Abstract
The growing adoption of electric buses in public transport has intensified the need for efficient scheduling algorithms. In the context of tactical planning, public transport operators must address two interdependent scheduling problems: the Single Depot Vehicle Scheduling Problem for Electric Buses (EB-SD-VSP) and the Crew Scheduling Problem for Electric Buses (EB-CSP). This study introduces a sequential approach, solving EB-SD-VSP via a Mixed-Integer Quadratic Programming (MIQP) model, and then using its solution to generate service blocks for the EB-CSP, which is then solved as a Mixed-Integer Linear Programming (MILP) model. The proposed sequential optimization approach ultimately solves the combined problem of Vehicle and Crew Scheduling for a fleet of Electric Buses (EB-SD-VCSP). Experiments on real-world bus line data from Athens, Greece demonstrate practical applicability of the approach. When compared to a baseline scenario where the services are executed with conventional buses, the proposed method can calculate efficient vehicle timetables and crew schedules for operations with electric buses. The results highlight the benefit of decomposing joint electric bus and crew planning into tractable subproblems while preserving solution quality. These findings offer a scalable tactical-level planning tool for transit agencies transitioning to electric fleets and suggest promising directions for future extensions to multi-depot and real-time scenarios.
1. Introduction
According to the European Commission, 100 cities across Europe will participate in the European Union (EU) Mission for 100 Climate-Neutral and Smart Cities by 2030, with their Climate City Contracts guiding systemic transformation, including electrified public transport such as electric buses, to support climate neutrality (U Mission: Climate-Neutral and Smart Cities. Available online: https://research-and-innovation.ec.europa.eu/funding/funding-opportunities/funding-programmes-and-open-calls/horizon-europe/eu-missions-horizon-europe/climate-neutral-and-smart-cities_en, accessed on 28 July 2025). Similarly, the Metropolitan Transportation Authority in New York plans to transition its entire fleet to zero-emission electric vehicles by 2040 (transitioning to a zero-emissions bus fleet. Available online: http://www.mta.info/project/zero-emission-bus-fleet, accessed on 28 July 2025). As cities worldwide commit to ambitious climate goals, optimizing electric bus operations becomes crucial for reducing emissions while maintaining reliable service. This topic has already attracted significant research attention, as seen in studies by Ji et al. [1], Janovec and M. Koháni [2], Wen et al. [3] and Reuer et al. [4].
The growing adoption of electric vehicles (EVs) is transforming public transport, mainly due to fundamental differences in operation compared to conventional vehicles. While the most visible change is the shift from traditional refueling to battery charging, EVs also introduce a broader range of challenges across strategic, tactical, and operational planning horizons of transport operations. Some cases of such challenges are described by Perumal et al. [5] and include changes to driving dynamics, driver shift scheduling, and service continuity, as well as strategic investments in electric bus fleets and the placement of charging infrastructure. Consequently, public transport organizations, and especially service operators, are required to revise transport planning procedures and update digital tools to optimally manage operations under electric mobility. To that end, it is now more important than ever before to utilize applied scientific tools [6] capable of restructuring vehicles, crew, and charging schedules, supported by modeling techniques that account for energy consumption and ensure efficient, reliable operations [7,8].
Connecting to the topic of the current research article, one key area impacted by these changes is public transportation systems scheduling, and more specifically vehicle and crew scheduling (or rostering). The Vehicle Scheduling Problem (VSP) is a well-known NP-hard optimization challenge. When accounting for EV-specific constraints, such as battery charging between service trips, the problem becomes even more complex. As a result, the Electric Vehicle and Electric Bus Scheduling Problems (E-VSP and EB-VSP) also remain NP-hard and require significantly more computational time to solve [9].
In a similar manner, the Crew Scheduling Problem for Electric Buses (EB-CSP) is an important challenge for the efficient operation of public transport services. With the replacement of conventional buses with electric ones, crew scheduling must also adapt, since recharging can create driver downtime unless they are reassigned to other vehicles. It also contributes to increased deadhead times, as the drivers need to move from or to the depots during working hours. For this, the combined problem of Vehicle and Crew Scheduling for a fleet of Electric Buses (EB-SD-VCSP) is also a relevant study. Similar studies on this topic are the ones by Perumal et al. [10] and Wang et al. [11], with the first focusing mainly on electric vehicles, while the second considering a mixed fleet.
In this paper, the EB-SD-VCSP will be modelled as two consecutive problems, EB-SD-VSP and EB-CSP. The EB-SD-VCSP is solved based on a sequential optimization solution approach, which first solves the EB-SD-VSP and then the EB-CSP. In the remainder of this paper, Section 2 provides the literature review for the proposed research and Section 3 provides the respective novel methodology. Finally, in Section 4 the results are provided from application on a bus line network from Athens, Greece, followed by the concluding remarks in Section 5.
2. Literature Review
The problem studied in this article is the combined (or integrated) problem of Vehicle and Crew Scheduling for a fleet of Electric Buses (EB-SD-VCSP). In that regard, in the following paragraphs, an overview of related literature is provided on EB-SD-VCSP and adjacent optimization problems.
The joint optimization of vehicle and crew scheduling has been a well-established topic within the transportation and operations research literature for several decades. Foundational work by Orloff [12] introduced early formulations of the vehicle scheduling problem under route constraints, establishing a basis for treating vehicle scheduling independently in public transport systems. This was further advanced by Bodin [13], who provided a comprehensive review of two decades of routing and scheduling research, including both vehicle and crew scheduling as distinct yet interconnected subproblems. These early studies not only laid the theoretical groundwork for the individual treatment of each problem but also highlighted the computational challenges that later motivated integrated approaches. The maturity of these VSP and CSP formulations underscores the long-standing significance and complexity of vehicle and crew scheduling in public transport planning.
Moving on, we will discuss previously introduced approaches to the combined vehicle and crew scheduling problem for conventional bus fleets. One of the earlier and notable contributions is that of Valouxis et al. [14], who addressed the combined bus and driver scheduling problem through a column generation approach, complemented by a solution refinement technique known as the QuickShift method. Their model ensures each bus is paired with a driver throughout the shift, aiming to produce integer solutions efficiently after solving a relaxed problem. A similar focus on real-life constraints appears in the study by Oughalime et al. [15], who use a sequential modeling approach, as the one employed in this paper, to solve a combined vehicle and driver scheduling problem in Malaysia. Both studies emphasized the practical applicability of such models and the importance of producing feasible, implementable schedules under tight operational constraints.
Several research works have addressed the integrated vehicle and crew scheduling problems for fleets of electric vehicles with definitions similar to the EB-SD-VCSP, as defined in this article. Such an article is the one by Perumal et al. [10], where the authors study the so-called Integrated Electric Vehicle and Crew Scheduling Problem. In their approach, the model is formulated with Mixed-Integer Linear Programming (MILP), creating sets of blocks and duties, and the solution is acquired with an Adaptive Large Neighborhood Search (ALNS) heuristic. For the integration of the vehicle and crew scheduling problems, the limited driving range of electric vehicles is considered. The ALNS is tested on real-world instances with data from public transport companies in Denmark and Sweden. Primarily, they examined the two subproblems modeled as linear programs, achieving feasible solutions in reasonable computational time; however, upon trying to solve the combination of the two by the same method, even though the results were better in quality, it appeared that some difficulties in the computation of some instances have occurred. By applying the proposed methodology, they proved that it improves the quality of the results and the computational times. The results of this work also showed the impact of the extension of the driving range of electric vehicles on the operational costs, with the latter being decreased.
In a similar study by Gkiotsalitis et al. [16], the problem of the multi-depot electric bus scheduling with time-windows is being studied (EB-MDVSPTW). The model that was first formulated by the authors is linearized with the use of decision variables. Without this alteration, they had to solve a mixed integer non-linear programming problem. With this modification the problem that is classified as NP-hard is able to be solved as a MILP problem. For more tight solutions, valid inequalities are introduced, to reduce the sets that are examined and the computational costs. The formulation was tested on benchmark instances achieving optimal solutions for data up to 30 trips.
Furthermore, the works of Guo et al. [17], Jiang and He [18], and Wang et al. [11] have similar components to our work. These studies are focused on the Electric Bus Scheduling Problem. Each one of those refers to different variables that form the problems that were solved. In Guo et al. [17] four uncertain variables were considered and a joint optimization strategy of dynamic departure interval and vehicle combination was proposed to minimize the total cost of passenger travel and energy consumption. The effectiveness of the proposed method is verified through the studied case, showing that considering uncertain factors in bus scheduling optimization can reduce the total travel time of passengers and improve the bus service level. Secondly, the study of Jiang and He [18] includes optimizing charging scheduling and management for a single bus line, then extending it into multiple lines. Vehicle characteristics and multiple workforce regulations are considered in modeling via MILP. The results showed that the optimal solution for the number of drivers/buses can be obtained, so that mealtime can be included. Finally, Wang et al. [11] studied the Integrated Vehicle and Crew Scheduling Problem for a mixed fleet of conventional and electric vehicles. The authors used a bi-level multi objective optimization model approach for the solution of the studied problem. Using an improved multi-objective swarm particle algorithm based on ε-constraint processing mechanism ε-THOMPSO, they were able to obtain Pareto optimal solutions.
Another relevant study is the one conducted by Janovec and Koháni [2]. The authors proposed a linear programming model for scheduling electric vehicles. The data for this study was obtained from the public transportation management company DPMŽ of the city of Žilina in Slovakia. The model was tested by gradually adding chargers in selected areas. Lastly, the results obtained from the Electric Vehicle Scheduling Problem (E-VSP) were compared with those of the VSP. To solve this model, the solver Xpress IVE was used. This study demonstrated that the number of buses required to serve the network does not change with the type of vehicle, and it was observed that by increasing the number of lines and the number of chargers, and taking into consideration their locations, the results become more complex and require more computational time. The complicating factors of the real-world VSP are also discussed in the articles by Eliiyi et al. [19] and Carosi et al. [20], who address the real-world problem instances of the VSP using heuristic and meta-heuristic approaches accordingly. In the latter article by Carosi et al. [20], the authors solve the integrated problem of timetabling and vehicle scheduling, as is also done in a recently published article by Gao et al. [21], further demonstrating how integrated scheduling models can outperform traditional sequential methods by enabling better synchronization and resource utilization.
As indicated above, many past studies were tested with information obtained from real-world environments. In the more recent works, Gkiotsalitis et al. [22] examined a case study in Singapore using a variety of metaheuristics (Genetic Algorithm, as well as, Simulated Annealing) for the Bus Scheduling Problem with limited passenger waiting times. Moreover, working with Simulated Annealing, Mauri and Lorena [23] solved the Bus Driver Scheduling Problem and tested it on Brazilian bus lines.
As a final note to this literature review, let us note that in parallel to individual contributions to the solutions of the VSP, CSP, EB-VSP, EB-CSP, EB-SD-VCSP and their adjacently defined problems, several comprehensive literature reviews have emerged to synthesize and classify these developments. Perumal et al. [5] provide a foundational overview of the electric vehicle scheduling problem, outlining key operational challenges and decision-making layers ranging from infrastructure siting to scheduling complexities. Lim et al. [7] extend this by analyzing optimization methods and digital tools used in current scheduling systems, emphasizing the need for energy-aware, integrated models that reflect real-world constraints. More recently, Behnia et al. [24] offer a comprehensive classification of vehicle and charging scheduling studies, categorizing the literature by scheduling type, fleet configuration, solution methodology, and system design assumptions. Together, these reviews underline the growing complexity of electric bus scheduling problems and the increasing reliance on advanced computational methods, including heuristics, metaheuristics, and hybrid approaches, to manage the operational intricacies of electrified fleets. Table 1 presents the published studies most closely related to the current research, along with the models and solution methods they employed.

Table 1.
Most relevant studies from past literature.
Key findings from the review include that the development of novel operations research methods can contribute to effective interventions in all the levels of planning (i.e., strategic, tactical, operational) of public transport systems that rely on electric buses. Especially in the case of the combined or integrated problem of vehicle and crew scheduling, several studies have attempted to solve real-world problem instances demonstrating considerable benefits for the involved stakeholders [10,11,15,16].
In this context, the present study advances the field by proposing a sequential optimization framework that incorporates detailed real-world data, including the technical specifications of electric buses and chargers, as well as the actual bus trip schedules currently implemented in practice. This approach enables the development of a comprehensive case study focused on the Athens metropolitan network. The methodology explicitly accounts for critical operational parameters such as energy consumption per unit distance, charging power of the infrastructure, different relief points for the buses based on the real-world spatial distribution of bus stops, depots and chargers, as well as legal constraints related to driver working conditions. In the next few years, and as the adoption of electric buses progresses in Athens, Greece and the rest of the world, it can be expected that mathematical programming models like the ones presented in this paper will be of critical importance to public transport operators and transport-related public authorities.
3. Methodology
In the current methodology section, the sequential optimization approach for the solution of the EB-SD-VCSP is given. The sequential approach initially solves the EB-SD-VSP sub-problem and then solves the EB-CSP subproblem. In that regard, Section 3.1 presents the mathematical formulation of the EB-SD-VSP sub-problem, and Section 3.2 presents the mathematical formulation of the EB-CSP sub-problem. In Section 3.3, more details about the sequential optimization solution approach are given.
3.1. Mathematical Formulation EB-SD-VSP
The mathematical model that is proposed for the solution of the Electric Bus Single Depot Vehicle Scheduling Problem (EB-SD-VSP) is based on the work of Perumal et al. [10] and on the work of Gkiotsalitis et al. [16]. In the first study, the authors proposed a cyclic network , formed with vertices that represent trips and arcs , where . These arcs contain the service trips, the trips from/to the depot, the waiting times, and the charging events. In our proposed model, which is explained further in this article, we use the same assumption as the study by Perumal et al. [10] where vehicle recharge takes place between two consecutive trips. For our model, modifications to the constraints have been made so that the problem will be formulated through linear constraints and simplified, as waiting times have not been considered. For that reason, the latter article’s [16] linearization techniques are also introduced in models proposed by the current research. Thus, as previous studies pertained to the use of multiple depots, with time windows, in the current study, we adjust our model to use a single depot and excluded time windows, creating the EB-SD-VSP.
In that aspect, the definition of the problem concerning the electric vehicle scheduling model EB-SD-VSP is described as follows:
“Given a timetable for the operation of bus lines and a fleet of electric vehicles , performing a number of tasks map each bus to tasks so that it complies with the given timetable, while minimizing the number of electric vehicles used.”
The main assumptions of the problem are the following:
- Each line is connected with a specific charging location, which is located at the depot of the line.
- The time needed for recharging depends on the vehicle’s remaining battery level.
- The energy level of the electric buses after recharging is the maximum allowed (350 kilowatt-hours). The energy level of electric vehicles should not be less than 20% of the maximum capacity, otherwise the completion of itineraries might not be possible.
- During a charging event, the charger is considered occupied for the entire duration of the time slot even if the bus has completed the charging procedure before the end of the slot. By implementing this assumption to the developed model, we avoid the queuing of vehicles when charging.
- Electric buses head to charging stations after completing the route of each bus line, that is after visiting their final stop per line direction.
- The timetable of the bus lines is planned in advance by the public transport operator and the timetables for charging are arranged through the charging time-slot approach mentioned above.
In this problem definition, we consider all the tasks performed by vehicles as nodes in a graph. We have a pre-defined number of trips according to the timetable of each line. Then, we consider a set , representing all the possible charging events at charging stations (depot). Each possible charging event can start within the time window . That is, is considered as the time point where bus has performed trip and has traveled from the final bus stop to the charging destination, and is the time point after the mentioned travel time, plus the time needed to complete the charging procedure. In addition, we introduce two sets , , that represent the origin and the destination node on each line. Therefore, all the tasks that a bus can perform belong to the set , where and 0.
Considering the complexity of the problem and since EB-SD-VSP is an NP-hard problem, we handle the complexity by splitting the operation of the bus lines into time-slices. With this approach and formulation, we manage to solve the problem for larger real-world instances.
To apply the time-slices approach, we considered that the set of potentially required buses that perform tasks consists of two sub-sets: and . Set represents the vehicles that did not perform any tasks in a specific time-slice and set includes the vehicles that did. This separation of set is necessary, since we divide the operating hours of each line in parts consisting of time-slices. Evidently, it becomes essential to keep track of the required buses per slice. The EB-SD-VSP is solved in each time-slice with the use of a quadratic model. Using a heuristic approach, we assign buses to sets and we also succeed in transferring the time and battery level state of a bus from one slice to another. A representation of the time-slice-based decomposition approach for the EB-SD-VSP can be found in Appendix A Figure A2.
With this formulation, we manage to find the best solution per time-slice and a comprehensive solution for the entire operating day of a line. Concerning the parameters of the problem, the duration of a task that a bus performs is . The travel time between the end location of task and the start location of task is The energy consumption caused by the distance covering between the locations of nodes is . The battery consumption per traveled distance is and the charging rate is Furthermore, the minimum allowed state of charge of a bus is and the maximum allowed state of charge is Since we need to keep track of the required buses, energy level, location and time that a bus performs a task we have introduced some parameters in order to successfully transfer the data regarding the location, battery level and time of each bus performing task from one time-slice to another. This transfer of data between time-slices can also be referred to as the “carrier state” for the electric bus fleet. The state of charge for the buses at the beginning of a time-slice is the location of the bus (either the first or final stop of the line or the depot) is , and the time that each bus is available in each time-slice is The decision variables of the problem include:
- where if bus uses arc and 0 otherwise.
- , where if bus is used in any time-slice and 0 otherwise.
Table 2 describes the notation used for the EB-SD-VSP.

Table 2.
EB-SD-VSP Nomenclature.
The mathematical problem presented is solved in each time-slice with a Mixed-Integer Quadratic Programming (MIQP) model, giving us the best solution for each time-slice. That is, the minimum number of electric vehicles required for the operation of the line in each time-slice. This result comes considering the deadhead distance, the timetable and charging limitations. The mathematical model for this is as follows:
Objective function:
Subject to:
Objective function (1) is used to minimize the number of vehicles required to cover the scheduled trips. In more detail, minimizes the connections between tasks . The term minimizes the number of buses used at the current time-slice. The variable takes the value of 1 if a vehicle k ∈ K is used in a time-slice, or zero otherwise. Parameter takes values 0–1 accordingly, in each time-slice, through a heuristic. Therefore, this summation takes the minimum value when the minimum number of vehicles is used per time-slice. The other two terms of the objective functio , aim to assign vehicles in arcs so that vehicle performs the earliest possible task in each time-slice and makes the nearest connection between two nodes, therefore wasting the minimum time needed, Finally, the term strives to make each vehicle start with as high energy level as possible in each time-slice. These three terms also contribute to the reduction in vehicles required for the daily operation of an examined line. Furthermore, it should be clarified that and are penalty parameters, which are applied to the respective terms to reduce the priority of the last three terms of the objective function in comparison with the first two terms.
Constraints (2) and (4) ensure that each vehicle leaves from the starting point at most once to perform any task . Equality constraints (3) and (5) ensure that a vehicle does not visit the starting point after performing tasks . Constraints (6) prohibit vehicle from connecting tasks , when both belong to the starting point. Additionally, constraint (7) forbids vehicle k to visit the starting point , after charging events, trips or arriving at a destination point, and (9) forbids vehicle k from performing any activity after visiting the destination point. Constraints (8) ensure that each vehicle reaches the destination point at most once, after performing task . Constraints (10) ensure that every vehicle that leaves the starting point to perform any task must also reach the destination point . Constraints (11) indicate that a vehicle , cannot visit a charging node after already having visited a charging node . Constraints (12) are flow conservation constraints ensuring that every vehicle which enters a node should also leave this node towards any node . Constraints (13) indicate that every node is visited at most once by any vehicle from any node . Constraints (14) ensure that every inner task is being performed from a vehicle , after visiting any node . Constraints (15) make sure that the number of vehicles leaving the starting point ok to perform tasks is less than or equal to the number of available vehicles. Lastly, constraints (16) guarantee that a vehicle does not perform self-visits in any of the nodes .
The combined application of constraints (17) and (18) ensures that if a vehicle uses arc , then the time variable , indicating the starting time of vehicle performing task is equal to the departure time of trip . Constraints (19) indicate that the variable can take a value only if vehicle uses arc . Constraints (20), indicate that if a vehicle uses arc , then variable can take the value of variable plus the time required to perform task and the elapsed time from task to , only if uses arc Similarly, for Equation (21) variable can take the value of variable plus the time required for recharging at charging node and the elapsed time from task to , only if uses arc . Constraints (22), (23) work together with (19), (20). In more detail, if , then variable , is relaxed to take any value in [−M, M]. In turn, inequalities (22), (23) are relaxed since the variables involved can take any value in their respective definition space. On the other hand, if = 1, then variables for specific combinations of are forced to take the value of zero. Constraints (24) and (25) ensure that if a vehicle uses arc , the starting time of the starting node task is equal to the values of parameter , indicating the instant that a vehicle starts the service at any time-slice. Constraints (26) and (27) make sure that if a vehicle uses arc the starting time of the ending node is equal to the starting time of task , plus the travel time between the location of task and the ending node and the duration of task . Constraints (28) and (29), indicate that the arrival time at ending node after visiting charging node is equal to the starting time of task , the time required for vehicle to recharge and the traveling time between nodes and .
Constraints (30) ensure that if a vehicle uses arc , then the state of charge at the start of task node is greater than or equal to the minimum allowed state of charge constraints (31), (32) make sure that only if a vehicle uses arc the variables , can take their appropriate values. Otherwise, = 0 and = 0. Constraints (33) and (34) make certain that if a vehicle is leaving the starting node to perform any task , then the state of charge at the starting node is equal to the parameter , indicating the state of energy of vehicle at the beginning of any time-slice. Constraints (35) and (36) ensure that if a vehicle uses arc , the state of charge at the start of task is equal to the state of charge at the end of task minus the energy consumption caused by the distance covered between the locations of nodes (i, j). Constraints (37) and (38) ensure that if node is visited by vehicle , then the difference between the state of charge at the start of task , and the state of charge of vehicle at the end of task , is equal to . Constraints (39) and (40) ensure that if a vehicle uses arc then is equal to the energy consumption caused by performing task Constraints (41), (42) make certain that if a vehicle reaches charging node , then takes the value of the amount of energy gained by the charging procedure, which is – The energy gained is modelled as a negative value. Constraints (43) and (44) ensure that if node is not visited, then = 0. Lastly, (45) and (46) ensure that variable , which indicates if a vehicle is used in any time-slice or not, takes a value if vehicle traverses an arc , otherwise = 0.
3.2. Mathematical Formulation EB-CSP
The approach presented in this subsection aims to address the problem of Crew Scheduling (or rostering) for a given set of bus services of a single bus line that is served by a fleet of electric buses. The formulation is based on the Fixed Job Scheduling Problem with spread-time constraints (see [25]) and assumes the following points:
- The blocks will most likely have durations greater than 8 h, so, in the pre-calculation process those will be divided into parts with duration up to 8 h.
- The total time during which a driver is available will be up to 10 h from the start of the duty until its end, including any breaks (up to 2 h). This 10-h driver availability window is different from the drivers’ shift duration (8 h).
- Each part of block is equivalent to a duty.
- As a Relief point (the place where the bus drivers change shift) can be considered any point between the service.
- Similarly, relief time can be any moment during the bus service.
- The blocks are arranged from the lowest to the highest ending time.
- Drivers that are assigned to more than one duty are able to travel in time to the relief points for the service of the duty.
In that regard, the definition of the EB-CSP problem, as considered in the context of the current study, can be stated as follows:
“Given a set of vehicle blocks for an electric bus fleet, denoted by , and a set of available drivers, denoted by , the objective is to determine the optimal assignment of drivers to vehicle blocks, or to parts of those blocks, in such a way that all operational requirements are satisfied while respecting each driver’s working time constraints.”
It is also necessary to specify that the optimal assignment of drivers to vehicle blocks results in the construction of drivers’ duties (or a duty in the case of an individual driver), a term widely adopted in the relevant scientific literature to describe the sequence of work activities assigned to a driver within the operational schedule.
Moving on, to solve the aforementioned problem there is a pre-optimization phase required where each of the electric bus vehicle blocks breaks down into parts given that any driver duty must not exceed the duration of eight hours. For that reason, in the pre-optimization phase, we break down vehicle blocks of more than eight hours into smaller parts of at maximum eight hours. Before explaining the pre-calculation phase and the mathematical MILP formulation into greater detail, in Table 3, the nomenclature for the EB-CSP is presented.

Table 3.
EB-CSP Nomenclature.
To model the EB-CSP problem, based on each electric bus block and its starting and ending times ( and , respectively), some extra parameters to the problem are calculated:
- Τhe set with the maximum number of parts per block ;
- Τhe set with the parts of a duration of 480 min (8 h) for each ;
- Τhe symmetric difference in the two previous sets which contains the parts that their duration is less than 8 h, ;
- Τhe duration for each part of each block within sets and .
In Equations (47)–(50), the formulas for the calculation of the extra pre-optimization-related parameters are given.
Next, in Equations (51)–(64) the mathematical formulation for the EB-CSP is given, with the detailed explanation of the equation following right after.
Subject to:
The goal of the objective function (51) is to minimize the number of drivers that are being used to cover all blocks of the trips on the bus line that is under study by the model. Constraint (52) ensures that the part of block will be covered by the driver , while Constraint (53) guarantees that exactly one driver will cover the part of block . Constraint (54) guarantees that the total duration of each part from blocks that is covered by the driver will not exceed the duration of the drivers’ duty (480 min). Constraint (55) ensures that the starting time of part of block will be greater or equal than (after) block’s release and Constraint (56) assures that the ending time of part of block will be lesser than or equal from (before) the respective block’s end time.
Constraints (57) and (58) work together and ensure the time continuity between parts, as it ensures that the starting time of part , meaning l is every part except from the first one, is equal to the ending time of of block . Constraints (59) and (60), follow similar modeling logic as Constraints (57) and (58), and guarantee that the difference between the ending time of part of block , will be equal to block’s part duration.
Constraint (61) ensures that for each part of block that is covered by driver , each part of that block can be assigned to the same driver, with , when the starting time of duty is greater or equal than the ending time of the service of duty . Meaning . Constraint (62) ensures that each part of block that a driver covers, each part of block , with , when the difference between the ending time of duty minus the starting time of the duty is lesser or equal than the time that is allowed between the parts (driver total availability). Meaning . Lastly, with Constraints (63) and (64), we define the decision variables of the formulation.
3.3. Sequential Solution Approach
The EB-SD-VCSP consists of two separate subproblems, which we solve in a consecutive order. In Figure 1, the sequential solution approach is depicted including input and output data for the two sub-problems solved.
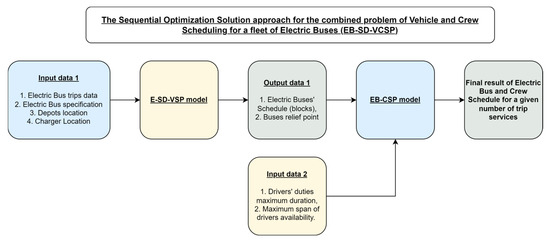
Figure 1.
A flowchart of the sequential optimization process for the EB-SD-VCSP, including the EB-SD-VSP and EB-CSP models.
The EB-SD-VSP is firstly solved through a time-slicing decomposition approach, in which the overall set of trips was partitioned into segments corresponding to equal divisions of the planning horizon (e.g., 08:00–16:00, 16:01–24:00 and 24:00–07:59 of the following day). This decomposition strategy was adopted to mitigate the computational complexity of the original EB-SD-VSP, which, when formulated as a single model for real-world instances, results in an extremely large number of binary variables. Such problem sizes render exact solution methods, such as branch-and-bound (through a solver as Gurobi in our case), computationally intractable. By partitioning the problem into smaller, more manageable subproblems, the time-slicing approach significantly improves solvability.
To ensure consistency and feasibility across consecutive time-slices, inter-slice continuity was preserved through the transfer of selected parameter values associated with the electric buses, derived from the solutions of the preceding slice. Those parameters can be referred to as the ‘carried state’ for the electric bus fleet, comprising the starting time , at which the electric vehicle is available for service, the starting state of charge meaning the state of charge at the beginning of the slice, the electric vehicles that are not being used until the slice that we examine the vehicles that end their trip by returning to depot the vehicles that end the trip at a bus stop . After each consecutive slice is solved, the results are summarized to receive the minimum number of electric vehicles required for the service of each line, the nodes that each vehicle that is being used visits (trips, charging, depot or bus stop), the nodes that the vehicle is recharging, the starting time of each node, the state of charge at the beginning and the ending of each event. The total results of the sequence for each vehicle will later be utilized to create the blocks for the Crew Scheduling Problem. The solution process for the EB-SD-VSP can be viewed in Appendix A Figure A1 and the time-slice decomposition can be viewed in Appendix A Figure A2.
With regard to the Crew Scheduling sub-problem, the EB-CSP is solved after the EB-SD-VSP, and receives the output of the solution of the EB-SD-VSP as input. This is because after all time-slices of the EB-SD-VSP are solved to optimality, the optimal number of blocks can be derived for the problem instance under study. This initial result (i.e., blocks) can be received as in the EB-CSP together with different relief points that can be considered for the vehicles, so that different scenarios are examined for the vehicle scheduling of electric buses. In that context, the blocks are calculated with two different methods in our approach depending on the case that is being studied. The first method considers the beginning of the block as the time that the vehicle is being released from the depot until the ending time of that block. This approach applies to the Prospective Scenario 1 (Crew Scheduling 1) of our study and to the existing conditions of conventional buses.
The second method considers the in-between charging nodes and applies to Prospective Scenario 2 (Crew Scheduling 2). The first block of each electric vehicle begins at the release time from the depot and ends in either the ending time for that block or the time at which the intermediate charging of that vehicle starts (i.e., charging node as a relief point). From then onwards, the next block begins either at the second release from the depot or the end of the charging event, and so forth. The results consist of the minimum number of drivers, the duty/duties each driver is assigned to, and the starting and ending time of each duty. The solution process for the EB-CSP can be viewed in Appendix A Figure A3.
4. Computational Results
To test our approach, a case study has been performed by using data from six bus lines of the Athens Urban Transport Organization (OASA), the public transport authority in Athens, Greece. More specifically, the bus lines selected were Bus Line 140 for Saturday’s services schedule, and Bus Lines 120, 122, 550, 608 and B9 for weekday service schedules. For the case study, we utilized General Transit Feed Specification (GTFS) (eneral Transit Feed Specification Wikipedia Webpage. Available online: https://en.wikipedia.org/wiki/GTFS, accessed on 28 July 2025) data, as provided by OASA (ASA Telematics website. Available online: https://www.oasa.gr/en/telematics/, accessed on 28 July 2025). The GTFS dataset includes all the bus lines data, such as the number and schedule of bus trips, as well as the stops’ locations. The depots’ locations are also required as part of this modeling approach and were acquired from OASA’s website. In Appendix B Figure A4, Figure A5, Figure A6, Figure A7, Figure A8 and Figure A9, one may notice the plots of the bus lines analyzed in this case study. As a final note, please let us mention that the time-slices that were used for the solution decomposition of the EB-SD-VSP were approximately 8-h time intervals, with the starting time of the time-slices being the starting time of the first trip of the day, for each individual bus line under study. The duration of the time-slices can be adjusted depending on the case study and the characteristics of the bus lines examined (number of trips, frequency of trips).
The implementation of the EB-SD-VSP and the EB-CSP models (both sub-problems of the EB-SD-VCSP) was carried out in Python version 3.11.9. The solution of all formulations in this case study was performed using the Gurobi solver version 11.03 (academic version). The computational experiments were conducted on a conventional computer system with an Intel (R) Core (TM) i7-1255U 1.70 GHz processor and 16.0 GB of RAM.
Case Study Results for the Sequential Solution Approach
The results for the application of the EB-SD-VCSP are presented in the following tables. The minimum number of vehicles and drivers, the number of blocks, and the number of block parts for each case for each line, when conventional buses are used, are presented in Table 4. The results for Crew Scheduling 1 are presented in Table 5 and for Crew Scheduling 2 in Table 6 (scenarios as discussed in Section 3.3). Additionally, in these tables, the number of 8-h parts, in which the drivers are assigned to continuous shifts, and the number of small-duration parts are presented.

Table 4.
Results for EB-SD-VCSP for the as-is scenario when Conventional Buses are used and vehicles blocks are considered to start and end only at depots (depot-to-depot).

Table 5.
Results for EB-SD-VCSP for the Prospective Scenario 1 when Electric Buses are used and vehicles blocks are considered to start and end only at depots (depot-to-depot).

Table 6.
Results for EB-SD-VCSP for the Prospective Scenario 2 when Electric Buses are used and vehicles blocks are considered to start and end only at depots and charger location.
One may notice that the bus lines examined are given along the rows of each table, indicating the bus line ID (e.g., Bus line 140 or Bus line 120) along with the timeframe that the service is executed (e.g., “Saturday” for Saturday’s trips, or “Weekday” for Weekdays’ trips). The result tables also include specific columns that describe the most significant attributes of the problem instances solved per bus line. The first column includes the bus line ID. The second column is a parameter to the problem and refers to the number of trips that are examined for each line. Columns three to six present the results that emerge after the run of the EB-SD-VSP: the third column describes the minimum number of buses required to serve the trips, the fourth column describes the number of blocks, the fifth column describes the number of parts within that column and the sixth column describes the number of 8-h parts within the blocks. Finally, the seventh column concerns the results of the EB-CSP and includes the number of shifts that emerge from the solution. In column eight, the number of driver shifts that have a duration of less than 120 min are included, since it has been considered a result of considerable importance.
When comparing the results of the three tables, one may notice the differences that emerge both between conventional and electric buses (when comparing Table 4 to Table 5 or Table 6), as well as the differences in the consideration of relief points for blocks (when comparing Table 5 to Table 6). As shown in Table 4 and Table 5, the transition from conventional to electric buses increases the minimum number of vehicles required and the total number of blocks. Electric bus operations result in fewer standard 8-h work parts and a slight increase in the minimum number of drivers needed, reflecting operational challenges due to charging requirements and limited range. However, the number of small-duration parts (≤120 min) decreases in our specific example with electric buses, indicating that the fragmentation of driver duties does not get significantly affected by the transition.
Table 5 and Table 6 present electric bus vehicle and crew scheduling results under two different block design approaches. When blocks are defined strictly from depot to depot (Table 5), fewer but longer blocks are observed, resulting in a higher number of 8-h work parts and drivers. In contrast, when relief points are allowed at charging stations (Table 6), the total number of blocks and block parts increases across all lines, but this approach enables more operational flexibility, a slight reduction in required drivers, and better integration of charging events into the schedule. Despite the increased fragmentation of vehicle operations in Table 6, small-duration parts (≤120 min) remain minimized, indicating that introducing charger-based relief points can improve scheduling efficiency without compromising operational continuity.
5. Conclusions
This study attempts to address common tactical planning challenges that arise from the transition to electric bus fleets, specifically targeting the integrated Vehicle and Crew Scheduling Problem for Electric Buses (EB-SD-VCSP). The problem is solved through a novel sequential optimization framework that decomposes the joint scheduling task into two tractable subproblems: an Electric Bus Single Depot Vehicle Scheduling Problem (EB-SD-VSP), formulated as a Mixed-Integer Quadratic Program (MIQP), followed by a Crew Scheduling Problem for Electric Buses (EB-CSP), formulated as a Mixed-Integer Linear Program (MILP).
The evaluation of the proposed sequential optimization approach on real-world bus line from Athens demonstrates the practical effectiveness of the proposed approach. Results show that, compared to conventional bus scheduling (Table 4), electric bus scheduling introduces increased vehicle and crew requirements. Furthermore, the comparison between depot-to-depot blocks (Table 5) and blocks allowing relief at chargers (Table 6) reveals that introducing intermediate relief points at charging stations provides greater flexibility, reduces required driver hours, and integrates charging events into the schedule without compromising service quality. Another important insight is that the installation of chargers plays a potentially important role, since if the placement of chargers happens at locations where there can be a shift in a driver’s duty (i.e., relief point), then potentially more efficient crew schedules can be derived.
The findings confirm the method’s value as a tactical planning tool for transit agencies managing the complexities of electric bus operations. By decoupling vehicle and crew scheduling as two separate problems that are co-solved under a common approach, agencies can generate cost-efficient, implementable schedules under the constraints of electric fleet characteristics such as limited range and charging requirements.
Nonetheless, certain caveats remain. The current approach focuses on the tactical planning level and does not yet account for real-time operational uncertainties such as vehicle breakdowns, traffic disruptions, or dynamic charging station occupancy. Moreover, the model focuses on single-depot configurations, limiting its immediate applicability to multi-depot systems.
Future research may extend this methodology to incorporate real-time re-optimization capabilities, stochastic disruptions, and multi-depot operations, which are all problems that emerge in tactical and operational planning procedures. Especially important is the extension of the current sequential framework to account for travel time uncertainties during rush hours. The integration of energy pricing (i.e., time-of-use tariffs, peak demand charge) is a promising research direction in the context of electric bus and energy grid networks co-planning, which can potentially be integrated with the current proposed research to reduce energy consumption and improve cost efficiency in electric bus networks.
Author Contributions
Conceptualization, K.T., D.R., M.M. and K.G.; Methodology, K.T., D.R., M.M. and K.G.; Software, K.T., D.R. and M.M.; Validation, K.T., D.R. and M.M.; Formal analysis, K.T., D.R. and M.M.; Investigation, K.T., D.R. and M.M.; Data curation, K.T.; Writing—original draft, K.T.; Writing—review & editing, D.R., M.M. and K.G.; Visualization, K.T.; Supervision, D.R., M.M. and K.G. All authors have read and agreed to the published version of the manuscript.
Funding
This research received no external funding.
Institutional Review Board Statement
Not applicable.
Informed Consent Statement
Not applicable.
Data Availability Statement
The data presented in this study are available on request from the corresponding author due to privacy.
Conflicts of Interest
The authors declare no conflict of interest.
Appendix A
In Appendix A Figure A1, one may notice the solution process for the EB-SD-VSP, while in Appendix A Figure A2, one may notice a second perspective on the time-slices-based decomposition approach for the EB-SD-VSP. In Appendix A Figure A3, the solution process for the EB-CSP problem is given.
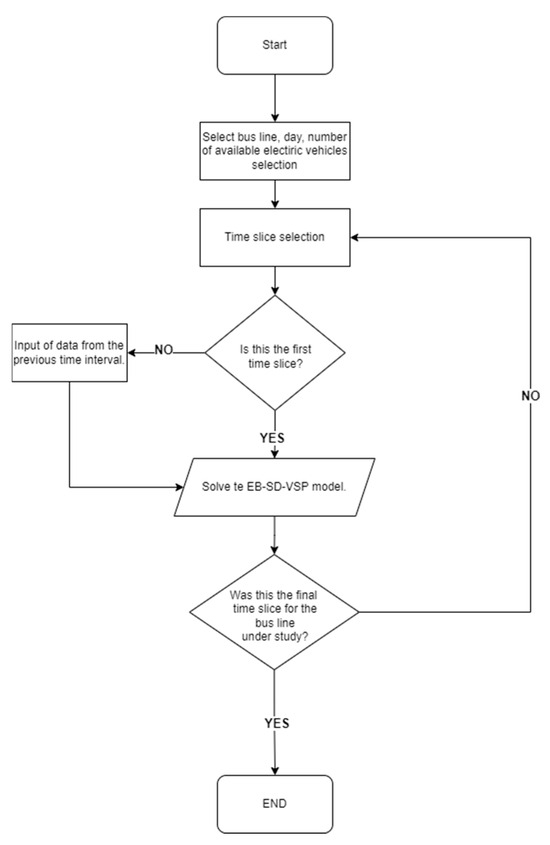
Figure A1.
The solution process for the EB-SD-VSP.
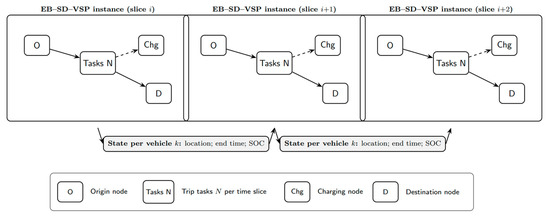
Figure A2.
Time-slice decomposition with carried state (vehicles locations, previous task end time and State of Charge) for the solution of the EB-SD-VSP.
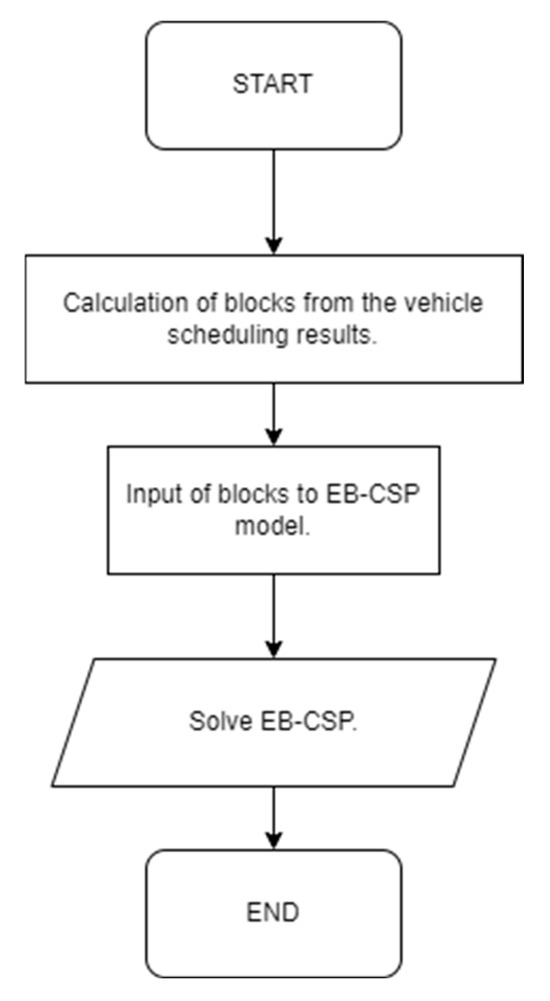
Figure A3.
The solution process for EB-CSP.
Appendix B
In Appendix B Figure A4, Figure A5, Figure A6, Figure A7, Figure A8 and Figure A9, the plots of the bus lines considered for the case study of this article can be viewed.
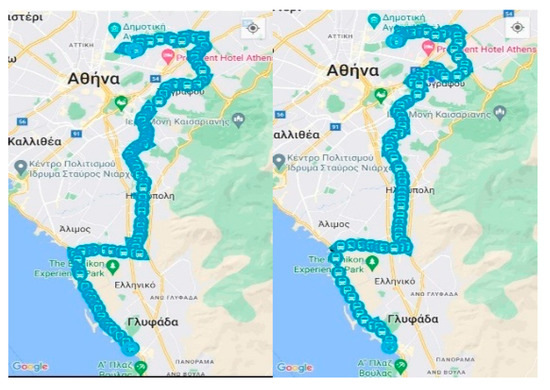
Figure A4.
Bus Line 140.
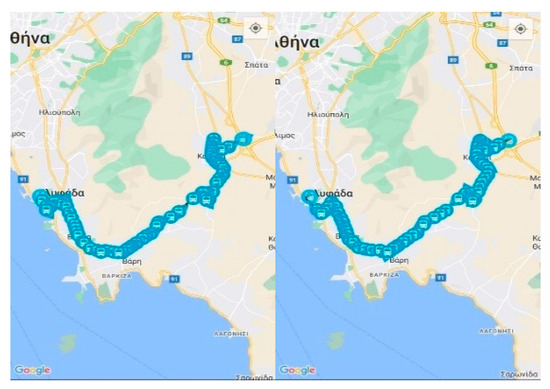
Figure A5.
Bus Line 120.
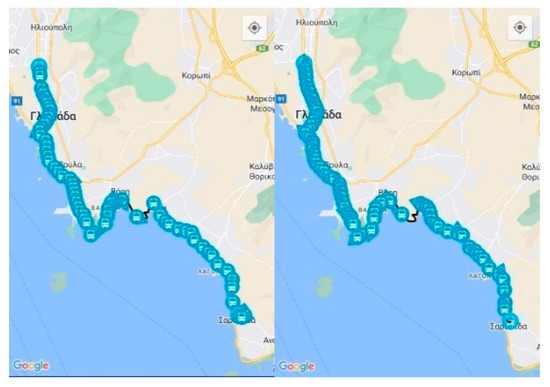
Figure A6.
Bus Line 122.
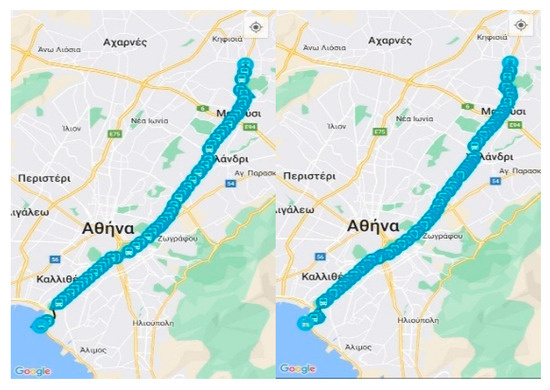
Figure A7.
Bus Line 550.
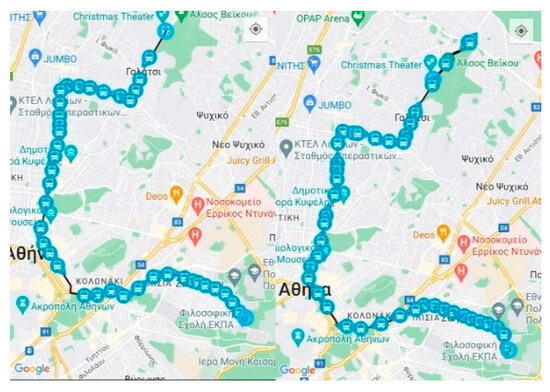
Figure A8.
Bus Line 608.
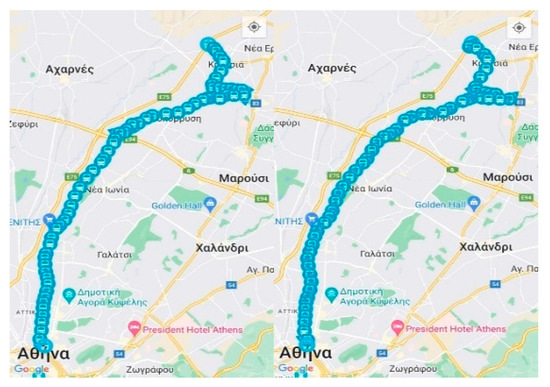
Figure A9.
Bus Line B9.
References
- Ji, J.; Bie, Y.; Shen, B. Vehicle Scheduling Model for an Electric Bus Line. In Smart Transportation Systems 2020, Proceedings of the 3rd KES-STS International Symposium, Split, Croatia, 31 May 2020; Springer: Singapore, 2020; pp. 29–39. [Google Scholar] [CrossRef]
- Janovec, M.; Koháni, M. Exact approach to the electric bus fleet scheduling. Transp. Res. Procedia 2019, 40, 1380–1387. [Google Scholar] [CrossRef]
- Wen, M.; Linde, E.; Ropke, S.; Mirchandani, P.; Larsen, A. An adaptive large neighborhood search heuristic for the Electric Vehicle Scheduling Problem. Comput. Oper. Res. 2016, 76, 73–83. [Google Scholar] [CrossRef]
- Reuer, J.; Kliewer, N.; Wolbeck, L. The Electric Vehicle Scheduling Problem A Study on Time-Space Network Based and Heuristic Solution Approaches. Available online: http://www.rotterdam2015.caspt.org/proceedings/paper93.pdf (accessed on 28 July 2025).
- Perumal, S.S.G.; Lusby, R.M.; Larsen, J. Electric bus planning & scheduling: A review of related problems and methodologies. Eur. J. Oper. Res. 2022, 301, 395–413. [Google Scholar] [CrossRef]
- Yu, X.; Cao, H.; Cao, K.; Zou, L.; Zhu, L. Considering the Optimization Design of Urban Bus Network Scheduling. Appl. Sci. 2024, 14, 6337. [Google Scholar] [CrossRef]
- Lim, L.K.; Muis, Z.A.; Ho, W.S.; Hashim, H.; Bong, C.P.C. Review of the energy forecasting and scheduling model for electric buses. Energy 2023, 263, 125773. [Google Scholar] [CrossRef]
- Zhang, L.; Han, Y.; Peng, J.; Wang, Y. Vehicle and Charging Scheduling of Electric Bus Fleets: A Comprehensive Review. J. Intell. Connect. Veh. 2023, 6, 116–124. [Google Scholar] [CrossRef]
- Li, J.-Q. Transit Bus Scheduling with Limited Energy. Transp. Sci. 2014, 48, 521–539. [Google Scholar] [CrossRef]
- Perumal, S.S.G.; Dollevoet, T.; Huisman, D.; Lusby, R.M.; Larsen, J.; Riis, M. Solution approaches for integrated vehicle and crew scheduling with electric buses. Comput. Oper. Res. 2021, 132, 105268. [Google Scholar] [CrossRef]
- Wang, J.; Wang, H.; Chang, A.; Song, C. Collaborative Optimization of Vehicle and Crew Scheduling for a Mixed Fleet with Electric and Conventional Buses. Sustainability 2022, 14, 3627. [Google Scholar] [CrossRef]
- Orloff, C.S. Route Constrained Fleet Scheduling. Transp. Sci. 1976, 10, 149–168. [Google Scholar] [CrossRef]
- Bodin, L.D. Twenty Years of Routing and Scheduling. Oper. Res. 1990, 38, 571–579. [Google Scholar] [CrossRef][Green Version]
- Valouxis, C.; Housos, E. Combined bus and driver scheduling. Comput. Oper. Res. 2002, 29, 243–259. [Google Scholar] [CrossRef]
- Oughalime, A.; Ismail, W.R.; Liong, C.-Y.; Ayob, M. Vehicle and driver scheduling modelling: A case study in UKM. In Proceedings of the 2009 2nd Conference on Data Mining and Optimization, Kajand, Malaysia, 27–28 October 2009; pp. 53–59. [Google Scholar] [CrossRef]
- Gkiotsalitis, K.; Iliopoulou, C.; Kepaptsoglou, K. An exact approach for the multi-depot electric bus scheduling problem with time windows. Eur. J. Oper. Res. 2023, 306, 189–206. [Google Scholar] [CrossRef]
- Guo, J.; Xue, Y.; Guan, H.Z. Research on the combinatorial optimization of EBs departure interval and vehicle configuration based on uncertain bi-level programming. Transp. Lett. 2023, 15, 623–633. [Google Scholar] [CrossRef]
- Jiang, Y.; He, T. Optimal Charging Scheduling and Management with Bus-Driver-Trip Assignment considering Mealtime Windows for an Electric Bus Line. Complexity 2022, 2022, 3087279. [Google Scholar] [CrossRef]
- Eliiyi, D.T.; Ornek, A.; Karakütük, S.S. A vehicle scheduling problem with fixed trips and time limitations. Int. J. Prod. Econ. 2009, 117, 150–161. [Google Scholar] [CrossRef]
- Carosi, S.; Frangioni, A.; Galli, L.; Girardi, L.; Vallese, G. A matheuristic for integrated timetabling and vehicle scheduling. Transp. Res. Part B Methodol. 2019, 127, 99–124. [Google Scholar] [CrossRef]
- Gao, W.; Lu, S.; Liu, K.; Li, D. Integrated optimization of timetabling and vehicle scheduling for pure electric buses considering multiple depots and vehicle types. Comput. Ind. Eng. 2025, 201, 110833. [Google Scholar] [CrossRef]
- Gkiotsalitis, K. Bus scheduling considering trip-varying travel times, vehicle availability and capacity. IET Intell. Transp. Syst. 2020, 14, 1594–1605. [Google Scholar] [CrossRef]
- Mauri, G.R.; Lorena, L.A.N. A new hybrid heuristic for driver scheduling. Int. J. Hybrid. Intell. Syst. 2016, 4, 39–47. [Google Scholar] [CrossRef]
- Behnia, F.; Schuelke-Leech, B.-A.; Mirhassani, M. Optimizing sustainable urban mobility: A comprehensive review of electric bus scheduling strategies and future directions. Sustain. Cities Soc. 2024, 108, 105497. [Google Scholar] [CrossRef]
- Gkiotsalitis, K. Public Transport Optimization; Springer International Publishing: Cham, Switzerland, 2023. [Google Scholar] [CrossRef]
Disclaimer/Publisher’s Note: The statements, opinions and data contained in all publications are solely those of the individual author(s) and contributor(s) and not of MDPI and/or the editor(s). MDPI and/or the editor(s) disclaim responsibility for any injury to people or property resulting from any ideas, methods, instructions or products referred to in the content. |
© 2025 by the authors. Licensee MDPI, Basel, Switzerland. This article is an open access article distributed under the terms and conditions of the Creative Commons Attribution (CC BY) license (https://creativecommons.org/licenses/by/4.0/).