1. Introduction
Robotic hands often require precise localization on surfaces and object arrangement capabilities for various applications. In manufacturing and assembly, they are employed for precision assembly and quality control, ensuring components are correctly positioned and aligned [
1,
2,
3]. In warehousing and logistics, robots perform order picking and inventory management by locating and arranging items efficiently [
4,
5]. Healthcare applications include surgical robots that navigate organ surfaces with precision and pharmacy automation for accurate medication dispensing [
6]. In agriculture, crops are harvested and sorted by robots, while in service robotics, they assist with cleaning and personal assistance tasks like arranging household items [
7,
8]. Retail applications involve stocking shelves and setting up displays, and in the food industry, robots handle food preparation and packaging. Construction robots precisely lay bricks and inspect surfaces, and in laboratory automation, they manage sample handling and chemical mixing. Entertainment and art applications include animatronics for lifelike motion and precise art installations. In all these fields, accurate localization and object arrangement are critical for efficiency, safety, and quality, often utilizing advanced sensors, computer vision, and machine learning algorithms [
9,
10].
Moreover, precise localization is required for robotic hands operating in harsh environments to perform challenging and dangerous tasks. In outer space, they are used for spacecraft maintenance and satellite servicing in the vacuum of space. Underwater, they handle deep-sea exploration and offshore oil and gas maintenance under high pressure and low visibility. In nuclear facilities, radioactive materials and decommissioning tasks are handled by robotic hands. In disaster zones, they navigate rubble for search and rescue and handle hazardous materials. Extreme weather conditions, such as Arctic and Antarctic research and desert operations, also necessitate robust localization capabilities. In mining and tunneling, they operate in dark, confined, and dusty environments, while in high-temperature industrial facilities and chemical plants, they manage materials under harsh conditions. Military applications include bomb disposal and reconnaissance in hostile environments. Additionally, robotic hands are used in volcanic areas for monitoring and lava flow management, and in forest fire zones for firefighting and post-fire assessment. These environments require robotic hands with advanced localization and manipulation capabilities, utilizing specialized sensors, robust materials, and sophisticated control algorithms to ensure safety and effectiveness [
11,
12].
Typically, sensors for robotic hands are either vision-based or capacitive. Vision-based sensors use cameras to detect and track objects, providing information about position, orientation, and distance. However, they can be affected by environmental factors such as lighting conditions, occlusions, and limited field of view, and they require substantial computational resources for real-time processing. Capacitive sensors, on the other hand, detect changes in capacitance when objects come into proximity, allowing for contactless sensing. However, they can be sensitive to environmental noise, humidity, and temperature changes, which can reduce their accuracy. Additionally, capacitive sensors often struggle with accurately detecting objects that have low dielectric constants or are non-conductive, and they tend to have a limited sensing range compared to other types of sensors.
Localization of a robotic hand using vision-based or capacitive sensors is therefore limited. Vision sensors can provide position and orientation data but are affected by lighting and occlusions, while capacitive sensors detect proximity but struggle with non-conductive materials and environmental factors, making precise localization difficult. For accurate and reliable localization, these sensors alone are insufficient and often require integration with other technologies [
13,
14,
15,
16,
17].
In [
5], a vision-based tactile sensing system with high spatial resolution is presented. The authors introduce a novel stereo vision-based tactile sensor capable of detecting tactile point clouds with high spatial precision. In [
18], Guan et al. propose a multi-sensor fusion approach combining VLP, SLAM, LiDAR, odometry, and a rolling shutter camera, achieving precise robot localization and navigation, even in LED-deficient environments, with an accuracy of 2.5 cm and a positioning latency of 42 ms. Zhu et al. [
19] present a multimodal capacitive sensor with pressure and localization capabilities, showing potential for bio-mechatronics applications, such as robotic fruit picking or diabetic insoles. In [
20], Carvalho et al. employ a method for object recognition using a three-fingered robotic hand that actively explores objects to reduce uncertainty. This approach, framed in Bayesian perception, gathers evidence through touch and guides exploration based on areas of interest. Experiments show the advantages of this active exploration over passive strategies.
Beyond vision- and capacitive-based sensing, several other localization technologies are commonly used in robotics, including Wi-Fi, Bluetooth Low Energy (BLE), ultra-wideband (UWB), and infrared systems. Fingerprint-based Wi-Fi localization is widespread and cost-effective, but typically achieves meter-level accuracy (roughly 1–3 m) in real-world indoor environments [
21]. BLE-based approaches provide similar coverage and low power consumption, but with positioning errors generally around 1–1.5 m, even with optimized deployment and algorithms. Additionally, ultra-wideband (UWB) systems have demonstrated exceptional indoor localization accuracy for mobile robots—with reported mean errors as low as 13 cm for static targets and 29.9 cm for moving robots—surpassing the performance of BLE- and Wi-Fi-based systems in comparative evaluations [
22].
In contrast, this work provides short-range, high-precision, compact, fully passive localization, designed specifically for scenarios where lighting, occlusion, or surface materials undermine other sensing modalities. This emphasizes the unique niche of our method, complementing rather than competing with long-range RTLS technologies, and making it highly relevant for close-proximity manipulation tasks. Radio frequency (RF) sensing offers a promising alternative for robotic hand localization. RF signals can penetrate certain materials, operate independently of lighting conditions, and maintain robust performance in adverse environments such as underwater, underground, or in high-interference industrial spaces. RF sensors facilitate object identification and tracking through fully passive, chipless resonator tags, eliminating the need for onboard tag power and enabling scalable, low-maintenance operation [
23,
24,
25].
Applications similar to the proposed RF-based approach have been explored in several recent works focused on passive RFID localization and robotic manipulation. Y. Zhang et al. developed an indoor localization system that combines phase-based dual-frequency ∆PDOA measurement and real-time tag fusion to enhance positioning accuracy for mobile robots without relying on RSSI-based ranging methods [
26]. F. Shamsfakhr et al. presented a Kalman smoother-based framework to localize a mobile agent and reconstruct its trajectory using phase measurements from passive UHF RFID tags [
27]. Additionally, the system proposed in [
28] enables centimeter-level location and orientation tracking by modeling the phase shift caused by tag orientation changes, achieving exceptional accuracy with passive RFID tags. These studies underscore the growing interest in harnessing passive RF technologies for robotic localization. However, most require dense tag deployment, infrastructure support, or operate in far-field regimes. In contrast, the present work introduces a fully passive, low-cost, scalable near-field RF localization framework using custom resonator tags, suitable for robotic hand applications in proximity-sensitive tasks [
29].
The aim of this work is to develop a simple, cost-effective, and compact RF-based sensing system for localizing a robotic hand within its tactile sensing range.
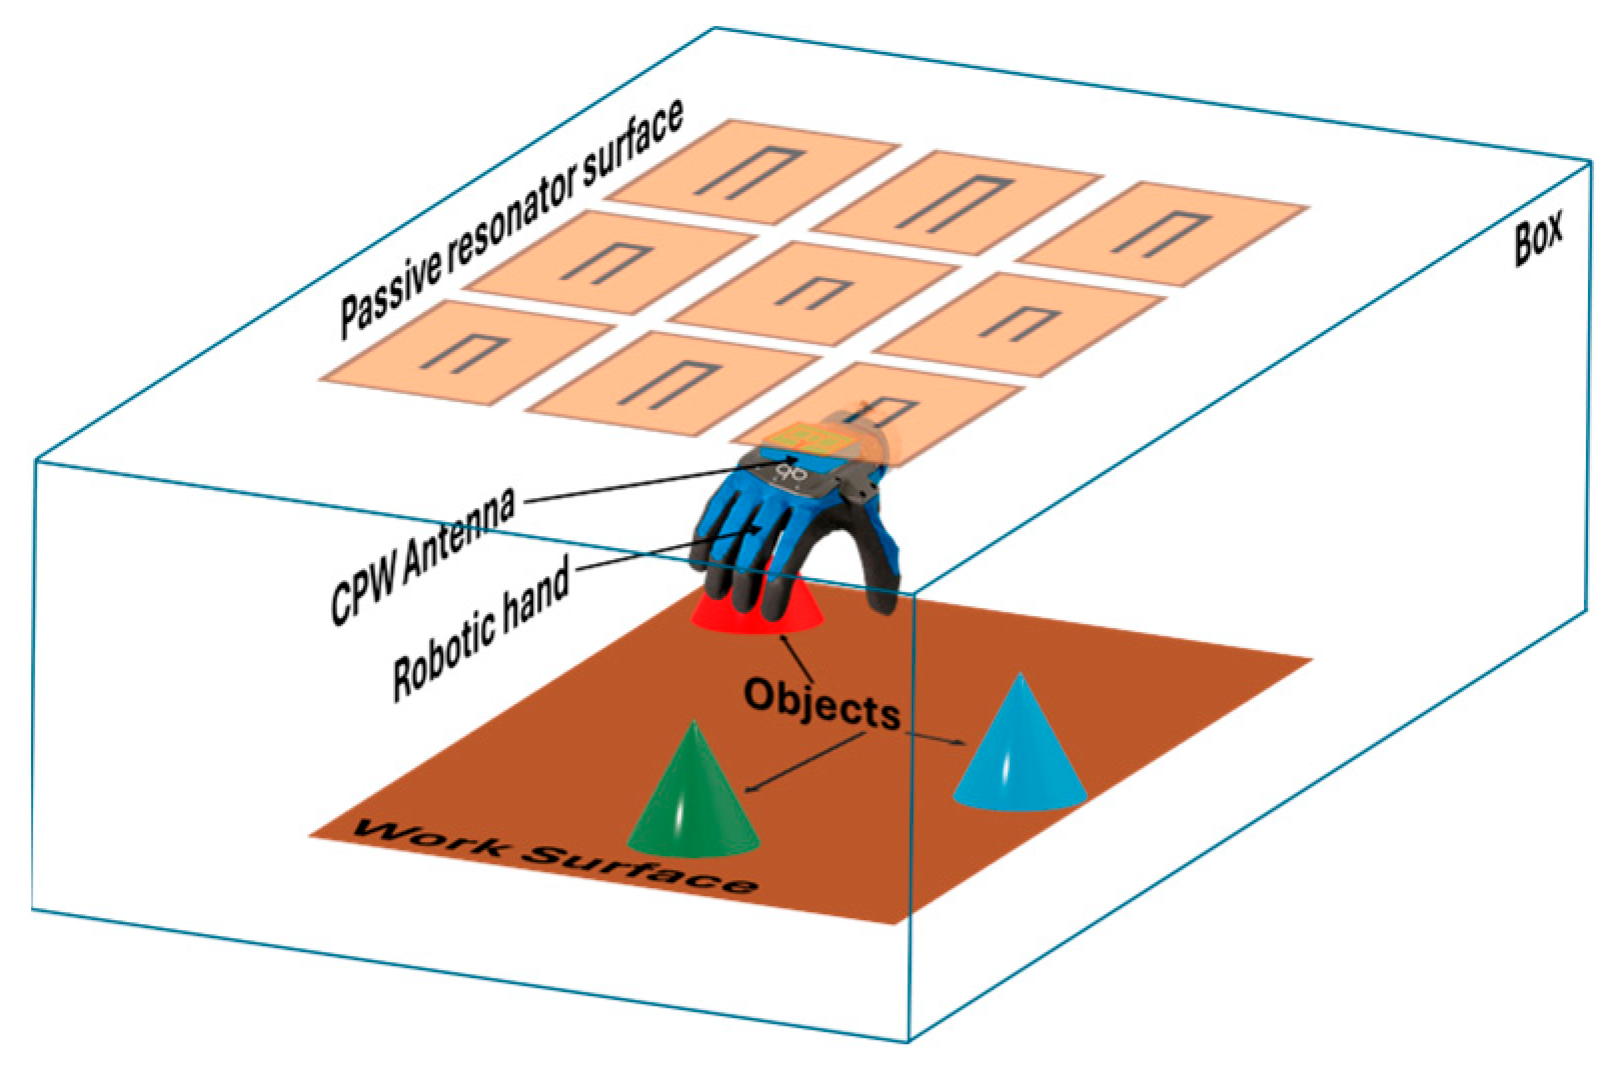
Figure 1 presents the conceptual scenario, in which a robotic hand equipped with a coplanar RF probe interacts with a surface embedded with fully passive resonator tags. The resonators are arranged in a structured grid, allowing the system to determine the position and orientation of the hand based on variations in the probe’s impedance response as it moves. By using resonators of different lengths, the system can uniquely identify each position, and the sensing area can be expanded by reconfiguring the printed tag layout.
The main contributions of this work are as follows:
- (i)
Development of a compact, fully passive RF-based localization system for robotic hands;
- (ii)
Fabrication of flexible resonator tags using a custom conductive ink and an open-source 3D printing platform;
- (iii)
Demonstration of high spatial resolution and robustness to environmental lighting and surface material variations;
- (iv)
Validation of system performance through combined electromagnetic simulation and experimental testing;
- (v)
Discussion of scalability, industrial integration, and commercialization potential.
On the other hand, this is the first demonstration of directly printing fully passive RF resonator tags for robotic hand localization using Ag–EGaIn–polymer conductive ink, thereby extending its application beyond flexible electronics into passive near-field RF sensing.
The functionality of the system is validated through electromagnetic simulations and experimental measurements, demonstrating its effectiveness for near-field localization in environments where traditional sensing methods may be unreliable. Moreover, this system can estimate the hand’s orientation relative to the object or surface, as well as the distance between them, as explored in previous studies [
30,
31].
The remainder of this paper is organized as follows.
Section 2 presents the numerical design and simulation framework of the probe–resonator configuration.
Section 3 describes the fabrication methodology, including materials, printing techniques, and geometry optimization.
Section 4 outlines the experimental setup used to evaluate the system’s performance.
Section 5 reports and analyzes the experimental results related to localization accuracy and impedance behavior.
Section 6 discusses the broader implications, limitations, and potential improvements of the proposed approach. Finally,
Section 7 concludes this paper by summarizing the main contributions and outlining future research directions.
3. Fabrication and Characterization
The preliminary investigation [
32] indicated that the minimum length of the resonator must exceed the length of the guiding (L
G) element (shown in
Figure 2) for a reliable system response. Additionally, as the resonator length surpasses the probe length of 65 mm, both the impedance and the resolution of the resonance frequency begin to decrease. Consequently, 15 resonators were fabricated based on their strong response and frequency distinction, with arm lengths ranging from 38.5 mm to 59.5 mm by the change of 1.5 mm in effective length.
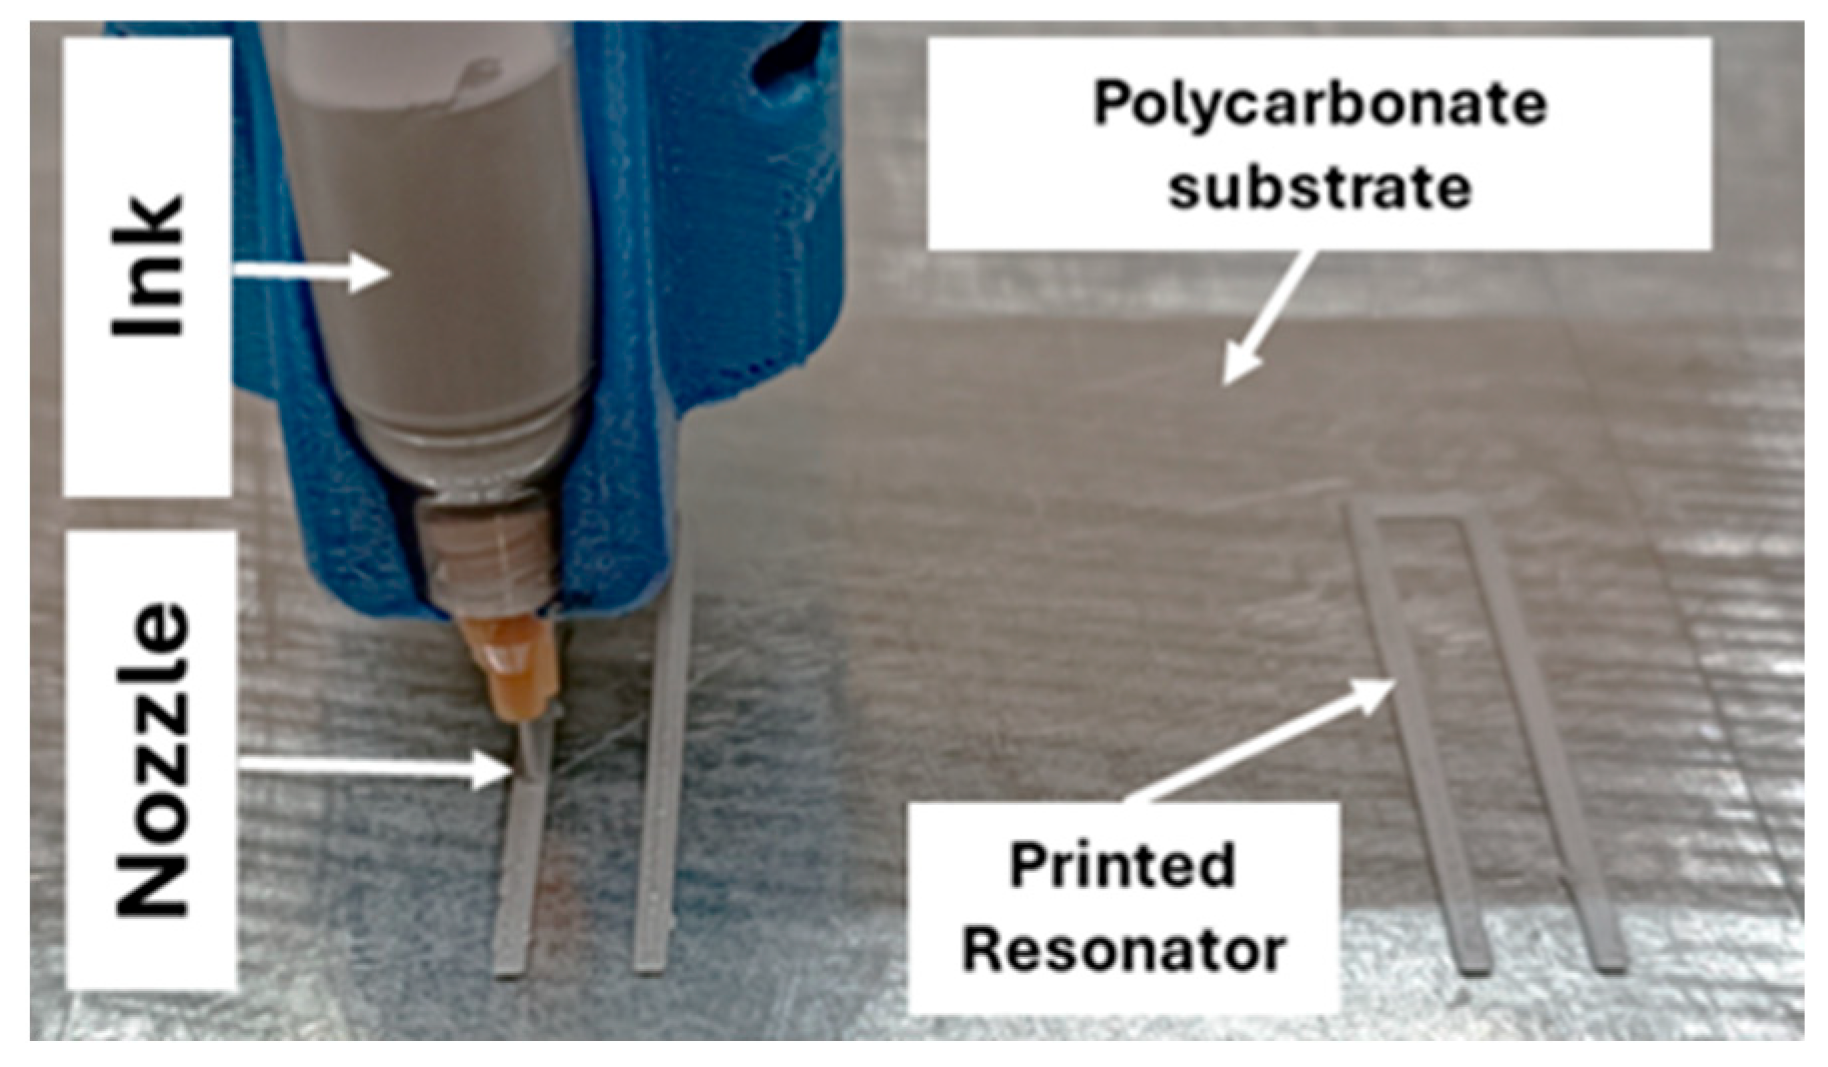
The fabrication process, illustrated in
Figure 7, employed a custom Ag–EGaIn–polymer conductive ink and a prototype printer based on an open-source 3D printing platform. This sinter-free ink, developed in our laboratory, enables direct digital printing of electronic circuits on a wide range of substrates, including heat-sensitive plastics and textiles, which is advantageous for extending this work to diverse applications. It is highly stretchable (>600%), cures at room temperature, becomes conductive immediately after deposition, and stabilizes within three days or within one hour when heated to 60 °C. Its properties also allow for interfacing with microchips [
33], supporting future development of more advanced and active devices. The custom printer offers precise motion and extrusion control, achieving micrometer-level resolution over a 330 × 330 mm working area, and surpasses typical commercial ink extrusion printers in feed rate. Printing parameters, including extrusion speed and nozzle velocity, were precisely controlled, with movement speeds of up to 20 mm/s and a pressure advance value of 4.15 to ensure consistent extrusion during sharp corners and trace transitions. A custom-made 0.33 mm internal diameter nozzle was used, and concentric infill settings in Prusa Slicer ensured uniform ink distribution. To achieve optimal electrical performance for this application, six layers of ink were deposited, yielding resistances below 1 Ω between the farthest points of the resonator; however, initial tests indicated that three layers already provided the required conductivity. Final fabricated resonators consistently demonstrated resistances below 0.6 Ω, confirming excellent conductivity, structural integrity, and repeatable fabrication quality. Each printed trace layer is approximately 150–200 µm thick, with a total of six layers, resulting in a combined thickness of about 1.0–1.2 mm. The extrusion process was controlled to produce uniform cross-sections, benefiting from the rheological stability and self-healing behavior of Ag–EGaIn droplets in the polymer matrix, which ensures continuous conductivity during printing. Literature reports indicate that this ink exhibits conductivity variation below 5% under 50% uniaxial strain, full recovery after up to 1000 bending cycles, and negligible degradation under 50% relative humidity for 24 h [
34].
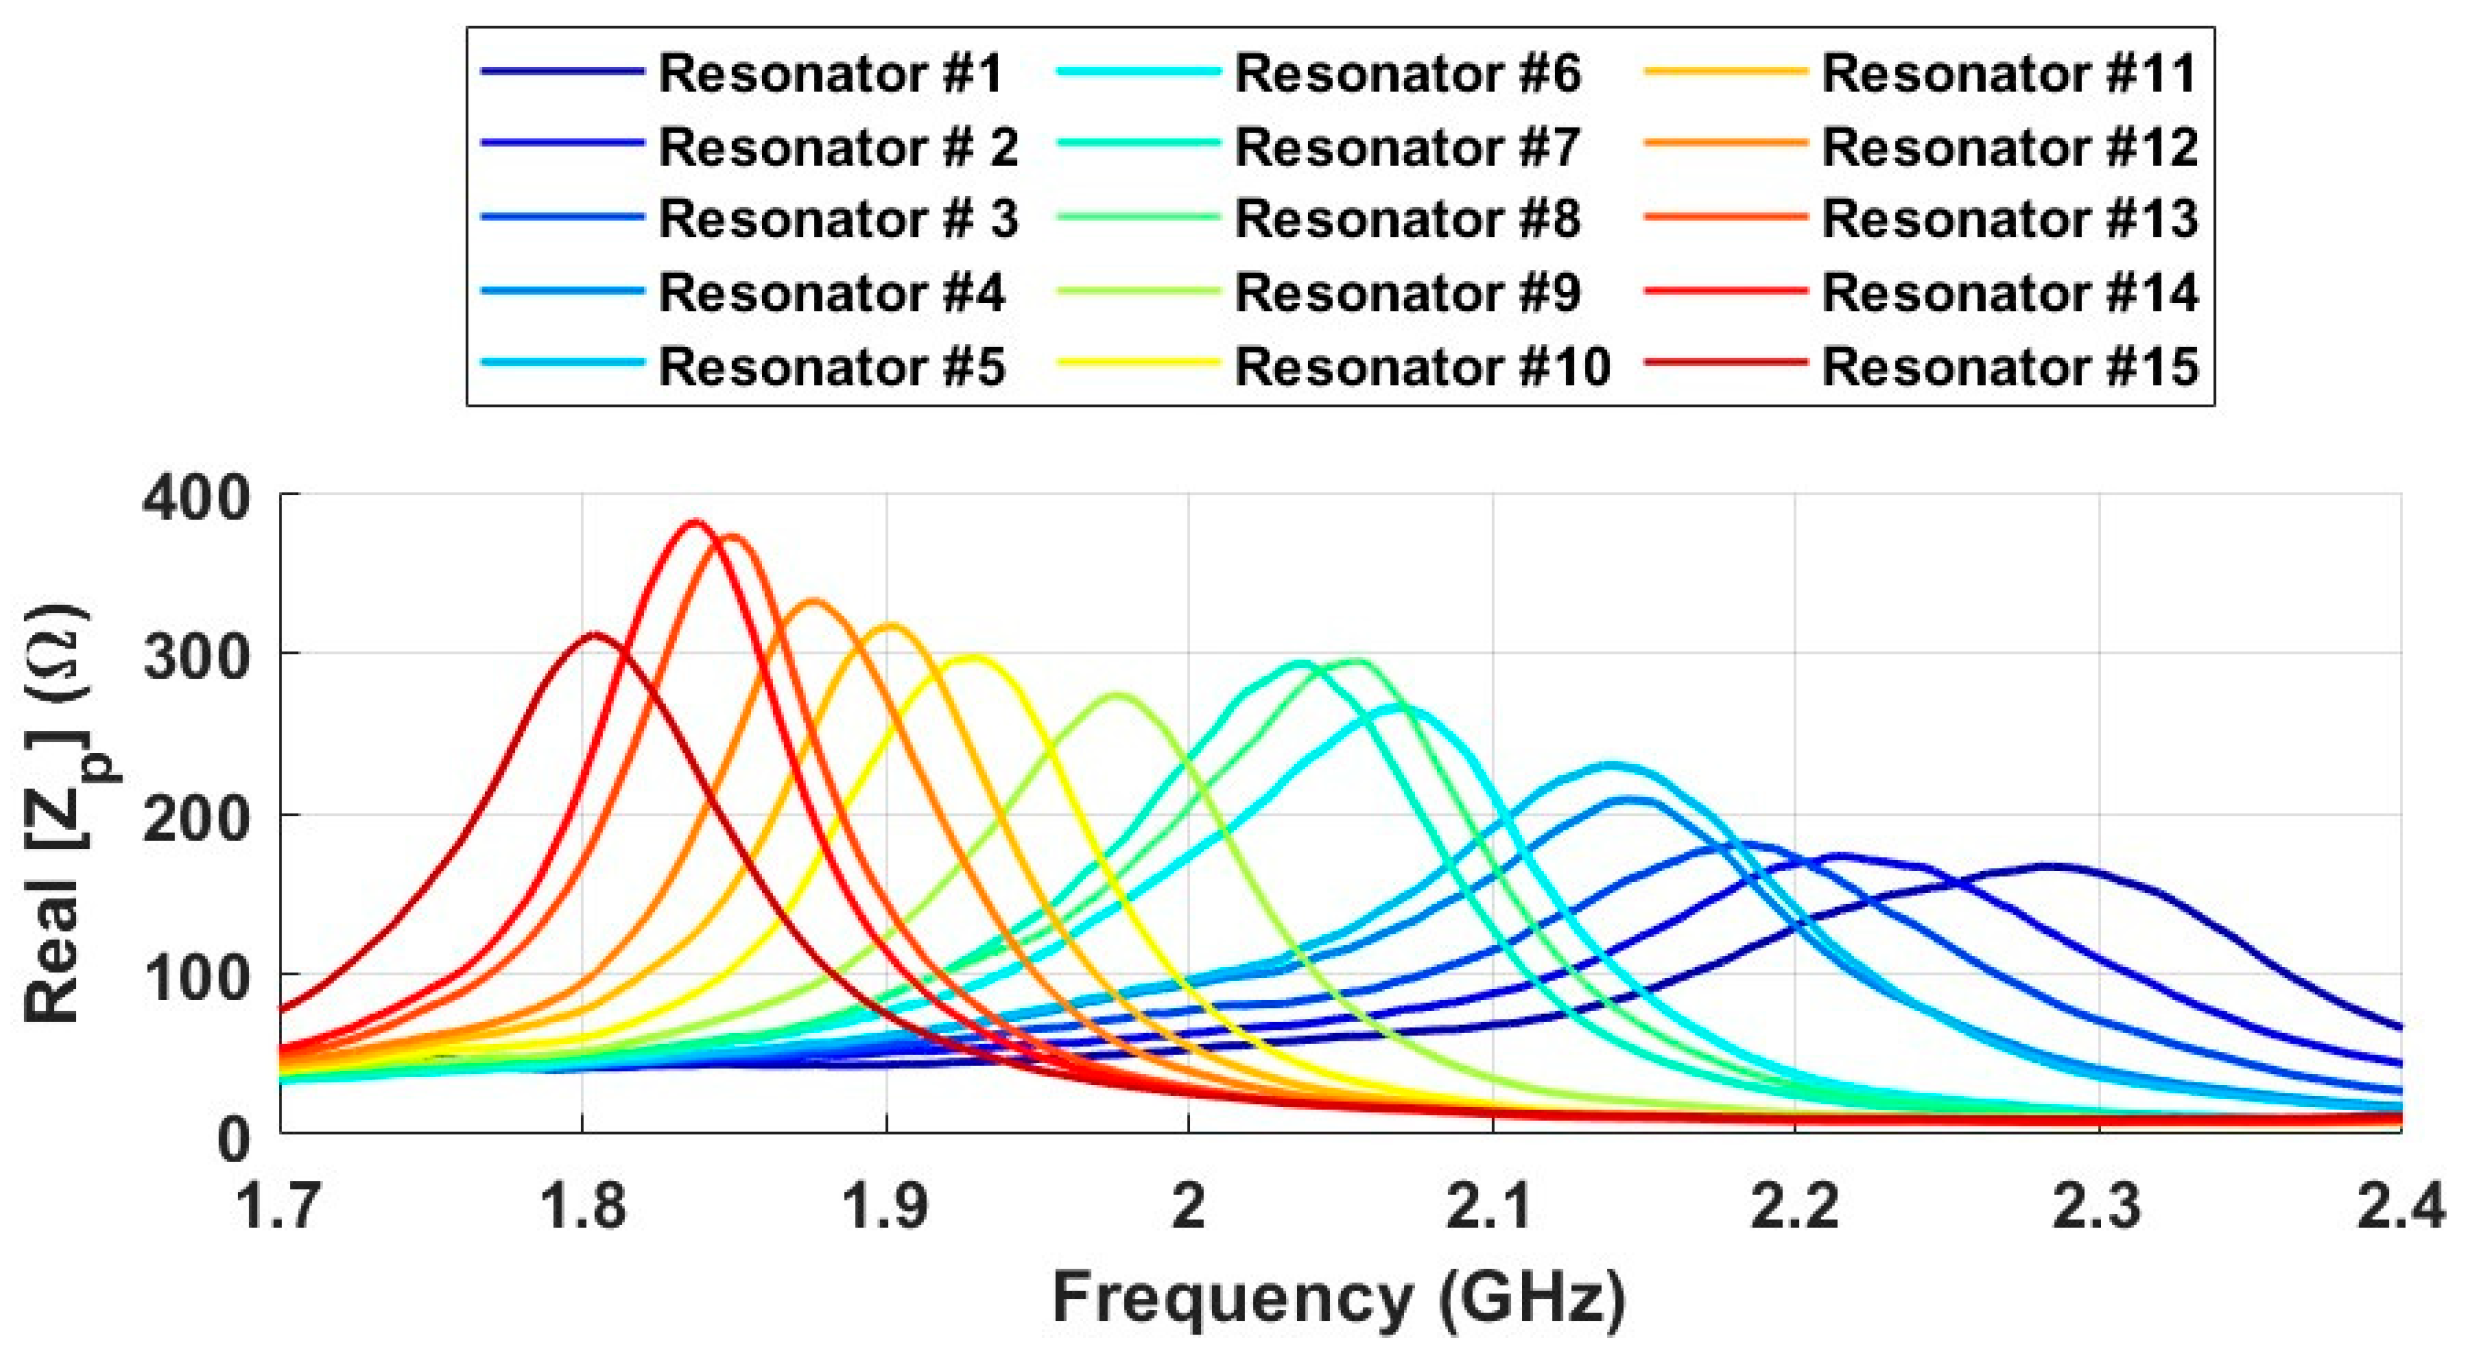
During the initial measurement phase, the response of the probe placed on the hand was assessed in conjunction with the 15 fabricated resonators, maintaining a distance of 10 mm between the hand and the resonators.
Figure 8 displays the results of these measurements across the frequency range of 1.7 GHz to 2.4 GHz. The results clearly indicate that the fabricated tags are suitable for localization purposes, as the impedance values are quite noticeable, and the differences in resonance frequency between the tags are significant in most cases. Consequently, to achieve the most distinct results and high resolution, 9 out of the 15 resonators with the strongest response and distinct resonance frequencies were selected for use in a 3 × 3 grid as the work surface. The details of the selected resonators are provided in
Table 1.
4. Experimental Setup
Experimental measurements for the localization test were conducted using a 4D platform, which allowed for movement along the X, Y, and Z axes, as well as rotational adjustments for angle alignment (Axis A). The probe was angularly aligned with the resonators and positioned 8 mm from the tags, which were arranged in a random 3 × 3 grid based on a Sudoku pattern. The probe moved along the Y axis, starting 15 mm above and 25 mm in front of the center of the first tag. The movement proceeded in 5 mm increments along the X axis and 15 mm increments along the Y axis, resulting in 13 rows of movement. This process was repeated in both directions along the X axis with 15 mm increments, covering 11 different search columns.
In this setup, we define ‘away’ as any motion that moves outward from the reference starting point of scanning and ‘toward’ as motion directed inward. These directional terms are applied consistently along both axes. Along the Y-axis (row progression), ‘away’ indicates motion from right to Left (+Y), while ‘toward’ corresponds to motion from left to right (−Y). Similarly, along the X-axis (within a column), ‘away’ denotes movement from top to bottom (−X), and ‘toward’ refers to movement from bottom to top (+X).
The S11 parameter values for both the probe and the resonators were measured using a high-precision Anritsu ShockLine MS46524B VNA device, paired with Anritsu cables.
The measured S
11 values were converted to input impedance using a MATLAB R2023b script, and the resulting data was plotted. The formula is as follows [
35,
36]:
where:
Zin is the input impedance;
S11 is the complex reflection coefficient;
Z0 is the system reference impedance (typically 50 Ω in our setup).
The VNA was configured to perform a frequency sweep from 0.5 to 4.0 GHz with 801 evenly spaced sampling points. This frequency resolution (~4.37 MHz per point) was selected to ensure accurate detection of resonance peaks while maintaining a reasonable acquisition time for each measurement position. A full one-port calibration using standard open, short, and load references was conducted before the measurements. The probe’s reflection coefficient (
S11) was measured across the selected frequency range and processed in MATLAB to extract impedance and admittance profiles. The operating cycle corresponded to a sweep time of 3000 milliseconds per scan. This sweep time was intentionally selected to ensure robust measurement stability and reliable data acquisition. It reflects a configuration choice for measurement quality rather than a limitation or indicator of the system’s intrinsic performance.
Figure 9 and
Figure 10 illustrates the measurement setup and process for further clarity and reference.
5. Experimental Results
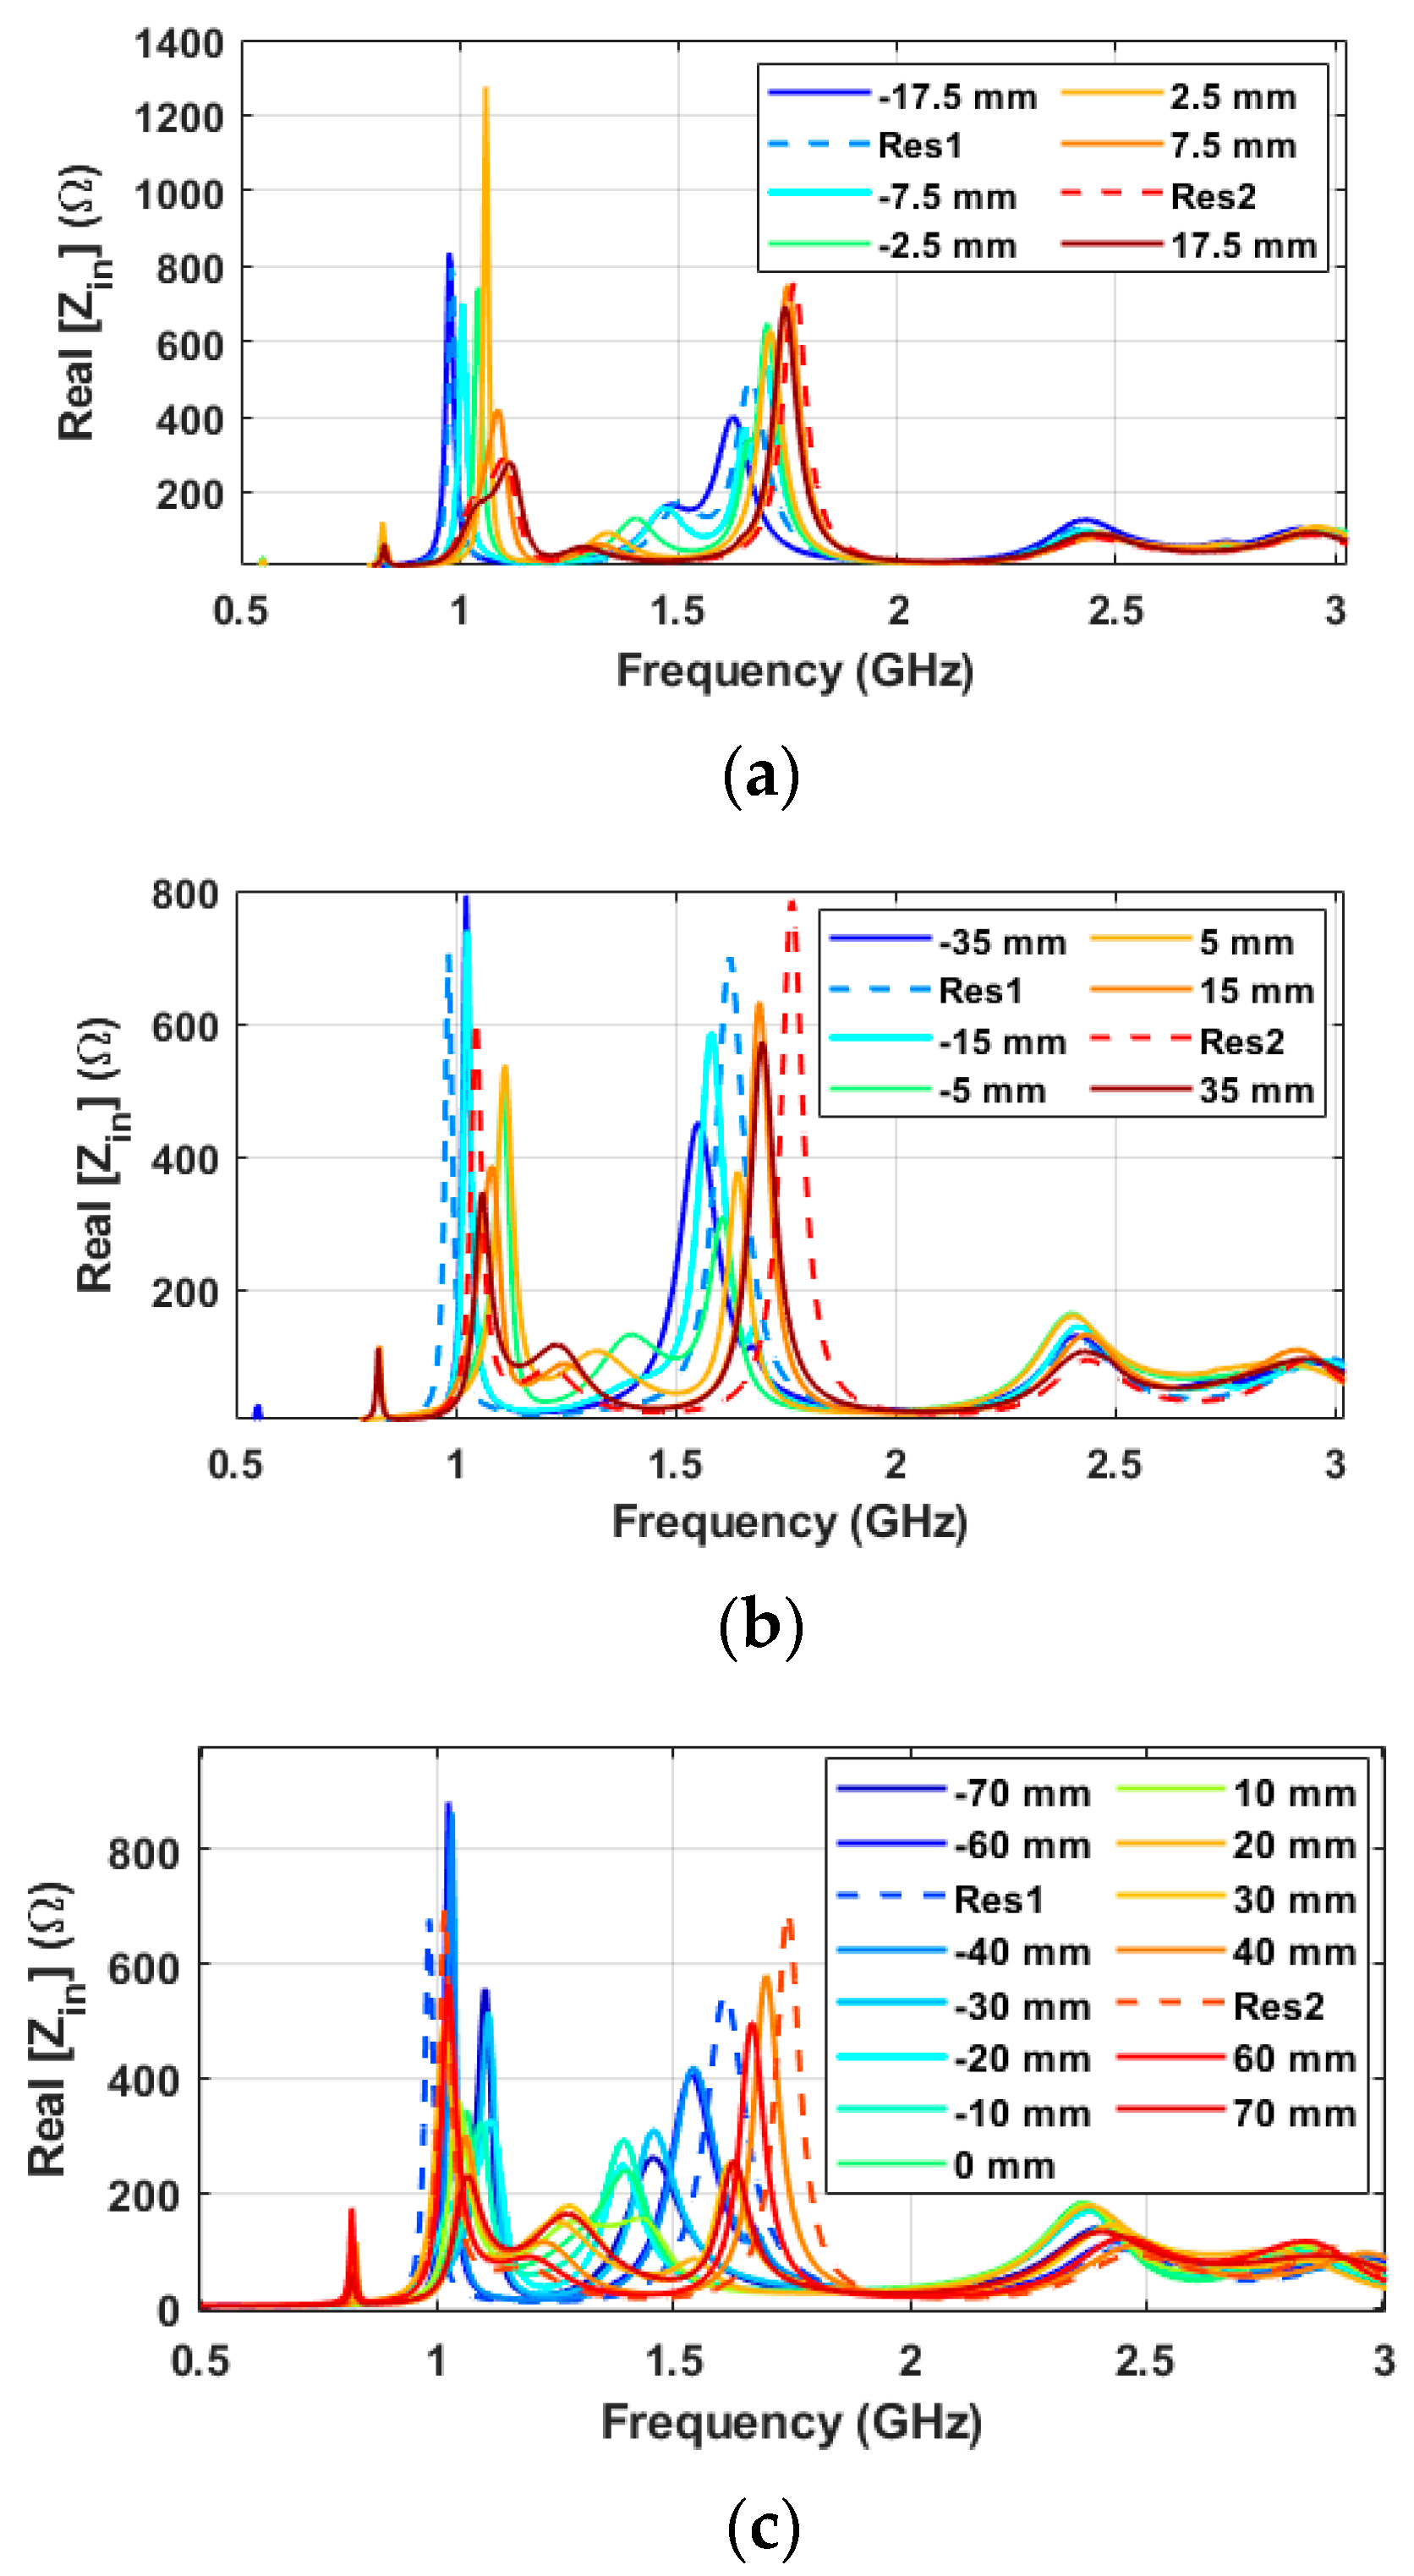
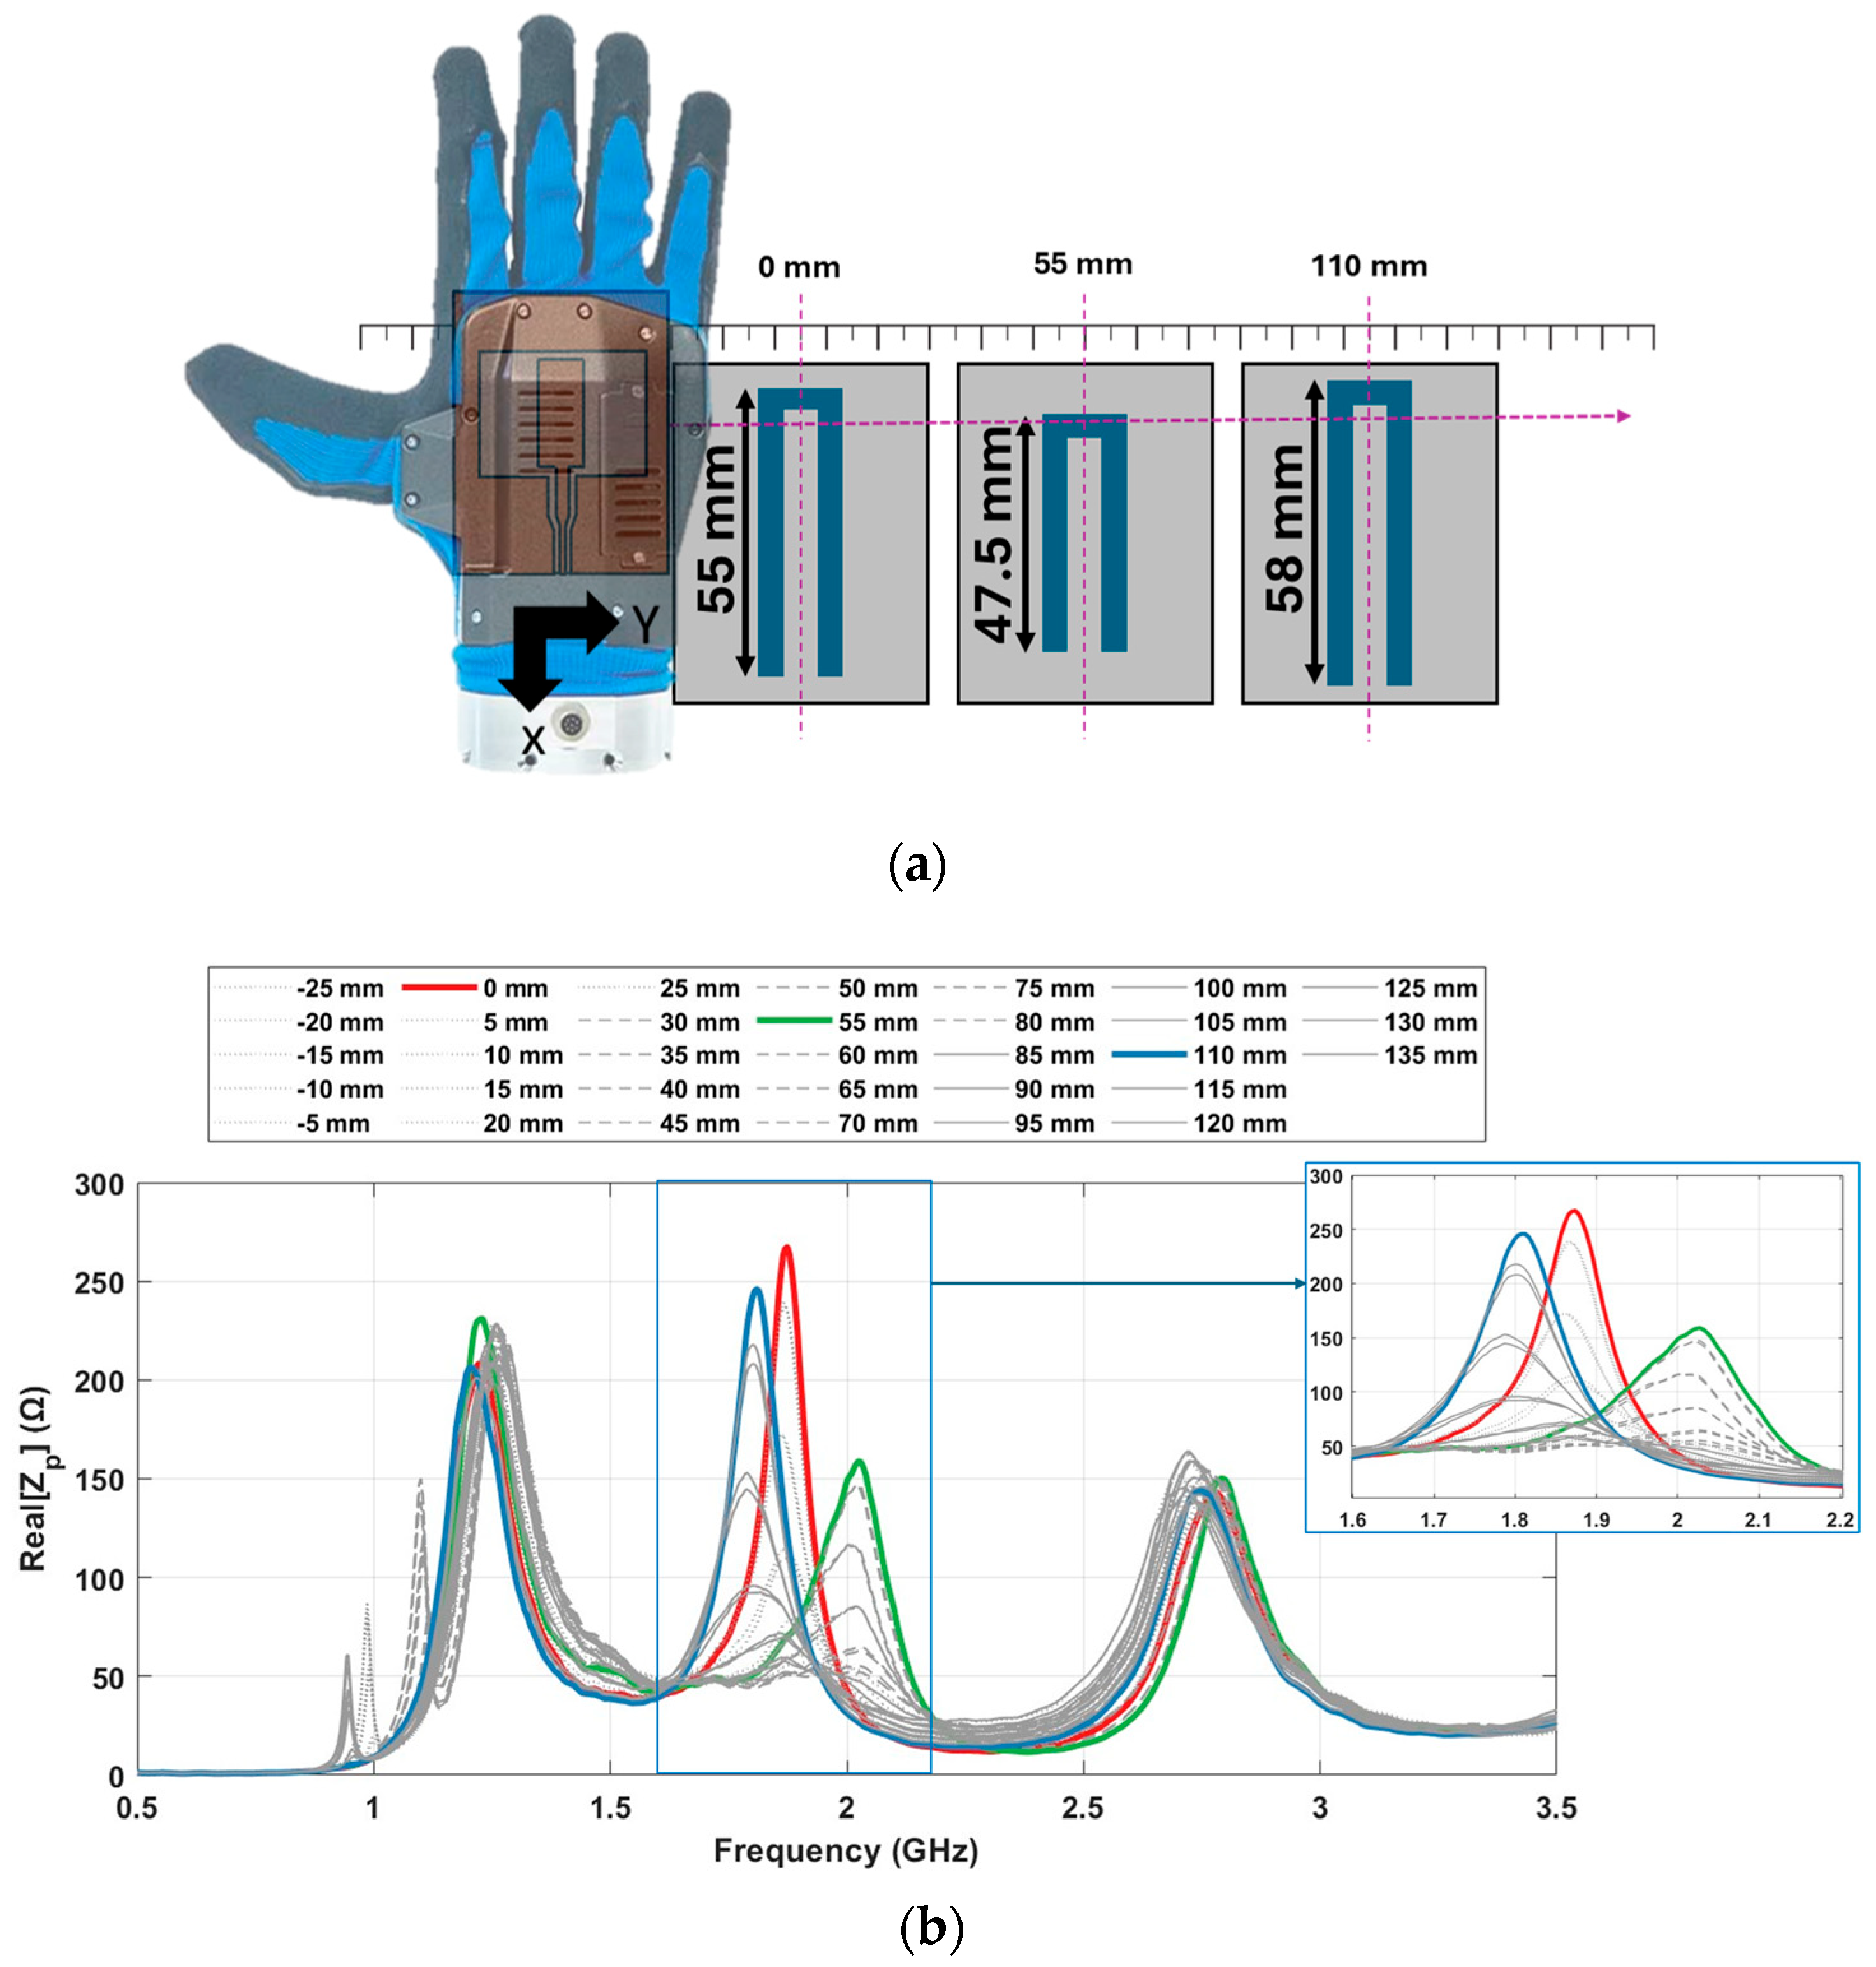
Figure 11 illustrates the input impedance values for 33 different positions while searching along the
Y direction. As shown in
Figure 11a, the center line of cells is placed in points 0 mm, 55 mm and 110 mm and the hand starts to move from point −25 mm to 135 mm by 5 mm step passing through all cells.
Figure 11b illustrates the real part of the measured impedance as a function of frequency across different lateral hand positions. Notably, in the frequency range of 1.7 GHz to 2.4 GHz, three distinct peak points are observed. The three colored curves represent measurements taken when the hand is aligned with the centerlines of the three tagged cells, located at 0 mm (red), 55 mm (green), and 110 mm (blue), respectively. These positions correspond to the central axes of the passive resonators in the sensing grid and serve as reference points for evaluating the system’s spatial response.
To better interpret the spatial sensitivity of the system, the surrounding gray curves show the impedance responses at positions adjacent to each centerline. These curves are differentiated by line style based on their proximity to each respective tag:
Solid gray lines correspond to positions near the 0 mm centerline.
Dotted gray lines represent positions close to the 55 mm centerline.
Dashed gray lines indicate positions surrounding the 110 mm centerline.
This visual grouping highlights how the impedance response varies with lateral displacement from the tag positions and confirms that peak impedance consistently occurs when the hand is directly aligned with a cell center. The inset further magnifies the frequency band around the resonant peaks, enhancing the comparison between central and off-center measurements. It is obvious that within each group, the maximum value occurs when the probe is aligned at the center of the corresponding column. Additionally, around the frequency of 1.0 GHz, an extra peak point emerges when the probe is not aligned with the column, as shown by the dashed or dotted curves. However, when the probe is properly aligned with the column, represented by solid curves, these additional peaks disappear.
5.1. Search in Direction Y
To better visualize the system’s behavior, the maximum impedance values were plotted against their corresponding positions throughout the entire search in both the X and Y directions. This approach offers a clearer understanding of how the system responds across the grid and highlights the relationship between the probe’s position and the peak impedance values during the search process.
The distance between the centers of the tags along the
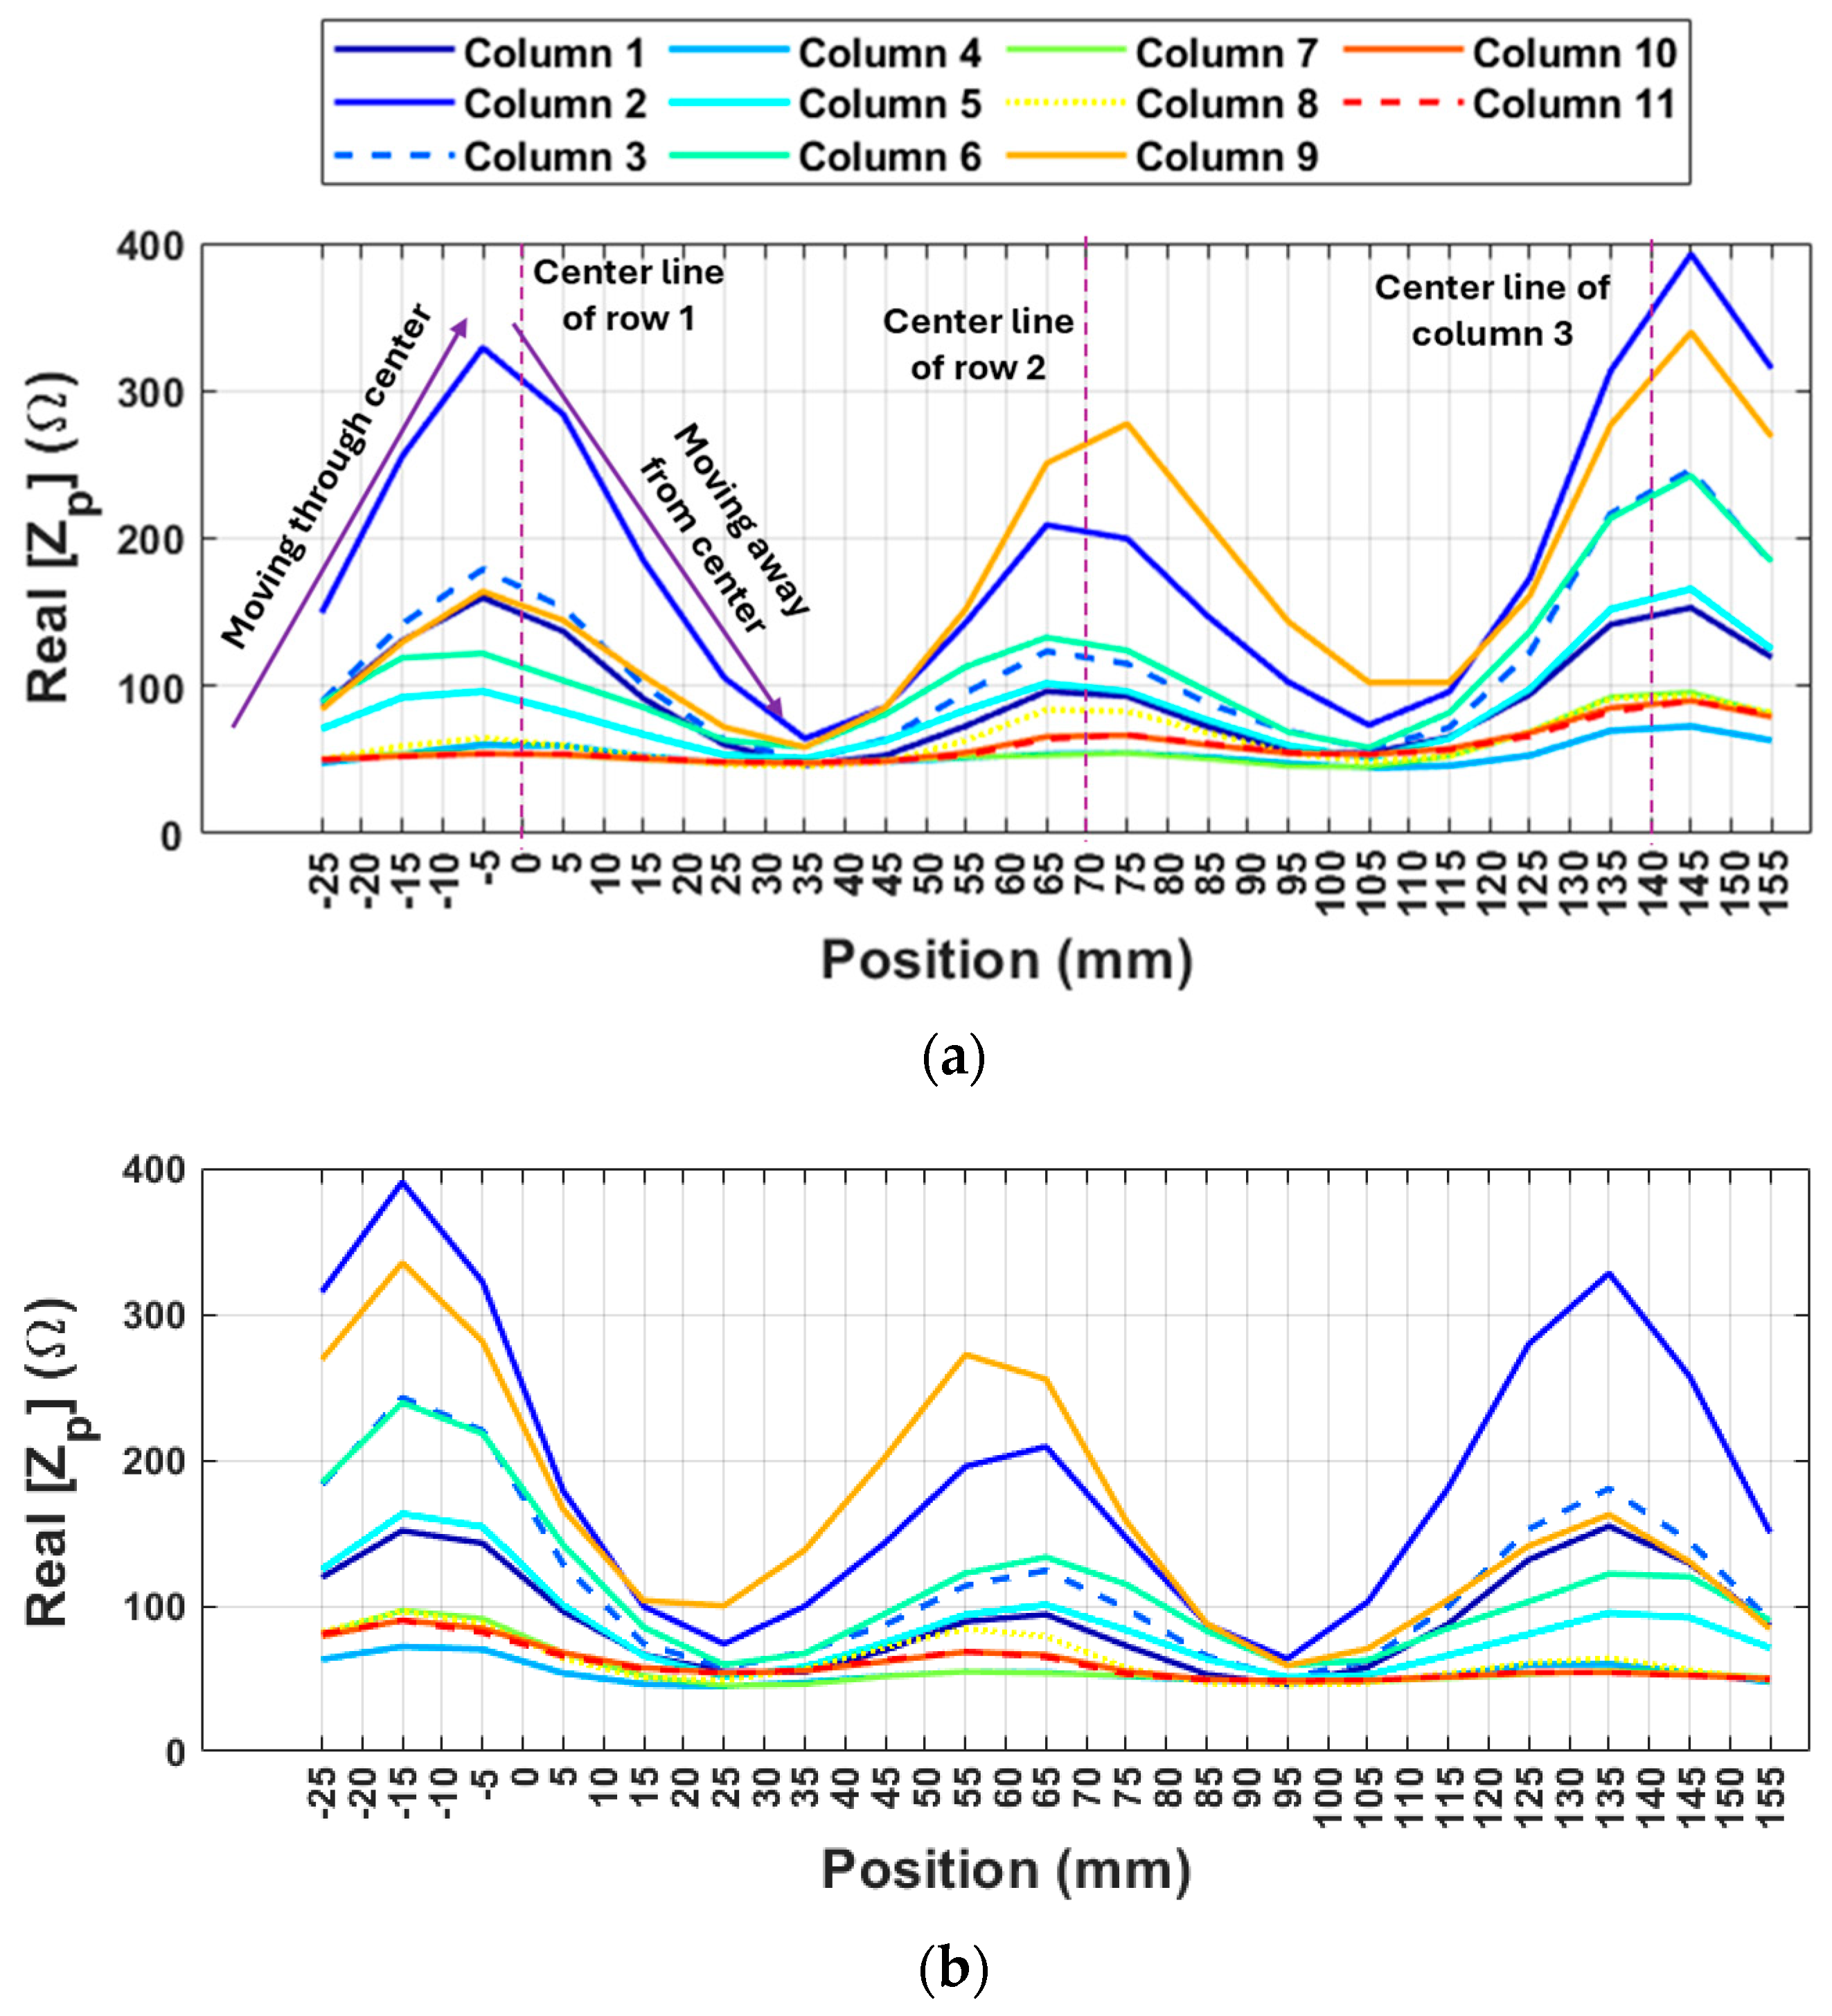
Y-axis is 55 mm, corresponding to positions at 0 mm, 55 mm, and 110 mm, which align with the columns. The graph demonstrates that when the hand is perfectly aligned with the centerline of a column, the impedance value peaks, and even slight misalignment causes it to decrease (
Figure 12). This suggests that detecting changes in impedance could allow for precise determination of the hand’s vertical position (
Y-axis). This conclusion is reinforced by the significant variations in impedance values observed across different hand positions, regardless of their location relative to the tags along the
X-axis. Additionally, it can be seen that reversing the direction of movement yields the same results. It is also worth noting that as the hand moves closer to the center of the cells along the
X-axis, the impedance values increase and become more pronounced. However, it remains possible to detect hand alignment even at greater distances from the cell centers.
5.2. Search in Direction X
Figure 13 illustrates the variation in the maximum real part of the probe’s input impedance as the robotic hand moves along the
X-axis over the tagged surface. Distinct impedance peaks are observed at approximately 70 mm intervals, corresponding to the center points of the resonator tags, which are located at
X = 0 mm, 70 mm, and 140 mm. These peaks occur due to strong electromagnetic coupling between the probe and a resonator when the probe is precisely aligned above it, resulting in a measurable resonance effect.
This alignment-sensitive impedance behavior confirms the system’s ability to accurately detect the hand’s lateral position. While a slight positional offset of 5–10 mm may occur—attributed to the probe’s physical characteristics—this can be easily corrected through calibration by aligning the peak impedance response with the centerline of the corresponding tag. Preliminary investigations [
31] have shown that the system is sensitive to displacements as small as 1 mm, with performance strongly influenced by frequency resolution and impedance values. Even such small movements produce measurable shifts in the peak frequency response. However, using larger displacement steps can increase the system’s scanning speed while still maintaining acceptable accuracy.
Repeatability of the impedance-based localization system was evaluated by performing two independent measurement runs (“away” and “toward”) for each of the 11 positions in the tag array in
X direction and comparing the results using the Mean Absolute Error (MAE) and coefficient of determination (R
2). The MAE, defined as the average absolute difference between the two runs, ranged from 0.021 to 0.279, with the majority of values below 0.2, indicating minimal deviation between repeated measurements. The R
2, obtained as the square of Pearson’s correlation coefficient, ranged from 0.9692 to 0.9986, with most values above 0.99, demonstrating an extremely strong linear correlation between repeated measurements. The repeatability of these peaks across multiple trials underscores the system’s robustness and spatial sensitivity, suggesting that the proposed RF-based localization method is well suited for applications requiring reliable planar tracking of a robotic hand, particularly in environments where visual or capacitive sensing is impractical due to lighting, occlusion, or environmental conditions. It should be noted that the slight differences in values are attributable to the limited positional accuracy of the search platform rather than the sensing system itself; if the sensor were placed in exactly the same position as in the previous run, it would yield identical readings.
Table 2 shows the repeatability analysis results for the impedance-based localization system, including the Mean Absolute Error (MAE) and coefficient of determination (R
2) for each position row.
6. Discussion
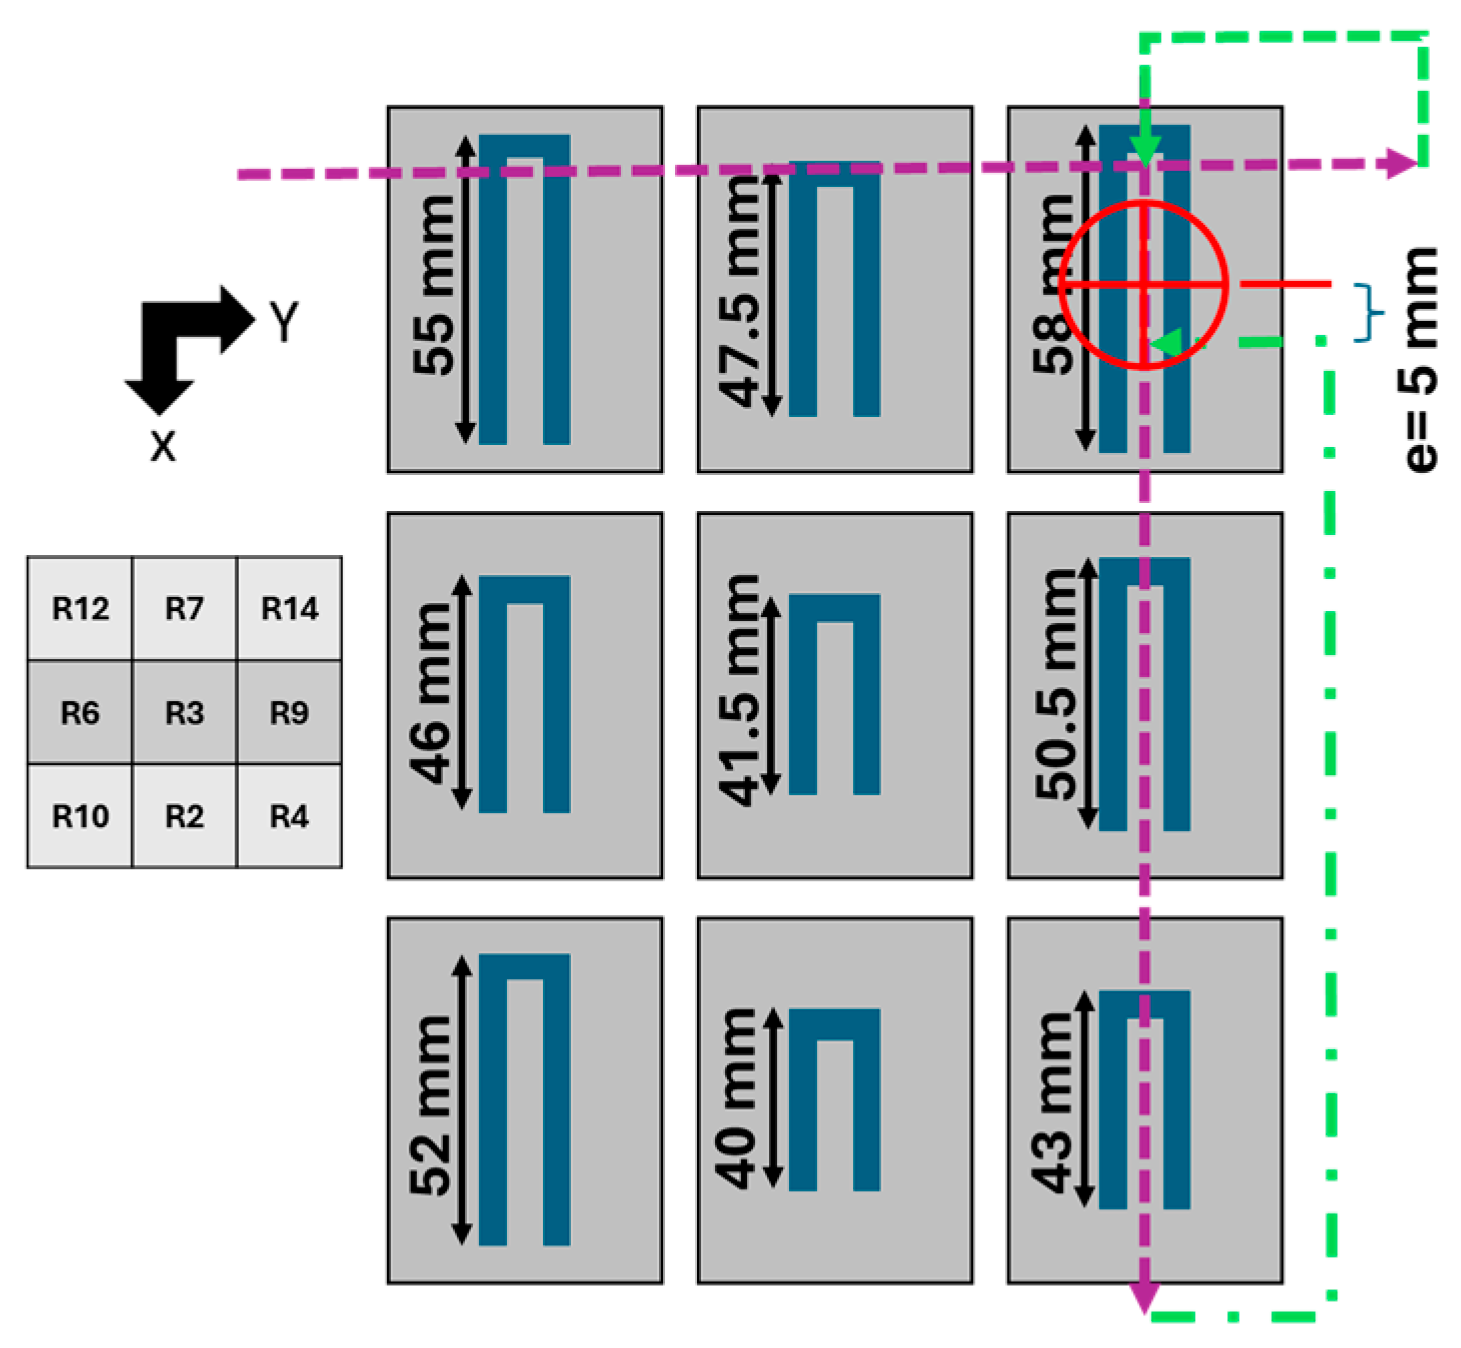
The presented results have enabled us to locate the robotic hand across a working surface as it moves in various directions, utilizing the features of the proposed probe–tag configuration. Deploying this sensor system requires careful planning to establish a structured method for successful location detection when both the position and orientation are unknown. In the initial approach, it is assumed that the hand begins moving along the first row, aligning itself with the position corresponding to the maximum measured impedance value. Due to the frequency sweeping within the selected range, all data is available simultaneously. The hand then moves in the second direction, once again aligning itself with the peak impedance value. As shown in
Figure 14, the hand becomes aligned with tag #14. At this point, the tag can be identified based on its resonance frequency and impedance value. Since the distance between tags in both directions is predefined, the hand can then move to the next cells and detect its position by aligning with the resonance frequency and impedance value of the corresponding tag. It is important to note that this is one proposed approach for alignment and location detection, but it can be adapted, for instance, by selecting the minimum impedance value or targeting a specific resonance frequency.
As illustrated in
Figure 15, a 3 × 3 section of a 9 × 9 Sudoku pattern was selected and tested in the experiments. However, the working surface can be expanded to a full 9 × 9 grid by adding additional arrangements. In this scenario, after identifying a specific tag, it will have four neighboring cells, each with distinct resonance frequencies and impedance values. Additionally, the same tag within the 9 × 9 pattern will have a different configuration of neighboring cells, which helps the system recognize various locations. For instance, in the tested pattern, tag #14 has a neighbor code of (10, 12, 7, 9) when the hand moves in a counterclockwise direction. The same tag in a different location could have neighbor codes like (2, 3, 10, 7) or (9, 10, 2, 9), enabling the system to accurately locate the hand over a larger surface.
The proposed RF system achieves high spatial resolution in short-range applications while operating with fully passive tags, resulting in low integration complexity and high robustness to environmental factors such as lighting variability or surface texture. Vision-based methods can offer comparable resolution over medium-to-long ranges but are highly dependent on lighting conditions and require more complex integration. Active RFID and UWB solutions provide good-to-high accuracy over greater ranges but rely on battery-powered tags and more complex electronics. Wi-Fi and BLE systems offer wide coverage and ease of deployment, but their meter-level accuracy limits their suitability for fine manipulation tasks. Infrared systems achieve very high resolution under controlled conditions but require strict line-of-sight, making them less reliable in cluttered or occluded environments.
This comparative analysis highlights the unique application scope of the proposed system for short-range, high-precision localization in conditions where vision and capacitive methods may fail.
Table 3 summarizes the qualitative comparison between the proposed RF-based localization system and several common localization approaches used in robotic applications. The comparison considers five key parameters: spatial resolution, operational range, power requirements, environmental robustness, and integration complexity.
