Abstract
Underground pressurized pipe leakage can induce sand fluidization, leading to ground collapses in urban areas. Additionally, the defluidization process is one of the main causes of sinkholes. In this study, a physical model test was conducted to examine sand bed fluidization and defluidization through a slot, which allowed precise control of the water flow rate in increments of 10 mL/s. The sand layer movement during the experiments was recorded, and the pressure field was accurately measured. The fluidization and defluidization processes were classified into five stages: fluidization static bed, internal fluidization, surface fluidization, internal defluidization, and defluidization static bed. Subsequently, the static bed stage included slow fluidization and fast fluidization, with the former driven by seepage and the latter involving densification and upward movement of sand particles above the orifice. Fluidization initiated at 240 mL/s when the sand particles near the orifice were compressed to approximately minimum porosity 0.37. The head losses comprised orifice head loss, seepage head loss, and vortex head loss, each exhibiting different variation patterns with the water flow rate. Hysteresis was observed in the cavity height curve, attributed to the arching effect. The findings of this study contribute to a more comprehensive understanding of effective strategies for preventing ground collapse.
1. Introduction
Underground pipe leakage can induce fluidization of the surrounding soil and even result in ground collapse incidents, which pose significant threats to public safety and can lead to urban infrastructure failures [1,2,3,4,5]. Considering the difficulty of leakage detection in long-distance transmission pipelines, the concealed and rupture characteristics of ground collapse is further exacerbated [6,7]. Liu et al. [2] summarized the causes of over 600 road collapse accidents and found that leakage from defective buried pipelines was the leading cause of ground collapse, accounting for approximately 63.9% of all accidents. This leakage can lead to substantial economic losses. According to World Bank data, global pipe leakage results in more than 8 billion U.S. dollars in revenue losses annually [8]. Furthermore, pressure fluctuations in pipelines, such as those occurring under low or negative pressure conditions, can allow contamination to enter water supply pipes through these cracks, posing a significant threat to public health [9]. Because of similar phenomenon in chemical engineering, fluidization and its reverse process, namely defluidization, have been widely studied in the field of fluidized bed. Most existing research has concentrated on localized fluidization in granular media, often using planar laser-induced fluorescence (PLIF) combined with refractive index matching (RIM) techniques for detailed observation and analysis [10,11,12]. Based on variations in cavity height, the fluidization process can be categorized into three stages: static bed, fluidized cavity, and surface fluidization, whereas the defluidization process experiences these stages in reverse order [11,12,13]. Although these studies have provided valuable qualitative results, there remains a lack of quantitative criteria to characterize the transitions between stages, particularly the shift from static bed to fluidized cavity.
Sinkholes that develop beneath urban roads are frequently caused by leakage or bursts in water supply pipes [14,15,16,17,18]. Unlike fluidization and defluidization in chemical engineering, the evaluation of failure mechanism must consider the influence of the pipe itself, especially the pipe pressure. The effect of the pipeline is examined by assessing the variation in head loss during the fluidization process. Van Zyl et al. [17] divided the total head loss into three components: orifice head loss, vortex head loss in the fluidized cavity, and seepage loss above the fluidized cavity. Once the cavity forms, the vortex head loss becomes dominant while the other two components diminish, and the pipe pressure can maintain initial pressure before surface fluidization. In addition, several studies [18,19,20] have indicated that when sand particles cover the leakage orifice, the leakage exponent N in the classical orifice head loss equation Q = c × hN often exceeds 0.5. It typically ranges from 0.5 to 2.5, with a median value of 1.15. These investigations into head loss are primarily qualitative experimental studies, with limited quantitative analysis of head loss variations throughout the entire fluidization process. The correlation between the leakage exponent and the porosity of the surrounding sand bed requires further in-depth examination.
Previous studies mostly focus on the critical fluidization flow rate and the variation of the pressure field. Alsaydalani and Clayton [21] and Tang et al. [22] proposed a method for calculating the critical fluidization flow rate and downstream pressure based on Ergun’s equation. He et al. [23] developed an analytical model to estimate the critical flow rate based on the point source jet model proposed by Zoueshtiagh and Merlen [24]. Schulz et al. [25] introduced a Froude number that incorporates inlet flow characteristics and cavity size to be used as a criterion for surface fluidization. Bailey and Van Zyl [26] mapped the pressure and velocity field, showing that the pressure within the granular bed reached its maximum value above the cavity and then drops quickly toward the surface. Moreover, the flow in the granular bed above the fluidized cavity remained slow, which explained why the seepage head loss accounted for the smallest proportion of the total head loss. However, most existing studies determine critical flow rates and pressure field based on several simplifications or qualitative results, leaving the underlying mechanisms governing the initiation of fluidization insufficiently understood. Further comprehensive investigations are required to study the relationship between critical flow rate, head loss, and variations in cavity height.
The geometry of the fluidized zone has commonly been examined using particle image velocimetry (PIV) and digital image correlation (DIC) techniques [2,14,17,21,27,28]. Van Zyl et al. [17] divided the fluidized zone into three parts: fluidized zone, mobile bed zone, and static bed zone. The slip surface is defined as the interface between the mobile bed zone and static zone. Alsaydalani and Clayton [21] and Monzer et al. [8] observed that the slip surface forms an angle of 64° with the horizontal in two-dimensional orientation. This angle appeared to be unaffected by the particle size, burial depth, or leakage size. However, most existing studies focus only on changes in the slip surface during the fluidization stage [2,14,27,28]. The mechanism underlying variations in the fluidized area across different stages remains inadequately understood.
Accordingly, based on the literature review, although prior studies have addressed fluidization induced by water jetting, the understanding of localized fluidization in the vicinity of the leakage orifice remains limited, particularly at the particle scale. In addition, the classification of fluidization stages is simplified, and the mechanisms behind stage transitions are still unclear. The variation in head loss and slip surface has not been quantitatively assessed. Defluidization process can also lead to ground collapse as the formed cavity gradually loses its support from the orifice jet in defective storm sewer pipes, especially after the rainfall stoppage [5,29,30,31,32,33,34,35]. Unlike fluidization, the defluidization process under the influence of pipe leakage has received little research attention.
This study conducted physical experiments to investigate both the fluidization and defluidization processes of a sand bed induced by pipe leakage from a pressurized pipe. Water flow rate was allowed precise control in increments of 10 mL/s into the sand bed through a slot on the pipe, enabling the analysis of localized cavities evolution near the leakage orifice. The cavity development during both processes is analyzed alongside the pressure distribution and head losses in the sand bed. Based on different behaviors regarding cavity size and pressure distribution, the stages of cavity development were further divided, variations in head losses were analyzed, and transition criteria were quantitatively determined. Furthermore, the arching effect during defluidization was also examined. The study contributes to an improved understanding of fluidization and defluidization, which is essential for the prevention of ground collapse.
2. Experiments and Materials
The experimental setup employed to simulate sand fluidization and defluidization caused by a leaking pipe is illustrated in Figure 1a. It primarily comprised a sand chamber, a water supply pipe, and an inflow rate control system. Figure 1b shows a photograph of the plexiglass sand chamber, which measures 600 × 100 × 1000 mm (length × width × height), with a wall thickness of 20 mm. Several orifices were created along the sidewalls to maintain a constant water level within the chamber. The water supply pipe featured an inner diameter of 50 mm and a wall thickness of 5 mm. It was partially embedded in the sand chamber, positioned 160 mm above the bottom, and sealed at the pipe’s end. A narrow slot measuring 3 mm in width and 100 mm in length (matching the width of the chamber) was cut into the pipe as the leakage point, as shown in Figure 1c, discharging a vertically upward jet along the chamber’s longitudinal section. Because of the aspect ratio exceeds 30, the narrow slot can be simulated as a two-dimensional slot. Since the chamber’s length was 10 times the pipe’s diameter, boundary effects were considered negligible. Sand particles were added to the chamber to reach the desired sand layer height. This experimental configuration simplified the scenario into a two-dimensional jet and plane strain condition for the contained sand particles [35,36].
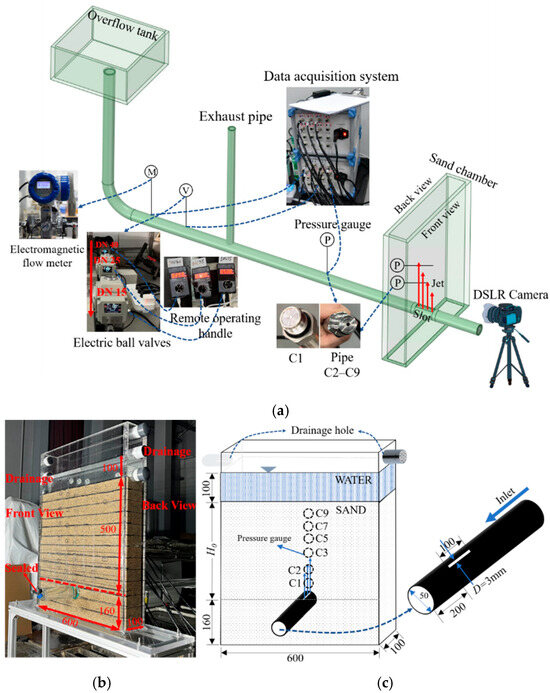
Figure 1.
Experimental setup: (a) schematic of the experimental setup (not to scale); (b) sand chamber (unit: mm); (c) water supply pipe buried in the sand chamber (not to scale, unit: mm).
A pipe pressure gauge (CYB-20S, Westzh, 30 kPa, with ±0.2% full-scale accuracy) was installed on the pipe, 50 cm from the slot, to monitor the variations in pipe pressure. In addition, nine pressure gauges labeled C1 through C9 were mounted along the centerline of the chamber’s sidewall [Figure 1c]. These gauges were positioned at vertical distances of 1.5, 6.0, 9.5, 13.0, 17.0, 22.0, 30.0, 38.0, and 46.0 cm above the slot, respectively. Figure 1a indicates that C1 (CYB-20S-M, Westzh, 20 kPa, with ±0.2% full-scale accuracy) was a flat diaphragm gauge capable of precisely detecting pressure variations within the zone of 0–2 cm above the slot. C2 to C9 (CYB-20S, Westzh, 10 kPa, with ±0.2% full-scale accuracy) were pilot hole gauges with 2 mm apertures utilized to measure pressure within the sand bed. The movement of the sand layer during the experiment was recorded from various perspectives. A digital video camera and a DSLR camera focused on the localized zone near the slot, while an additional DSLR camera captured the general motion of the sand layer. Another video camera was installed above the chamber to record surface phenomena such as expansion, collapse, and surface fluidization. Rulers were affixed to the chamber walls to measure changes in cavity height and sand layer displacement.
The increment of the water flow rate must be maintained below 10 mL/s during each loading and unloading process to observe the development of the cavity with variations in the water flow rate. Figure 1a illustrates that an inflow control system is developed with careful consideration of the sand particles surrounding the pipe slot. This inflow control system comprised a height-adjustable overflow tank, an electromagnetic flowmeter (OPTIFLUX 4300 C, KROHNE, DN15, with ±0.2% full-scale accuracy), and a set of valves (JM-10, Zhejiang Jimai Auto-Tech Co., Ltd., Wenzhou, China) integrated into the pipeline. An exhaust pipe was also installed to remove air bubbles and reduce water hammer effects through oscillation. In the upstream of the chamber, the inlet pipe had a diameter of 50 mm and a length of 3.0 m, which helped maintain a steady flow into the chamber. A set of electric ball valves contained three stepwise diameter reductions (DN40→DN25→DN15) to allow staged flow regulation with improved precision. With the aid of a remote operating handle and real-time feedback, the opening and closing of each valve could be adjusted with an accuracy of ±0.5%. In a preliminary experiment, a set of water tank heights and valve openings (DN40 and DN25) were established. Then the DN15 valve gradually opened from 0% and observed the flow rate values. If the flow rate difference between consecutive readings was less than 10 mL/s, the experimental conditions for the fluidization process were considered valid. When the difference exceeded 10 mL/s, the water tank height and valve opening were reduced accordingly. Based on a series of preliminary experiments, setting the water tank height to 3 m, and the openings of DN40 and DN25 60% and 80%, it could maintain a single loading/unloading flow rate below 10 mL/s from DN15.
Coarse sands were screened from Fujian standard sands and utilized to fill the chamber as the backfill material during the experiment. The particle size distribution curve is presented in Figure 2a, and the physical properties are listed in Table 1. The particle size distribution was determined following ASTM D422-63 [37], and the specific gravity was measured based on ASTM D854-23 [38]. Based on ASTM standard D2487-17 [39], the sand is classified as “SP,” indicating it behaves as an isotropic and homogeneous material. The permeability coefficient (k) and the angle of repose (φ) were measured using the constant head method and direct shear test, respectively. These tests were conducted at a porosity (n) of 0.4. The maximum porosity (nmax) was determined using the vibratory table method based on ASTM D4253-16 [40], while the minimum porosity (nmin) was measured using the free fall method following ASTM D4254-16 [41]. A microscopic image of the sand particles is shown in Figure 2b. Most particles appear angular, and the friction between them must be carefully considered in the analysis.
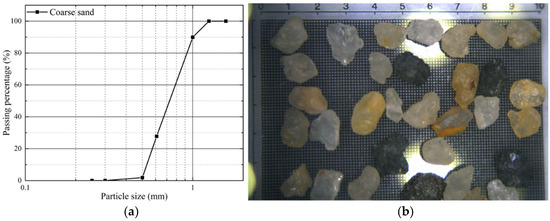
Figure 2.
(a) Particle size distribution of sand; (b) sand under a microscope (unit: mm).

Table 1.
Physical properties of sand used in this study.
In the experiments, the initial height of the sand bed (H0) was set to 50 cm, and the porosity (n) was maintained at 0.4. The preparation method of Indiketiya et al. [42] is adopted in this study to form a dense sand layer. Sand particles were dropped into the chamber using a trowel-sized scoop and manually spread evenly across the chamber’s cross-section. Each layer was compacted to a thickness of 50 mm using a tamper to ensure uniform porosity. The top surface of each compacted layer was manually roughened to a height of approximately 3 mm before adding the next layer to improve bonding between layers. For improved visualization of sand movement, black-dyed sand particles of the same size were placed near the front wall of the chamber. This process was repeated until the target sand bed height was achieved. The uniformity of the porosity can be calculated from the flow rate–pressure curve of the pressure gauge during the experiment. During the experiments, the inner wall surfaces of the chamber were thoroughly coated with silicone oil to reduce friction with the sand particles, minimizing the sidewall effect. The sand was then saturated using the “quick” saturation method [43]. During saturation, moistened sponges were placed on top of the sand to prevent surface erosion. De-aired water was slowly dripped into the chamber until it reached the sidewall orifices, and a constant water level was established. When the pressures measured by C1–C9 matched the static water pressure at their respective positions, it indicated a sufficient degree of sand saturation. After saturation, the experimental setup was left undisturbed for 24 h to eliminate any creep effects before testing began.
Before initiating the experiments, the overflow tank in the water flow control system was elevated to 3 m above ground level to achieve the desired water flow rate for each loading stage. The data acquisition system (CYB-809S, Westzh) was then activated. The valves within the flow rate control system were adjusted, and the flow rate was gradually increased, with each increment maintained within 10 mL/s. Once the real-time readings from the pressure gauges and flow meter stabilized, the subsequent loading step was executed. Once the surface fluidization occurred, the flow rate was adjusted three additional increments to maintain this state. Then, it was gradually reduced, and each unloading step was also maintained within 10 mL/s to initiate the defluidization process, which continued until the flow rate reached 0. All experiments were conducted at a room temperature of 20°C. In addition to the sand-based experiments, two control tests were conducted by replacing the sand in the chamber with either water or air. The quantitative indicator that quantifies the impact of different media is the orifice head loss, which will be described in detail in Section 3.5.1. These control experiments were utilized to examine how the properties of the surrounding medium affect pipe leakage.
3. Results and Discussions
3.1. Stage Classification
Figure 3 illustrates the variation in cavity height and pipe pressure during the fluidization and defluidization processes. All pressure gauge readings are shown in centimeters. The pressure head along the vertical axis was calculated by subtracting the initial hydrostatic pressure from the measured gauge values. This calculation accounts for the velocity head, which is generally negligible in most cases. The progression O–A1–A2–A3–A4–B–B1 in Figure 3a denotes the fluidization process, while the reverse sequence B1–C1–C2–C3–C4–O corresponds to the defluidization process. The corresponding pipe pressure head for both stages is shown in Figure 3b.
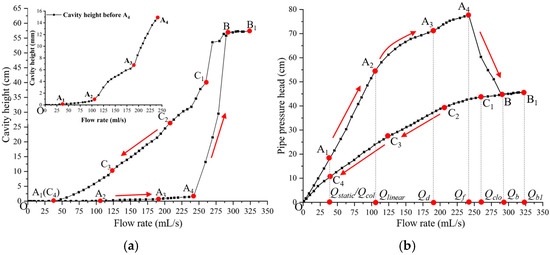
Figure 3.
Variation of the cavity height and pipe pressure with water flow rate: (a) cavity height (top left picture shows the variation of the localized fluidization cavity height before point A4, right picture shows the variation of cavity height during the whole fluidization and defluidization processes); (b) pipe pressure (hydrostatic pressure subtracted already).
The flow rate at point B1 denoted as Qb1 is defined as the critical flow rate that marks the transition between fluidization and defluidization. The Qb1 point is an artificially set endpoint for fluidization, and its value does not affect the pressure field and the height of the cavities. Figure 3a reveals that during the O–A4 stage, the height of the localized cavity increases slowly, remaining below 3% of the initial sand bed height. During this stage, the sand bed remains static, referred to as the static stage. From Figure 3b, during the static stage, the pipe pressure exhibits two distinct trends, divided by point A2. In the O–A2 phase, the pipe pressure increases linearly, while in the A2–A4 phase, the increase becomes nonlinear. The water flow rate at point A2 is defined as Qlinear.
During the A4–B stage, the height of the fluidized cavity rises rapidly, and the pipe pressure drops sharply. Point A4 signifies the transition from a static state to internal fluidization. The water flow rate at this point is defined as Qf. Following the internal fluidization stage, the B–C1 stage corresponds to the surface fluidization stage, comprising the B–B1 phase from the fluidization process and the B1–C1 phase from the defluidization process. Point B denotes the transition from internal fluidization to surface fluidization, and the water flow rate at this point is defined as Qb. During this stage, both the height of the fluidized cavity and the pipe pressure remain nearly constant. Point C1 indicates a sudden drop in cavity height attributed to the cessation of surface fluidization; hence, the flow rate at point C1 is defined as Qclo. During the C1–C4 stage, the defluidized cavities behave similarly to those observed in the A4–B stage, which is classified as the internal defluidization stage. Finally, in the C4–O stage, defluidized cavities vanish, and the sand bed returns to a static state. At this point, the sand layer near the orifice collapses. Point C4 represents the critical point of this localized collapse, and the flow rate at this point is defined as Qcol. Figure 3 shows that both cavity height and pipe pressure exhibit nonlinear variation throughout the defluidization process.
Accordingly, the fluidization and defluidization processes can be categorized into five distinct stages, as described in Equation (1). Compared to previous studies, this classification provides a more detailed subdivision of the static bed stage and provides a deeper understanding of the transition mechanism from localized fluidization near the orifice to the internal fluidization stage. However, future research will comprehensively investigate how external conditions (slot size, particle size, and porosity) influence each stage.
Stage 1, Fluidization static bed: O–A4 (Q < Qf)
Stage 2, Internal fluidization: A4–B (Qf < Q < Qb)
Stage 3, Surface fluidization: B–B1 and B1–C1 (Qb < Q < Qb1 & Qclo < Q < Qb1)
Stage 4, Internal defluidization: C1–C4 (Qcol < Q < Qclo)
Stage 5, Defluidization static bed: C4–O (Q < Qcol)
Stage 2, Internal fluidization: A4–B (Qf < Q < Qb)
Stage 3, Surface fluidization: B–B1 and B1–C1 (Qb < Q < Qb1 & Qclo < Q < Qb1)
Stage 4, Internal defluidization: C1–C4 (Qcol < Q < Qclo)
Stage 5, Defluidization static bed: C4–O (Q < Qcol)
3.2. Stage Features
The characteristics of the five stages are discussed below, focusing on changes in the sand bed, cavity height, and pipe pressure.
Stage 1 occurs when the flow rate Q is below the critical value Qf. This stage includes three key transition points: A1, A2, and A3, as shown in Figure 3b. The corresponding flow rates are defined as Qstatic, Qlinear, and Qd, respectively. Before the flow rate reaches Qstatic, the sand bed remains stable. No visible cavities or sand particle movement are observed, as shown in Figure 4a. As the flow rate exceeds Qstatic, the localized fluidization cavity begins to form above the leakage point and keeps growing in size until the critical flow rate Qf. The range Qstatic < Q < Qf can be further divided into two substages: slow fluidization phase (Qstatic < Q < Qlinear) and fast fluidization phase (Qlinear < Q < Qf). In the slow fluidization phase, the height of the localized cavities increases slowly, and pipe pressure rises almost linearly. In the fast fluidization phase, as shown in Figure 4b,c, the localized cavities expand more rapidly while the pipe pressure increases at a slower rate. Sand particles near the leakage point become denser due to water flow.

Figure 4.
Localized cavities above the orifice before A4: (a) slow fluidization (A1–A2), Q = 20 mL/s; (b,c) fast fluidization (A2–A4), Q = 200 mL/s, Q = 230 mL/s, respectively.
Stage 2 represents the internal fluidization stage, occurring when the flow rate ranges between Qf and Qb. Figure 3b reveals that the pipe pressure drops sharply, indicating the onset of internal fluidization. During this stage, three fluidized cavities form within the sand bed, two of which are shown in Figure 5. Within these cavities, sand particles move in a vortex with rapidly rotating motion, resulting in frequent interparticle collisions and energy loss. The height of the fluidized cavity is highly sensitive to variations in flow rate; even minor increases can cause substantial growth. Once the cavity height reaches 30 cm, it continues to expand rapidly until it breaks through the sand bed surface, forming the surface fluidization phenomenon.
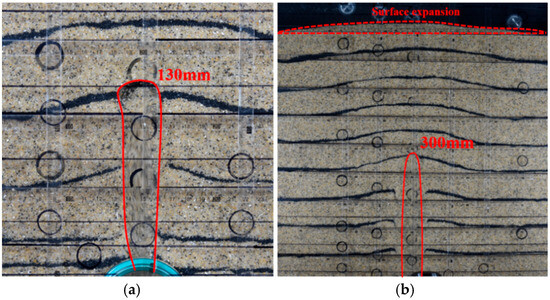
Figure 5.
Internal fluidized cavity in the sand bed during the stage A4–B: (a) Q = 260 mL/s, (b) Q = 280 mL/s.
Stage 3 is defined as the surface fluidization stage, which includes both fluidization and defluidization. These correspond to flow rates increasing from Qb to Qb1 and decreasing from Qb1 to Qclo. Figure 6a indicates that a fluidized chimney cavity is distinctly observed in the fluidized region, resembling the structure reported by Zoueshtiagh and Merlen [24]. The fluidized chimney is a narrow zone that contains the movement of water–sand vortex, forming a turbulent convection roll from the bottom to the upper surface. The flow rate at Qb is defined as surface fluidization flow rate. This point marks the fluidized cavity penetrates the sand bed, and the fluidized chimney is formed. Several studies, including those by Alsaydalani and Clayton [21], He et al. [23], and Mena et al. [11], indicate using Qb as the critical fluidization flow rate. However, from a soil foundation safety perspective, the flow rate at Qf provides a more appropriate definition for the onset of fluidization. In practical engineering projects, it is crucial to raise awareness of the dangers posed by small cavities, and the leaks must be sealed immediately. Furthermore, when pipeline pressure fluctuations and sudden drops are detected at a specific location, a combination of ground penetrating radar and acoustic monitoring technologies should be combined to conduct safety checks for the potential presence of underground cavities.
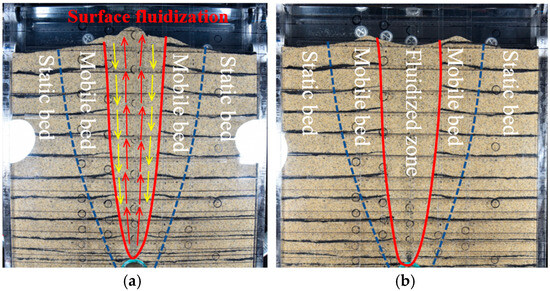
Figure 6.
Surface fluidization stage: (a) surface fluidization (Q = 300 mL/s, the yellow arrows show the secondary flow zone and the red arrows show the fluidized chimney zone); (b) static bed at the end of the defluidization process.
The fluidized zone can be categorized into three regions by tracking the movement of black sand: the static bed zone, mobile bed zone, and fluidized zone, as shown in Figure 6. Sand particles remain stationary and tightly packed in the static zone, whereas in the fluidized zone, particles are fully fluidized, forming a particle flow. The mobile zone lies between the static and fluidized zones, where particles move within a limited range. The slip surface is defined as the interface between the mobile zone and static zone. Figure 6a shows that the fluidized zone can be further subdivided into two parts:
- The chimney zone (red arrows) is where particles move in a turbulent convection roll, colliding and compressing to form a continuous upward vortex motion.
- The secondary flow zone (yellow arrows) is located between the chimney and mobile bed zones, where the flow moves downward. Friction between these two zones induces additional energy loss, resulting in a lower velocity compared to the chimney zone. Once the flow rate exceeds Qb, the pipe pressure becomes stabilized.
Stage 4, the internal defluidization stage, occurs as the water flow rate decreases from Qclo to Qcol, as shown in Figure 3b. The shape of the defluidized cavity observed during this stage is similar to that in Stage 2. Both the defluidized cavity height and the sand bed surface gradually decrease, while the secondary flow becomes more significant compared to Stage 2. Figure 3a illustrates that the collapse rate of the defluidized cavity during this stage is considerably slower than the expansion rate in Stage 2. This hysteresis behavior [11,12] is attributed to the arching effect. Points C2 and C3 denote the stable states associated with the arching effect, which are discussed in detail later.
Stage 5 begins when the flow rate drops below Qcol. At this point, the defluidized cavities vanish. The collapse process initiates near the orifice and remains confined to a localized area above the orifice. The free fall arching effect progressively decelerates the collapse until it ceases entirely, and the system transitions to a static bed, as shown in Figure 6b. This stage is referred to as the defluidization static bed stage.
3.3. Pressure Field Analysis
Figure 7a,b illustrate the changes in pipe pressure (P) and internal sand bed pressures at points C1 to C9, respectively. Red points on each pressure curve mark the transition between the linear (seepage) and nonlinear (densification) phases. Connecting these points yields a densification curve that separates the seepage zone from the densification zone. The arrows along the curve indicate the direction of densification during the fluidization and defluidization processes. During fluidization, densification proceeds from the orifice upward to the surface. The onset of fluidization at point A4 occurs when the porosity of the densified region above the localized cavity reaches a critical threshold, approximately equal to the minimum porosity. Internal fluidization refers to the process in which the sand layer above the fluidized cavity is compressed to a critical porosity value near the minimum and then expands. In this process, the pressure curve exhibits a sudden increase followed by a rapid decrease from points C1 to C9. During defluidization, the sand bed densifies in the opposite direction, from the surface downward to the orifice. Due to the hysteresis effect shown in Figure 3a, the tangent of the direction curve in Figure 7a is smoother than that in Figure 7b.
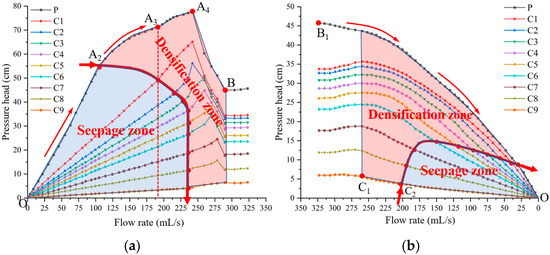
Figure 7.
Variation of pressure (hydrostatic pressure subtracted): (a) fluidization process; (b) defluidization process.
The flow rate Qlinear at point A2 indicates the onset of sand bed densification induced by water jetting. Point C2 indicates the onset of seepage according to the collapse of the bed surface during C1–C2 phase. Point A3, located between A2 and A4, is the point at which the C1 pressure curve shifts from linear to nonlinear behavior. As shown in Figure 3a, the densification rate in the A3–A4 phase is significantly higher than that in A2–A3. The A3–A4 phase is the transition from fast fluidization to internal fluidization. The flow rate at point A3 is defined as the densification flow rate Qd.
3.4. Parallel Experiments
Figure 8a–c present the results of three parallel experiments (1#, 2#, and 3#), highlighting the pipe pressure (hp), pressure at C1 (hC1), and the height of the cavity (Hc), respectively. These parameters were selected because hp and hC1 exhibit noticeable fluctuations due to complex flow conditions, whereas Hc is essential for accurately determining head loss. The results indicate that the relative errors for hp, hC1, and Hc are below 5%, demonstrating good experimental repeatability.
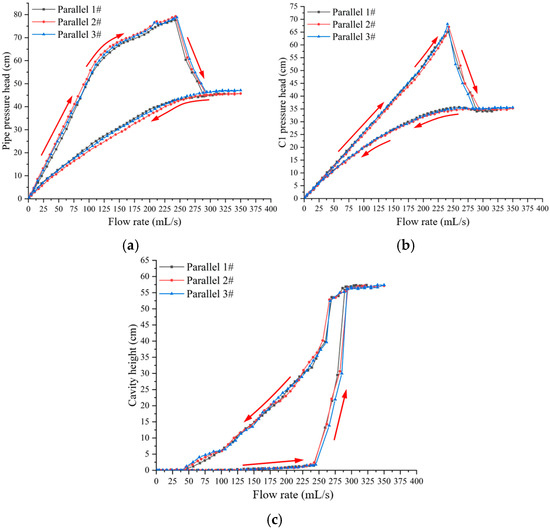
Figure 8.
Parallel experimental data: (a) pipe pressure; (b) C1 pressure; (c) cavity height.
3.5. Head Loss
Figure 9 presents the head loss calculation model. This calculation is based on the streamline above the leakage point, using the free surface at the overflow drainage holes as the reference plane. Before the experiment, hydrostatic pressure values within the sand bed at points C1 to C9 were recorded. During the experiment, head loss was calculated by subtracting these initial hydrostatic values from the real-time pressure data. The head losses are expressed in centimeters, as described in Equation (2),
hp = ho + hs + hv
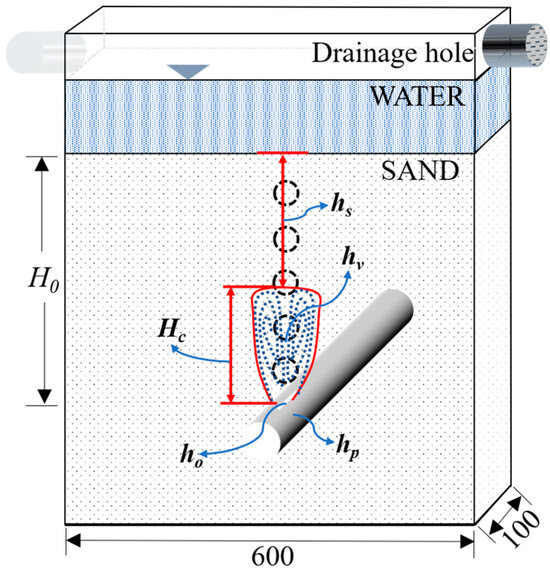
Figure 9.
Model for calculating head loss (the red area shows the fluidized cavity zone.).
Equation (2) shows that the total head loss (hp) consists of three components: the orifice head loss (ho) at the leakage point, the seepage head loss (hs) caused by seepage through the sand bed above the fluidized cavity, and the vortex head loss (hv) resulting from the vortex motion of sand particles in the fluidized cavity.
The calculation methods for the three types of head losses are distinct. The orifice head loss is calculated from the difference between the pipe and the C1 pressure. The seepage head loss is determined using the pressure value in the upper part of the fluidized cavity. Finally, the sand particles vortex head loss in the fluidized cavity is calculated by subtracting the orifice and seepage losses from the total head loss. From the perspective of calculation method, these three types of head losses are independent of each other and of the total head loss. Figure 10 shows the variations in orifice head loss, seepage head loss, and vortex head loss during fluidization and defluidization processes. The dynamic changes of the three head losses reflect the development mechanism of fluidization and defluidization. At point A2, the total head loss transitions from linearity to nonlinearity, primarily due to a decrease in orifice head loss, as shown in Figure 10a. After point A4, the total head loss decreases sharply, as illustrated in Figure 10b, resulting from a significant reduction in seepage head loss. During the surface fluidization stage, as shown in Figure 10c, the total head loss stabilizes because the vortex head loss remains nearly constant between A2 and A4. In the defluidization process, changes in total head loss are mainly influenced by variations in seepage head loss. As shown in Figure 10b, the total head loss declines slightly as the increase in seepage head loss offsets the decreases in orifice head loss and vortex head loss in the C1–C2 phase. In the C2–C3 phase, the total head loss declines more slowly compared to the C3–O phase. This slower decline corresponds to the plateau observed in the seepage loss curve. The following section will discuss the physical significance of this plateau. The subsequent discussion will focus on the mechanisms underlying the variations in orifice head loss and vortex head loss during the fluidization–defluidization process.
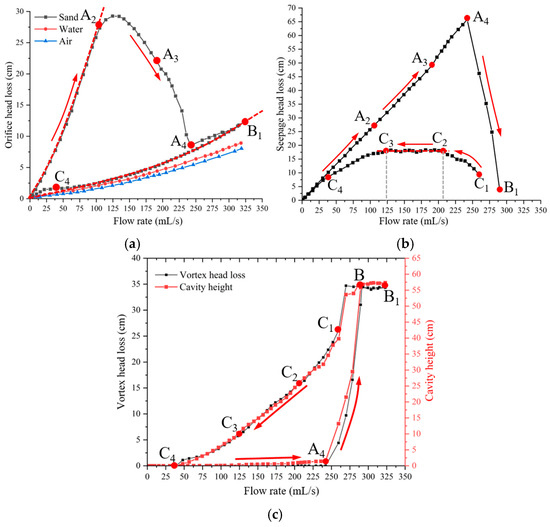
Figure 10.
Variation of head loss with flow rate: (a) orifice head loss ho; (b) seepage head loss hs; (c) vortex head loss hv.
3.5.1. Orifice Head Loss
The International Water Association (IWA) proposed the formula for calculating the leakage flow rate in a power function [44], as shown in Equation (3),
where h is the pressure head loss through the orifice, and in this study, h = ho. c is the leakage coefficient, and N is the leakage exponent. The leakage coefficient is related to the area of the leakage orifice and the discharge coefficient Cd. He et al. [20] determined that when the height of the sand bed above the orifice exceeds 50 cm, the variation of Cd is very small, and the effect of the leakage coefficient c can be ignored. The following discussion primarily examines the correlation between the leakage exponent (N) and the porosity of the sand bed (n) near the orifice, based on Equation (3).
Q = c × hN
Figure 10a shows that the orifice head loss during the O–A2 and A4–C4 phases (including A4–B1 and B1–C4) aligns with the behavior described by Equation (3). In the O–A2 phase, sand particles near the orifice are densely packed, with a porosity of approximately 0.4, which is close to the maximum density. The flow in this phase is classified as a dense flow near the orifice. In contrast, in the A4–C4 phase, the flow near the orifice transforms into a liquid–solid two-phase dilute flow, exhibiting a porosity of around 0.6, which is near the minimum density. Both dense and dilute flows can be considered isotropic, homogeneous materials. The main difference between them is the porosity.
Figure 10a also presents orifice head loss curves for conditions where the chamber is filled with water and air at the same height. The O–A2 and A4–C4 phases for sand, water, and air can all be fitted using the power function described in Equation (3). All corresponding coefficients of determination (R2) exceed 0.9. Table 2 lists the relationship between the porosity n and the exponent N. The fitted exponent values are 0.86, 0.66, 0.62, and 0.52, corresponding to porosities of 0.4 (dense flow), 0.6 (dilute flow), and 1 (for water and air), respectively. The exponent value 0.52 for air is close to the exponent in Torricelli’s law, where the flow rate is proportional to the square root of the head. The values of exponent N follow the order O–A2 > A4–C4 > water > air. This indicates that when the orifice is surrounded by a uniform medium, lower porosities results in higher N values and greater orifice head loss. This experiment quantifies the relationship between the leakage exponent and soil characteristics, confirming that the porosity of the surrounding media significantly influences the leakage exponent. This correlation provides a better understanding of leakage mechanism and improves the accuracy of leakage flow rate prediction. The phase between A2–A4 represents a transition zone, during which the growth rate of localized cavities near the orifice increases, leading to a rise in porosity from minimum to maximum. This porosity transition results in a lower leakage exponent and orifice head loss, reflecting the transformation from dense to dilute flow near the orifice. The experimental findings demonstrate that an increase in the porosity above the orifice leads to a corresponding decrease in the orifice head loss.

Table 2.
Relationship between the leakage exponent (N) and porosity (n).
Figure 3a shows that when the localized cavities between A2–A4 begin to rise, the increase in porosity near the orifice corresponds to a decrease in orifice head loss over the A2–A4 interval, as shown in Figure 10a. In addition, after point A3, the localized cavities rise more rapidly. The porosity near the orifice increases sharply, and orifice head loss declines steeply. Seepage loss in the sand bed grows at a steady rate before A3 and accelerates between A3 and A4. The rate of increase in seepage loss surpasses the rate of decrease in orifice head loss. As a result, the total head loss continues to rise after point A2, although at a slower rate.
3.5.2. Vortex Head Loss
Figure 10c shows that vortex head loss increases sharply during the internal fluidization stage from A4 to B. However, during the surface fluidization stage (B–B1 and B1–C1), vortex head loss remains nearly constant despite changes in flow rate. The trend in vortex head loss is closely consistent with the changes in cavity height. This indicates that vortex head loss can be highly related to the variation of the fluidized cavity height. Specifically, the rate of cavity collapse follows the order C1–C2 > C2–C3 > C3–C4.
3.6. Arching Effect
Frictional and interlocking forces between sand particles must be considered due to their angular shapes. During internal fluidization and defluidization, the sand layer situated above the fluidized or defluidized cavity begins to slide, and friction between particles causes stress redistribution [30,45,46]. This redistribution is known as the stress arching effect, which is the main cause of the hysteresis effect. In the internal fluidization stage, the upward resistance of the cavity is predominantly attributed to the passive arching effect. In contrast, during the defluidization stage, the downward resistance is mainly driven by the active arching effect.
Figure 10b illustrates the variation in seepage head loss as a function of flow rate. Considering the localized cavities are less than 1.5 cm as the sand bed is static, the displacement of overall sand bed is small. Before the flow rate reaches Qf, the seepage head loss conforms to Darcy’s law and its extensions, such as the Forchheimer or Ergun equations. However, during the A4–B1 and C1–C4 phases, Darcy’s law and its extensions are no longer applicable. Based on force equilibrium analysis and Ergun’s equation, the seepage loss observed in these two phases reflects changes in the arching effect, as shown in Figure 10b.
During the C1–C2 phase of defluidization, the height of the defluidized cavity drops the fastest, leading to a sharp increase in the arching effect. This signifies a phase in which stress is actively redistributed within the sand layer directly above the cavity. The arching effect in the C2–C3 phase becomes stabilized, indicating the formation of a stable stress arch over the cavity. In the C3–C4 phase, as the height of the defluidized cavity falls below 10 cm, the arching effect gradually weakens. However, the free-fall arching effect described by many scholars [30,35,47] becomes increasingly significant. This effect creates a stable arch of sand particles above the orifice, which inhibits further collapse of the cavity. The slowest rate of cavity height reduction during C3–C4 is primarily attributed to the combined influence of free fall and active arching effects. From C4 until the conclusion of the experiment, the defluidized cavities vanish completely. Sand particles pass through the orifice and gradually cease movement due to the free fall arching effect above the orifice. At this stage, water flow within the sand bed returns to a near-seepage state.
Accordingly, the arching effect during defluidization progresses through three distinct stages: rapid intensification, steady stabilization, and gradual weakening. In the C3–O phase, the free-fall arching effect grows stronger and peaks as particle descent ceases. During the internal fluidization stage (A4–B1), the growth of the cavity is mainly resisted by the passive arching effect. This resistance peaks at point A4 and then drops quickly due to the sudden loss of buoyant weight above the fluidized cavity. The abrupt reduction in the passive arching effect causes a sharp pressure drop during the A4–B1 stage, leading to a significant decrease in total head loss. The flow rates at A1, A2, A3, and A4 during fluidization correspond to the flow rates at C4, C3, C2, and C1 during defluidization. This indicates that the defluidization process is not completely reversible with respect to the fluidization process.
3.7. Fluidization Pattern and Slip Surface
The displacement field of the sand bed was measured by tracking the movement of black sand particles. Based on this, the shape of the slip surface was analyzed through the deformation observed during the fluidization process. The sand bed fluidization pattern can be reflected by the change of the slip surface. Figure 11 shows the changes in the slip surface (indicated by the red line) during static bed stage before Qf. The numbers shown above the red contour lines correspond to different water flow rates. The critical fluidization flow rate, Qf, represents the point at which the shape of the slip surface begins to change. When the flow rate remains below Qf, the slip surface expands outward in a radial direction. This expansion occurs more rapidly along the centerline than at the edges, as shown in Figure 11. The radial expansion is induced by a point source jet. Several CFD-DEM simulations have observed similar circular or ellipse pressure field and confirmed the presence of a radial flow distribution [48,49,50]. The scope of the radial expansion is confined by the initial porosity of the sand bed. In this experiment, the initial porosity is close to its minimum, resulting in a small expansion zone, which is confined to a 5 cm × 5 cm square above the orifice.
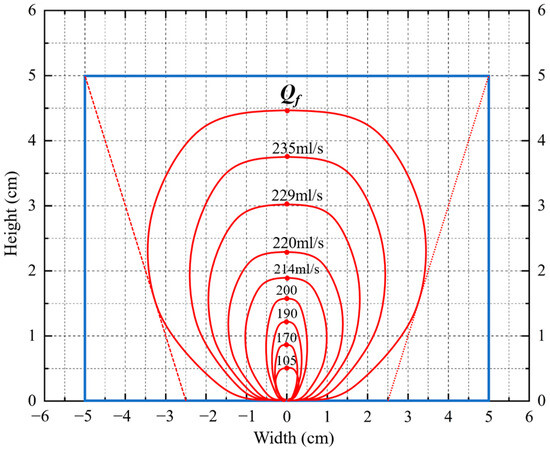
Figure 11.
Radial expansion process before Qf.
As the flow rate increases from Qf to Qb, the slip surface transitions into the wedge expansion. Figure 12 shows the variation in slip surface shape during wedge expansion. The point of maximum curvature along the red line determines the slip surface. The angle formed between slip surface and the horizontal is about 60°, which closely aligns with the findings of Alsaydalani and Clayton [21] and Monzer et al. [8]. The angle between the fluidized zone and the mobile zone is even steeper, at around 80°, indicating the nearly vertical rise of the fluidized chimney.
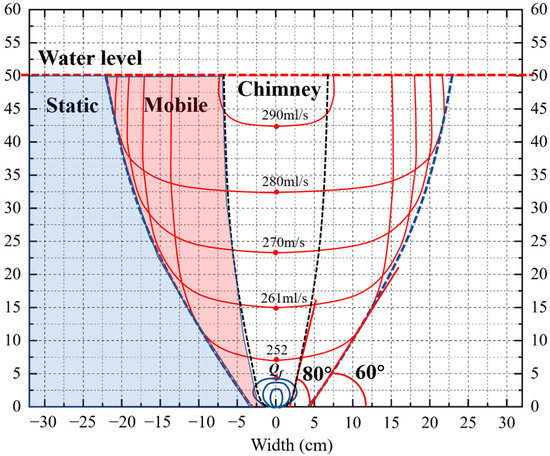
Figure 12.
Wedge expansion process between Qf to Qb.
Figure 13 indicates that wedge expansion is also associated with the upward movement of the sand bed surface. The surface expansion ratio is defined as the ratio between the current sand bed height at the centerline and its initial height (H/H0). A noticeable rise in the surface begins once the flow rate surpasses Qf. Qf is a critical transition point within the entire fluidization process. It indicates the shift in the fluidization pattern from radial to wedge expansion, the commencement of sand bed surface expansion, and the initiation of full-scale sand bed fluidization.
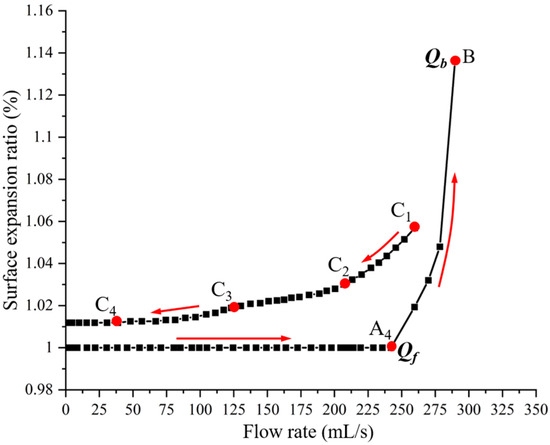
Figure 13.
Variation of surface expansion ratio with water flow rate.
4. Conclusions
A physical model is conducted to investigate the fluidization and defluidization processes of the sand bed caused by upward water jet. The water inflow rate is precisely controlled at 10 mL/s, enabling close observation of cavity development and sand bed displacement throughout the process. Major conclusions are drawn below:
- The fluidization and defluidization processes are classified into five stages: fluidization static bed, internal fluidization, surface fluidization, internal defluidization, and defluidization static bed. The static stage is further divided into two substages based on the variation of cavity height in the vicinity of the orifice: slow fluidization, associated with Darcy seepage, and fast fluidization, which involves the densification of sand particles above the orifice. Fluidization initiates when the sand particles in the vicinity of the orifice are compressed to approximately minimum porosity, the compression–expansion processes are accompanied by the entire internal fluidization stage.
- The nonlinear variation in total head loss during fluidization primarily results from the reduction in orifice head loss. As the localized cavity expands, the porosity of the sand bed near the orifice increases, resulting in a decrease in orifice head loss. When homogeneous porous media surround the orifice, the leakage exponent N takes values of 0.86, 0.66, 0.62, and 0.52, corresponding to porosity levels of 0.4 (dense flow), 0.6 (dilute flow), and 1 (for water and air). These results indicate that the leakage exponent increases as porosity decreases.
- The vortex head loss is related to the variation of the fluidized cavity height. The vortex head loss remains nearly constant despite changes in flow rate in the surface fluidization stage. The descent rate of vortex head loss becomes smaller during entire defluidization process.
- The arching effect is the primary cause of the hysteresis observed in the cavity height curve. An active arching effect is identified in three stages: rapid increase, steady state, and gradual decline, all of which reduce the collapse rate of the defluidized cavity. The free fall arching effect forms a stable arch above the orifice, resulting in a slower cavity decrease rate compared to the active arching effect stage.
- The development of the slip surface progresses through two stages: radial expansion, followed by wedge expansion. The critical flow rate Qf indicates the shift in the fluidization pattern from radial to wedge expansion, the initiation of sand bed surface expansion, and the full-scale fluidization.
Future research will involve a parametric analysis of particle size, leakage orifice size, porosity, and granular bed height. This will provide a broader validation of the conclusions presented in this paper and increase our understanding of soil–pipe interaction. In practical engineering, enhancing the monitoring of pipeline pressure and focusing on points of sudden pressure drops or increases is crucial for the early detection of ground collapse. Experimental results have confirmed that even small cavities can rapidly expand to a catastrophic size under sustained water leakage. Therefore, enhanced monitoring of underground cavities is necessary in the areas where pressure pipelines are located beneath roadbeds. When monitoring equipment detects centimeter-scale cavities, immediate measures must be taken to seal them to prevent rapid expansion and sudden ground collapse.
Author Contributions
Conceptualization, H.W., Y.Z. and Y.M.; methodology, H.W. and Y.Z.; validation, H.W. and Z.Z.; writing—original draft preparation, H.W.; writing—review and editing, Y.M.; visualization, H.W.; supervision, Y.Z. and T.Y.; project administration, Y.Z. and T.Y.; funding acquisition, T.Y. and Y.M. All authors have read and agreed to the published version of the manuscript.
Funding
This research was funded by the Zhejiang Province Leading Geese Plan (Grant No. 2025C02208), the National Natural Science Foundation of China (Grant No. 52070167 and Grant No. 52300122), the Natural Science Foundation of Zhejiang Province (Grant No. LZJWZ23E090009), and the Fundamental Research Funds for the Central Universities (226-2024-00033).
Institutional Review Board Statement
Not applicable.
Informed Consent Statement
Not applicable.
Data Availability Statement
All data used or analyzed in this study are available from the corresponding author on reasonable request.
Conflicts of Interest
The authors declare no conflicts of interest.
References
- Guo, J.X.; Zhang, Y.J.; Li, Y.F.; Zhang, X.; Zheng, J.Q.; Shi, H.X.; Zhang, Q.; Chen, Z.F.; Ma, Y.J. Model experimental study on the mechanism of collapse induced by leakage of underground pipeline. Sci. Rep. 2024, 14, 17717. [Google Scholar] [CrossRef] [PubMed]
- Liu, J.C.; Wang, Z.Y.; Tan, Y.; Cao, Y.C. Failure evolution and mechanism of ground collapse due to exfiltration of shallowly buried water pipeline. Eng. Fail. Anal. 2024, 162, 108390. [Google Scholar] [CrossRef]
- Önem, H.; Arslan, M.H.; Erkan, I.H.; Çevik, A. Analyzing the relationship between the formation of sinkholes and structural deformation: A parametric study. Eng. Fail. Anal. 2025, 169, 109186. [Google Scholar] [CrossRef]
- Ren, J.L.; Liu, Y.; Yu, P.Q.; Zhang, Y.L.; Li, D.S. The influence of fines content on ground collapse due to internal erosion of sand-fines mixtures around defective pipes. Eng. Fail. Anal. 2024, 165, 108810. [Google Scholar] [CrossRef]
- Abegaz, R.; Wang, F.; Xu, J.; Pierce, T.; Moody, M. Developing soil internal erosion indicator to quantify soil internal erosion around defective buried pipes under water exfiltration. Geotech. Test. J. 2025, 48, 19. [Google Scholar] [CrossRef]
- Meniconi, S.; Brunone, B.; Tirello, L.; Rubin, A.; Cifrodelli, M.; Capponi, C. Transient tests for checking the Trieste subsea pipeline: Toward field tests. J. Mar. Sci. Eng. 2024, 12, 374. [Google Scholar] [CrossRef]
- Meniconi, S.; Brunone, B.; Tirello, L.; Rubin, A.; Cifrodelli, M.; Capponi, C. Transient tests for checking the Trieste subsea pipeline: Diving into fault detection. J. Mar. Sci. Eng. 2024, 12, 391. [Google Scholar] [CrossRef]
- Monzer, A.; Faramarzi, A.; Yerro, A.; Chapman, D. MPM Investigation of the Fluidization Initiation and Postfluidization Mechanism around a Pressurized Leaking Pipe. J. Geotech. Geoenviron. 2023, 149, 04023096. [Google Scholar] [CrossRef]
- Shao, Y.; Yao, T.; Gong, J.Z.; Liu, J.J.; Zhang, T.Q.; Yu, T.C. Impact of Main Pipe Flow Velocity on Leakage and Intrusion Flow: An Experimental Study. Water 2019, 11, 12. [Google Scholar] [CrossRef]
- Jiang, L.J.; Zhang, B.; Huang, S.H.; Shao, Y. Analysis of fluidized zone in transparent soil under jet induced by pipe leakage. Water Sci. Eng. 2023, 16, 203–210. [Google Scholar] [CrossRef]
- Mena, S.E.; Luu, L.H.; Cuellar, P.; Philippe, P.; Curtis, J.S. Parameters affecting the localized fluidization in a particle medium. Aiche J. 2017, 63, 1529–1542. [Google Scholar] [CrossRef]
- Philippe, P.; Badiane, M. Localized fluidization in a granular medium. Phys. Rev. E 2013, 87, 042206. [Google Scholar] [CrossRef]
- Mena, S.E.; Brunier-Coulin, F.; Curtis, J.S.; Philippe, P. Experimental observation of two regimes of expansion in localized fluidization of a granular medium. Phys. Rev. E 2018, 98, 042902. [Google Scholar] [CrossRef]
- Chao, H.; Tan, Y.; Su, Z.K. Ground failure and soil erosion caused by bursting of buried water pipeline: Experimental and numerical investigations. Eng. Fail. Anal. 2025, 167, 108965. [Google Scholar] [CrossRef]
- Latifi, M.; Mohammadbeigi, S.; Moghadam, K.F.; Naeeni, S.T.; Kilanehei, F. Experimental study of pressure and soil effects on fluidization and mobile bed zones around buried leaking pipes. J. Pipeline Sys. Eng. 2022, 13, 04022034. [Google Scholar] [CrossRef]
- Sharafodin, S.; Latifi, M.; Ghodsian, M. Experimental investigation of leakage flow rate and fluidisation beneath polyethylene pipes in non-uniform soils. Water 2024, 16, 1156. [Google Scholar] [CrossRef]
- van Zyl, J.E.; Alsaydalani, M.O.A.; Clayton, C.R.I.; Bird, T.; Dennis, A. Soil fluidisation outside leaks in water distribution pipes—Preliminary observations. Proc. Inst. Civ. Eng.—Water Manag. 2013, 166, 546–555. [Google Scholar] [CrossRef]
- van Zyl, J.E.; Clayton, C.R.I. The effect of pressure on leakage in water distribution systems. Proc. Inst. Civ. Eng.—Water Manag. 2007, 160, 109–114. [Google Scholar] [CrossRef]
- Latifi, M.; Parvaneh, R.; Naeeni, S.T. Investigating the influence of surrounding soil properties on leakage discharge from cracks in polyethylene pipes. Eng. Fail. Anal. 2022, 141, 106676. [Google Scholar] [CrossRef]
- He, Z.Y.; Hu, S.W.; Shan, C.X.; Pan, F.Q. Leakage characteristics of high performance unplasticized polyvinyl chloride buried pipeline in urban. Phys. Fluids 2025, 37, 013314. [Google Scholar] [CrossRef]
- Alsaydalani, M.O.A.; Clayton, C.R.I. Internal Fluidization in Granular Soils. J. Geotech. Geoenviron. 2014, 140, 04013024. [Google Scholar] [CrossRef]
- Tang, Y.; Chan, D.H.; Zhu, D.Z. Numerical Investigation of Sand-Bed Erosion by an Upward Water Jet. J. Eng. Mech. 2017, 143, 04017104. [Google Scholar] [CrossRef]
- He, Y.X.; Zhu, D.Z.; Zhang, T.Q.; Shao, Y.; Yu, T.C. Experimental observations on the Initiation of sand-bed erosion by an upward water jet. J. Hydraul. Eng. 2017, 143, 06017007. [Google Scholar] [CrossRef]
- Zoueshtiagh, F.; Merlen, A. Effect of a vertically flowing water jet underneath a granular bed. Phys. Rev. E 2007, 75, 056313. [Google Scholar] [CrossRef]
- Schulz, H.E.; van Zyl, J.E.; Yu, T.C.; Neto, I.E.L.; Francisco, A.S.; Correa, N.A.; Benites, I.M.; Wang, H.Q. Hydraulics of Fluidized Cavities in Porous Matrices: Cavity Heights and Stability for Upward Water Jets. J. Hydraul. Eng. 2021, 147, 04021037. [Google Scholar] [CrossRef]
- Bailey, N.D.; Van Zyl, J.E. Experimental investigation of internal fluidisation due to a vertical water leak jet in a uniform medium. In Proceedings of the Computing and Control for the Water Industry, Leicester, UK, 2–4 September 2015; pp. 111–119. [Google Scholar] [CrossRef][Green Version]
- Akrami, S.; Bezuijen, A.; Tehrani, F.S.; Terwindt, J. The effect of relative density on the response of sand to internal fluidization. Acta Geotech. 2023, 18, 319–333. [Google Scholar] [CrossRef]
- Indiketiya, S.; Jegatheesan, P.; Rajeev, P. Evaluation of defective sewer pipe-induced internal erosion and associated ground deformation using laboratory model test. Can. Geotech. J. 2017, 54, 1184–1195. [Google Scholar] [CrossRef]
- Cao, L.-T.; Li, X.-Y.; Li, Z.-Y.; Liu, J.-M.; Li, J.-C.; Lv, X.-F. Influence of drainage flow velocity on microscopic cohesive soil erosion and macroscopic road collapse evolution: A case study in Beijing, China. Eng. Fail. Anal. 2024, 164, 108698. [Google Scholar] [CrossRef]
- Zhang, D.M.; Du, W.W.; Peng, M.Z.; Feng, S.J.; Li, Z.L. Experimental and numerical study of internal erosion around submerged defective pipe. Tunn. Undergr. Space Technol. 2020, 97, 103256. [Google Scholar] [CrossRef]
- Wang, Z.Y.; Liu, J.C.; Tan, Y.; Long, Y.Y. Experimental and numerical investigation on internal erosion induced by infiltration of defective buried pipe. Bull. Eng. Geol. Environ. 2025, 84, 38. [Google Scholar] [CrossRef]
- Dai, Z.L.; Peng, L.H.; Qin, S.W. Experimental and numerical investigation on the mechanism of ground collapse induced by underground drainage pipe leakage. Environ. Earth Sci. 2024, 83, 17. [Google Scholar] [CrossRef]
- Chen, B.W.; Liu, C.Y.; Li, Q.; Onyekwena, C.C. Experimental and theoretical investigations of ground settlement around submerged defective pipelines. Transp. Geotech. 2024, 49, 101395. [Google Scholar] [CrossRef]
- Mohamed, H.I.; Rabey, S.H.; Darweesh, M.S. Laboratory Investigation of Ground Surface Settlement Caused by Erosion around a Leaking Pipe. J. Pipeline Sys. Eng. 2022, 13, 04021080. [Google Scholar] [CrossRef]
- Tang, Y.; Zhu, D.Z.; Chan, D.H. Experimental Study on Submerged Sand Erosion through a Slot on a Defective Pipe. J. Hydraul. Eng. 2017, 143, 04017026. [Google Scholar] [CrossRef]
- Xu, C.J.; Liang, L.J.; Chen, Q.Z.; Luo, W.J.; Chen, Y.F. Experimental study of soil arching effect under seepage condition. Acta Geotech. 2019, 14, 2031–2044. [Google Scholar] [CrossRef]
- ASTM D422-63; Standard Test Method for Particle-Size Analysis of Soils. ASTM International: West Conshohocken, PA, USA, 2007.[Green Version]
- ASTM D854-23; Standard Test Methods for Specific Gravity of Soil Solids by the Water Displacement Method. ASTM International: West Conshohocken, PA, USA, 2023.[Green Version]
- ASTM D2487-17; Standard Practice for Classification of Soils for Engineering Purposes (Unified Soil Classification System). ASTM International: West Conshohocken, PA, USA, 2020.[Green Version]
- ASTM D4253-16; Standard Test Methods for Maximum Index Density and Unit Weight of Soils Using a Vibratory Table. ASTM International: West Conshohocken, PA, USA, 2016.[Green Version]
- ASTM D4254-16; Standard Test Methods for Minimum Index Density and Unit Weight of Soils and Calculation of Relative Density. ASTM International: West Conshohocken, PA, USA, 2016.[Green Version]
- Indiketiya, S.; Jegatheesan, P.; Rajeev, P.; Kuwano, R. The influence of pipe embedment material on sinkhole formation due to erosion around defective sewers. Transp. Geotech. 2019, 19, 110–125. [Google Scholar] [CrossRef]
- Muszynski, M.R.; Olson, S.M.; Hashash, Y.M.A.; Phillips, C. Earth pressure measurements using tactile pressure sensors in a saturated sand during static and dynamic centrifuge testing. Geotech. Test. J. 2016, 39, 371–390. [Google Scholar] [CrossRef]
- Walski, T.; Bezts, W.; Posluszny, E.T.; Weir, M.; Whitman, B.E. Modeling leakage reduction through pressure control. J. Am. Water Works Ass. 2006, 98, 147–155. [Google Scholar] [CrossRef]
- Long, Y.Y.; Tan, Y. Soil arching due to leaking of tunnel buried in water-rich sand. Tunn. Undergr. Space Technol. 2020, 95, 103158. [Google Scholar] [CrossRef]
- Liang, L.J.; Xu, C.J. Numerical and theoretical research on stress distribution in the loosening zone of the trapdoor problem. Int. J. Numer. Anal. Met. 2019, 43, 1426–1447. [Google Scholar] [CrossRef]
- Guo, S.; Jiang, Y.H.; Tang, Y.; Cheng, H.K.; Luo, X.J.; Lv, Y.Z.; Li, M. Experimental study on the soil erosion through a defective pipe under the cyclic infiltration-exfiltration flow. Transp. Geotech. 2023, 42, 101085. [Google Scholar] [CrossRef]
- Montella, E.P.; Toraldo, M.; Chareyre, B.; Sibille, L. Localized fluidization in granular materials: Theoretical and numerical study. Phys. Rev. E 2016, 94, 052905. [Google Scholar] [CrossRef] [PubMed]
- Ngoma, J.; Philippe, P.; Bonelli, S.; Radjai, F.; Delenne, J.Y. Two-dimensional numerical simulation of chimney fluidization in a granular medium using a combination of discrete element and lattice Boltzmann methods. Phys. Rev. E 2018, 97, 052902. [Google Scholar] [CrossRef] [PubMed]
- Cui, X.L.; Li, J.; Chan, A.; Chapman, D. Coupled DEM-LBM simulation of internal fluidisation induced by a leaking pipe. Powder Technol. 2014, 254, 299–306. [Google Scholar] [CrossRef]
Disclaimer/Publisher’s Note: The statements, opinions and data contained in all publications are solely those of the individual author(s) and contributor(s) and not of MDPI and/or the editor(s). MDPI and/or the editor(s) disclaim responsibility for any injury to people or property resulting from any ideas, methods, instructions or products referred to in the content. |
© 2025 by the authors. Licensee MDPI, Basel, Switzerland. This article is an open access article distributed under the terms and conditions of the Creative Commons Attribution (CC BY) license (https://creativecommons.org/licenses/by/4.0/).