Article

Evapotranspiration and Inputs of Salts to Soil in Irrigated Millet with Wastewater

by
José Raliuson Inácio Silva
1,*,
Mauricio Luiz de Mello Vieira Leite
1,
Genival Barros Junior
1,
Josefa Edinete de Sousa Silva
2,
Elania Freire da Silva
3,
Alexandre Maniçoba da Rosa Ferraz Jardim
4,*,
Juracy Barroso Neto
5,
José Romualdo de Sousa Lima
6,
Antônio Celso Dantas Antonino
7 and
Eduardo Souza
1
1
Postgraduate Program in Plant Production, Academic Unit of Serra Talhada, Federal Rural University of Pernambuco, Serra Talhada 56909-535, PE, Brazil
2
Academic Unit of Serra Talhada, Federal Rural University of Pernambuco, Serra Talhada 56909-535, PE, Brazil
3
Department of Agricultural and Forestry Sciences, Federal Rural University of the Semi-Arid, Mossoró 59625-900, RN, Brazil
4
Department of Biodiversity, Institute of Biosciences, São Paulo State University—UNESP, Av. 24A, 1515, Rio Claro 13506-900, SP, Brazil
5
Embrapa Arroz e Feijão, Santo Antônio de Goiás 75375-000, GO, Brazil
6
Department of Agronomy, Federal University of the Agreste of Pernambuco, Garanhuns 55292-278, PE, Brazil
7
Department of Nuclear Energy, Federal University of Pernambuco, Recife 50740-545, PE, Brazil
*
Authors to whom correspondence should be addressed.
Appl. Sci. 2025, 15(17), 9612; https://doi.org/10.3390/app15179612
Submission received: 8 July 2025 / Revised: 26 August 2025 / Accepted: 27 August 2025 / Published: 31 August 2025

Abstract

The growing reliance on unconventional water sources requires effective strategies for forage production, particularly in semiarid regions. The objective of this study was to evaluate evapotranspiration, phytomass accumulation, and salt inputs to the soil in millet crops irrigated with wastewater under different soil water levels, both with and without organic fertilizer. We conducted the experiment in a protected environment using a randomized block design in a 4 × 2 + 1 (control) factorial scheme with three replicates. We applied four irrigation levels with wastewater (25, 50, 75, and 100% of available soil water) with or without organic fertilizer. The control treatment was watering with the public supply submitted to 100% of the available water from the soil without fertilization. Wastewater did not affect biomass without fertilization, but irrigation levels significantly influenced productivity under fertilization. Additionally, applying 50% of available soil water proved the most efficient system in terms of yield per unit of water consumed. Although irrigation improved productivity, water use efficiency in millet showed limited enhancement. The millet did not exhibit any symptoms of salt stress. Finally, we emphasize caution when using wastewater (graywater) for irrigation, as continuous application can lead to salt accumulation and subsequent soil salinization.

1. Introduction

Amidst the persistent challenges of drought and water scarcity in arid and semiarid regions, the potential of recycled water for agriculture represents a beacon of hope. These regions, often characterized by industrial underdevelopment, experience minimal discharges of industrial sewage, resulting in water sources primarily composed of domestic with low pollution levels. This unique characteristic enables the safe recycling of wastewater, offering substantial opportunities for its utilization. However, it is imperative to stress the importance of adopting safe practices with recycled water in these regions, ensuring rigorous water quality monitoring and adherence to high-quality standards for effluents from sewage treatment plants. This context addresses global water scarcity and promotes sustainable development, substantially contributing to the water security and sustainability of communities in these regions [1].
Using domestic sewage water for irrigation represents a management alternative that provides immediate benefits in the face of water scarcity. On one hand, it increases the water available for agriculture and supplies nutrients to plants due to its high nutrient content [2]. On the other hand, it typically contains high levels of dissolved salts, which can reduce agricultural yields and cause environmental impacts on the soil [3]. Therefore, it is necessary to monitor the salinity of soils irrigated with wastewater, with soil electrical conductivity serving as the most used method. Soil electrical conductivity offers an effective, low-cost, and easy-to-implement way to monitor salinity, while providing accurate measurements under field conditions [4].
One way to reduce the impacts of wastewater salinization in agriculture is to limit crop water supply [5]. The lower the applied supervision depth, the lower the contribution of salts to the soil. However, restricting water supplies can significantly reduce crop yields. Water stress promotes damage to plant metabolism, reducing photosynthesis and cell division, increasing energy expenditure, and releasing reactive oxygen in cells [6]. These biochemical and physiological responses directly influence the reduction in crop evapotranspiration, which represents the amount of water used by a plant to offset the losses through soil evaporation and plant transpiration under field conditions. Evapotranspiration is a key parameter for estimating water use efficiency (i.e., the relationship between productivity and water consumption), and a plant can tolerate water and salt stress only when it can enhance this efficiency [5].
People generally oppose the use of wastewater because of its association with sewage recycling and concerns that exposure to this water may be unsafe [7]. This inclusion decreased significantly in regions with low water availability, such as the Brazilian semiarid region; however, concerns about food contamination persist [8]. The use of graywater (referring to water that has been used in domestic processes, excluding toilet flushes) appears as one of the safest options for irrigated agriculture, as it is generated in showers, sinks, washing machines, and other domestic processes, except toilet flushes, contributing to a significant reduction in the contaminant load [9,10]. This type of water contains fewer pathogens and usually goes through a filtration system to capture fat and organic matter in suspension before irrigation. Therefore, this technology offers low-cost implementation and is easily adopted by communities, making it a viable option, especially in developing countries [11].
In summary, using recycled water for irrigation in arid and semiarid regions provides a promising solution to water scarcity, offering a sustainable approach to agricultural water management. However, its use necessitates careful water quality monitoring to ensure the safety of crops, soil, and the environment. Strategies such as monitoring soil salinity, adjusting irrigation depths, and implementing effective filtration systems for graywater can help mitigate potential risks associated with recycled water use. In this context, the objective of this study was to evaluate the effect of different irrigation depths using graywater on evapotranspiration and salt input in pearl millet, with and without cattle manure fertilization. We hypothesized that increasing irrigation depths with graywater would result in higher evapotranspiration and salt input, and that cattle manure fertilization would partially mitigate these effects.

2. Materials and Methods

We meticulously conducted this study in a controlled environment at the Rural Federal University of Pernambuco, Serra Talhada Academic Unit, from September to November 2017. The site, situated in the Brazilian semiarid (altitude: 429 m, latitude: 7°56′15″ S and longitude: 38°18′45″ W), features a semiarid BSh climate (characterized as hot and dry) according to the Köppen classification. Throughout the experimental period, we carefully monitored the meteorological conditions, recording the average temperature (30.09 ± 1.57 °C) and relative humidity (44.02 ± 5.48%) of the air were accurately recorded.
We carefully designed the experiment using a randomized block design in a 4 × 2 + 1 (control) factorial scheme with three replicates. The first factor represented the precise amount of wastewater watering (25, 50, 75, and 100% of available soil water), and the second factor represented the presence or absence of organic fertilization (with and without application of bovine manure). The control treatment received irrigated with water from the public supply (Table 1) and subjected to 100% available water without fertilization, maintaining the control conditions of the experiment.
The system used to collect wastewater consists of two phases. In the first phase, the wastewater flows through a fat retention box and in the second phase for a filtration tank (formed by a superficial layer of charcoal, followed by layers of coarse gravel, coarse sand, fine sand, and fine crushed). After going through this process, the water is stored in a tank and used for irrigation. It is worth noting that the toilet water does not enter this system, so the water collected can be classified as graywater (Figure 1).
Plastic pots with a capacity for 18 dm3 have been grown with soil (Haplic Cambisol) collected in a pasture area from the first 0.20 m layer of soil. After collecting, the soil was sieved in a 4 mm mesh and then added to the vessels until it reached a density of 1.30 g cm−3. The chemical and physical characteristics of the soil used are: 7.1 pH; 0.68 cmolc dm−3 potassium; 40.0 mg dm−3 phosphorus; 1.30 cmolc dm−3 calcium; 43 mg dm−3 iron; 1.0 cmolc dm−3 hydrogen + aluminum; 0.27 cmolc dm−3 sodium; 0.88% of organic matter; 10.5% of clay; 17.2% of silt and 72.2% of sand.
The fertilized treatments with bovine manure received 640 g (with 70% water), the equivalent of 34 Mg ha−1 of bovine manure. According to Nicolau Sobrinho et al. [12], this amount of manure is enough for the total growth of the millet. The bovine manure used had the following chemical characteristics: 10.44 g kg−1 of nitrogen; 10.50 g kg−1 of potassium; 5.28 g kg−1 of phosphorus; 6.85 g kg−1 of magnesium; 11.20 g kg−1 of calcium; 113.29 g kg−1 of carbon and 11 of carbon/nitrogen ratio.
We determined the available water content (AWC) of the soil by calculating the difference between the moisture at field capacity (FC) and the moisture at the permanent wilting point (PWP). The FC was obtained following the methodology proposed by Casaroli and Jong van Lier [13]. We determined PWP from undisturbed soil samples by applying a pressure of 15 atm in the Richards pressure chamber. The procedures described for the determination of AWC were performed in the soil in the pots with and without manure, obtaining the following results for soil without manure: 0.18 g g−1 and 0.03 g g−1 respectively for FC and PWP; for soil with manure, these values were 0.20 g g−1 and 0.05 g g−1 for FC and PWP, respectively.
In this study, we used the millet [Pennisetum glaucum (L.) R. Br.] cultivar IPA-bulck-1 BF was used. From seedling emergence until the fifteenth day of growth, we irrigated the plants daily with high-quality water without restriction. After this period, we performed thinning, leaving one plant per pot, and began applying the different wastewater irrigation depths based on fractions of the soil’s available water content—AWC (25, 50, 75, and 100% of AWC). We irrigated the pots daily, replacing the water lost through evapotranspiration by weighing the pots at dawn to determine the required water mass.
After applying the treatments, we evaluated the experiment for 60 days. During this period, we identified two phenological phases: vegetative growth (from germination to panicle emergence) and reproductive growth (from panicle emergence to harvest). This information enabled us to determine evapotranspiration for these two phenological phases.
At the end of the experiment, we harvested the plants and dried them at 65 °C until they reached a constant weight (~48 h) for later determination of plant dry matter (DM) [14]. After removing the plants, we carefully disaggregated and homogenized the entire soil from each pot to obtain a representative sample. We then collected a subsample of this soil to determine the electrical conductivity of the soil saturation extract (ECse), following the methodology described by Freire et al. [15]. Using the soil saturation extract, we measured soluble sodium (Na+) with a flame photometer [15].
We first subjected the results to the Shapiro–Wilk normality test and Bartlett’s homoscedasticity test. Once we verified these assumptions, we performed analysis of variance (F-test at 5%) and conducted regression analysis when we observed a significant difference. We used the R statistical software (version 4.4.3) [16] for all statistical analyses and graphical representations.

3. Results and Discussion

3.1. Millet Phytomass Accumulation

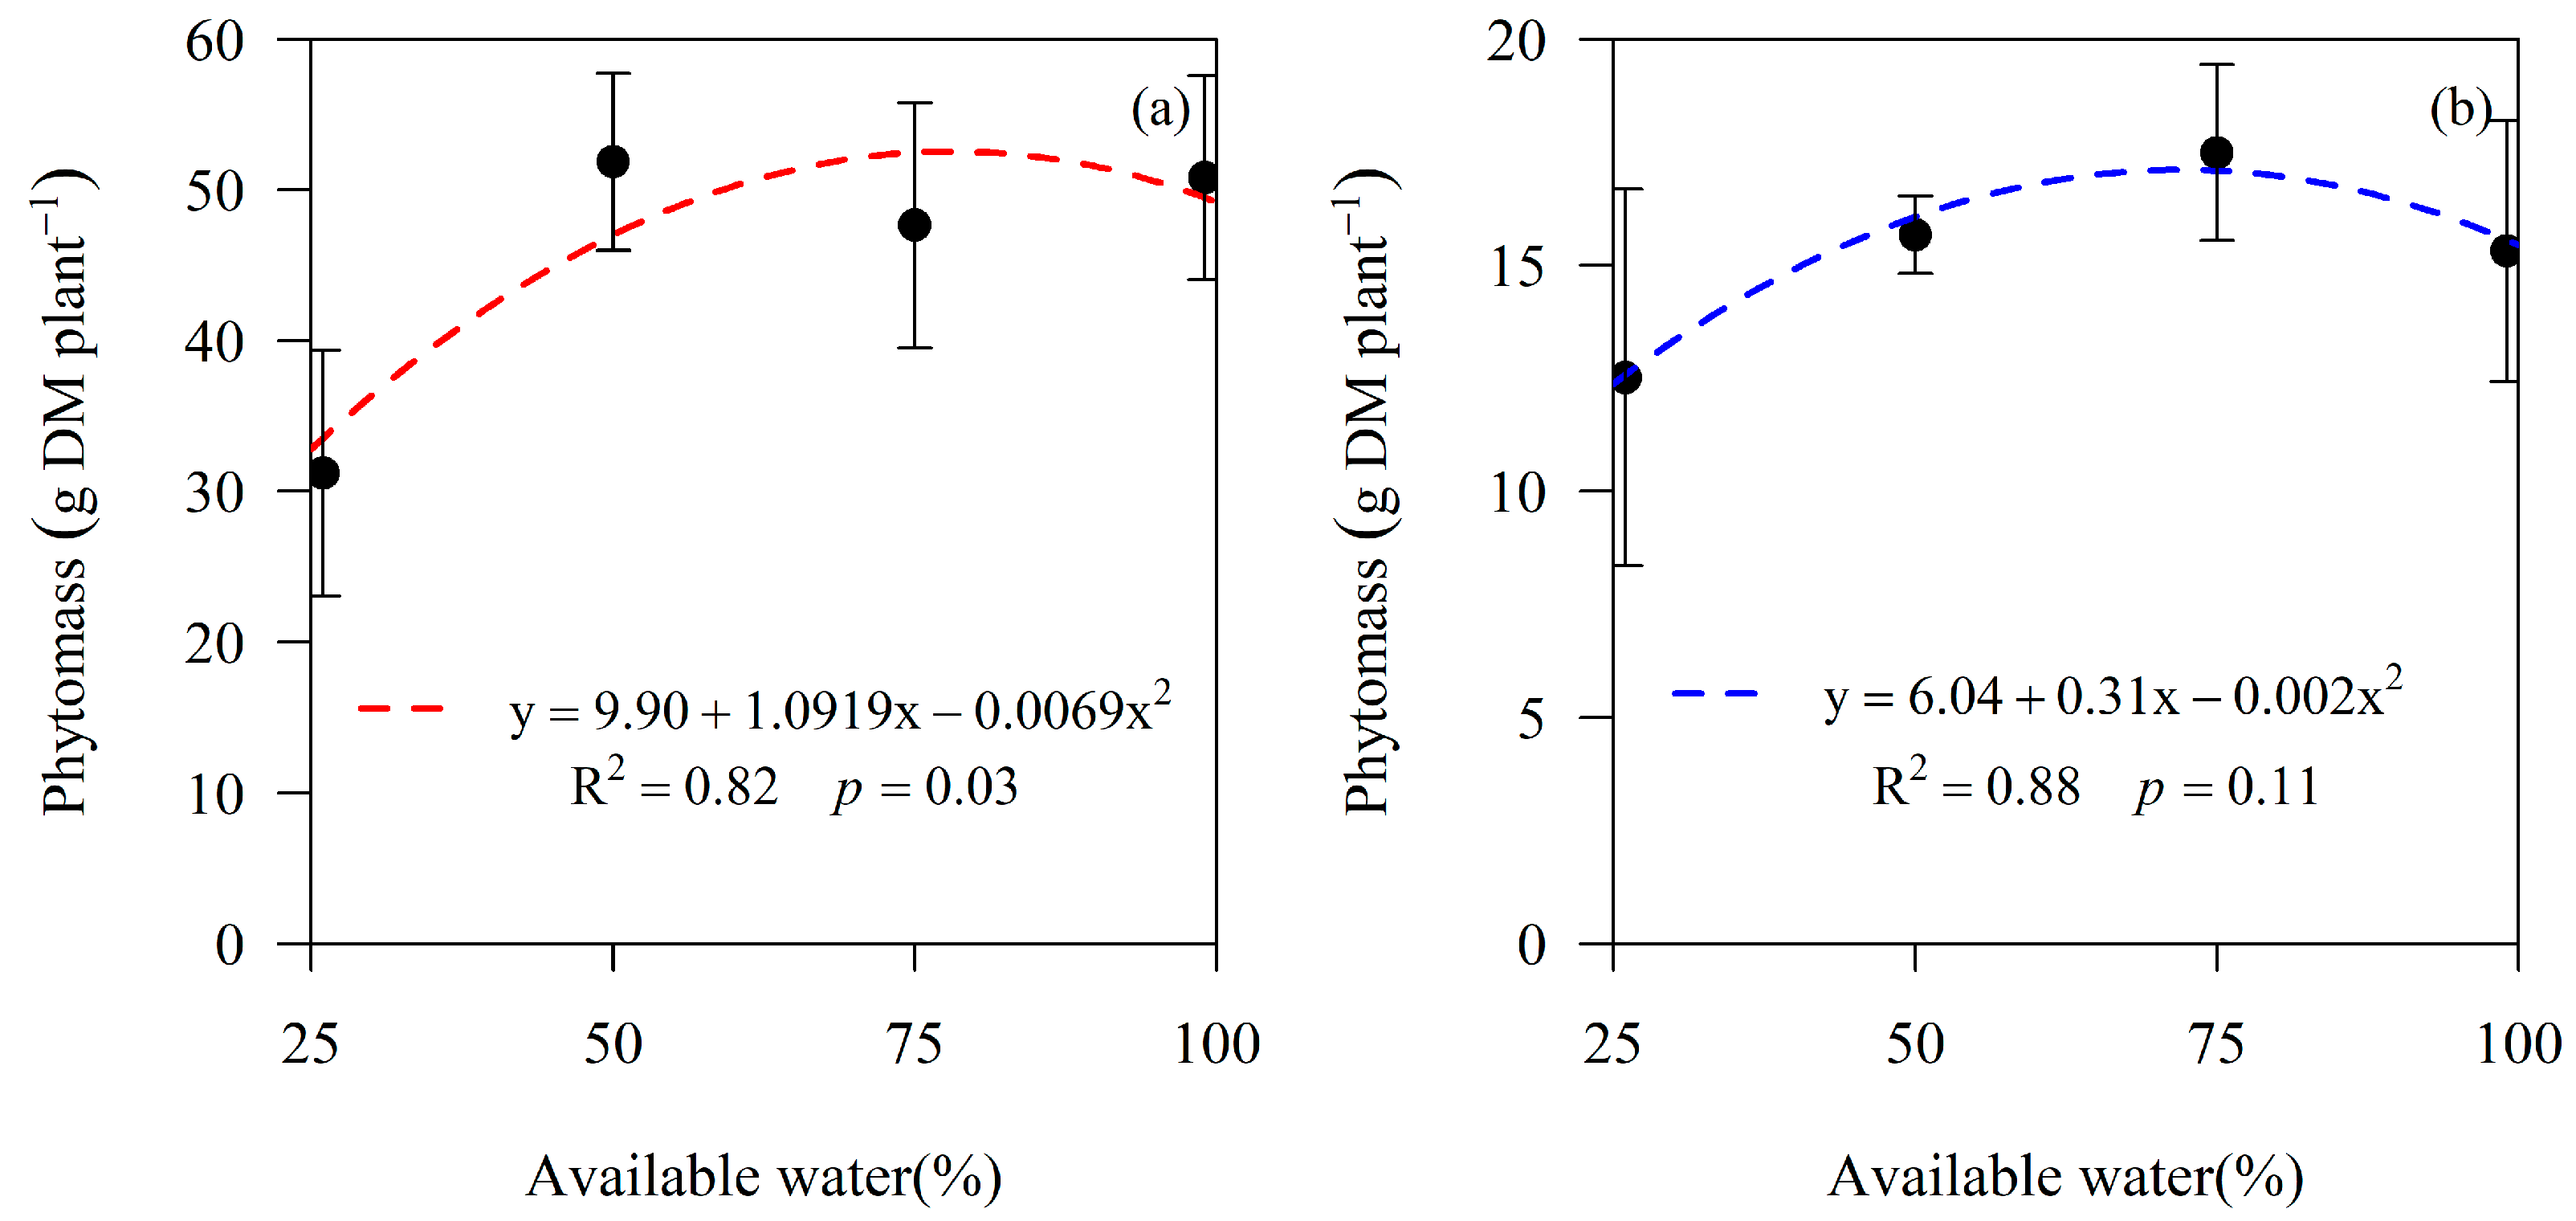
According to Figure 2, when the plants did not receive fertilization, the model describing the accumulation was not significant at the 5% level, indicating that reduced irrigation depths did not affect biomass production (Figure 2b). In contrast, under fertilization, the reduction in irrigation depth significantly influenced biomass accumulation, and the quadratic model provided the best fit to the data. The model derivative indicated that the maximum millet yield under fertilization occurred at 80% of the available soil water (Figure 2a).
Independent of the level of water available in the soil, fertilization increased millet biomass yield by more than 100% compared to unfertilized plants. Fertilized millet showed greater leaf area expansion and, consequently, higher yield; however, it also required more water due to increased transpiration, which made the plants more susceptible to water stress [17]. In addition, millet tolerance to limited irrigation also depends on factors such as plant metabolism [18] and irrigation frequency [19].
Phytomass production in the control treatment (15.35 g DM plant−1) was statistically like that of unfertilized plants, regardless of soil water availability. The low nutrient content in graywater generally reflects its source [20]. In addition, despite developing well in sandy soils with low fertility, it responds positively to fertilization due to its high capacity for nutrient translocation [21].

3.2. Analysis of Millet Evapotranspiration

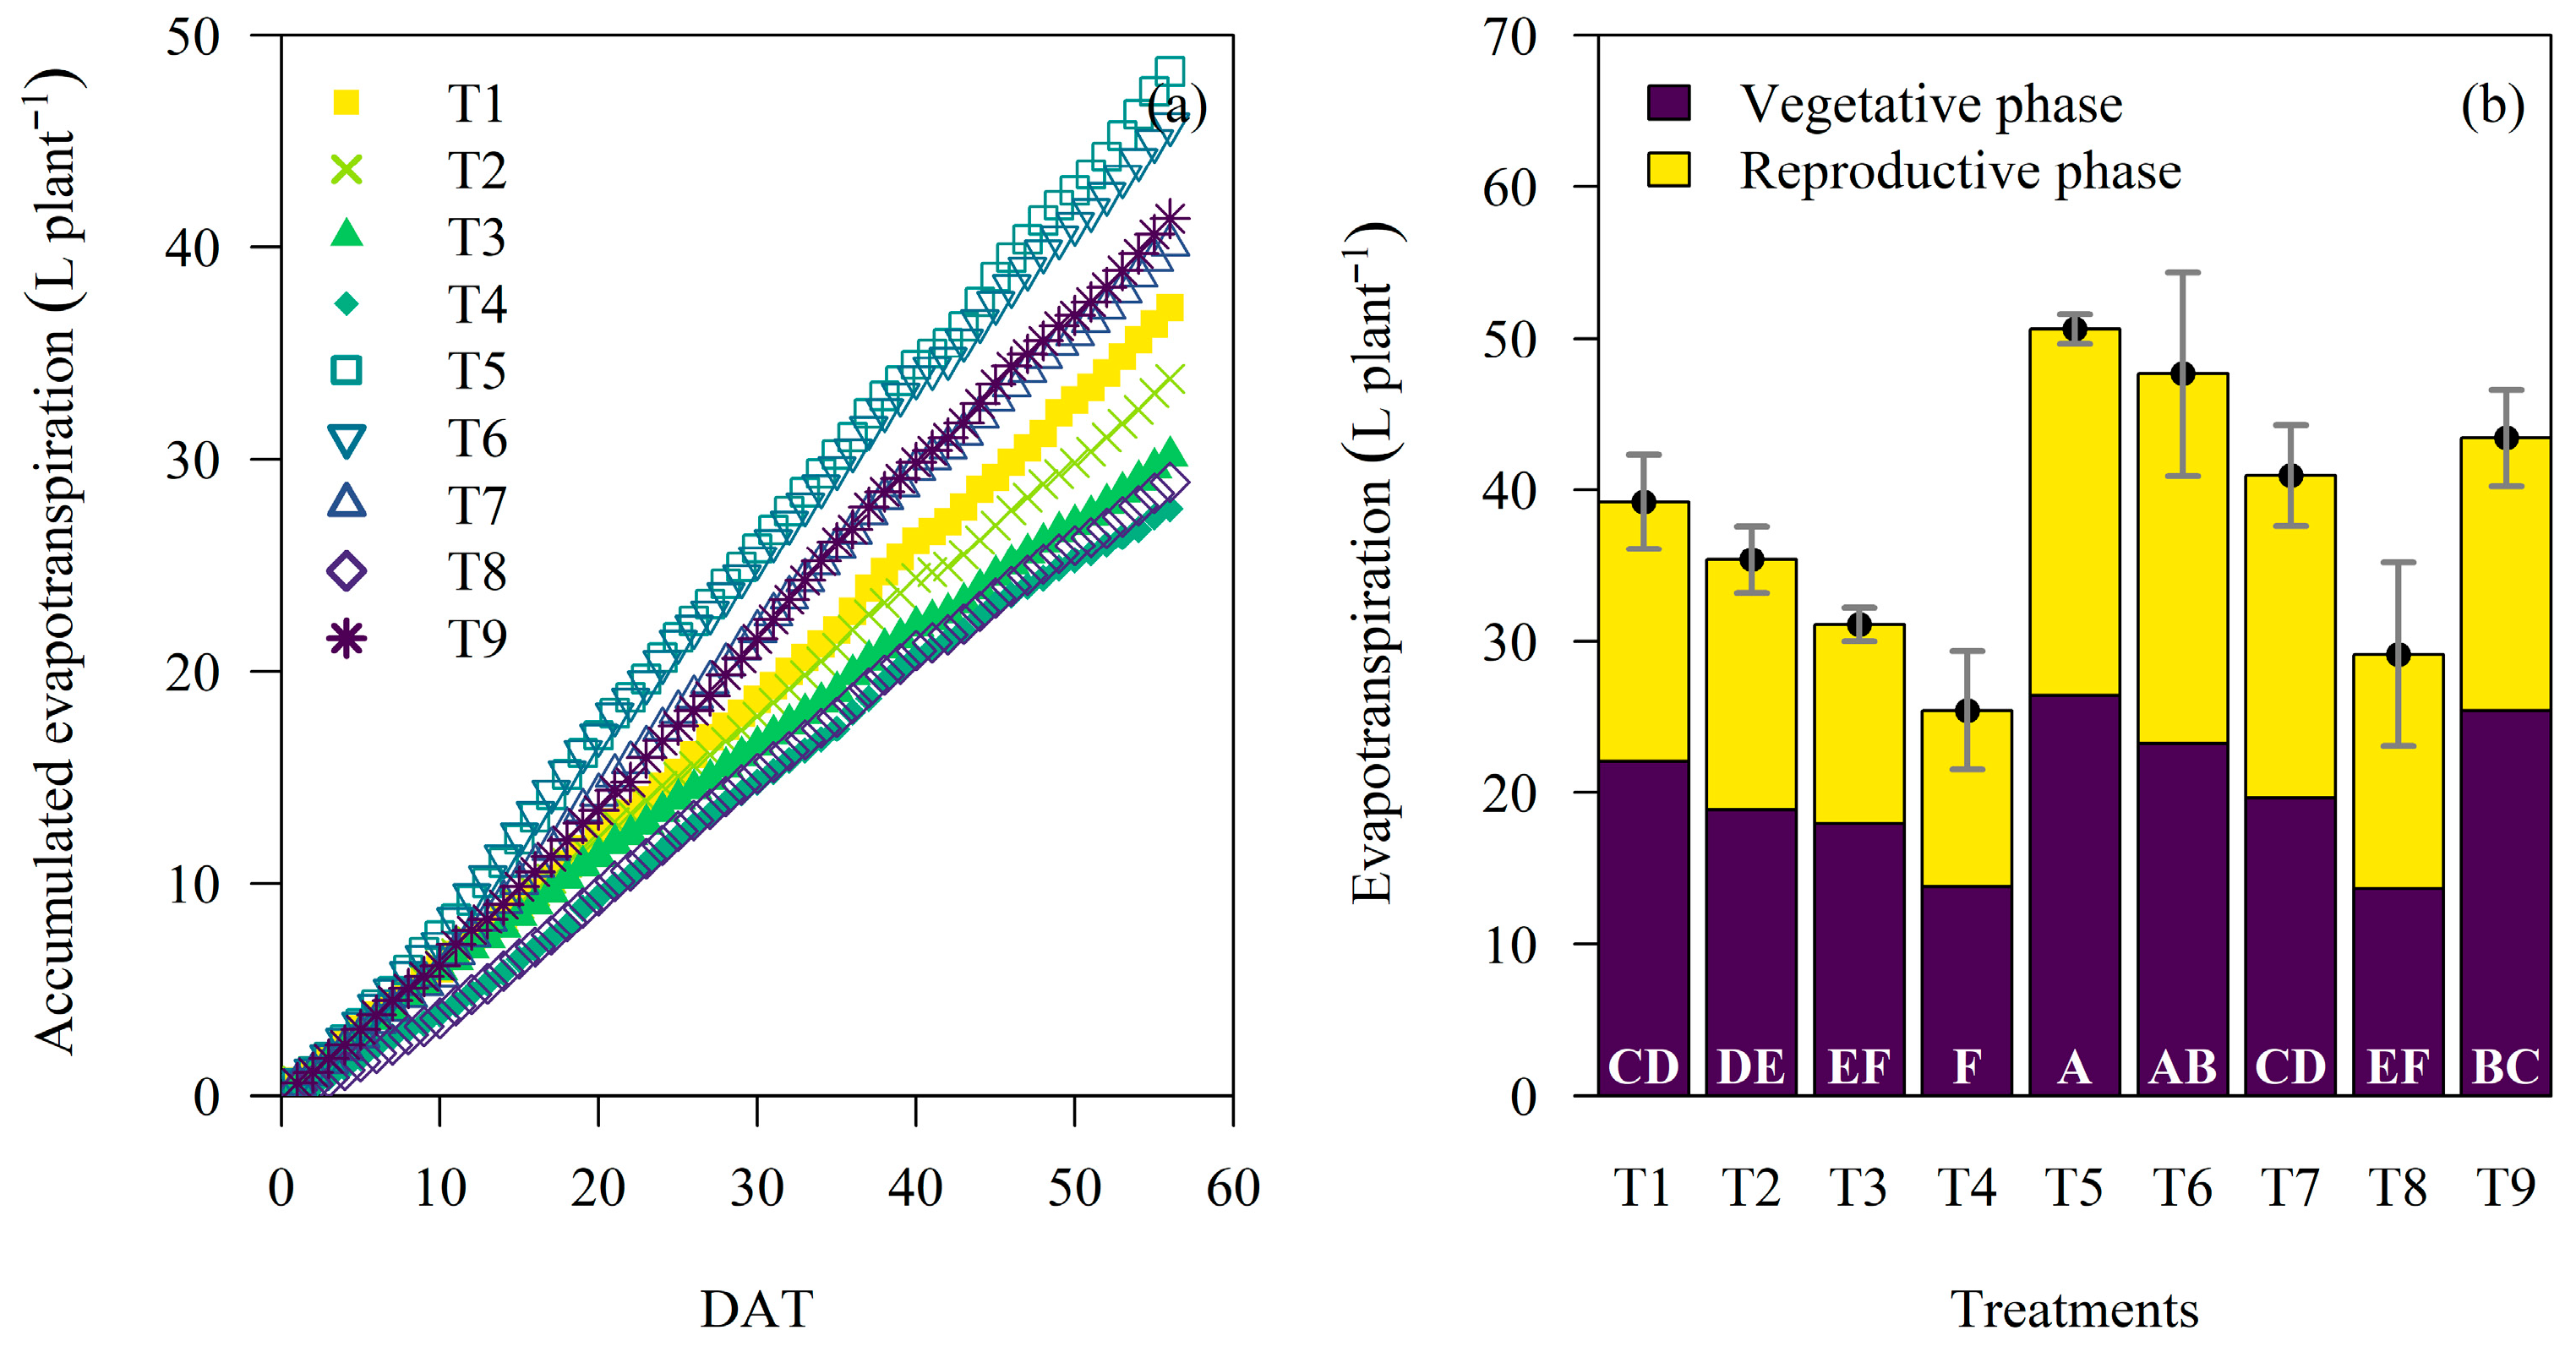
Accumulated evapotranspiration (ET) in fertilized treatments irrigated at 50, 75, and 100% of AWC exceeded all unfertilized treatments and the fertilized treatment irrigated at 25% AWC (Figure 3a). Fertilization increased leaf number and size in millet, which enhanced stomatal density and transpiring surface area [22]. At 15 DAT, treatments with lower soil water availability showed reduced ET values (Figure 3a).
The control showed ET values 15% higher than the unfertilized treatment irrigated with 100% wastewater, indicating that wastewater irrigation restricted ET. These restrictions likely resulted from reduced transpiration in millet plants, caused by cumulative salt uptake since wastewater contained higher salinity than the urban water supply (Table 1). The resulting salt accumulation in the soil also reduced soil water evaporation.
According to Duarte and Souza [23], an increase in soil salinity promotes changes in soil osmotic potential, decreasing the loss of water from the soil to the atmosphere. Furthermore, the high concentration of suspended solids in wastewater intensifies solute–water interactions, decreasing the tendency of water molecules to transition to the gaseous state and thus lowering soil evaporation [24].
Fertilized millet plants under higher irrigation levels (100% and 75% AWC) exhibited the greatest evapotranspiration (Figure 3b). Regardless of fertilization, there was a decrease in evapotranspiration (ET) with a reduction in the available water in the soil. However, in unfertilized pots, phytomass production remained statistically unchanged across irrigation levels (Figure 2b). In contrast, fertilized plants only showed reduced biomass under the 25% AWC treatment. This finding highlights that reducing irrigation depth can improve water use efficiency, if crop yield does not decrease proportionally to the reduction in water supply [25].
A reduction in soil water availability (AWC) decreased the proportion of evapotranspiration (ET) occurring during the vegetative phase (Figure 3b). When the millet was fertilized and irrigated with 75, 50, and 25% AWC of the soil, the ET in the reproductive phase surpassed that of the vegetative phase (Figure 3b). Furthermore, phytomass accumulation correlated more strongly with ET in the reproductive phase (r = 0.83) than with total ET (r = 0.70) or ET during the vegetative phase (r = 0.51).
Differences in water absorption dynamics are critical for sustaining yield under drought conditions, as plants generally increase water uptake during the reproductive phase [26]. Millet varieties that are more tolerant to water deficits tend to allocate greater water use to this stage, thereby ensuring higher water availability for grain filling [27].

3.3. Millet Water Use Efficiency (WUE)

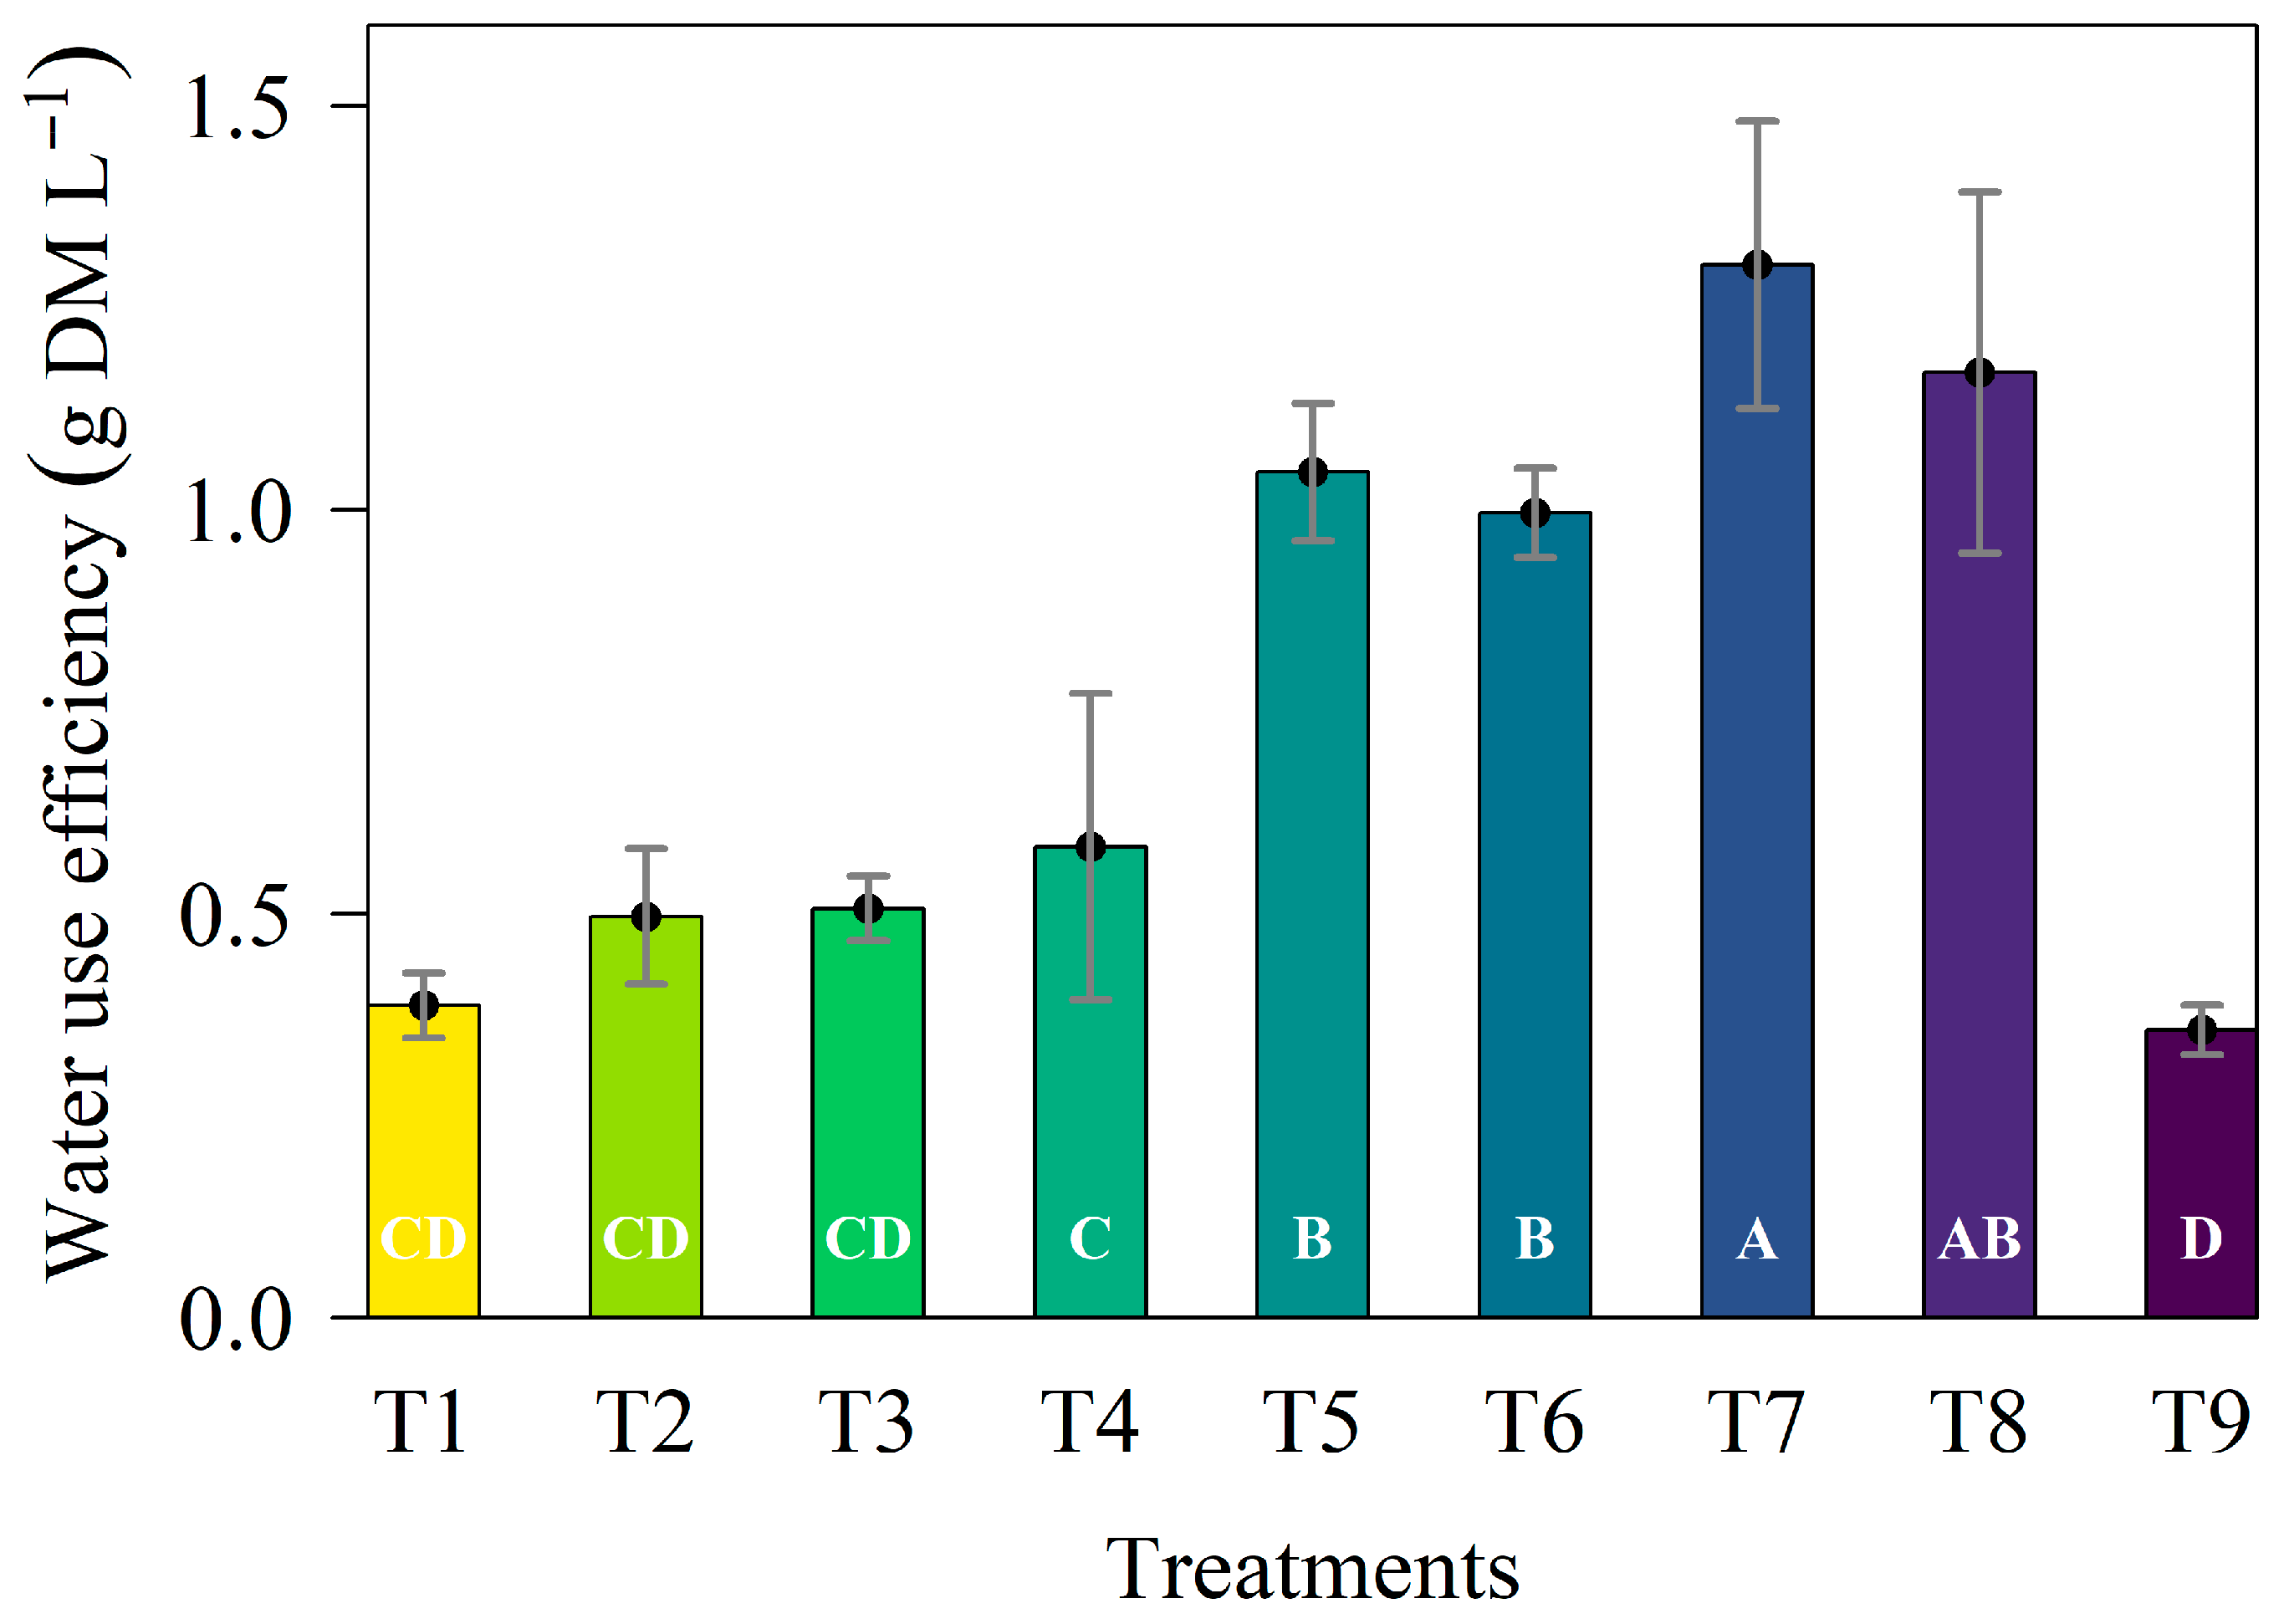
Water use efficiency (WUE) showed significant differences depending on irrigation depths. The significantly enhanced water use efficiency, despite the higher evapotranspiration observed in these treatments (Figure 3). In fertilized conditions, each liter of applied water resulted in an additional 1.0 g of dry matter, whereas in the absence of fertilization, the yield ranged from 0.36 to 0.42 g of dry matter per liter of applied water. Although WUE remains relatively stable under conditions of low water availability, regardless of fertilization, forage quality tends to decline due to the accumulation of dead material and the deterioration of bromatological traits [22]. Treatments with lower irrigation depths showed significant increases in water use efficiency, mainly because pearl millet is a species capable of regulating stomatal conductance and reducing water loss under limiting water conditions [21].
The control treatment exhibited the lowest water use efficiency among all treatments studied (Figure 4), despite producing phytomass statistically like that of the unfertilized wastewater irrigation treatments. However, it showed higher evapotranspiration compared to these irrigation treatments (Figure 3). Using 25% of AWC as the reference for lower ET and dry matter production (DMP), we analyzed the proportion of ET and DMP with increasing soil water availability (Figure 5). In unfertilized millet, ET increased proportionally to DMP at 50% and 75% AWC (Figure 5a); however, at 100% AWC, the increase in ET was twice that of DMP.
For fertilized millet irrigated at 50% AWC, DMP increased 22% more than ET. At 75% and 100% AWC, DMP increased proportionally to ET (Figure 5b). Thus, increases in dry matter production must exceed the rise in evapotranspiration for higher irrigation depths to be considered efficient for the producer. Fertilization enhances both evapotranspiration and millet production, even under water deficit conditions.

3.4. Soil Salts Inputs

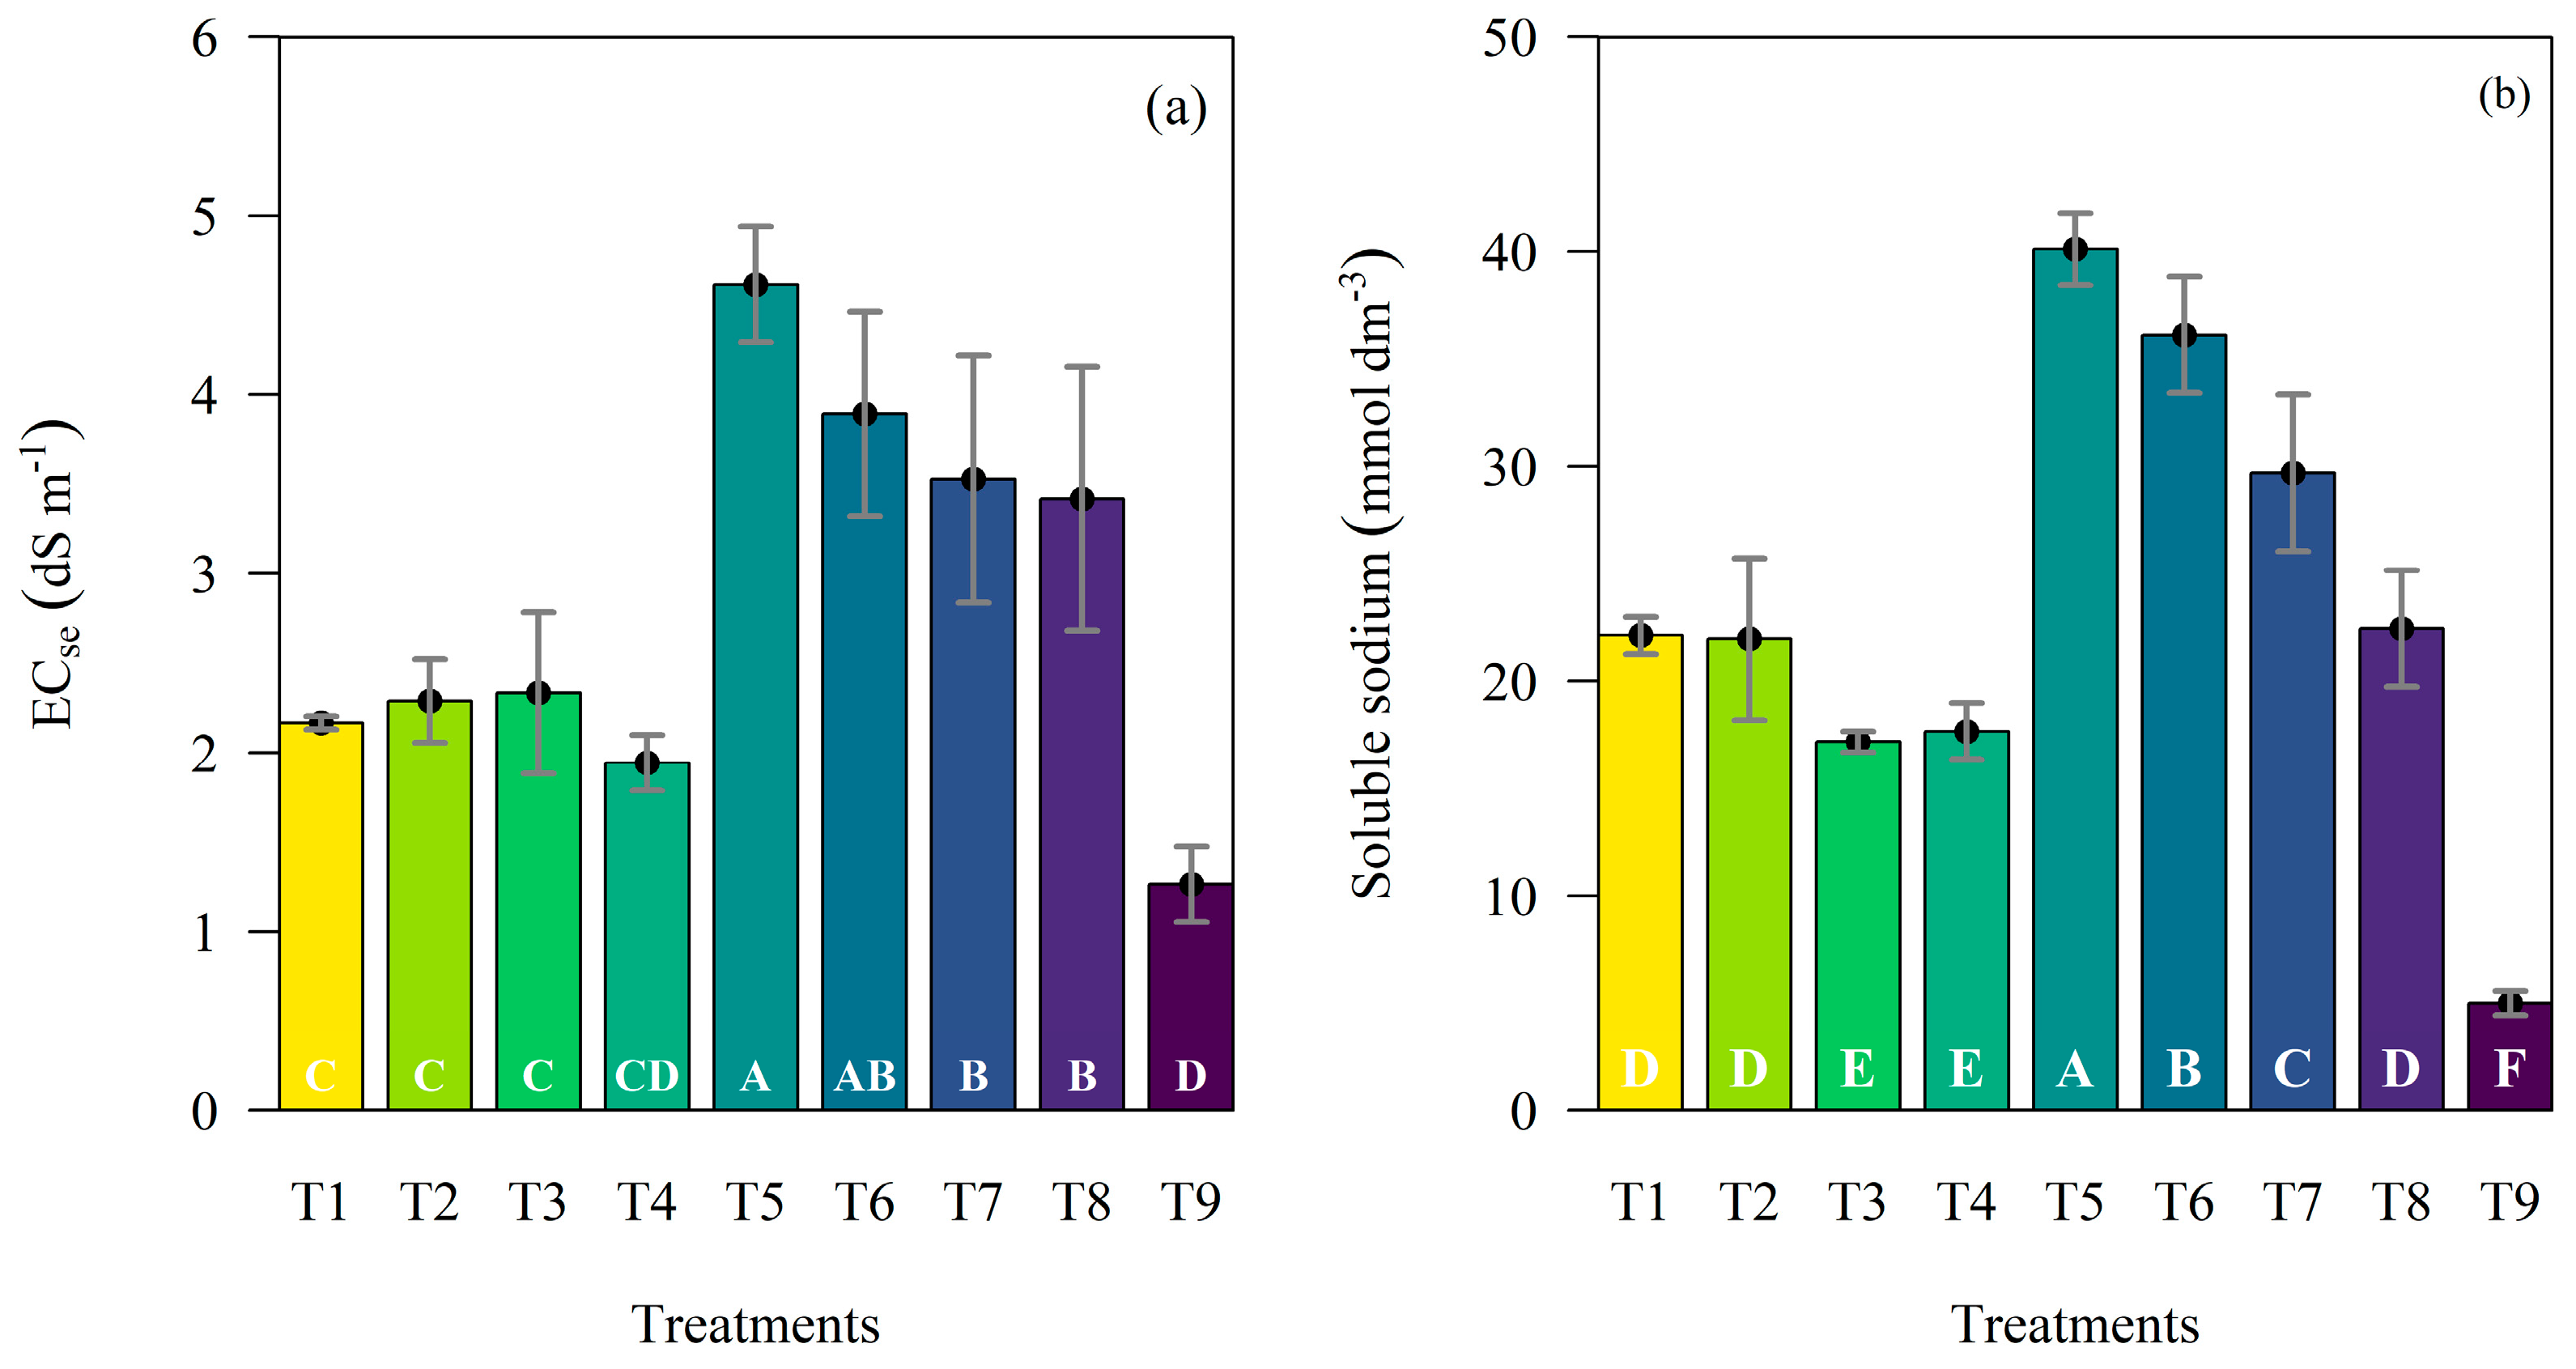
Soils in fertilized treatments exhibited higher electrical conductivity of the saturation extract (ECse) due to the larger volumes of wastewater applied (Figure 3). Soils irrigated with 75% and 100% AWC reached ECse values above 4.0 dS m−1 (Figure 6a), classifying them as saline [28]. Despite this substantial increase in soil salinity, millet showed no signs of salt stress, likely because salt accumulation occurred gradually throughout the crop cycle and due to millet’s inherent tolerance, as it is one of the forage species least affected in yield by salinity [29]. Cultivating salt-tolerant plants can constitute a sustainable management strategy, provided sufficient rainfall occurs to leach accumulated salts from the soil [3].
ECse did not differ significantly across soil water availability levels in millet grown without manure fertilization (Figure 6a). Although these ECse values remained lower than those in fertilized treatments, they were still higher than in control, which was irrigated with public supply water and had lower salinization potential (Table 1). As a result, the control treatment caused the smallest increase in soil salinity compared to the initial soil ECse of 0.55 dS m−1.
Therefore, special attention is required when using wastewater (graywater) for irrigation, as its long-term use can promote soil salinization. Considering soil moisture, the actual electrical conductivity in the root zone can be 2–3 times higher than the conductivity measured in the saturation extract, which amplifies the effects of saline stress under deficit irrigation [30]. Soil salinization from wastewater irrigation has also been reported in Israel, where authorities consider effluent desalination to mitigate this problem [31]. As soil osmotic potential increases, plants expend more energy to absorb water and adjust their water potential relative to the soil [32].
Beyond its toxic effects on plants, increased soil salinity directly alters soil osmotic potential, shifting it from negligible to highly influential in soil water dynamics for the plant [23]. As soil osmotic potential rises, plants expend more energy to absorb water and adjust their water potential relative to the soil [32].
Figure 6b shows the response of exchangeable sodium (Na+) to the treatments. Like ECse, the highest Na+ content occurred in fertilized treatments with greater irrigation depth, while the control treatment exhibited the lowest Na+ content. Increased soil sodium promotes clay dispersion, destabilizes soil aggregates, reduces water movement in the soil profile, and causes aeration problems [3]. Therefore, applying risk management and interim strategies is necessary to prevent negative impacts from wastewater irrigation, as its continued use can degrade the soil.
The relationship between ECse and ET (Figure 7a) and between Na+ and ET (Figure 7b) stands out due to the higher angular coefficient of the linear regression line (β1 = 0.767) and coefficient of determination (R2 = 0.70) of Na+. This more considerable angular coefficient results from the more pronounced differences in Na+ depending on the water levels available in the soil compared to the ECse (Figure 6). Therefore, Na+ increases significantly more than ECse when graywater from wastewater is used for irrigation. Despite the linear trend of increasing ECse as evapotranspiration increased, the coefficient of determination was relatively low (R2 = 0.51; Figure 7). Because soil samples were collected only at the end of the experiment, the ECse value reflects the cumulative effect of several processes that occurred throughout the crop cycle, such as the progressive salt accumulation due to the absence of drainage and the ionic uptake by the plants. The increase in evapotranspiration promoted soil salinization because the irrigation management relied on saline water (Table 1) and no drainage occurred. Under these conditions, the salt input becomes cumulative throughout the crop cycle, and higher irrigation depths result in a greater amount of salt being added to the soil. Similar results were reported by Duarte and Souza [23], Ben-Gal et al. [30] and Silva et al. [5].
The progression of soil salinization and sodification depends on the salt concentration in irrigation water, the initial salinity of the receiving soils, climatic conditions, and, most importantly, the physical properties of the soils [33]. Because ECse and exchangeable sodium increase linearly with evapotranspiration (which varies according to soil water availability), adopting lower irrigation depths is essential—especially when using wastewater with a high risk of salinization. This practice not only conserves water but also substantially reduces salt inputs to the soil. Higher soil salt concentrations impair plant physiological processes—causing specific ion toxicity, reducing transpiration and photosynthetic activity, and altering biochemical pathways—and deteriorate soil physical conditions by promoting clay dispersion, decreasing water percolation, and increasing the osmotic potential of the soil solution [23,34]. A significant increase in soil salinity and deterioration of soil properties were also reported by Uppal et al. [21], when wastewater was used for irrigation [35].
Irrigating with graywater increased soil salt content but did not reduce pearl millet biomass. Continuous use should include practices that promote salt leaching to prevent long-term salinization or sodification. As this study used single plants in pots under controlled conditions, some variables—such as biomass, salt accumulation, and soil evaporation—may have been overestimated. Field studies are needed to confirm the trends observed here.

4. Conclusions

Cultivating millet with 50% of the available water combined with organic fertilization proved to be the most efficient system. This treatment minimized evapotranspiration, reduced salt accumulation in the soil, and maintained high millet phytomass. Our results demonstrate that controlled irrigation with graywater can support sustainable forage production if soil salinity is closely monitored.
These findings offer practical guidance for water management in semiarid regions, particularly where conventional water resources are limited. However, this study was conducted under controlled pot conditions with a single plant per pot, which may overestimate some variables such as evapotranspiration and salt accumulation. Future studies should validate these results under field conditions and evaluate the long-term effects of graywater irrigation on soil salinization and crop performance.

Author Contributions

Conceptualization, J.R.I.S., A.M.d.R.F.J., and E.S.; methodology, J.R.I.S., A.M.d.R.F.J., E.F.d.S., J.E.d.S.S., M.L.d.M.V.L., and G.B.J.; software, J.E.d.S.S. and E.F.d.S.; validation, A.M.d.R.F.J., J.B.N., and J.R.d.S.L.; formal analysis, J.R.I.S., A.C.D.A., and E.S.; investigation, J.R.I.S., M.L.d.M.V.L., and G.B.J.; resources, J.R.I.S., A.M.d.R.F.J., J.R.d.S.L., and E.S.; data curation, J.R.I.S., A.M.d.R.F.J., and J.R.d.S.L.; writing—original draft preparation, J.R.I.S. and E.F.d.S.; writing—review and editing, J.R.I.S., J.B.N., and M.L.d.M.V.L.; visualization, G.B.J., A.M.d.R.F.J., J.E.d.S.S., and A.C.D.A.; supervision, E.S., G.B.J., J.R.d.S.L., and A.C.D.A.; project administration, J.R.I.S., E.S., G.B.J., J.R.d.S.L., and A.C.D.A.; funding acquisition, A.M.d.R.F.J. and J.R.I.S. All authors have read and agreed to the published version of the manuscript.

Funding

This work was financed by Research Support Foundation of the State of Pernambuco—FACEPE, the National Council for Scientific and Technological Development—CNPq and National Observatory of Water and Carbon Dynamics in the Caatinga Biome—NOWCDCB.

Data Availability Statement

Data is contained within the article.

Acknowledgments

This work is part of the National Observatory of Water and Carbon Dynamics in the Caatinga Biome—NOWCDCB, supported by Research Support Foundation of the State of Pernambuco—FACEPE (Grant: APQ-0296-5.01/17; APQ-0498-3.07/17 NOWCDCB; APQ-0532-5.01/14) and National Council for Scientific and Technological Development—CNPq (Processes: 435508/2018-0; 312984/2017-0). In addition, the first author thanks FACEPE support for granting a Master’s scholarship (IBPG-1786-5.01/16). A.M.d.R.F.J. acknowledges support from the São Paulo Research Foundation—FAPESP grant 2023/05323-4. We thank the four anonymous reviewers for their valuable comments and suggestions, which helped us to improve the quality of the manuscript.

Conflicts of Interest

The authors declare no conflicts of interest.

Abbreviations

AWCavailable water content
DMdry matter
DMPdry matter production
ETevapotranspiration
ECseelectrical conductivity of the soil saturation extract
FCfield capacity
Na+soluble sodium
PWPpermanent wilting point
T1100% available water content without manure
T275% available water content without manure
T350% available water content without manure
T425% available water content without manure
T5100% available water content with manure
T675% available water content with manure
T750% available water content with manure
T825% available water content with manure
WUEwater use efficiency

References

  1. Qiu, Y.; Liu, C.; Du, L.; Jiang, X.; Yuan, D. Study on the safety of recycled water irrigation in arid, semiarid and underdeveloped areas: A case study in Qinghai Province. Irrig. Sci. 2024, 42, 769–783. [Google Scholar] [CrossRef]
  2. Chen, C.Y.; Wang, S.W.; Kim, H.; Pan, S.Y.; Fan, C.; Lin, Y.J. Non-conventional water reuse in agriculture: A circular water economy. Water Res. 2021, 199, 117193. [Google Scholar] [CrossRef]
  3. Erel, R.; Eppel, A.; Yermiyahu, U.; Ben-Gal, A.; Levy, G.; Ziporia, I.; Schaumann, G.E.; Mayer, O.; Daga, A. Long-term irrigation with reclaimed wastewater: Implications on nutrient management, soil chemistry and olive (Olea europaea L.) performance. Agric. Water Manag. 2019, 213, 324–335. [Google Scholar] [CrossRef]
  4. Menezes, L.A.N.; Mattos, A.T. Condutividade elétrica do solo em função da dose de aplicação de água residuária em áreas de fertirrigação. Rev. Eng. Agric. 2018, 26, 383–389. [Google Scholar] [CrossRef]
  5. Silva, J.R.; Souza, E.; Leite, M.L.D.; Barros Junior, G.; Sales, A.T.; Antonino, A.C. Gas exchange and millet phytomass under organic fertilization and graywater irrigation. Rev. Bras. Eng. Agríc. Ambient. 2022, 26, 111–118. [Google Scholar] [CrossRef]
  6. Farooq, M.; Hussain, M.; Allah, S.U.; Siddique, K.H.M. Physiological and agronomic approaches for improving water-use efficiency in crop plants. Agric. Water Manag. 2019, 219, 95–108. [Google Scholar] [CrossRef]
  7. Garcia-Cuerva, L.; Berglund, E.Z.; Binder, A.R. Public perceptions of water shortages, conservation behaviors, and support for water reuse in the US. Resour. Conserv. Recycl. 2016, 113, 106–115. [Google Scholar] [CrossRef]
  8. Schaer-Barbosa, M.; Santos, M.E.P.; Medeiros, Y.P. Viabilidade do reúso de água como elemento mitigador dos efeitos da seca no semiárido da Bahia. Ambiente Soc. 2014, 17, 17–32. [Google Scholar] [CrossRef][Green Version]
  9. Leong, J.Y.C.; Oh, K.S.; Poh, P.E.; Chong, M.N. Prospects of hybrid rainwater-greywater decentralised system for water recycling and reuse: A review. J. Clean. Prod. 2017, 142, 3014–3027. [Google Scholar] [CrossRef]
  10. Madzaramba, T.H.; Zanamwe, P. User perceptions and acceptance of treated greywater reuse in low-income communities: A narrative review. J. Water Clim. Change 2023, 14, 4236–4244. [Google Scholar] [CrossRef]
  11. Cirilo, J.A.; Montenegro, S.M.; Campos, J.N.B. The issue of water in the Brazilian semi-arid region. In Waters of Brazil: Strategic Analysis; Springer Nature: Berlin, Germany, 2017; pp. 59–71. [Google Scholar]
  12. Nicolau Sobrinho, W.; Santos, R.V.; Menezes Júnior, J.C.; Souto, J.S. Acúmulo de nutrientes nas plantas de milheto em função da adubação orgânica e mineral. Rev. Caatinga 2009, 22, 107–110. [Google Scholar]
  13. Casaroli, D.; Jong Van Lier, Q. Critérios para determinação da capacidade de vaso. Rev. Bras. Ciênc. Solo 2008, 32, 59–66. [Google Scholar] [CrossRef]
  14. Detmann, E.; Souza, M.A.; Valadares Filho, S.C.; Queiroz, A.C.; Berchielli, T.T.; Saliba, E.O.; Cabral, L.S.; Pina, D.S.; Ladeira, M.M.; Azevedo, J.A.G. Métodos Para Análise de Alimentos, 1st ed.; Suprema: Visconde do Rio Branco, Brazil, 2012. [Google Scholar]
  15. Freire, M.B.G.S.; Pessoa, L.G.M.; Gheyi, H.R. Métodos de análises químicas para solos salinos. In Manejo da Salinidade na Agricultura: Estudos Básicos E Aplicados, 2nd ed.; Ghey, H.R., da Silva Dias, N., de Lacerda, C.F., Filho, E.G., Eds.; INCTSal: Fortaleza, Brazil, 2016; pp. 489–501. [Google Scholar]
  16. R Core Team. R: A Language and Environment for Statistical Computing; R Foundation for Statistical Computing: Vienna, Austria, 2013; Available online: https://www.R-project.org/ (accessed on 23 February 2025).
  17. Affholder, F. Effect of organic matter input on the water balance and yield of millet under tropical dryland condition. Field Crops Res. 1995, 41, 109–121. [Google Scholar] [CrossRef]
  18. Ghatak, A.; Chaturvedi, P.; Nagler, M.; Roustan, V.; Lyon, D.; Bachmann, G.; Postl, W.; Schröfl, A.; Desai, N.; Varshney, R.K.; et al. Comprehensive tissue-specific proteome analysis of drought stress responses in Pennisetum glaucum (L.) R. Br. (pearl millet). J. Proteom. 2016, 143, 122–135. [Google Scholar] [CrossRef]
  19. Al-Solaimani, S.G.; Alghabari, F.; Ihsan, M.Z.; Fahad, S. Water deficit irrigation and nitrogen response of Sudan grass under arid land drip irrigation conditions. Irrig. Drain. 2017, 66, 365–376. [Google Scholar] [CrossRef]
  20. Rodríguez, C.; Sánchez, R.; Rebolledo, N.; Schneider, N.; Serrano, J.; Leiva, E. Life cycle assessment of greywater treatment systems for water-reuse management in rural areas. Sci. Total Environ. 2021, 795, 148687. [Google Scholar] [CrossRef]
  21. Uppal, R.K.; Wani, S.P.; Garg, K.K.; Alagarswamy, G. Balanced nutrition increases yield of pearl millet under drought. Field Crops Res. 2015, 177, 86–97. [Google Scholar] [CrossRef]
  22. Rostamza, M.; Chaichi, M.R.; Jahansouz, M.R.; Alimadadi, A. Forage quality, water use and nitrogen utilization efficiencies of pearl millet (Pennisetum americanum L.) grown under different soil moisture and nitrogen levels. Agric. Water Manag. 2011, 98, 1607–1614. [Google Scholar] [CrossRef]
  23. Duarte, H.F.H.; Souza, E.R. Soil water potentials and Capsicum annuum L. under salinity. Rev. Bras. Ciênc. Solo 2016, 40, e0150220. [Google Scholar] [CrossRef]
  24. Gondal, A.H.; Tampubolon, K.; Toor, M.D.; Ali, M. Pragmatic and fragile effects of wastewater on a soil–plant–air continuum and its remediation measures: A perspective. Rev. Agric. Sci. 2021, 9, 249–259. [Google Scholar] [CrossRef] [PubMed]
  25. Comas, L.; Trout, T.J.; DeJonge, K.C.; Zhang, H.; Gleason, S.M. Water productivity under strategic growth stage-based deficit irrigation in maize. Agric. Water Manag. 2019, 212, 433–440. [Google Scholar] [CrossRef]
  26. Vadez, V.; Kholová, J.; Yadav, R.S.; Hash, C.T. Small temporal differences in water uptake among varieties of pearl millet (Pennisetum glaucum (L.) R. Br.) are critical for grain yield under terminal drought. Plant Soil 2013, 371, 447–462. [Google Scholar] [CrossRef]
  27. Beggi, F.; Falalou, H.; Buerkert, A.; Vadez, V. Tolerant pearl millet (Pennisetum glaucum (L.) R. Br.) varieties to low soil P have higher transpiration efficiency and lower flowering delay than sensitive ones. Plant Soil 2015, 389, 89–108. [Google Scholar] [CrossRef][Green Version]
  28. Ribeiro, M.R.; Ribeiro Filho, M.R.; Jacomine, P.K.T. Origem e classificação dos solos afetados por sais. In Manejo da Salinidade na Agricultura: Estudos Básicos e Aplicados, 2nd ed.; Gheyi, H.R., Dias, N.S., Lacerda, C.F., Gomes Filho, E., Eds.; INCTSal: Fortaleza, Brazil, 2016; pp. 9–15. [Google Scholar]
  29. Silva, J.R.I.; Jardim, A.M.R.F.; Barroso Neto, J.; Leite, M.L.M.V.; Teixeira, V.I. Estresse salino como desafio para produção de plantas forrageiras. Pesqui. Apl. Agrotecnol. 2018, 11, 127–139. [Google Scholar] [CrossRef]
  30. Ben-Gal, A.; Beiersdorf, I.; Yermiyahu, U.; Soda, N.; Presnov, E.; Zipori, I.; Crisostomo, R.R.; Dag, A. Response of young bearing olive trees to irrigation-induced salinity. Irrig. Sci. 2017, 35, 99–109. [Google Scholar] [CrossRef]
  31. Tal, A. Rethinking the sustainability of Israel’s irrigation practices. Water Res. 2016, 90, 387–394. [Google Scholar] [CrossRef] [PubMed]
  32. Corwin, D.L. Climate change impacts on soil salinity in agricultural areas. Eur. J. Soil Sci. 2021, 72, 842–862. [Google Scholar] [CrossRef]
  33. Oliveira, A.M.; Dias, N.S.; Gurgel, G.C.S.; Rabelo, L.N.; Melo, M.R.S.; Santos, M.V. Impactos físico-químicos do descarte de rejeito salino em Neossolo e Chernossolo do oeste potiguar, Brasil. Irriga 2018, 23, 413–425. [Google Scholar] [CrossRef]
  34. Amorim, T.L.; Santos, H.R.B.; Neto, J.B.; Herminio, P.J.; Silva, J.R.I.; Silva, M.M.A.; Simões, A.N.; Souza, E.; Ferreira-Silva, S.L. Resistant rootstocks mitigate ionic toxicity with beneficial effects for growth and photosynthesis in grapevine grafted plants under salinity. Sci. Hortic. 2023, 317, 112053. [Google Scholar] [CrossRef]
  35. Gao, Y.; Shao, G.; Wu, S.; Xiaojun, W.; Lu, J.; Cui, J. Changes in soil salinity under treated wastewater irrigation: A meta-analysis. Agric. Water Manag. 2021, 255, 106986. [Google Scholar] [CrossRef]
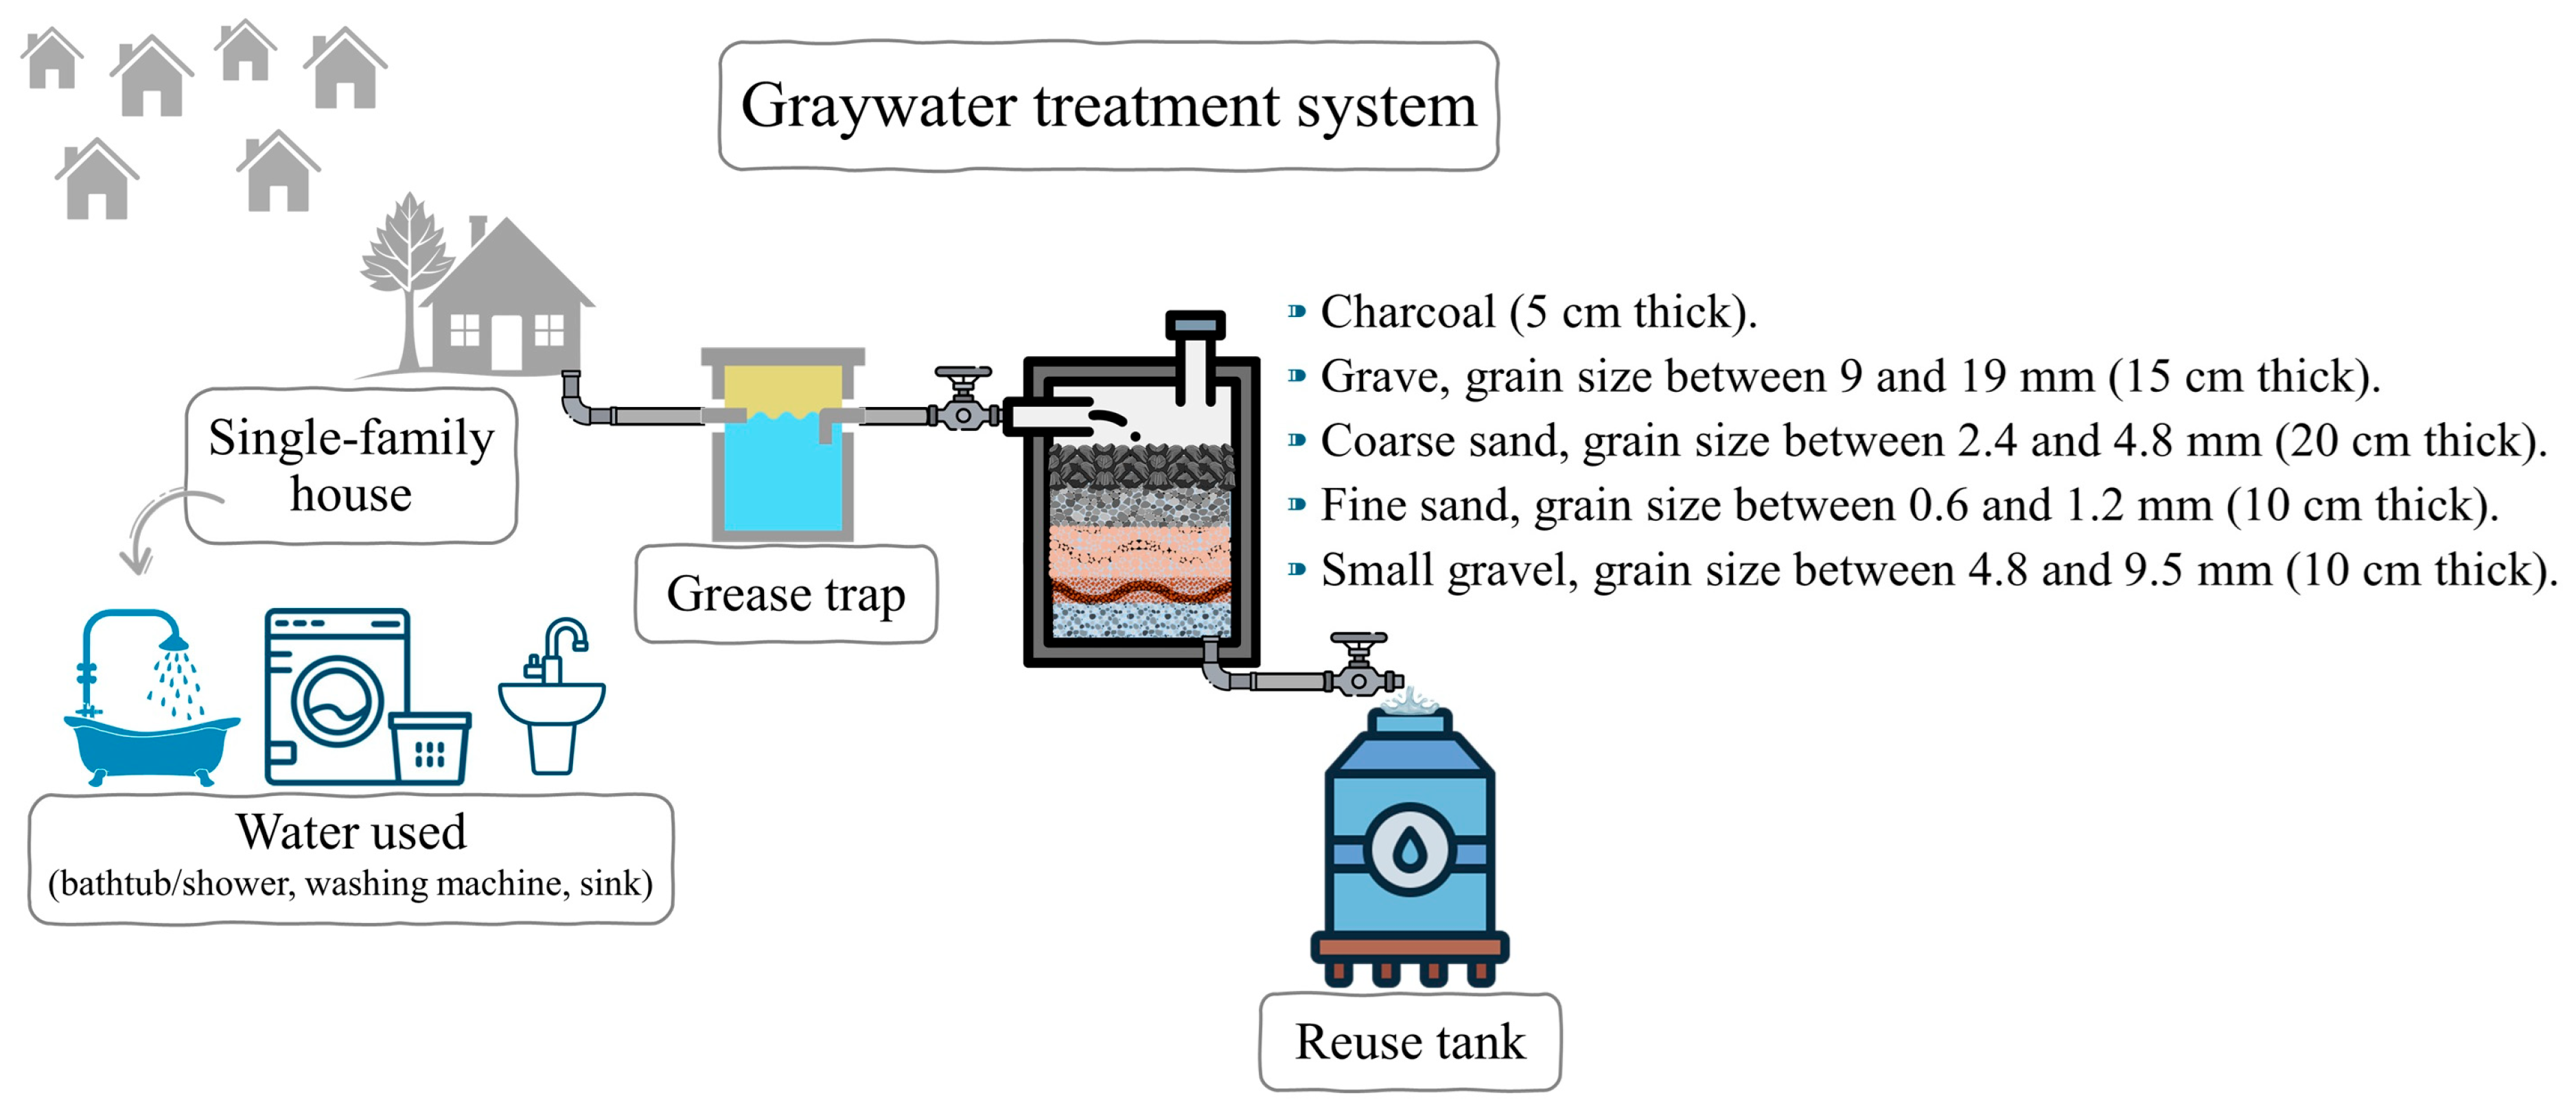
Figure 1. Illustration of the wastewater (graywater) filtration system installed by the Non-Governmental Organization Diaconia in rural residential areas in the semiarid region of Pernambuco, Brazil.
Applsci 15 09612 g001
Figure 2. Dry matter phytomass production of millet with organic fertilization of 34 mg ha−1 with (a) and without (b) 34 Mg ha−1 organic fertilization as a function of available soil water. Dots represent the mean values of three replicates; vertical bars indicate the standard deviation.
Applsci 15 09612 g002
Figure 3. Dynamics of accumulated (a) and development phase (b) evapotranspiration in irrigated millet with varying soil water levels and fertilization (without and with 34 Mg ha−1 of bovine manure). Treatments: T1—100% AWC without manure; T2—75% AWC without manure; T3—50% AWC without manure; T4—25% AWC without manure; T5—100% AWC with manure; T6—75% AWC with manure; T7—50% AWC with manure; T8—25% AWC with manure; T9—control. The error bars represent the standard deviation. DAT—days after treatment. Means followed by the same letter do not differ by the Tukey test at 5%.
Applsci 15 09612 g003
Figure 4. Water use efficiency (WUE) of millet irrigated with wastewater, varying soil available water content (AWC), and fertilization (without and with 34 mg ha−1 of bovine manure). Treatments: T1—100% AWC without manure; T2—75% AWC without manure; T3—50% AWC without manure; T4—25% AWC without manure; T5—100% AWC with manure; T6—75% AWC with manure; T7—50% AWC with manure; T8—25% AWC with manure; T9—control. Vertical bars indicate standard deviation. Means followed by the same letter do not differ by the Tukey test at 5%.
Applsci 15 09612 g004
Figure 5. Increase in evapotranspiration and plant dry matter of pearl millet irrigated with wastewater, without (a) and with (b) the application of 34 Mg ha−1 of cattle manure, using 25% of the available soil water as the reference level. Means followed by the same uppercase letter do not differ for evapotranspiration increase according to Tukey’s test at a 5% significance level; means followed by the same lowercase letter do not differ for plant dry matter increase. The error bars represent the standard deviation.
Applsci 15 09612 g005
Figure 6. Electrical conductivity of soil saturation extract (ECse) (a) and soil soluble sodium (b) in millet-grown soil irrigated with wastewater at different soil available water content (AWC) levels, without and with 34 Mg ha−1 bovine manure fertilization. Treatments: T1—100% AWC without manure; T2—75% AWC without manure; T3—50% AWC without manure; T4—25% AWC without manure; T5—100% AWC with manure; T6—75% AWC with manure; T7—50% AWC with manure; T8—25% AWC with manure; T9—control. Vertical bars indicate the mean standard deviation. Means with the same letter do not differ by LSD test at 5% significance.
Applsci 15 09612 g006
Figure 7. Regression between evapotranspiration and electrical conductivity of soil saturation extract—ECse (a), and regression between evapotranspiration and soil soluble sodium (b). Treatments: T1—100% AWC without manure; T2—75% AWC without manure; T3—50% AWC without manure; T4—25% AWC without manure; T5—100% AWC with manure; T6—75% AWC with manure; T7—50% AWC with manure; T8—25% AWC with manure; T9—control. AWC—available water content of the soil.
Applsci 15 09612 g007
Table 1. Chemical analysis of urban water supply (UW) and wastewater (WW) used for millet irrigation.
ElementUWWWElementUWWW
Calcium (mmol L−1)0.642.20Chlorides (mmol L−1)0.609.60
Magnesium (mmol L−1)0.480.68Copper (mg L−1)0.040.06
Sodium (mmol L−1)0.3217.04Iron (mg L−1) 0.080.08
Potassium (mmol L−1)0.070.46Manganese (mg L−1)0.030.05
Carbonate (mmol L−1)0.000.24Zinc (mg L−1)0.050.05
Bicarbonate (mmol L−1)0.404.00Power of hydrogen (pH)7.207.75
Sulfates (mmol L−1)0.040.17Electric conductivity (dS m−1)0.200.98
SAR0.278.69 Water classificationC1S1C3S2
SAR—sodium adsorption ratio. Classification regarding the risk of salinization and sodification.
Disclaimer/Publisher’s Note: The statements, opinions and data contained in all publications are solely those of the individual author(s) and contributor(s) and not of MDPI and/or the editor(s). MDPI and/or the editor(s) disclaim responsibility for any injury to people or property resulting from any ideas, methods, instructions or products referred to in the content.