1. Introduction
Amid accelerating globalization, China’s ethnic regions have become key nodes in global sustainability networks due to their unique biocultural richness. First, their indigenous cultures and traditional ecological knowledge are a living archive for global cultural diversity and sustainable development. Their genetic reservoirs and long-standing management practices support international biodiversity conservation. Second, southwestern China’s ethnic areas, located in a major biodiversity hotspot, are crucial for global ecological security. Conservation here affects biogeochemical cycles and climate regulation globally. Meanwhile, these regions have developed models integrating poverty alleviation and ecological stewardship, providing replicable blueprints for the global south.
Amid rapid modernization, ethnic regions in Sichuan Province confront intertwined economic, social, and environmental challenges [
1,
2]. Economically, the low per capita GDP, a single industrial structure, underdeveloped infrastructure, and persistent brain drain have jointly constrained the growth potential. Socially, public services—education, health care, and employment—remain inadequate, while traditional cultures are eroded by dominant modern norms. Ecologically, fragile landscapes are increasingly stressed by the intensifying trade-off between resource extraction and conservation.
To address multifaceted challenges, it is crucial to adopt a holistic approach that integrates economic, social, and environmental dimensions. The traditional focus solely on economic growth tends to lead to social inequalities and environmental degradation, underscoring the need for a comprehensive framework [
3]. The economy–society–environment (ESE) model provides a comprehensive framework that can address the relevant dimensions simultaneously. This model holds that economic prosperity is important, but it should be achieved while ensuring social equity and environmental sustainability [
4]. This study selects the ESE model because it can provide a holistic perspective to capture the complex interactions between the economy, society, and environment in a region. By analyzing the coupled coordination relationships and driving mechanisms of the ESE system, it is possible to identify pathways for sustainable development, which can promote economic growth while maintaining social cohesion and environmental integrity. The ESE model can integrate multiple indicators and data sources, facilitating the understanding of the spatiotemporal patterns and driving factors of sustainable development, which is of great significance to ethnic regions.
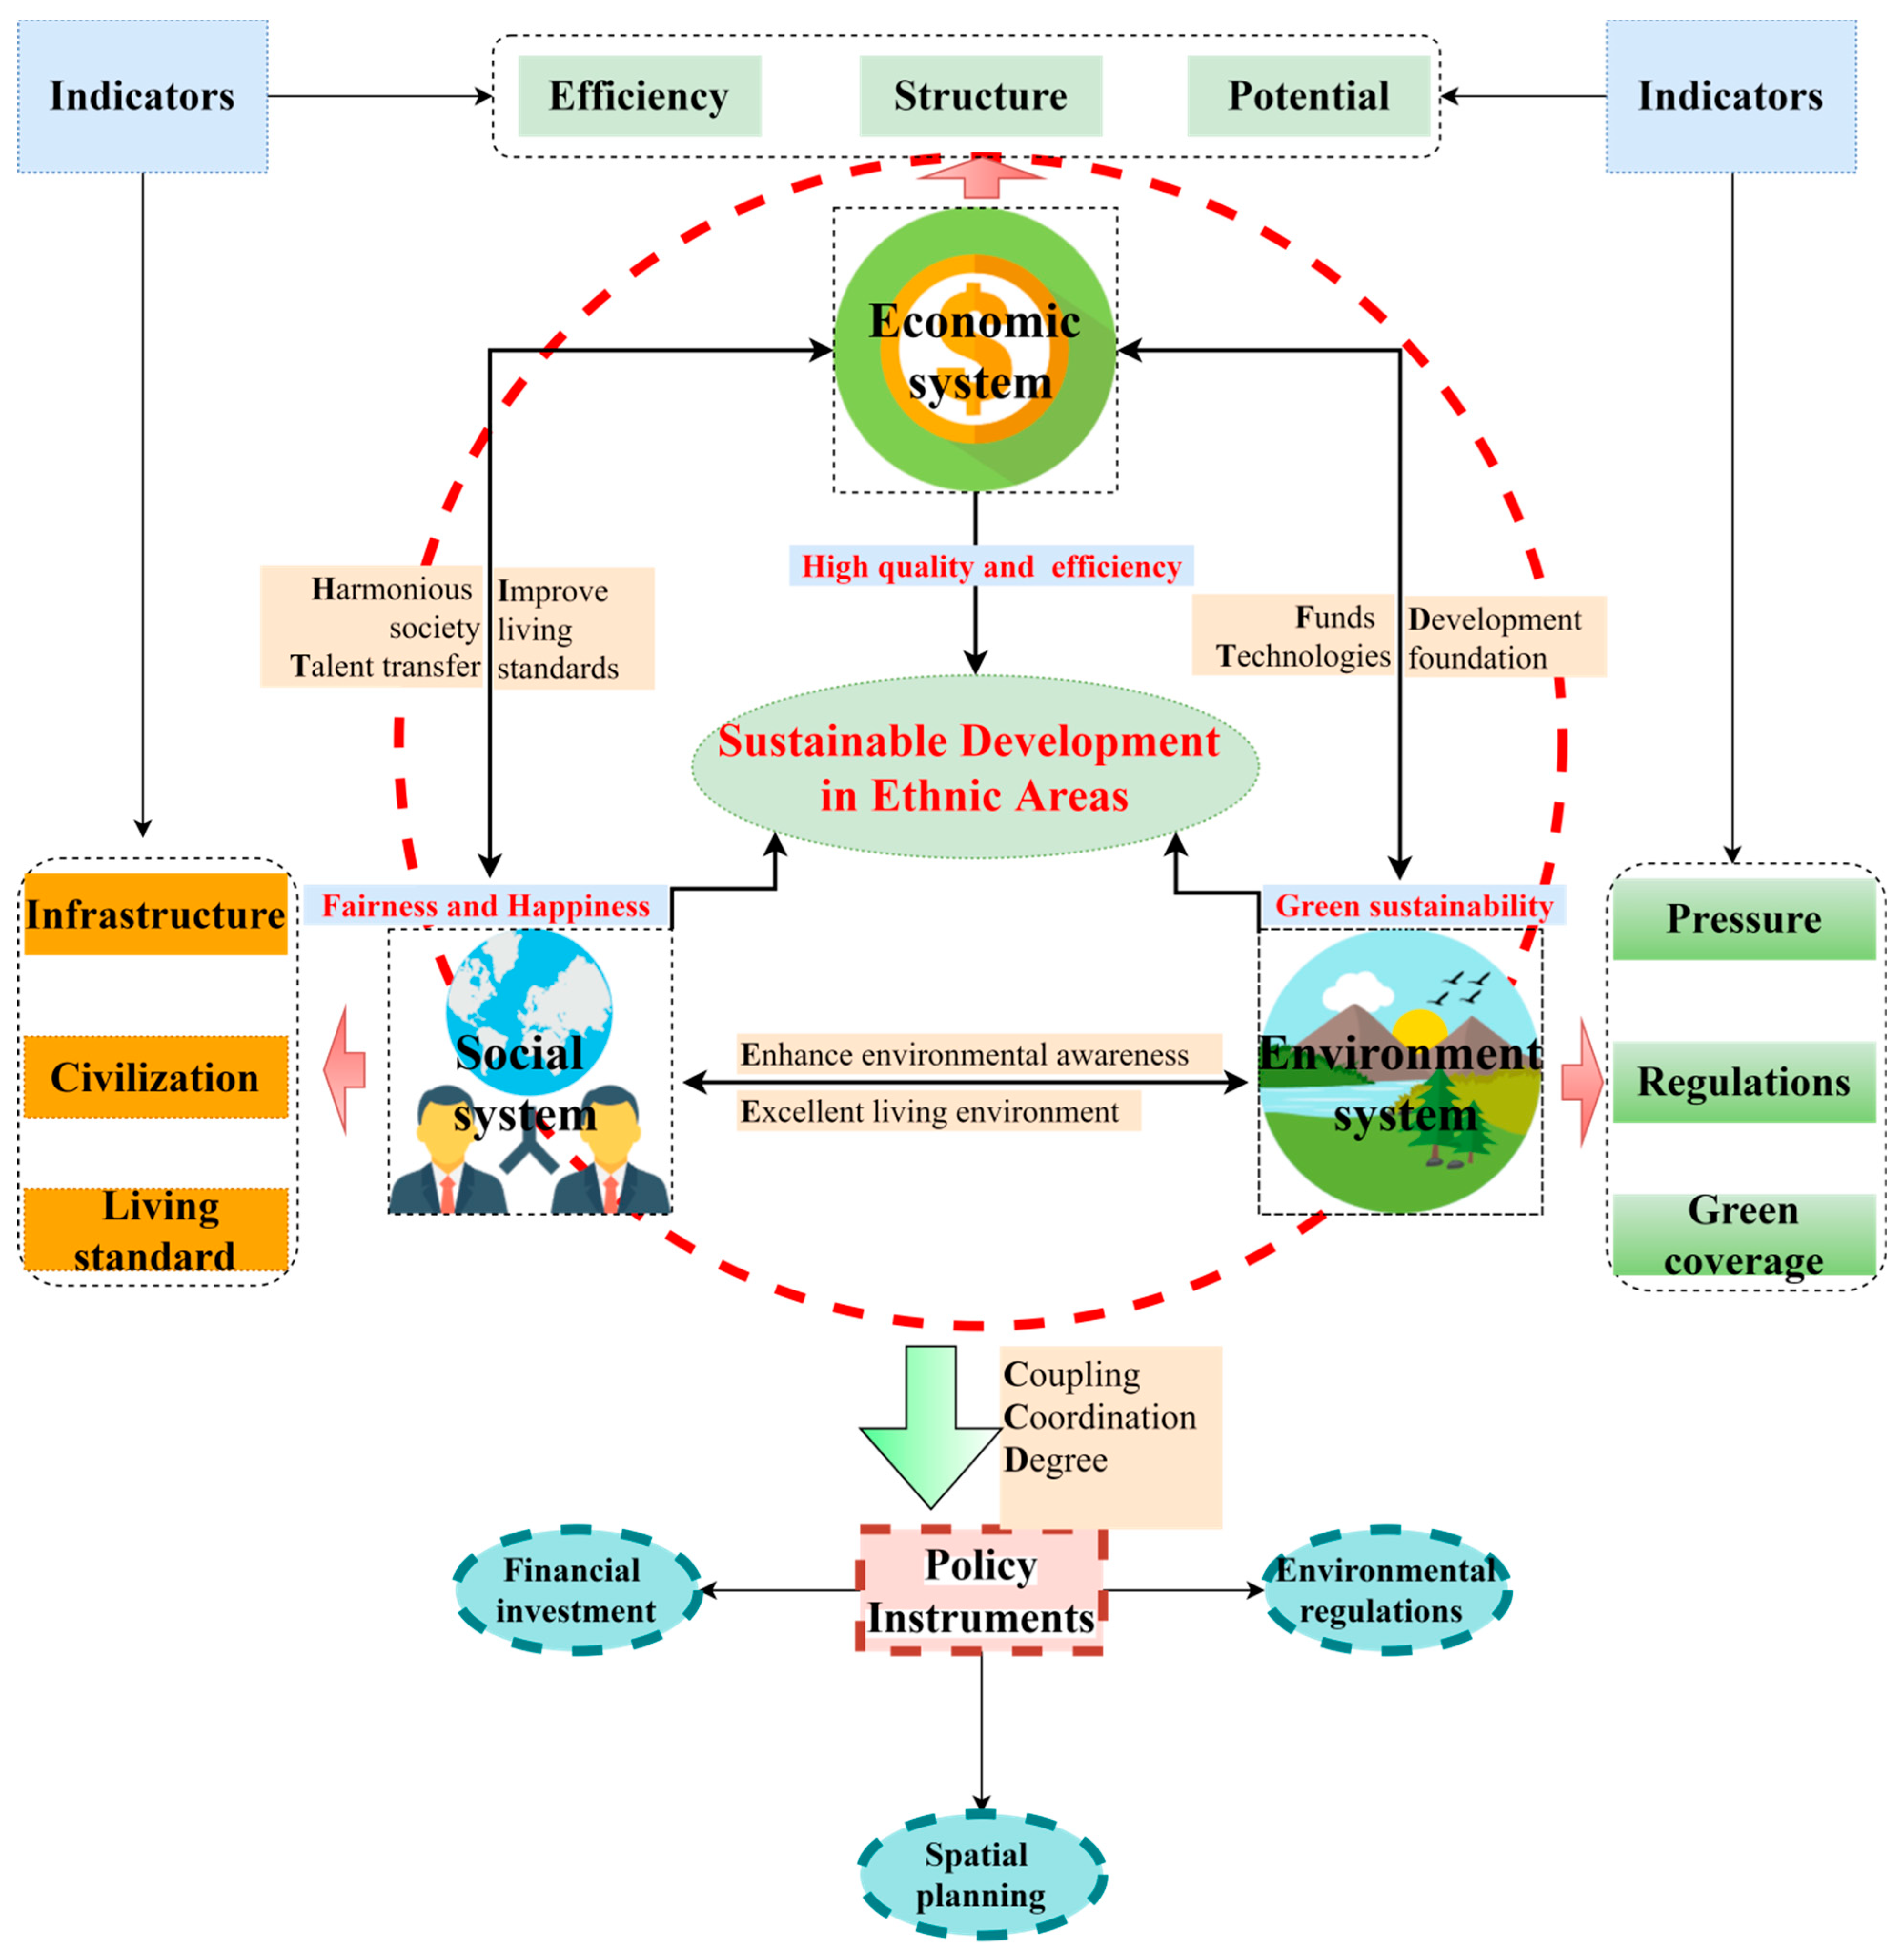
Consequently, regional development should go beyond GDP-centric models and pursue integrated sustainability by combining economic growth, social progress, and environmental protection. In this framework, the environment is the foundation that provides resources and ecosystem services; the economy enables the generation of material means for social welfare and environmental management; society mediates the feedback between economic and environmental subsystems, promoting synergy. The following sections empirically analyze the status, deficits, and determinants of the economy–society–environment nexus in Sichuan’s ethnic counties. More importantly, on the basis of the economic–environment–society coupling framework, this study constructs a conceptual framework of “policy tools→ economic/social/environmental leverage→ subsystem indicators→ coupling and coordination results” to guide the realization of sustainable development in ethnic minority areas (
Figure 1).
2. Literature Review
At the macro scale, a broad scholarly consensus holds that the economic, social, and environmental subsystems are interdependent and mutually constraining; their degree of coupling coordination critically determines the trajectory of regional sustainable development [
5,
6]. Empirical evidence indicates that in many developing economies, distorted industrial structures and low resource-use efficiency allow rapid GDP growth to be achieved only through severe ecological degradation and heightened social tensions, yielding persistently low coupling coordination levels among the three subsystems. By contrast, developed economies, by leveraging advanced technologies and robust governance frameworks, have more coupling coordination fully achieve synchronized progress across the economic, social, and environmental dimensions [
7].
Focusing on China, with the advancement of the regional coordinated development strategy, the coupling coordination trends across different regions have shown significant differences. Benefiting from advantages such as a solid economic foundation, strong environmental protection awareness, and abundant social resources, the eastern coastal regions have taken a relatively leading position in terms of coupling coordination degree. Although the central and western regions started relatively late, their coupling coordination degree has steadily improved by virtue of policy support and the conversion of resource advantages [
8]. Nevertheless, the internal disparities within these regions are still quite prominent. When delving into regional disparities, extant studies predominantly concentrate on macro-level descriptions, lacking in-depth exploration of the specific internal mechanisms within regions. Existing research on the coupling coordination of economic, social, and environmental systems can be generally classified into two research directions.
The first direction examines the bilateral relationship between the economic and environmental subsystems. At the national level, Sueyoshi et al. (2021) [
9] and Hoang et al. (2024) [
10] illustrate that the coupling coordination between economic growth and environmental change are prerequisites for sustainable development. Although these macro-level findings provide strategic guidance, their applicability for micro-level policy formulation is restricted. In contrast, Li et al. (2020) [
11] investigated the coupling coordination between the resource-based economy and the environment in Northeast China, indicating that an expanding gap between economic performance and environmental quality reduces the coupling coordination levels. Li et al. (2022) [
12] confirmed this view through a national-scale sample of resource-dependent cities, emphasizing that city-level analyses have greater policy relevance for formulating replicable development strategies. Furthermore, delving into the relationship between a city’s economic development and its ecological environment from a more micro-level industrial viewpoint will further enrich the coordination theory of the economic–environment system. For instance, Lee and Chen (2021) [
13] incorporated the tourism industry into the ecological–economic framework and hypothesized that the unregulated growth of tourism would augment the ecological footprint and consequently elevate the economic risks of the nation.
Secondly, in relation to the coupling coordination of the integrated economic–social–environmental (ESE) system, the dominance of the sustainable-development paradigm has steered academic attention towards the three subsystems as an inseparable entity that mutually constrains and reinforces each other [
14]. Yuan et al. (2023) [
15] investigated the interrelationships within the complex economy–ecology–society (EES) system through the construction of an indicator system and discovered that the enhancement of the coupling coordination degree notably expedites the process of regional sustainable development. Among these elements, technological innovation is considered a crucial impetus for promoting the coordinated development of the three systems [
16]; the maturation of new-energy technologies not only decarbonizes the energy structure and mitigates environmental deterioration but also creates employment opportunities and spurs economic growth. However, existing studies mostly focus on the direct impact of technology, while insufficiently analyzing its mechanism of action within the social system and the synergistic effects among the three systems [
17]. Particularly in ethnic regions, technology promotion faces challenges such as high initial costs and technical barriers, which restrict the potential of technological innovation in driving regional coordinated development. Complementary policy tools, such as well-formulated tax incentives and targeted subsidies, guide corporate behavior towards green transitions and redirect social capital towards environmental protection [
18]. Spatially, however, the coupling coordination trajectories exhibit significant disparities across regions [
19]. Coastal megacities, equipped with abundant capital and advanced technologies, have successfully pioneered low-carbon development paths. Conversely, inland and less developed regions are still caught in a significant trade-off dilemma between accelerating economic growth and protecting ecological integrity [
20].
Sustainable development within China’s ethnic regions is intrinsically intricate. These regions, predominantly located in border areas or rugged inland mountainous terrains, are characterized by deeply-rooted poverty. Consequently, economic progress serves as an essential cornerstone for any feasible sustainability strategy [
21]. Furthermore, the complex cultural diversity and significant developmental disparities among ethnic regions can easily lead to social instability. Thus, inclusive social development emerges as a crucial factor influencing their long-term sustainability [
22]. Environmental sustainability represents both the fundamental prerequisite and the dynamic outcome of economic and social development in China’s ethnic regions. Its state is continuously reshaped by the stage-specific development paths and capabilities of the economic and social subsystems [
23]. Therefore, an integrated assessment encompassing economic, social, and environmental dimensions is essential for understanding the sustainable development trajectories of ethnic regions.
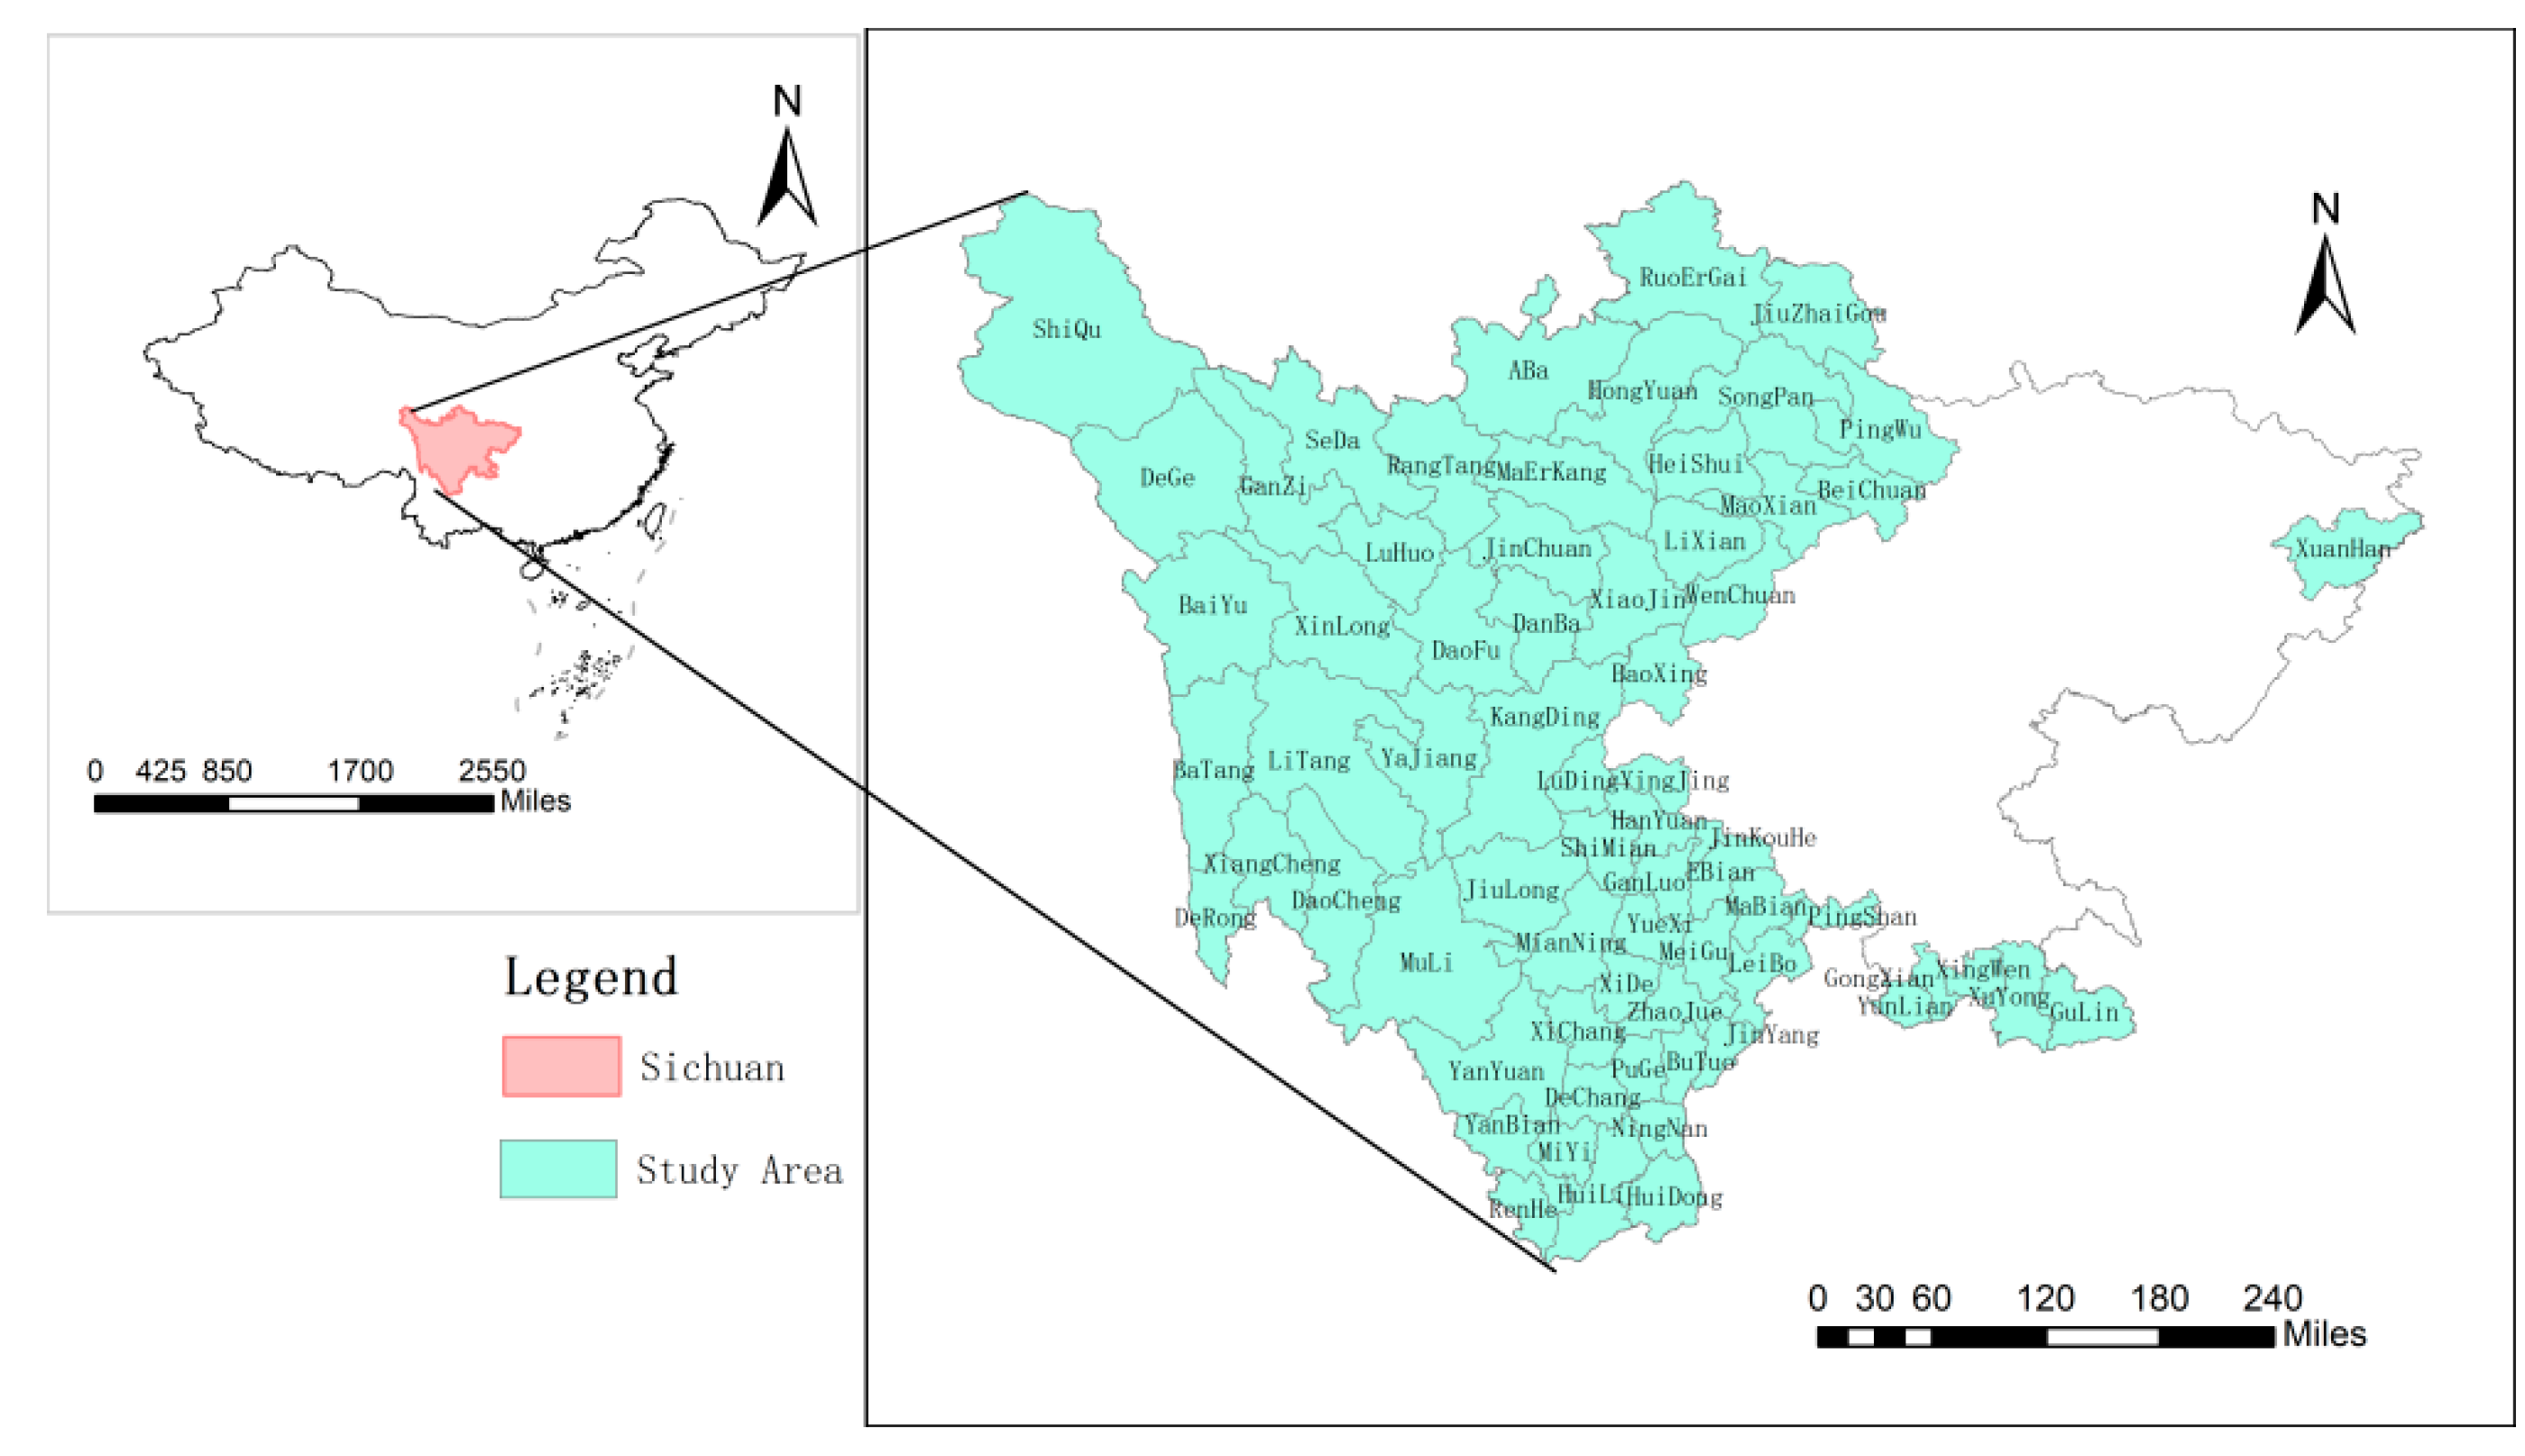
However, existing studies present two prominent limitations. Firstly, methodological oversimplification, manifested in the use of static indicators, limited weighting methods, and coarse data aggregation, undermines the accuracy and reliability of the derived conclusions. Secondly, micro-level, long-term dynamic processes and their underlying determinants, especially in the ethnic counties of Sichuan Province, remain significantly under-investigated. Adopting a systems-theory perspective and integrating multiple analytical methods with newly compiled multi-dimensional panel data, this research undertakes a micro-level, long-term examination of the coupled and coordinated evolution of the economic–social–environmental (ESE) nexus across all ethnic counties in Sichuan Province and elucidates its key driving mechanisms. By rectifying the methodological simplicity and data deficiencies identified in prior studies, this paper aims to offer solid evidence for sustainable development policy formulation.
This study’s anticipated marginal contributions are twofold:
(1) Theoretical contribution: The study enhances the sustainable development theory for ethnic regions by expanding the analytical scope of ESE coupling research to a highly detailed, long-term scale. The case of Sichuan enriches the global evidence repository and provides a transferable framework for ethnic regions globally.
(2) Policy contribution: The findings will guide evidence-based policies that concurrently promote economic prosperity, social stability, and ecological integrity in ethnic areas, thus integrating Chinese experiences into the global pursuit of the SDGs.
4. Results
4.1. Evaluation Index System
Based on the sustainable development framework for ethnic areas proposed in this paper (
Figure 1), an economic–environment–social system evaluation index system was constructed (
Table 3). The majority of indicators are sourced from the annual Sichuan Statistical Yearbooks, the Annual Statistical Bulletins published by the Sichuan Provincial Bureau of Statistics, the Statistical Bulletins of the Aba Tibetan and Qiang Autonomous Prefecture, and the Honghei Population Database. Spatially oriented indicators were derived through Kriging interpolation techniques and area-based statistical aggregation.
First, the economic subsystem is composed of three key dimensions: efficiency, structure, and potential. Economic development efficiency is measured by the economic growth rate, unemployment rate, and the urban–rural income gap. The economic growth rate serves as a critical indicator of regional economic vitality and reflects the development speed and quality in ethnic areas; a higher growth rate signifies stronger resource mobilization and transformation capabilities. The unemployment rate indicates the stability of the labor market, particularly in ethnic regions, where industries such as tourism, new ecological agriculture, and light industry play a crucial role in absorbing labor. This indicator is positively correlated with economic development efficiency. The urban–rural income gap reflects the level of coordinated regional development. Given that ethnic areas often face pronounced urban–rural disparities, a moderate reduction in this gap contributes to the formation of a sustainable and inclusive growth model, thereby enhancing economic development efficiency. Economic development structure is quantified through GDP total, fixed asset investment, and the output value of the tertiary industry. GDP total reflects the overall economic scale and structural stability. Fixed asset investment represents capital formation and future growth potential, indicating the capacity for structural adjustment in ethnic regions. The output value of the tertiary industry reflects the modernization level of the industrial structure and signals economic upgrading. Economic development potential is assessed using two indicators: the number of patents per 10,000 people and the number of registered enterprises. The number of patents per 10,000 people measures innovation capacity; given the relatively low levels of scientific and technological investment in ethnic areas, this indicator is particularly useful for evaluating transformation potential. The number of registered enterprises reflects market dynamism and the quality of the entrepreneurial environment, serving as a proxy for factors such as business environment and market diversity.
Second, based on the provided image depicting the classification framework of social indicators, the social subsystem can be systematically structured into three core dimensions, infrastructure, civilization, and living standards, each comprising specific measurable variables. The infrastructure dimension encompasses four key indicators: (1) road mileage, which serves as a critical proxy for regional connectivity and transportation accessibility, particularly vital for overcoming geographical constraints in ethnic minority areas; (2) total postal and telecommunications services, reflecting the development level of communication infrastructure essential for modern socioeconomic activities; (3) gas coverage rate, an indicator of energy infrastructure modernization and urban living convenience; and (4) number of hospital beds per 10,000 population, a direct measure of healthcare resource allocation and equitable public service provision. The civilization dimension evaluates societal progress through two components: (1) proportion of population with higher education, which quantifies human capital development and intellectual advancement in ethnic regions, and (2) per capita cultural facility area, a metric for cultural preservation efforts and their role in fostering social cohesion and collective identity. Lastly, the living standards dimension integrates two economic welfare indicators: (1) urban disposable income per capita, a central metric for assessing household economic capacity and livelihood quality, and (2) urban household consumption expenditure, which directly captures consumption patterns and material living conditions.
Third, the environmental protection subsystem comprises three dimensions, pressure, regulation, and green coverage, each operationalized through specific indicators. The pressure dimension evaluates environmental burdens via two metrics: (1) pollution load index, a composite measure of regional environmental stress, and (2) the rate of harmless disposal of domestic garbage, which reflects urban sanitation management efficacy and waste treatment pressures. These indicators collectively capture anthropogenic impacts on ecosystems. Under the regulation dimension, governance effectiveness is assessed through (1) annual variation rate of PM2.5 concentration, a direct proxy for air quality improvement, particularly salient in resource-dependent ethnic regions where industrial emission controls hinge on regulatory rigor; and (2) the rate of surface water quality reaching the standard, which gauges compliance with national water quality benchmarks and the success of hydrological monitoring policies. Together, these metrics quantify the outcomes of environmental governance frameworks. The green coverage dimension integrates ecological vitality with urban sustainability: (1) vegetation coverage index (e.g., NDVI) measures regional ecological resilience and bioproductivity, while (2) urban per capita green area underscores the role of green infrastructure in enhancing livability and mitigating urban environmental degradation.
This tripartite structure—spanning pressure drivers (causes), regulatory responses (interventions), and green coverage (outcomes)—provides a systemic lens to analyze environmental performance. The inclusion of directional symbols (e.g., +/−) for indicators in the original table further suggests their hypothesized relationships with broader sustainability goals, enabling hypothesis testing in policy-relevant research.
4.2. Calculation Results of Non-Statistical Data
4.2.1. County-Level Vegetation Overjet Index
In accordance with Xiong et al. (2022) [
32], the study utilized the ERDN and TRA frameworks to produce 10 m resolution enhancements for Landsat bands (Blue, Green, Red, and NIR) while minimizing inter-sensor reflectance discrepancies, with achieved accuracies surpassing 95%. Specifically, the pretrained model parameters and TRA algorithm library from that work were integrated into our workflow via the Earth Engine Python3.8 API to process GEE datasets locally. By applying this pipeline, Landsat 7 ETM+ (2005–2013) and Landsat 8 OLI (2013–2017) data were elevated to Sentinel-2 L2A-equivalent fidelity, yielding an “Enhanced Sentinel” dataset suitable for reliable NDVI and DBSI analyses.
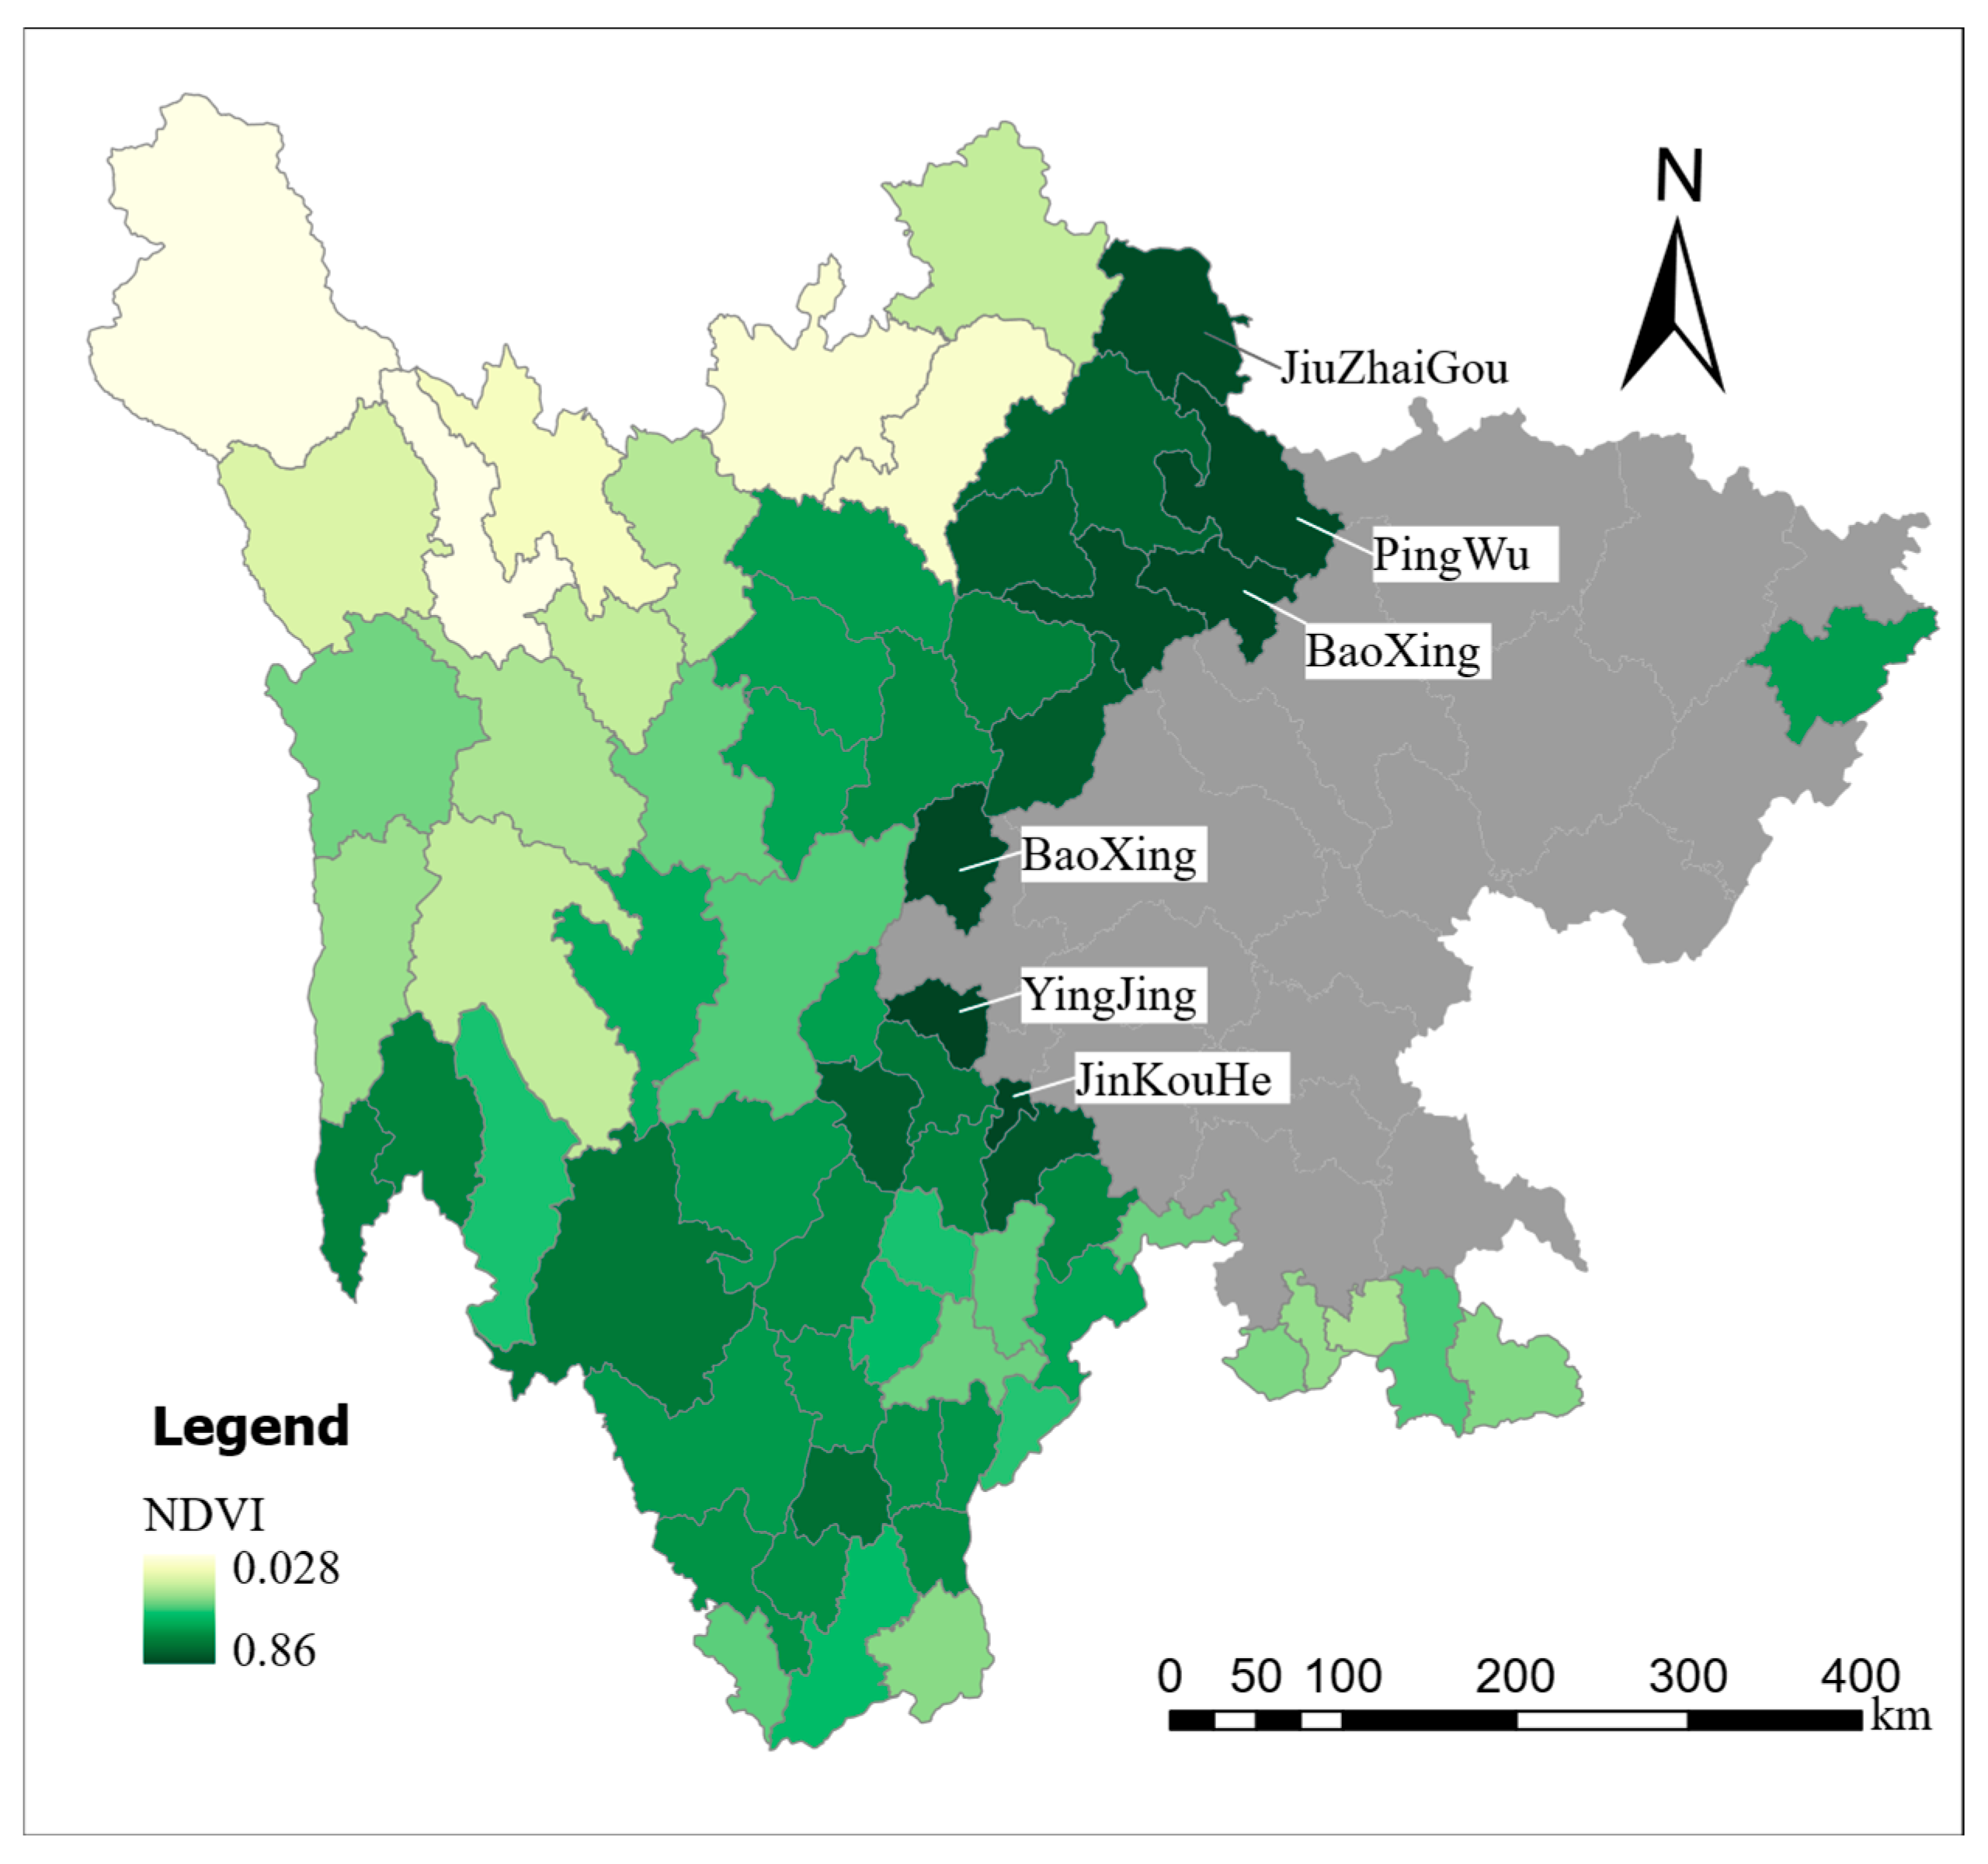
Using “Enhanced Sentinel” data from 2005 to 2024 in Google Earth Engine, calculate the annual Normalized Difference Vegetation Index (NDVI) for the entire study area. Then, use the ZonalStatistics function in ArcPy to compute the annual average NDVI for each county, with the statistics_type parameter set to MEAN. Taking 2024 as an example, the calculated NDVI values for each county are shown in
Figure 3, with six counties having NDVI values exceeding 0.8.
4.2.2. County-Level Highway Mileage
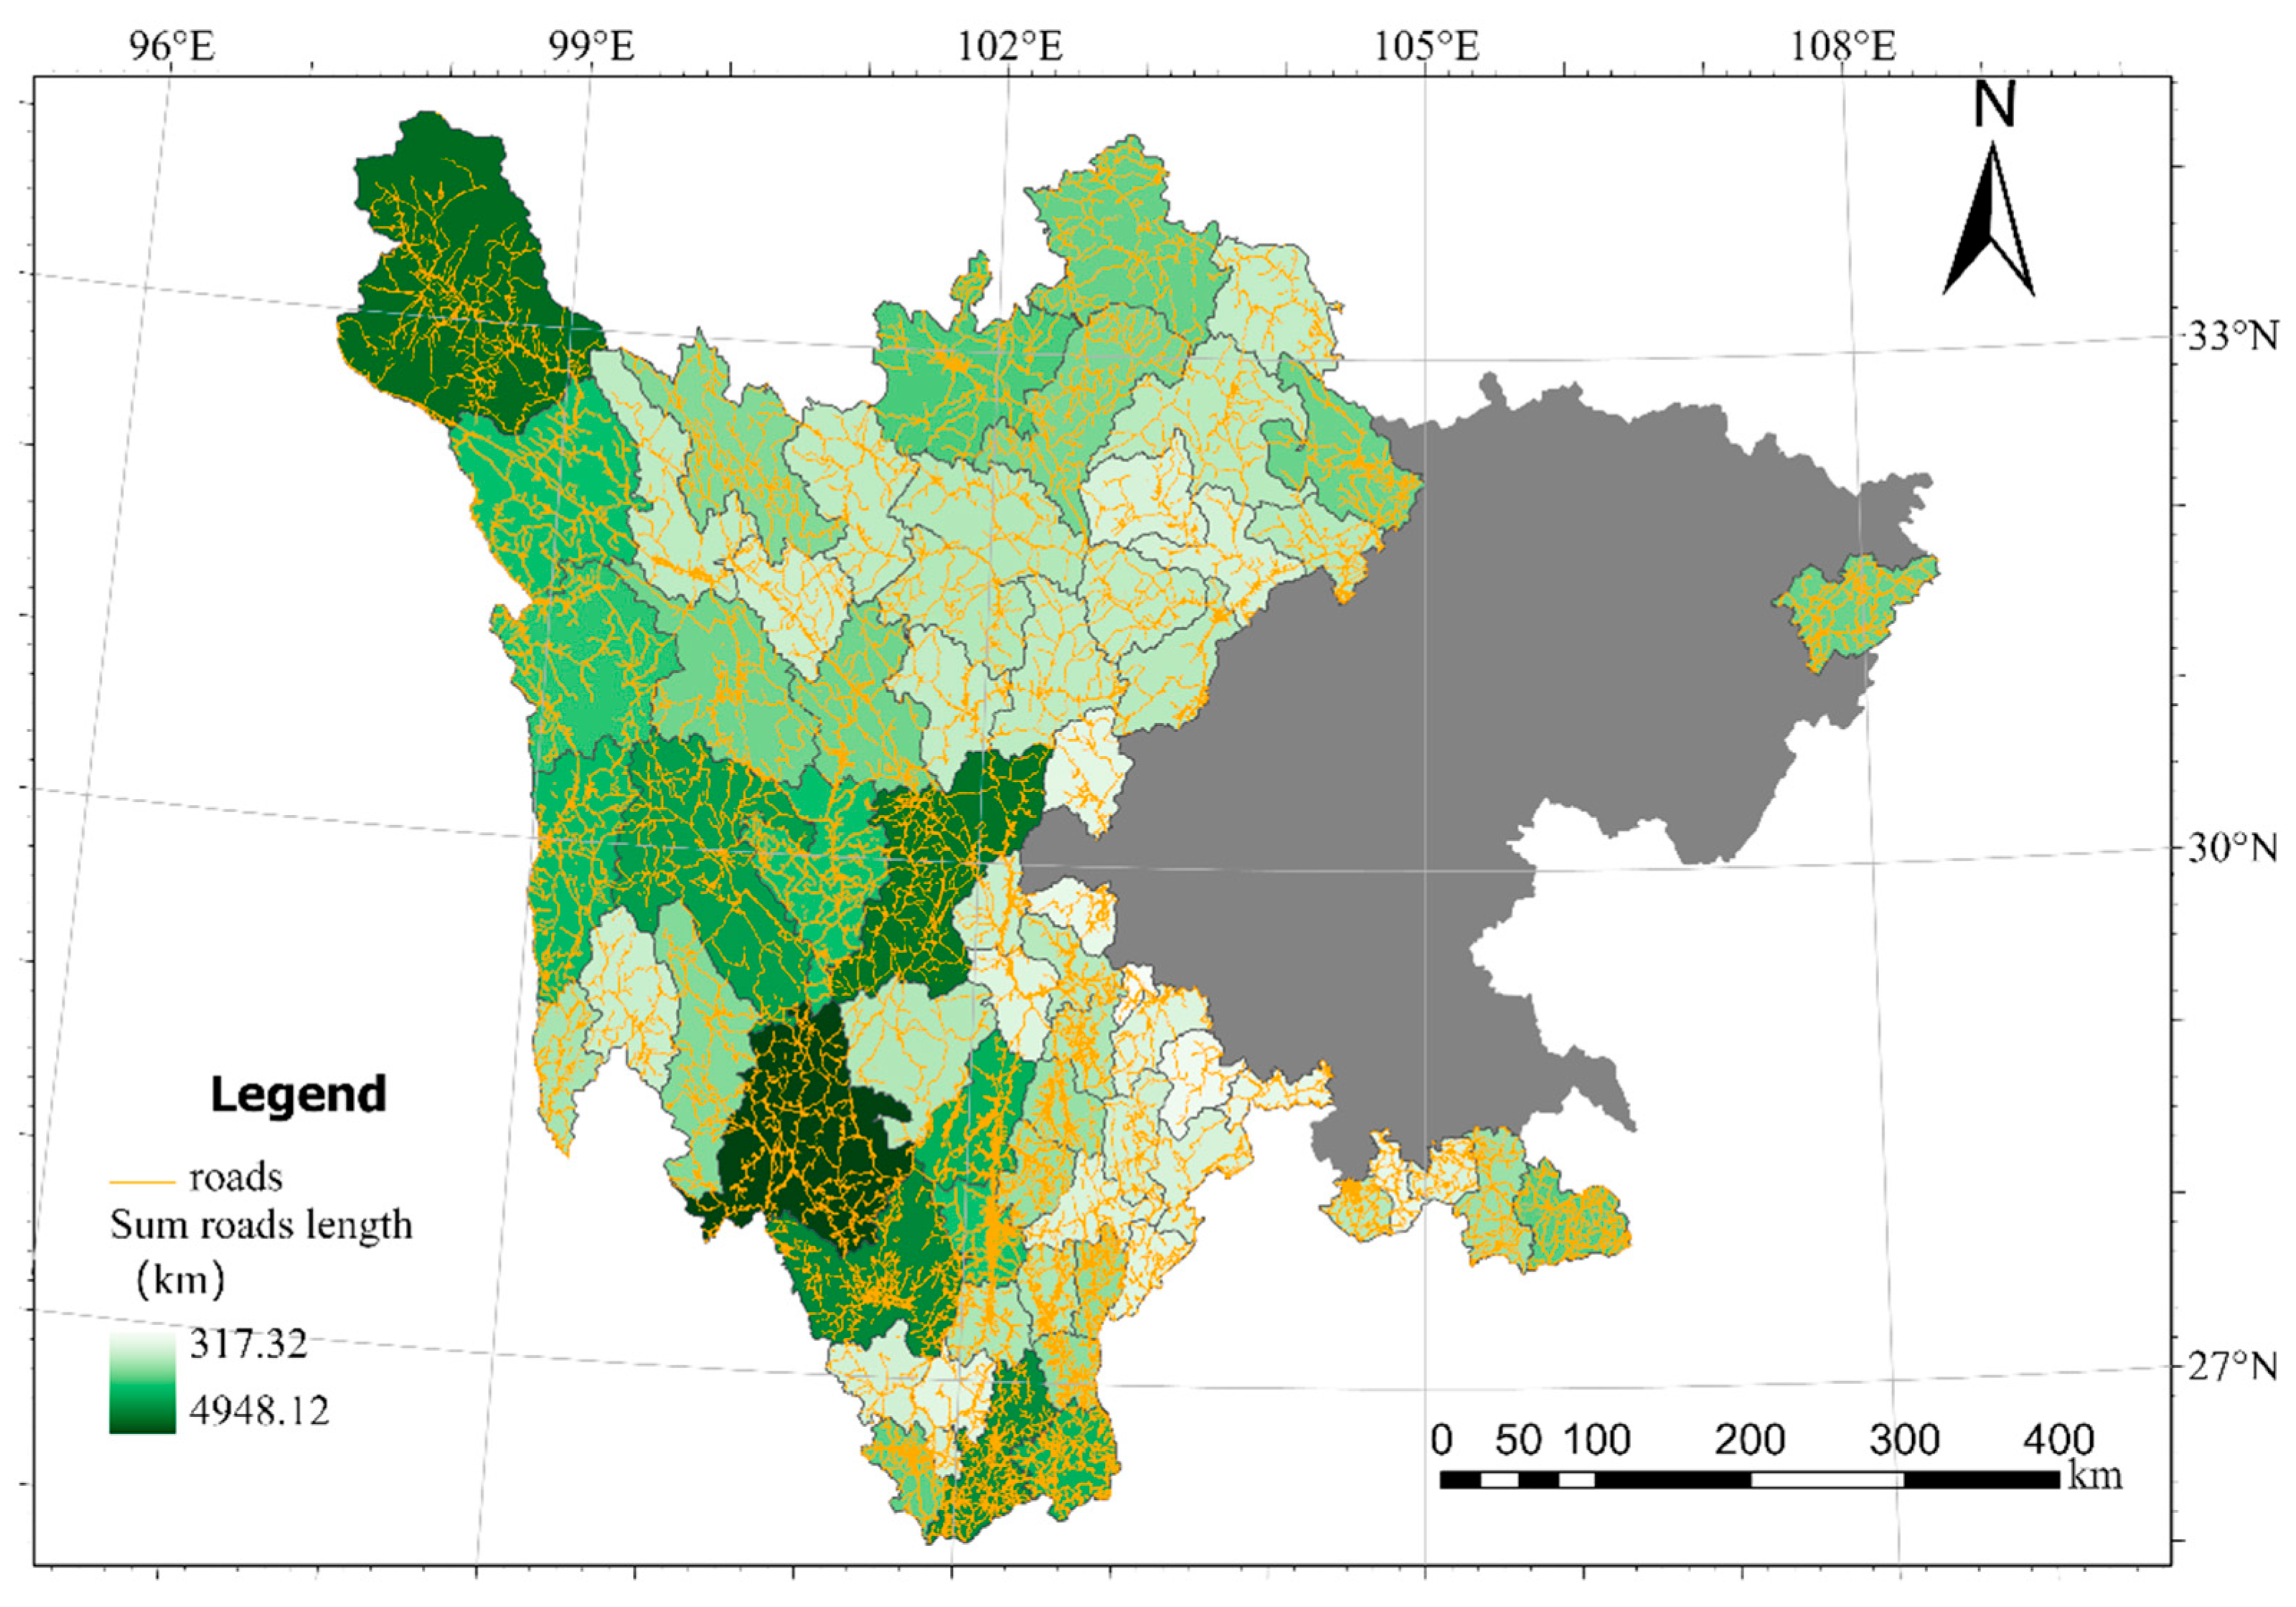
First, to calculate the total highway mileage for each county within the study area, the SummarizeWithin function in arcpy was employed to perform zonal statistics on road data from OSM (OpenStreetMap). The resulting highway mileage data for 2024 is presented in
Figure 4.
Secondly, this study employs the 2024 OpenStreetMap (OSM) road vector layer as a spatial dimension prior to identifying the current existence of roads and combines this with multi-temporal remote sensing metrics—specifically NDVI and DBSI—to infer road construction years. NDVI is a standardized index indicative of vegetation health and coverage, with higher values denoting denser vegetation. Upon road construction, vegetation is typically cleared or covered, resulting in a marked decline in NDVI at the corresponding pixel. Conversely, the Dry Bare-Soil Index (DBSI) is particularly sensitive to bare and paved surfaces; such areas typically exhibit significantly elevated DBSI values. The complementary use of these indices thus effectively discriminates between roads and vegetated or agricultural land. When applied across a time series of remote sensing imagery, if a given road pixel exhibits a sudden NDVI reduction concurrent with a substantial DBSI increase—and if this altered state persists in subsequent years—one can reasonably conclude that the road was constructed in that year. The method is substantiated by three core rationales: (i) road construction typically induces abrupt vegetation removal and changes in surface properties, which are distinctly reflected in NDVI and DBSI; (ii) leveraging multi-annual temporal series and imposing a requirement for persistence helps mitigate spurious variations such as short-term bare soil or cropping cycles, thereby enhancing detection accuracy; and (iii) utilizing OSM-derived road masks to constrain analysis to confirmed road locations significantly reduces false positives. This logical framework aligns with established remote sensing methodologies, such as those employing Sentinel-2 NDVI time series on the Google Earth Engine platform to detect fine-scale land cover changes (e.g., post-fire vegetation recovery and track formation), where published studies report overall classification accuracies exceeding 0.86 [
33].
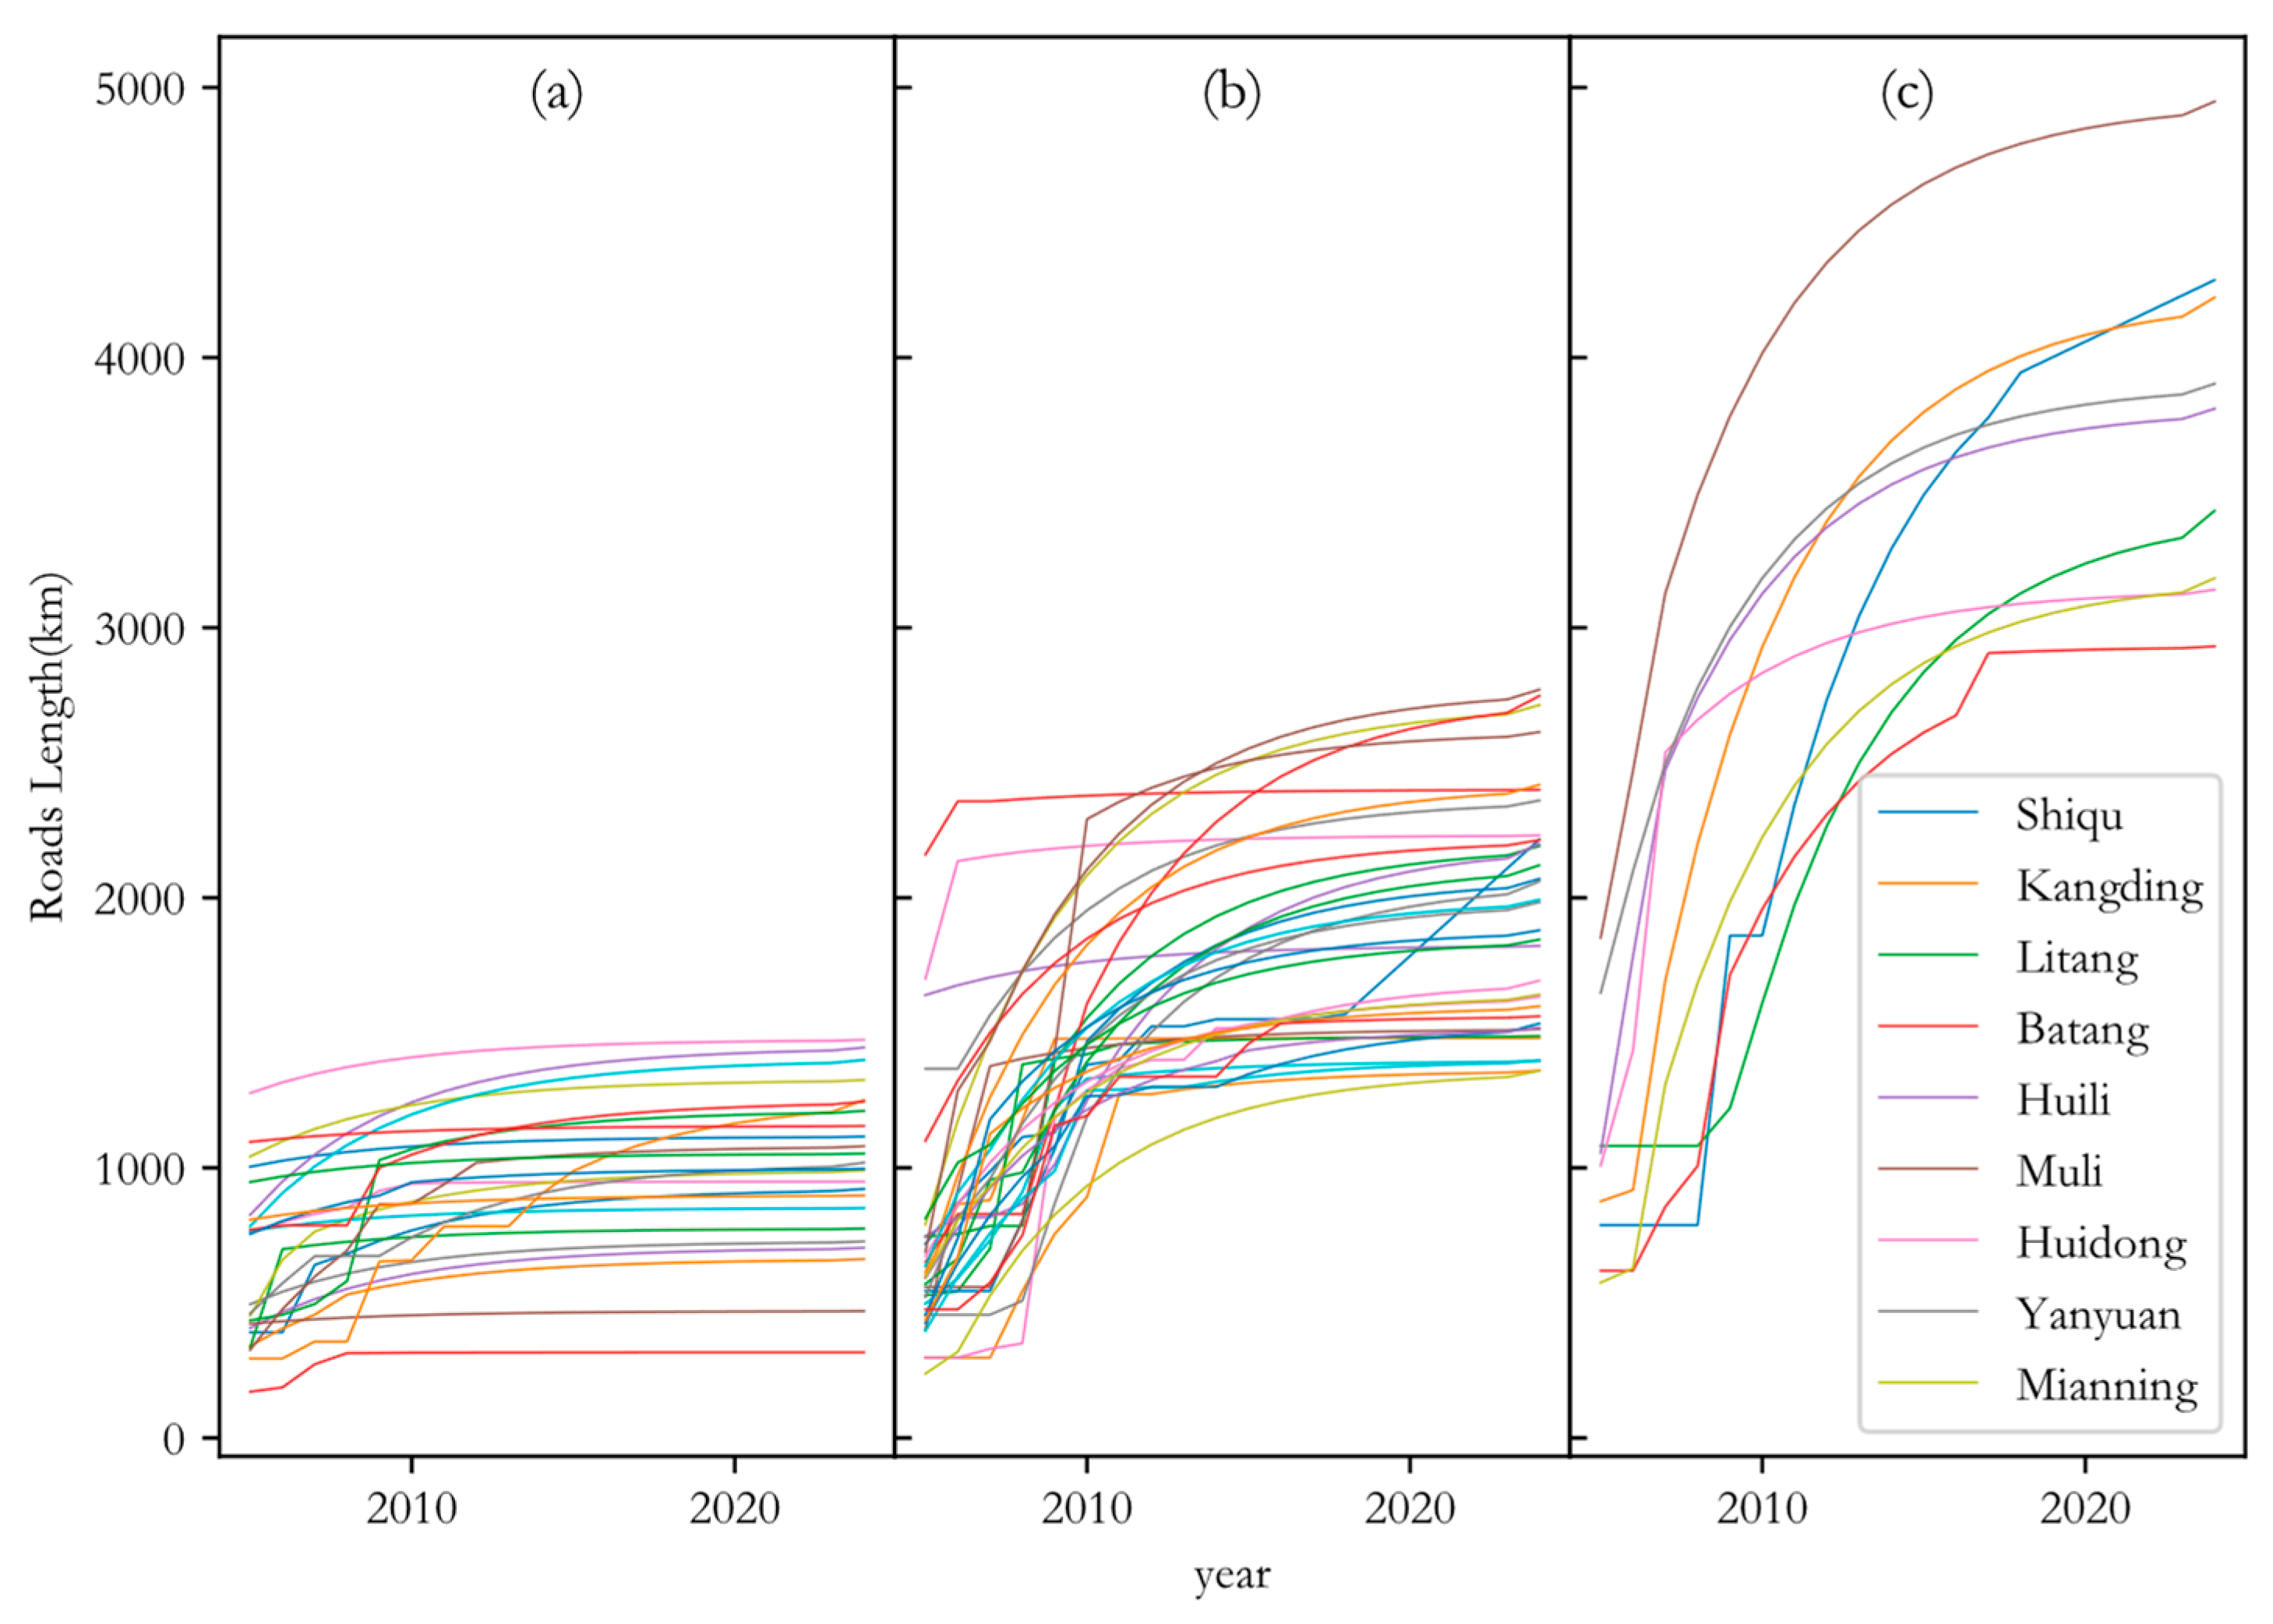
To analyze the variation in road mileage across counties, the KMeans algorithm from the sklearn library was applied to classify the data into three categories, as shown in
Figure 5. Among them,
Figure 5a represents 24 counties with minimal changes in total road mileage;
Figure 5b represents 34 counties with moderate changes in road mileage; and
Figure 5c represents 9 counties exhibiting the most significant changes in total road mileage.
4.3. Evaluation Based on Dynamic Shannon Entropy Weight Method
4.3.1. Weighting Results of the Evaluation Indicator System
Based on the 20-period data of each indicator, the data were normalized prior to distribution fitting. Initially, a gamma distribution was fitted to the normalized data to obtain the shape parameter (α) and scale parameter (β), followed by mean-centering and fitting to a normal distribution. Since β was fixed at 1 and the normal distribution was imposed to have a mean of zero, only the estimated α and the standard deviation, along with the corresponding mean absolute error (MAE), are reported. To assess the stability of the fitted distribution parameters—specifically, the shape parameter (α) and the standard deviation (std)—we conducted bootstrap resampling with replacement, drawing samples of the same size as the original dataset and performing 1000 iterations. The results indicate that the parametric estimates derived from the original data are consistent with those obtained from the bootstrap samples. This consistency demonstrates that the weights computed using the dynamic Shannon entropy-based weighting method are highly stable and reliable, validating their suitability for subsequent subsystem score evaluation. The fitting results are presented in
Table 4. As all indicators exhibit mean absolute errors below 0.2, the quality of these fits is considered acceptable within the context of this study. Therefore, subsequent weight calculations are based on entropies derived from the fitted probability density functions.
The weights of the indicators for the economic, social, and environmental subsystems were calculated to further evaluate each subsystem. The data for each subsystem were independently normalized, detrended, and fitted to a distribution. The dynamic Shannon entropy of each indicator was then computed, followed by the calculation of the corresponding weights. The results are presented in
Table 5.
The weight distributions across economic, social, and environmental subsystems reveal key insights into their dynamic entropy drivers. In the economic subsystem, “Number of Registered Enterprises” (A8, weight: 0.25) emerges as the most influential indicator, highlighting innovation and growth potential as primary factors, while structural indicators like GDP (A4, 0.18) and fixed asset investment (A5, 0.08) demonstrate the importance of economic stability, and efficiency measures show particular sensitivity to unemployment rates (A2, 0.14). The social subsystem emphasizes infrastructure development through postal services (B2, 0.18) and road networks (B1, 0.14), with cultural facilities (B6, 0.13) significantly impacting social progress, though consumption expenditure (B8, 0.07) shows minimal influence. Environmental priorities center on waste management (C2, 0.29) and water quality compliance (C4, 0.20), with green space indicators (C5/C6, both 0.12) contributing equally to ecological improvement.
These findings collectively provide a scientific foundation for targeted policy interventions, revealing how specific indicators differentially impact system dynamics across all three subsystems to inform sustainable development strategies. The results particularly underscore the varying sensitivity of economic innovation metrics, social infrastructure factors, and environmental protection measures in shaping overall system behavior.
4.3.2. Evaluation Results of Development Levels for Each Subsystem
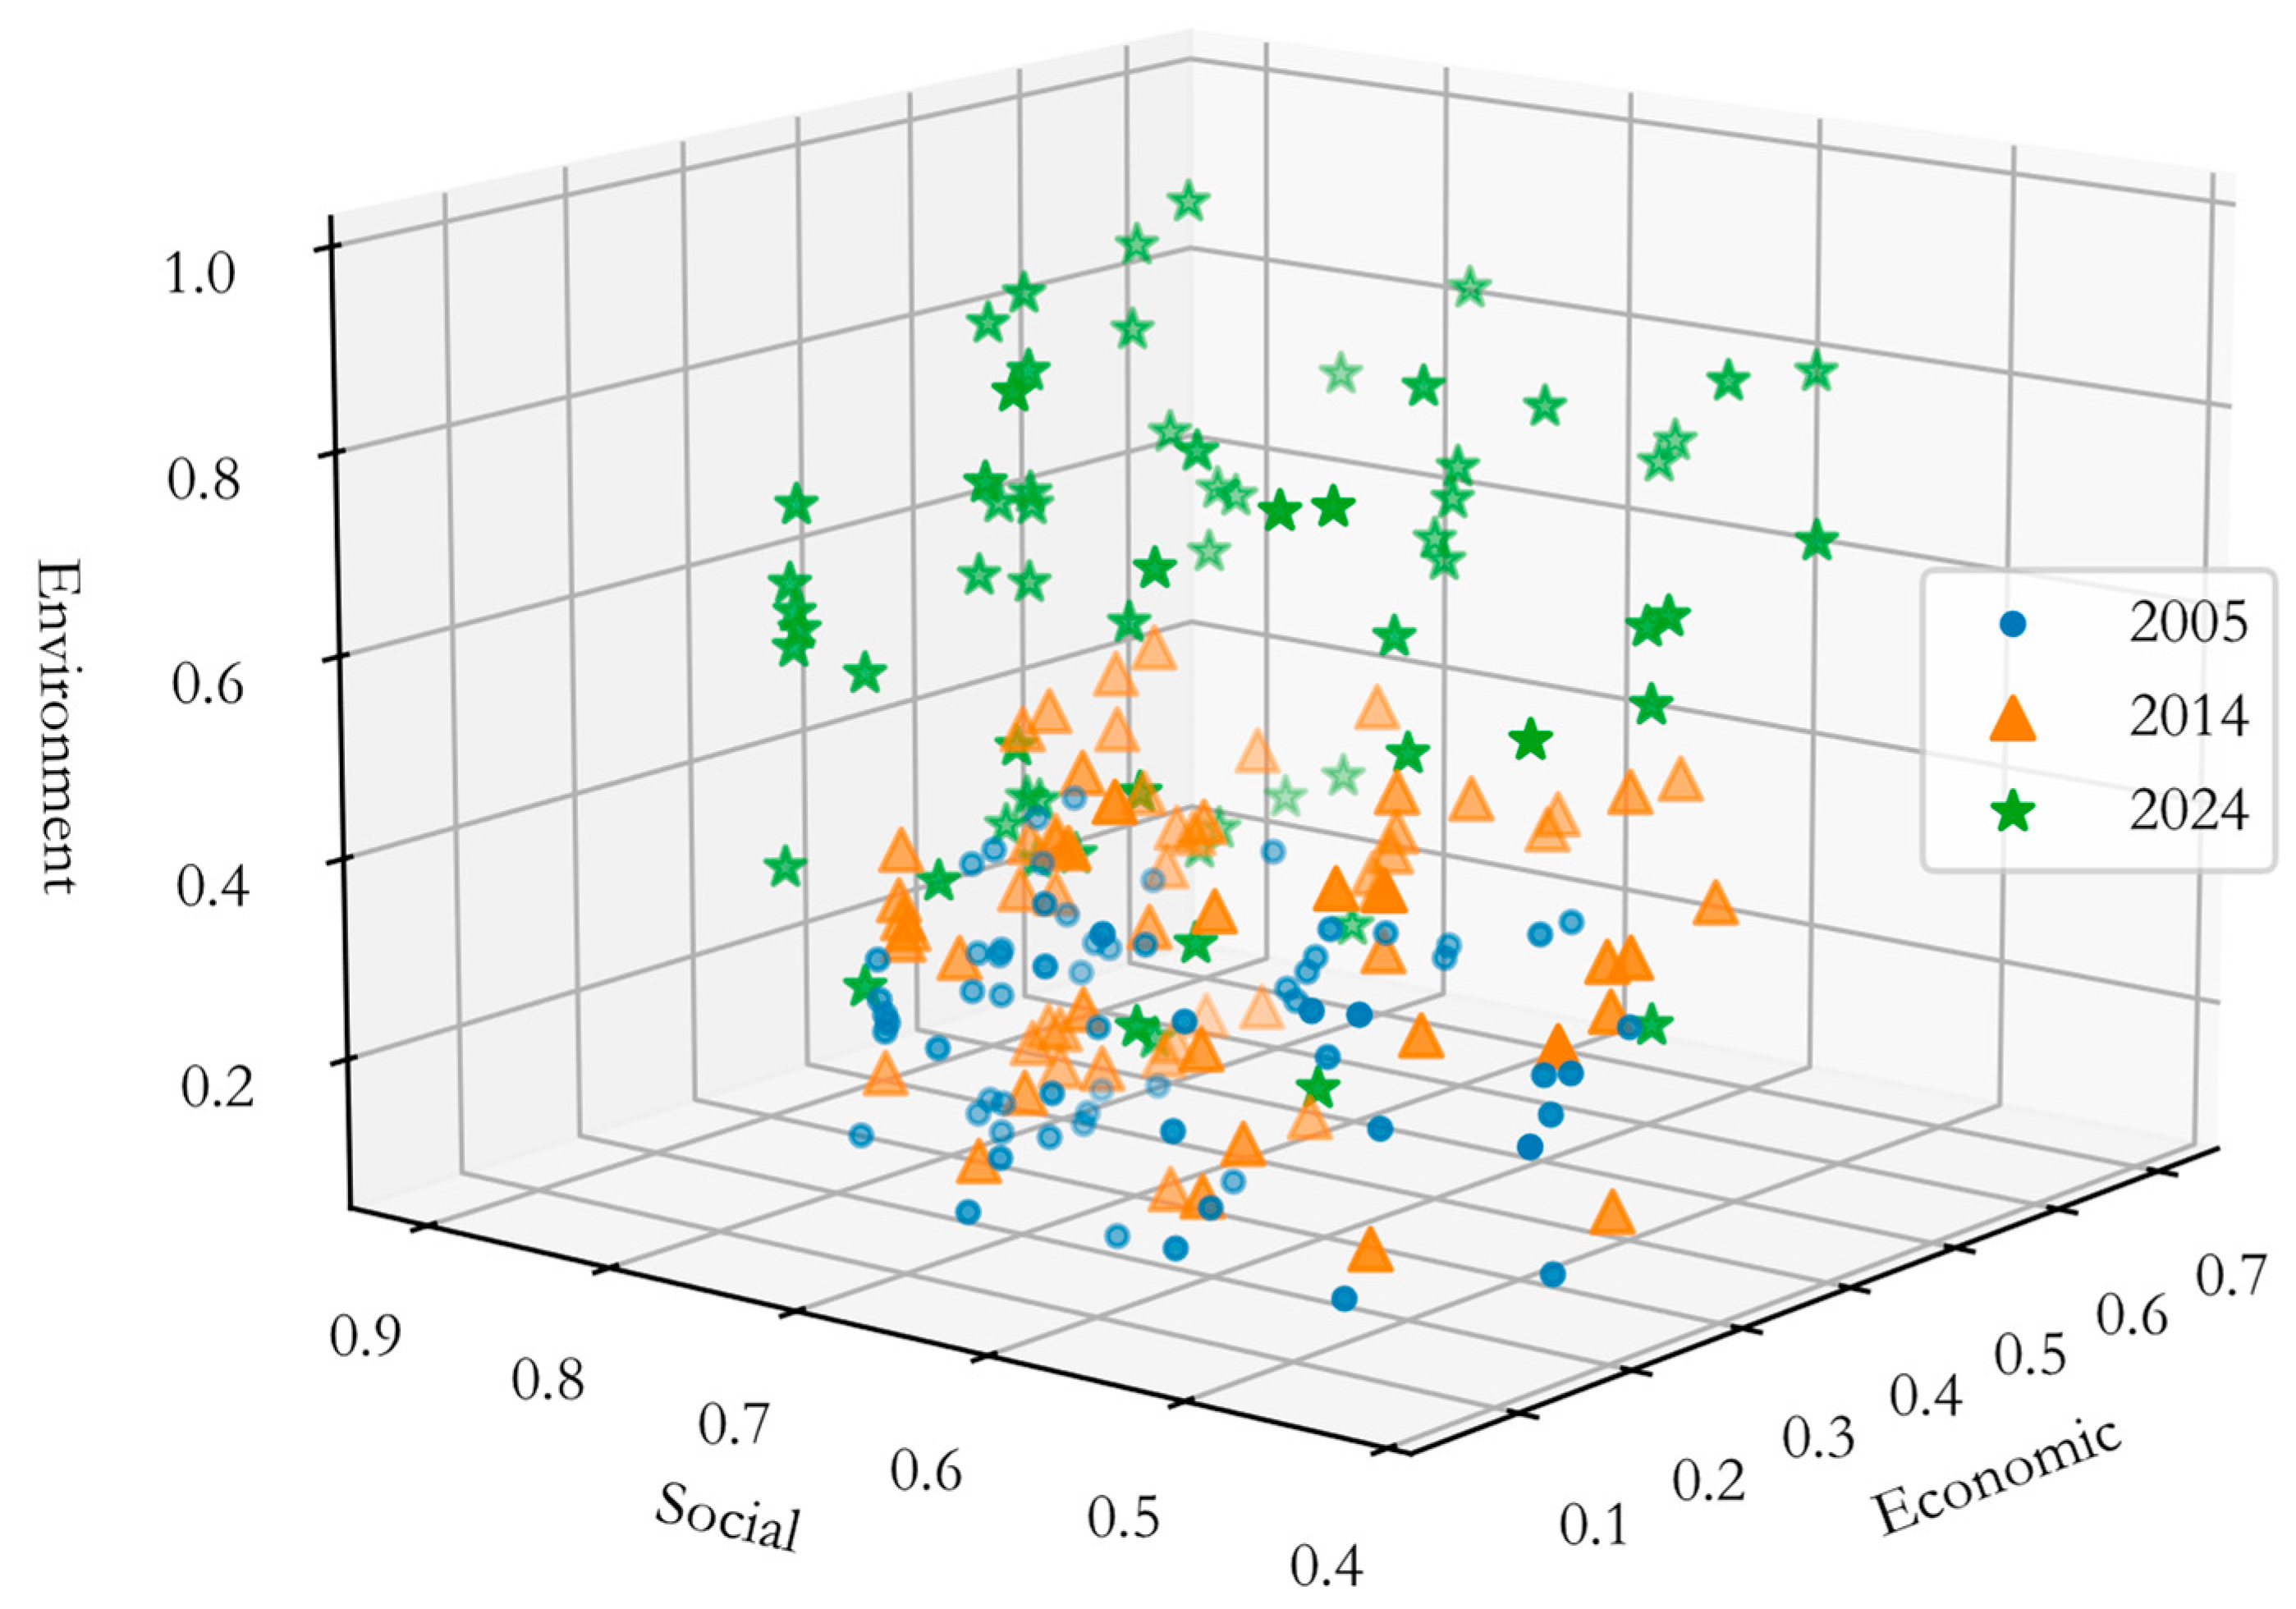
Based on the weights of each indicator, the subsystem scores of each county were evaluated, and scatter plots of the evaluation results for the years 2005, 2014, and 2024 were created (
Figure 6). Furthermore, the mean, minimum, and maximum values of the evaluation results for each county were calculated annually, and the overall trend of the subsystems from 2005 to 2024 was plotted (
Figure 7). In addition, a comparison was made between the evaluation results obtained using the dynamic Shannon entropy weight method and the equal weight method. The results showed that the dynamic Shannon entropy weight method is more suitable for evaluating the development level of each subsystem. Specifically, the coefficient of variation of the evaluation results obtained using the dynamic Shannon entropy weight method was 0.012, which is significantly lower than that of the equal weight method (0.368). This indicates that the dynamic Shannon entropy weight method provides more stable and reliable evaluation results, better reflecting the actual development trends of the subsystems over time.
First, from 2005 to 2024, the scores of the economic subsystem generally increased, reflecting significant development during this period, which may be closely related to factors such as policy support, increased investment, and infrastructure improvements. The scores of the social subsystem remained relatively stable across the three years, with an overall high level, indicating that the social subsystem maintained a favorable developmental state during this time. This likely reflects continuous investments and improvements in education, healthcare, cultural facilities, and other areas. Similarly, the scores of the environmental subsystem showed an upward trend, with a notable improvement in 2024, which may be attributed to strengthened environmental protection policies, the implementation of ecological restoration projects, and increased public awareness of environmental conservation.
Second, the mean, minimum, and maximum scores of the economic subsystem exhibited a steady upward trend, indicating continuous improvement in its developmental level and a gradual reduction in developmental disparities. The scores of the social subsystem remained relatively stable during this period, with a slight increase in the mean, suggesting balanced development and a slow but steady improvement in overall performance. The environmental subsystem’s mean, minimum, and maximum scores all showed a clear upward trend, particularly in 2024, when the scores improved significantly, demonstrating substantial progress in its developmental level during this period.
Finally, the economic–social–environmental systems of the 67 county-level administrative units in the ethnic regions of Sichuan Province achieved varying degrees of development from 2005 to 2024. Among them, the economic subsystem showed the most significant progress, the social subsystem developed more evenly, and the environmental subsystem exhibited marked improvements in the later years.
4.4. Coupling Coordination Degree Results of Economy–Environment–Society in Ethnic Regions
4.4.1. Temporal Evolutionary Characteristics of CCD
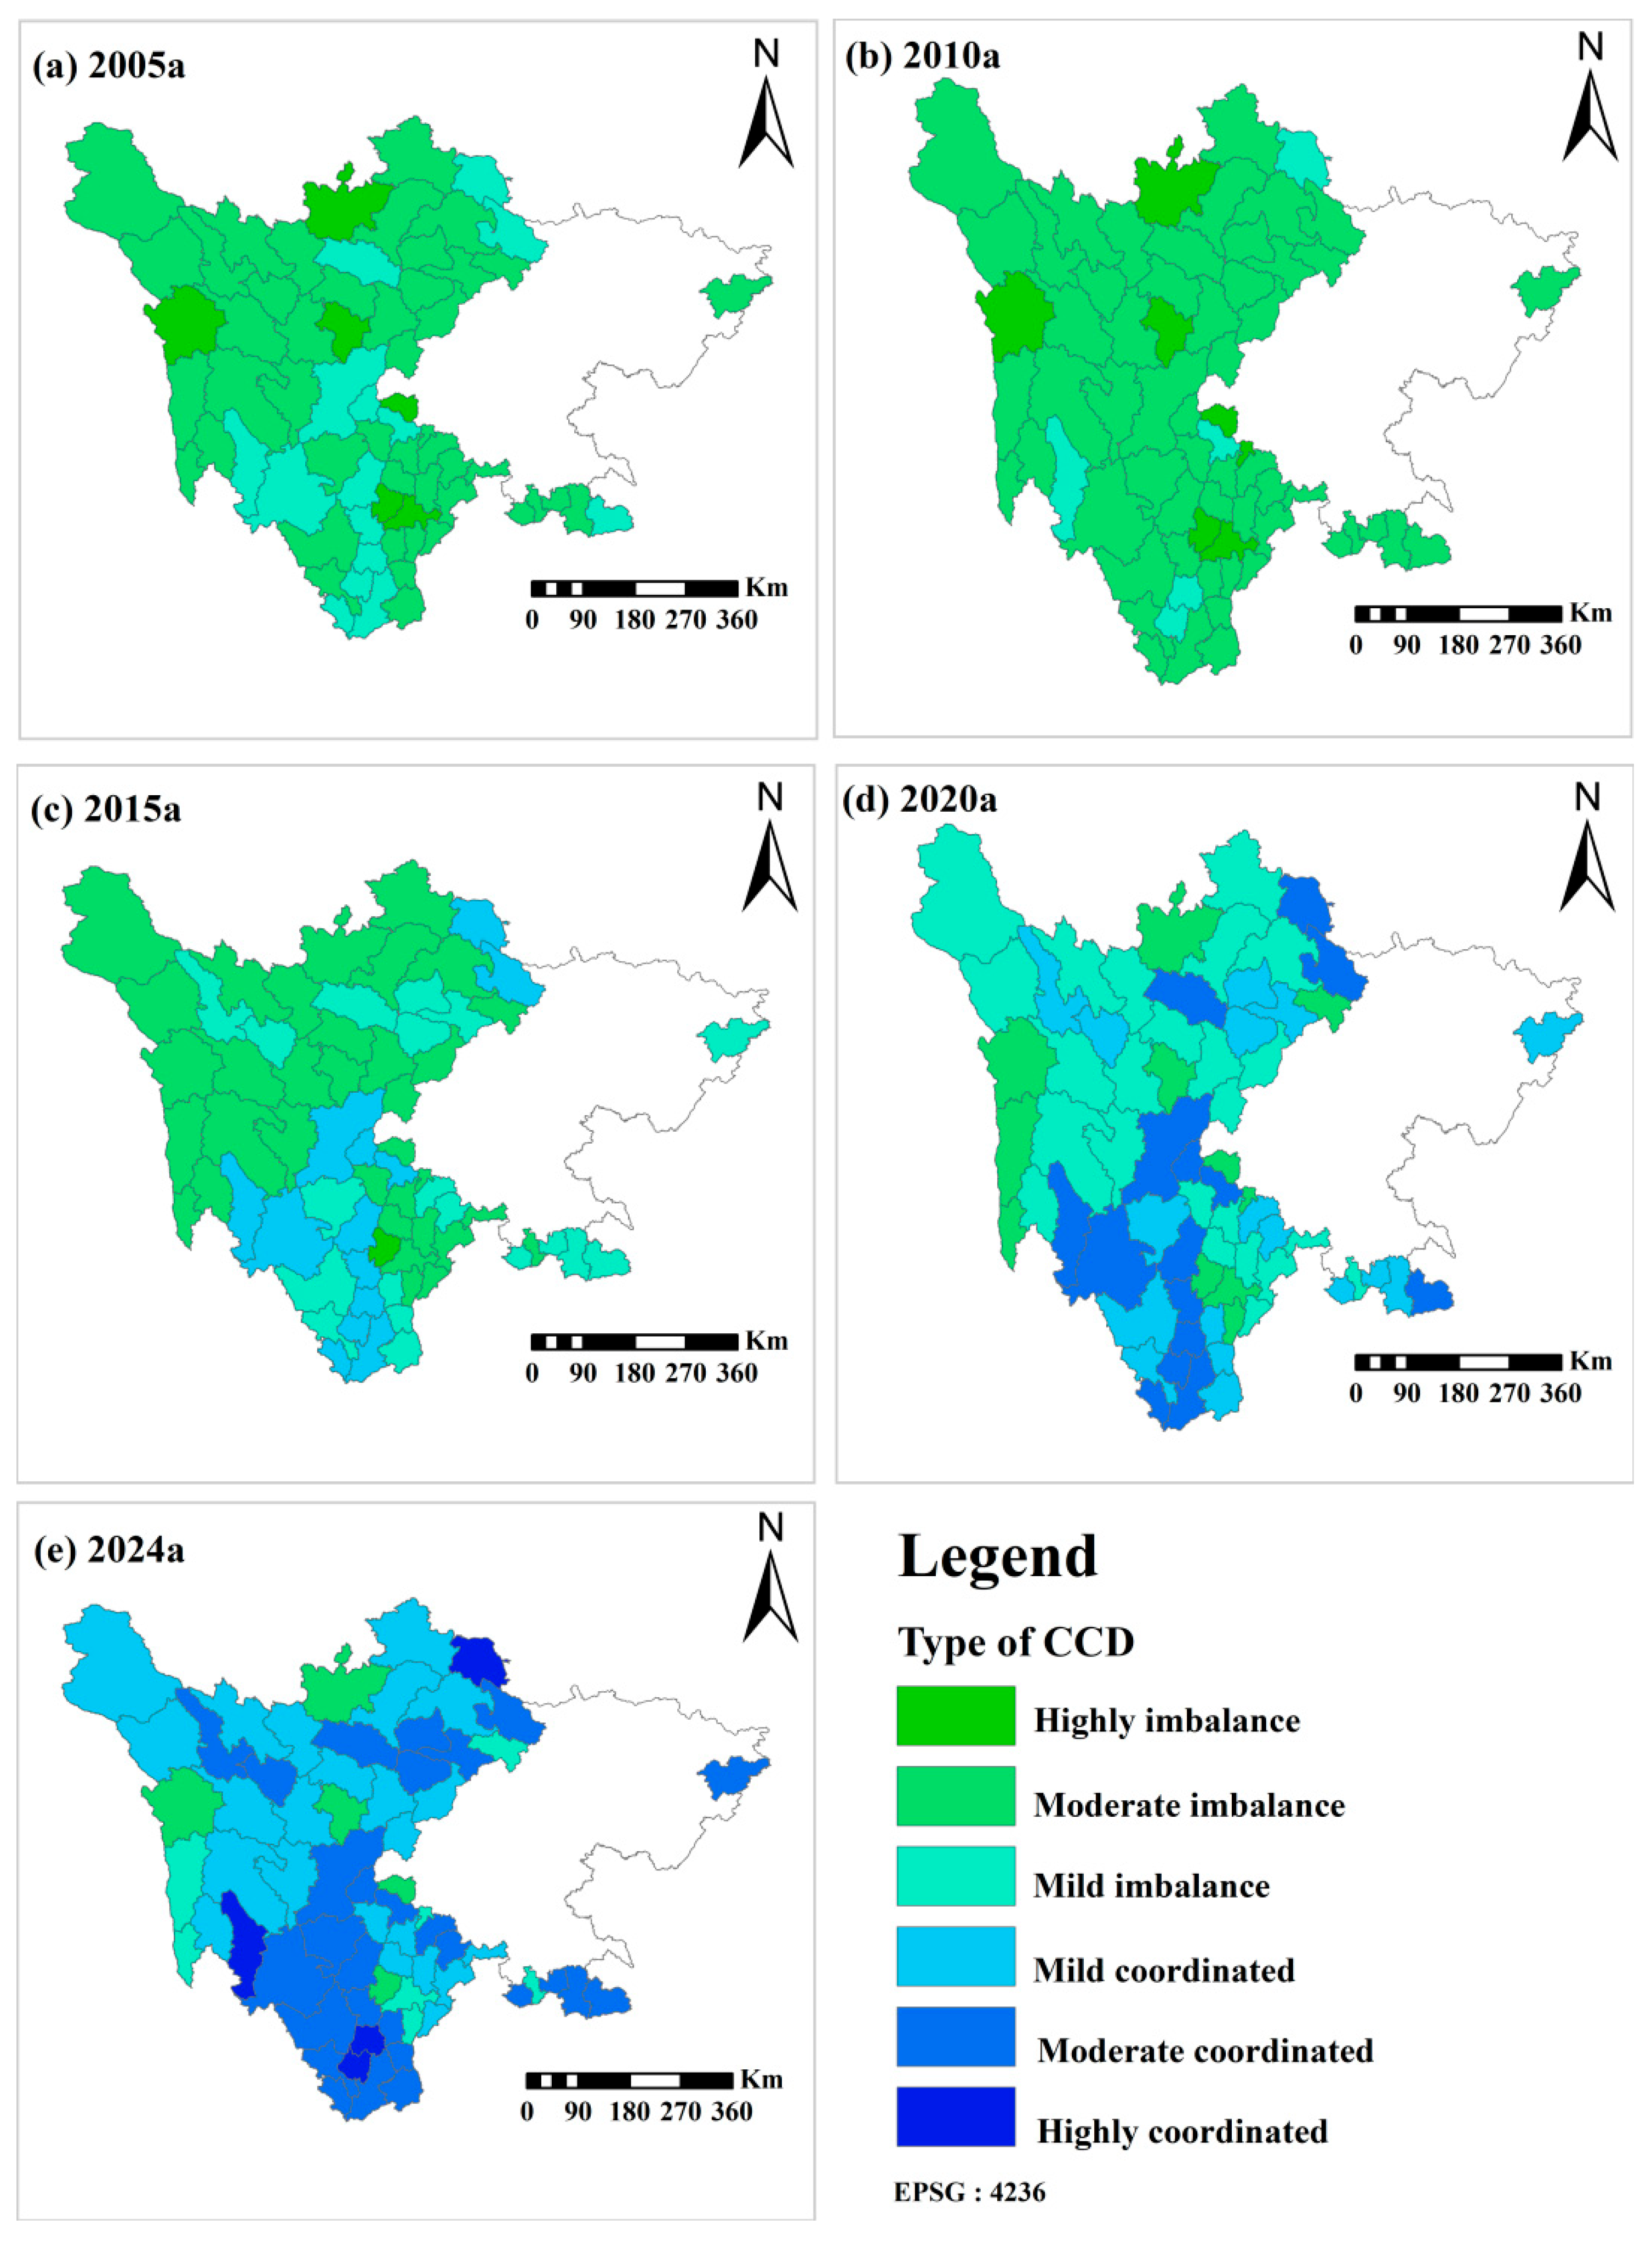
This study conducts a detailed analysis of the coupling coordination degree level data from 67 regions over a 20-year period (2005–2024) based on the coupling coordination degree model and visualizes the temporal evolution characteristics (
Figure 8).
From the perspective of temporal variations in coupling coordination levels, in the early years (2005–2010), “moderate dysfunction” was the predominant characteristic, accounting for 55%–82% of the cases. Concurrently, there were smaller proportions of “severe dysfunction” (5%–10%) and “mild dysfunction” (7%–34%). During the 2011–2015 period, the proportion of “mild dysfunction” increased to 25%–34%, whereas “moderate dysfunction” declined to 51%–70%. After 2016, higher coordination levels such as “moderate coordination” (4%–42%) and “mild coordination” (21%–34%) started to emerge, indicating a significant transformation in the distribution pattern of coupling coordination levels.
The key inflection points are as follows: in 2014, “severe dysfunction” almost vanished, dropping to merely 1.5%; in 2016, “moderate coordination” emerged for the first time, accounting for 4.5%; in 2023, “high coordination” made its debut at 3%; and by 2024, the proportion of “high coordination” doubled to 6%. As of 2024, the coordinated levels (mild + moderate + high coordination) now hold a dominant position at 81.8%, while the dysfunctional levels (mild + moderate dysfunction) have decreased to 17.9%, with the highest tier (“high coordination”) reaching 5.97%.
Collectively, these trends clearly illustrate a year-by-year improvement in coupling coordination. The situation has transitioned from the early stages dominated by dysfunction to a coordination-oriented phase, with a progressive increase in higher coordination tiers, which reflects substantial progress in regional developmental harmony.
From the perspective of the spatial distribution characteristics of coupling coordination levels, there were significant geographical differences and dynamic changes between 2005 and 2024. The counties in these ethnic regions were primarily located in the western Sichuan Plateau, southwestern Sichuan, northeastern Sichuan, southern Sichuan, and the areas surrounding the Chengdu Plain. The evolution of coupling coordination was closely linked to the region’s natural geographical conditions, economic development level, and the implementation of ethnic policies. In the early years, the western Sichuan Plateau (e.g., Aba and Ganzi counties) was largely characterized by high or moderate imbalance. However, in recent years, with the strengthening of ecological protection measures and the improvement of ecological compensation mechanisms in ethnic regions, the coupling coordination level in some counties has improved. For instance, Daocheng County gradually transitioned to mild or moderate coordination after 2016. In the southwestern region (e.g., Miyi and Huili counties), the coupling coordination degree showed an overall upward trend. Miyi County progressed from mild imbalance in 2005 to high coordination in 2024, indicating a successful balance between resource development and environmental protection, with coordinated advancement of economic development and ecological construction. In the northeastern region (e.g., Xuanhan County), industrial restructuring and ecological governance significantly improved the coupling coordination level. From 2015 onward, Xuanhan County gradually shifted from mild imbalance and mild coordination to moderate coordination, achieving moderate coordination by 2024. In the southern region (e.g., Yunlian County), a balance between regional economic cooperation and ecological protection has gradually been established. Yunlian County reached moderate coordination after 2021. In the areas surrounding the Chengdu Plain (e.g., Wenchuan County), notable progress has been made in post-disaster reconstruction and ecological restoration. Wenchuan County transitioned from mild imbalance and mild coordination to mild coordination starting in 2016 and maintained this level by 2024.
From a geographical perspective, the plateau areas in Sichuan Province have generally had a low level of early coupling coordination due to harsh natural conditions and fragile ecological environment. However, with the strengthening of ecological protection measures in recent years, the coupling coordination in some counties has improved. Although there are still significant challenges, the situation has improved. Mountainous areas (such as Eba and Mabian counties) have limited economic development due to terrain constraints, but through the development of characteristic agriculture and eco-tourism, the coupling coordination has gradually improved. In plain areas (such as the counties around the Chengdu Plain), the economic development foundation is relatively good, but the ecological pressure is high. In recent years, through strengthened environmental supervision and promoting green development, the coupling coordination has steadily improved, and in some areas, it has reached moderate coordination or even high coordination levels.
Overall, the coupling coordination of 67 ethnic minority counties in Sichuan Province has shown a clear trend of shifting from imbalance to coordination over the past 20 years. This not only reflects the remarkable achievements of Sichuan Province in regional coordinated development and ecological protection but also provides strong support for the continued promotion of green development and ecological civilization construction in the future. At the same time, it demonstrates the potential and progress of ethnic minority areas in achieving economic and ecological coordination with policy support.
4.4.2. Intercorrelation Characteristics of CCD
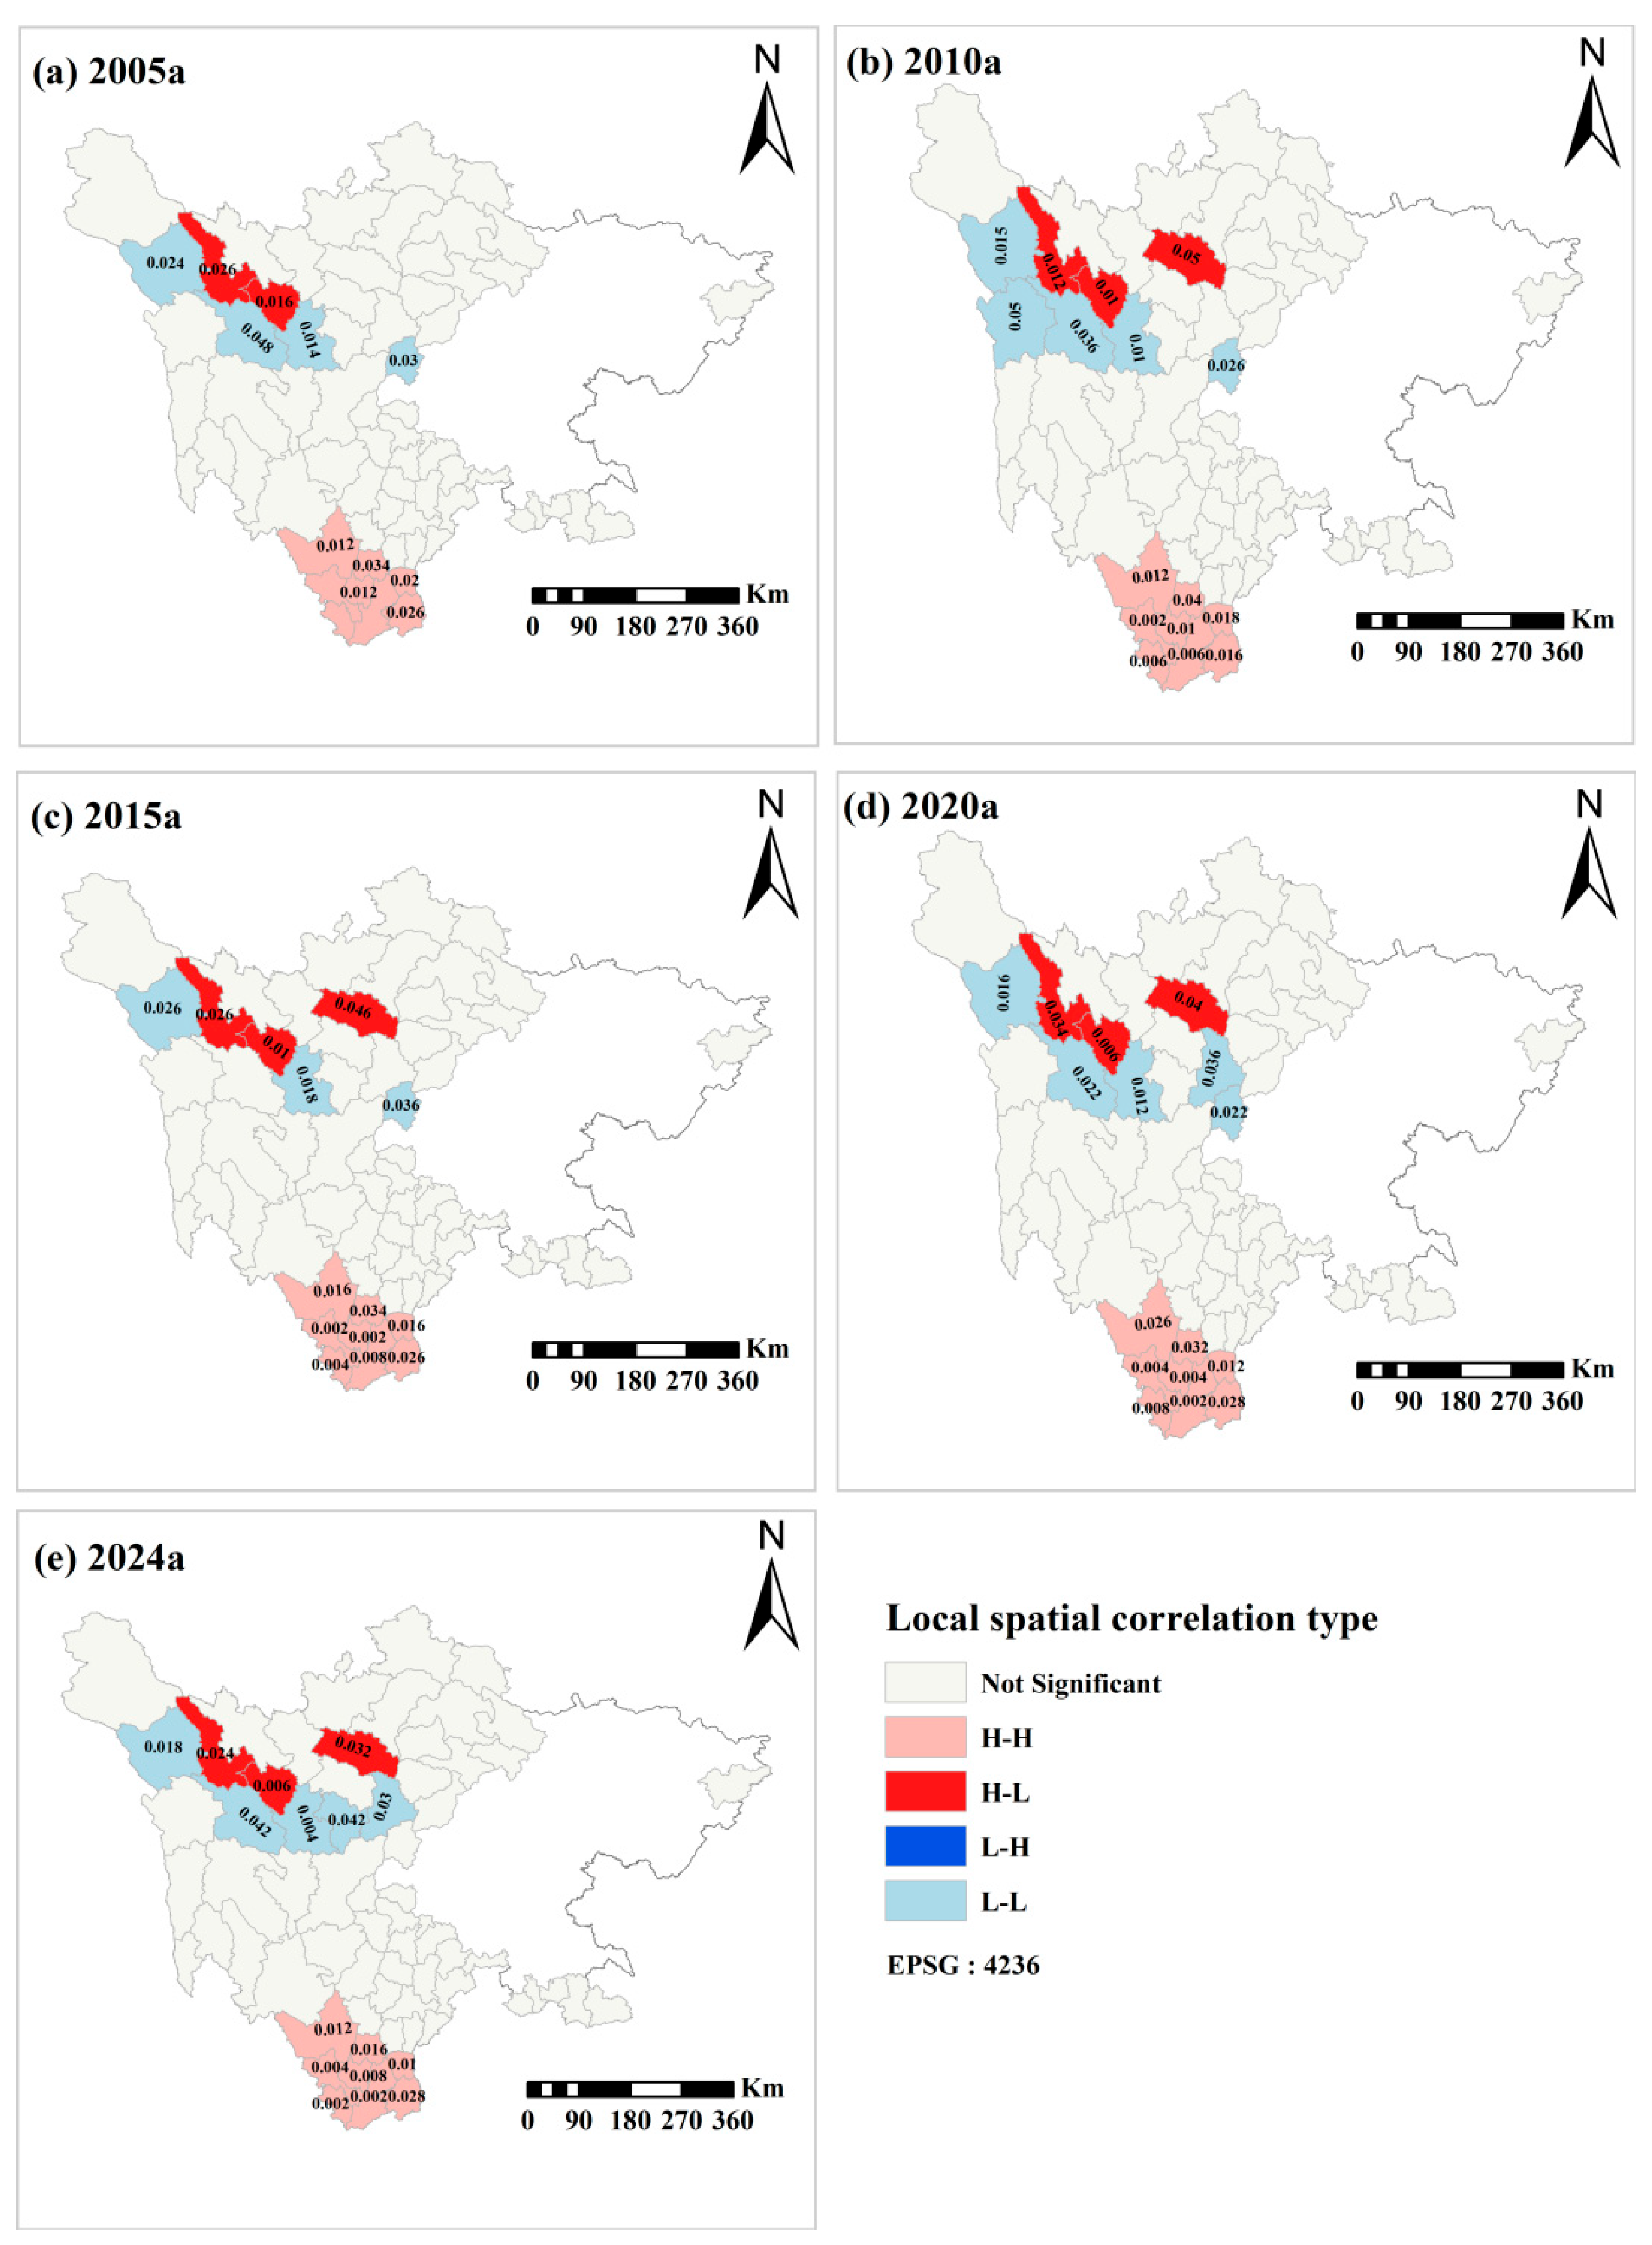
Between 2005 and 2024, the coupling coordination degree of society, economy, and environment in Sichuan Province exhibited significant spatial autocorrelation and path dependence characteristics (
Figure 9). In this study’s Local Moran’s I (LISA) analysis conducted via GeoDa, a distance-based spatial weights scheme was employed using the k-nearest neighbors method with k = 8, meaning each spatial unit is linked to its eight closest neighbors by Euclidean distance. This strategy avoids isolated observations that may arise from overly narrow distance-band thresholds and ensures every unit has a fixed number of neighbors, thereby preventing “islands” in the spatial graph. The resulting weights matrix was row-normalized, such that each row sums to 1, allowing spatial lags to be interpreted as a “neighborhood average” and aligning with the mathematical formulation of Local Moran’s I. For significance testing, a random permutation approach was utilized, with the default 999 permutations executed to generate a reference distribution and estimate p-values, a common practice in GeoDa’s local spatial autocorrelation module. In this study, to address the accumulation of Type I errors resulting from multiple comparisons in the Local Moran’s I (LISA) analysis, we applied GeoDa’s built-in False Discovery Rate (FDR) correction procedure. This approach is designed to maintain higher detection power while controlling the rate of false discoveries, in contrast to more conservative corrections such as Bonferroni. Globally, the high–high agglomeration area (High–High) was consistently located in the ethnic autonomous regions of Aba and Ganzi in the western Sichuan plateau. The spatial stability (Moran’s I significance p < 0.01, inter-annual variation < 5%) indicated the continuous effect of the combination of ecological protection compensation, tourism poverty alleviation, and ethnic policies. Correspondingly, the low–low agglomeration area (Low–Low) was long entrenched in 27 counties (districts) in the central Sichuan hilly and eastern Sichuan parallel ridge and valley regions, showing a “poverty–pollution” lock-in effect, suggesting that the traditional industrialization path dependence and ecological vulnerability have hindered the improvement of the coordination degree.
In terms of local heterogeneity, the high–low outliers (High–Low) evolved from “point-like” to “cluster-like”. In 2005, they were only sporadically distributed in the suburbs of Chengdu, and after 2015, they spread to the Chengdu-Deyang-Mianyang-Leshan urban belt along with the construction of the Tianfu New Area and Mianyang Science and Technology City, highlighting the shielding effect of policy polarization and innovation spillover on the surrounding areas; the low–high outliers (Low–High) decreased from nine counties in 2005 to three in 2024, contracting spatially to the hinterland of Liangshan Prefecture and Wanyuan City in Dazhou, reflecting the continuous suppression of the coordination degree by traffic isolation, resource scarcity, and governance fragmentation. The proportion of areas without significant spatial autocorrelation decreased from 41.7% in 2005 to 28.4% in 2024, retreating spatially to the periphery of the Sichuan–Southwestern Chongqing Economic Corridor, indicating that the overall coupling coordination degree of the province is converging towards significant agglomeration.
The above pattern suggests that the western Sichuan ecological function area has achieved a high-level lock-in of the coordination degree through the “development in protection” path, while the central and eastern Sichuan regions need to break the path dependence to catch up. The local polarization-depression phenomenon in policy highlands and marginal areas indicates that in the future, a “core–periphery” gradient governance and cross-regional compensation mechanism should be established to eliminate spatial imbalance and enhance the overall coupling coordination degree of the province.
4.5. Analysis of the Influencing Factors of CCD
After clarifying the spatial lock and local polarization patterns of the coupling coordination degree in the ethnic areas of Sichuan Province from 2005 to 2024, it is urgent to answer the key question of “what driving forces shaped the above spatiotemporal characteristics”. The western Sichuan Plateau has maintained a high level of coordination as a high–high concentration area, while some counties have shifted from low–high outliers to low–low concentration, suggesting that there is a differentiation effect of heterogeneous dominant factors within the region. In this regard, the following text introduces the GeoDetector model. Firstly, the q value is used to measure the marginal contribution of a single factor to the coupling coordination degree (
Table 6 and
Figure 10), and then the nonlinear coupling mechanism between factors is revealed through interactive detection (
Figure 11), thereby providing quantitative evidence for solving the “space–causation“ dual-dimensional logic of coordinated development in ethnic areas.
4.5.1. Single-Factor Detection: The Spatiotemporal Evolution of Driving Forces
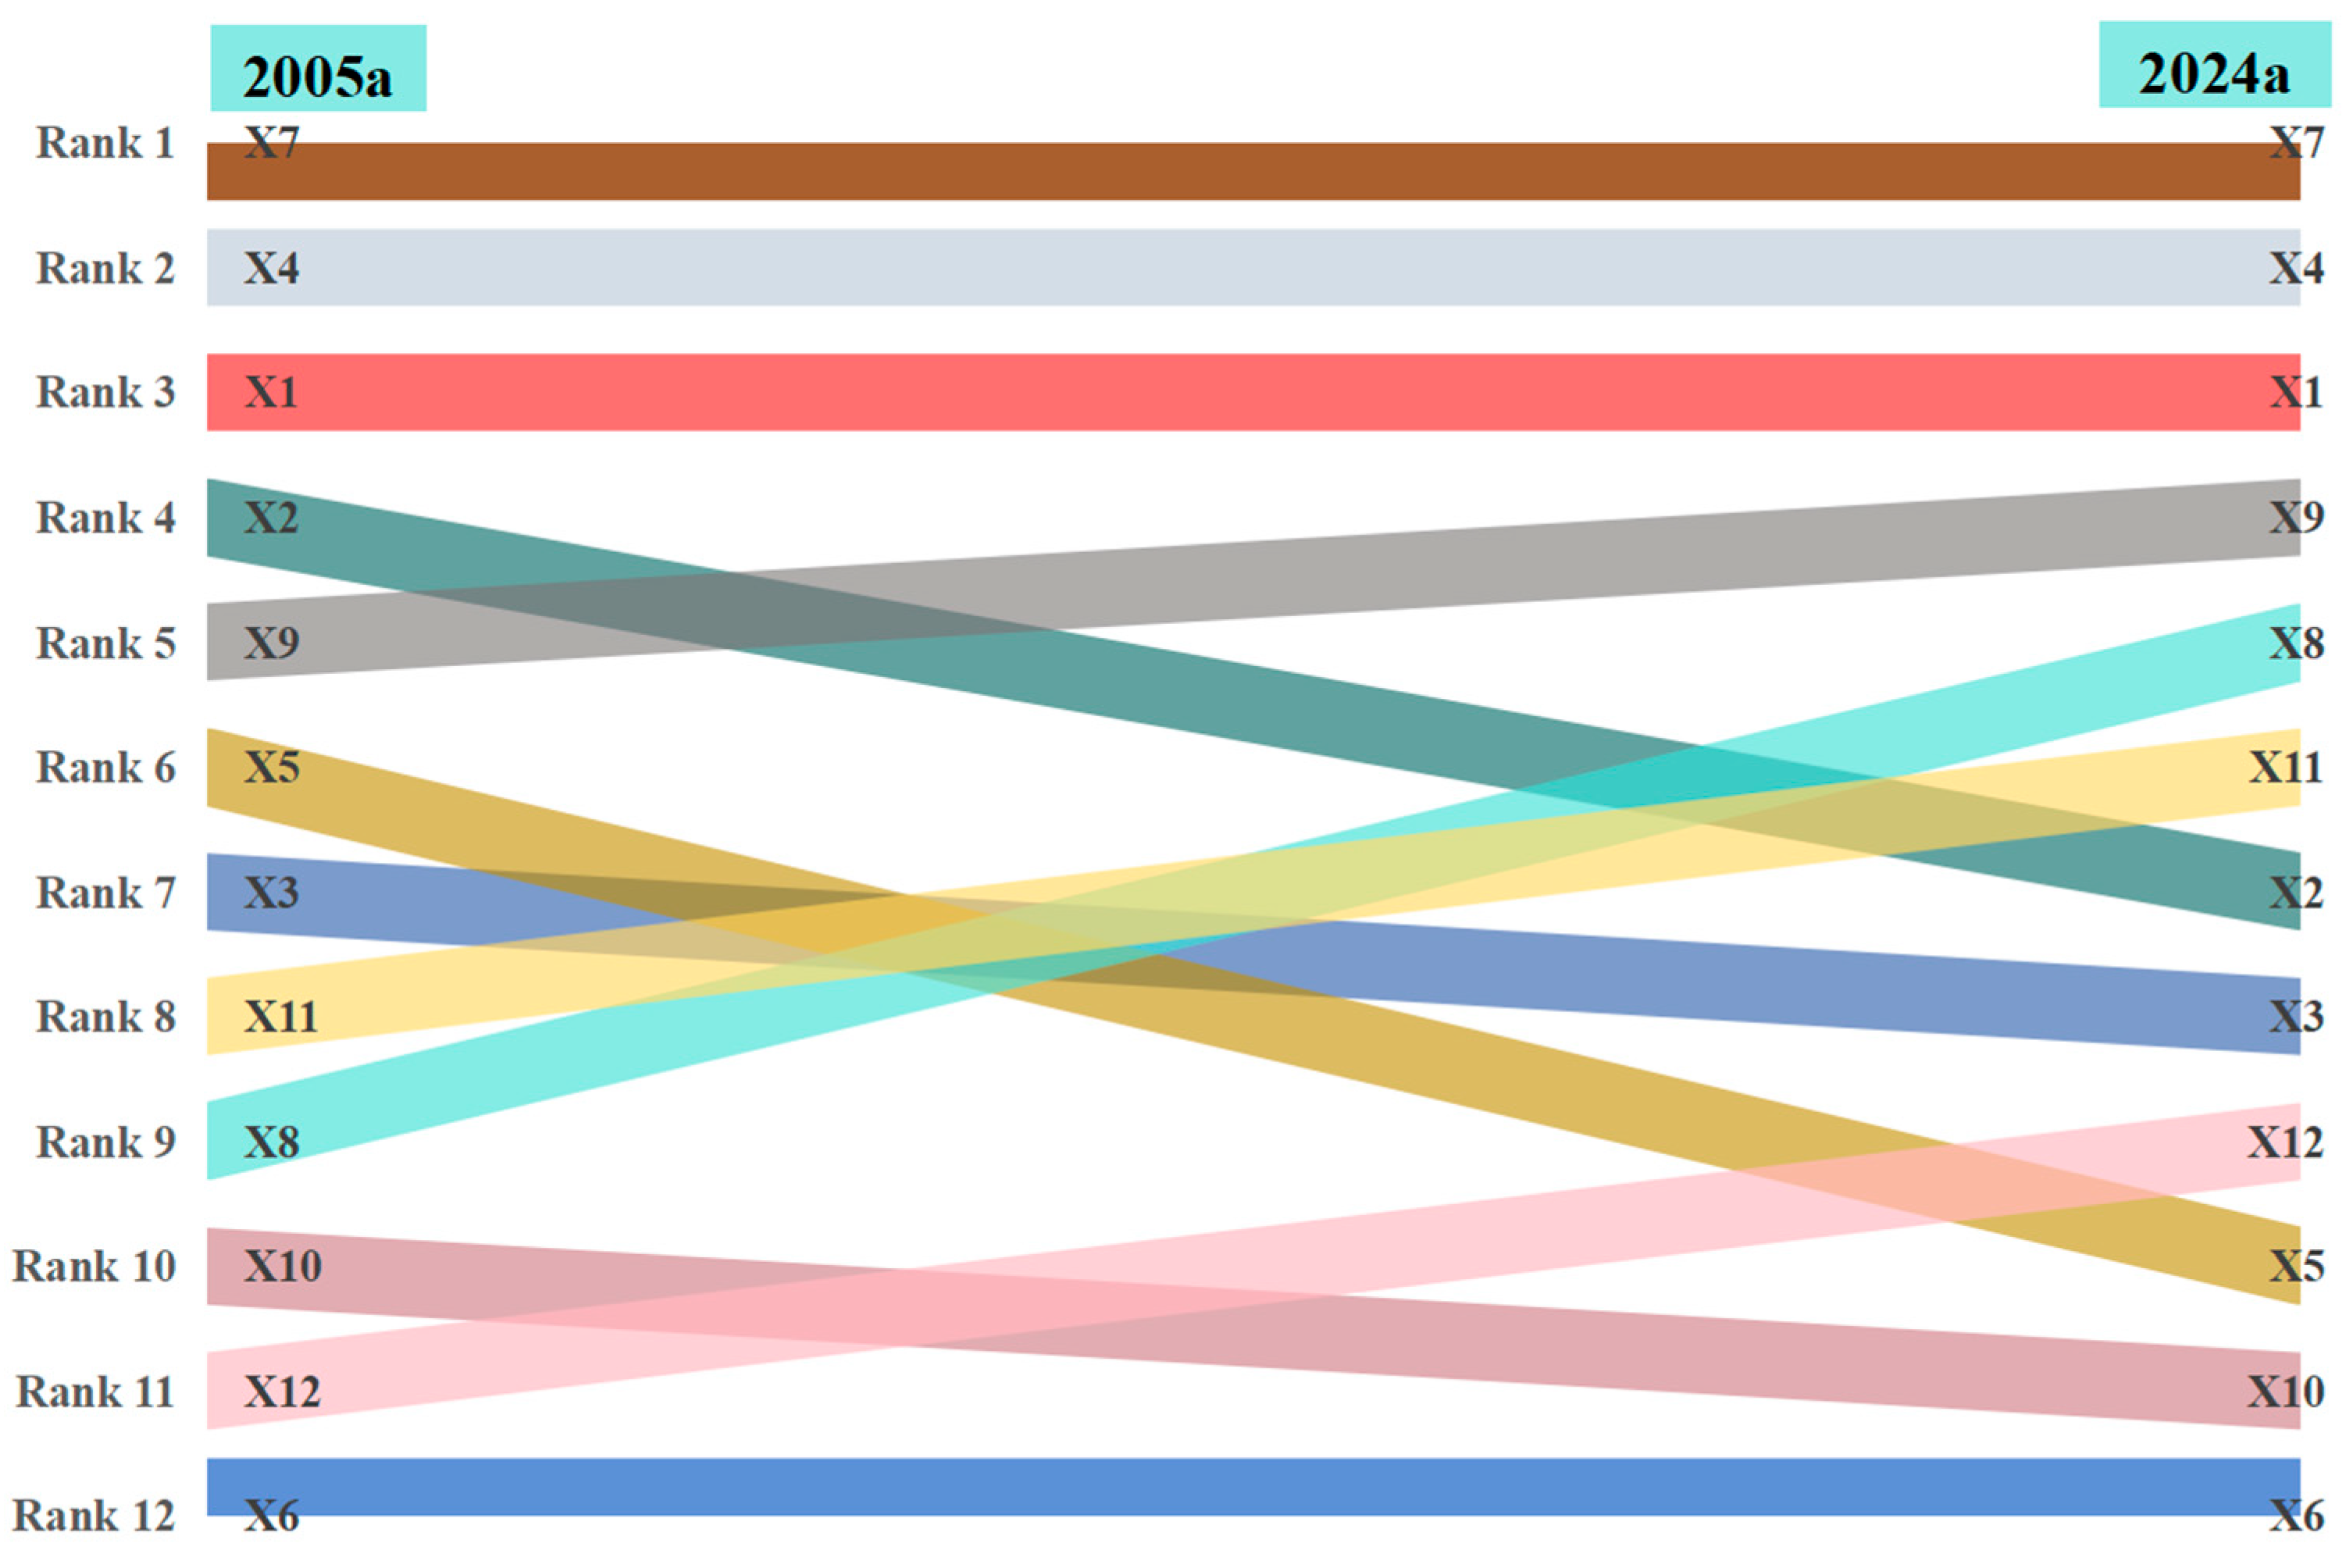
As can be observed from
Table 6 and
Figure 10, during the period from 2005 to 2024, the main influencing factors of the coupling coordination degree in ethnic areas exhibited a “ecological–economic” dual-dominance pattern. Habitat quality (X7) has consistently been a primary influencing factor, with its q-value increasing from 0.439 to 0.493. This indicates that the ecological background has progressively enhanced its core role in maintaining the high-level coupling coordination degree of the Western Sichuan Plateau. Per capita GDP (X1) and urban per capita green area (X4) closely followed (q-values increasing from approximately 0.39 to 0.44), suggesting that the coordinated improvement of economic growth and green welfare is a key factor in breaking the “poverty trap”. Notably, the q-values of unit GDP energy consumption (X8) and carbon emission intensity (X9) increased from 0.126 and 0.238 to 0.296 and 0.372, respectively. This reveals that under the tightening constraints of ecological red lines, the marginal impact of energy structure transformation on the coupling coordination degree has significantly increased. The influence of foreign direct investment (X5) declined from 0.206 to 0.123, indicating that in ethnic areas, the marginal benefit of capital injection gradually decreases, possibly due to insufficient industrial matching and geographical location disadvantages.
The single-factor explanatory power of population density (X2), urbanization rate (X3), and industrial structure has consistently remained below 0.28. This implies that relying solely on population concentration or adjustment of industrial share is challenging in breaking through the coordinated development bottleneck in ethnic areas.
4.5.2. Interactive Detection: Nonlinear Enhancement Through Factor Coupling
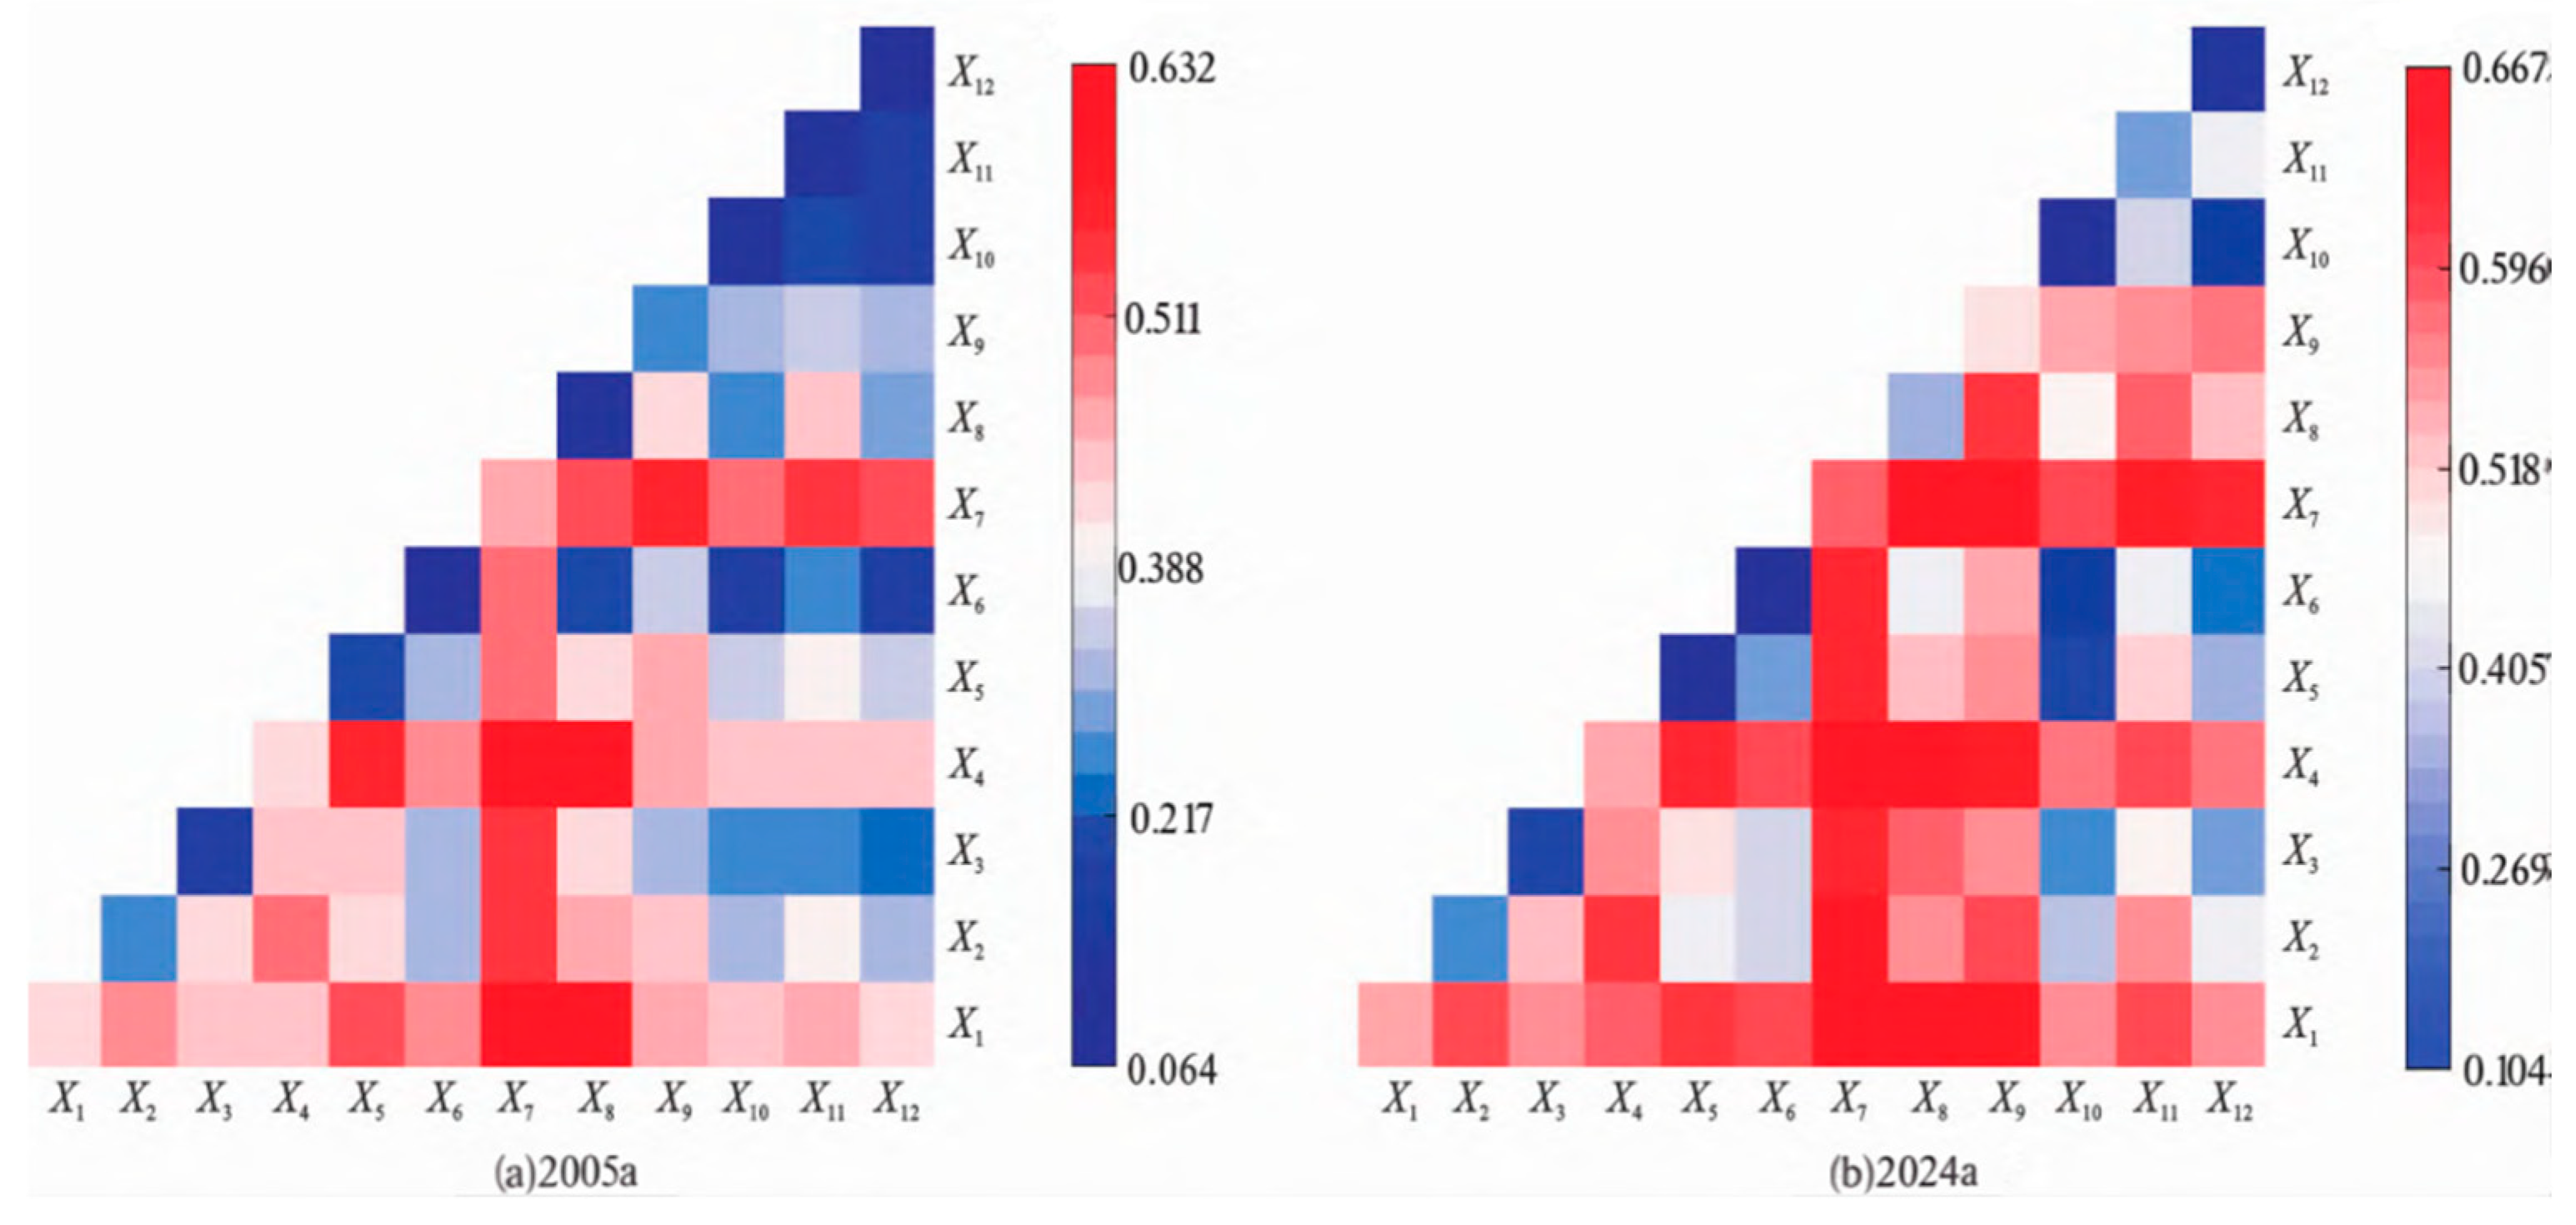
The interactive detection results (
Figure 11) show that the q(X∩Y) of any two factors is greater than the maximum of qX and qY, and 92% of the combinations exhibit the “non-linear enhancement” feature, with the coupling of ecological–economic factors being the most significant.
In 2005, the interactive q value of habitat quality (X7) ∩ per capita GDP (X1) was as high as 0.632, and it further increased to 0.660 in 2024. The 95% confidence interval for this interaction term ranges from 0.610 to 0.680, indicating a high level of statistical confidence in this association. This suggests that a combination of “high habitat quality + high economic level” is associated with maintaining or enhancing the coupling coordination degree. Meanwhile, the interactive q value of per capita GDP (X1) ∩ unit GDP energy consumption (X8) increased from 0.511 to 0.596, with a 95% confidence interval ranging from 0.560 to 0.630. This indicates a strong association between economic growth and energy efficiency improvement, which is crucial for addressing the “development–environment” trade-off in ethnic regions. Additionally, the significant increase in the interactive q values of habitat quality (X7) ∩ carbon emission intensity (X9) (2024 q = 0.518, 95% CI: 0.480–0.550) and urban per capita green area (X4) ∩ the proportion of the secondary industry (X10) (2024 q = 0.405, 95% CI: 0.370–0.440) points to the potential benefits of an “ecological protection + green industrialization” approach. In contrast, the interaction intensity between urbanization rate (X3) or the proportion of the tertiary industry (X11) and other factors is generally lower than 0.30, with 95% confidence intervals ranging from 0.250 to 0.350 for these interactions. This further confirms that ethnic regions should not simply replicate the “high urbanization–high serviceization“ model of the eastern region. In summary, the improvement of the coupling coordination degree in ethnic regions is closely associated with leveraging ecological advantages and achieving coordinated development through the “dual-wheel” coupling of green economic growth and energy structure transformation.
6. Conclusions
This study utilizes panel data from 67 counties in the ethnic minority areas of Sichuan Province spanning from 2005 to 2024. It establishes an integrated analytical framework combining “dynamic Shannon entropy, coupling coordination, and geodetector” to systematically characterize the spatio-temporal evolution patterns of the coupling coordination degree within the economic–social–environment (ESE) system and to identify its key driving mechanisms. The main findings are summarized as follows:
(1) Temporally, the ESE system in ethnic minority areas has experienced a progressive transition from “moderate imbalance → mild imbalance → mild coordination → moderate coordination.” By 2024, counties classified as “coordinated” accounted for 81.8%, with the first emergence of “highly coordinated” counties, indicating that the region has surpassed a critical threshold and entered a green transformation trajectory.
(2) Spatially, the western Sichuan Plateau has consistently exhibited high–high clustering through the “ecological asset monetization + ethnic cultural capitalization” pathway. In contrast, persistent low–low clustering has emerged in the central Sichuan hills and eastern parallel mountain valleys due to path dependence on traditional industrialization. The spatial contraction of high–low and low–high outliers reflects the coexistence of policy-induced polarization and marginalization.
(3) Mechanistically, the interaction between habitat quality and per capita GDP demonstrates the strongest explanatory power (q = 0.660). Over the past two decades, the marginal contributions of unit GDP energy consumption and carbon emission intensity have increased. These findings confirm that “green industrialization” rather than “de-industrialization” serves as the pivotal lever for ethnic minority areas to overcome the “poverty–pollution” trap.
(4) Methodologically, this study integrates gamma–time domain and ecological–frequency domain information into Shannon dynamic entropy, significantly enhancing the stability of panel data weighting. GeoDetector reveals that 92% of factor combinations exhibit nonlinear enhancement, offering a novel methodological paradigm for studying ESE systems in ecologically fragile regions.
Based on the findings, future policies should focus on improving social infrastructure, promoting social equity, protecting cultural diversity, and enhancing social cohesion. These measures will not only support economic growth and environmental sustainability but also ensure social stability and well-being in ethnic minority areas.
In this study, as we attempted to attribute spatial patterns to specific policies such as ecological compensation and tourism development, the study realized the need for greater caution due to the complexity of causal relationships in the real world. To address these limitations and strengthen causal inference in future research, the study proposes several directions. Firstly, future studies could employ quasi-experimental designs, such as the staggered difference-in-differences (DID) method with spatial spillover effects, to better control for confounding factors and provide more robust causal evidence. Secondly, applying interpretable machine learning frameworks can enhance our understanding of the complex interactions between policies and spatial patterns, potentially offering insights into causal mechanisms. Additionally, facilitating cross-regional comparative analyses can help identify generalizable patterns and understand the variability in policy impacts across different contexts. By acknowledging these limitations and suggesting directions for future research, the study aims to make a more rigorous, evidence-based contribution to understanding the impact of policies on spatial patterns, particularly in the context of sustainable development in ethnic minority areas and other ecologically sensitive regions. Such methodological improvements will help enhance the accuracy and reliability of research, providing a more solid scientific basis for policy formulation.
