1. Introduction
The increasing demand for effective electromagnetic (EM) wave absorbers in fields such as telecommunications, defense, and aerospace has led to extensive research into materials that exhibit strong absorption across wide frequency ranges, particularly in the GHz regime. To achieve efficient EM wave absorption, materials must exhibit either dielectric loss, magnetic loss, or a combination of both [
1,
2,
3]. Among various candidates, magnetic ceramics such as hexaferrites are of particular interest due to their intrinsic magnetic loss behavior associated with ferromagnetic resonance (FMR), a phenomenon that enables strong absorption at specific resonance frequencies [
4,
5,
6].
W-type hexaferrites, with the general formula AMe
2Fe
16O
27 (A = Ba or Sr; Me = divalent metal ions such as Zn, Co, or Ni), are considered one of the most promising classes of magnetic ceramics for GHz to tens of GHz applications. Their high saturation magnetization (M
S), elevated Curie temperature, and well-defined FMR behavior make them ideal for EM wave absorber applications [
7,
8,
9,
10,
11,
12]. Importantly, the FMR frequency (
fFMR) in W-type hexaferrites can be tailored through the substitution of cations, which directly affects their magnetic anisotropy. This tunability enables precise control over the frequency band in which absorption occurs, offering a path toward designing materials for specific operational ranges. W-type hexaferrites exhibit either c-axis or c-plane magnetic anisotropy, which can be described by the following two equations [
3,
13,
14].
In these expressions, fFMR denotes the FMR frequency, Ha represents the anisotropy field associated with c-axis magnetic anisotropy, and Hθ and Hφ correspond to the anisotropy fields related to c-plane anisotropy. Moreover, γ is the gyromagnetic ratio, and μ0 is the permeability of free space. The fFMR can be effectively tuned through cation substitution.
Traditionally, Co-containing W-type hexaferrites have been widely studied due to their strong magnetic anisotropy and low FMR frequencies suitable for sub-18 GHz applications. However, cobalt is a relatively expensive and strategically sensitive raw material, motivating the exploration of Co-free alternatives. Replacing Co with other transition metal ions such as Mn, Ni, Cu, or Fe presents an opportunity to develop cost-effective hexaferrite-based absorbers while still maintaining desirable magnetic properties. Moreover, these substitutions can extend the
fFMR into higher GHz ranges, making them attractive for applications in the millimeter-wave regime. In recent years, studies have reported the substitution of Mn, Cu, and Cr into Zn or Fe sites in W-type hexaferrites [
15,
16,
17]; however, there appear to be very few reports that explicitly correlate such substitutions with shifts in
fFMR and their resulting EM wave absorption characteristics above 18 GHz.
In this study, we investigate the EM wave absorption behavior of Ba0.5Sr0.5Zn2−xMexFe16O27 (Me = Fe, Ni, Co, Cu, Mn; x = 1), a series of cation-substituted W-type hexaferrites synthesized via solid-state reaction. Additionally, for Me = Mn, the substitution level (x) was varied from 0.0 to 2.0 to further explore the tunability of fFMR and its effect on EM wave absorption. All powders were composited with 10 wt% epoxy and processed into toroidal and rectangular geometries for high-frequency characterization in the ranges of 0.1–18 GHz and 26.5–40 GHz, respectively. For ferrite-based EM wave absorbers, powder–polymer composites are generally preferred over sintered ceramic bodies due to the superior formability offered by polymer matrices. In the present samples, magnetic loss is considered the dominant EM absorption mechanism, as both the W-type hexaferrite and the epoxy resin exhibit high electrical resistivity, thereby minimizing the contribution of dielectric loss to the overall absorption. Reflection loss (RL) maps were generated to identify frequency–thickness regions of strong absorption and to evaluate the influence of composition on broadband absorption behavior. This work demonstrates that Co-free W-type hexaferrites can achieve significant EM wave absorption in the high-frequency range (26.5–40 GHz), with the potential to tune the absorption band via careful cation substitution. The successful synthesis of Co-free W-type hexaferrites with tunable FMR behavior and efficient absorption in the millimeter-wave band highlights the potential of these materials for next-generation EM wave absorbing applications. This study offers valuable insights into the design of high-frequency EM absorbers using cation substitution in W-type hexaferrites and opens pathways toward cobalt-free, cost-effective solutions for advanced electromagnetic interference (EMI) shielding technologies.
2. Materials and Methods
W-type hexaferrites with the chemical compositions Ba0.5Sr0.5ZnMeFe16O27 (Me = Fe, Ni, Co, Mn, Cu) and Ba0.5Sr0.5Zn2−xMnxFe16O27 (x = 0.0, 0.5, 1.0, 1.5, 2.0) were synthesized via the conventional solid-state reaction method. The precursor powders—Fe2O3 (99.9%, Kojundo Chemical, Seoul, Republic of Korea) BaCO3 (99+%, Kojundo Chemical), SrCO3 (99.9%, Kojundo Chemical), ZnO (99.9%, Kojundo Chemical), Mn2O3 (99.9%, Kojundo Chemical), NiO (99.97%, Kojundo Chemical), and CuO (99.9%, Kojundo Chemical)—were weighed according to the desired cation ratios. The weighed mixtures were placed in polypropylene bottles with deionized water and ZrO2 balls, dried in an oven at 120 °C, and then subjected to a first calcination in an air atmosphere furnace at 900 °C for 6 h. The calcined powders were ground to pass through a #80 mesh sieve and then underwent a second calcination at 1300 °C for 6 h, followed by furnace cooling. A heating rate of 5 °C/min was applied for both calcinations. The resulting powders were further ground to pass through a #200 mesh sieve. To prepare samples for vector network analyzer (VNA) measurements, each powder was mixed with an epoxy binder (YD-014, Kukdo Chemical, Seoul, Republic of Korea) at a ratio of 90 wt% powder to 10 wt% epoxy. Approximately 0.3 g of the mixture was molded into a toroidal shape (inner diameter: 3.03 mm, outer diameter: 7.00 mm). Additionally, 0.15 g of the same mixture was molded into a rectangular shape (3.5 mm × 7.4 mm). The molded samples were heat-treated in a drying oven at 180 °C for 20 min, followed by post-processing to meet the dimensional requirements for VNA measurements.
The crystalline structure of the ferrite powders was analyzed by X-ray diffraction (XRD, D8 Advance, Bruker, Karlsruhe, Germany) using Cu Kα radiation (λ = 0.154056 nm). The microstructure of the calcined powders was observed using field-emission scanning electron microscopy (FE-SEM, JSM-7610F, JEOL, Tokyo, Japan). M–H curves were measured on second-calcined powder samples using a vibrating-sample magnetometer (VSM, EZ9, MicroSense, Lowell, MA, USA) at room temperature with a sweeping H field within ±25 kOe. For the measurements, the powder samples were mixed with paraffin in a 1:1 ratio and solidified. The complex permittivity (ε = ε′ − jε″) and complex permeability (μ = μ′ − jμ″) of the ferrite–epoxy composites were measured over two frequency ranges. In the 0.1–18 GHz range, toroidal samples (inner diameter: 3.03 mm, outer diameter: 7.00 mm) were tested using a vector network analyzer (VNA, E50356A, Keysight, Santa Rosa, CA, USA) with an airline kit (85052BR03) and N1500A software. For the 26.5–40 GHz range, rectangular samples (3.5 mm × 7.4 mm) were measured using a VNA (E8364A, Agilent Technologies, Santa Rosa, CA, USA) connected to a waveguide calibration kit (R11644A, Keysight), with measurements performed using 85071E software.
3. Results and Discussion
Figure 1a,b shows the X-ray diffraction (XRD) patterns of Ba
0.5Sr
0.5ZnMeFe
16O
27 (Me = Fe, Ni, Co, Mn, Cu) and Ba
0.5Sr
0.5Zn
2−xMn
xFe
16O
27 (
x = 0.0, 0.5, 1.0, 1.5, 2.0) powders after the second calcination at 1300 °C. Phase identification of the W-type hexaferrite was performed by matching the diffraction peaks with reference data from the ICDD database (PDF card No. 01-084-0927), and the corresponding standard peaks are displayed at the bottom of each figure. The diffraction planes (hkl indices) of the W-type phase are also labeled accordingly. In
Figure 1a, single-phase W-type structures were observed for Me = Fe and Mn. In contrast, minor secondary phases of spinel-type Fe
3O
4 were detected in samples with Me = Co and Ni, while the sample with Me = Cu exhibited the most prominent spinel secondary peaks. The peak located near 2θ ~35.5° corresponds to the (311) plane, the main diffraction peak of the spinel phase, and may suggest partial substitution of Zn into the Fe
3O
4 lattice. Given the relatively high calcination temperature of 1300 °C—higher than typical values—it is possible that some trivalent cations, such as Fe
3+, were partially reduced. This may explain why divalent Mn and Fe resulted in more stable formation of the W-phase compared to Ni, Co, and Cu. In
Figure 1b, a similar trend was observed in the Mn-substituted series. While the composition with
x = 0 (i.e., Ba
0.5Sr
0.5Zn
2Fe
16O
27) exhibited minor spinel peaks, the samples with
x > 0 showed complete suppression of these peaks, indicating successful synthesis of a single-phase W-type hexaferrite. Given that spinel phases, owing to their cubic symmetry and high multiplicity factors, tend to produce relatively intense XRD peaks even when present in small amounts, the results indicate that all the synthesized samples are predominantly composed of the W-type hexaferrite phase, with only minimal, if any, contributions from secondary spinel phases.
The lattice parameters and unit cell volumes of the W-type hexaferrites were calculated from the d
hkl values derived from the 2θ peak positions corresponding to the (1 1 0), (1 0 10), (1 1 6), and (1 0 11) planes, as summarized in
Table 1 [
5]. The unit cell volume of Ba
0.5Sr
0.5ZnMeFe
16O
27 (
x = 0), in which no substitution occurs at the Zn site, is larger than those of the Ba
0.5Sr
0.5ZnMeFe
16O
27 (Me = Fe, Ni, Co, Mn, Cu) samples with
x = 1.0, further supporting the trend that Zn
2+ has a larger ionic radius than the substituted Me
2+ ions. Among them, the sample with Mn substitution shows the smallest unit cell volume. In the Ba
0.5Sr
0.5Zn
2−xMn
xFe
16O
27 (
x = 0.0, 0.5, 1.0, 1.5, 2.0) series, a significant decrease in unit cell volume is observed with increasing
x up to
x = 1.5. However, beyond this point, the cell volume remains nearly constant (
x = 1.0 and
x = 1.5) and even shows a slight increase at
x = 2.0, suggesting a limit in lattice contraction or possible structural relaxation at higher Mn substitution levels.
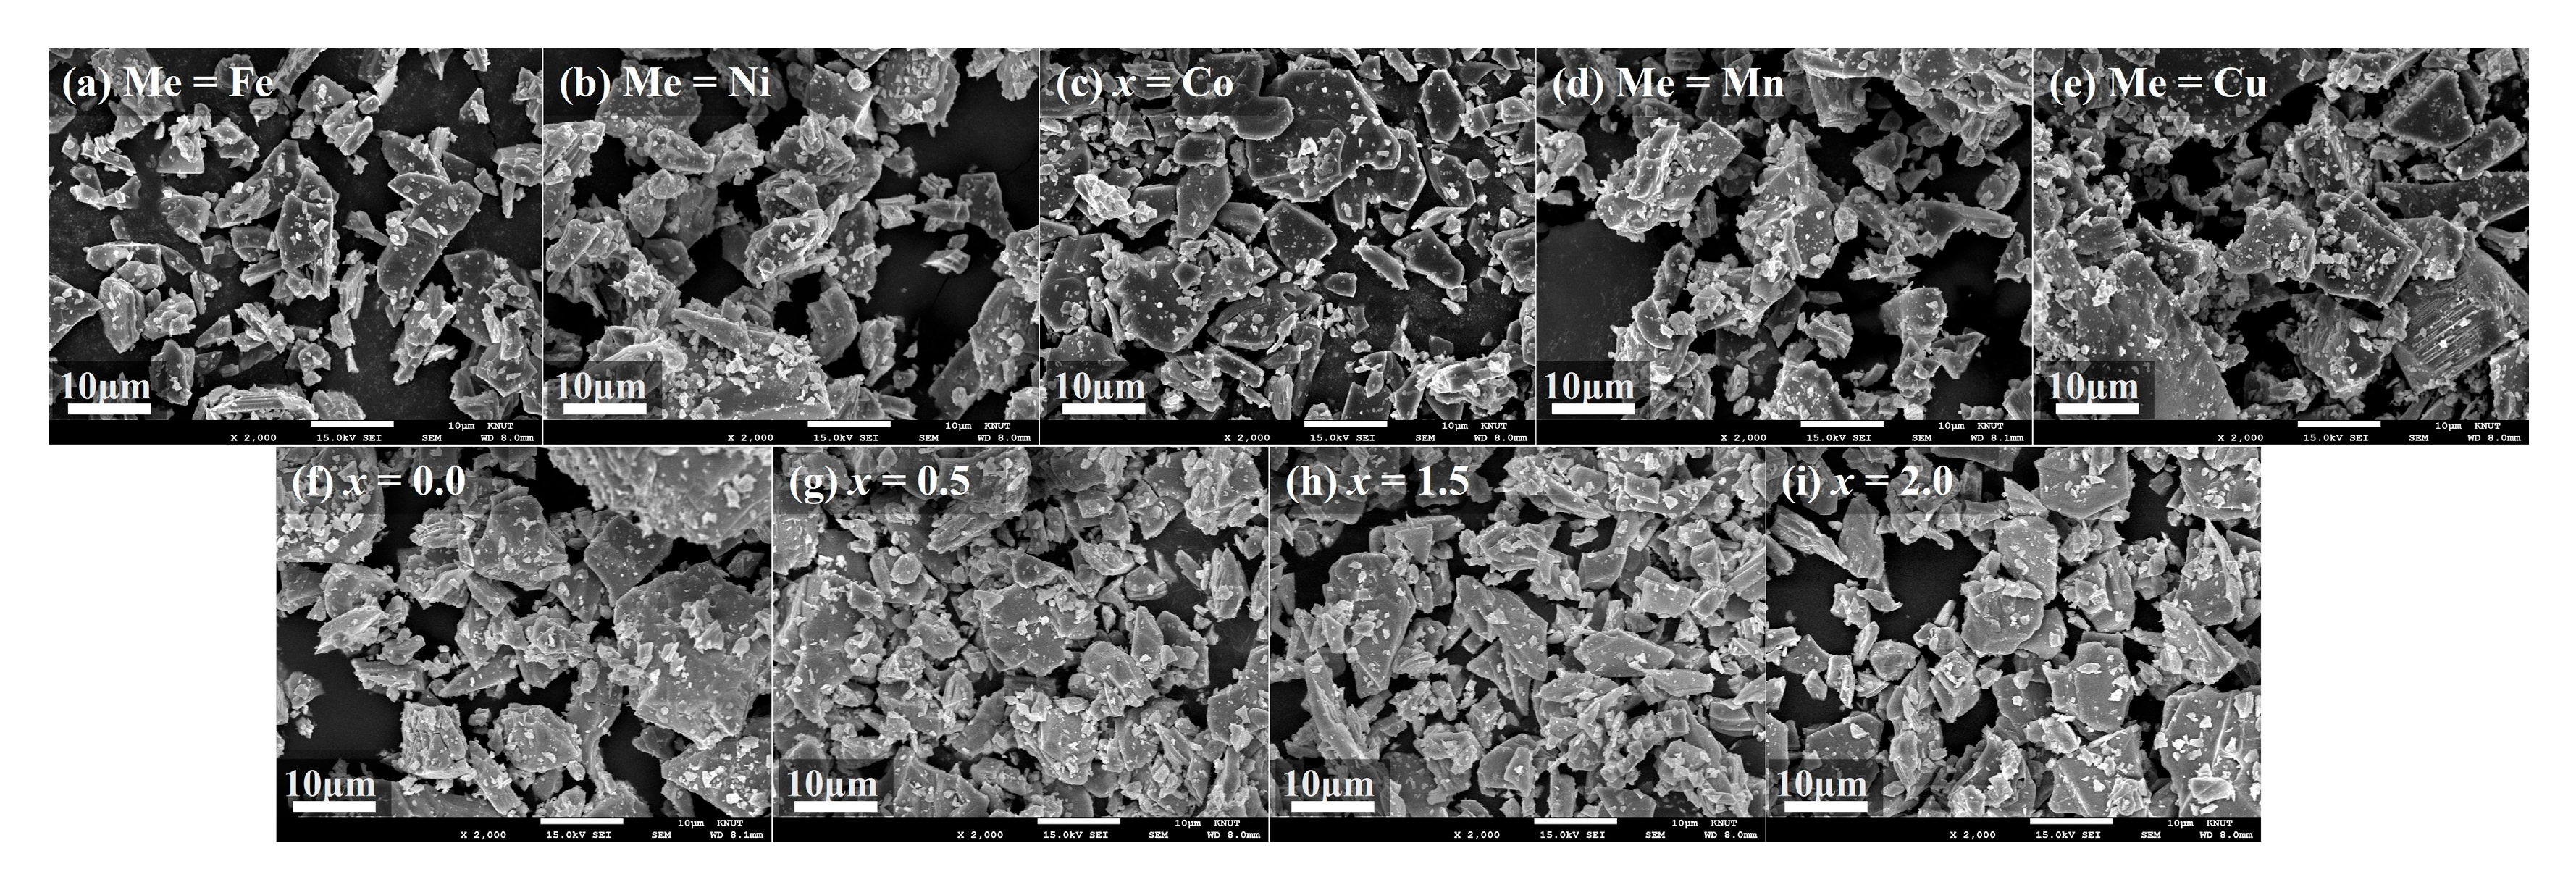
Figure 2a–i present the microstructures of Ba
0.5Sr
0.5ZnMeFe
16O
27 powders (Me = Fe, Ni, Co, Mn, Cu;
Figure 2a–e) and Ba
0.5Sr
0.5Zn
2−xMn
xFe
16O
27 powders (
x = 0.0, 0.5, 1.0, 1.5, 2.0;
Figure 2f–i) after the second calcination at 1300 °C in air followed by mechanical grinding. The image corresponding to
x = 1.0 in the Mn-substituted series is omitted, as it is identical to that of the Me = Cu sample shown in
Figure 2c. In all samples, high-temperature calcination promoted the growth of plate-like hexaferrite grains to sizes ranging from several to tens of micrometers. Due to subsequent hand grinding, the grains appear irregularly fractured. Among the Me-substituted samples, the Me = Cu composition exhibited the most pronounced grain growth, resulting in visibly larger particles even after grinding. This observation is consistent with the relatively intense (0012) peak observed in the XRD pattern of the Me = Cu sample in
Figure 1a, likely due to the preferential alignment of large plate-like grains parallel to the sample holder surface during XRD sample preparation, leading to preferred orientation along the (00l) planes [
18,
19,
20]. In the Ba
0.5Sr
0.5Zn
2−xMn
xFe
16O
27 series, the
x = 0 composition (i.e., no Mn substitution) exhibited the largest grain size, while no significant systematic variation in microstructure was observed with increasing Mn content. Within the grain size range of several to several tens of micrometers, such variations in particle size are not expected to have a meaningful impact on the high-frequency dielectric and magnetic properties or on the EM wave absorption performance of hexaferrites.
Figure 3a,b present the M–H curves of Ba
0.5Sr
0.5ZnMeFe
16O
27 (Me = Fe, Ni, Co, Mn, Cu) and Ba
0.5Sr
0.5Zn
2−xMn
xFe
16O
27 (
x = 0.0, 0.5, 1.0, 1.5, 2.0) samples. In each figure, the region near the origin is enlarged and displayed as an inset in the upper left corner. The M
S values measured at H = 25 kOe and the coercivity (H
C) values are summarized in
Table 1. Among the various substituted elements, the Me = Co sample exhibits the fastest magnetization, the highest M
S of 81.7 emu/g, and the lowest H
C of 23.9 Oe. It is well known that the main factors influencing H
C are the magnetocrystalline anisotropy constant (K
1) and grain size; for the Me = Co sample, the low H
C is primarily attributed to its lower K
1 compared with the other samples. For the Me = Cu sample, the relatively fast initial magnetization and low H
C are likely due to the significantly enlarged grains, as shown in
Figure 2e. The Cu- and Mn-substituted samples exhibit lower M
S values compared with the other samples. The variation in M
S is considered to originate from the Bohr magneton (μ
B) values of the substituting ions and their preferential occupation sites within the ferrimagnetic W-type crystalline structure; however, a detailed analysis of this effect is beyond the scope of the present study. For the Ba
0.5Sr
0.5Zn
2−xMn
xFe
16O
27 series (
Figure 3b), it is noteworthy that M
S increases with Mn substitution up to
x = 1.0 and subsequently decreases, while H
C generally increases with increasing
x.
Figure 4a–d present the high-frequency complex permittivity and permeability spectra of Ba
0.5Sr
0.5ZnMeFe
16O
27 (Me = Fe, Ni, Co, Mn, Cu)–epoxy (10 wt%) composites. In the ε′ and ε″ spectra shown in
Figure 4a,b, the most notable feature is that the Cu-substituted sample exhibits the highest permittivity values. Above 10 GHz, noise signals are commonly observed across all samples. As previously reported [
11], EM wave absorption in hexaferrites is predominantly governed by magnetic loss mechanisms. Therefore, such permittivity-related noise or relative differences in dielectric behavior are expected to have minimal influence on the overall absorption performance. In the μ′ and μ″ spectra in
Figure 4c,d, the most significant variation is observed for the Co-substituted sample. In hexaferrites, the real part of permeability (μ′) is influenced primarily by domain wall motion (
f < 1 GHz) and FMR phenomena (
f > 1 GHz). The Ba
0.5Sr
0.5ZnCoFe
16O
27 sample, which exhibits the lowest magnetic anisotropy among the compositions, shows substantially higher permeability values in the entire frequency range (0.1 ≤
f ≤ 18 GHz) owing to both active domain wall motion and the presence of FMR. The
fFMR for this sample is identified at 4.3 GHz, as indicated by the peak in the μ″ spectrum in
Figure 4d. For the other four samples (Me = Fe, Mn, Ni, Cu), no clear FMR signature is observed within the measured frequency range, suggesting that their FMR frequencies lie beyond 18 GHz due to higher magnetic anisotropy. At frequencies below 1 GHz, these samples display μ′ > 1 and μ″ > 0 due to domain wall motion. However, as the frequency increases beyond 1 GHz, the contribution from domain wall motion diminishes, resulting in μ′ approaching 1 and μ″ approaching 0. As expressed in Equations (1) and (2), magnetic anisotropy and
fFMR are directly proportional. According to Snoek’s limit law [
13], as expressed following equation, the static permeability (
μs) decreases as the
fFMR increases.
Here, γ is a constant called gyromagnetic ratio, and Ms is the saturation magnetization value. At f = 0.1 GHz, the μ′ values of the four samples with relatively high magnetic anisotropy (Me = Fe, Mn, Ni, Cu) range from 2.0 to 2.5, whereas the μ′ value of the Me = Co sample reaches approximately 4.6, exhibiting a significant difference. The relatively high permeability observed in Ba0.5Sr0.5ZnCoFe16O27 over the 0.1–18 GHz range is consistent with this principle.
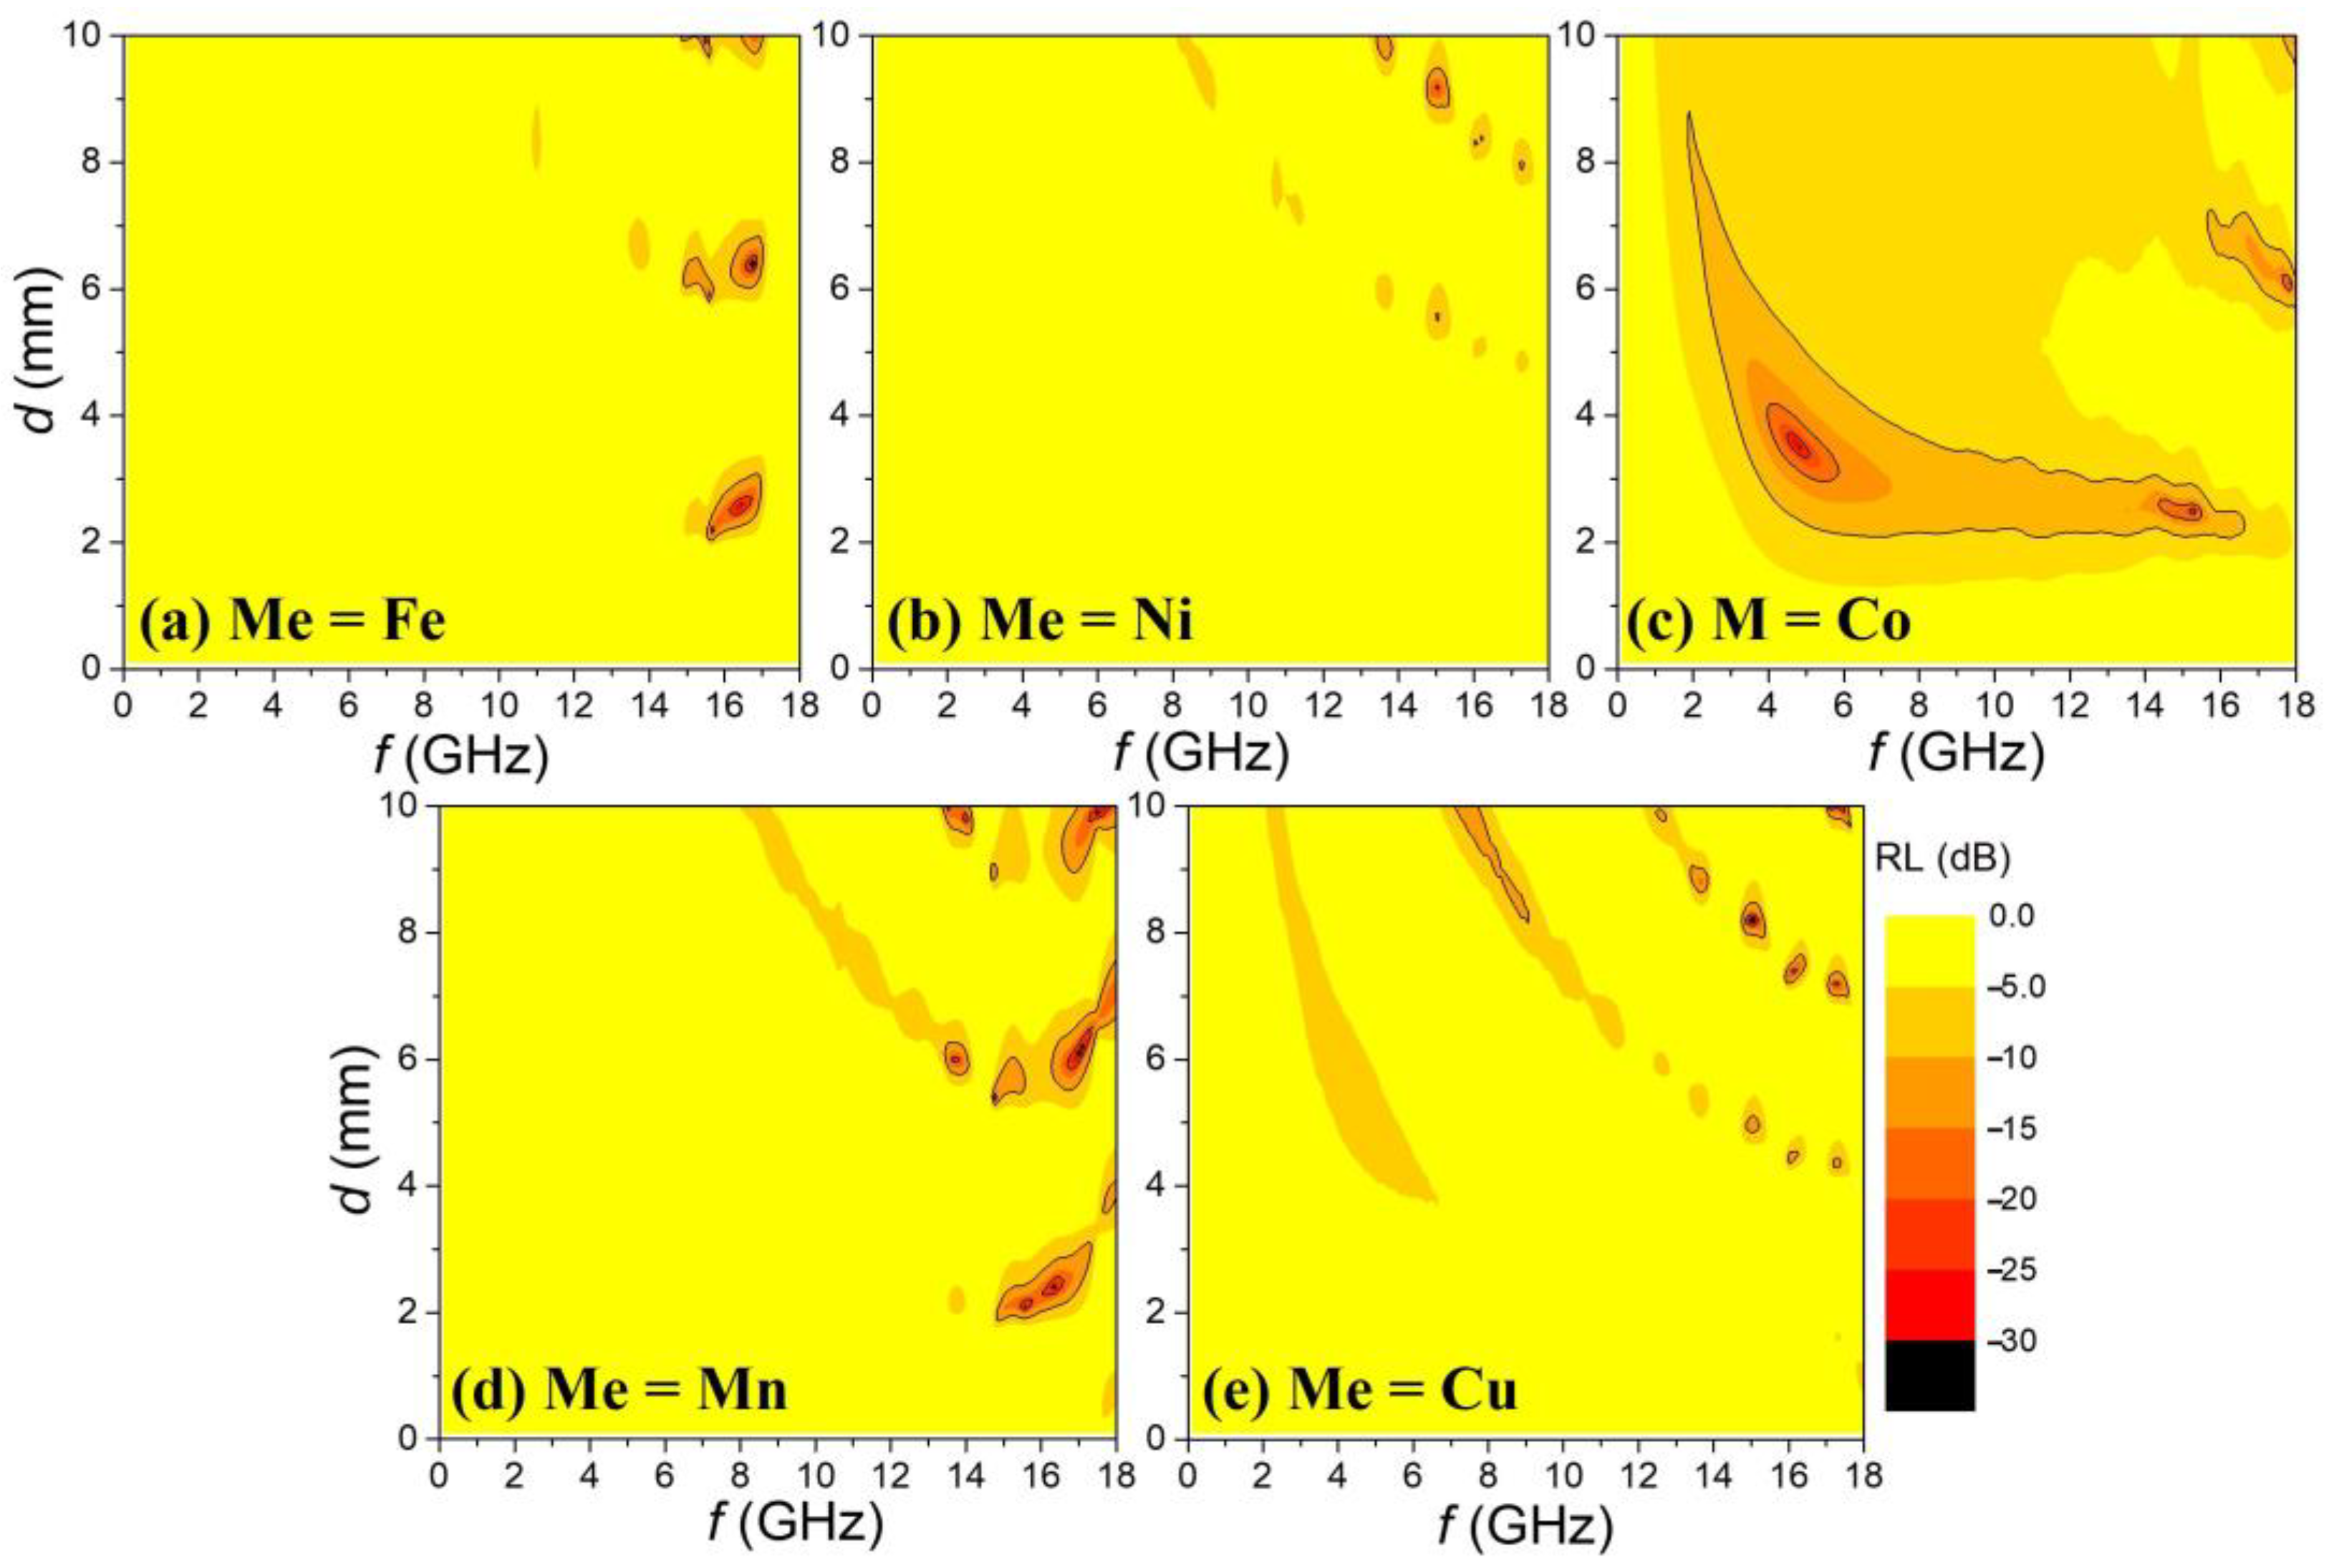
Figure 5a–e shows two-dimensional maps of reflection loss (RL) values as functions of frequency and sample thickness (0 ≤
d ≤ 10 mm), calculated from the ε′, ε″, μ′, and μ″ spectra in
Figure 4 using the transmission line theory [
21] equations described below.
Here, is the normalized input impedance of the absorber, is the characteristic impedance of free space, c is the speed of light, f is the frequency of the incident EM wave, and d is the thickness of the absorber.
In the RL maps, regions with more negative RL values are represented by progressively darker shading in 5 dB intervals. Additionally, the areas enclosed by solid lines indicate regions where RL < −10 dB, with solid contours drawn at every 10 dB decrement within this range. Only the sample with Me = Co, which exhibits high μ′ and μ″ spectra over the measured frequency range (0.1 ≤ f ≤ 18 GHz), shows a broad EM wave absorption pattern. In contrast, the other samples do not exhibit significant absorption patterns due to the absence of FMR, which is the primary magnetic loss mechanism for EM wave absorption.
Accordingly, for the Ba
0.5Sr
0.5ZnMeFe
16O
27 (Me = Fe, Ni, Mn, and Cu) powder–epoxy (10 wt%) samples, it was anticipated that FMR would occur at higher frequency ranges. Therefore, ε′, ε″, μ′, and μ″ spectra were measured in the frequency range of 26.5 ≤
f ≤ 40 GHz and are presented in
Figure 6a–d. As expected, distinct FMR signals varying with substitution composition were observed in the μ′ and μ″ spectra of
Figure 6c,d. The
fFMR was identified from the peak frequency in the μ″ spectra. Among the samples, Me = Mn exhibited the lowest
fFMR at 32.8 GHz, while Me = Cu showed the highest at 36.8 GHz, with the other two samples falling in between. In addition, the μ′ and μ″ spectra of the Ba
0.5Sr
0.5Zn
2−xMn
xFe
16O
27 (
x = 0.0, 0.5, 1.0, 1.5, 2.0) powder–epoxy (10 wt%) samples were measured and are shown in
Figure 6e–h. The
fFMR values also varied with the amount of Mn substitution: the lowest
fFMR was observed at
x = 1.0, and a gradual increase in
fFMR was seen as the
x value either decreased or increased from this point. The
fFMR values for each sample are summarized in
Table 2.
The variation in
fFMR can be explained by changes in magnetic anisotropy resulting from cation substitution, as indicated by Equations (1) and (2). In the case of the Me = Co sample, it is known that the substitution of Zn by Co effectively reduces the magnetic anisotropy, leading to a transition from c-axis anisotropy to planar anisotropy in the substitution level range of
x = 0.75–1.0 [
11,
22]. Consequently, the
fFMR decreases from 35 GHz in Ba
0.5Sr
0.5Zn
2Fe
16O
27 to 4.3 GHz in Ba
0.5Sr
0.5ZnCoFe
16O
27 when Co is substituted at the
x = 1.0 level. In contrast, the samples with Me = Ni, Cu, Mn, and Fe appear to retain c-axis anisotropy even at the
x = 1.0 substitution level, with
fFMR values remaining within the 32–35 GHz range. As shown in
Figure 3b and
Table 1, in the Ba
0.5Sr
0.5Zn
2−xMn
xFe
16O
27 series, the M
S increases with Mn content up to
x = 1.0 and decreases thereafter. This trend suggests that variations in M
S play a dominant role in determining the anisotropy field (H
a = 2K
1/M
S), where changes in H
a are primarily governed by M
S. Consequently, through Equations (1) and (2), the observed changes in
fFMR are correlated with variations in M
S. The fact that the
x = 1.0 sample exhibits the lowest
fFMR is therefore closely related to its highest M
S value within the series.
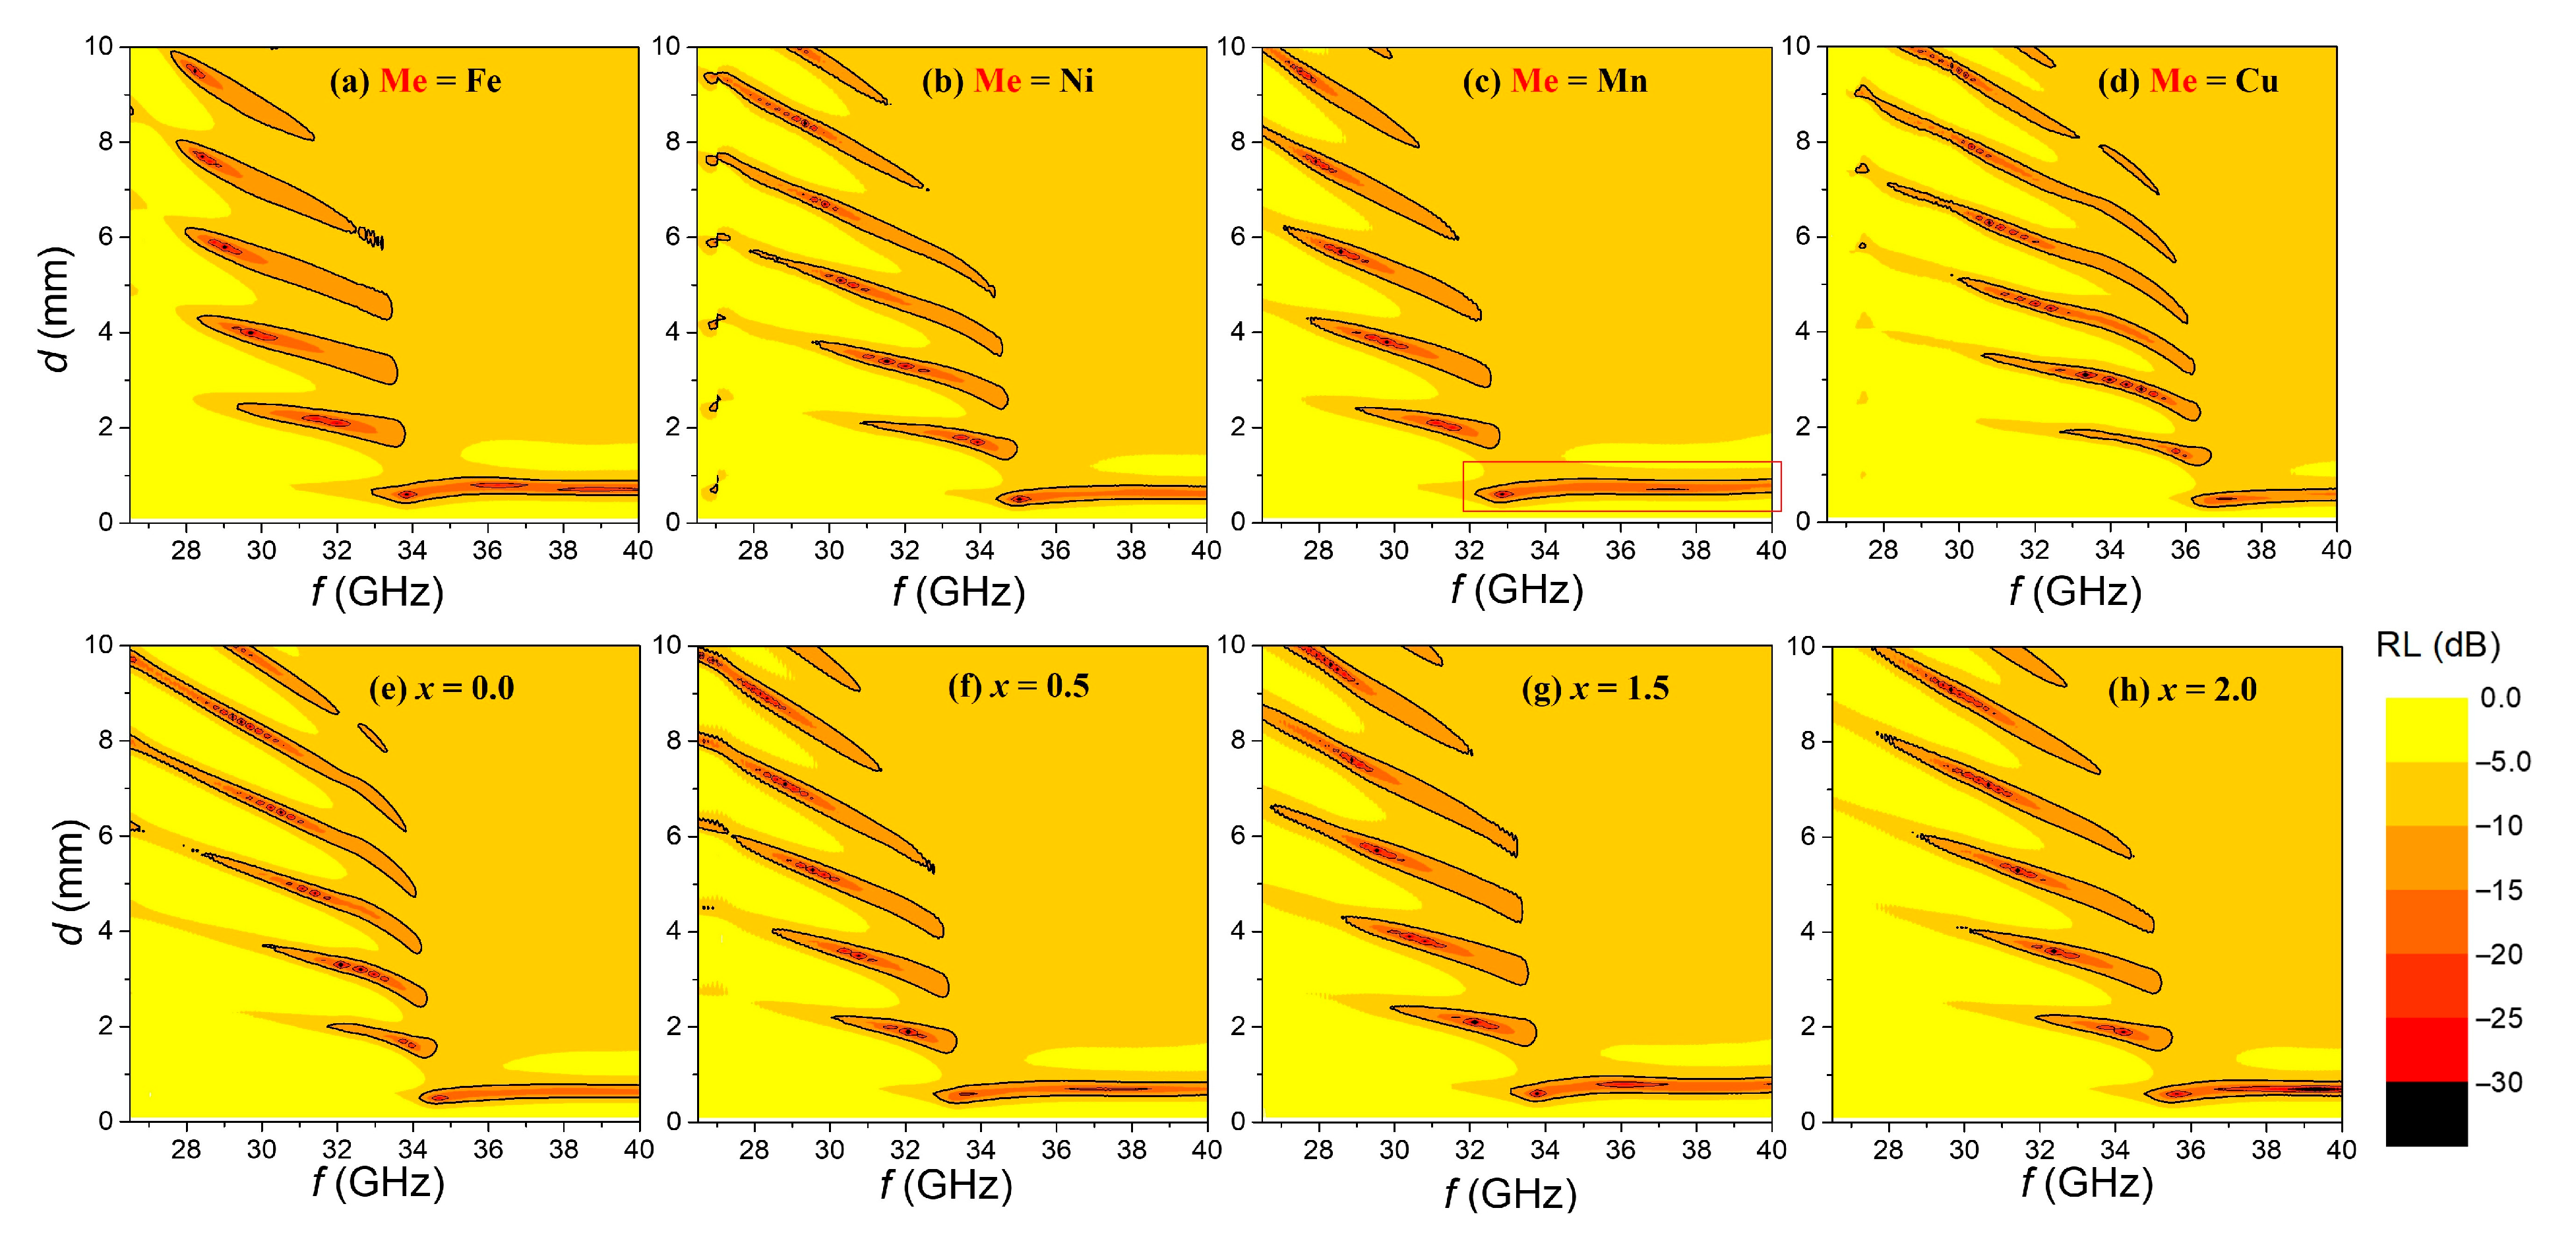
Figure 7a–h present the RL maps derived from the ε′, ε″, μ′, and μ″ spectra shown in
Figure 6, calculated using Equations (4) and (5).
Figure 7a–d correspond to Ba
0.5Sr
0.5ZnMeFe
16O
27 (Me = Fe, Ni, Mn, and Cu)–epoxy composites, while
Figure 7e–h depict the RL maps for Ba
0.5Sr
0.5Zn
2−xMn
xFe
16O
27 samples with varying Mn substitution levels (
x). In all samples, the EM wave absorption bands satisfying RL < −10 dB—indicated by solid contour lines—appear periodically as a function of thickness. A primary absorption band elongated horizontally is observed at the lowest thickness, and with increasing thickness, additional absorption bands reappear repeatedly at thicknesses that satisfy impedance matching conditions. Of particular interest is the primary absorption band at the lowest-thickness region (
d < 1 mm), where the minimum reflection loss (RL
min), the corresponding frequency, and the bandwidth (Δ
f) satisfying RL < −10 dB are clearly seen.
Among the Me = Fe, Ni, Mn, and Cu samples, the Mn-substituted sample exhibits the primary absorption band extending to the lowest frequencies. In
Figure 7c, the primary absorption band region is highlighted with a red box. Since frequencies above 40 GHz are beyond the measurement range, the exact cutoff frequency of the absorption band is unknown; however, changes in the primary absorption band frequency range closely correspond to the samples’
fFMR values. It is evident that the absorption frequency band shifts lower as
fFMR decreases. For the Ba
0.5Sr
0.5Zn
2−xMn
xFe
16O
27 series (
x = 0.0, 0.5, 1.0, 1.5, 2.0), the sample with
x = 1.0 shows the lowest
fFMR, and when comparing its RL map (
Figure 7c) with those of samples with
x = 0.0, 0.5, 1.5, and 2.0 (
Figure 7e–h), the primary absorption band shifts progressively toward higher frequencies in correspondence with increasing
fFMR values. Because the EM wave absorption mechanism of W-type hexaferrites is governed by FMR [
11], the precise shift of the primary absorption band directly follows the variation in the
fFMR. As noted earlier, changes in the
fFMR arise from cation substitution, which alters intrinsic material parameters such as the M
S and the K
1.
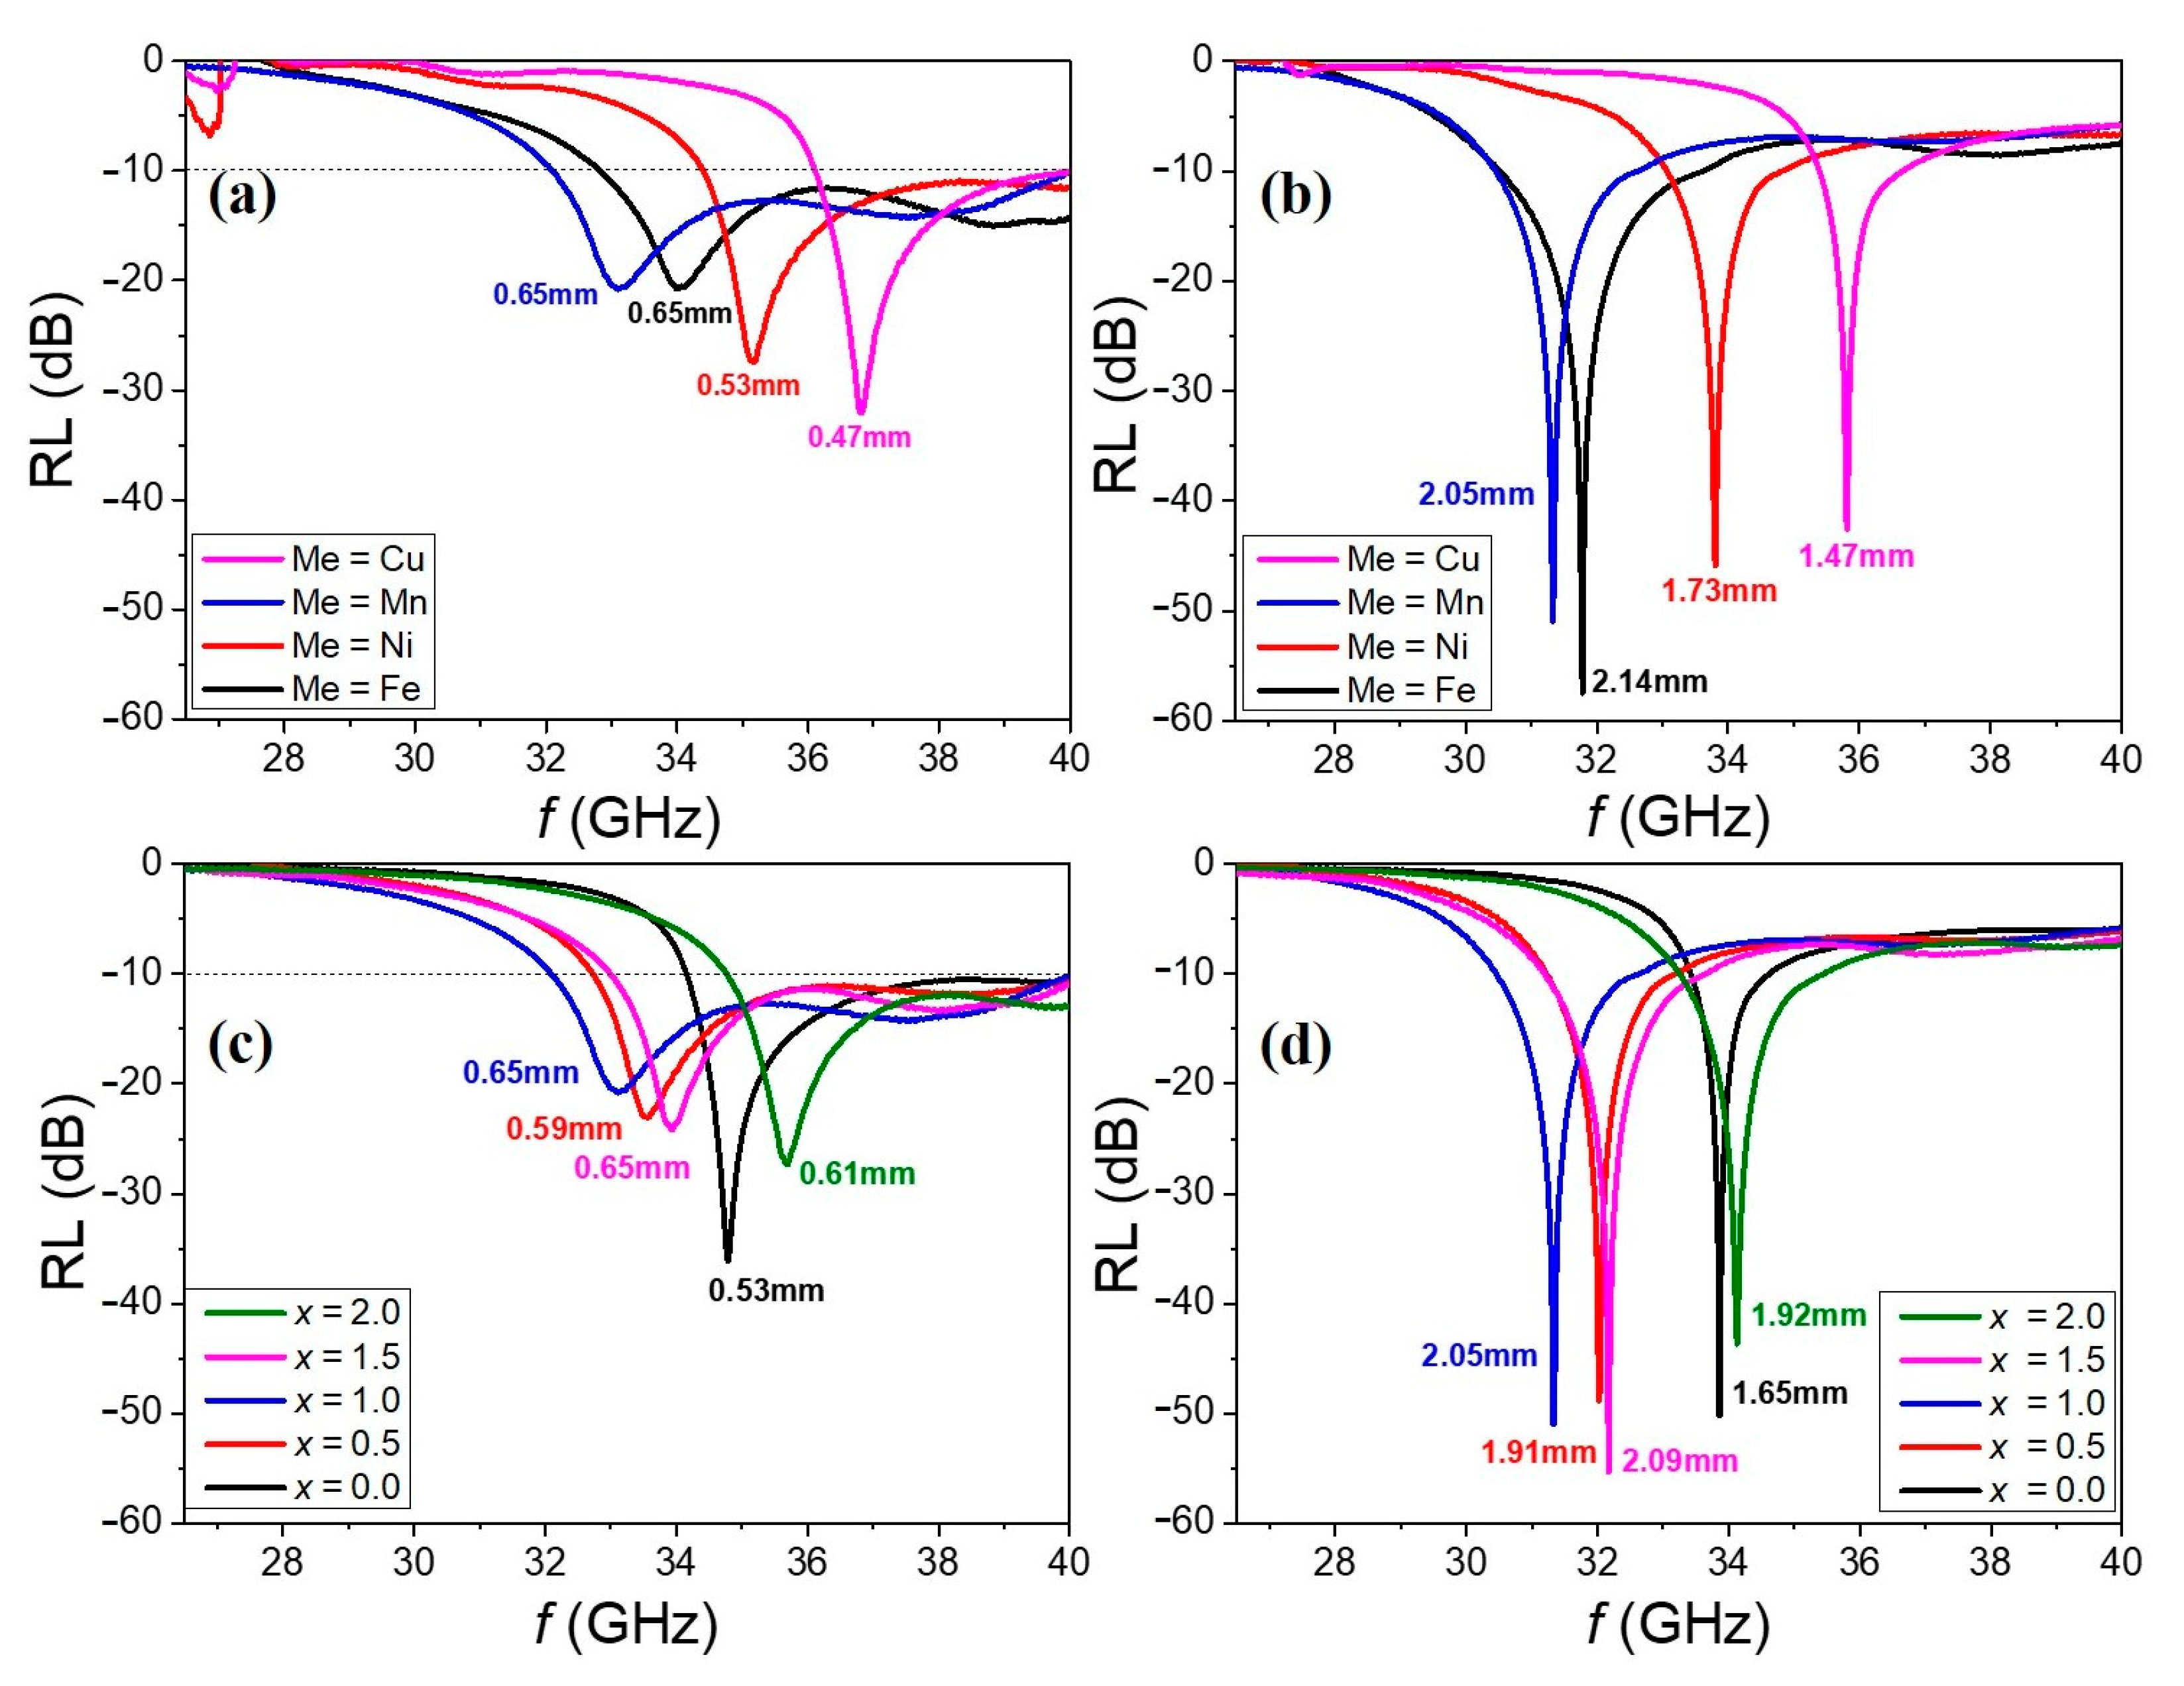
Figure 8a,b present the RL spectra of Ba
0.5Sr
0.5ZnMeFe
16O
27 (Me = Fe, Ni, Mn, Cu)–epoxy (10 wt%) composites, while
Figure 8c,d show the RL spectra of Ba
0.5Sr
0.5Zn
2−xMn
xFe
16O
27 (
x = 0.0, 0.5, 1.0, 1.5, 2.0)–epoxy (10 wt%) composites at selected thicknesses.
Figure 8a,c correspond to the RL spectra measured at the thicknesses where the absorption bandwidth (Δ
f) is maximized for each composition within the measured frequency range.
Figure 8b,d show the RL spectra at the thicknesses where the minimum reflection loss (RL
min) is observed. The values of RL
min, the corresponding frequency (
fRLmin), and the absorber thickness at RL
min (
dRLmin), as well as the maximum Δ
f values along with their respective thicknesses and frequency ranges, are summarized in
Table 2. Although the absorption bands vary slightly with changes in the cation substitution levels and corresponding
fFMR shifts, all samples exhibit excellent absorption performance within the 32–40 GHz range at thicknesses around 0.4 to 0.6 mm. If the measurement frequency range had extended beyond 40 GHz, it is expected that the bandwidth Δ
f for all samples would have exceeded 10 GHz.


