Abstract
The use of regression-based surrogate models to determine design scaling rules for mechanical product families has proven to be a powerful approach for dimensioning complex geometries. However, there is a broad range of surrogate models in the literature, and each model can be configured in multiple ways. The optimal model election is highly conditioned by the case study nature (e.g., non-linearity level), and consequently, it is mandatory to evaluate different surrogate models. This process can be cumbersome and time consuming, but the election of an inaccurate model may lead to several design–analysis iterations that increase the product cost and development time. Therefore, in this paper, a novel surrogate modelling technique to determine representative design scaling rules for product families—named Univariate Regression-Based Multivariate (URBaM)—is presented. The proposed method seeks to minimize design–analysis iterations while suppressing the process involved in evaluating different surrogate models, independent of the non-linearity level nature of the design problem. The URBaM model is evaluated through six oil and gas valve family design case studies, addressing critical mechanical component design problems across different non-linearity levels (two low, two medium, and two high). The results obtained with the URBaM model in these six cases are compared against 14 configurations of eight widely used techniques in the literature. The obtained results demonstrate that the URBaM model is capable of accurately adapting to different non-linearity levels with a single configuration and presents high stability regarding MAPE, NRMSE, and RMAE metrics from case to case. Consequently, the potential of the URBaM surrogate modelling technique to assist the design process of scalable mechanical product families is proven.
1. Introduction
The use of product families is an extended solution to efficiently develop customized products [1,2]. Two main strategies are followed when adapting the product platform of a family in order to obtain a family member: module-based and scale-based strategies [3,4]. The former, adapts the product platform by combining different functional modules. The latter, adapts the platform by scaling it according to previously defined scaling rules [5]. In particular, scale-based strategies are widespread in the development of mechanical product families, since dimensions play an important role in the structural integrity and functionality of these kinds of products [3].
Nowadays, the evaluation of the functionality and the structural integrity of mechanical products is usually carried out by Finite Element Method (FEM)- or Finite Volume Method (FVM)-based Computer-Aided Engineering (CAE) software [6]. Such verification techniques may become computationally expensive when solving complex problems [7]. This fact becomes especially relevant when poorly defined scaling rules entail an iterative scaling design process where the model must be updated and run in each design iteration, extending the product development time. For this reason, it is mandatory to define representative product platform scaling rules, maintaining structural integrity and functionality conditions in each new scaled product [8].
Scaling rules of mechanical products have been traditionally defined using analytical formulations of mechanics of materials [9]. However, such formulations do not adequately represent the mechanical behavior of complex shape geometries. FEM-FVM CAE models afford representative solutions, but they are sometimes computationally expensive [10]. As an alternative, surrogate models have proven to be a powerful option for dimensioning complex shape geometries by replacing costly to evaluate problems with almost instantly to solve mathematical functions [11,12,13]. The complexity of the geometry can even go further in topological optimization problems, which are also used in the mechanical design field [14].
Surrogate models interrelate user defined input parameters (e.g., dimensions of a product) and an output parameter (e.g., field variable of interest). Thus, surrogate models are built based on phenomenological data of multiple cases within the range of interest called design points, which can be obtained either from an experimental or numerical source. In general, surrogate models for scaling rules are built based on deterministic numerical data [15]. For that purpose, a Design Of Experiment (DOE) to calculate the required field variable for each design point that covers the DOE domain has to be designed [16]. Once the surrogate model is built, the result of any input value configuration within the DOE range can be directly obtained. This allows for optimizing the design variable election process and obtaining reliable and safe product designs in a reduced number of design–analysis iterations.
Multiple surrogate model types exist in the literature [17]. Some of the best known model types are polynomial models [10,18,19]; Radial Basis Function (RBF) models [20,21,22]; Kriging models [23,24,25]; Artificial Neural Network (ANN) models [26,27]; Support Vector Machine Regression (SVMR) models [28,29,30]; Multivariate Adaptive Regression Splines (MARS) models [31,32]; and Random Forest (RF) models [33,34,35]. In addition, there is one further group of modelling, labelled in this paper as “Standalone Weighted Ensemble”, which refers to models that combine different types of independent models such as Kriging, Polynomial models, and SVMR [36,37,38,39,40,41,42]. Such a wide range of options makes it difficult for the user to make the optimum choice. In addition, each model can be configured in multiple ways. Depending on the configuration, the prediction accuracy can be different [24,43]. Thus, the definition of an accurate surrogate model is greatly hindered by the decisions taken at configuration phase. Moreover, several studies in the literature indicate that applying the same surrogate model configuration to problems with different characteristics does not necessarily yield accurate predictions (see Table 1):

Table 1.
Comparative studies of surrogate models reported in the literature.
Such contradictory results indicate that the optimal selection of a surrogate model and its configuration is highly conditioned by the case study in which it is employed [36,37]. For this reason, the strategy of using the same type and configuration model for all case studies is inappropriate. In fact, no one specific model independent of the characteristics of a particular problem currently exists in the literature [38,40].
Some authors have defined general rules that associate specific types of surrogate models with the characteristics of particular case studies to facilitate the surrogate model selection [39,46]. Table 2 summarizes general guidelines from various authors, with a focus on the relationship between case study non-linearity and prediction accuracy.

Table 2.
Guidelines from the literature for selecting surrogate models according to case study nature.
While these conclusions are helpful for selecting a surrogate model, the studies do not associate the proposed guidelines to a standardized metric to evaluate the level of non-linearity of a problem. R. Jin et al. [47] evaluated the level of non-linearity classifying the coefficient of determination R2 value of a low order polynomial approach of the DOE. This non-linearity measurement procedure was also used in [49]. However, this metric was not generally adopted by other works, evaluating non-linearity level only qualitatively. Therefore, the guidelines proposed in the literature are sometimes difficult to apply in specific problems. In consequence, authors of papers [26,44] evaluate different types and configurations of surrogate models as a procedure to choose the most appropriate model for each case. Nevertheless, this process could become cumbersome and time-consuming depending on the case of analysis, specifically in an industrial environment.
As an alternative, in this paper a novel surrogate modelling technique capable of adapting to different non-linearity levels with a single configuration—named Univariate Regression-Based Multivariate (URBaM)—is presented. The proposed method was developed with two main objectives. Firstly, the proposed model aims to avoid the cumbersome and time-consuming evaluation process of different surrogate model types and configurations required nowadays to choose the most appropriate model for each case study. Secondly, the method seeks to reduce close to zero design–analysis iterations when scaling a new family member. The accuracy of the proposed technique is evaluated for six case studies of different non-linearity levels (two low, two medium, and two high) and compared against 14 configurations of eight most representative techniques in the literature.
The rest of this article is set out as follows: Section 2 defines the proposed URBaM modelling method. Section 3 details the procedure followed to evaluate the accuracy and the adaptability to different non-linearity level cases of the URBaM models. Here, the URBaM method is compared to the most employed surrogate models in the literature in six case studies classified according to non-linearity levels. Section 4 presents the obtained results with the discussion of this study. Section 5 provides the main conclusions of this study. The fundamentals of the analyzed surrogate models and their configurations are attached in Appendix A.
2. URBaM Modelling Method
The URBaM model is a multilayer surrogate model in which the number of layers corresponds to the amount of design variables p: xi → Li, where xi refers to the design variables, Li to the layers, and i ∈ {1…p}. In each layer, multiple nodes are defined, Ni,j,t: the number of nodes in a layer is represented by t, while j determines the position of the node in the layer, where j ∈ {1…kt}. In each of these nodes, input data, xi,j,t, and the associated layer design variable value, xi, are transformed into node output data, yi,j,t, by using selected functions, fi,j,t. The determined node output is transferred to another node in the concatenated layer above. Therefore, the output of the node, yi,j,t, becomes the input, xi−1,j,t, of the node, Ni−1,j,t, in the layer above, where yi,j,t = xi−1,j,t. This concatenation of nodes can be understood as a master/slave dependency. A master node in the layer i is fed by the inputs determined by different slave nodes in the layer i + 1. Each slave node transfers only one input to the master node, and the number of slave nodes that each master node can have varies in the model. The number of the associated slave nodes is directly affected by the function fi,j,t used in the master node. In particular, the function fi,j,t is composed of kt unknown parameters, and each master node must have the same number of associated slave nodes.
The master/slave concatenation is repeated throughout all the layers of the model, but the type of function, fi,j,t, used can be different in each case. The concatenation between nodes can be graphically interpreted by branches, while the global structure takes a tree shape with an initial root node that determines the prediction of y, which is ŷ. Figure 1 shows the global structure of a p design variable URBaM model.
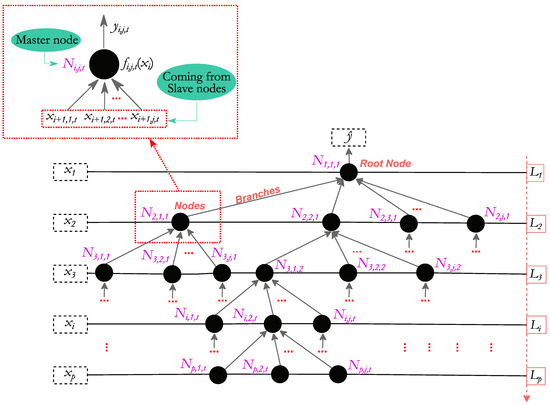
Figure 1.
Generic structure of an URBaM surrogate model and the master/slave node relation.
The defined Ni,j,t node structure depends on the used fi,j,t(xi) function in each master node. The procedure was followed by the URBaM method for defining fi,j,t(xi) functions, thus establishing the global nodal structure, which is defined hereafter; Figure 2 summarizes all necessary steps:
- First, the f1,1,1(x1) function is defined in L1. Here, DOE data is arranged in different data groups. The design points in each of these groups must have different x1 values, and the rest of design variable values must remain constant (xz = const., where z ∈ {i + 1…p}) (Step 1.1). In order to create data groups of these characteristics, a full factorial DOE must be defined; not all DOE types in the literature can be used for creating URBaM models.
- After defining data groups, a univariate regression function is selected (Step 1.2) and each of the data groups defined is modelled using it. The applied regressions relate the x1 design variable by means of simple univariate (2D) regression functions to the output variable y and the unknown coefficients are determined by the least square method (Step 1.3).
- In order to evaluate in future steps how the applied regression fits to the data groups, the coefficient of determination, R2, is measured together with the number of unknown coefficients that the applied regression function requires being calculate by the least squares method (Step 1.4).The regressions are applied to each data group (Loop 1.1).
- Multiple simple univariate regression types are available in the literature, and the URBaM model must select one of them prior to defining f1,1,1(x1). Table 3 sets out the type of regression functions considered by the URBaM surrogate modelling technique. In order to select the most appropriate function, the model studies all the regression functions in Table 3. To this end, the URBaM model repeats the following procedure: (i) takes one of these functions and applies it to each of the design point groups created in the node, (ii) calculates the R2 of each data group and determines the mean value, and (iii) identifies the number of unknown coefficients of the regression function. The same process is repeated with all functions in Table 3 (Loop 1.2). The best function option will be that with a high correlation between regression parameters (and thus, a high R2), while at the same time being a function type without a high number of unknown parameters to avoid overfitting. In other words, the URBaM method selects the function with the fewest number of unknown coefficients, but with the highest R2 value, considering 0.95 the minimum R2 value (Step 1.5).
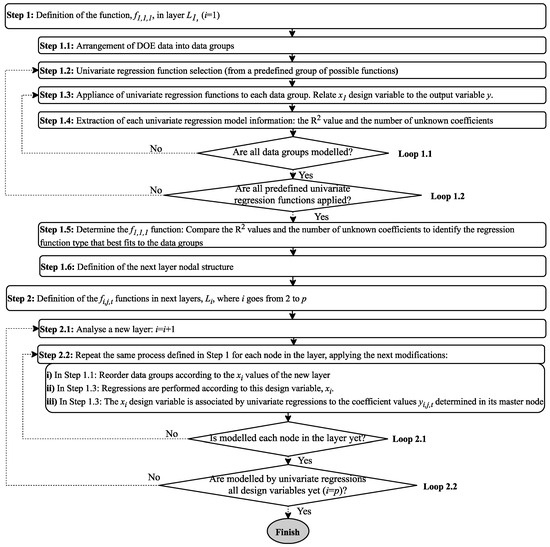 Figure 2. The steps followed by the URBaM modelling technique.
 Table 3. Type of regression functions used by the URBaM model.Table 3. Type of regression functions used by the URBaM model.
Model Regression Function Lineal regression Second-order polynomial regression Third order polynomial regression Logarithmic regression Exponential regression Potential regression - The regression function selected by the URBaM method becomes the f1,1,1(x1) function in the root node (N1,1,1). Figure 3a shows an example of a second-order polynomial regression function selection case of one of the defined design point data groups. Following the same example, Figure 3b shows how the number of slave nodes created from the master node N1,1,1 is the same as the number of unknown coefficients determined by least square method in f1,1,1(x1). In this case, the function has three unknown coefficients, so three slave nodes are created from the master node (Step 1.6).
 Figure 3. (a) Example of a second order polynomial regression fitting in N1,1,1 and (b) its master/slave node configuration.
 - In each node multiple design point data groups are modelled individually; thus, multiple yi+1,j,t coefficients will be determined. All of them will comprise the yi+1,j,t output variable. Following the example in Figure 3a, the A coefficients obtained in the applied regression of each data group will comprise the y2,1,1 vector, and the B and C coefficients will comprise the y2,2,1 and y2,3,1 vectors, respectively.
- The nodal structure in the layer L2 is defined as a consequence of the selection of f1,1,1(x1) function and its unknown coefficients. Thus, the next step consists of defining all the f2,j,t(x2) functions of the created nodes in the layer L2 (Step 2.1). To this end, the obtained y2,j,t values in L1 are related to each of the corresponding nodes in L2 (Figure 3b). In each node, the y2,j,t values are related to the x2 design variable by simple univariate regression functions, f2,j,t(x2). The procedure that must be followed for defining f2,j,t(x2) is the same used in the definition of the f1,1,1(x1) function, but defining the new regressions using x2 and y2,j,t values (Step 2.2). This process is repeated in all nodes of L2. As a result, all f2,j,1(x2) functions, all the yi+1,j,t vector values, and the L3 nodal structure N3,j,t are determined (Loop 2.1). This process is repeated throughout all the layers, until the last layer Li is reached, where i = p (Loop 2.2).
- In the last layer Lp, the xp design variable is related to yp,j,t by fp,j,t(xp) regression function in each Np,j,t node of the layer, repeating the same procedure. However, in this last layer, the unknown coefficients determined by the least square method in the fp,j,t(xp) functions are not used for building new nodes. These last coefficients, termed Cj,t, are constant terms that are used by the URBaM model as inputs for predicting new x test points.
Once all the fi,j,t(xi) functions are defined, the Cj,t constant terms and the global structure of the URBaM model shown in Figure 1 are obtained. As a result, the URBaM model is completely defined. In order to predict y values of new x test points, ŷ(x), the x1, x2, …, xp design variable values are introduced progressively in the model from the last layer to the initial one. Thus, the xp design variable values of the test points and the determined Cj,t coefficient values are entered into the determined fp,j,t(xp) functions, obtaining the yi,j,t values of the nodes in the layer. Following the master/slave concatenation, each slave node will pass the determined yi,j,t values to its master node, and will be used in fp−1,j,t(xp−1) functions. This concatenation is repeated until the root node in the first layer is reached, where the output will be ŷ(x). Figure 4 shows an overview of the concatenation process followed by URBaM for determining ŷ(x).
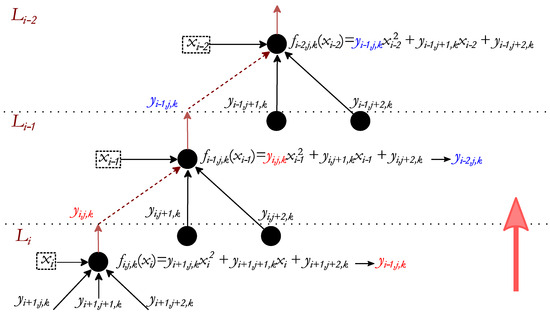
Figure 4.
Internal input/output dependences between nodes of different layers for a second-order polynomial regression function concatenation.
The URBaM model concatenates multiple 2D univariate regressions, and as a consequence, a global multivariate regression model is obtained. The univariate regressions are implemented progressively for each design variable layer to layer, starting from the last layer and finishing in the root node layer. Thus, in each layer the dimensionality of the nodes changes depending on the layer position. In the last layer nodes, when the xp design variable value is implemented in the regression functions fp,j,t(xp), the model acquires a 2D predictive model form (Figure 5a). When a new design variable, xp−1, is implemented in the univariate regression functions, fp−1,j,t(xp−1), of the Lp−1 layers, the model takes a 3D model shape (Figure 5b). Repeating the same process in the next layer, a 4D regression domain is obtained (Figure 5c). Further repetition results in a 5D regression domain (Figure 5d). Finally, the prediction of the test point, ŷ(x), is obtained in a (p + 1) dimension domain. The dimensionality in each layer can be determined by the following expression: p − (i − 2).
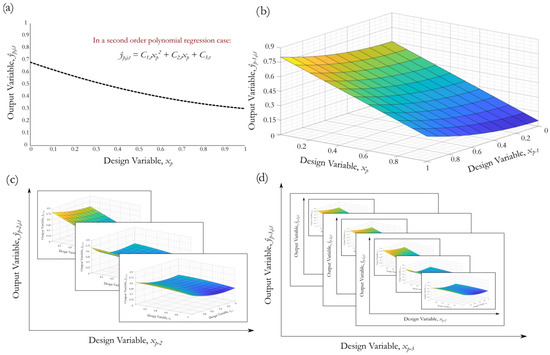
Figure 5.
Representation of (a) a 2D regression domain in a node of the Lp layer, (b) a 3D regression domain in a node of the Lp−1 layer, (c) a 4D regression domain in a node of the Lp−2 layer, and (d) a 5D regression domain in a node of the Lp−3 layer.
The URBaM method ensembles simple regression functions, similar to ensemble approaches discussed in the literature. However, unlike standard ensemble models, URBaM is specifically designed to adapt to varying degrees of non-linearity. For this purpose, the method progressively applies simple regression functions to each design variable, accounting for how each variable influences the non-linear behavior of the output. Moreover, URBaM accounts for variations within the DOE range by applying different regressions to the same variable in different regions. Since a variable may exhibit near-linear behavior in some parts of the DOE range and highly non-linear behavior in others, this localized treatment allows for URBaM to capture non-linearity changes more effectively. Thus, while URBaM can be classified as an ensemble model, its distinctive strength lies in its ability to adapt to non-linearities.
3. Validation of the URBaM Modelling Method
First, the accuracy and adaptability of the presented URBaM modelling method was evaluated for different non-linearity-level cases. Then, it was compared in each case study against 14 configurations of eight widely used surrogate modelling methods in the literature. For that purpose, six case studies of different non-linearity levels were selected: two high non-linearity-, two medium non-linearity-, and two low non-linearity-level cases. All of them are real engineering problems, focused on the design of valve families in the oil and gas sector.
In all case studies, the design variables that most affect the mechanical performance were selected through a numerical sensitivity study performed in ANSYS®. The remaining design parameters, which are necessary to geometrically define the studied valve components, were defined by previously set dimensioning rules. These dimensioning rules vary according to the two main parameters that are generally used for defining valves in a family: the valve size (bore diameter Db) and the working pressure (P). Next, a full factorial DOE was assembled considering the identified main design variables together with the valve size and rating within the specified valve family range. The design points of the full factorial DOE were run in ANSYS®. The surrogate models were defined following the URBaM modelling technique as well as the eight modelling techniques selected for purposes of comparison, in a total of 14 model configurations.
Finally, the accuracy of the surrogate models were evaluated using the split samples strategy, where the test points were randomly defined within the domain of interest. In order to obtain a representative validation sample, the number of test points for each case study was set to approximately 25% of the size of the DOE used to build the models. The validation points were also executed using ANSYS®.
In this section, first, the metrics used to evaluate the non-linearity level of the selected case studies, as well as the accuracy metrics of the surrogate models are specified. Then, the six case studies are exposed, selected according to problem non-linearity-level criteria. Finally, the configuration of the URBaM model and the eight surrogate model types (their 14 configurations included) selected from the literature for comparison purposes of these six case studies is detailed.
3.1. Problem Classification and Surrogate Model Evaluation Metrics
3.1.1. Problem Non-Linearity Definition Metric
As explained in the introduction, very few works in the literature propose non-linearity evaluation methods, and there is not a standardized and widely accepted criteria for this purpose. In the present work, a non-linearity evaluation criteria that takes as reference the procedure proposed by R. Jin et al. [47] was established. The procedure consists of the following steps: (i) the case study was fitted with a first order polynomial model, (ii) the coefficient of determination was obtained (Equation (1)), and (iii) four non-linearity classification levels were set according to the coefficient of determination, R2, value. This classification includes high non-linearity (HNL), medium non-linearity (MNL), low non-linearity (LNL), and quasi-linear (QL). Table 4 details the R2 coefficient ranges considered for each non-linearity level.

Table 4.
Case study non-linearity level classification.
3.1.2. Surrogate Model Accuracy Metrics
The accuracy of the surrogate model was evaluated by analyzing the Mean Absolute Percentage Error (MAPE), the Normalized Root Mean Square Error (NRMSE), and the Relative Maximum Absolute Error (RMAE). All of them are widely used metrics in the literature for comparing surrogate models [37,45,52].
MAPE (Equation (2)) provides insight into the general error of the model in percentages. However, the error percentage value is highly sensitive for numerical values close to zero, where even cases with small difference between predicted and measured results can lead to high error percentage values. In order to identify when this happens, it is also important to measure the residual difference between the predicted and measured values. The NRMSE and RMAE metrics are used for this. The NRMSE provides insight into the general error of the model, and the RMAE gives information about the maximum error of the model. Although parameters can be normalized in multiple ways according to the literature, H. Chen et al. [52] stated that the method used for normalization does not substantially affect to the accuracy evaluation process. In the present work, NRMSE was normalized with respect to the standard deviation, σ, according to Equation (3). The RMAE metric is shown in Equation (4):
In order to evaluate the representativeness that each surrogate model configuration analyzed has in the presented engineering design problems, the following limits are considered in the present study: an MAPE limit of 10% is considered as desirable, while an MAPE value of 20% is considered as acceptable (which can be translated into a security factor of 1.1 and 1.2, respectively). In addition, an NRMSE limit of 0.5 and an RMAE limit of 1 were also defined according to user experience. Therefore, the surrogate models that fulfil these three conditions will be considered representative for the analyzed case studies.
3.2. Case Studies
The proposed surrogate modelling method was developed in the context of the oil and gas valve industry to assist product family development. The selected case studies are focused on the dimensioning of critical valve components of different valve families based on FEM calculations. Hereafter, the different case studies are detailed, summarized in Table 5:
- Case study 1: Stem dovetail dimensioning in a downstream slab valve family. Slab valves in downstream applications are used in the transportation of high volumes of fluid. The valve size ranges from 1” to 46” Db, and they may work from 300 lbs up to 2500 lbs pressure ratings. When the valve is in a closed position, the upstream chamber of the valve is pressurized, but not the downstream chamber. The pressure difference generates a normal force between the seat and the gate that must be borne by the valve opening mechanism in a maneuvering. One of the critical areas in the maneuvering mechanism is the stem dovetail, the failure of which would lead to the inoperability of the valve. Therefore, the aim of this case study is to generate a surrogate model to correctly size the stem dovetail. For this purpose the maximum equivalent Von Mises stress in the dovetail was set as the output variable of the analysis, while the dovetail arm thickness (h1), the dovetail arm cantilever distance (b1), and the thickness of the dovetail core (t1) were considered the design variables (see Case 1 in Table 5). Thus, a four-design-variable (h1, b1, t1, and Db) full factorial DOE with 832 design points was set for a single pressure rating, P, of 900 lbs. The non-linearity analysis resulted in R2 = 0.33, a high non-linearity (HNL)-level problem.
- Case study 2: Structural bolt dimensioning in a flanged joint of a high-pressure split body ball valve family. The body of this type of valves is divided into two parts that are assembled by means of a flanged joint. The analytical equations correctly size the bolting so as to bear the tensile loads resulting from preloading and the internal high pressure during loading stage. This pressure can range from 5000 psi to 15,000 psi, in valve sizes that range from 1 13/16″ to 16 3/4″. However, an inadequate flange dimensioning may cause it to deflect and consequently couple the tensile loads in the bolting with a bending effect that may compromise the integrity of the joint. Therefore, the aim of this case study is to generate a surrogate model to correctly dimension the flange and the bolting preventing excessive flange deflections. For this purpose the maximum deflection angle in the flange was set as the output variable of the analysis, while the bolt metric (Dm), flange thickness (h2), and cantilever distance of the flange (b2) were considered the design variables (see Case 2 in Table 5). Thus, a four-design-variable (Dm, h2, b2, and Db) full factorial DOE with 320 design points was set for a single pressure rating, P, of 5000 psi. The non-linearity analysis classified the present problem as an HNL-level case, due to the value of the coefficient of determination R2 = 0.43.
- Case study 3: Slab dovetail dimensioning in a downstream slab valve family. This case study corresponds to the same valve family as case study 1. However, in this case, the female dovetail of the slab is dimensioned instead of the stem dovetail. Again, the maximum equivalent Von Mises stress in the dovetail was set as the output variable of the analysis, while the dovetail arm thickness (h3), the dovetail arm cantilever distance (b3), and the lateral thickness of the dovetail (t3) were considered the design variables (see Case 3 in Table 5). Thus, a four-design-variable (h3, b3, t3, and Db) full factorial DOE with 832 design points was set for a single pressure rating P of 300 lbs. The non-linearity analysis classified the present problem as a medium non-linearity (MNL)-level case, due to the value of the coefficient of determination R2 = 0.62.
- Case study 4: Stem–ball joint dimensioning for a high-pressure ball valve family. As in case study 2, due to pressure difference between the upstream chamber and downstream chamber, high friction forces appear in this case between the ball and the sealing seats. In addition, the resultant forces may be extremely high as internal pressure may rise up to 5000–15,000 psi. The friction force combined with the ball diameter generates a resistance torque that has to be borne by the maneuvering mechanism. In particular, one of the critical areas in this mechanism is the trunnion stem–ball joint. Therefore, the aim of the present case study is to generate a surrogate model to correctly dimension the stem–ball joint. For this purpose, the maximum equivalent Von Misses stress was set as the output variable of the analysis, while the trunnion diameter (Dt), the groove height (h4), and groove width (t4) were considered the design variables (see Case 4 in Table 5). Thus, a three-design-variable (Dt, h4, and t4) full factorial DOE with 64 design points was set for a 5000 psi P pressure rating and 2 9/16″ Db valve sizes. The non-linearity analysis classified the present problem as a MNL level case, due to the value of the coefficient of determination, R2 = 0.76.
- Case study 5: Flange dimensioning in a bonnet to body joint for a high-pressure ball valve family. This case study is similar to case study 2. However, as commercial valve actuators for valve maneuvering are assembled in the bonnet, bolting diameter and positioning cannot vary in the present case. Therefore, the aim of this case study is to generate a surrogate model to correctly dimension the flange thickness to prevent undesired bending deflections. For this purpose, the deflection angle was set as the output variable of the analysis, while the flange thickness (h5) and the cantilever distance of the bonnet (b5), together with the size of the valve Db were considered the design variables (see Case 5 in Table 5). Thus, a three-design-variable (h5, b5, and Db) full factorial DOE with 112 design points was set for a single pressure rating P of 5000 psi. The non-linearity analysis classified the present problem as a low non-linearity (LNL)-level case, due to the value of the coefficient of determination R2 = 0.85.
- Case study 6: Gate–Seat dimensioning for a high-pressure slab valve family. This case study corresponds to the same valve type defined in Case 1, but for highly pressurized and subsea slab valve families. The present case study analyzes the closure mechanism between the slab and the seat of a valve, where internal sealing must be ensured when the valve is pressurized (up to 5000–15,000 psi) in a closed position for valve sizes that range from 1 13/16″ to 7 1/16″. For this purpose, the contact pressure between the gate and the slab was set as the output variable of the analysis, while the contact thickness of the seat (t6), together with the size of the valve Db were considered the design variables (see Case 6 in Table 5). Thus, a two-design-variable full factorial DOE with 16 design points was set for a single pressure rating P of 15,000 psi. The non-linearity analysis classified the present problem as an LNL-level case, due to the value of the coefficient of determination R2 = 0.96.
 Table 5. Selected case studies: studied area, output variable of interest, design variables, and non-linearity level are detailed.Table 5. Selected case studies: studied area, output variable of interest, design variables, and non-linearity level are detailed.
Case Valve Type Studied Area Output Variable R2 Non-Linearity Level 1 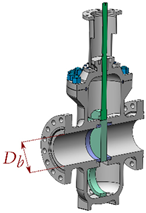
Downstream Slab Valve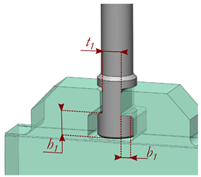
Stem dovetailDovetail equivalent Von Mises stress 0.33 High non-linearity (HNL) 2 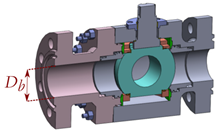
High-Pressure Ball Valve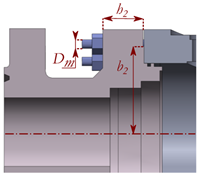
Split body flanged jointSplit Body flange bending angle 0.43 HNL 3 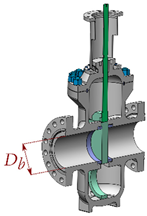
Downstream Slab Valve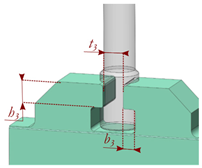
Slab dovetailDovetail equivalent Von Mises stress 0.62 Medium non-linearity (MNL) 4 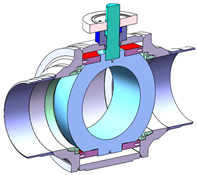
High-Pressure Ball Valve
Stem–ball jointVon Mises equivalent stress 0.76 MNL 5 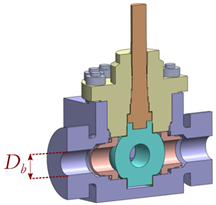
High-Pressure Subsea Ball Valve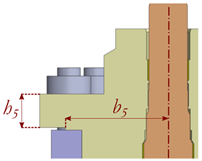
Bonnet flanged jointBonnet flange bending angle 0.85 Low non-linearity (LNL) 6 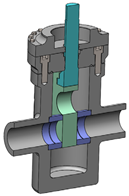
High-Pressure Slab Valve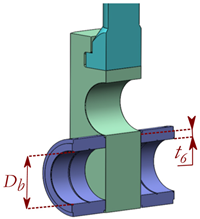
Gate–Seat closure mechanismGate–Seat contact pressure 0.96 LNL
3.3. Configuration of Surrogate Models
The proposed URBaM modelling method was evaluated and compared with eight of the most studied surrogate modelling techniques in the literature: (i) second-order polynomial, (ii) Artificial Neural Network (ANN), (iii) Radial Basis Function (RBF), (iv) Kriging, (v) Multivariate Adaptive Regression Splines (MARS), (vi) Random Forest (RF), (vii) Support Vector Machine Regression (SVMR), and (viii) Standalone Ensemble model based on the Penalized Predictive Score weighting Genetic Algorithm (PPS-GA). The fundamentals of the selected surrogate modelling techniques for validation purposes are summarized in Appendix A.
Each type of surrogate modelling method presents a wide range of configuration options. Therefore, the URBaM model was compared with a total of 14 recommended model configurations, which are detailed hereafter:
- Second-Order Polynomial: From all the possible polynomial model configurations, the full second-order polynomial model, which considers all the possible interactions between design variables, is the most widely used polynomial model configuration [53]. Therefore, this configuration was selected.
- Artificial Neural Networks (ANNs): One-hidden-layer-based ANN models are the most widely used [48]. However, there is not a specified rule for defining the optimum number of nodes of the hidden layer. Thus, three arbitrary ANN configurations were selected: (i) 3 nodes, (ii) 5 nodes, and (iii) 10 nodes.
- Radial Basis Function (RBF): The RBF model can be configured according to several types of base functions: linear, cubic, multiquadratic, inverse multiquadratic, thin plate spline, and Gaussian. However, several authors highlight the potential of multiquadratic and inverse multiquadratic functions for building accurate RBF models [54,55,56]. Moreover, the effect of the shape parameter c, which governs the RBF functions, was studied by different authors. Thus, E. Acar and M. Rais-Rohani [41] proposed a c = 1 configuration, while M. J. Colaço et al. [57] recommended a c = 1/N configuration, where N corresponds to the number of design points. Therefore, four configurations of the RBF modelling technique were selected: (i) multiquadratic with c = 1, (ii) multiquadratic with c = 1/N, (iii) inverse multiquadratic with c = 1, and (iv) inverse multiquadratic with c = 1/N.
- Kriging: From all possible Kriging model configurations, Universal Kriging is one of the most widely used due to its high potential [24]. In particular, Kriging models are commonly configured using a Gaussian correlation function with a pu exponent coefficient of 2 [22,48,58]. In addition, the correlation parameter θu can be defined as a constant or variable unknown term for each design variable. Simpson et al. [18] reported that fixing constant the correlation parameter sufficiently good results can be obtained. However, defining a variable correlation parameter is more common than fixing it as a constant. Therefore, in the present work, two Universal Kriging configurations were selected: (i) constant correlation parameter and (ii) variable correlation parameter.
- Multivariate Adaptive Regression Splines (MARS): The main characteristic of the MARS modelling method developed by J. H. Friedman [31] is that the modelled domain is divided into different subdomains by means of knots. Each subdomain can be modelled by linear or cubic piecewise functions. According to [59], the use of a cubic function configuration provides more accurate results for non-noisy data. In the current work, the maximum number of subdomains, Maxsub, was limited according to [60]: the minimum value between 200 and max(20;2k), where k is the number of design variables. In addition, as FEM results are considered as non-noisy data, the MARS model was configured based on cubic piecewise functions.
- Random Forest (RF): In the current work, each tree is built with 1/3 of the total design variables (NDV) selected randomly according to [61], the number of leaves of each tree NL ≥ 1 [34], the minimum number of design points to split each node in the tree NS ≥ 5 [61], and a standard deviation threshold of 5% in the model response to split a node [62]. Different numbers of trees were evaluated to ensure that the predictions of the RF models converged to a stable value. Specifically, each case study was checked for 100, 200, and 500 trees. It was found that the results converged over 200 trees in all the studied cases. Therefore, the results for 500 trees were used as reference for validation purposes.
- Support Vector Machine Regression (SVMR): From all the possible SVMR configurations, the ε-insensitive model, derived from the machine learning field, is typically used in numerical regression problems [28,29]. In particular, SVMR models that use linear loss functions and Gaussian kernels for non-linear transformations are among the most widely employed in the literature. Therefore, this configuration was selected.
- Standalone Ensemble model based on Penalized Predictive Score weighting Genetic Algorithm (PPS-GA): According to M. B. Salem and L. Tomaso [38], the ensemble models based on Genetic Algorithm (GA) techniques together with a Penalized Predictive Score (PPS) weighting criterion are among the models that present the highest accuracy. In particular, the weighting parameter values determined by the PPS method are obtained minimizing (i) the RMSE of the design points, (ii) the k-fold cross-validation PRESS value, and (iii) the overfitting penalization. The ensemble models are typically built based on second-order polynomial, Kriging, RBF, Gaussian Process, SVMR, or Moving Least Square [22] standalone models [37,38,41,42]. Therefore, in the present work, different configurations of second-order polynomial, Kriging, SVMR, and Moving Least Square standalone models, detailed in Table 6, are considered to build ensemble models.
 Table 6. Summary of the characteristics of the surrogate modelling technique configurations.
The manual modelling of these methods can be cumbersome and error-prone, especially in high-dimensional problems. However, the codes of the most utilized surrogate modelling techniques are available in the literature. In fact, the second-order polynomial, the Kriging, the ANN, the SVMR, and the PPS-GA models are already available in ANSYS® 19.2 DesignXplorer™, which was the software package used for building these models. The codes to build and test RBF [63], MARS [59], and RF [61] models were implemented in MATLAB® 2023. The URBaM modelling method proposed in Section 2 was also programmed in a Visual Basic for Application (VBA) environment of Excel© 365 software.
Table 6 shows the evaluated modelling techniques, the configurations used, their abbreviation name set for each configured model, and the reference of the code utilized:
4. Results and Discussion
4.1. URBaM Method Evaluation
Figure 6 represents the deviation between the FEM results, used as a reference, and the predictions obtained with the URBaM model for the evaluated validation points in the six case studies. In addition, the ±10% and ±20% deviation error curves are also represented in the charts to identify the error range of the validation points. The following can be observed:
- In Cases 1 (HNL), 3, and 4 (MNL), where the equivalent stress is evaluated, as well as in in Case 6 (LNL), where the contact pressure is evaluated, most of the validation points present an error below ±10%, independent of the non-linearity level. In particular, all points in Case 6 are below ±10% error range. However, multiple validation points present an error in the ±10–20% range in Cases 1, 3, and 4. The 20% error limit was surpassed by a few validation points in these cases. In general, the maximum errors occur for lower output variable magnitudes, as they are more sensitive to any deviation in percentages.
- Most of the validation points in Case 2 (HNL) were below the ±10% error curve, and in Case 5 (LNL) below the ±20% error curve. However, in these cases, the evaluated output variable corresponds to the deflection angle in degrees, which leads to very low-magnitude values (<2°). Therefore, the predictions are more sensitive to any deviation, and they provide higher error percentage values.
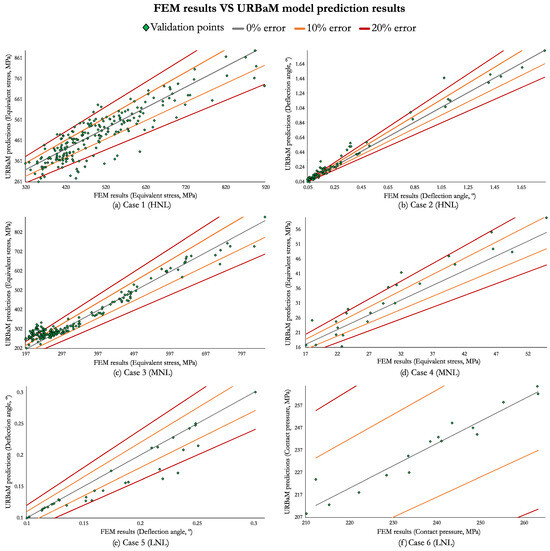 Figure 6. Comparison of the FEM and the URBaM prediction results of the validation points.
As observed, the error percentage is not conditioned to the level of non-linearity of the case. In contrast, it is found that the error sensitivity is influenced by the magnitude of the output variable. In particular, near-zero output values may lead to high errors, even when there are small residual differences. Therefore, analyzing the error percentage metric without taking into account the residual difference between reference and predicted values can lead to incomplete conclusions. Thus, the Normalized Root Mean Square Error (NRMSE) and Relative Maximum Absolute Error (RMAE) metrics were also analyzed to complete this study, together with the Mean Absolute Percentage Error (MAPE).
Figure 7 shows the MAPE, NRMSE, and RMAE values of the validation points predicted with the URBaM modelling technique for the six case studies. The obtained results show the following:
- The MAPE value remained stable near the 10% value in all cases except in Case 2 (HNL). In that case, the error reached the 20% value. This error percentage increase is attributed to the fact that several output values are close to zero.
- The NRMSE metric remained stable close to 0.25 for all case studies.
- The RMAE metric also remained stable for all cases close to 0.7.
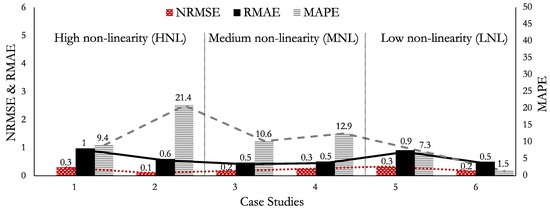 Figure 7. Comparison of the NRMSE, RMAE, and MAPE values of the validation points using the URBaM model.
The results show that the average values of MAPE, NRMSE, and RMAE are 10.5%, 0.22, and 0.66, respectively. In addition, the accuracy of the URBaM method remained stable independent of the non-linearity level, as the standard deviation values show: 6% for MAPE, 0.07 for NRMSE, and 0.2 for RMAE. The MAPE observed in Case 2 (HNL) presented the highest deviation with a 21.4% value. However, the same case presented the smallest NRMSE value (0.1).
4.2. Comparison with Well-Known Surrogate Model Configurations
The URBaM modelling technique is compared with eight widely used surrogate modelling techniques (a total of 14 model configurations) in the six case studies with different non-linearity levels.
4.2.1. Case 1 (HNL): Stem Dovetail Dimensioning in a Downstream Slab Valve Family
The MAPE, NRMSE, and RMAE values of Case 1 are shown in Figure 8, Figure 9, and Figure 10, respectively. The highlights of the histograms are set out as follows:
- The models that present an MAPE below 10% are the PPS-GA (5.4%), RBF_MQ_1/N (5.7%), SVMR (7.2%), UKRI_Const (7.6%), POL2 (8.6%), and URBaM (9.5%) models. In addition, the ANN_5 (12.4%), RF (13.7%), ANN_10 (18%), ANN_3 (18.1%), and MARS (19%) models present errors below the 20% criteria.
- The models that present an NRMSE below 0.5 are the PPS-GA (0.2), RBF_MQ_1/N (0.2), UKRI_Const (0.2), URBaM (0.3), SVMR (0.3), POL2 (0.3), RF (0.4), ANN_5 (0.4), and MARS (0.5) models.
- The models that report an RMAE below 1 are the PPS-GA (0.6), RBF_MQ_1/N (0.7), URBaM (1), and UKRI_Const (1) models.
The models that fulfil the established three metric criteria for Case 1 (HNL) are the URBaM, PPS-GA, UKRI_Const, and RBF_MQ_1/N models. Thus, all of them are representative for modelling Case 1. The POL2 and the SVMR models present an MAPE and an NRMSE below the reference limits. However, they surpass the RMAE limit of 1: SVMR (1.6) and POL2 (2). Therefore, in general, these models provide representative prediction values but occasionally report high deviations in the predictions and are considered partially representative models for Case 1.
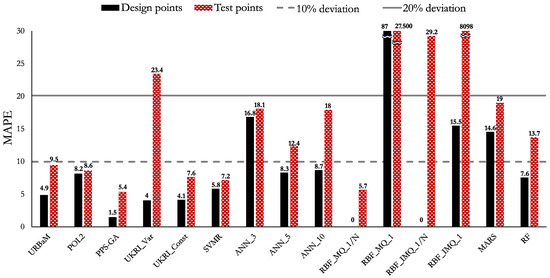
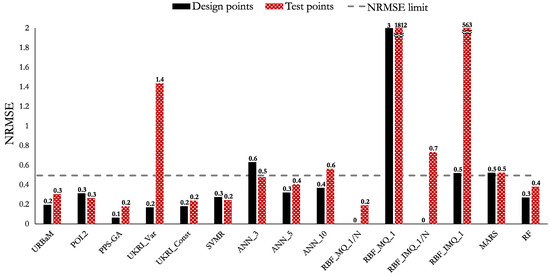
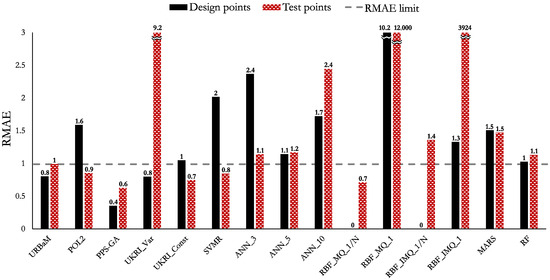

Figure 8.
MAPE values of the different surrogate model configurations analyzed in Case 1 (HNL).

Figure 9.
NRMSE values of the different surrogate model configurations analyzed in Case 1 (HNL).

Figure 10.
RMAE values of the different surrogate model configurations analyzed in Case 1 (HNL).
4.2.2. Case 2 (HNL): Structural Bolting Dimensioning in a Flanged Joint of a High-Pressure Split Body Ball Valve Family
The MAPE, NRMSE, and RMAE values of Case 2 are shown in Figure 11, Figure 12, and Figure 13, respectively. The highlights of the histograms are set out as follows:
- All the analyzed models present an MAPE value higher than 20%. As previously stated, this fact is attributed to the magnitude of the output variable of Case 2, which is close to zero. The models that present MAPE values closest to the 20% limit are ANN_10 (20.2%) and URBaM (21.4%).
- The models that present an NRMSE below 0.5 are the URBaM (0.1), ANN_10 (0.1), SVMR (0.2), ANN_5 (0.2), RBF_MQ_1/N (0.2), PPS-GA (0.3), UKRI_Const (0.3), ANN_3 (0.3), MARS (0.3), POL2 (0.4), and RF (0.4) models.
- The models that report an RMAE below 1 are the ANN_10 (0.5), URBaM (0.6), UKRI_Const (0.8), PPS-GA (0.9), and RBF_MQ_1/N (0.9) models.
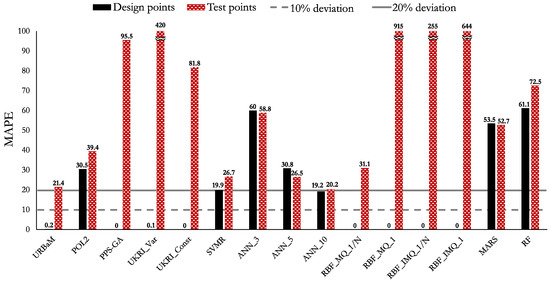
Figure 11.
MAPE values of the different surrogate model configurations analyzed in Case 2 (HNL).
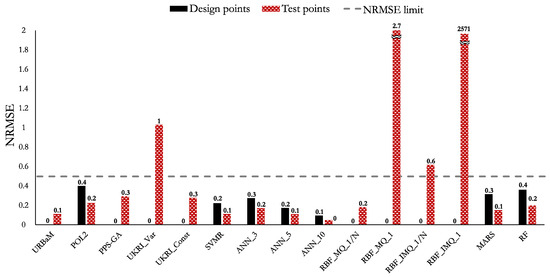
Figure 12.
NRMSE values of the different surrogate model configurations analyzed in Case 2 (HNL).
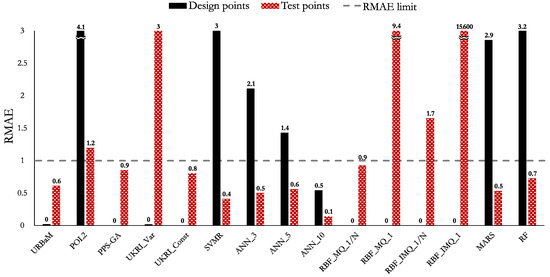
Figure 13.
RMAE values of the different surrogate model configurations analyzed in Case 2 (HNL).
The models that fulfil the established NRMSE and RMAE metric criteria for Case 2 (HNL) are the ANN_10, URBaM, UKRI_Const, PPS-GA, and RBF_MQ_1/N models. According to the MAPE metric criterion, the ANN_10 (20.2%) and URBaM (21.4%) models present the smallest error percentage values and are close to the 20% error limit. Thus, both models could be considered representative for modelling Case 2.
4.2.3. Case 3 (MNL): Slab Dovetail Dimensioning in a Downstream Slab Valve Family
The MAPE, NRMSE, and RMAE values of Case 3 (MNL) are shown in Figure 14, Figure 15, and Figure 16, respectively. The highlights of the histograms are set out as follows:
- The models that present an MAPE below 10% are the RBF_MQ_1/N (3.4%) and SVMR (7%) models. However, several models are close to that value: the RF (10.3%), URBaM (10.6%), POL2 (11.4%), MARS (12%), and UKRI_Const (12.1%) models.
- The models that present an NRMSE below 0.5 are the RBF_MQ_1/N (0.1), URBaM (0.2), POL2 (0.2), UKRI_Const (0.2), SVMR (0.2), MARS (0.2), RF (0.2), ANN_3 (0.4), PPS-GA (0.5), and ANN_5 (0.5) models.
- The RMAE of the RBF_MQ_1/N (0.3) and URBaM (0.5) models are below 1.
The RBF_MQ_1/N model fulfils the established three metric criteria completely for Case 3 (MNL). The URBaM model fulfils the RMAE and NRMSE criteria, and it only surpasses in 0.6% the MAPE criterion of 10%. Therefore, both of them could be considered representative for modelling Case 3.
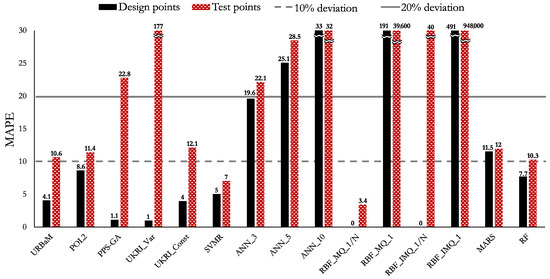
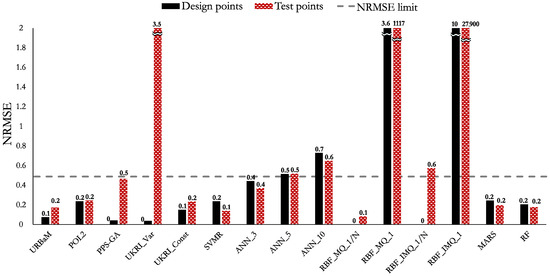
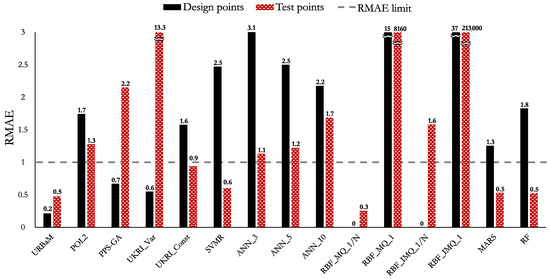

Figure 14.
MAPE values of the different surrogate model configurations analyzed in Case 3 (MNL).

Figure 15.
NRMSE values of the different surrogate model configurations analyzed in Case 3 (MNL).

Figure 16.
RMAE values of the different surrogate model configurations analyzed in Case 3 (MNL).
4.2.4. Case 4 (MNL): Stem–Ball Joint Dimensioning for a High-Pressure Ball Valve Family
The MAPE, NRMSE, and RMAE values of Case 4 (MNL) are shown in Figure 17, Figure 18, and Figure 19, respectively. The highlights of the histograms are set out as follows:
- All the analyzed models have an MAPE value higher than 10%. The models that present an error value within the 10–20% domain are the POL2 (11.3%), URBaM (12.9%), UKRI_Const (13.9%), UKRI_Var (14%), ANN_10 (14.2%), RBF_MQ_1/N (14.6%), RBF_MQ_1 (14.7%), PPS-GA (14.8%), RBF_IMQ_1 (14.9%), SVMR (15%), MARS (17.5%), ANN_5 (19.2%), and ANN_3 (19.7%) models.
- The NRMSE of all the analyzed models is below 0.5.
- The models that present an RMAE below 1 are the URBaM (0.5), POL2 (0.6), SVMR (0.7), PPS-GA (0.7), RBF_MQ_1 (0.7), RBF_MQ_1/N (0.7), RBF_IMQ_1 (0.7), UKRI_Var (0.8), UKRI_Const (0.8), RBF_IMQ_1/N (0.8), MARS (0.8), and ANN_3 (1) models.
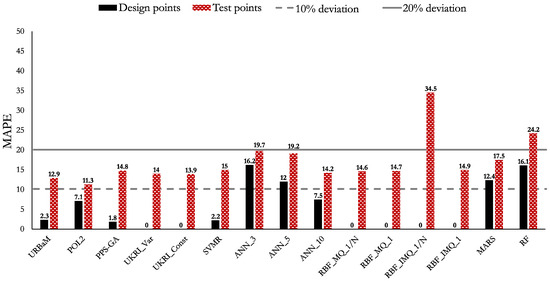
Figure 17.
MAPE values of the different surrogate model configurations analyzed in Case 4 (MNL).
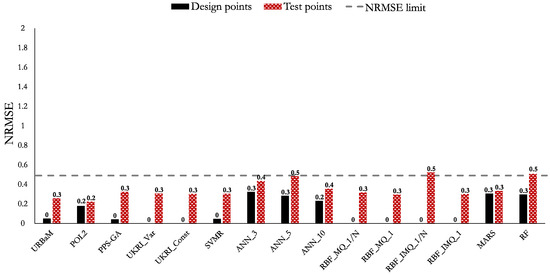
Figure 18.
NRMSE values of the different surrogate model configurations analyzed in Case 4 (MNL).
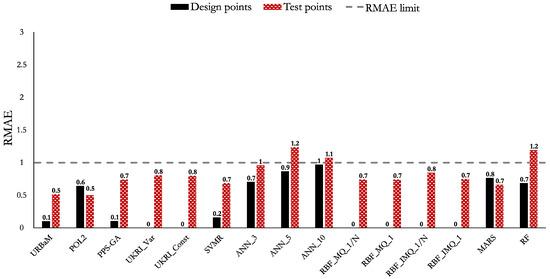
Figure 19.
RMAE values of the different surrogate model configurations analyzed in Case 4 (MNL).
All the evaluated models, excluding ANN5, ANN10, RBF_IMQ_1/N, and RF, have an MAPE in the 10–20% range. These models, the ones which have an MAPE in the 10–20% range, also have NRMSE and RMAE values below 0.5 and 1, respectively. Therefore, they meet the acceptance criteria and can be considered appropriate to represent Case 4. However, it is worth highlighting that the models that present the lowest MAPE within the 10–20% domain are the POL2 (11.3%) and URBaM (12.9%) models. These two models also present the lowest NRMSE and RMAE values. Therefore, both models are considered the most appropriate ones to represent Case 4 (MNL).
4.2.5. Case 5 (LNL): Flange Dimensioning in a Bonnet to Body Joint for a High-Pressure Ball Valve Family
The MAPE, NRMSE, and RMAE values of Case 5 (LNL) are shown in Figure 20, Figure 21, and Figure 22, respectively. The highlights of the histograms are set out as follows:
- The models that present an MAPE below 10% are the RBF_MQ_1/N (2.8%), UKRI_Const (2.9%), PPS-GA (3%), UKRI_Var (3.2%), SVMR (3.9%), POL2 (6.2%), MARS (6.2%), and URBaM (7.3%) models. However, several models are close to that value: RBF_IMQ_1/N (11.2%), RF (12%), and ANN_5 (12.8%).
- The models that present an NRMSE below 0.5 are the PPS-GA (0.1), UKRI_Var (0.2), UKRI_Const (0.2), SVMR (0.2), RBF_MQ_1/N (0.2), MARS (0.2), URBaM (0.3), POL2 (0.3), RBF_IMQ_1/N (0.4), ANN_10 (0.5), and RF (0.5) models.
- The models that report an RMAE below 1 are the PPS-GA (0.4), UKRI_Var (0.4), UKRI_Const (0.5), SVMR (0.6), RBF_MQ_1/N (0.7), MARS (0.7), and URBaM (0.9) models.
The models that fulfil the established three metric criteria for Case 5 (LNL) are the URBaM, PPS-GA, UKRI_Var, UKRI_Const, SVMR, RBF_MQ_1/N, and MARS models. Hence, all of them are representative for modelling Case 5.
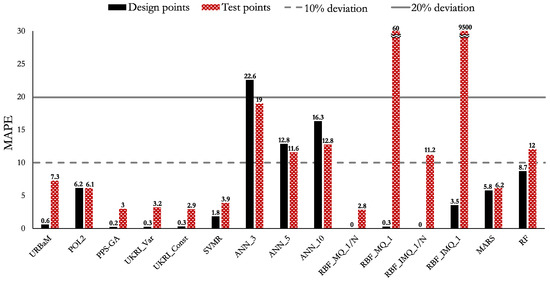
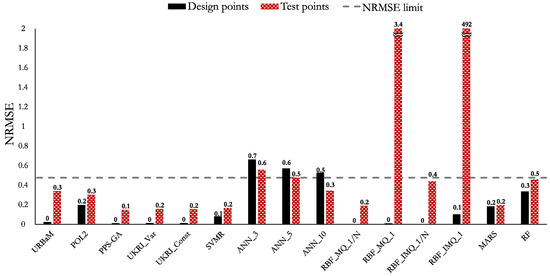
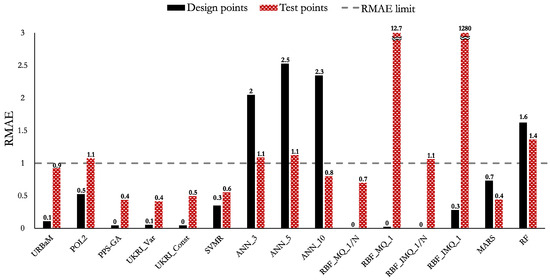

Figure 20.
MAPE values of the different surrogate model configurations analyzed in Case 5 (LNL).

Figure 21.
NRMSE values of the different surrogate model configurations analyzed in Case 5 (LNL).

Figure 22.
RMAE values of the different surrogate model configurations analyzed in Case 5 (LNL).
4.2.6. Case 6 (LNL): Gate–Seat Dimensioning for a High-Pressure Slab Valve Family
The MAPE, NRMSE, and RMAE values of Case 6 (LNL) are shown in Figure 23, Figure 24, and Figure 25, respectively. The highlights of the histograms are set out as follows:
- The models that present an MAPE below 10% are the UKRI_Var (1.1%), UKRI_Const (1.1%), POL2 (1.3%), URBaM (1.5%), PPS-GA (1.7%), ANN_3 (1.7%), te ANN_5 (1.7%), MARS (1.8%), ANN_10 (2.9%), SVMR (3%), RF (3.6%), and RBF_IMQ_1/N (4%) models.
- The models that present an NRMSE below 0.5 are the UKRI_Var (0.1), UKRI_Const (0.1), POL2 (0.1), URBaM (0.2), PPS-GA (0.2), ANN_3 (0.2), ANN_5 (0.2), MARS (0.2), ANN_10 (0.4), SVMR (0.4), and RF (0.5) models. The NRMSE of the RBF_IMQ_1/N (0.6) model is also close to 0.5.
- The models that present an RMAE below 1 are the POL2 (0.3), UKRI_Var (0.4), UKRI_Const (0.4), ANN_3 (0.4), URBaM (0.5), PPS-GA (0.5), ANN_5 (0.5), MARS (0.5), ANN_10 (0.7), SVMR (0.8), and RF (1) models. The RMAE of the RBF_IMQ_1/N (1.2) model is also close to 1.
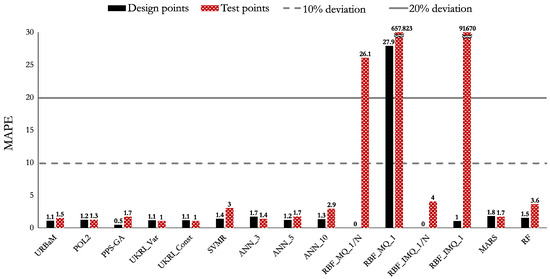
Figure 23.
MAPE values of the different surrogate model configurations analyzed in Case 6 (LNL).
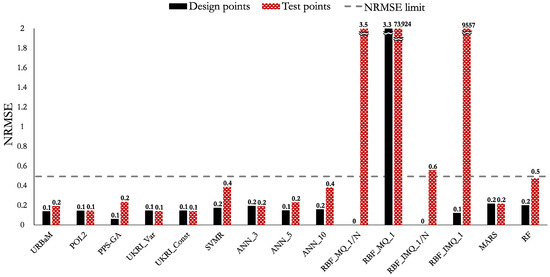
Figure 24.
NRMSE values of the different surrogate model configurations analyzed in Case 6 (LNL).
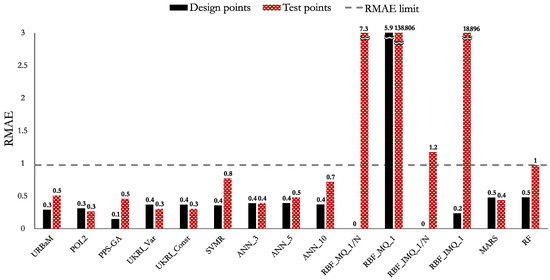
Figure 25.
RMAE values of the different surrogate model configurations analyzed in Case 6 (LNL).
The models that fulfil the established three metric criteria for Case 6 (LNL) are the UKRI_Var, UKRI_Const, POL2, URBaM, PPS-GA, ANN_3, ANN_5, MARS, ANN_10, SVMR, and RF models. Thus, all of them are representative for modelling Case 6. The RBF_IMQ_1/N model slightly surpasses the NRMSE and RMAE criteria and the MAPE value is far below 10%. Therefore, this model could be considered also representative for modelling Case 6.
4.2.7. Comparison Overview
Figure 26 summarizes the representativeness of the evaluated surrogate modelling techniques in accordance with the defined MAPE, NRMSE, and RMAE limits. The models that fulfil all criteria for a case study are marked with a black dot. In addition, the models that are considered still representative, although with one of the defined criteria slightly surpassed, are marked with a white dot. It can be observed that no model completely fulfils the established criteria for Case 2, which is a high non-linear case (HNL). However, the predictions of the URBaM model and the ANN_10 models slightly surpassed the established limits and thus can still be considered representative. Figure 26 shows that most of the modelling techniques analyzed are representative for Cases 5 and 6 (low non-linear cases), but when the non-linearity of the case increases, the number of representative models drastically decreases. However, it is worth highlighting that the URBaM modelling technique is the only technique that provided representative predictions for all the six case studies, independent of the level of non-linearity.
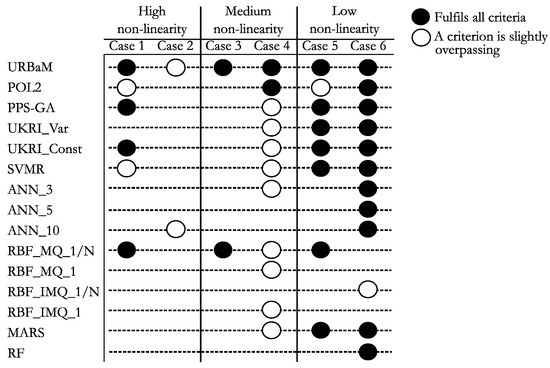
Figure 26.
Summary of the obtained errors with the different modelling techniques in each case study.
With the aim of analyzing the error stability according to different non-linearity levels, the MAPE (Figure 27), NRMSE (Figure 28), and RMAE (Figure 29) of the most representative surrogate models were studied. Therefore, the PPS-GA, UKRI_Const, and RBF_MQ_1/N models, which were representative in four out of six cases, were selected for comparing against the URBaM method. These models presented average MAPE values of 23.9%, 19.9%, and 13.9% with a standard deviation of 32.9%, 28%, and 11.1%, respectively; average NRMSE values of 0.26, 0.22, and 0.75 with a standard deviation of 0.12, 0.07, and 1.23, respectively; and average RMAE values of 0.88, 0.85, and 1.77 with a standard deviation of 0.61, 0.39, and 2.48, respectively. It can be observed that the URBaM model not only presents the lowest average values of MAPE, NRMSE, and RMAE metrics with values of 10.5%, 0.22, and 0.66 but also presents the highest stability from case to case with standard deviation values of 6%, 0.07, and 0.2, respectively.
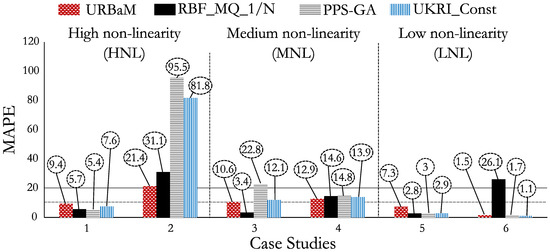
Figure 27.
MAPE values of the URBaM, RBF_MQ_1/N, PPS-GA, and UKRI_Const models.
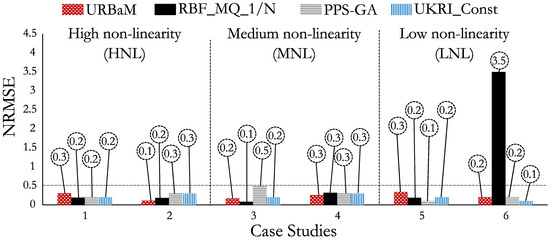
Figure 28.
NRMSE values of the URBaM, RBF_MQ_1/N, PPS-GA, and UKRI_Const models.
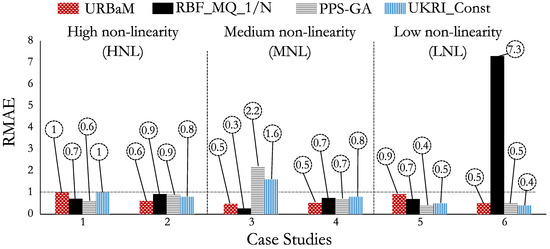
Figure 29.
RMAE values of the URBaM, RBF_MQ_1/N, PPS-GA, and UKRI_Const models.
In addition, the charts show that the optimum model choice results to be different from case to case. However, the obtained accuracy metric values of the URBaM model are always close to those of the optimum model. Thus, the average of the deviation of MAPE, NRMSE, and RMAE of the URBaM model with respect to the optimum model from case to case are 3.1%, 0.1, and 0.23, with standard deviation values of 2.3%, 0.06, and 0.17, respectively.
5. Conclusions
In this paper, a new surrogate modelling technique to assess the definition of reliable product family scaling rules, named URBaM, is presented. The model was evaluated and compared with 14 configurations of eight widely studied surrogate models in six real engineering problems with different non-linearity levels: two low (LNL), two medium (MNL), and two high (HNL):
- The URBaM model adapts with average MAPE, NRMSE, and RMAE errors of 10.5%, 0.22, and 0.66, respectively, with a case-to-case standard deviation of 6%, 0.07, and 0.2, demonstrating good capability in adapting to different non-linearity levels with a single configuration.
- The URBaM model was not the optimum choice in all cases but resulted in being the unique model capable of accurately representing the six analyzed cases of different non-linearity levels. The model was always close to the optimum model with an average deviations MAPE, NRMSE, and RMAE of 3.1%, 0.1, and 0.23, respectively.
Consequently, the URBaM technique was validated to assist the design process of scalable mechanical product families for problems with different non-linearities contributing in two different ways:
- Allows for efficiently determining reliable scaling rules for mechanical product families. The cumbersome and time-consuming optimum surrogate model type and configuration election process is not required with the URBaM model in the process of determining product family scaling rules, where non-linearity level is unknown a priori.
- The result accuracy level shown by the URBaM model allows for reducing the design–analysis iterations close to zero for a new family member. Consequently, the design delivery time and the cost of the product are minimized, which is crucial in product delivery strategies where product dimensions are stablished by the customer, as in Engineer To Order (ETO) strategies.
The time required in the two scenarios—(i) not defining a scaling rule, resulting in nearly zero design-analysis iterations, and (ii) performing model configuration and comparison tasks—can extend to days or even weeks, depending on the complexity of the design case. While quantifying the time savings in such frameworks is challenging, significant reductions are ensured, as surrogate model training takes only minutes and model execution requires only few seconds.
The URBaM modelling technique is currently limited to the use of full factorial DOEs. However, as reported by F. A. Viana et al. [64], full factorial designs are not recommended when more than five design variables are involved. Therefore, in this work, the authors recommend restricting the number of design variables to fewer than five when applying the URBaM method. In this context, it is important to emphasize the role of sensitivity analysis in eliminating unnecessary variables in surrogate modelling, as highlighted by J. Zhai and F. Boukouvala [65]. Future research should focus on overcoming the dependency on full factorial DOEs, thereby enabling the broader application of the URBaM technique to frameworks involving more than five variables.
Author Contributions
Conceptualization, X.T. and J.A.E.; methodology, X.T. and J.A.E.; software, X.T. and D.U.; validation, J.A.E. and M.E.; writing—original draft preparation, X.T., J.A.E. and D.U.; writing—review and editing, M.E. and I.U.; supervision, I.U. All authors have read and agreed to the published version of the manuscript.
Funding
This research received no external funding.
Data Availability Statement
The raw data that support the findings of this study are available from the corresponding author upon reasonable request. Access may be restricted because some data contain sensitive information from the analyzed industrial case studies.
Acknowledgments
Authors would like to express their gratitude to AMPO S.Coop. Innovation and Technology Development Department. This research would not have been possible without its collaboration.
Conflicts of Interest
The authors declare no conflict of interest.
Correction Statement
This article has been republished with a minor correction to the Data Availability Statement. This change does not affect the scientific content of the article.
Abbreviations
| ANN | Artificial Neural Network |
| CAE | Computer-Aided Engineering |
| DOE | Design Of Experiment |
| ETO | Engineer To Order |
| FEM | Finite Element Method |
| FVM | Finite Volume Method |
| HNL | High Non-Linearity |
| LNL | Low Non-Linearity |
| MAPE | Mean Absolute Percentage Error |
| MARS | Multivariate Adaptive Regression Splines |
| MLS | Moving Least Square |
| MNL | Medium Non-Linearity |
| NRMSE | Normalized Root Mean Square Error |
| POL2 | Second-Order Polynomial model |
| PPS-GA | Penalized Predictive Score Genetic Algorithm |
| QL | Quasi-Linear |
| RBF | Radial Basis Function |
| RF | Random Forest |
| RMAE | Relative Maximum Absolute Error |
| SVMR | Support Vector Machine Regression |
| URBaM | Univariate Regression Based Multivariate |
Appendix A. Fundamentals of Surrogate Modelling Techniques
Some of the most studied surrogate models in the literature, which have been selected as reference models to evaluate the proposed procedure, are (i) the polynomial model, (ii) the Artificial Neural Network (ANN) model, (iii) the Radial Basis Function (RBF) model, (iv) the Kriging model, (v) the Multivariate Adaptive Regression Splines (MARS) model, (vi) the Random Forest (RF) model, (vii) the Support Vector Machine Regression (SVMR) model, and (viii) the Standalone Weighted Ensemble model. Hereafter, the fundamentals of each model are briefly explained.
Appendix A.1. The Polynomial Model
The polynomial model (Equation (A1)) is one of the oldest and best known models in the literature [10,18]. As its name suggests, a polynomial function is used to model the problem [48,53]. The unknown β(…) coefficients of the model are usually determined by the maximum likelihood estimation [22], solving β = (Φ′·Φ)−1Φ′y: where y is the result matrix, β is the unknown coefficient matrix (with all unknown β(…) coefficients), and Φ is the matrix of Vandermonde (Equation (A2)) for the particular case when there is no interaction between design variables. In cases where design variables are also introduced, the matrix is expanded.
Different polynomial model configurations can be defined depending on the polynomial order d and the defined interaction between design variables (full/none/partial interaction) [11,66].
Appendix A.2. The Artificial Neural Network (ANN) Model
The Artificial Neural Network (ANN) imitates the neuronal function of a human brain by defining an imaginary network composed of “neurons” (also called nodes) classified in layers [26,27]. The imaginary network is composed of input, hidden, and output layers. The input layer comprises same number of design variable number nodes and the output layer consists of the same number of output variable nodes. Hence, multiple hidden layers and nodes can be configured by the model developer to define the global structure of the network.
The ANN model applies a data transformation procedure to the defined network. This procedure is unidirectional in the present regression framework [48], with the result that the transformation process starts in the input layer nodes, passes through the hidden layer nodes, and finishes in the output layer nodes. In each layer-to-layer link, all nodes from the previous layer pass information to each node of the next hidden layer. The model therefore performs a weighting of each input layer node value and combines them linearly, incorporating the effect of all nodes in the previous layer into the next working layer. The result of the linear combination in a node is then transformed by a linear or sigmoidal function, which is known as the activation function [48,67]. Finally, the transformed value is associated to the correspondent node, and the process is repeated in all nodes in the model until the output node value is determined.
The unknown parameters of the model are calculated by backpropagation technique. In other words, the calculation proceeds backwards through the network, and the defined forward process is then repeated to analyze if the change has improved model accuracy. This model accuracy improvement is measured by a lack of fit criteria, as shown [26,27]. The process is repeated iteratively until the lack of fit value converges over a predefined value, or until reaching maximum number of iterations.
Equation (A3) defines an example of an ANN model structure, the feedforward one-hidden-layer ANN model, which is widely reported in the literature [48]. In the equation, k represents the number of output variables; p the number of design variables; H the number of nodes in the second layer; υj,h and ωh,k the weighting factors from layer 1–2 and 2–3, respectively; θh and γk are constant terms known as bias nodes; and f1 and f2 are the activation functions used in one- to two-layer transformations, and two- to three-layer transformations, respectively.
Appendix A.3. The Radial Basis Function (RBF) Model
The Radial Basis Function (RBF) model is a parametric interpolation model defined from the sum of different N (number of design points) base functions [20]. Each base function is constructed symmetrically, considering each design point as the central point (Equation (A4)):
Several ψ basis functions can be defined, such as linear, cubic, thin plate spline, Gaussian, multiquadratic, and inverse multiquadratic. Multiple RBF configurations exist depending on the defined basis function. Moreover, most of these basis functions contain an additional c configuration parameter (for instance, the multiquadratic base function is ψ(rdist) = (rdist2 + c2)1/2. Then, the ωi weighting parameters are determined under the condition that the results of the RBF model must be the same as the results of the design points [20]. Thus, all ωi values are determined by solving W = Ψ−1y, where y is the result matrix, and Ψ is the Gram matrix composed of the defined basis functions, Ψi,j(|xi − xj|) for i,j = 1…N [22].
Appendix A.4. The Kriging Model
The Kriging model is an interpolation statistical model that treats the response as a realization of a random function Y(x) = f(x) + Z(x) [23]. On the one hand, the f(x) component defines the global trend of the response, and multiple kinds of Kriging configuration models can be developed depending on how the f(x) component is defined: (i) by a known constant term in a Simple Kriging configuration, (ii) by an unknown constant term in an Ordinary Kriging configuration, (iii) by polynomial functions with unknown coefficients in an Universal Kriging configuration, and (iv) by a Bayesian feature selection method that defines the most optimum representation in a Blind Kriging configuration [18,24,43]. However, the generic form of the model is the universal one, defined in Equation (A5): where bm(x) is a polynomial function, βm is the unknown coefficient matrix, and M is the number of polynomials used to represent the global trend.
On the other hand, the Z(x) component represents the local trend of the problem by a stationary Gaussian random process with normal distribution, zero mean value, variance σ2, and a non-zero covariance [18]. As a result, the following relationship is fulfilled (Equation (A6)):
The R correlation matrix can be defined with several kind of R(xi,xj) correlation functions (Equation (A7)) [58]. Nevertheless, the Gaussian correlation function with pu = 2 for all u design variables is a common configuration [22]. In addition, the Kriging model can also be configured considering the correlation parameter θu as an unknown constant term for all design variables, or as an unknown variable term for each design variable.
The prediction of a result using Kriging is performed by a linear predictor by using the information of the defined random function. The Kriging model uses the Best Linear Unbiased Predictor (BLUP) to find the linear predictor with the lowest Mean Square Error (MSE) value under the condition of unbiasedness (Equation (A8)) [23,48]: where the b matrix is composed of the bm polynomial functions based on the x test point values, and the r matrix comprises correlation functions that correlate the test point with the design points, the R correlation matrix with all θu parameters included, the YD results of the design points, the F matrix with all deduced values of the design points in bm function, and β coefficient matrix. Both θu and βm coefficients are determined by maximum likelihood estimation; in particular, the log-likelihood technique is applied [22]:
Appendix A.5. The Multivariate Adaptive Regression Splines (MARS) Model
The Multivariate Adaptive Regression Splines (MARS) is a non-parametric regression model (Equation (A9)) defined by [31]. This model is based on a recursive partitioning technique to generate M subdomains, represented by univariate truncated power basis functions, Bm, which are combined with an expansion coefficient, am [32]. Equation (A10) shows how each basis function is defined: where Km is the number of truncated functions multiplied in an m basis function, sk,m is a ±1 double value parameter, q is the order of the spline approximation, xv(k,m) is the design variable v of the truncated linear function k of the m basis function, and tk,m is the knot location of the corresponding design variable generated by the recursive partitioning. The “+” sign in Equation (A10) represents a truncated power basis function, the expression in Equation (A11).
The MARS model defines tk,m knot locations by an algorithm defined in [31]. The maximum number of basis functions are established by the user; however, the model then determines the optimum number of M basis functions, based on a stepwise forward and backward technique [13]. This process is iterative, introducing and removing the base functions, based on the value of the cross-validation error of the model measured in each iteration. Finally, the am parameters are defined by the least square technique [68].
Appendix A.6. The Random Forest (RF) Model
The Random Forest (RF) model (Equation (A12)) was defined by Breiman [34] in the machine learning field. The model is based on the averaged sum of randomly defined J trees [35]. Each tree is composed of a root node, terminal node, and intermediate nodes and are designated as base learners, hj(X,Θj). The definition of each tree is based on a Classification And Regression Tree (CART) technique; an initial root node is partitioned to create intermediate nodes. The intermediate nodes are recursively partitioned until a maximum number of partitions is reached and the terminal nodes are determined. Each tree is composed of a subgroup of design points and design variables randomly selected, Θj, from all X design points. The partition in each Q node is defined by split points, which are fixed by an iterative error measurement for different split point values (Equation (A13)). The Q node creates new Qleft and Qright nodes; the split point is located in the best position to minimize the sum error of both nleft and nright subgroups of points [33]: Qsplit = nleft Qleft + nright Qright.
The design points that are not used in each tree are known as out-of-bag data. This data can be used to calculate the Mean Square Error (MSE) in each zone of the domain of interest and identify the optimal configuration of the model, (for instance, for the definition of the number of trees of the model) [33].
Appendix A.7. The Support Vector Machine Regression (SVMR) Model
The Support Vector Machine Regression (SVMR) model is a non-parametric regression model from machine learning. The ε-insensitive SVMR is a particularly well-known example of this model, and is based on the definition of an acceptable ε error region (ε-tube) [28,29]. For this purpose, the SVMR model defines an optimization problem that maximizes the number of design points within the ε-tube and narrows the region as much as possible [30]. The model is built using only the points outside the ε-tube. Each point outside the ε-tube is converted into a penalization measure by convex loss functions, and the optimization problem minimizes the loss value. In addition, the optimization problem also minimizes ω, which is the flatness coefficient of the model that narrows the ε error region. Several loss functions are used in the literature (e.g., linear, quadratic) to develop different model configurations. In particular, the optimization problem of a SVMR model that uses a linear loss function configuration is defined in in Equation (A14) [11]. In this equation, the distance from the ε-tube to each point outside the range is established by slack variables (ξi and ξi*) for the N points outside, the yi represents the real measured value, and the C parameter is the box constant that the model uses for controlling the applied penalization factor to each point.
The process to solve the optimization problem is explained in [11]. First, the dual form of the equation is defined introducing Lagrange multipliers. The saddle point condition is then applied to the obtained Lagrange expression, and the Lagrange expression is minimized with respect to the primal variables and maximized with respect to the dual variables. The deduced dual variables αi and αi* became support vectors of the model. Finally, the parameter b is determined by using the Karush–Kuhn–Tucker (KKT) condition. Equation (A15) defines the SVMR model, where NSV represents the number of support vectors (same as the points outside the ε-tube). Different kernel functions are usually applied to represent non-linear problems. In this way, instead of (x·xi), a k(x·xi) kernel based on a transformation function is applied [30].
Appendix A.8. The Standalone Weighted Ensemble Model
Standalone Weighted Ensemble models are created by assembling other models presented in the literature, such as Kriging, SVMR, and polynomial models. The model, ŷensemble, depends on the sum of the product between a weighted ωi coefficient and the ŷi sub-model for NM assemblies (Equation (A16)). The sum of all ωi must be always 1. The values of ωi have been determined in different ways in the literature. For instance: Ref. [37] defined the PRESS Weighted average Surrogate (PWS) model, which is based on minimizing the Generalized Mean Square cross-validation Error (GMSE) criterion for deducing ωi; the Optimal Weighted Surrogate (OWS) model from [42] minimizes the Mean Square Error (MSE) to determine ωi; [41] minimizes the RMSE of the validation points and the GMSE from [42] with some changes in the usage of particular parameters to determine ωi; and [38] developed the Penalized Predictive Score (PPS) model, which is based on the minimization of the Mean Square Error (MSE) of the design points, the minimization of the 10-fold Cross-validation PRESS error, and the roughness penalty minimization to avoid overfitting considering the Bending Energy Functional (BEF) factor.
There exist several different types of sub-models and configurations between the same types of sub-models. The analysis time required to select the best option and create an ensemble model can be significant however, and hence the usage of evolutionary algorithms for defining ensemble models, such as genetic algorithms, has been studied in the literature. These algorithms optimize the search for the best possible models based on mutation and cross-over genetic operators [12,45]. For instance, Ref. [40] used genetic algorithms in its model with an equal value of ωi, and [38] defined the PPS–Genetic Aggregation (PPS-GA) model.
References
- Jiao, J.R.; Simpson, T.W.; Siddique, Z. Product family design and platform-based product development: A state-of-the-art review. J. Intell. Manuf. 2007, 18, 5–29. [Google Scholar] [CrossRef]
- Simpson, T.W.; Jiao, J.; Siddique, Z.; Hölttä-Otto, K. Advances in Product Family and Product Platform Design; Springer: New York, NY, USA, 2014; Volume 1. [Google Scholar]
- Simpson, T.W. Product platform design and customization: Status and promise. Ai Edam 2004, 18, 3–20. [Google Scholar] [CrossRef]
- Gao, F.; Xiao, G.; Simpson, T.W. Module-scale-based product platform planning. Res. Eng. Des. 2009, 20, 129–141. [Google Scholar] [CrossRef]
- Ma, J.; Kim, H.M. Product family architecture design with predictive, data-driven product family design method. Res. Eng. Des. 2016, 27, 5–21. [Google Scholar] [CrossRef]
- Nolan, D.C.; Tierney, C.M.; Armstrong, C.G.; Robinson, T.T. Defining simulation intent. Comput. -Aided Des. 2015, 59, 50–63. [Google Scholar] [CrossRef]
- Boussuge, F.; Tierney, C.M.; Vilmart, H.; Robinson, T.T.; Armstrong, C.G.; Nolan, D.C.; Léon, J.-C.; Ulliana, F. Capturing simulation intent in an ontology: CAD and CAE integration application. J. Eng. Des. 2019, 30, 688–725. [Google Scholar] [CrossRef]
- Chai, K.-H.; Wang, Q.; Song, M.; Halman, J.I.; Brombacher, A.C. Understanding competencies in platform-based product development: Antecedents and outcomes. J. Prod. Innov. Manag. 2012, 29, 452–472. [Google Scholar] [CrossRef]
- Craig, R.R., Jr.; Taleff, E.M. Mechanics of Materials; John Wiley & Sons: Hoboken, NJ, USA, 2020. [Google Scholar]
- Wang, G.G.; Shan, S. Review of metamodeling techniques in support of engineering design optimization. In Proceedings of the International Design Engineering Technical Conferences and Computers and Information in Engineering Conference, Philadelphia, PA, USA, 10–13 September 2006. [Google Scholar]
- Forrester, A.; Sobester, A.; Keane, A. Engineering Design via Surrogate Modelling: A Practical Guide; John Wiley & Sons: Hoboken, NJ, USA, 2008. [Google Scholar]
- Banyay, G.A.; Smith, S.D.; Young, J.S. Sensitivity Analysis of a Nuclear Reactor System Finite Element Model. In Proceedings of the ASME 2018 Verification and Validation Symposium, Minneapolis, MN, USA, 16–18 May 2018. [Google Scholar]
- Kleijnen, J.P. Design and analysis of simulation experiments. In Proceedings of the International Workshop on Simulation, Bergeggi, Italy, 21–23 September 2015; pp. 3–22. [Google Scholar]
- Habashneh, M.; Rad, M.M. Optimizing structural topology design through consideration of fatigue crack propagation. Comput. Methods Appl. Mech. Eng. 2024, 419, 116629. [Google Scholar] [CrossRef]
- Crombecq, K.; Laermans, E.; Dhaene, T. Efficient space-filling and non-collapsing sequential design strategies for simulation-based modeling. Eur. J. Oper. Res. 2011, 214, 683–696. [Google Scholar] [CrossRef]
- Garud, S.S.; Karimi, I.A.; Kraft, M. Design of computer experiments: A review. Comput. Chem. Eng. 2017, 106, 71–95. [Google Scholar] [CrossRef]
- Alizadeh, R.; Allen, J.K.; Mistree, F. Managing computational complexity using surrogate models: A critical review. Res. Eng. Des. 2020, 31, 275–298. [Google Scholar] [CrossRef]
- Simpson, T.W.; Poplinski, J.; Koch, P.N.; Allen, J.K. Metamodels for computer-based engineering design: Survey and recommendations. Eng. Comput. 2001, 17, 129–150. [Google Scholar] [CrossRef]
- Mao, J.; Hu, D.; Li, D.; Wang, R.; Song, J. Novel adaptive surrogate model based on LRPIM for probabilistic analysis of turbine disc. Aerosp. Sci. Technol. 2017, 70, 76–87. [Google Scholar] [CrossRef]
- Fang, H.; Horstemeyer, M.F. Global response approximation with radial basis functions. Eng. Optim. 2006, 38, 407–424. [Google Scholar] [CrossRef]
- Song, X.; Lv, L.; Sun, W.; Zhang, J. A radial basis function-based multi-fidelity surrogate model: Exploring correlation between high-fidelity and low-fidelity models. Struct. Multidiscip. Optim. 2019, 60, 965–981. [Google Scholar] [CrossRef]
- Forrester, A.I.; Keane, A.J. Recent advances in surrogate-based optimization. Prog. Aerosp. Sci. 2009, 45, 50–79. [Google Scholar] [CrossRef]
- Sacks, J.; Welch, W.J.; Mitchell, T.J.; Wynn, H.P. Design and analysis of computer experiments. Stat. Sci. 1989, 4, 409–423. [Google Scholar] [CrossRef]
- Mukhopadhyay, T.; Chakraborty, S.; Dey, S.; Adhikari, S.; Chowdhury, R. A critical assessment of Kriging model variants for high-fidelity uncertainty quantification in dynamics of composite shells. Arch. Comput. Methods Eng. 2017, 24, 495–518. [Google Scholar] [CrossRef]
- Qian, J.; Yi, J.; Cheng, Y.; Liu, J.; Zhou, Q. A sequential constraints updating approach for Kriging surrogate model-assisted engineering optimization design problem. Eng. Comput. 2020, 36, 993–1009. [Google Scholar] [CrossRef]
- Rodriguez-Galiano, V.; Sanchez-Castillo, M.; Chica-Olmo, M.; Chica-Rivas, M. Machine learning predictive models for mineral prospectivity: An evaluation of neural networks, random forest, regression trees and support vector machines. Ore Geol. Rev. 2015, 71, 804–818. [Google Scholar] [CrossRef]
- Pavlícek, K.; Kotlan, V.; Doležel, I. Applicability and comparison of surrogate techniques for modeling of selected heating problems. Comput. Math. Appl. 2019, 78, 2897–2910. [Google Scholar] [CrossRef]
- Awad, M.; Khanna, R. Support vector regression. In Efficient Learning Machines; Springer: Berlin/Heidelberg, Germany, 2015; pp. 67–80. [Google Scholar]
- Schlkopf, B.; Smola, A.J.; Bach, F. Learning with Kernels: Support Vector Machines, Regularization, Optimization, and Beyond; MIT Press: Cambridge, MA, USA, 2018. [Google Scholar]
- Drucker, H.; Burges, C.J.; Kaufman, L.; Smola, A.J.; Vapnik, V. Support vector regression machines. In Proceedings of the Advances in Neural Information Processing Systems, Denver, CO, USA, 1–6 December 1997; pp. 155–161. [Google Scholar]
- Friedman, J.H. Multivariate adaptive regression splines. Ann. Stat. 1991, 19, 1–67. [Google Scholar] [CrossRef]
- Crino, S.; Brown, D.E. Global optimization with multivariate adaptive regression splines. IEEE Trans. Syst. Man Cybern. Part B (Cybern.) 2007, 37, 333–340. [Google Scholar] [CrossRef]
- Cutler, A.; Cutler, D.R.; Stevens, J.R. Random forests. In Ensemble Machine Learning; Springer: Berlin/Heidelberg, Germany, 2012; pp. 157–175. [Google Scholar]
- Breiman, L. Random forests. Mach. Learn. 2001, 45, 5–32. [Google Scholar] [CrossRef]
- Dasari, S.K.; Cheddad, A.; Andersson, P. Random forest surrogate models to support design space exploration in aerospace use-case. In Proceedings of the IFIP International Conference on Artificial Intelligence Applications and Innovations, Hersonissos, Greece, 24–26 May 2019; pp. 532–544. [Google Scholar]
- Müller, J.; Shoemaker, C.A. Influence of ensemble surrogate models and sampling strategy on the solution quality of algorithms for computationally expensive black-box global optimization problems. J. Glob. Optim. 2014, 60, 123–144. [Google Scholar] [CrossRef]
- Goel, T.; Haftka, R.T.; Shyy, W.; Queipo, N.V. Ensemble of surrogates. Struct. Multidiscip. Optim. 2007, 33, 199–216. [Google Scholar] [CrossRef]
- Salem, M.B.; Tomaso, L. Automatic selection for general surrogate models. Struct. Multidiscip. Optim. 2018, 58, 719–734. [Google Scholar] [CrossRef]
- Acar, E. Various approaches for constructing an ensemble of metamodels using local measures. Struct. Multidiscip. Optim. 2010, 42, 879–896. [Google Scholar] [CrossRef]
- Gorissen, D.; De Tommasi, L.; Croon, J.; Dhaene, D. Automatic model type selection with heterogeneous evolution: An application to rf circuit block modeling. In Proceedings of the 2008 IEEE Congress on Evolutionary Computation (IEEE World Congress on Computational Intelligence), Hong Kong, China, 1–6 June 2008; pp. 989–996. [Google Scholar]
- Acar, E.; Rais-Rohani, M. Ensemble of metamodels with optimized weight factors. Struct. Multidiscip. Optim. 2009, 37, 279–294. [Google Scholar] [CrossRef]
- Viana, F.A.; Haftka, R.T.; Steffen, V. Multiple surrogates: How cross-validation errors can help us to obtain the best predictor. Struct. Multidiscip. Optim. 2009, 39, 439–457. [Google Scholar] [CrossRef]
- Joseph, V.R.; Hung, Y.; Sudjianto, A. Blind kriging: A new method for developing metamodels. J. Mech. Des. 2008, 130, 031102. [Google Scholar] [CrossRef]
- Ghiasi, R.; Ghasemi, M.R.; Noori, M. Comparative studies of metamodeling and AI-Based techniques in damage detection of structures. Adv. Eng. Softw. 2018, 125, 101–112. [Google Scholar] [CrossRef]
- Banyay, G. Surrogate Modeling and Global Sensitivity Analysis Towards Efficient Simulation of Nuclear Reactor Stochastic Dynamics. Ph.D. Thesis, University of Pittsburgh, Pittsburgh, PA, USA, 2019. [Google Scholar]
- Lu, H.; Li, Q.; Pan, T.; Agarwal, R.K. An adaptive region segmentation combining surrogate model applied to correlate design variables and performance parameters in a transonic axial compressor. Eng. Comput. 2021, 37, 275–291. [Google Scholar] [CrossRef]
- Jin, R.; Chen, W.; Simpson, T.W. Comparative studies of metamodelling techniques under multiple modelling criteria. Struct. Multidiscip. Optim. 2001, 23, 1–13. [Google Scholar] [CrossRef]
- Chen, V.C.; Tsui, K.-L.; Barton, R.R.; Meckesheimer, M. A review on design, modeling and applications of computer experiments. IIE Trans. 2006, 38, 273–291. [Google Scholar] [CrossRef]
- Jia, L.; Alizadeh, R.; Hao, J.; Wang, G.; Allen, J.K.; Mistree, F. A rule-based method for automated surrogate model selection. Adv. Eng. Inform. 2020, 45, 101123. [Google Scholar] [CrossRef]
- Williams, B.; Cremaschi, S. Selection of surrogate modeling techniques for surface approximation and surrogate-based optimization. Chem. Eng. Res. Des. 2021, 170, 76–89. [Google Scholar] [CrossRef]
- Villa-Vialaneix, N.; Follador, M.; Ratto, M.; Leip, A. A comparison of eight metamodeling techniques for the simulation of N2O fluxes and N leaching from corn crops. Environ. Model. Softw. 2012, 34, 51–66. [Google Scholar] [CrossRef]
- Chen, H.; Loeppky, J.L.; Sacks, J.; Welch, W.J. Analysis methods for computer experiments: How to assess and what counts? Stat. Sci. 2016, 31, 40–60. [Google Scholar] [CrossRef]
- Myers, R.H.; Montgomery, D.C.; Anderson-Cook, C.M. Response Surface Methodology: Process and Product Optimization Using Designed Experiments; John Wiley & Sons: Hoboken, NJ, USA, 2016. [Google Scholar]
- Aijazi, A.N.; Glicksman, L.R. Comparison of regression techiques for surrogate models of building energy performance. Proc. SimBuild 2016, 6, 327–334. [Google Scholar]
- Ozcanan, S.; Atahan, A.O. RBF surrogate model and EN1317 collision safety-based optimization of two guardrails. Struct. Multidiscip. Optim. 2019, 60, 343–362. [Google Scholar] [CrossRef]
- Fang, H.; Rais-Rohani, M.; Liu, Z.; Horstemeyer, M. A comparative study of metamodeling methods for multiobjective crashworthiness optimization. Comput. Struct. 2005, 83, 2121–2136. [Google Scholar] [CrossRef]
- Colaço, M.J.; Dulikravich, G.S.; Sahoo, D. A comparison of two methods for fitting high dimensional response surfaces. In Proceedings of the Inverse Problems, Design and Optimization Symposium, Miami, FL, USA, 16–18 April 2007; pp. 16–18. [Google Scholar]
- Levy, S.; Steinberg, D.M. Computer experiments: A review. AStA Adv. Stat. Anal. 2010, 94, 311–324. [Google Scholar] [CrossRef]
- Jekabsons, G. ARESLab: Adaptive Regression Splines Toolbox for Matlab/Octave. Available online: http://www.cs.rtu.lv/jekabsons/regression.html (accessed on 25 August 2025).
- Milborrow, S.; Hastie, T.; Tibshirani, R.; Miller, A.; Lumley, T. Earth: Multivariate Adaptive Regression Splines. Available online: https://cran.r-project.org/web/packages/earth/index.html (accessed on 25 August 2025).
- Jekabsons, G. M5PrimeLab: M5 Regression Tree, Model Tree, and Tree Ensemble Toolbox for Matlab/Octave. Available online: http://www.cs.rtu.lv/jekabsons/regression.html (accessed on 25 August 2025).
- Wang, Y.; Witten, I.H. Induction of Model Trees for Predicting Continuous Classes; University of Waikato: Hamilton, New Zealand, 1996. [Google Scholar]
- Jekabsons, G. Radial Basis Function Interpolation Toolbox for Matlab/Octave. Available online: http://www.cs.rtu.lv/jekabsons/regression.html (accessed on 25 August 2025).
- Viana, F.A.; Gogu, C.; Goel, T. Surrogate modeling: Tricks that endured the test of time and some recent developments. Struct. Multidiscip. Optim. 2021, 64, 2881–2908. [Google Scholar] [CrossRef]
- Zhai, J.; Boukouvala, F. Nonlinear variable selection algorithms for surrogate modeling. AIChE J. 2019, 65, e16601. [Google Scholar] [CrossRef]
- Johnson, R.T.; Montgomery, D.C.; Jones, B.; Parker, P.A. Comparing computer experiments for fitting high-order polynomial metamodels. J. Qual. Technol. 2010, 42, 86–102. [Google Scholar] [CrossRef]
- Hyndman, R.J.; Athanasopoulos, G. Forecasting: Principles and Practice; OTexts: Melbourne, Australia, 2018. [Google Scholar]
- Bakin, S.; Hegland, M.; Osborne, M.R. Parallel MARS algorithm based on B-splines. Comput. Stat. 2000, 15, 463–484. [Google Scholar] [CrossRef]
Disclaimer/Publisher’s Note: The statements, opinions and data contained in all publications are solely those of the individual author(s) and contributor(s) and not of MDPI and/or the editor(s). MDPI and/or the editor(s) disclaim responsibility for any injury to people or property resulting from any ideas, methods, instructions or products referred to in the content. |
© 2025 by the authors. Licensee MDPI, Basel, Switzerland. This article is an open access article distributed under the terms and conditions of the Creative Commons Attribution (CC BY) license (https://creativecommons.org/licenses/by/4.0/).