1. Introduction
As a result of long-term geological tectonic forces, significant internal stress accumulates within the rock mass, and structural planes of various sizes develop, including faults, joints, layers, and fracture zones [
1,
2,
3,
4]. Joints, as discontinuous structures that are widespread within rock masses, play a crucial role in the mechanical behavior of rock masses due to their inclinations. Variations in joint inclination [
5,
6] profoundly affect the distribution of stress states within the rock mass and directly influence the failure mode, strength characteristics, and deformation behavior of the rock mass. In addition, during tunneling, the rock mass is continuously subjected to the original in situ stress field and undergoes significant stress unloading stages. As a result, the rock mass is prone to shear, tensile, or compressive failure along the joint planes, which results in a sharp decline in stability [
7,
8] and increases the risk of collapse during tunnel excavation.
Significant progress has been made in the study of the mechanical behavior of jointed rock masses under a single loading condition. The existence of joints in rock masses severely weakens their integrity and continuity, resulting in rocks exhibiting highly nonlinear and complex mechanical responses [
9,
10]. Many scholars have systematically explored the influence of joint properties on the mechanical performance of rock masses by controlling the test conditions. For instance, Shan et al. [
11] conducted a triaxial compression test to analyze the effects of joint roughness on the stress/strain relationship, failure mode, strength parameters, and Poisson’s ratio. Peng et al. [
12] revealed the influence of defect size on mechanical behavior, energy evolution, and damage accumulation of sandstone with different fracture lengths through experiments under uniaxial compression, and established the corresponding damage constitutive model. In terms of the spatial configuration of fractures, Chen, Yang et al. [
13,
14] investigated the failure mechanism and mechanical properties of rock samples with parallel fractures at different inclinations, and constructed a strength prediction model based on the fracture inclination angle. Zheng et al. [
15] conducted uniaxial compression tests on non-parallel fracture sandstone, explored the effect of fracture inclination angle on fracture initiation, propagation, and fracture mode, and proposed the constitutive relationship describing the discontinuous fracture behavior. These studies focus on a single loading path, providing a key theoretical basis for a deeper understanding of the failure mechanism and energy evolution characteristics of jointed rock masses [
16,
17].
During the excavation of tunnels, roadways, and other chambers, due to the diversity of excavation methods and engineering disturbances, rock masses often undergo complex changes in loading and unloading stress paths, resulting in significant path dependence in their mechanical behavior [
18,
19,
20]. In the research on the mechanical response of rock mass under loading and unloading stress paths, many scholars have conducted systematic studies through laboratory experiments. Huang et al. [
21] analyzed the mechanical properties and fracture surface characteristics of argillaceous sandstone under different stress paths through triaxial loading and unloading tests. Lin et al. [
22] studied the anisotropic mechanical behavior and failure mechanism of shale under different stress paths, especially the influence of the bedding plane angle, distribution, and confining pressure, providing theoretical support for the optimization of fracturing processes in shale gas development. Huang et al. [
23] explored the mechanical properties, deformation behavior, and failure mechanism of sandstone during loading and unloading, with particular attention to the evolution laws of deformation modulus and Poisson’s ratio under unloading conditions. An et al. [
24] conducted triaxial unloading tests on frozen weakly cemented sandy slate under different initial principal stress conditions, revealing the principal stress effects on its deformation and failure mechanisms. Based on the results of laboratory experiments, scholars have further developed energy theory and damage mechanics models in the research of energy evolution and damage constitutive models. Cheng et al. [
25] constructed an elastoplastic constitutive model to describe the energy dissipation and crack evolution mechanism of rocks during loading, thereby enhancing the predictive ability for the rock failure process. Gong et al. [
26] proposed an improved constitutive model for brittle rock damage based on the linear energy dissipation law, effectively improving the simulation deviation of the traditional Lemaitre model in the initial compaction stage. Yan et al. [
27] systematically revealed the damage anisotropy and failure mechanism of jointed rock masses under different joint inclination angles and confining pressures from the perspective of energy evolution, providing a theoretical basis for the prediction of rock mass stability.
In conclusion, substantial results have been achieved in the research on the mechanical properties and energy evolution of rocks subjected to different stress path loading methods and various types of defects, such as single fractures, combined fractures, parallel fractures, and non-parallel fractures [
28,
29]. However, there is limited research on connected and unconnected double-jointed rocks considering varying inclinations under different stress paths. Therefore, in this study, a high-pressure triaxial test system for rocks is employed to conduct conventional triaxial compression and increase axial pressure to relieve confining pressure tests. Mechanical tests are conducted on through-double-joint sandy slate to further investigate the influence of loading and unloading methods, as well as through-joints at varying inclinations, on the mechanical behavior and energy evolution laws of sandy slate. The research aims to provide a significant scientific foundation and theoretical support for the stability analysis of geotechnical engineering under complex stress paths, strength prediction of jointed rock masses, and failure mechanism analysis.
2. Test Scheme
2.1. Preparation of Intact and Jointed Specimens
Based on the principle of similarity theory [
30], and with reference to the latest research by scholars both domestically and internationally in the field of rock simulation materials, as well as the on-site engineering geological exploration report, this study investigates the proposed use of a cement/sand/barite powder mixture as the primary material for simulating jointed rocks in experiments. Furthermore, complete model specimens of the same material were prepared by adjusting the water/cement ratio. Material A consists of cement, sand, water, and barite powder in mass ratios of 1:1:0.3:0.6, 1:1:0.4:0.6, 1:1:0.5:0.6, and 1:1:0.6:0.6, respectively. The original rock mechanical parameters are presented in
Table 1. According to the data in the table, the mass ratio of cement, sand, and barite powder at 1:1:0.5:0.6 most closely approximates the parameters of the original rock and thus was selected for sample preparation.
According to the requirements of the “Standard Test Methods for Engineering Rock Mass” (GB/T50266-2013) [
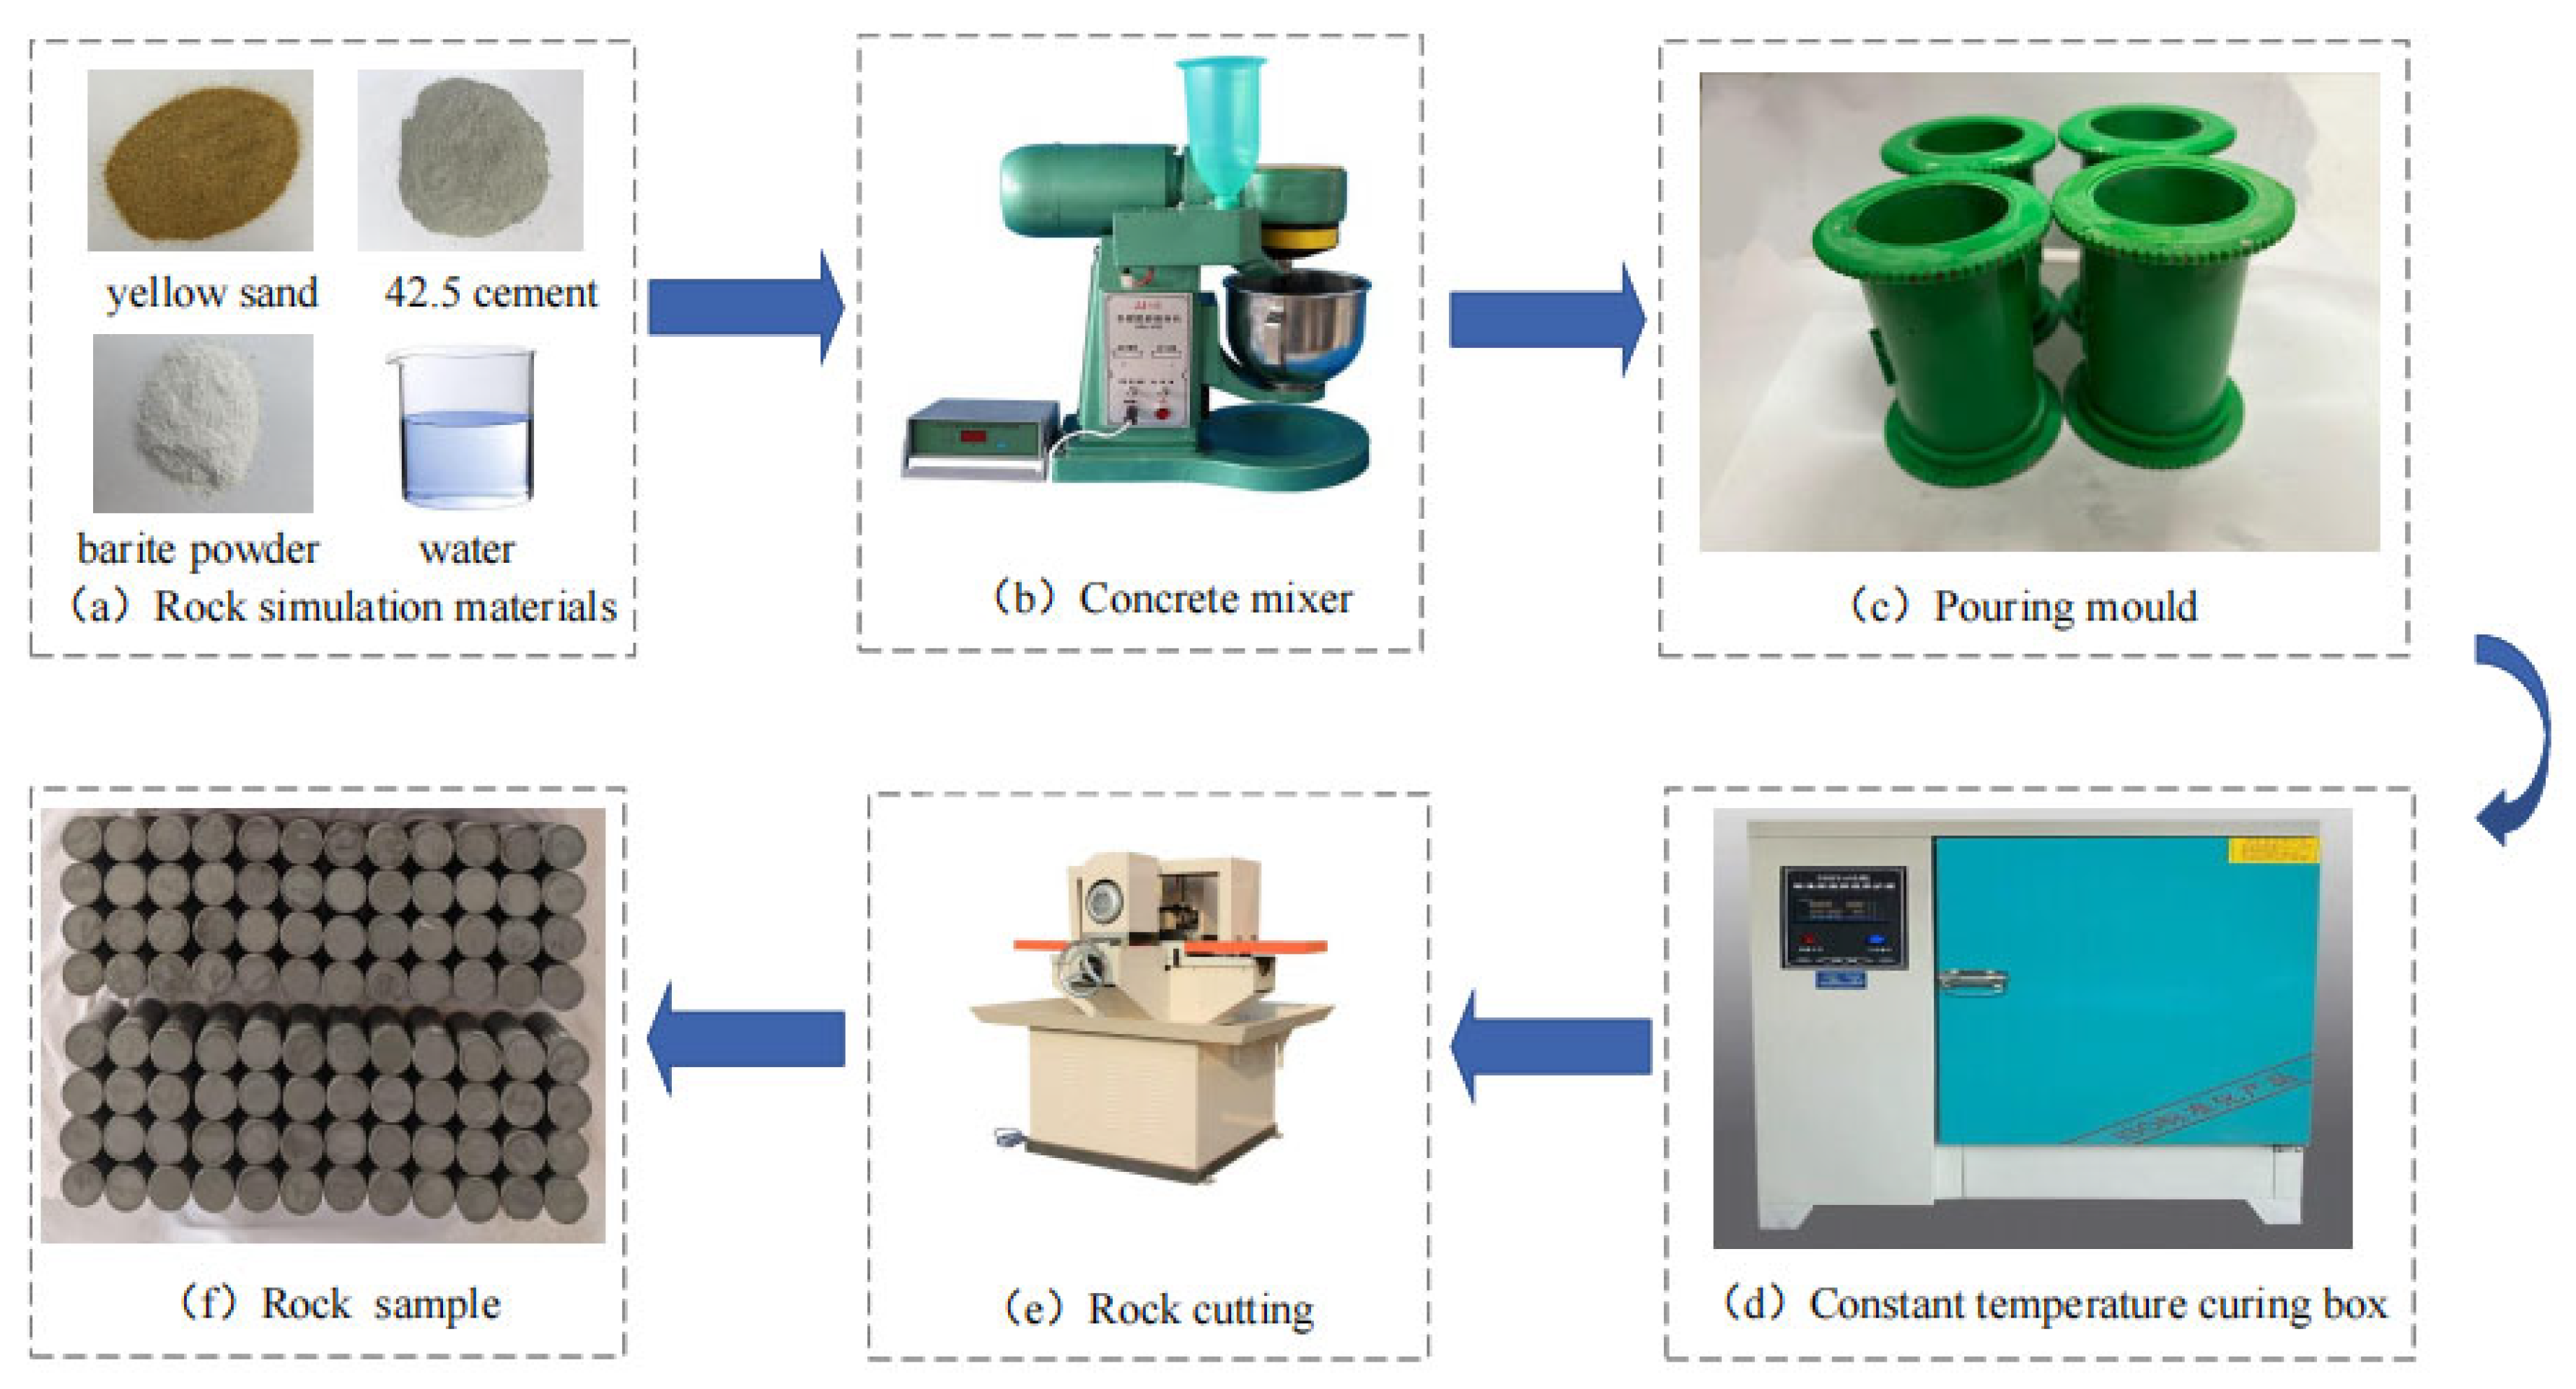
31], prepare standard cylindrical specimens with a diameter of 50 mm and a height of 100 mm. Ensure that the non-parallelism of the two ends of the specimens does not exceed 0.05 mm, and the end faces are perpendicular to the axis of sandy slate, with a maximum deviation of no more than 0.25°. The preparation process is shown in
Figure 1, and each sub-figure corresponds to the following key steps: (a) Is the simulated material of cement, sand, water, and barite powder (mass ratio 1:1:0.5:0.6); (b) Use a mixer to evenly mix the materials in the prescribed proportion; (c) Pour the mixture into a mold (a cylinder with a diameter of 50 mm and a height of 100 mm) to allow it to solidify and take shape; (d) After demolding, place the initial blank sample in the curing box for curing; (e) Use a cutting machine to grind the end face and the periphery of the sample (control the non-parallelism of the two end faces ≤ 0.05 mm, and the deviation of the perpendicularity of the end face to the axis ≤ 0.25°); (f) Obtain complete samples that comply with the “Standard Test Methods for Engineering Rock Mass” (GB/T50266-2013) to prepare for the subsequent prefabricated joint and mechanical tests.
The complete model sample was cut by water jet cutting. The joint width was processed with a 1 mm water jet nozzle (cutting speed of 5 mm/s, random inspection deviation ≤0.05 mm), and the length was processed according to the 15 mm radial path preset by CAD (laser detection deviation ≤ 0.1 mm, radial offset ≤ 0.2 mm). The preset inclination angle is positioned with a 0.1° precision fixture and detected with a 0.05° precision digital display angle meter (3 sections, deviation ≤ 0.2°, error traceable). The inclination angle of one joint is fixed at 0°. Another joint has inclination angles of 0°, 30°, 60°, and 90°, respectively (referred to as the through-double-joint sandy slate with inclination angles of 0°, 30°, 60°, and 90°), with a joint length of 15 mm and a width of 1 mm. Meanwhile, the surface roughness and matching degree of the joints are controlled by alcohol residue removal, synchronous processing in the same batch, and positioning pin splicing (error ≤ 0.02 mm) to ensure the geometric and state accuracy of the joints. The cut sandstone slate joint-like rock material sample is shown in
Figure 2.
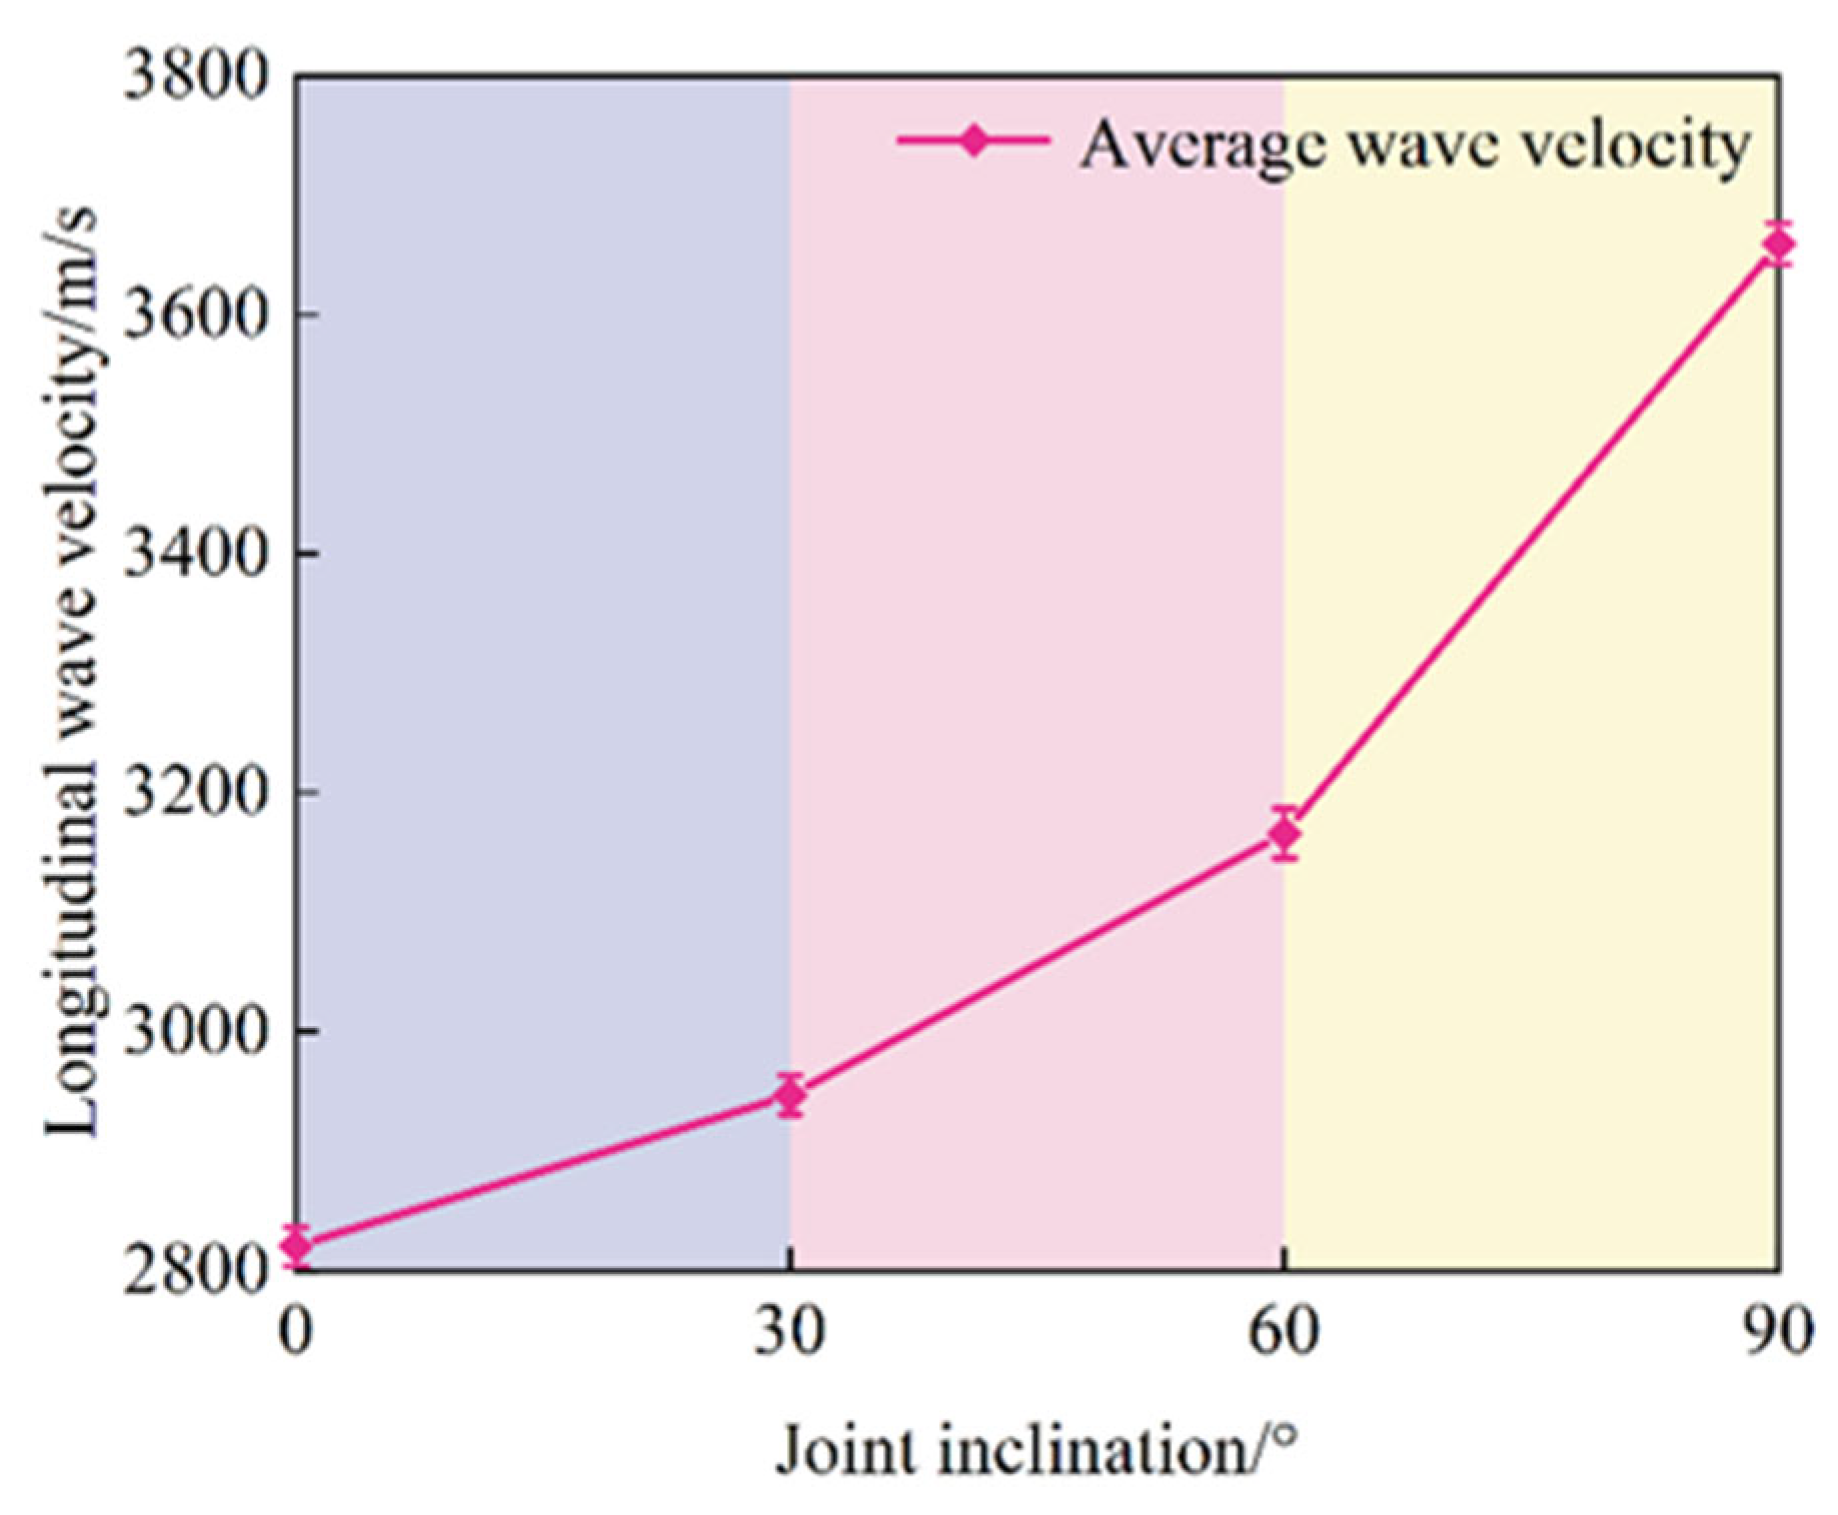
To ensure the accuracy of the test results and the homogeneity of the rock samples, the longitudinal wave velocity of the sandy slate was measured using a non-metallic ultrasonic instrument. The results of determining the through-type double-joint sandy slate are presented in
Figure 3. The “upper and lower boundaries” corresponding to each group of inclination angles in the figure represent the measured discrete range (maximum–minimum value) of the longitudinal wave velocity of the three parallel specimens, specifically: 0° (2780–2860 m/s), 30° (2905–2989 m/s), 60° (3112–3220 m/s), 90° (3600–3704 m/s). The boundary determination is based on the “Standard Test Methods for Engineering Rock Mass” (GB/T50266-2013), and is obtained through acoustic wave tests of three parallel samples (the same material, the same process, and the same curing), reflecting the objective dispersion (dispersion rate ≤ 3%) caused by the micro-homogeneity of the material and the slight deviation of the preparation process. It does not affect the core law that “the wave speed increases with the joint inclination angle”. The average longitudinal wave velocities at joint inclinations of 0°, 30°, 60°, and 90° were 2820, 2947, 3166, and 3652 m/s, respectively. The differences in wave velocities were primarily attributed to the variation in the angle between the joint surface and the direction of wave velocity propagation. When the joint inclinations were smaller, the joint surface was approximately parallel to the direction of wave propagation, which caused a stronger hindrance effect on the wave and a greater energy loss. As the inclination angle increased, the angle between the joint surface and the direction of wave propagation gradually changed, weakening its hindrance to wave propagation. In addition, the force-bearing structure formed within the rock mass due to the adjustment of the joint inclination angle is more conducive to wave transmission, and the wave velocity shows a gradual increasing trend. When the inclination reaches 90°, the plane becomes perpendicular to the direction of wave propagation. At this point, the cutting effect of the joints on wave propagation becomes minimal, the integrity of the rock mass improves, and energy loss is significantly reduced.
As shown in
Figure 3, the relative error in the longitudinal wave velocity is small, indicating a lower degree of dispersion in the sample. In terms of the trend, the longitudinal wave velocity exhibits a distinct growth pattern with the increase in the joint inclination angle, though there are significant differences in the growth characteristics across different inclination angle intervals. In the low inclination angle range of 0–30°, the wave velocity increases relatively gradually; as the inclination increases to 30–60°, the rate of wave velocity increases significantly; and in the high inclination range of 60° to 90°, the wave speed exhibits the most significant acceleration trend.
2.2. Test Instruments and Test Scheme Design
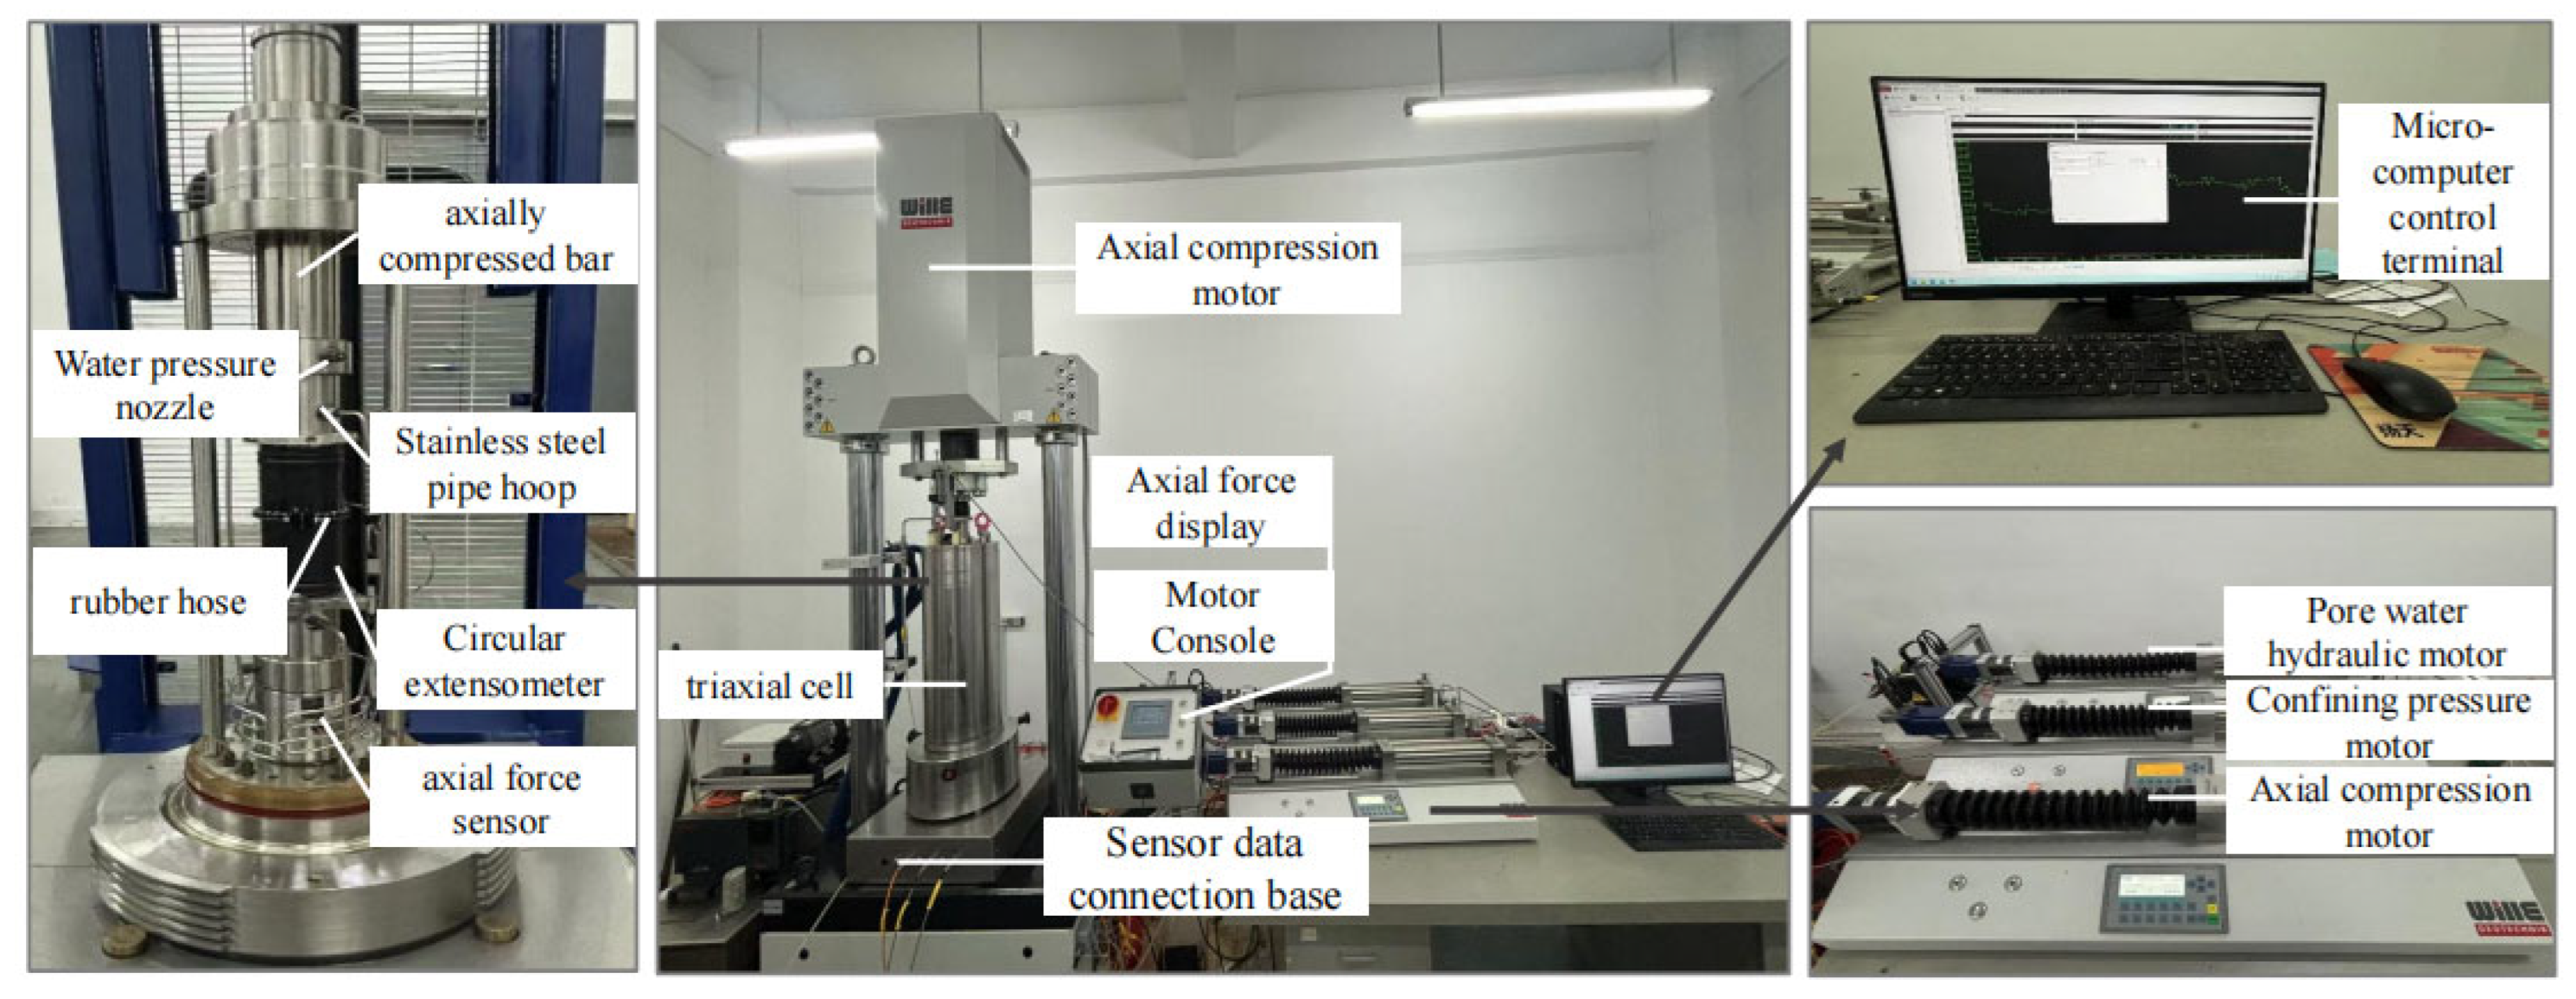
The test equipment was selected using the rock high-pressure triaxial test system from the Institute of Underground Structures at Anhui University of Technology, specifically, the German WILLE-00111-A0-005 model. A full view of the test equipment is shown in
Figure 4. Conventional triaxial compression tests and tests with increased axial compression and relieved confining pressure were conducted on double-jointed sandy slate specimens. The specific test plan is outlined as follows:
Conventional triaxial compression test: (1) Axial and confining pressures were applied simultaneously at a loading rate of 0.05 MPa/s under hydrostatic pressure conditions, reaching values of 2, 4, 6, and 8 MPa; (2) During the axial loading phase, the confining pressure was kept constant, and axial compression was applied at a rate of 0.002 mm/s until the specimen was completely fractured.
Increase axial pressure to relieve confining pressure test: (1) Axial and confining pressures were applied simultaneously at a loading rate of 0.05 MPa/s under hydrostatic pressure conditions, reaching values of 2, 4, 6, and 8 MPa; (2) During the axial compression loading phase, the confining pressure was maintained constant, and axial pressure was applied in displacement control mode at a rate of 0.002 mm/s until it reached 70% of the ultimate axial pressure; (3) During the phase of increased axial pressure and relieved confining pressure, axial pressure was increased at a rate of 0.002 mm/s while the confining pressure was gradually reduced at a rate of 0.05 MPa/s until the specimen was completely fractured.
The first stage of the axial pressure increase and confining pressure relief test (constant confining pressure increase of axial pressure) terminates at 70% of the peak axial stress. The basis for selecting this threshold is as follows. In the middle and late stages of specimen yield (pre-tests show that the yield stage of the four types of inclinity/angle specimens is concentrated at 60–80% of the peak stress), it can trigger the damage evolution during the confining pressure relief stage and avoid premature failure. Meanwhile, this threshold matches the rock mass stress level (peak strength 60–80%) before deep tunnel excavation, which can meet the actual engineering requirements. In addition, referring to the existing research on the relief of confining pressure in jointed rock masses, 70% peak stress is a commonly used threshold, which can ensure the comparability of the results of this study with similar studies. Moreover, the pre-test verification shows that under this threshold, the specimens exhibit typical tension/shear composite failure, with clear energy evolution curve characteristics, and the data dispersion rate of parallel specimens is ≤5%, meeting the requirements of test accuracy.
To reduce the influence of friction at the end of the specimen on the uniformity of stress, in the test, gaskets with center holes were placed between the upper and lower end faces of the specimen and the indenter, and standard specimens with a height-to-diameter ratio of 2:1 (φ 50 mm × 100 mm) were used to suppress the end restraint effect to the greatest extent. During data processing, no end stress correction was carried out. However, since all samples were tested under the same conditions, the systematic error caused by the end effect does not affect the validity of the comparison between the test results of different groups.
4. Energy Evolution Characteristics
4.1. Energy Calculation Methods
According to thermodynamic theory, under complex stress conditions, the total energy converted from the work performed by external forces on the rock mass units is distributed in two forms: one part is stored in the rock as releasable elastic strain energy (which can be recovered when unloaded), and the other part is converted into unidirectional, irreversible dissipated energy (dissipated in the form of heat, sound, etc., during the plastic deformation of the rock and fracture propagation, etc.) [
37]. In this experiment, it is assumed that the entire system is a closed system with no energy exchange with the external environment, and only energy conversion occurs within the system, that is:
In the formula, is the total strain energy input by the external force during the test process; is the release elastic strain energy; is dissipated energy.
In a conventional triaxial compression test, the axial stress causes the jointed specimen to undergo axial compression (the displacement is in the same direction as the stress), thus doing positive work on the specimen; the specimen expands radially (the displacement is opposite to the confining stress), so the confining stress does negative work on the specimen. Therefore, the total energy
absorbed by the jointed rock mass throughout the test can be expressed as [
38]:
In the formula, is the absorbed energy of the jointed sample under the action of axial force; is the energy consumed by the jointed rock mass sample in overcoming the negative work of confining pressure.
The calculation formulas for the absorbed energy
generated by axial stress and the dissipated energy
caused by confining pressure constraints of the jointed specimen during the test are as follows:
In the formula, , , and , respectively, represent the axial stress, axial strain, confining pressure, and circumferential strain corresponding to each point on the full stress/strain curve.
In conventional triaxial compression and loading/unloading tests, the formula for calculating the elastic energy
of jointed specimens is:
where
is the modulus of elasticity;
is Poisson’s ratio.
In the energy calculation of this study, the elastic strain energy
is calculated using Formula (5), in which the elastic modulus
and Poisson’s ratio
involved are both regarded as constants. The values are derived from the basic mechanical parameters determined through uniaxial tests of complete specimens in
Table 1 of this paper. Although the mechanical parameters of materials will show a certain path dependence after entering plastic deformation (i.e., the instantaneous tangent value will change), using constant elastic parameters to estimate the release/release elastic strain energy is a commonly used method in rock mechanics energy analysis [
26].
From the above, it can be known that the relationship between total energy
and each energy is:
Then, the dissipated energy
is:
4.2. Energy Evolution Law of Specimens with Double Joints
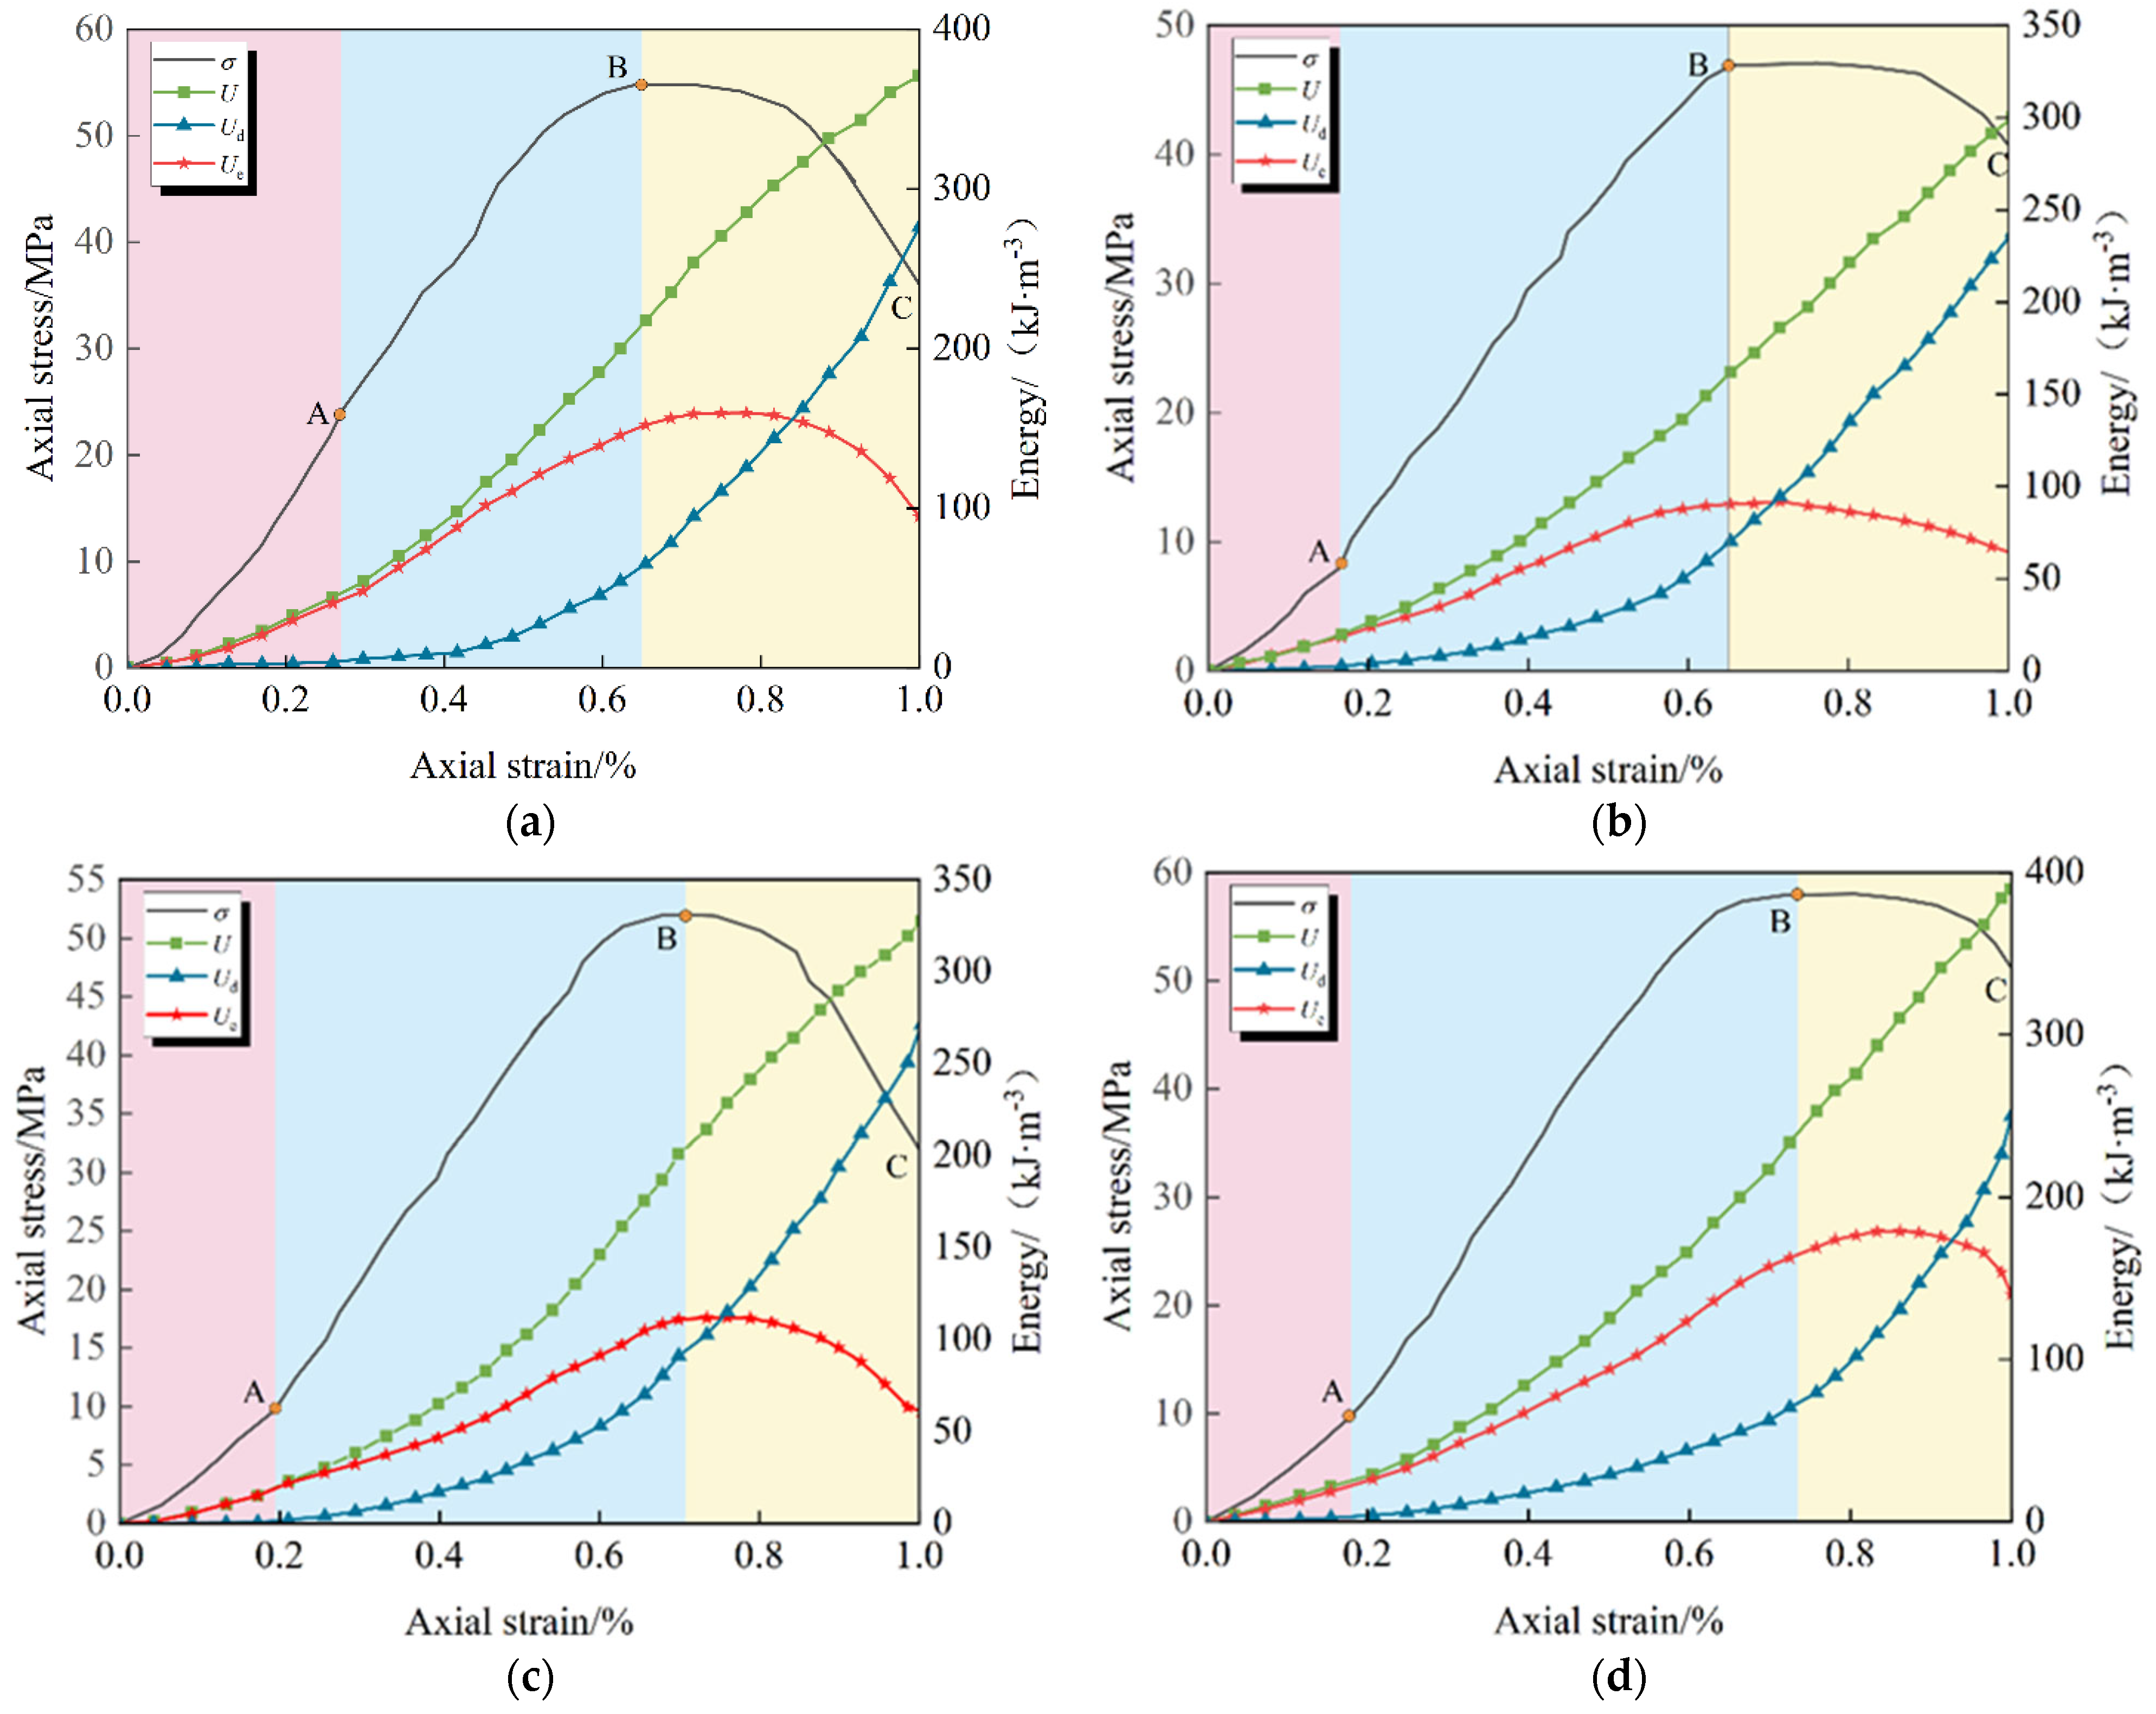
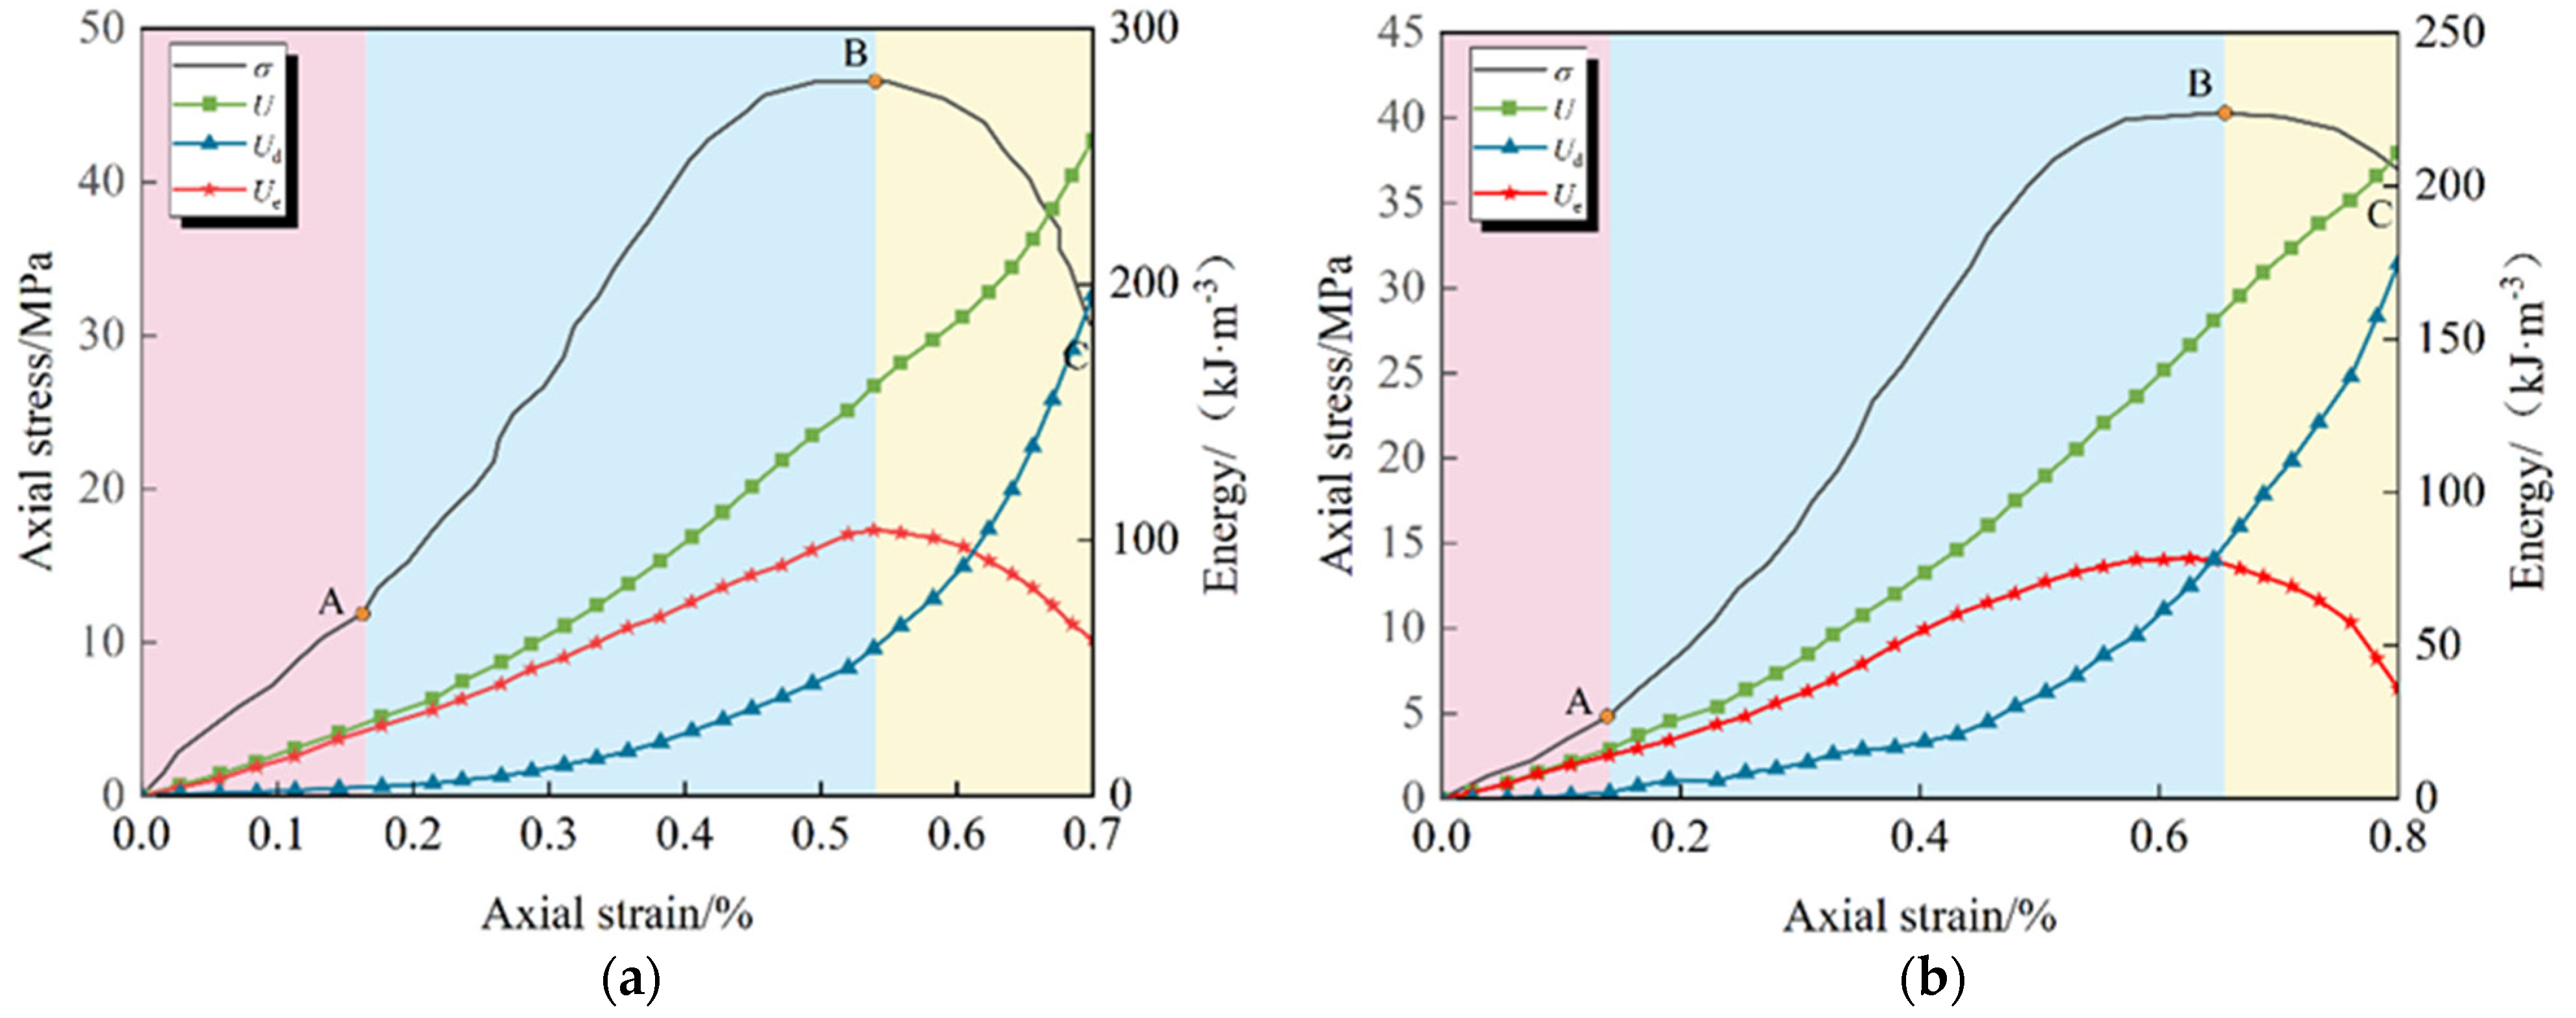
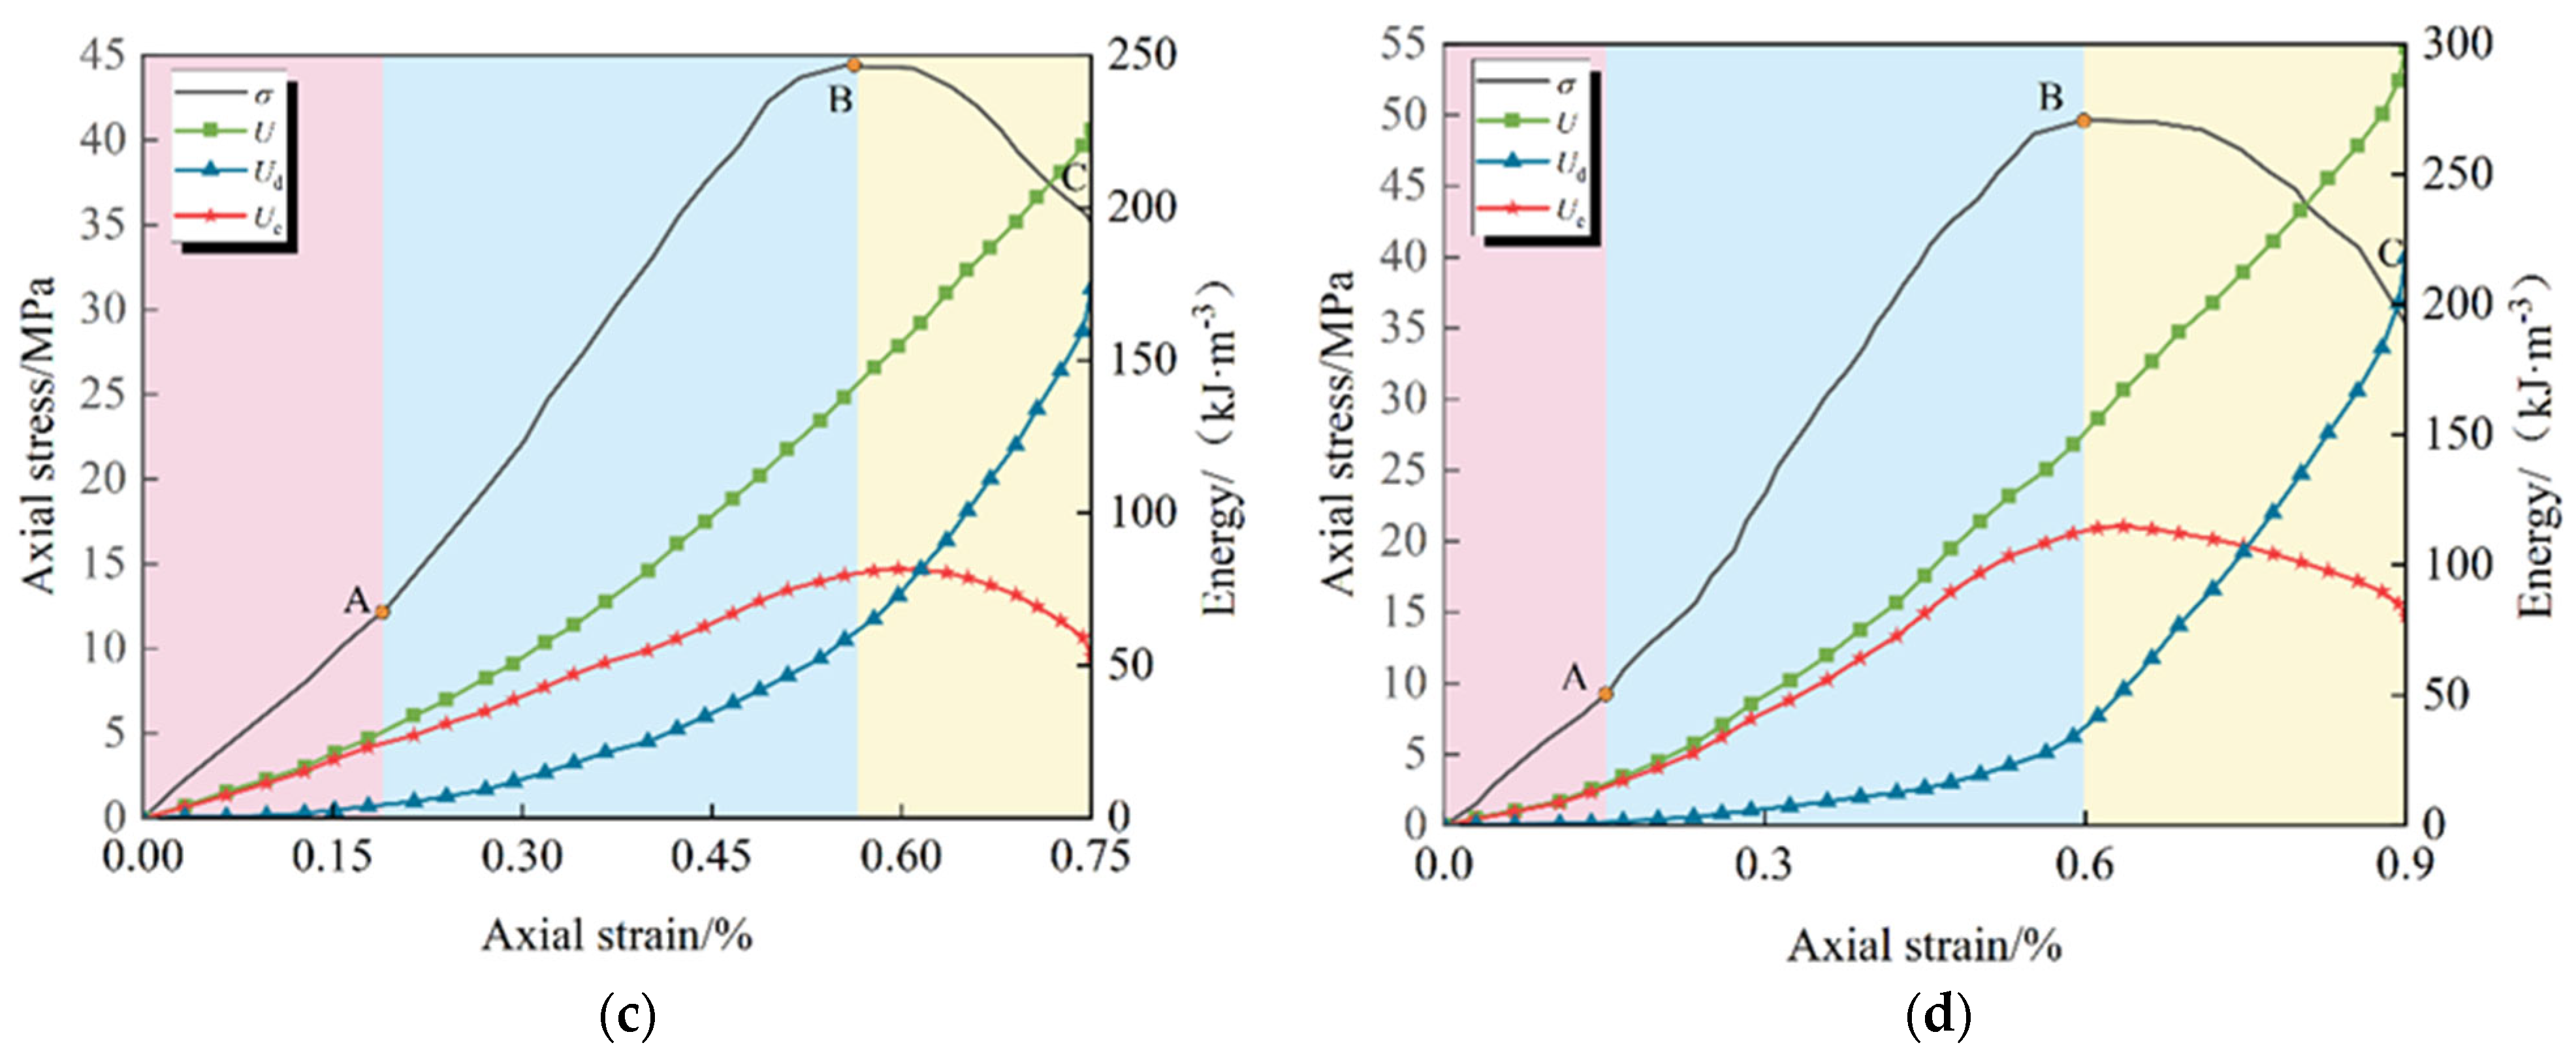
Based on the principle of energy conservation, along with the stress/strain data obtained from conventional triaxial compression and increased axial compression relief confining tests on double-jointed specimens at various inclinations under low confining pressure (2 MPa) conditions, the axial stress/axial strain/energy evolution curves for specimens at different inclinations under the two stress paths were calculated and subsequently plotted, as shown in
Figure 9 and
Figure 10, respectively.
Observing
Figure 9 and
Figure 10, it is evident that the energy evolution patterns of the double-jointed specimens, with varying inclinations, under both loading modes are remarkably similar [
39]. The elastic strain energy initially increases and subsequently decreases, and its post-peak variation pattern aligns with the post-peak attenuation pattern of the axial stress curve. Additionally, as the joint inclination angle increases, the dissipated energy and total energy of the specimens at the end of both loading modes exhibit a “V” pattern, initially decreasing and then increasing.
The energy variation curves of the double-jointed specimens under different stress paths exhibit the same trend, and the energy evolution pattern was systematically analyzed based on the characteristic stages of the axial stress/axial strain curve: the linear elastic stage (OA), plastic yield stage (AB), and post-peak failure stage (BC).
(1) In the linear elastic phase (OA segment), the total energy and elastic strain energy increase synchronously and linearly, with the two curves approximately overlapping; dissipated energy remains near zero. This indicates that almost all energy absorbed by the specimen is converted into elastic strain energy and stored within the rock mass.
(2) During the plastic yield stage (AB section), the total energy and elastic strain energy continue to increase, but the growth rate slows significantly and reaches the storage limit at the peak strength point; simultaneously, dissipated energy rises sharply, reflecting the large amount of energy consumed by the initiation and propagation of internal cracks and irreversible plastic deformation of the specimen.
(3) Entering the post-peak failure stage (BC section), after the stress/strain curve passes the peak point, the elastic strain energy stored within the double-jointed specimen begins to be released, and the elastic energy curve shows an inflection point, dropping synchronously with the axial stress; simultaneously, the total energy and dissipated energy continue to increase, with the two curves approximately parallel, reflecting the dominant energy dissipation during the macroscopic failure process caused by the continuous expansion and penetration of the fissure.
4.3. The Influence of Joint Inclination Angle on Energy
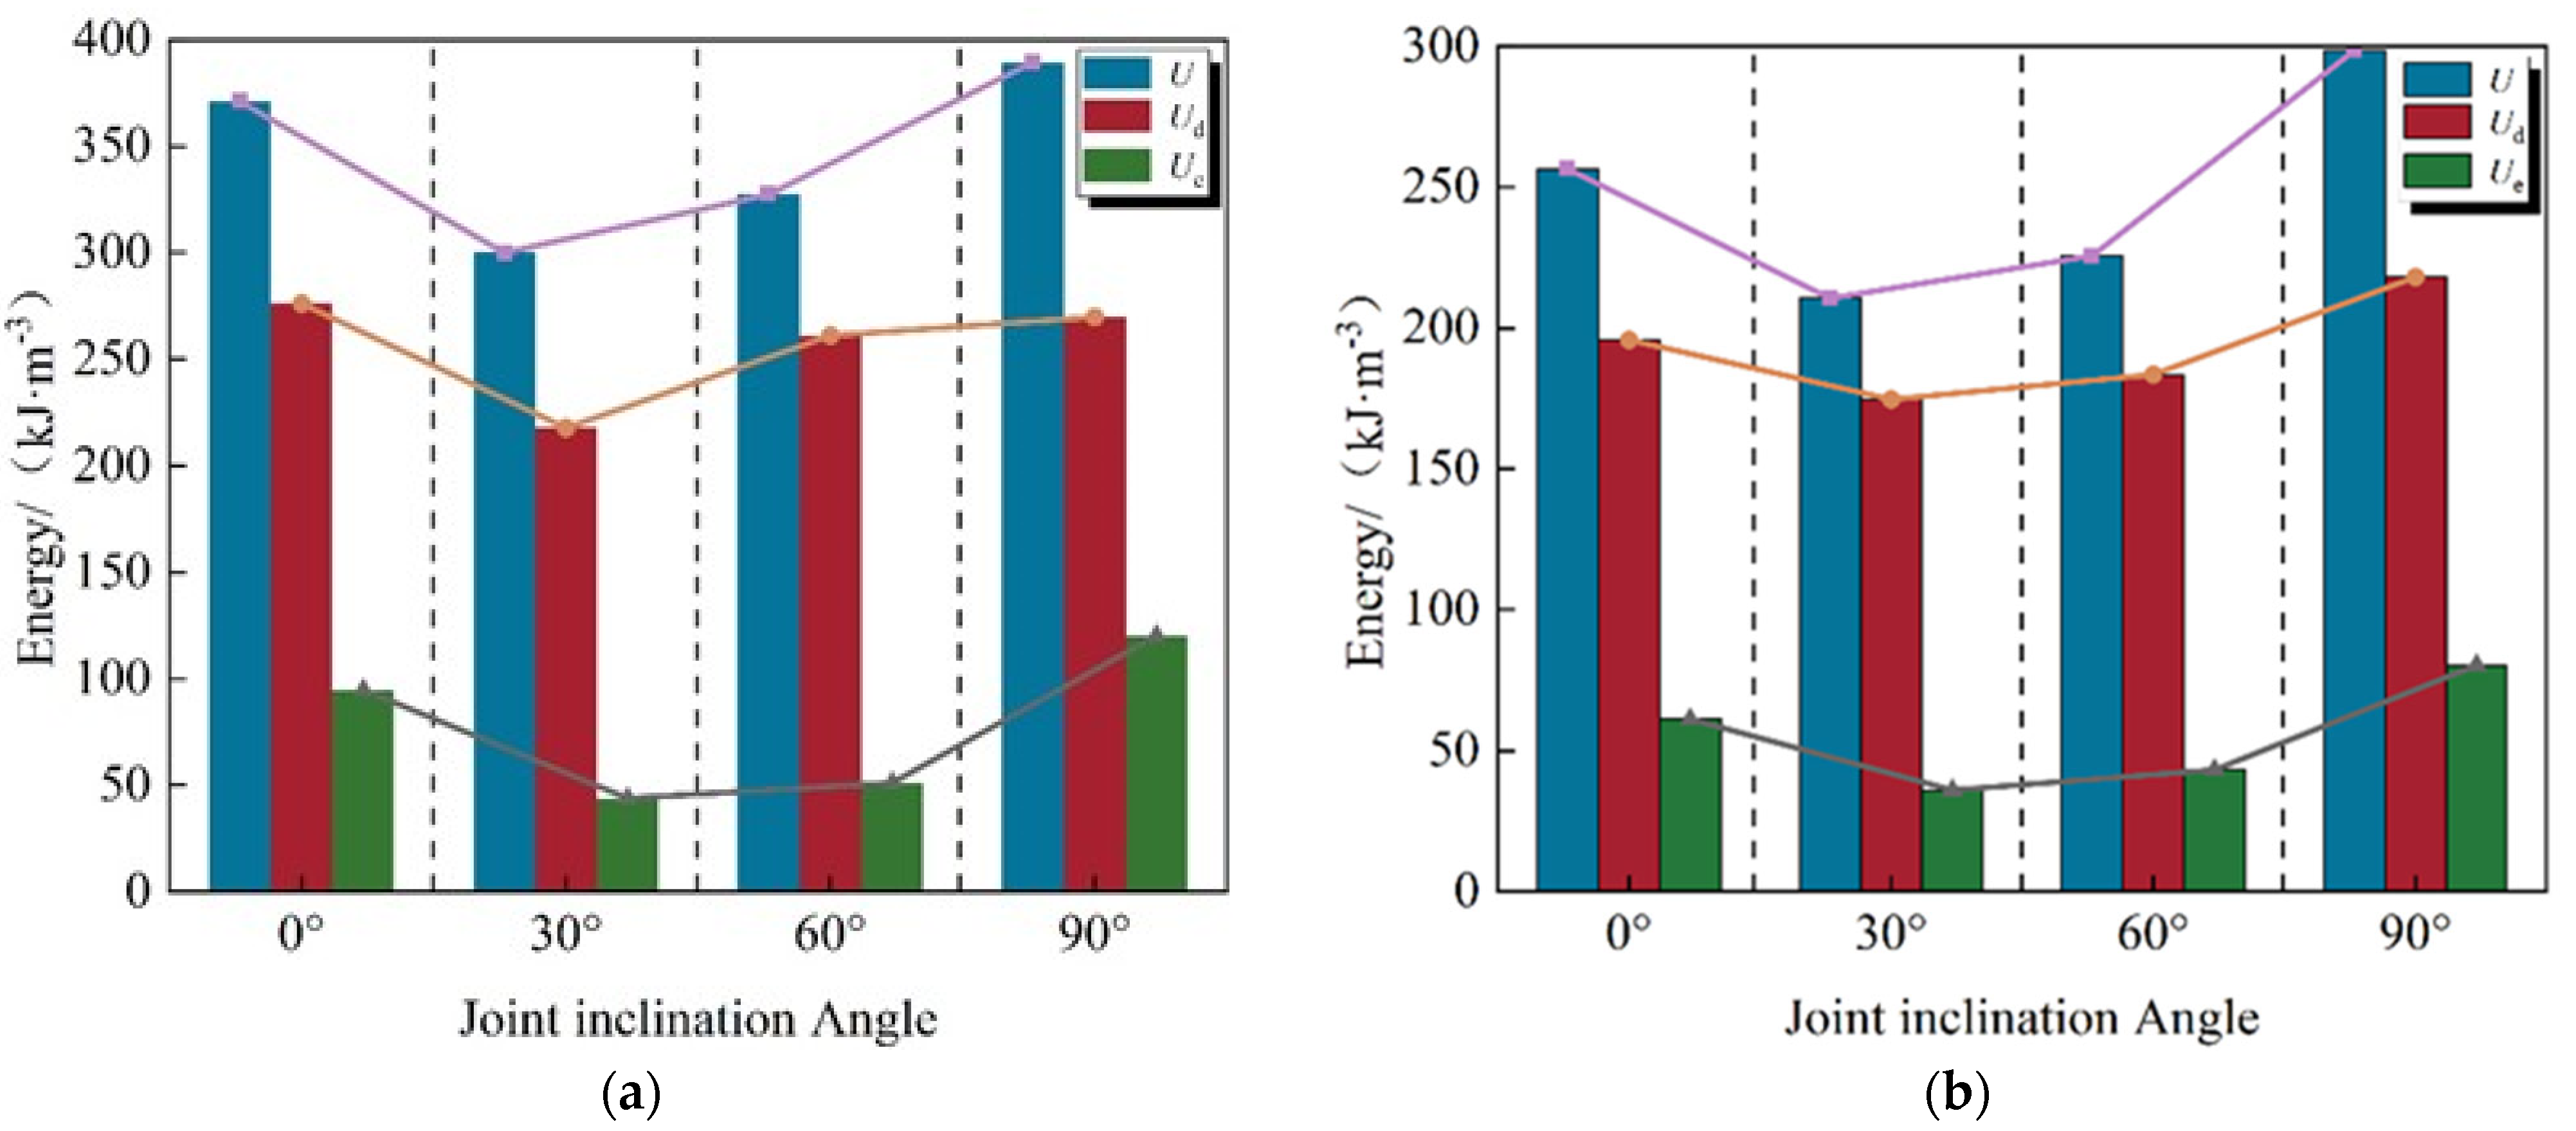
Figure 11a presents the variation in sample energy during a conventional triaxial compression test, conducted under a confining pressure of 2 MPa and varying inclinations.
It can be observed from the figure that under the conventional triaxial compression path, as the joint inclination angle increases from 0° to 90°, the total energy, elastic strain energy, and dissipated energy of the specimen exhibit a “V” shape, initially decreasing and then increasing. For example, with a 2 MPa confining pressure, the 0° inclined sample exhibits significant energy dissipation due to rock bridge shear failure, with a total energy of 370.89 kJ/m3. At a 30° inclination, sliding along the joints becomes the dominant failure mode, with low frictional energy dissipation efficiency, causing the total energy to drop to a minimum of 300.00 kJ/m3. The 60° inclined sample, with confining pressure suppressing joint slip, partially redirects energy to rock mass fracture dissipation, causing the total energy to rebound to 327.37 kJ/m3. At a 90° inclination, the vertical joints, coupled with the principal stress direction, cause shear in the high-stress rock mass, and the total energy rises to 389.43 kJ/m3. The energy dissipation data for specimens at various inclinations clearly reveal differences in failure difficulty. The energy dissipation for the 0°, 30°, and 60° samples decreased by 1.36%, 19.26%, and 6.93%, respectively, based on the 90° sample. The 30° specimens exhibited the most significant reduction (nearly 1/5 less than the 90° specimens), directly confirming the mechanical mechanism wherein 30° inclination angle specimens are most prone to failure due to the priority occurrence of low-resistance joint slip under the same confining pressure.
Figure 11b presents the variation in sample energy during an axial pressure increase and confining pressure relief test, conducted under a confining pressure of 2 MPa and varying inclinations [
40].
It can be observed from the figure that the trend of specimens with different inclinations under the unloading path mirrors that under the conventional triaxial stress path. The total energy, elastic strain energy, and dissipated energy of the specimens all exhibit a “V” shape, initially decreasing and then increasing with increasing joint inclinations. For the same joint inclination angle and confining pressure, the energy under the conventional triaxial compression test is greater than that under the axial pressure increase and confining pressure relief test. The total energy of specimens with inclination angles of 0°, 30°, 60°, and 90° under the unloading path were 256.51 kJ/m3, 210.62 kJ/m3, 225.71 kJ/m3, and 298.54 kJ/m3, respectively. Compared with conventional triaxial compression, the total energy of the four inclination angle joints decreased by 30.84%, 29.79%, 31.05%, and 23.34%, respectively, with an average reduction of 28.76%. This systematic attenuation results from the constraint-weakening effect of the unloading stress path. The relief of confining pressure leads to insufficient lateral support, causing the rock mass to compress and deform towards the open surface, accelerating joint opening and fracture expansion, thereby making the rock mass more prone to instability and collapse. This mechanism directly explains the collapse disaster caused by the sudden decrease in rock mass energy during tunnel excavation.
5. Damage Evolution of Double-Jointed Specimens Based on Energy Dissipation
5.1. Damage Constitutive Model
There are two paths for defining damage variables: microscopic (geometric parameters of micro-defects) and macroscopic (physical response parameters) [
41]. However, the microscopic definition is difficult to put into practical use due to the limitations of observation techniques. Therefore, this study defines the damage variables of joint/joint rock masses from a macroscopic perspective based on the principle of energy equivalence. The theoretical basis lies in that the essence of damage evolution is an irreversible deterioration process driven by energy—the work performed by external loads is converted into dissipated energy, driving the initiation, propagation, and penetration of microcracks within the material. Drawing on the research of many scholars, the damage variable
can be defined as the ratio of cumulative dissipated energy-to-the theoretical limit of total dissipated energy, that is:
In the formula, is the cumulative dissipated energy of the jointed rock mass at time ; is the theoretical limit of the total dissipated energy of the jointed rock mass.
Based on the residual strength characteristics of the stress/strain curve of the jointed rock mass (post-peak stress not reset to zero), it indicates that the damage evolution has not reached the state of complete failure, and the definition of the damage variable needs to be revised. The damage critical value is introduced to characterize the actual failure threshold, and the modified formula is:
In the formula, is the damage critical value.
According to existing scholars’ research [
42], the value of the damage critical value
is:
In the formula, is residual strength; is the peak strength.
Substitute Equation (10) into Equation (9), and the damage variable is:
Based on the theory [
43] of damage mechanics, the stress/strain constitutive relationship of the jointed rock mass considering damage evolution under triaxial compression can be expressed as:
Substituting Equation (11) into Equation (12), the damage constitutive models of jointed rock masses with different inclinations under triaxial compression are:
5.2. Verification of the Damage Constitutive Model
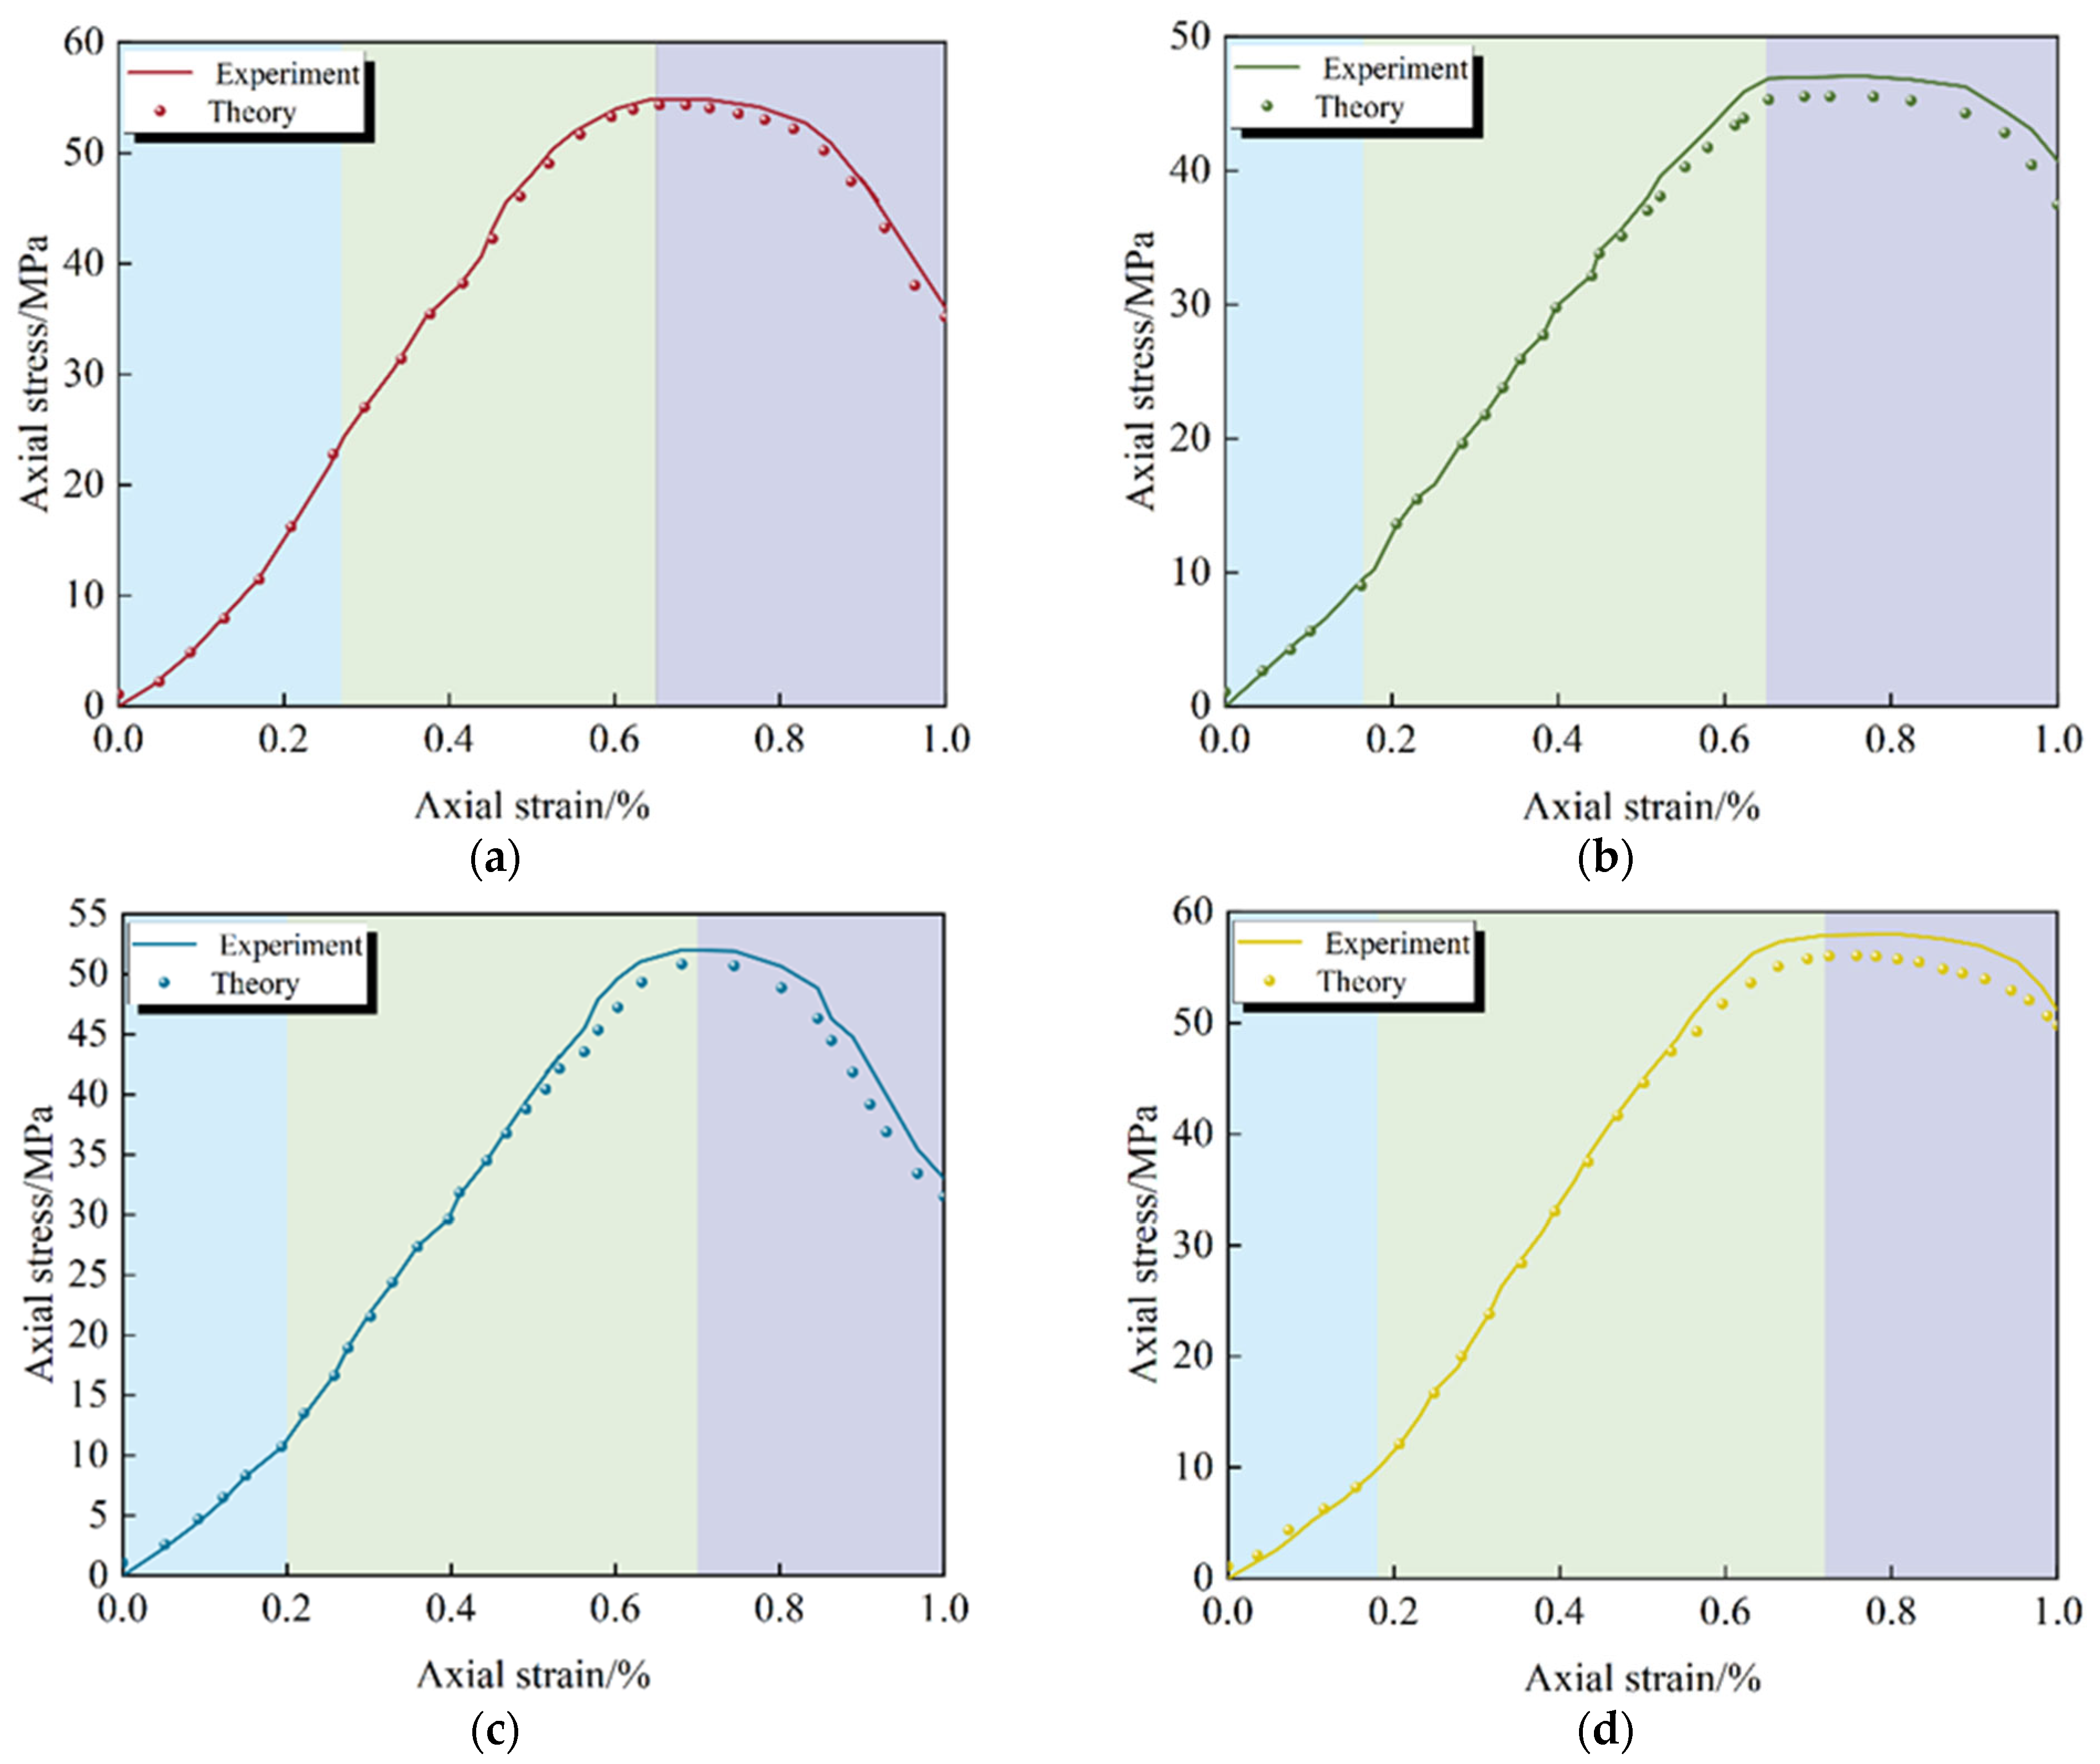
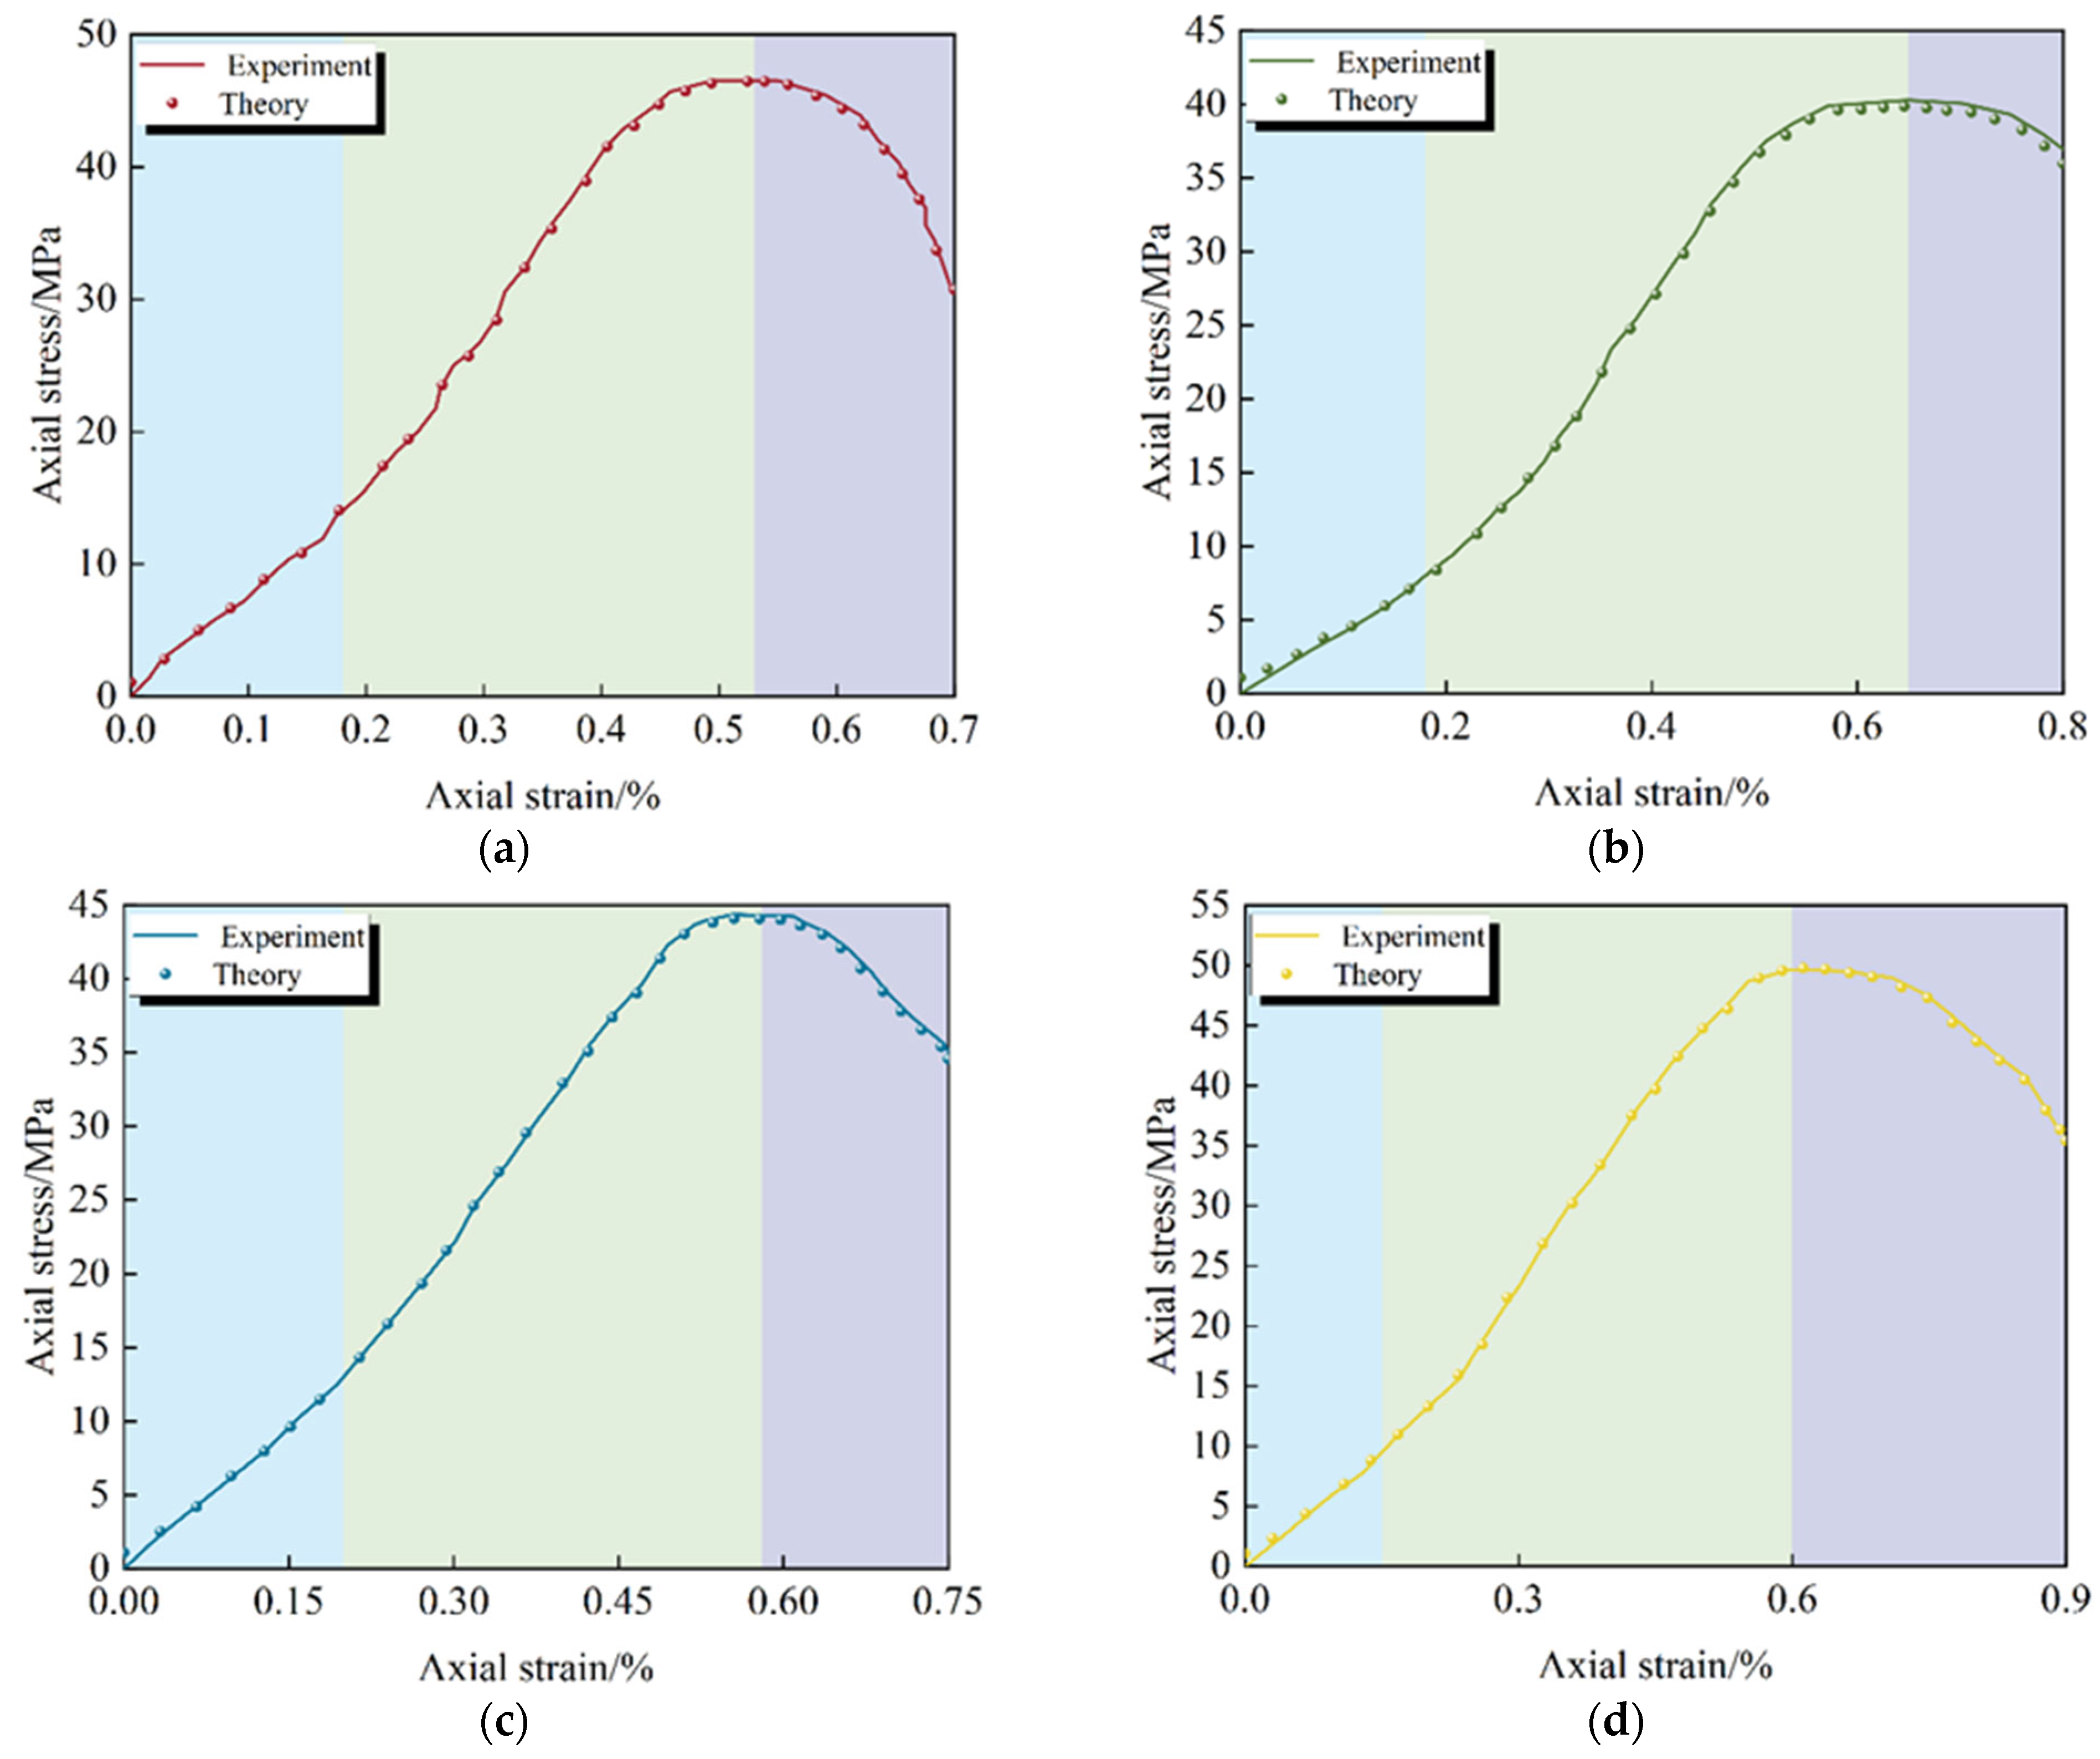
To verify the rationality of the constitutive model of rock mass damage at different inclinations (Equation (13)), the theoretical axial stress/strain curves of the specimens at different inclinations under two stress paths (conventional triaxial compression and increased axial compression to relieve confining pressure) were plotted based on the theoretical calculation values of the model and compared with the corresponding test curves, as shown in
Figure 12 and
Figure 13.
The comparison and verification of
Figure 12 and
Figure 13 show the theoretical curves of the damage constitutive model [
44]. The two types of curves showed significant goodness of fit in the elastic phase and relatively good coincidence in the post-peak phase. It fully demonstrates that the model can reliably characterize the damage mechanics behavior of jointed rock under triaxial compression.
5.3. Damage Evolution Laws
The damage evolution equations for specimens with different inclination angles, constructed based on the damage constitutive model, provide a foundation for systematically analyzing the damage evolution mechanism [
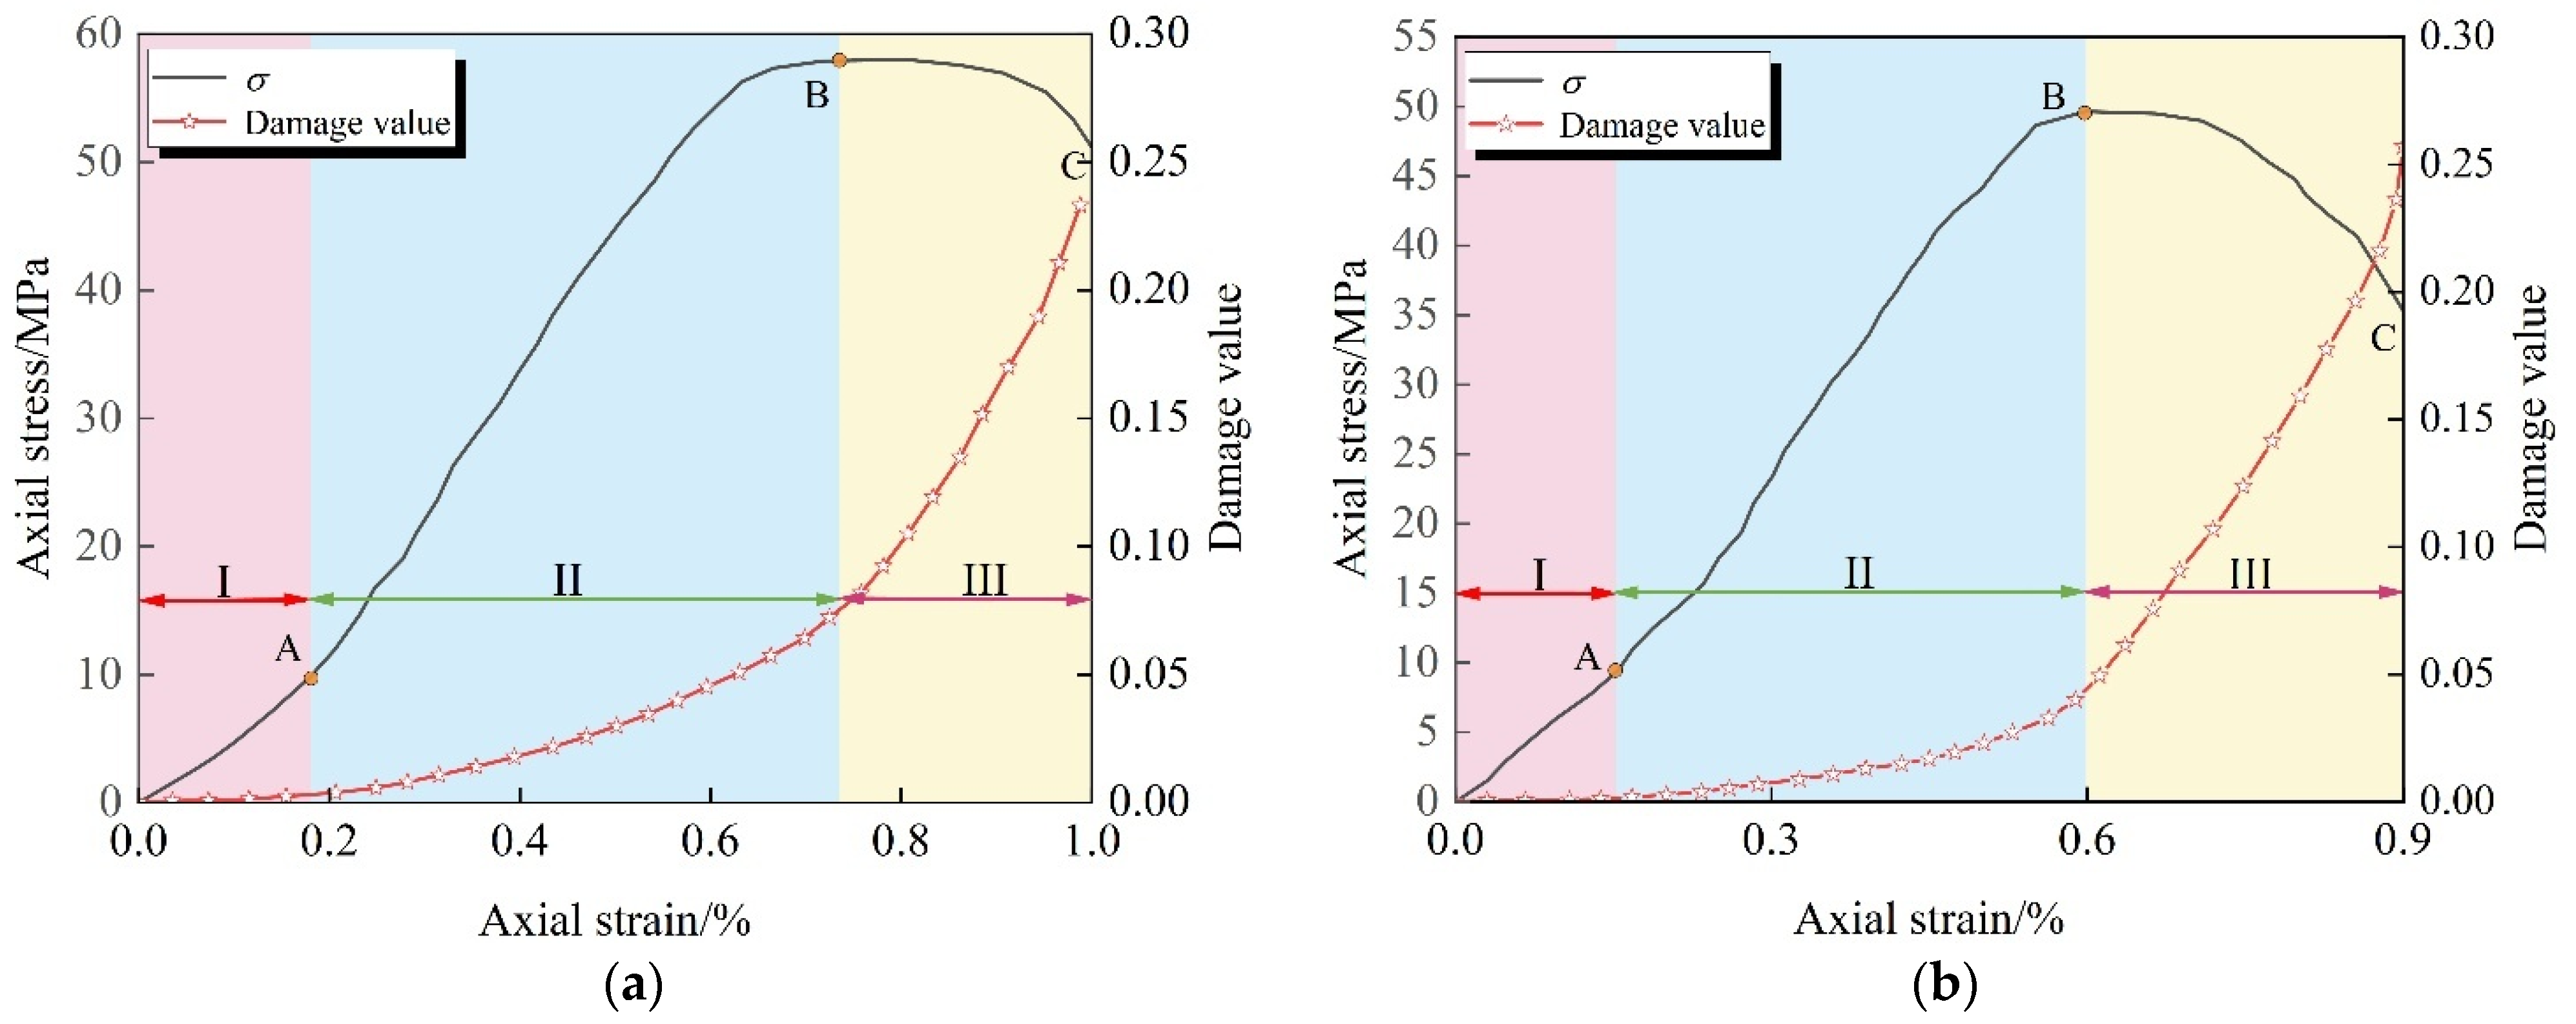
45] of jointed rock masses. Taking the responses of specimens with a 90° inclination angle under both conventional and unloading paths as an example (
Figure 14), and combined with the three-stage characteristics of the axial stress/strain curve—the linear elastic stage (OA), the plastic yield stage (AB), and the post-peak failure stage (BC)—the damage evolution process is divided into three stages: the initial damage stage (I), the damage development stage (II), and the damage accelerated growth stage (III) for analysis.
(1) Linear elastic stage (I): In the linear elastic stage, almost all of the energy absorbed by the jointed rock mass is converted into elastic strain energy for storage, with dissipated energy being negligible. At this point, aside from the elastic closure of the primary micro-defect, no new damage is generated, and the damage variable approaches zero.
(2) Damage development stage (II): When the axial stress/strain enters the plastic yield stage, the directional propagation of internal cracks in the jointed rock mass causes irreversible plastic deformation, and the dissipated energy increases significantly, driving the damage variable to accumulate nonlinearly and at a slow rate. During this stage, the rate of damage evolution remains at a moderate to low level, reflecting the progressive damage characteristics of stable crack propagation.
(3) Damage acceleration growth stage (III): Upon entering the post-peak failure stage, the internal crack network of the rock mass penetrates, causing macroscopic fractures, with surface fissures expanding at an accelerated rate. The dissipated energy is released sharply, driving the damage variable to grow exponentially. During this stage, the axial stress/strain curve exhibits strain softening characteristics (ductile response), while the slope of the damage evolution curve continues to increase, reflecting the critical state of damage instability and expansion.
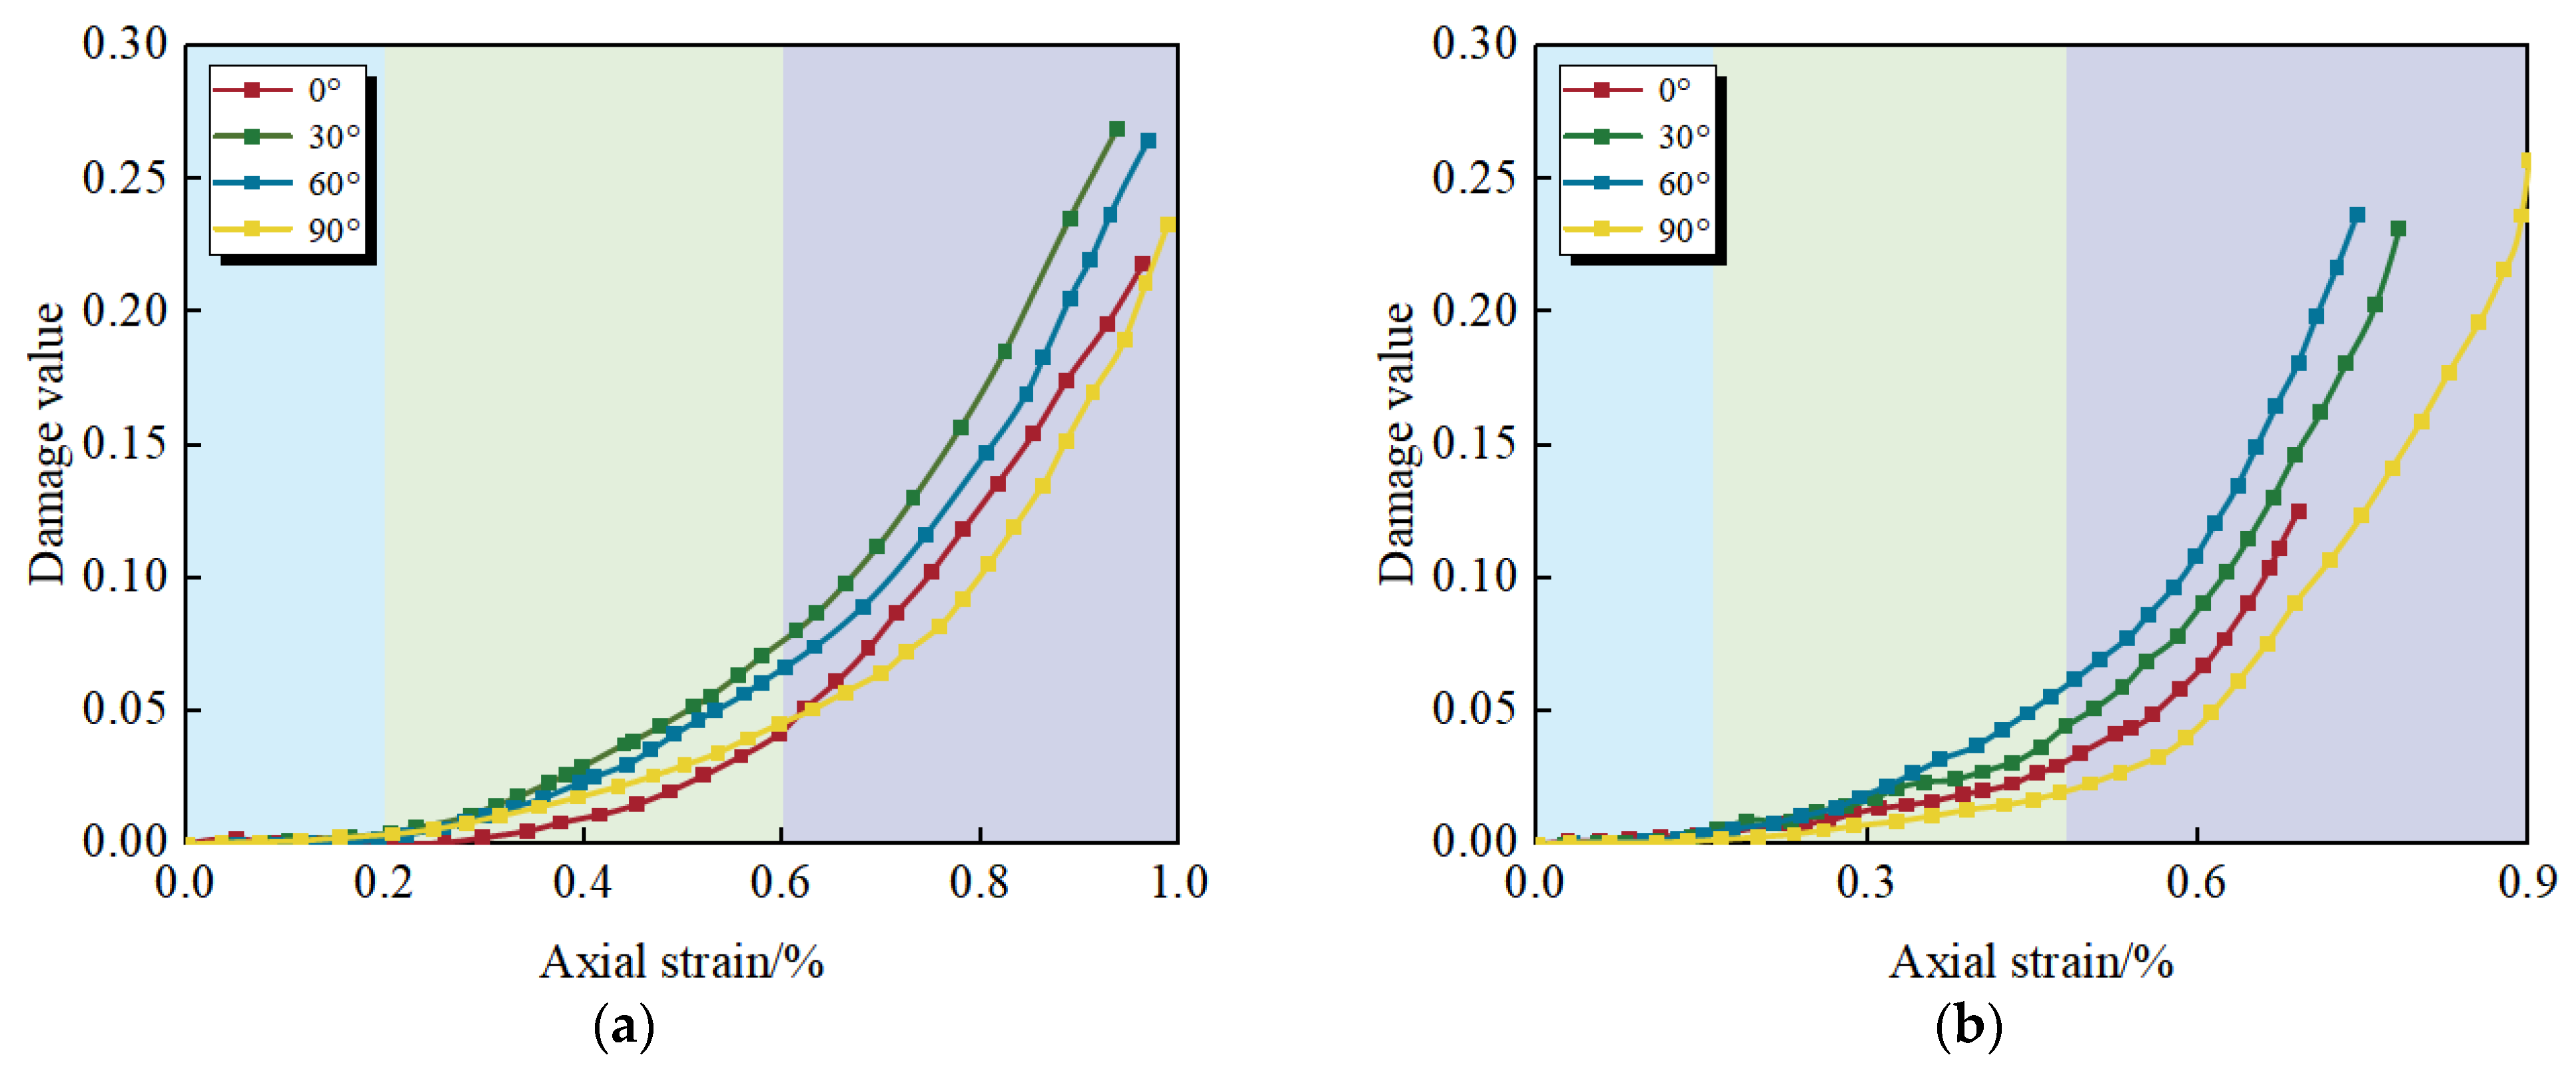
Figure 15 illustrates the damage evolution curves of jointed specimens with varying inclinations under triaxial compression along two stress paths. The figures reveal that the damage evolution trends of the specimens with varying joint inclinations in
Figure 15a,b under triaxial compression exhibit similar patterns, and the damage evolution curves of the jointed rock mass increase nonlinearly with strain. Overall, the damage values of the jointed rock mass under triaxial compression exhibit a power function relationship with axial strain.
Under both conventional triaxial compression and unloading stress paths, the damage evolution of the 30° and 60° inclinations consistently showed a higher development level—the accumulation degree of damage variables and the rate of damage evolution were significantly greater than those of the 0° and 90° inclinations. This difference arises from the synergy between joint orientation and the stress field. The 30° specimens, as the joint plane aligns closely with the direction of maximum shear stress, preferentially trigger low-resistance slip damage along the joint plane. The 60° specimens accelerate the shear fracture process in the rock bridge region through the strong stress concentration effect at the joint ends. The 0° and 90° specimens, due to the failure mode requiring the fracture to cross the intact rock mass, exhibited stronger resistance in damage evolution, further confirming the dominant role of joint inclination in damage development. When the joint inclinations were identical, the accumulation of damage under the conventional triaxial compression path significantly exceeded that under the unloading path.
6. Conclusions and Prospects
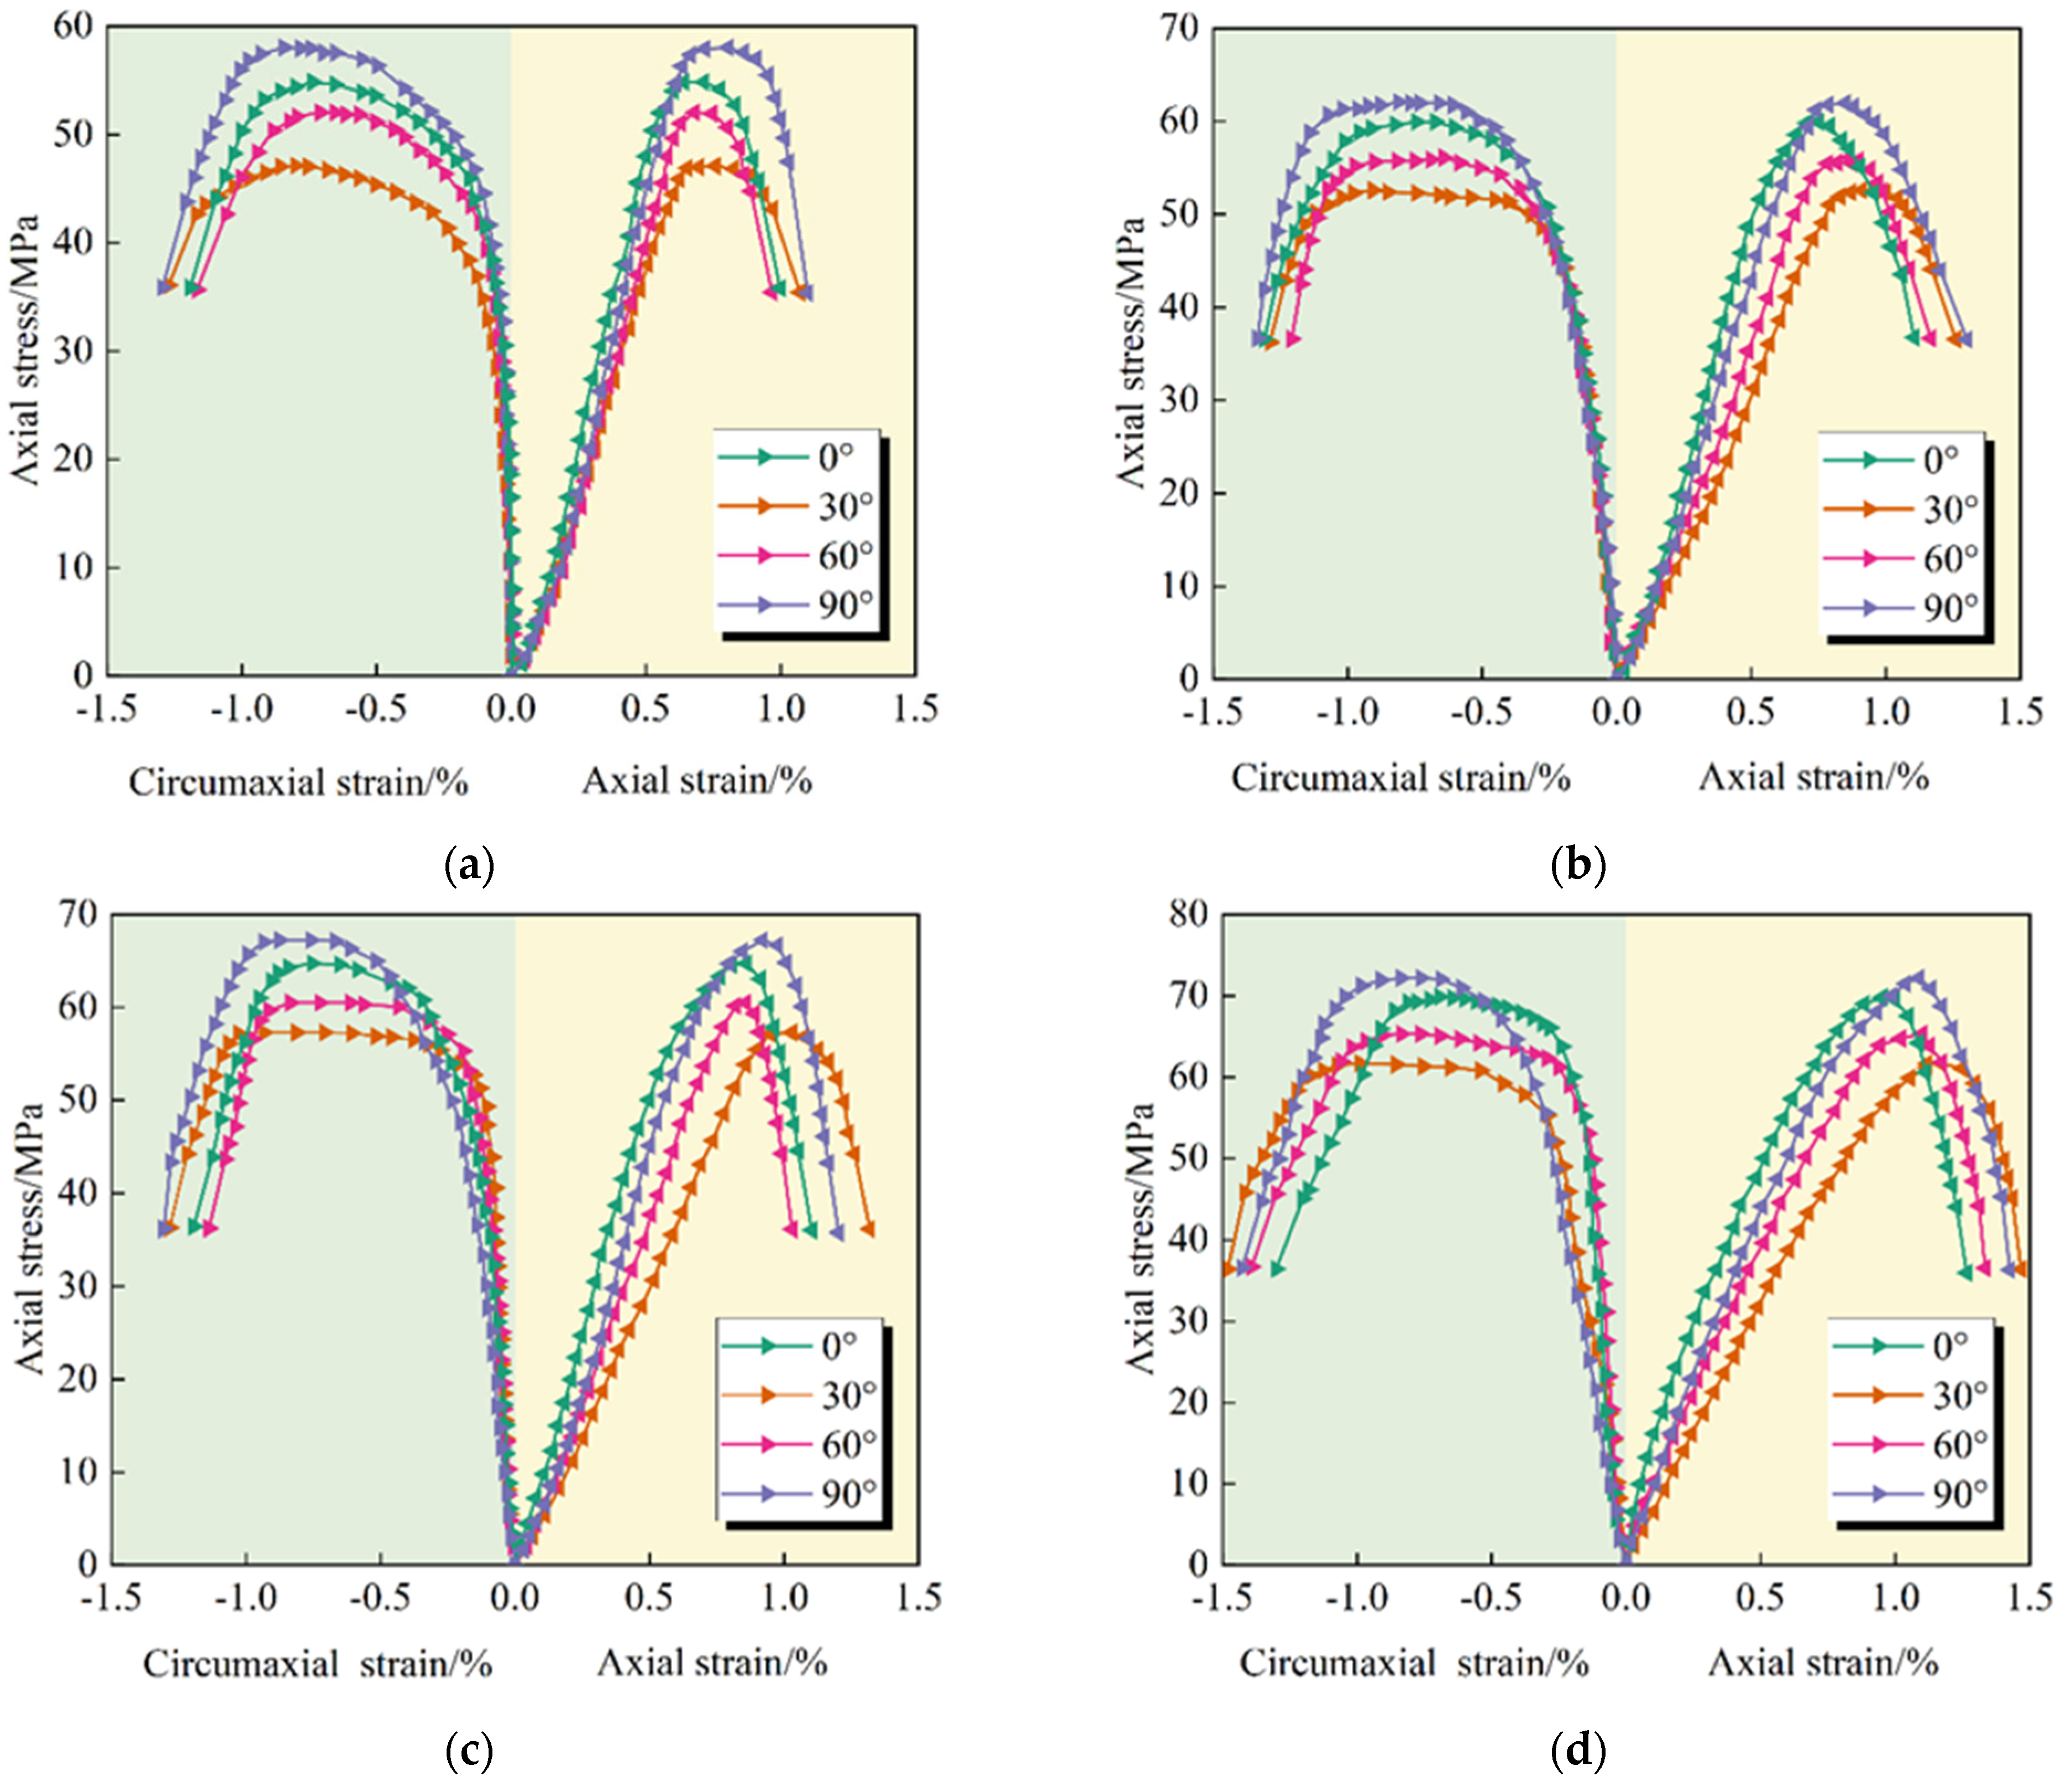
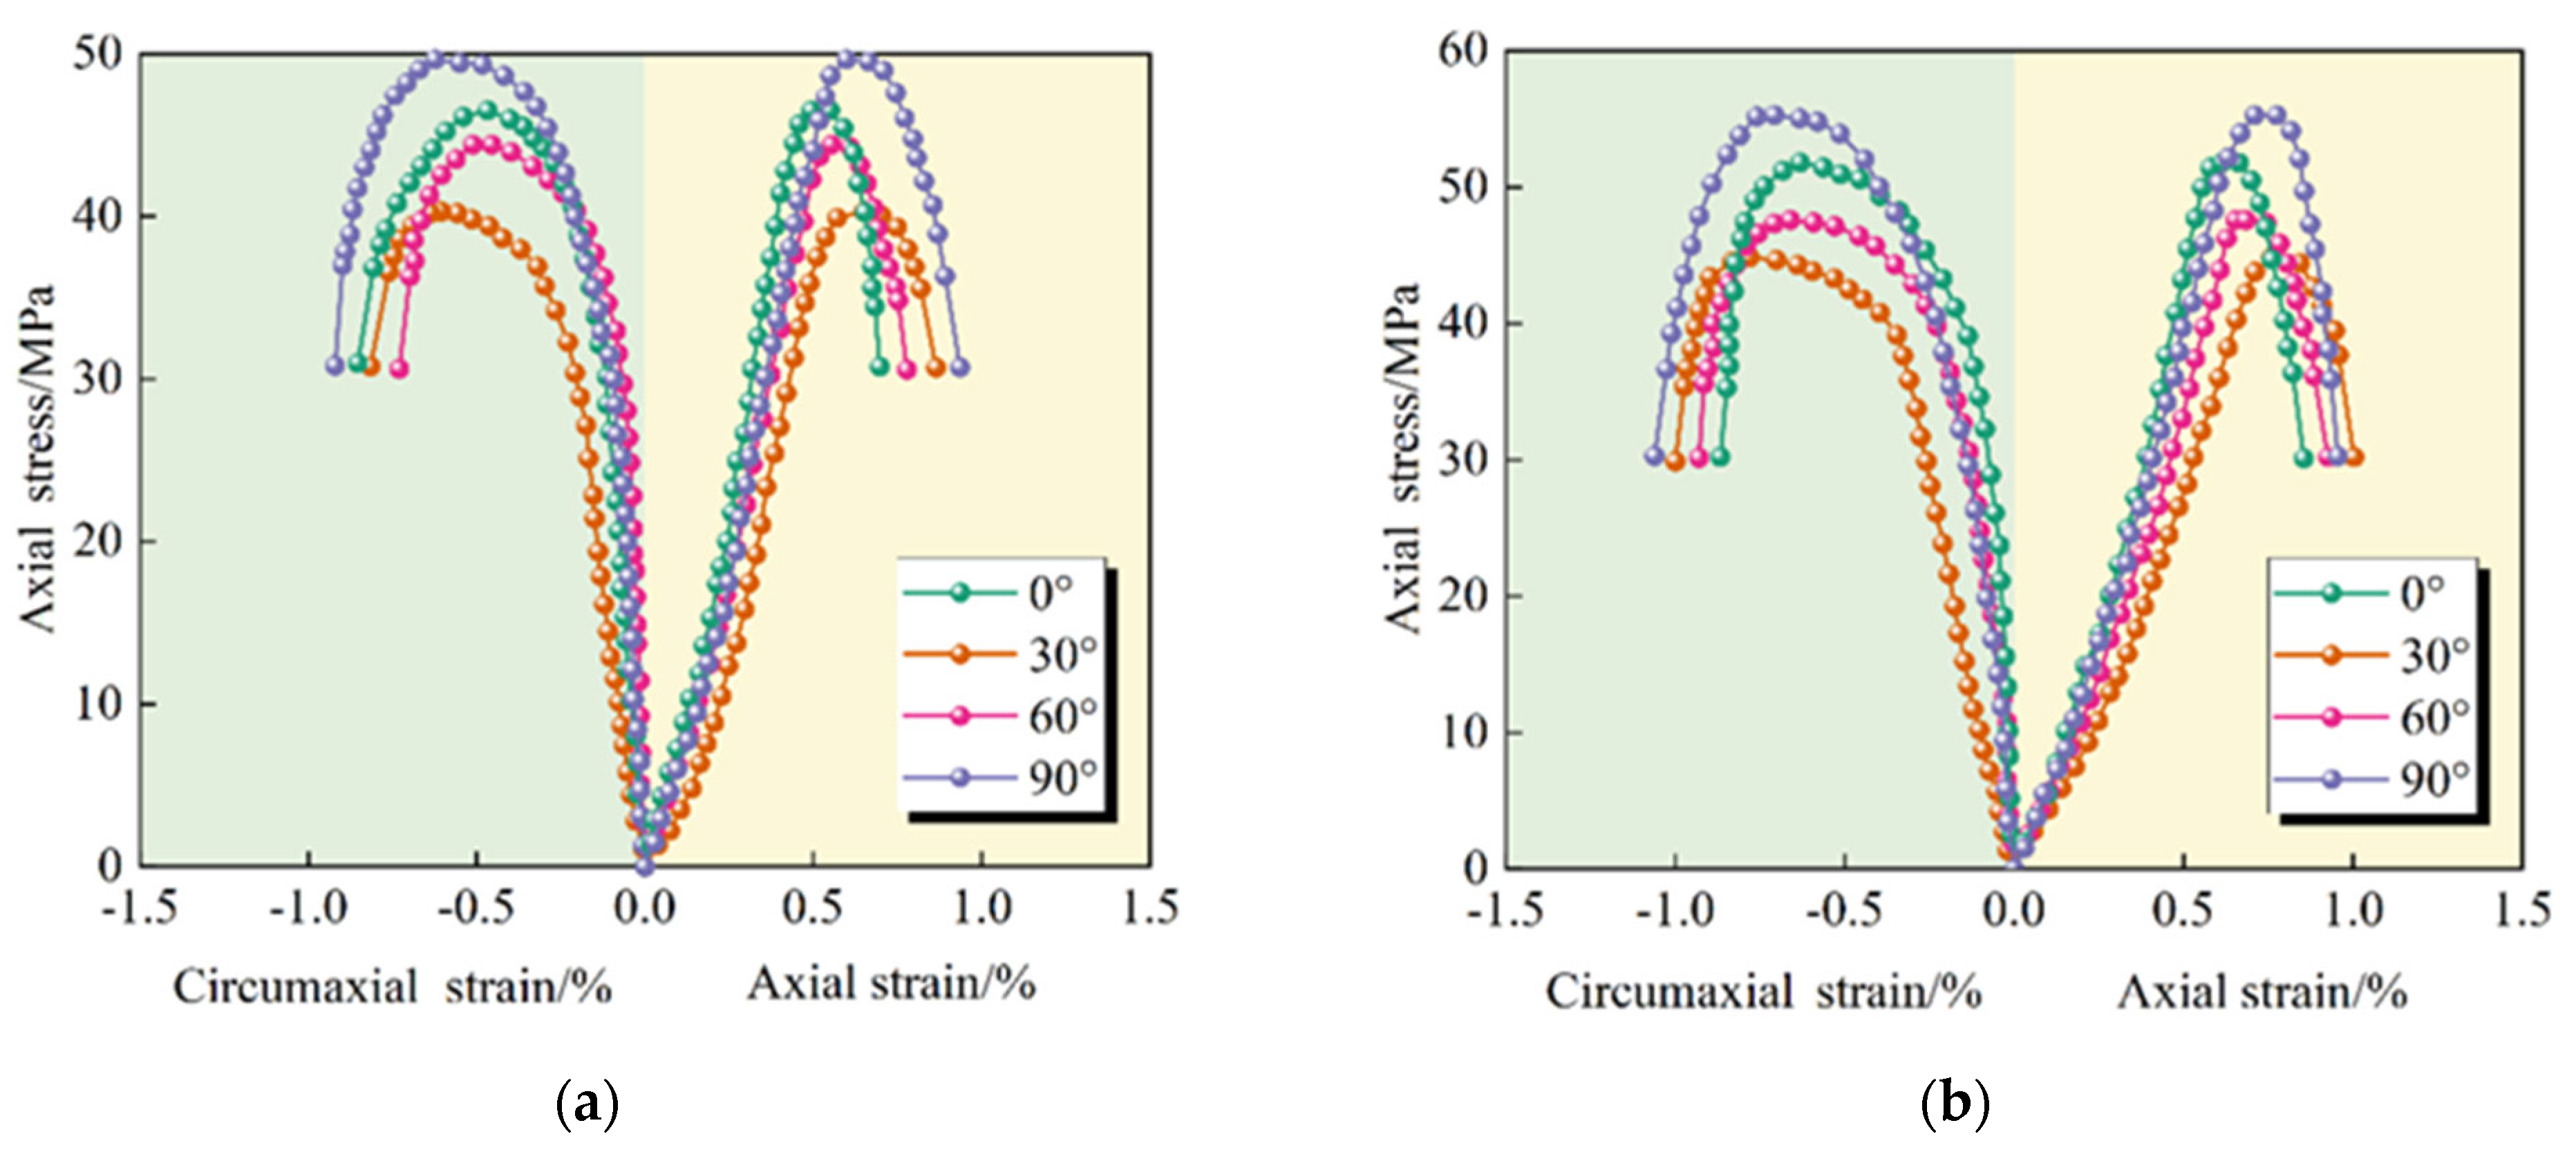
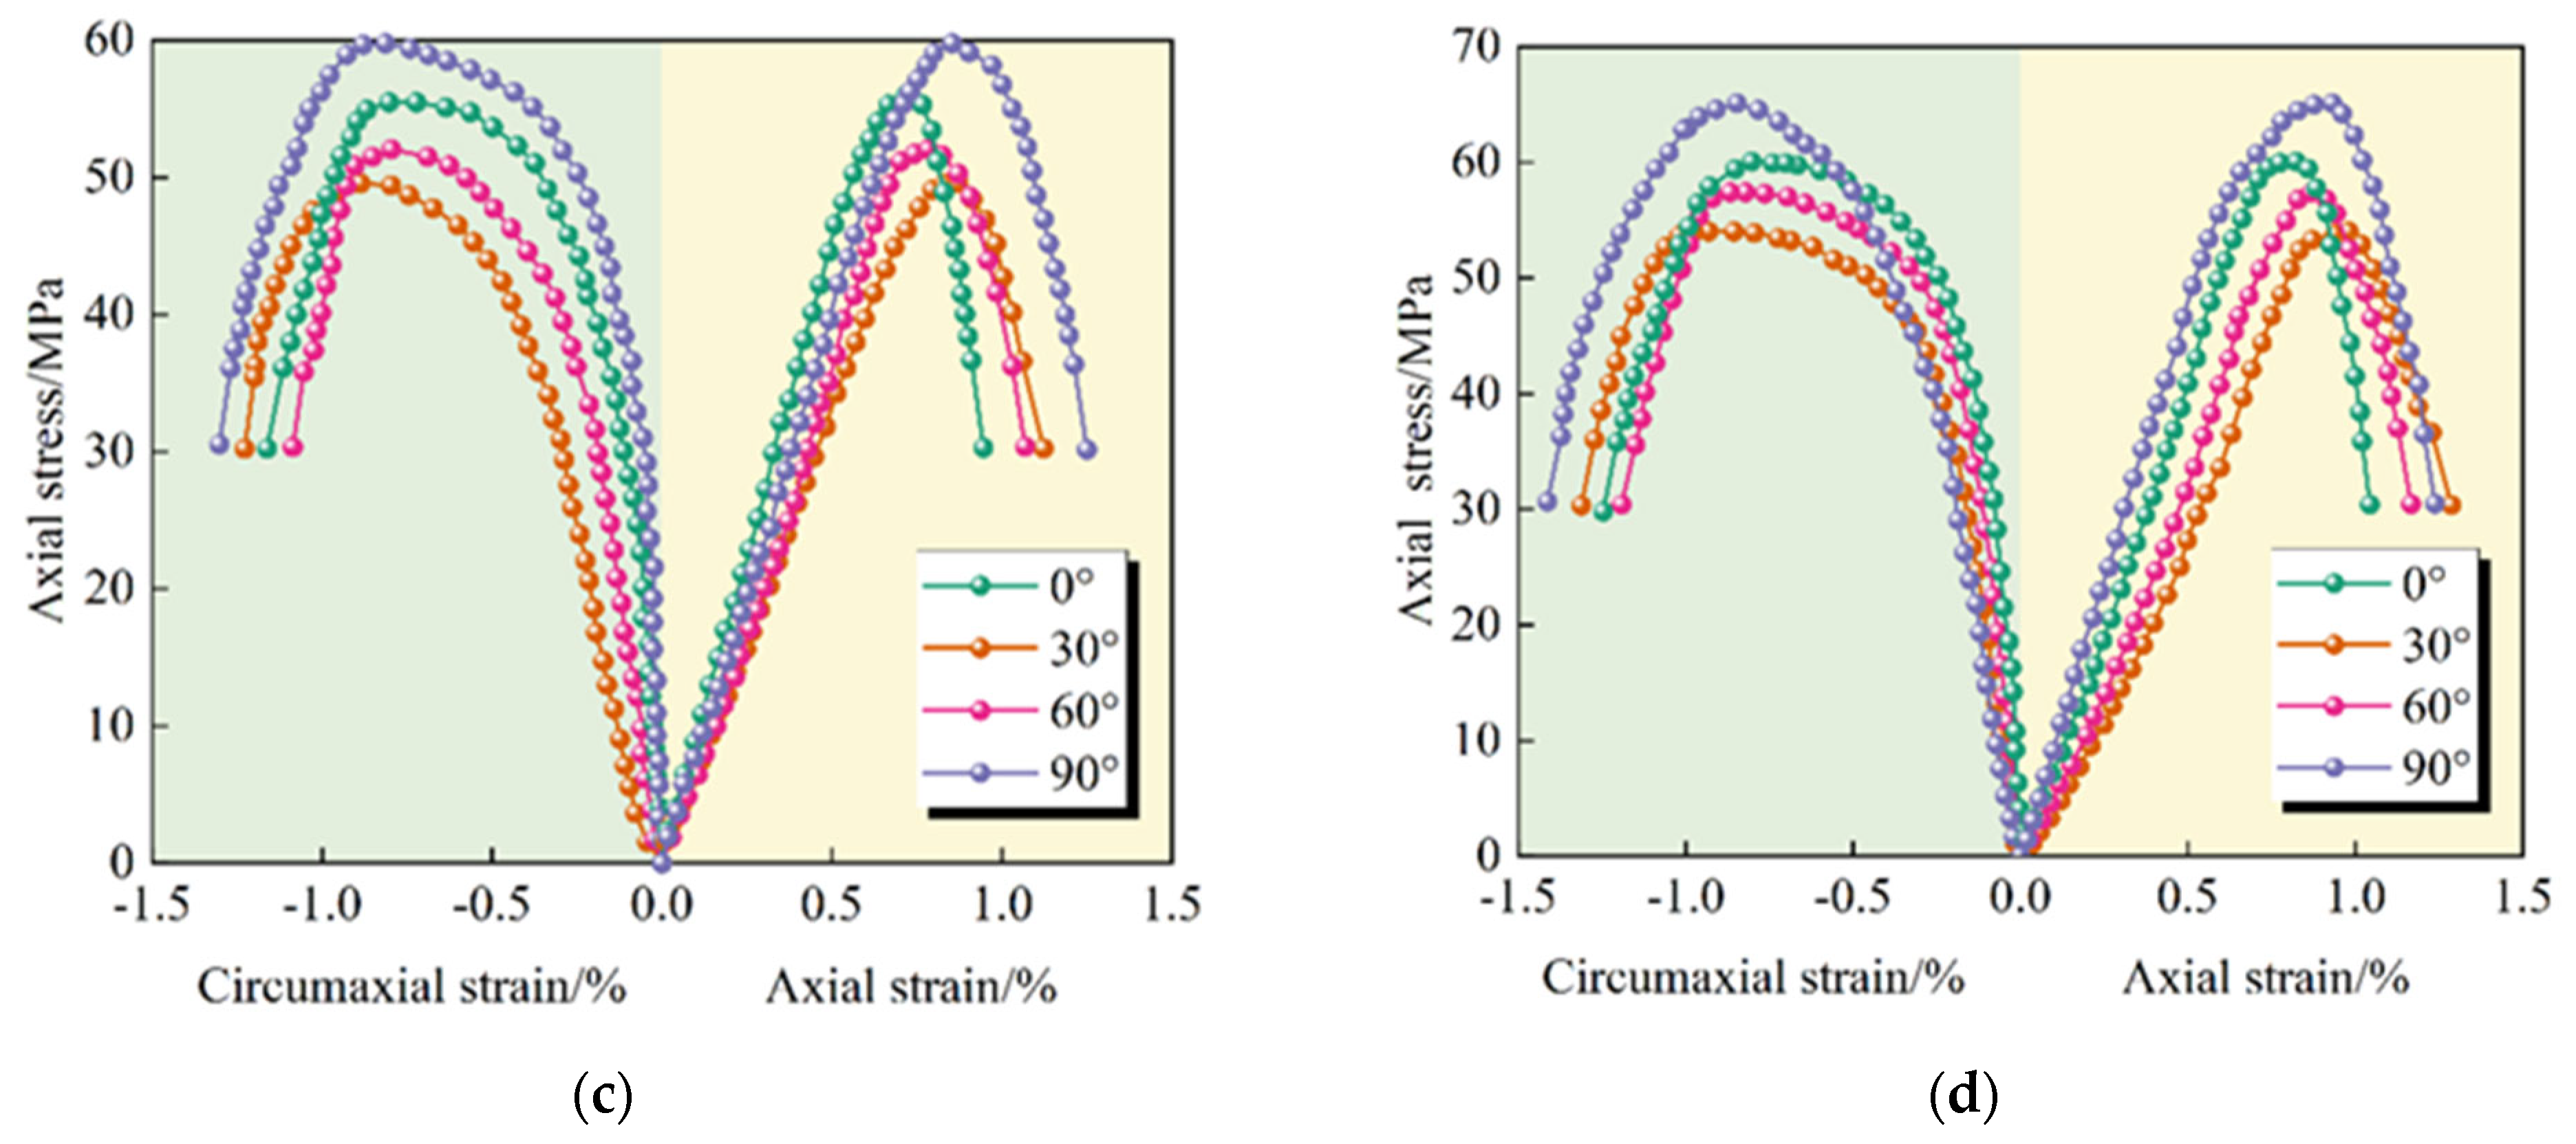
(1) The stress/strain curves of the four jointed rock masses with different inclination angles under two stress paths all present typical characteristics. With the increase in the inclination angle, the peak intensity shows a “V”-shaped variation trend of first decreasing and then increasing. Meanwhile, the stress path also has a certain influence on the peak strength, which is specifically manifested as a decrease in the peak strength of the joint specimen under unloading.
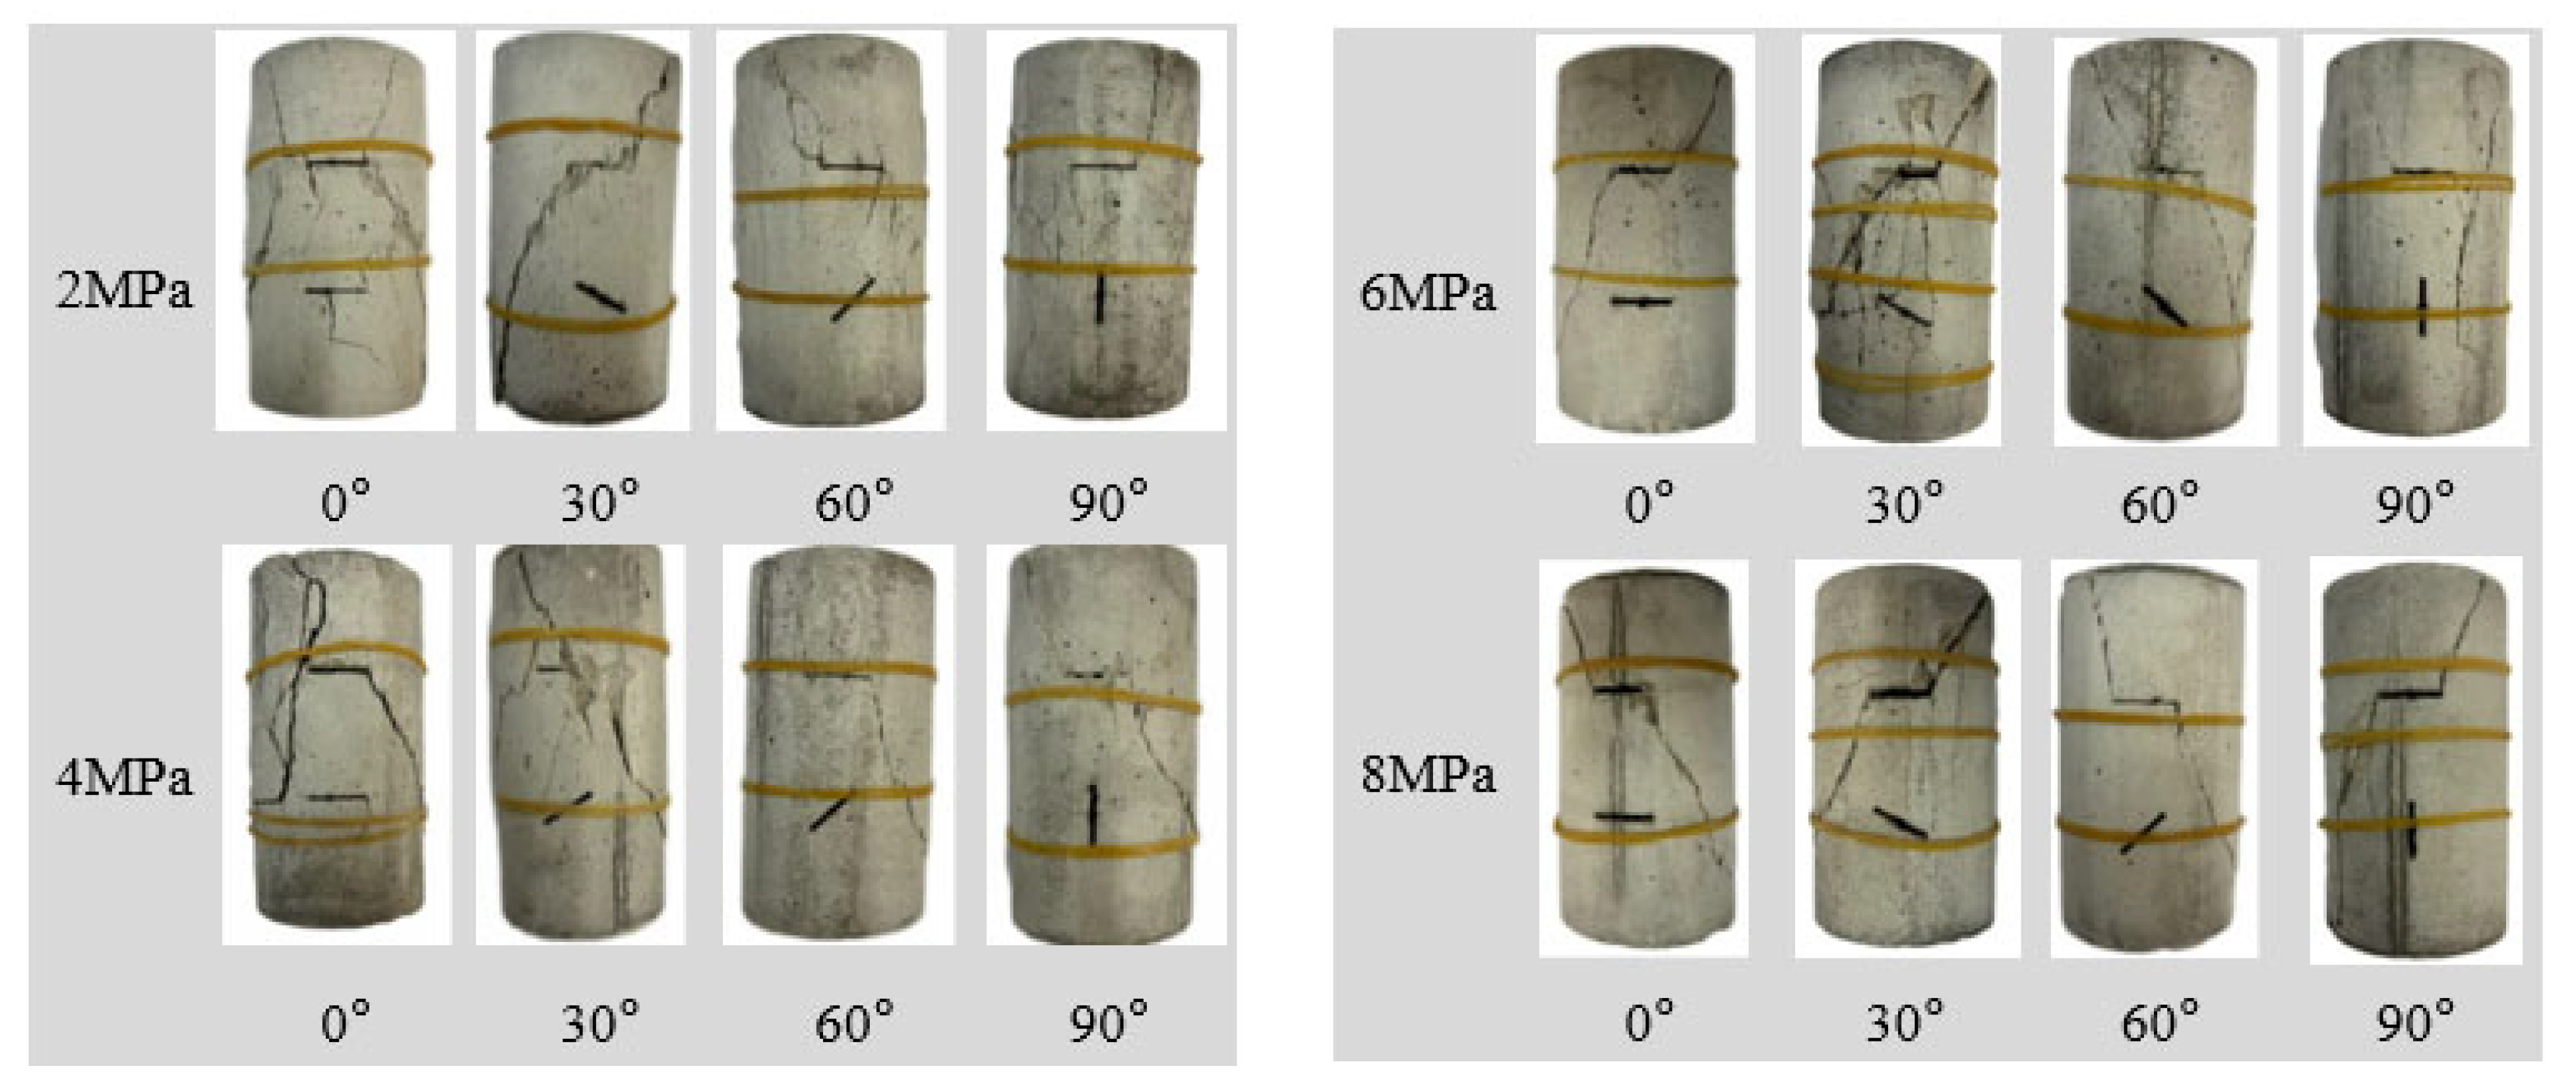
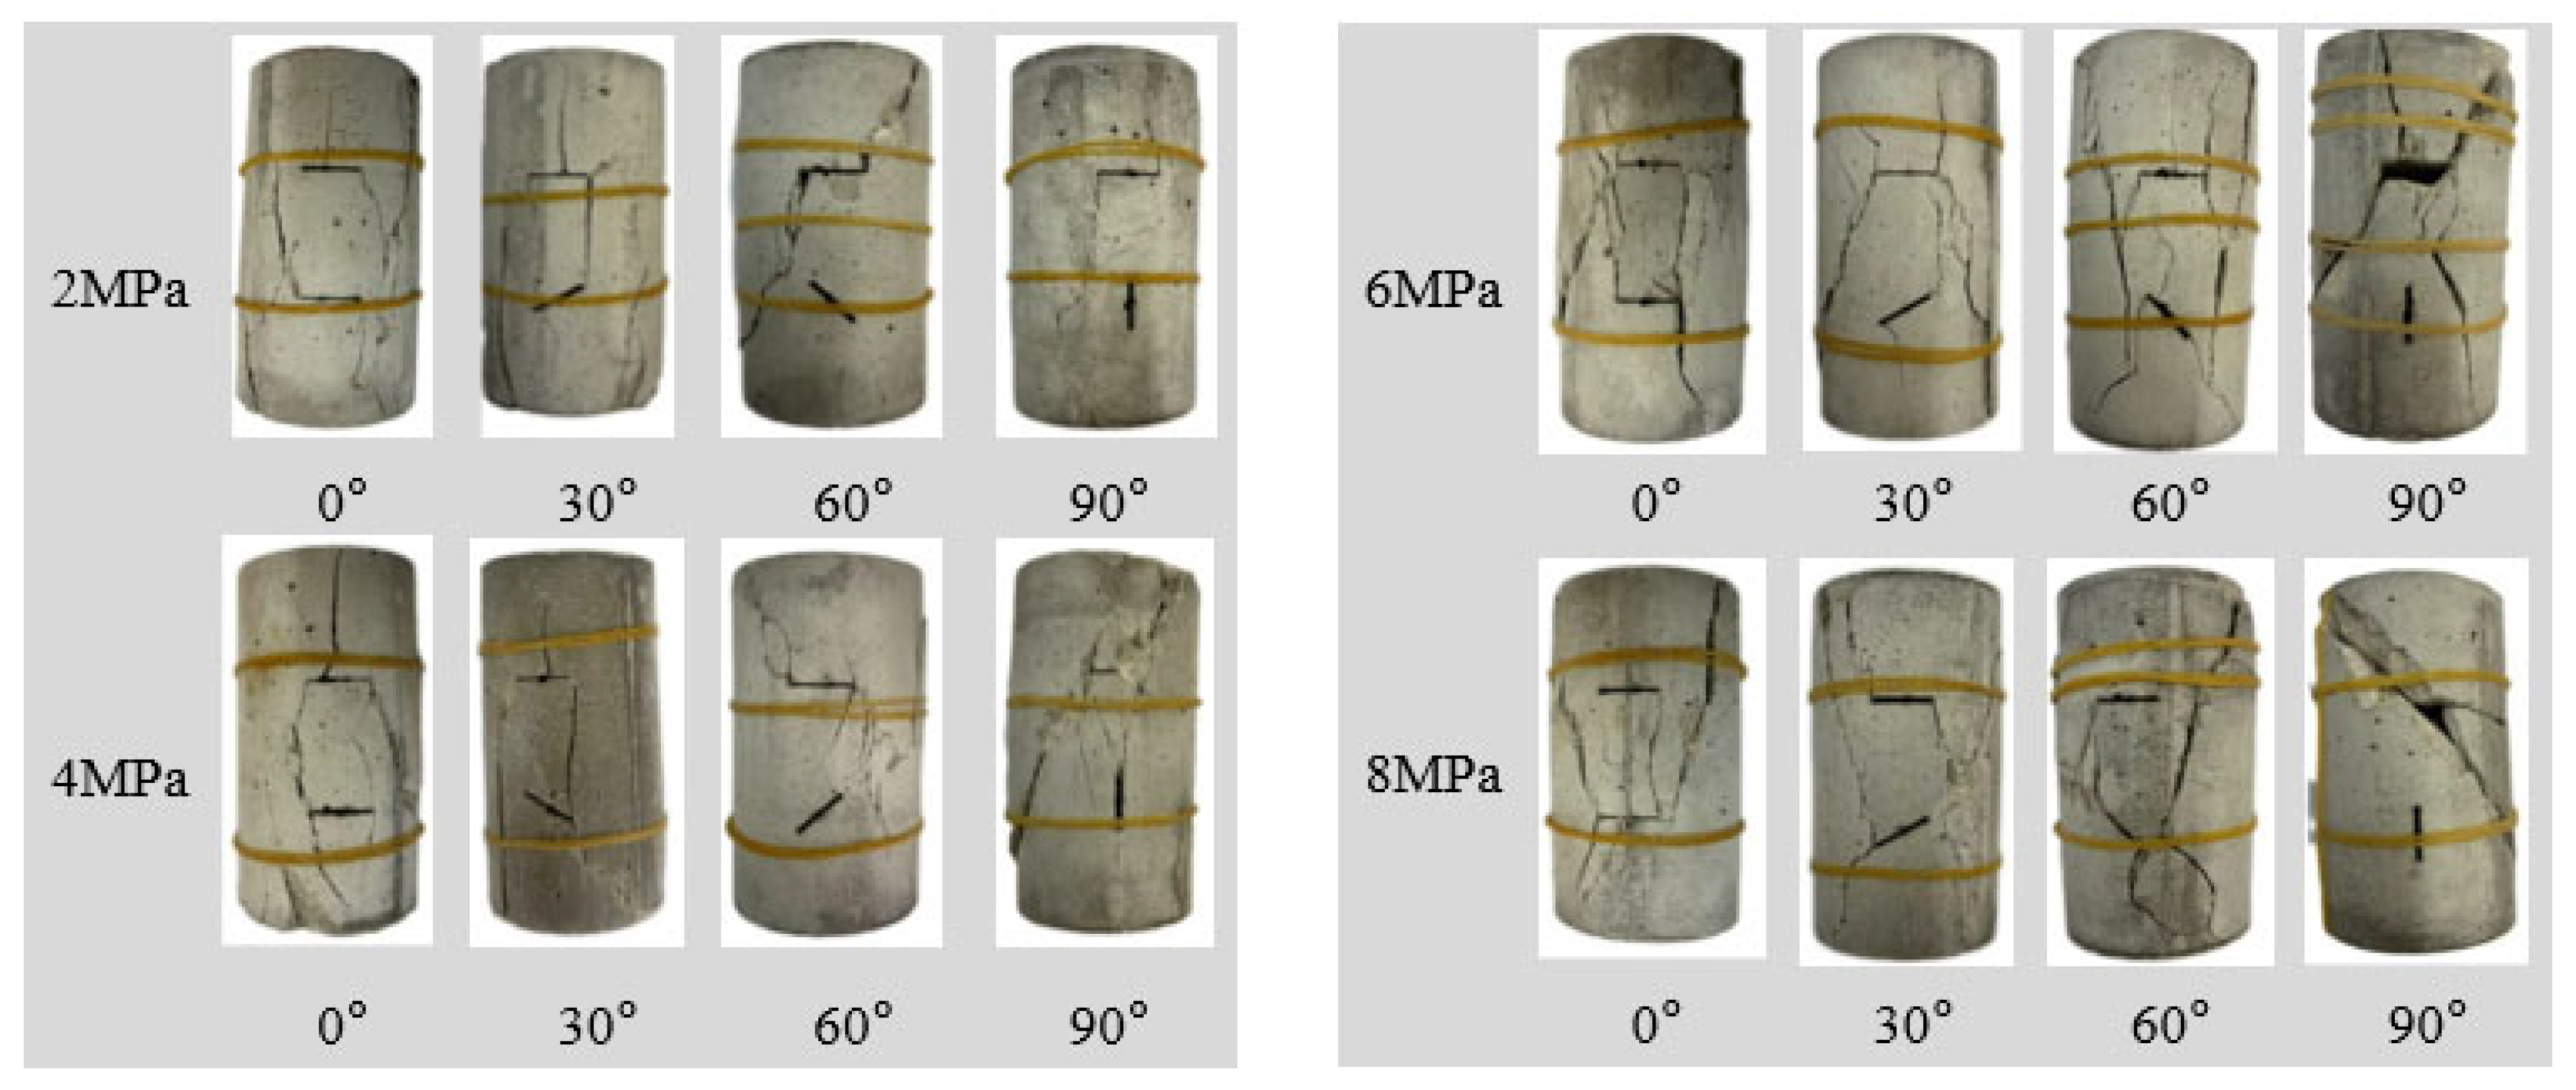
(2) Under conventional triaxial compression, the specimen shows progressive compression/shear failure, with significant sliding of the joint surface and crack penetration. Confining pressure inhibits crack propagation. Under the path of increasing axial pressure and releasing confining pressure, sudden tension/shear composite failure occurs. The decrease in confining pressure promotes the formation of tensile fracture networks, and the release of energy under high confining pressure intensifies brittle failure.
(3) Under the condition of the same confining pressure, with the increase in the joint inclination angle, both the dissipated energy and the total energy in the two tests showed a trend of first decreasing and then increasing. When the joint inclination angles are the same, under the same confining pressure, the energy value in the conventional triaxial compression test is higher than that in the unloading test.
(4) A constitutive model of joint rock mass damage was established based on energy dissipation, which can effectively describe the deformation and failure process under triaxial compression. In terms of the change in damage values, with the increase in the joint inclination angle, the damage values of the jointed rock mass under both stress paths show a trend of first increasing and then decreasing. Moreover, under the condition of the same joint inclination angle, the damage value under the conventional triaxial compression test is greater than that under the unloading stress path.
(5) The research results of this study can provide theoretical support and design basis for the stability assessment of surrounding rock in deep tunnels with high ground stress, the optimization of support parameters for jointed rock masses, and the early warning of rockburst disasters. Subsequently, the influence of the number of joint groups and their penetration degree can be explored. Factors such as temperature and hydraulics can be introduced, or macro and mesoscopic coupling analysis can be carried out in combination with FLAC3D and PFC3D simulations to improve the theory of joint-rock mass mechanics and enhance the multi-scenario applicability of the results.
