Abstract
With the continuous development and innovation of thermal management technology for lithium-ion batteries, the advantages of direct immersion liquid cooling technology have become increasingly prominent. However, at present, there is relatively little research on immersion liquid cooling systems, and current research is still mainly focused on small-capacity battery systems. Therefore, taking a large-capacity battery pack as the research object, a new type of single-phase immersion liquid cooling system was designed. The battery pack has a charge and discharge rate of 1C, consists of 52 cells, and has a total capacity of 52.249 kWh. It was compared with traditional liquid cooling and static immersion liquid cooling. Then, the effects of the aperture of the flow distributor, the inlet flow rate of the cooling liquid, and the type of cooling liquid on the cooling performance of the dynamic immersion battery pack were discussed. The holes on the flow distribution plate are primarily designed to facilitate a relatively uniform distribution of incoming liquid flow. Our research found that compared with traditional liquid cooling and static immersion liquid cooling, the overall cooling performance of the dynamic immersion cooling system was significantly improved, with the maximum temperature Tmax decreasing by 7.8 °C and 6.6 °C, the maximum temperature difference ΔTmax of the entire pack decreasing by 5.5 °C and 5.8 °C, and the maximum temperature difference U-DΔTmax between the top and bottom surfaces of the battery pack decreasing by 10.1 °C and 8.96 °C. An appropriate aperture had a positive impact on the cooling effect of the battery pack, with the best effect at a aperture of 4 mm. Tmax and ΔTmax gradually decreased with an increase in the flow rate of the cooling liquid, with Tmax decreasing from 42.3 °C to 31 °C and ΔTmax decreasing from 14.8 °C to 7.9 °C, but the rate of the temperature decrease gradually decreased. Deionized water in the cooling liquid had the best cooling effect, while ethyl silicone oil had the worst cooling effect. The novel single-phase immersion cooling system developed in this study serves as a valuable reference for the design of immersion liquid cooling systems in large-capacity battery packs, contributing to enhanced temperature uniformity and improved system safety.
1. Introduction
A power battery is one of the key components of electric vehicles. To meet the high operational demands of current electric vehicles, power batteries must have sufficiently high specific power and specific energy densities. Currently, lithium-ion batteries are widely used in electric vehicle power battery systems due to their high energy density, good cycle performance, lack of memory effects, and environmental friendliness [1]. Generally, it is believed that the acceptable operating temperature range for lithium-ion batteries is −20 to 60 °C, with the optimal range being 15 to 35 °C, and the temperature difference within a battery module should be controlled within 5 °C [2,3]. Research shows that excessively high temperatures can lead to a decrease in battery cycle life and, in severe cases, even cause thermal runaway, while excessively low temperatures can reduce battery capacity [4,5]. Therefore, the battery thermal management system (BTMS), as a key technology to prevent lithium-ion batteries from overheating, has received significant attention in both academia and the industry. Thus, research on the thermal management system of lithium-ion batteries is highly necessary [6].
According to the cooling media employed, battery thermal management systems can be primarily categorized into air cooling, liquid cooling, heat pipe cooling, phase change cooling, and hybrid cooling systems [7]. Among these, air cooling features a simple structure, mature technology, and low costs, and it has already been used in commercial applications. However, due to the low specific heat capacity and thermal conductivity of air, they cannot meet the heat dissipation requirements of high-specific-heat and high-current batteries [8]. Heat pipe cooling systems offer flexibility in geometric design, which can substantially reduce thermal resistance. However, because of their limited total volume and relatively small contact area, they often need to be integrated with other cooling techniques [9]. Phase-change battery thermal management systems have strong heat dissipation capabilities, but due to their heat dissipation characteristics, they are currently mainly used as an auxiliary heat dissipation method [10]. Liquid-cooled systems are currently the most widely used in new energy vehicles and are mainly divided into direct cooling and indirect cooling. Indirect cooling is cold plate cooling, which has the advantage of high cooling efficiency but can cause uneven thermal field distribution in battery modules [11]. Direct cooling, also known as immersion liquid cooling, immerses the battery in a non-conductive medium, allowing for uniform heat conduction and ensuring uniform battery temperature. Since the heat transfer medium is in direct contact with the battery, the contact thermal resistance is reduced, further improving heat transfer efficiency. In addition, this cooling method can also reduce the complexity of the system [12,13]. Currently, researchers mainly focus on the optimization of cooling media and flow channel structure design. Jithin et al. [14] compared the cooling effects of mineral oil, AmpCool AC-100, and deionized water on 4S1P cylindrical batteries. The study found that for 3C discharge, deionized water was more effective in limiting the temperature rise to below 2.2 °C, while the thermal performance of mineral oil and AmpCool AC-100 was comparable. Tan et al. [15] immersed the battery in hydrogen fluoride ether and compared the cooling effects of different hydrogen fluoride ether flow rates, flow path heights, and channel layer numbers. H. Choi et al. [16] designed an immersion structure with a through partition and graphite fins, and they improved the cooling efficiency at the bottom of the battery module by changing key parameters such as flow direction and battery gap. The results showed that the pressure drop and power consumption were reduced by 45.4% and 61.0%, respectively. Immersion liquid cooling, with its superior cooling efficiency, has become the focus of scholars’ research and will play an important role in future battery thermal management.
Research indicates that most existing studies on battery pack cooling systems have primarily focused on small-capacity battery systems. This paper shifts the focus to large-capacity battery packs by designing a novel single-phase immersion liquid cooling system. The system is compared with the conventional cold plate cooling method, and the effects of key parameters—such as hole size, cooling fluid inlet flow rate, inlet temperature, and fluid type—on cooling performance are systematically analyzed. The objective is to achieve enhanced thermal conductivity, a more uniform temperature distribution, and, ultimately, improved overall performance and reliability of a battery system. Furthermore, this study aims to provide valuable insights for the design and optimization of dynamic immersion liquid cooling systems.
2. Mathematical Model of Lithium-Ion Battery Pack
2.1. Physical Model
In this paper, a lithium-ion battery pack model is selected, as shown in Figure 1. The model has a length of 800 mm, a width of 1200 mm, and a height of 230 mm. The battery pack consists of 52 cells. The cell material is lithium iron phosphate, and 314 Ah energy-storage cells are adopted, with a series-parallel configuration of 1P52S. The total energy of the entire pack is 52.249 kWh. The length, width, and height of a single cell are 174 mm, 72 mm, and 207 mm, respectively. The flow condition of the coolant and its flow between the cells are presented in Figure 2. The main functions of the thermal pads between the cells are to form flow channels and provide thermal insulation. Upper and lower flow-equalizing plates are designed on the upper and lower sides of the box, respectively. There are flow channels on the flow-equalizing plates, which are formed by stamping technology. Holes are added to the flow channels of the flow-equalizing plates, as shown in Figure 3, aiming to enable relatively uniform coolant circulation for inflow. The coolant enters from the inlet, passes through the holes of the upper flow-equalizing plate, and reaches the gaps between the cells to conduct convective heat transfer with the cells. Then, it flows out through the holes of the lower flow-equalizing plate, taking heat away and continuously cooling the cells.
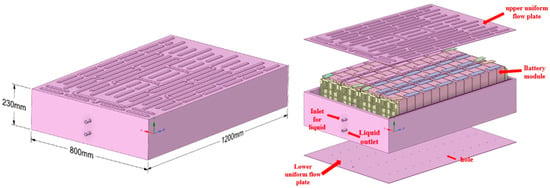
Figure 1.
Model schematic diagram.

Figure 2.
Schematic diagram of the coolant’s flow.
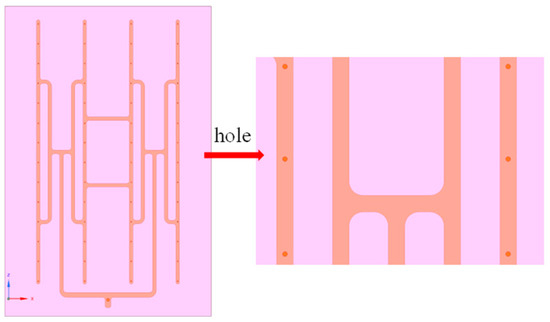
Figure 3.
Schematic diagram of flow channel holes.
2.2. Mathematical Method
Lithium iron phosphate batteries feature a large number of internal components, and the heat transfer processes among various materials are relatively intricate. For the convenience of simulation calculations, a reasonable simplification of the battery is carried out. Heat generation within the battery core is assumed to be uniform. The heat generated by the battery is primarily transferred through thermal conduction, while heat convection and thermal radiation are neglected. Moreover, the physical property parameters of the materials are considered invariant with temperature changes. Based on the energy conservation equation, the differential equation of heat conduction for the battery can be expressed as follows [17]:
In the formula, ρ represents the battery density (kg/m3); Cp is the specific heat capacity of the battery (J/kg·K); T is the battery temperature (K); t is the time (s); λx, λy, and λz are the thermal conductivity coefficients of the battery in the x, y, and z directions of the rectangular coordinate system (W/(m·K)) [18]; λx = 23.88, λy = 0.65, and λz = 23.88; q is the heat generation power (W/m3).
The heat generation rate of the battery is an important parameter affecting thermal simulation calculations. It is usually obtained by the classic calculation method proposed by Bernardi [17], which is
In the formula, Vb represents the battery volume (m3), I is the working current of the battery (A), Rt is the internal resistance of the battery (Ω), T is the working temperature of the battery (K), ∂U0/∂T is the temperature influence coefficient (V/K), and T(∂U0/∂T) is usually taken as a constant value of 11.16 mV in the calculation [19]. The basic parameters of the battery are shown in Table 1.

Table 1.
Battery parameter table.
The coolant employed in this paper exhibits relatively stable thermophysical properties within the room temperature range. Thus, it is assumed that the fluid possesses constant properties, has no internal heat source, and is an incompressible Newtonian fluid, and radiative heat dissipation generally accounts for less than 5% under normal temperature conditions, which is significantly lower than the dominant contribution of forced convection. Furthermore, fluid–solid coupling entails complex multi-physics field interactions, and the computational cost often does not justify the marginal gains in accuracy. Therefore, the effects of fluid–solid coupling and radiative heat transfer are neglected in this analysis. The STAR-CCM+ CFD solver is utilized to address the mass, momentum, and energy conservation governing equations for incompressible Newtonian fluids. In this research, only steady-state conditions are considered, and the relevant equations are summarized as follows [20]:
Here, u and x represent the velocity and direction vectors in the Cartesian space; ρ is the density; P is the pressure; μ is the dynamic viscosity of the fluid; c is the specific heat capacity; T is the temperature; k is the thermal conductivity; Δ is the Laplacian operator. The basic parameters of the coolant are shown in Table 2.

Table 2.
Thermal physical parameters of coolant.
2.3. Validation of Numerical Method
In this study, the grid generation and simulation software employed is STAR-CCM+ 2310. The grid generation scenario is depicted in Figure 4. Polyhedral meshes were utilized to discretize the battery pack cooling system. The simulation was conducted under the condition of 25 °C. The inlet and outlet boundary conditions were specified as a mass-flow inlet and a pressure outlet. The inlet flow rate was set at 10 L/min, the inlet temperature was 20 °C, and the outlet pressure was 0 Pa. The contact thermal resistance between the battery and the coolant was 0.002 m2 K/W. With a convective heat-transfer coefficient of 3 W/(K·m2). The battery discharge rate was maintained at 1C. For the verification of grid independence, five sets of different grid densities were considered. The maximum temperature of the battery pack, denoted as Tmax, and the pressure drop across the battery pack, ΔP, were used as validation metrics. As presented in Figure 5, with the progressive increase in the number of grids, Tmax rose from 26.5 °C to 32.61 °C, while ΔP decreased from 25.7 kPa to 22.8 kPa, and both parameters eventually reached a state of stability. When the grid count reached 12.66 million, further increases in the grid density led to negligible changes in Tmax and ΔP of the battery pack. Specifically, the variations were within 1%. After a comprehensive consideration of computational cost and accuracy requirements, a grid count of 12.66 million was ultimately chosen for subsequent computational investigations.
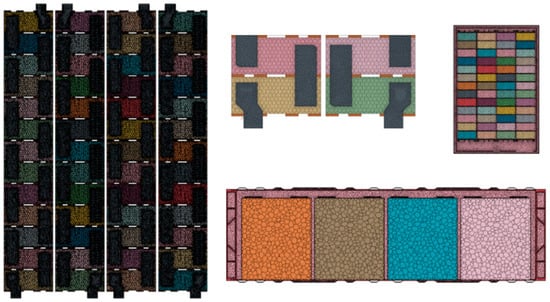
Figure 4.
Grid model.
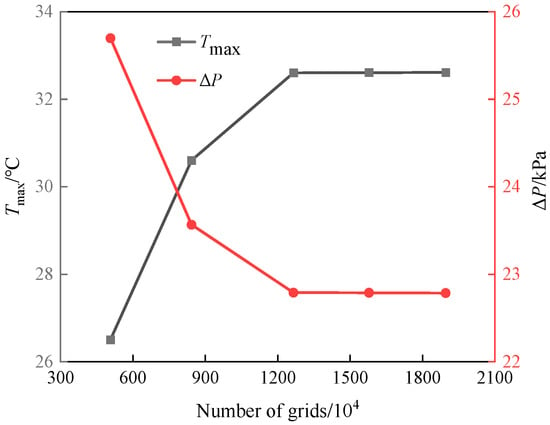
Figure 5.
Grid independence verification.
The heat generation rate of the single-cell simulation model is calculated by the average heat release using the Bernadi formula, and it is assumed that the heat generation inside the single cell is uniform, with an initial temperature of 25 °C and a discharge rate of 1C. The temperature monitoring points are the center points of each face of the cell. The numerical simulation results of the average temperature of each surface of the battery are compared with the experimental results in the literature, and the results are shown in Figure 6. As evident from Figure 6, the numerical simulation results are in good agreement with the experimental results in the literature. Specifically, the maximum relative error is 3.85%. This validates that the established battery heat generation model is capable of accurately depicting the actual heat generation process of the battery.
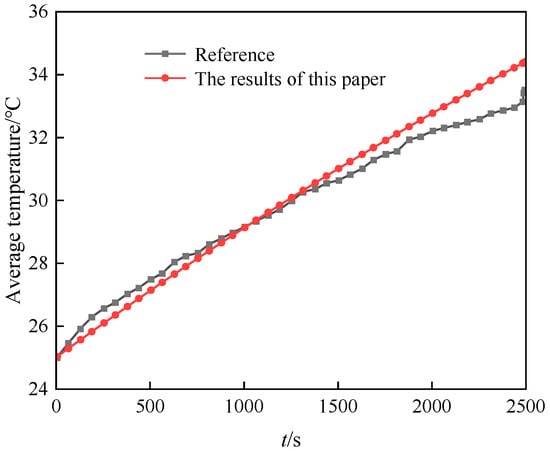
Figure 6.
The numerical simulation results of this paper are compared with those of Liu, Z.B [21].
3. Results and Discussion
3.1. Simulation Comparison of Traditional Liquid Cooling, Static Immersion Liquid Cooling, and Dynamic Immersion Liquid Cooling
First, the temperature distribution contour map of the battery pack within the dynamic immersion liquid cooling system is presented, as depicted in Figure 7. Subsequently, a cold-plate cooling design for the battery pack was carried out. In the fluid domain, two media, namely, air and synthetic oil, were specified for comparative analysis, representing traditional liquid cooling and static immersion liquid cooling, respectively. The corresponding temperature distributions are shown in Figure 8. Under conditions of identical inlet flow rates and inlet temperatures, a comparison of the temperature distribution contour maps of these three cooling methods reveals that, in the case of the dynamic immersion liquid cooling design, both the temperature consistency between adjacent cells and that between the top and bottom of the battery pack are well-maintained. In contrast, for the cold-plate liquid cooling design, although the temperature uniformity among adjacent cells is satisfactory, a significant temperature disparity exists between the top and bottom of the battery pack.
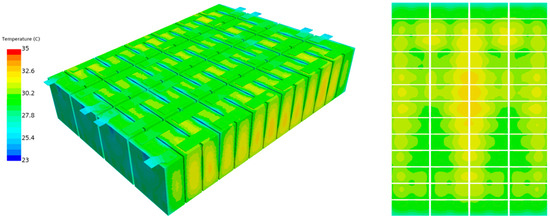
Figure 7.
Temperature distribution of dynamic immersion liquid cooling system.
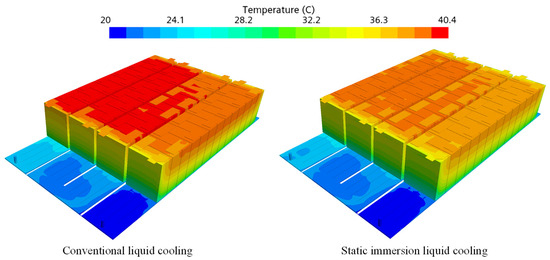
Figure 8.
Temperature distribution of traditional liquid cooling and static immersion liquid cooling systems.
To further describe the evaluation results of the comparison among the three, the temperature performance of dynamic immersion liquid cooling is evaluated by the maximum temperature of the battery pack Tmax, the maximum temperature difference of the entire pack ΔTmax, and the maximum temperature difference between the top and bottom surfaces of the battery pack U-DΔTmax. The maximum temperature difference between the top and bottom surfaces of the battery pack is defined as U-DΔTmax. It can be seen from Figure 9 that compared with traditional liquid cooling and static immersion liquid cooling, the Tmax of dynamic immersion liquid cooling decreased by 7.8 °C (19.31%) and 6.6 °C (16.84%), respectively. Therefore, dynamic immersion liquid cooling significantly reduces the maximum temperature of the battery pack and enhances battery safety. ΔTmax decreased by 5.5 °C (39%) and 5.8 °C (40.28%), improving the uniformity of temperature among adjacent cells and extending the working life of the cells. The U-DΔTmax of dynamic immersion liquid cooling is only 2.04 °C, which decreased by 10.1 °C (83.20%) and 8.96 °C (81.45%) compared with traditional liquid cooling and static immersion liquid cooling, respectively. The problem of excessive temperature differences between the top and bottom surfaces of the cells was greatly reduced.
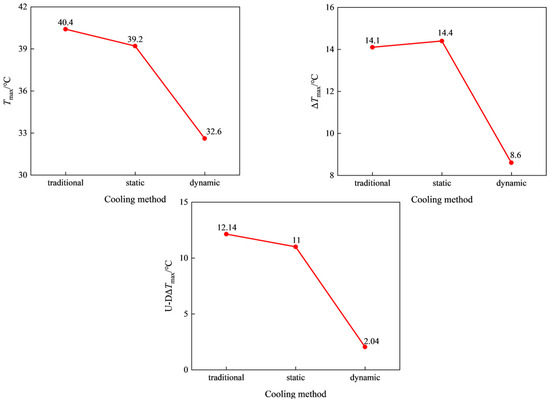
Figure 9.
The influence of different cooling methods on Tmax, ΔTmax, and U-DΔTmax.
3.2. Impact of the Aperture of the Flow-Equalizing Plate on the Temperature-Rise Characteristics of the Battery Pack
To investigate the impact of the aperture of the flow-equalizing plate on the performance of dynamic immersion liquid cooling, an inlet flow rate of 10 L/min and synthetic oil as the coolant were chosen as the subjects of this study. Four different aperture sizes, namely, 3 mm, 4 mm, 5 mm, and 6 mm, were selected for a comparative analysis. As shown in Figure 10, both the maximum temperature Tmax and the maximum temperature difference ΔTmax of the battery pack first decreased and then increased with an increase in the aperture. Among them, when the aperture was 4 mm, both the maximum temperature Tmax and the maximum temperature difference ΔTmax were the minimum values, which were 32.60 °C and 8.60 °C, respectively.
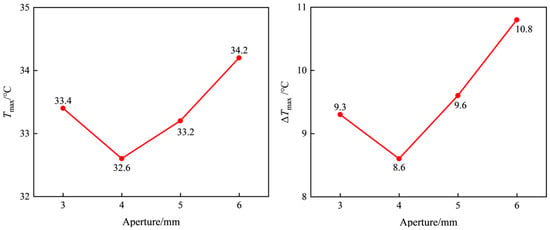
Figure 10.
The influence of different apertures on Tmax and ΔTmax.
To further explore why the cooling performance is the best when the aperture is 4 mm, the flow distribution on Sections 1–14 and the temperature distribution of the battery pack under four working conditions were analyzed. Since the upper and lower flow plates of the battery pack are symmetrical, the flow distribution is the same. Also, as the flow distribution of the four columns of holes on the upper flow plate is similar, it is sufficient to study one column. As shown in Figure 11 and Figure 12, the larger the flow, the lower the temperature. From Q = HAΔT, since the model design remains unchanged, the heat exchange area remains constant (Q represents heat flow, H represents surface heat transfer coefficient, A represents the solid surface area involved in convective heat transfer, and ΔT represents the temperature difference between the solid surface and the surrounding fluid.). The inlet water temperature remains unchanged, so the heat exchange temperature difference T remains constant. Under the condition of constant cross-sectional area, the larger the flow, the larger the heat exchange coefficient, and the more heat is carried away. When the aperture is 3 mm, the highest temperature appears in regions ① and ③. When the aperture is 4, 5, and 6 mm, the highest temperature appears in region ②. When the aperture is 3 mm, the flow deviation is the smallest, and theoretically, the uniformity of temperature is the best. However, due to the thermal aggregation effect, the temperature in region ② should be the highest. But due to the flow, the temperatures in regions ① and ③ are higher. Therefore, when the aperture is 3 mm, Tmax and ΔTmax will be relatively large. When the aperture is 4 mm, it is in the middle position of the high-temperature variation.
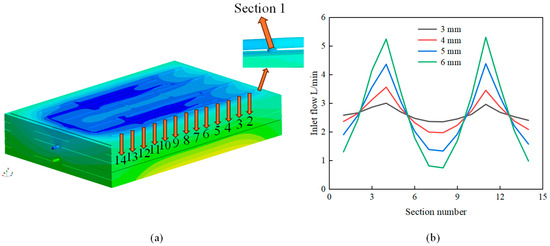
Figure 11.
(a) Schematic diagram of Section 1–14; (b) flow data graph on Section 1–14 under different apertures.
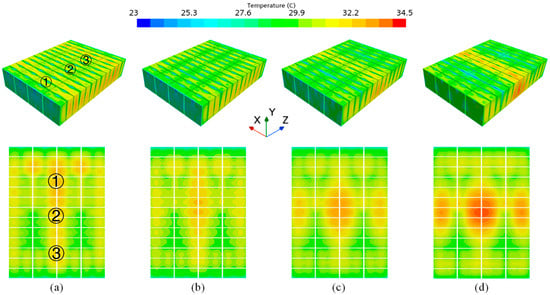
Figure 12.
Temperature distribution cloud graphs of the side and bottom surfaces of the battery pack under different apertures: (a) 3 mm, (b) 4 mm, (c) 5 mm, and (d) 6 mm.
At this time, the heat exchanger and flow are in direct proportion, and the uniformity of temperature is the best. Therefore, Tmax will take a smaller value when the aperture is 4 mm. When the aperture is 4, 5, and 6 mm, the flow difference between regions ①, ③, and ② becomes larger and larger, so the corresponding maximum temperature difference will become larger and larger. Therefore, when the aperture is 4 mm, the maximum temperature difference is the smallest. Considering all factors, the cooling performance is the best when the aperture is 4 mm.
3.3. The Influence of Coolant Inlet Flow Rate on the Temperature Rise Characteristics of Battery Packs
To investigate the effect of coolant inlet flow rate on dynamic submerged liquid cooling performance, a 4 mm aperture was selected, and synthetic oil was employed as the coolant in this study. The coolant inlet flow rates were set at 2.5 L/min, 5 L/min, 7.5 L/min, 10 L/min, 12.5 L/min, and 15 L/min. The simulation results are shown in Figure 13. As the coolant inlet flow rate increases, Tmax and ΔTmax gradually decrease, and the rate of decrease also gradually decreases. When the flow rate increases from 2.5 L/min to 15 L/min, Tmax and ΔTmax in the system significantly decrease, with Tmax dropping from 42.3 °C to 31 °C and ΔTmax from 14.8 °C to 7.9 °C. The influence of flow rate changes on Tmax and ΔTmax is more prominent in the low-flow stage. When the flow rate increases from 2.5 L/min to 5 L/min, Tmax decreases by 4.6 °C, a reduction of 10.87%; ΔTmax decreases by 2.5 °C, a reduction of 16.89%. In contrast, in the high-flow stage, when the flow rate increases from 12.5 L/min to 15 L/min, Tmax only decreases by 0.8 °C, a reduction of 2.52%; ΔTmax decreases by 0.4 °C, a reduction of 4.82%. Considering all factors, an inlet flow rate of 10 L/min is the optimal choice in this design.
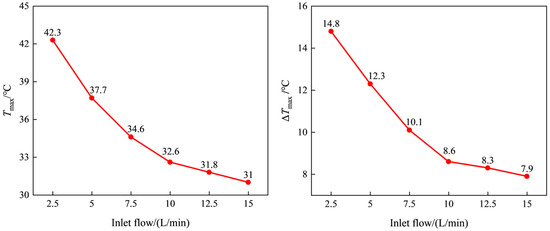
Figure 13.
The influence of different inlet flow rates on Tmax and ΔTmax.
To conduct a more in-depth analysis of the flow-field characteristics of the immersion system under various inlet flow rates, Figure 14 presents the velocity distribution across Section 15, while Figure 15 provides a schematic illustration of Section 15. As can be discerned from these figures, with the progressive increase in the inlet flow rate, the velocity at which the coolant enters the immersion system through the holes steadily rises. Consequently, the overall flow velocity of the coolant within the immersion system experiences a notable augmentation. This increase in flow velocity serves to strengthen the convective heat transfer between the coolant and the battery cells. Therefore, as the inlet flow rate continues to increase, the cooling performance of the system improves accordingly. When the inlet flow rate escalates from 2.5 L/min to 5 L/min, the velocity at the inlet exhibits a marked increase. This phenomenon elucidates why the enhancement of cooling performance is more conspicuous at lower flow rates. Furthermore, as the flow rate continues to increase, the velocity distribution within the flow field gradually converges, and the incremental effect on cooling performance gradually diminishes.
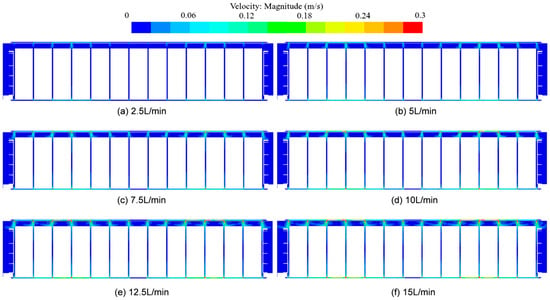
Figure 14.
Flow velocity cloud graphs under different inlet flow rates.
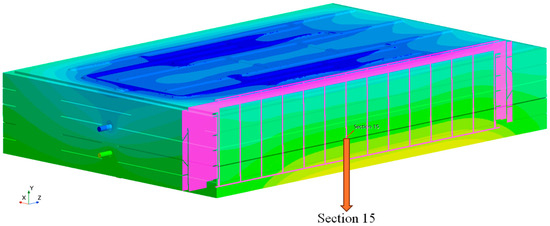
Figure 15.
Schematic diagram of Section 15.
3.4. The Impact of Coolant Types on the Temperature-Rise Characteristics of Battery Packs
To explore the influence of coolant types on the dynamic immersion cooling effect, an aperture of 4 mm and an inlet flow rate of 10 L/min were selected as the research objects. Five types of coolants, namely, fluorinated liquid (D1), synthetic oil, deionized water, ethyl silicone oil, and ester (MIVOLT-DF7), were chosen for this study. Their physical parameters are detailed in Table 3.

Table 3.
Five thermal physical parameters of coolant.
As shown in Figure 16, deionized water exhibits superior cooling performance due to its excellent thermal conductivity, high specific heat capacity, and relatively low dynamic viscosity. The maximum temperature (Tmax) reaches 27.9 °C, with a maximum temperature difference (ΔTmax) of 5.6 °C. In comparison, ethyl silicone oil demonstrates significantly reduced heat dissipation capability due to its inferior thermal physical properties. Its Tmax and ΔTmax reach 35.3 °C and 10.2 °C, respectively. Compared with deionized water, Tmax increases by 7.4 °C, representing a 26.52% increase, while ΔTmax increases by 4.6 °C, corresponding to an 82.14% increase.
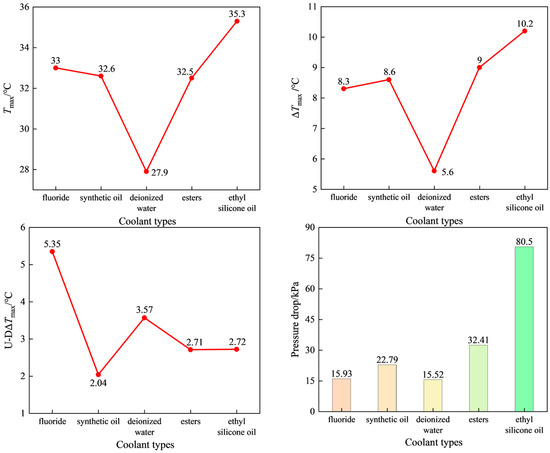
Figure 16.
The influence of different cooling fluid types on Tmax, ΔTmax, U-DΔTmax, and ΔP.
The cooling effects of synthetic oil, ester, and fluorinated liquid were relatively close. Among them, synthetic oil had the lowest maximum temperature difference U-DΔTmax of 2.04 °C, fluorinated liquid had the highest of 5.35 °C, and ester and ethyl silicone oil were similar. The pressure drop is primarily determined by the fluid’s density and dynamic viscosity. An increase in density enhances the fluid’s inertia, thereby requiring a greater amount of driving kinetic energy to sustain the same flow rate. Conversely, an increase in dynamic viscosity intensifies the viscous dissipation effect during the flow process. As illustrated in Table 3 and Figure 15, ethyl silicone oil, which exhibits higher density and viscosity, experiences the largest pressure drop of 80.5 kPa. In contrast, deionized water, with its comparatively lower physical parameters, demonstrates the smallest pressure drop of 15.52 kPa, which is 64.98 kPa (80.72%) less than that of ethyl silicone oil. Considering the comprehensive cooling effect and energy-saving performance, combined with the inherently low dielectric constant and cost-effectiveness of synthetic oil, this design selects synthetic oil as the coolant for research.
The dynamic immersion cooling system demonstrates significant potential for enhancing battery longevity and operational safety. Furthermore, the raw material cost of synthetic oil is merely one-fifth to one-tenth that of fluorinated liquids, and its production does not depend on specialized chemical supply chains, unlike dielectric fluids. In terms of lifecycle management, synthetic oil exhibits superior chemical stability, which can reduce coolant replacement frequency by over 50%. Additionally, its compatibility with commonly used metallic materials simplifies system maintenance. Therefore, this study offers valuable insights into addressing practical challenges associated with the real-world implementation of dynamic immersion cooling systems.
4. Conclusions
This study presents an innovative design of a unique cooling medium flow channel and battery module layout, enabling efficient heat transfer and a more uniform temperature distribution. As a result, the overall performance and reliability of the system are significantly enhanced. Compared with conventional cold plate liquid cooling, immersion liquid cooling demonstrates superior thermal management capabilities. Subsequently, the effects of key parameters—including the aperture of the flow distributor, coolant inlet flow rate, coolant inlet temperature, and coolant type—on the temperature field distribution characteristics are systematically investigated. The main findings of the study are summarized as follows:
- (1)
- Compared with traditional liquid cooling and static immersion liquid cooling, dynamic immersion cooling can significantly reduce the temperature difference and the maximum temperature of the battery cells, which is beneficial to improving the safety and lifespan of the cells. The maximum temperature difference between the top and bottom surfaces has decreased significantly, and the problem of excessive temperature difference between the top and bottom surfaces of the cells has been greatly reduced.
- (2)
- A well-designed thermal management system can enhance the temperature uniformity within the system. For example, an appropriate aperture size positively influences the cooling performance of the battery pack. Both the maximum temperature (Tmax) and the maximum temperature difference (ΔTmax) initially decrease and subsequently increase with an increase in aperture size. The optimal cooling effect is achieved when the aperture size is 4 mm.
- (3)
- As the inlet flow rate increases, both Tmax and ΔTmax gradually decrease, and the rate of decrease gradually decreases. The influence on Tmax and ΔTmax is more obvious at low flow rates. It is indicated that the cooling flow rate has a limited impact on the temperature of the battery cells. Considering the reduction in system energy consumption, an appropriate flow rate can be selected to match the system’s design.
- (4)
- Comparing the cooling effects of five types of coolants, deionized water has the best cooling effect, and ethyl silicone oil has the worst cooling effect. The U-DΔTmax of synthetic oil is the lowest, and its uniformity is the best. At the same time, synthetic oil is widely used as the coolant in immersion liquid cooling systems due to its advantages of having a low dielectric constant, good thermal conductivity, low viscosity, and low costs.
- (5)
- Immersion liquid cooling demonstrates significant advantages in improving the uniformity and safety of heat dissipation within battery thermal management systems. However, its widespread adoption is currently hindered by several engineering challenges, including high costs, material compatibility issues, and the development of reliable sealing technologies. Future research should focus on the development of cost-effective and environmentally sustainable cooling media, the optimization of sealing processes, and the exploration of their applicability in high-energy-density configurations, such as solid-state batteries.
Author Contributions
J.H. completed numerical simulations, processed the data, and wrote this article. B.Y. and Z.C. conducted numerical simulations, processed the data, and revised this article. S.C., S.W. and F.L. helped complete numerical simulations and revised this article. All authors have read and agreed to the published version of the manuscript.
Funding
This research received no external funding.
Institutional Review Board Statement
Not applicable.
Informed Consent Statement
Not applicable.
Data Availability Statement
The data underlying this article will be shared upon reasonable request to the corresponding author.
Acknowledgments
Jiajun Hu thanks his parents and his girlfriend for their support, understanding and help during the writing of this article.
Conflicts of Interest
The authors declare no conflicts of interest.
References
- Goodenough, J.B.; Park, K.S. The Li-ion rechargeable battery: A perspective. J. Am. Chem. Soc 2013, 135, 1167–1176. [Google Scholar] [CrossRef]
- Wu, W.X.; Wang, S.F.; Wu, W.; Chen, K.; Hong, S.H.; Lai, Y.X. A critical review of battery thermal performance and liquid based battery thermal management. Energy Convers. Manag. 2019, 182, 262–281. [Google Scholar] [CrossRef]
- Ma, S.; Jiang, M.D.; Tao, P.; Song, C.; Wu, J.; Wang, J.; Deng, T.; Shang, W. Temperature effect and thermal impact in lithium-ion batteries: A review. Prog. Nat. Sci. Mater. Int 2018, 28, 653–666. [Google Scholar] [CrossRef]
- Ramadass, P.; Haran, B.; White, R.; Popov, B.N. Capacity fade of Sony 18650 cells cycled at elevated temperatures Part I. Cycling performance. J. Power Sources 2002, 112, 606–613. [Google Scholar] [CrossRef]
- Senyshyn, A.; Muhlbauer, M.J.; Dolotk, O.; Ehrenberg, H. Low-temperature performance of Li-ion batteries: The behavior of lithiated graphite. J. Power Sources 2015, 282, 235–240. [Google Scholar] [CrossRef]
- Wu, T.T.; Wang, C.H.; Hu, Y.X.; Liang, Z.X.; Fan, C.X. Research on electrochemical characteristics and heat generating properties of power battery based on multi-time scales. Energy 2023, 265, 126416. [Google Scholar] [CrossRef]
- Bhosale, A.J.; Deshmukh, V.N. Efficient ways of thermal management of an EV battery. Mater. Today Proc. 2023, 72, 1434–1445. [Google Scholar] [CrossRef]
- Wang, Z.C.; Du, C.Q. A comprehensive review on thermal management systems for power lithium-ion batteries. Renew. Sustain. Energy Rev. 2021, 139, 110685. [Google Scholar] [CrossRef]
- Kim, J.; Oh, J.; Lee, H. Review on battery thermal management system for electric vehicles. Appl. Therm. Eng. 2019, 149, 192–212. [Google Scholar] [CrossRef]
- Tang, X.; Guo, Q.; Li, M.; Wei, C.; Pan, Z.; Wang, Y. Performance analysis on liquid—Cooled battery thermal management for electric vehicles based on machine learning. J. Power Sources 2021, 494, 229727. [Google Scholar] [CrossRef]
- Jiaqiang, E.; Yue, M.; Chen, J.; Zhu, H.; Deng, Y.; Zhu, Y.; Zhang, F.; Wen, M.; Zhang, B.; Kang, S. Effects of the different air cooling strategies on cooling performance of a lithiumion battery module with baffle. Appl. Therm. Eng. 2018, 144, 231–241. [Google Scholar] [CrossRef]
- Dan, D.; Yao, C.N.; Zhang, Y.J.; Zhang, H.; Zeng, Z.; Xu, X. Dynamic thermal behavior of micro heart pipe array-air cooling battery thermal management system based on thermal network mode. Appl. Therm. Eng. 2019, 16, 114183. [Google Scholar] [CrossRef]
- Deng, Y.W.; Feng, C.L.; E, J.Q.; Zhu, H.; Chen, J.W.; Wen, M.; Yin, H.C. Effects of different coolants and cooling strategies on the cooling performance of the power lithium ion battery system: A review. Appl. Therm. Eng. 2018, 142, 10–29. [Google Scholar] [CrossRef]
- Jithin, K.V.; Rajesh, P.K. Numerical analysis of single-phase liquid immersion cooling for lithium-ion battery thermal management using different dielectric fluids. Int. J. Heat Mass Transf. 2022, 188, 122608. [Google Scholar] [CrossRef]
- Tan, X.; Lyu, P.; Fan, Y.; Rao, J.; Ouyang, K. Numerical investigation of the direct liquid cooling of a fast-charging lithium-ion battery pack in hydrofluoroether. Appl. Therm. Eng. 2021, 196, 117279. [Google Scholar] [CrossRef]
- Choi, H.; Lee, H.; Kim, J.; Lee, H. Hybrid single-phase immersion cooling structure for battery thermal management under fast-charging conditions. Energy Convers. Manag. 2023, 287, 117053. [Google Scholar] [CrossRef]
- Bernardi, N.; Pawlikowski, E.; Newman, J. A General Energy-Balance for Battery Systems. J. Electrochem. Soc. 1985, 132, 5–12. [Google Scholar] [CrossRef]
- Chen, Y.H.; Chen, S.; Chen, H.L.; Sun, X.Q.; Luo, Y.Q. Simulation Study on Cooling Performance of Immersion Liquid-cooled System for Energy Storage Battery Packs. Energy Storage Sci. Technol. 2025, 14, 648–658. [Google Scholar]
- Pesaran, A.A.; Keyser, M.; Burch, S. An Approach for Designing Thermal Management Systems for Electric and Hybrid Vehicle Battery Packs; Office of Scientific & Technical Information Technical Reports; National Renewable Energy Laboratory: Golden, CO, USA, 1999.
- Jarrett, A.; Kim, I.Y. Design optimization of electric vehicle battery cooling plates for thermal performance. J. Power Sources 2011, 196, 10359–10368. [Google Scholar] [CrossRef]
- Liu, Z.B.; Zhu, T.; Jiang, W.; Zhang, X.B.; Wang, J.G.; Guan, Q.Q.; Zhang, Q.S.; Zhao, Q.L. Simulation Analysis and Structure Optimization of Cooling System for Energy Storage Lithium-Ion Battery Pack. Electr. Power 2023, 56, 202–210. [Google Scholar]
Disclaimer/Publisher’s Note: The statements, opinions and data contained in all publications are solely those of the individual author(s) and contributor(s) and not of MDPI and/or the editor(s). MDPI and/or the editor(s) disclaim responsibility for any injury to people or property resulting from any ideas, methods, instructions or products referred to in the content. |
© 2025 by the authors. Licensee MDPI, Basel, Switzerland. This article is an open access article distributed under the terms and conditions of the Creative Commons Attribution (CC BY) license (https://creativecommons.org/licenses/by/4.0/).