Article

Stability Analysis of Shield Tunnels Considering Spatial Nonhomogeneity and Anisotropy of Soils with Tensile Strength Cut-Off

1
Sanya Institute of Hunan University of Science and Technology, Sanya 572024, China
2
School of Civil Engineering, Hunan University of Science and Technology, Xiangtan 411201, China
3
School of Resources Environment and Safety Engineering, Hunan University of Science and Technology, Xiangtan 411201, China
*
Author to whom correspondence should be addressed.
Appl. Sci. 2025, 15(17), 9507; https://doi.org/10.3390/app15179507
Submission received: 31 July 2025 / Revised: 24 August 2025 / Accepted: 27 August 2025 / Published: 29 August 2025
(This article belongs to the Special Issue Slope Stability and Earth Retaining Structures—2nd Edition)

Abstract

The issue of working face stability in shield tunnels crossing inclined layered soil is addressed by a modified version of the Mohr–Coulomb strength criterion. This model considers spatial nonhomogeneity and anisotropy of the soil layer, and enables a 3D tunnel stability analysis. It derives the energy equation using virtual work, finds the ultimate support stress at the working face, and solves for its optimal upper bound using an algorithm. This research examined the impact of soil nonhomogeneity, anisotropy, and reduced tensile strength parameters on the stability of tunnel working faces. The results demonstrate the validity of the model, as the findings are consistent with existing research when only tensile strength is considered. The ultimate support force decreases with the nonhomogeneous coefficient and increases with the nonhomogeneously directional angle. The ultimate support force decreases first, and then increases with the soil layer’s inclined angle. Soil layers between 10° and 30° have the lowest ultimate support force. This ultimate support force gets stronger with an increasing anisotropic coefficient. Case studies show that using a method that accounts for soil tensile strength to calculate tunnel working face support force results in a relative error of only 1.92%, improving tunnel stability assessment accuracy.

1. Introduction

As urbanization continues to advance, the development of ground space has reached a saturation point, particularly in densely populated metropolitan areas, where the scarcity of land resources is becoming increasingly apparent. However, issues such as traffic congestion and inadequate infrastructure are gradually becoming the core contradictions constraining urban development. Developing and using underground space is an effective pressure-relieving solution, with shield tunnel technology being applied widely [1,2,3]. Shallow-buried shield tunnels face numerous challenges, including crossing layered soil. The stability of the tunnel face is a key concern [4,5].
In recent years, a significant body of research has been conducted by scholars both domestically and internationally on the stability of shield tunnel working faces. The methods used to analyse tunnel working face stability are model testing [6,7], theoretical analysis [8], and numerical simulation [9]. Limit analysis [10,11] and limit equilibrium [12] analysis are two common theoretical analysis methods. Mollon et al. [13] used a multi-cone failure model to analyse collapse pressure in circular tunnel pressure shield tunnelling. Zhang and Qu [14] analysed the stability of unsaturated soil at the end of a tunnel by introducing the shear strength theory of unsaturated soil based on the upper bound theorem of limit analysis. Zhang et al. [15] studied the seismic stability of shield tunnel working faces under various failure modes, combining the upper bound theorem of limit analysis with the response surface method. Zhang and Zhang et al. [16] established a 3D model considering the randomness of rock parameters, and analysed the seismic stability of surfaces using kinematic and response surface methods. The classic literature often uses the Mohr–Coulomb strength criterion for tunnel interface pressure in soil. But soil loses strength when it is under tensile stress, and can be considered to have zero strength. Drucker and Prager [17] defined tensile cut-off, limiting soil tensile strength to zero so the soil body exhibits a nonlinear strength envelope. Park and Michalowsk [18] expanded the scope of this study to encompass three-dimensional slopes, thereby facilitating more precise calculations of slope stability coefficients. Liu et al. [19] found the pressure support for tunnel faces during seismic events by including tensile strength cut-off in their analysis. Park [20] considered the tensile strength cut-off and performed a stability analysis on the deep tunnel roof. Huang et al. [21] solved the critical pressure of longitudinally inclined shield tunnels by introducing tensile strength cut-off. Hou and Yang [22] estimated tunnel face stability during seismic events using tensile strength cut-off. In the above study on tunnel stability, the key parameter of the tensile strength cut-off value improved analysis accuracy and reliability.
The effects of nonhomogeneity and anisotropy of soil on tunnel stability have been extensively studied. Zou et al. [23] studied the three-dimensional rotational collapse mechanism and the effect of vertical soil variability on circular tunnels’ stability. Du et al. [24] studied how the non-homogeneity and anisotropy of soil affect earth pressure and shallow square tunnels’ failure mechanisms using the upper bound theorem. Meng et al. [25] proposed a three-dimensional failure mechanism that incorporates the soil arch effect into the ultimate analysis theoretical framework. This was conducted with the aim of studying the stability of square tunnel working faces. Wang et al. [26] constructed a three-dimensional model to study how the instability of tunnel working faces is affected by soil nonhomoliucccgeneity and anisotropy. Chen et al. [27] studied the stability of tunnel working faces in anisotropic soil based on the limit analysis theorem. Keawsawasvong and Ukritchon [28] explored the impact of clay anisotropy and nonhomogeneity on tunnel stability using a lower-limit analysis. Zhang et al. [29] conducted a probabilistic analysis of the support of circular vertical shafts in unsaturated and heterogeneous cohesive soil. Zou and Peng [30] discussed how soil anisotropy and heterogeneity affect tunnel bearing pressure and the collapse zone. Chi et al. [31] constructed a random field model of soil parameters introducing spatial variability, and conducted a three-dimensional random finite element numerical analysis for a composite dam. Jamhiri et al. [32] developed a probabilistic framework that improved the reliability of crack estimation in dry soils. Li et al. [33] proposed a random finite element method to evaluate the failure mechanism and ultimate bearing capacity characteristics of pile foundations in spatially heterogeneous seabed soil layers. The above scholars have systematically researched the impact of soil nonhomogeneity and anisotropy on tunnel stability and have achieved a number of important research results. However, existing studies on the analysis of soil heterogeneity are mostly limited to the vertical direction (i.e., horizontally layered soil), or they use random field finite element models to analyse stability without considering the reduction in tensile strength. Research on the stability of shield tunnels in inclined layered soil is still insufficient.
In summary, scholars have researched shield tunnel stability extensively and have achieved valuable results. However, there is still insufficient research on the working face support force in relation to the reduction in tensile strength cut-off when shield tunnels pass through inclined layered soil layers. Inclined layered soil layers exhibit significant spatial nonhomogeneity and anisotropy characteristics, while the traditional Mohr–Coulomb strength criterion struggles to accurately represent the tensile strength of soil, making it difficult to assess the stability of shield tunnels and thereby threatening tunnel construction safety. This paper is based on the upper limit method of limit analysis, introduces a tensile strength reduction parameter to modify the Mohr–Coulomb strength criterion, and considers the spatial nonhomogeneity and anisotropy of the soil. It studies the calculation of working face support forces when a tunnel passes through inclined layered soil, providing a reference for the safe passage of shield tunnels through inclined layered soil.

2. Theoretical Basis

2.1. Tensile Strength Cut-Off

The traditional Mohr–Coulomb strength criterion only takes into account shear failure of soil. The tensile strength of soil is obtained by extrapolating the results of compression tests to tensile conditions. In engineering, soil cannot withstand such a high tensile strength, which is close to zero. In the context of plane strain conditions, the strength envelope of the compressive shear stress zone corresponds to the linear portion of the Mohr–Coulomb strength criterion. In contrast, the strength envelope of the tensile shear stress zone is characterised by a partial arc of a specific limit Mohr circle. The boundary point between the two is located at a certain intersection point on the slip plane [34]. Michalowski [35] revised the strength criteria for the tensile stress zone. This amendment used a tensile strength cut-off, a method that reduces tensile strength within the strength envelope. In Figure 1b, ft′ is used to denote tensile strength according to the Mohr–Coulomb strength criterion, but in actual engineering, soil cannot withstand such large tensile stresses. To make it comparable to the Mohr–Coulomb strength criterion, a tensile strength reduction parameter, ξ, is introduced, ranging from 0 to 1, where ft = ξfm. Figure 1a shows a complete tensile strength cut-off (ξ = 0); Figure 1b shows partial cut-off (0 < ξ < 1), and Figure 1c shows minimal cut-off (ξ = 1) [18].

2.2. Spatial Inhomogeneity and Anisotropy Soil Cohesion

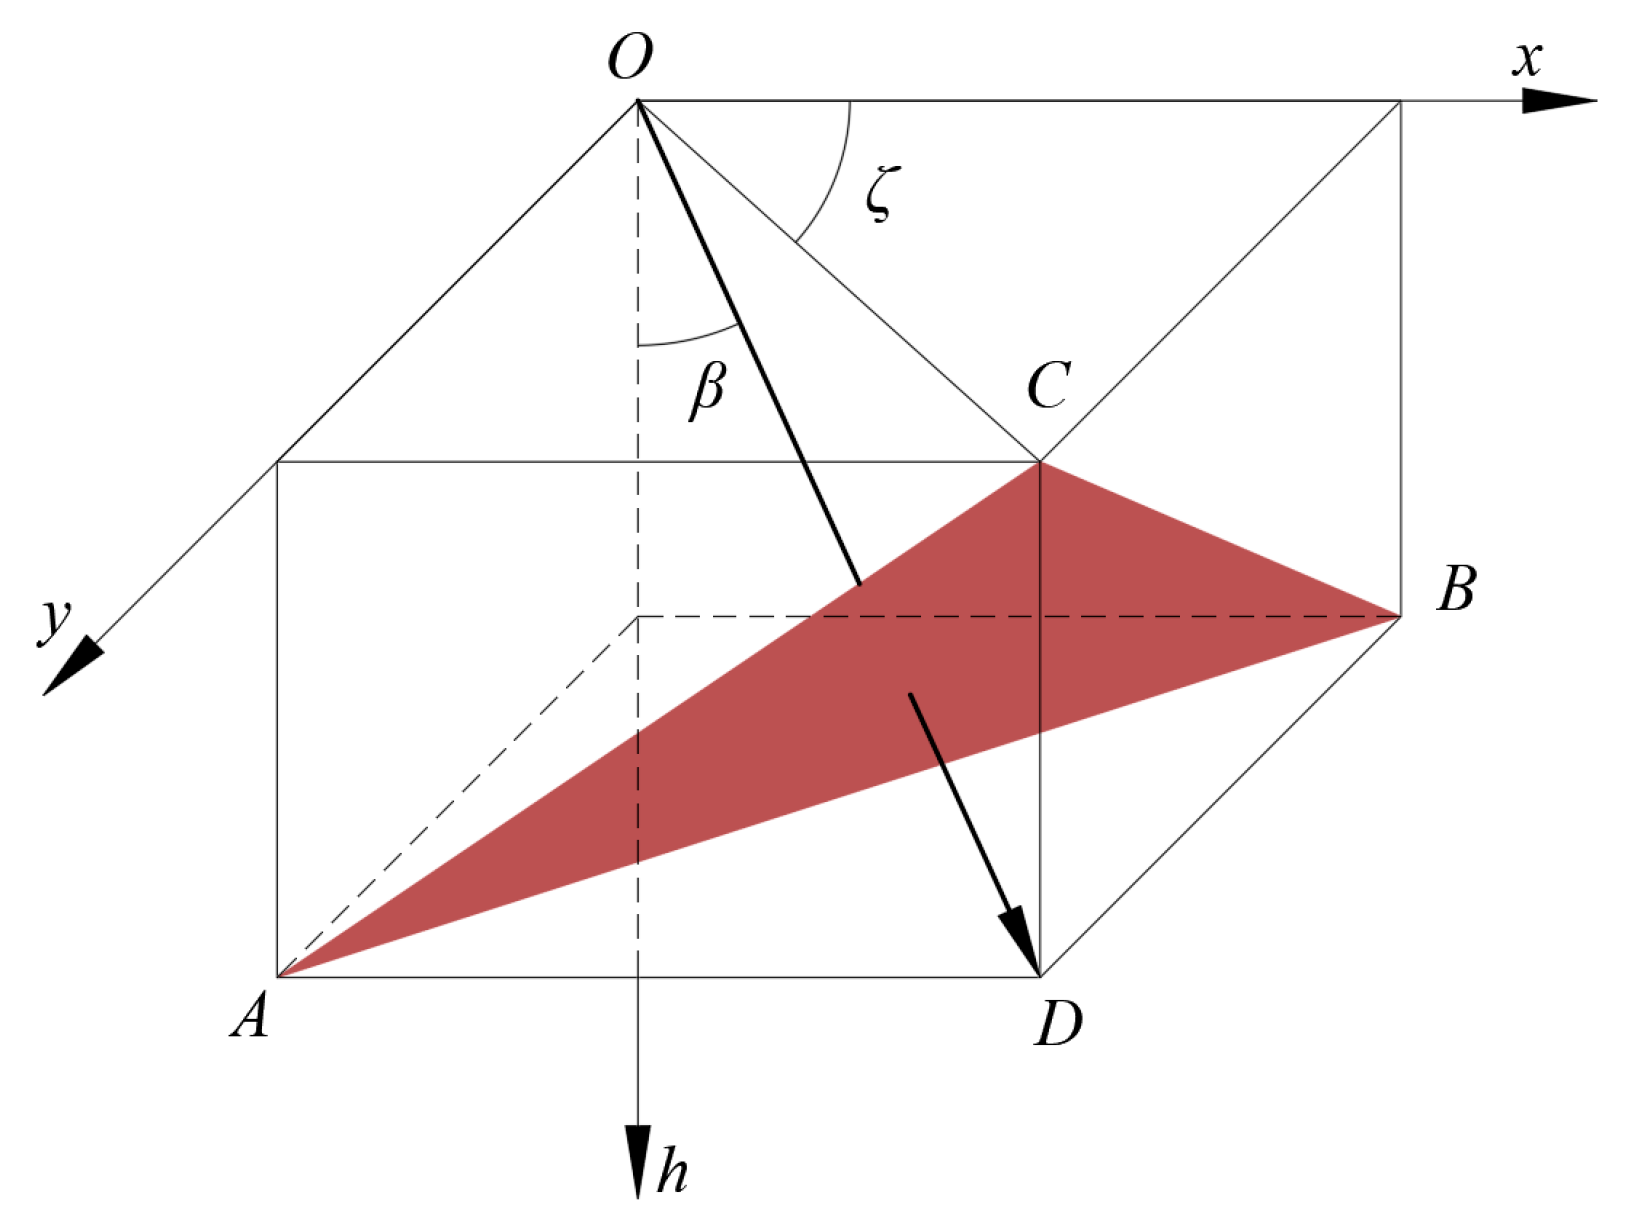
As shown in the study by Luan et al. [36], the dependence of the internal friction angle on the principal stress direction can be neglected, and it can be assumed that only the cohesive force is related to the principal stress direction. Therefore, this paper assumes that the internal friction angle is constant and only considers the heterogeneity and anisotropy of the cohesive force. Liao et al. [37] found that the cohesion of soil in non-horizontal layered strata varies linearly along non-vertical directions, and established a spatially nonhomogeneous model, as shown in Figure 2. The O of the coordinate system is on the ground, with the x-axis going the direction of tunnel excavation and the centre of the tunnel working face on the h-axis. The ABC plane is the structural plane of the inclined layered soil layer, OD is perpendicular to the ABC plane, and OC is the projection of OD on the xOy plane. The inclined angle of soil layer β is defined as the angle between the ABC plane and the horizontal plane. β is at an angle of 0° to 90°. The nonhomogeneously directional angle ζ is defined as the angle formed between the x-axis and OC. The nonhomogeneously directional angle ζ satisfies 0° ≤ ζ ≤ 360°. ρ is the nonhomogeneous coefficient. The initial cohesion c0 is the cohesion at point O. The equation of plane ABC in the spatial coordinate system is expressed as follows:
x sin β cos ζ + y sin β sin ζ + h cos β =   0
The expression for the spatially nonhomogeneous distribution function is as follows:
c 1 = c 0 + ρ x sin β cos ζ + y sin β sin ζ + h cos β
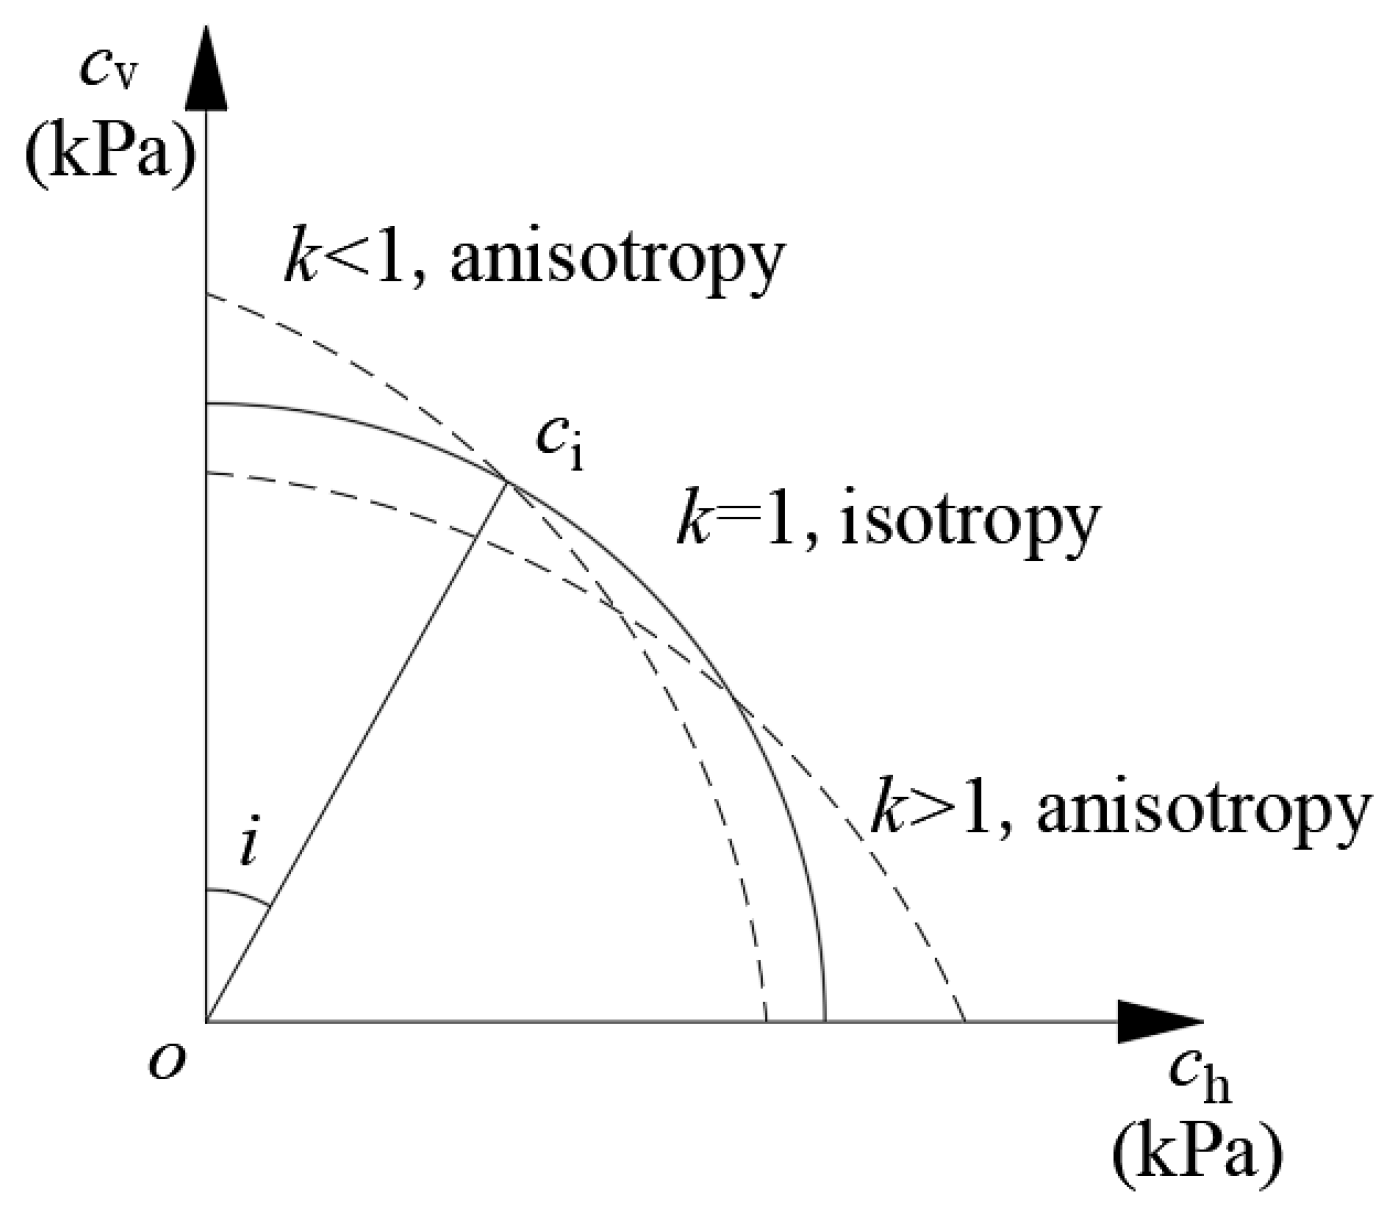
The anisotropy of cohesion is shown in Figure 3, where k is the anisotropic coefficient. The angle between the first principal stress and the vertical direction is denoted by the letter i. The angle between the first principal stress and the failure plane is denoted by the letter ψ, with a value of 35° [38]. The expression for cohesion is shown below:
The anisotropy of cohesion is shown in Figure 3, where cv and ch are the horizontal and vertical principal cohesion forces, respectively. The ratio of ch to cv is k, where k is the anisotropy coefficient. The angle between the first principal stress and the vertical direction is denoted by the letter i. The ψ is the angle between the first principal stress and the failure plane. According to the research of Zhang and Zhang [38], assuming ψ is 35°, the expression for cohesion can be obtained as follows:
c = c 1 1 + 1 k / k cos 2 i
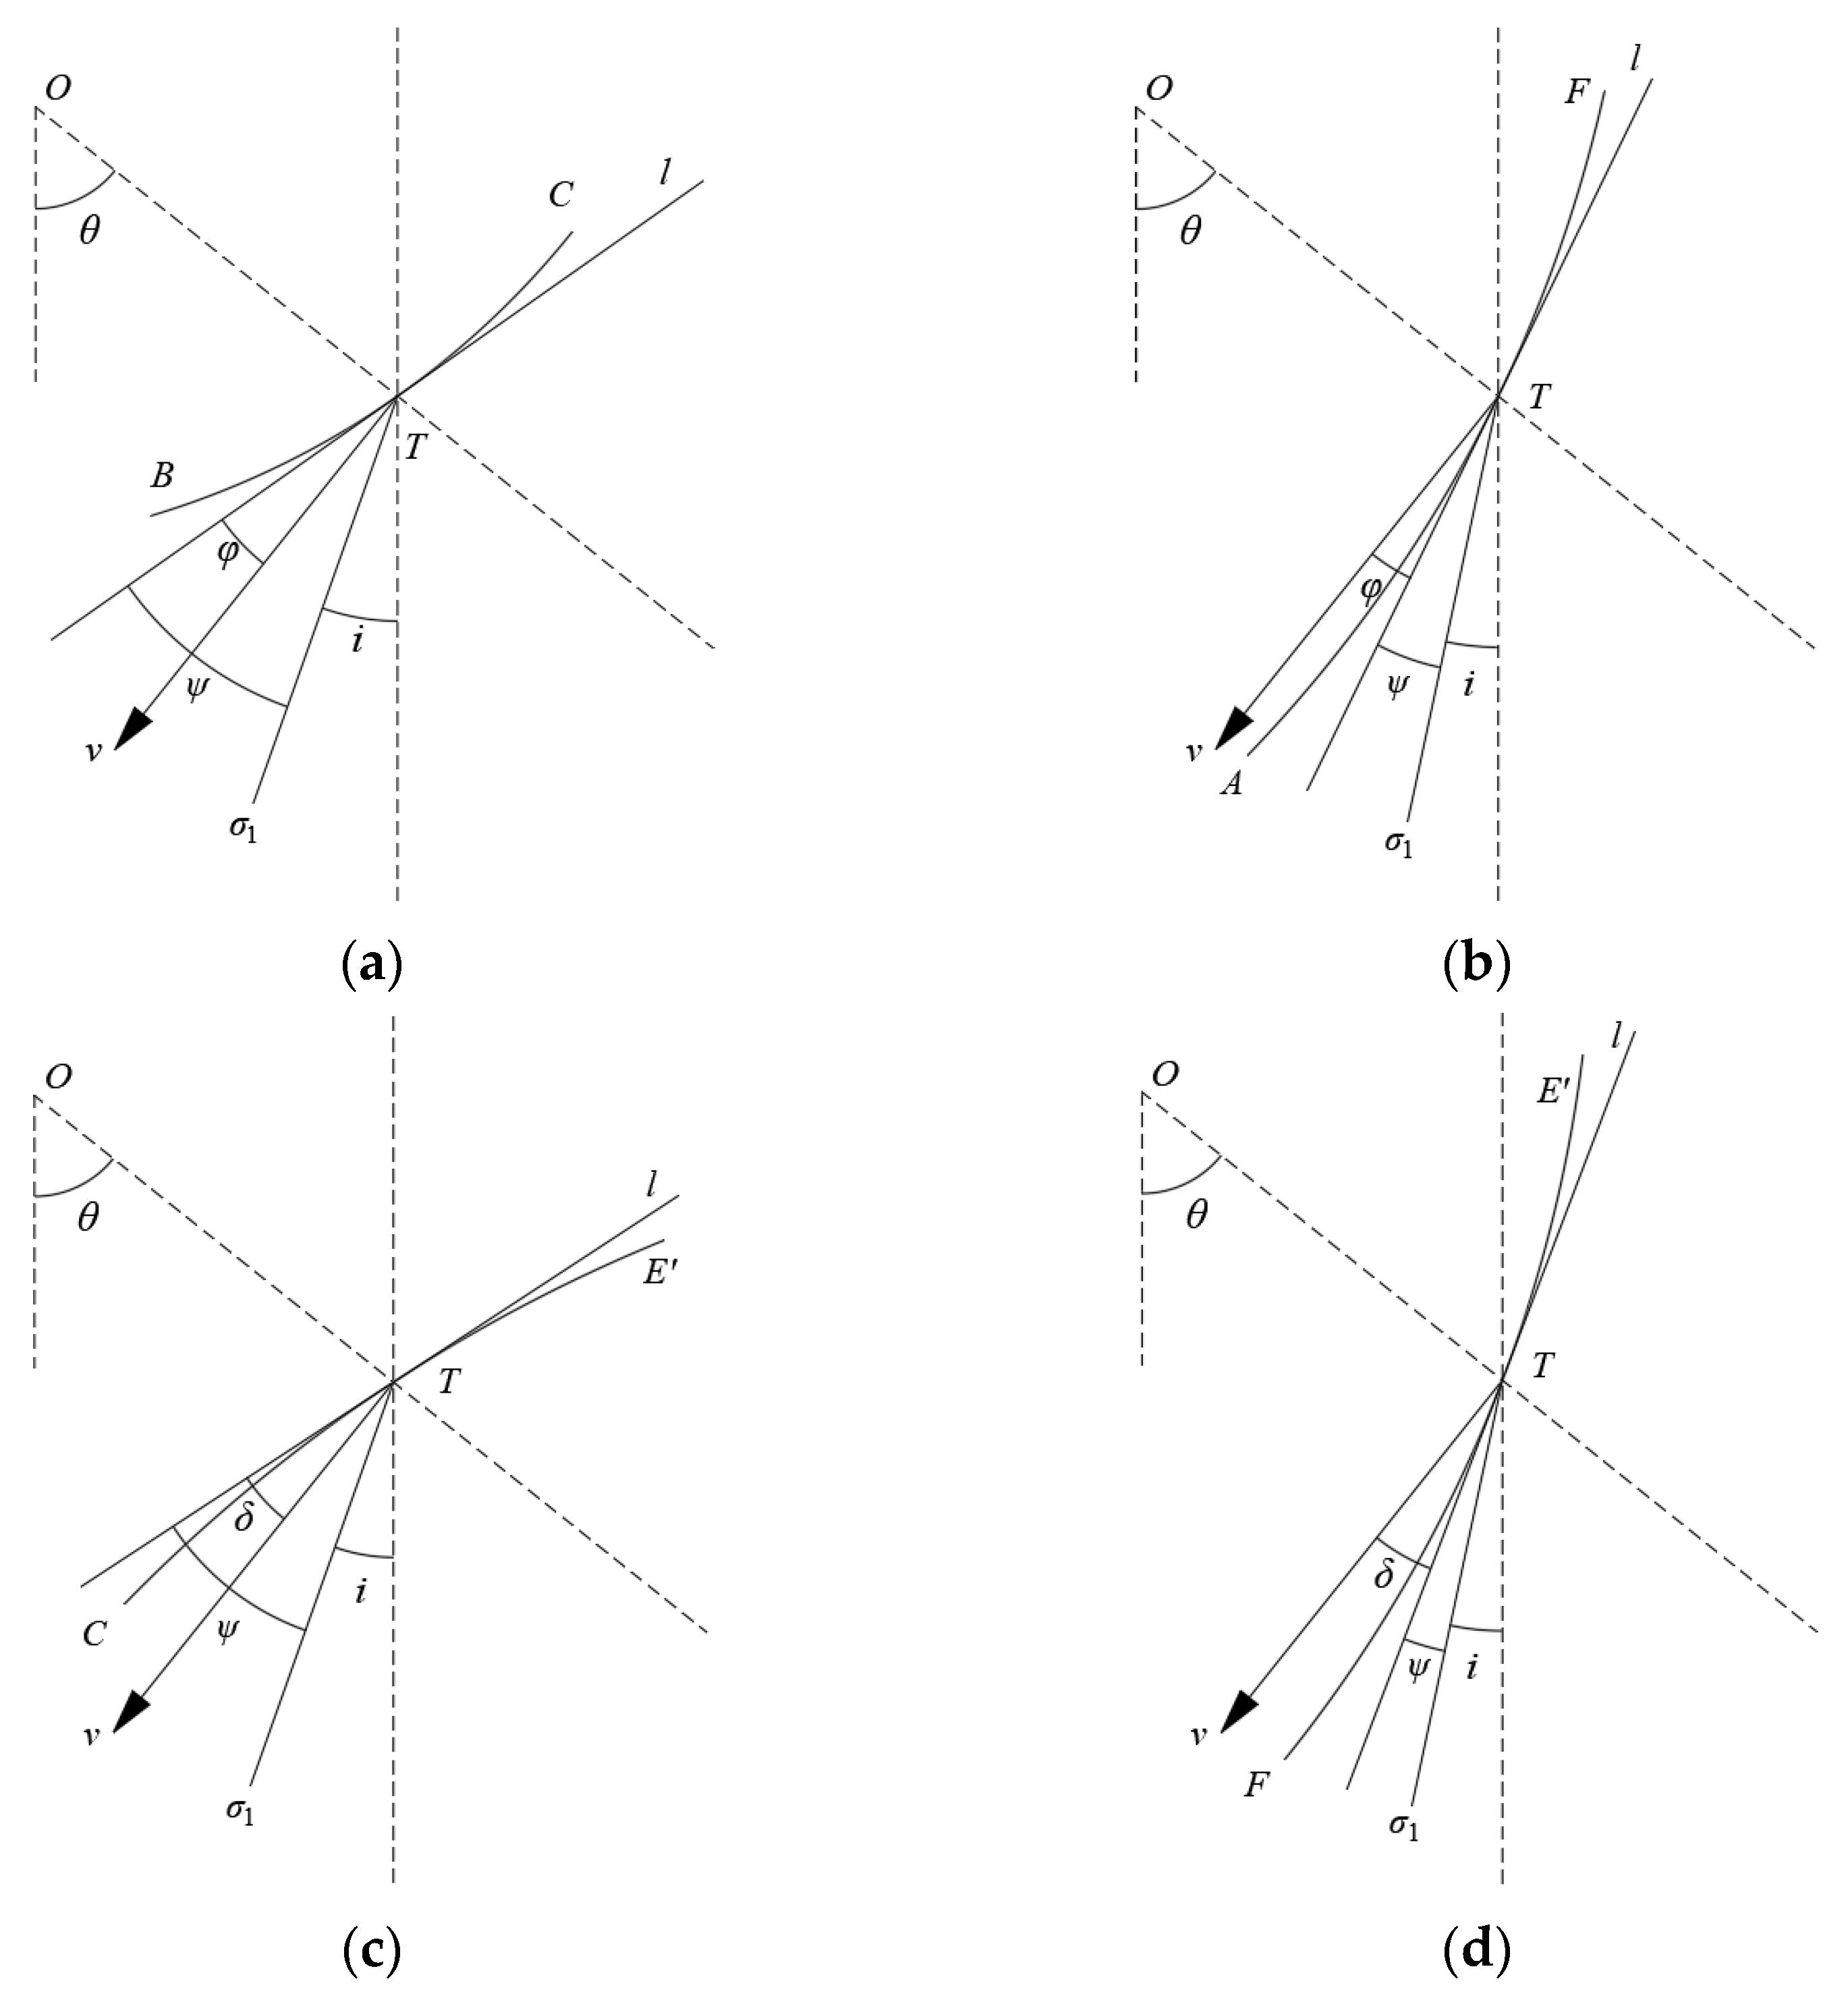
According to the geometric relationship in Figure 4, when θ1 < θ < θ0, the value of i is the following:
i = θ + ψ + φ cos α π / 2
When θ0 < θ < θm, the value of i is the following:
i = θ + ψ + δ θ cos α π / 2

3. Destruction Mode

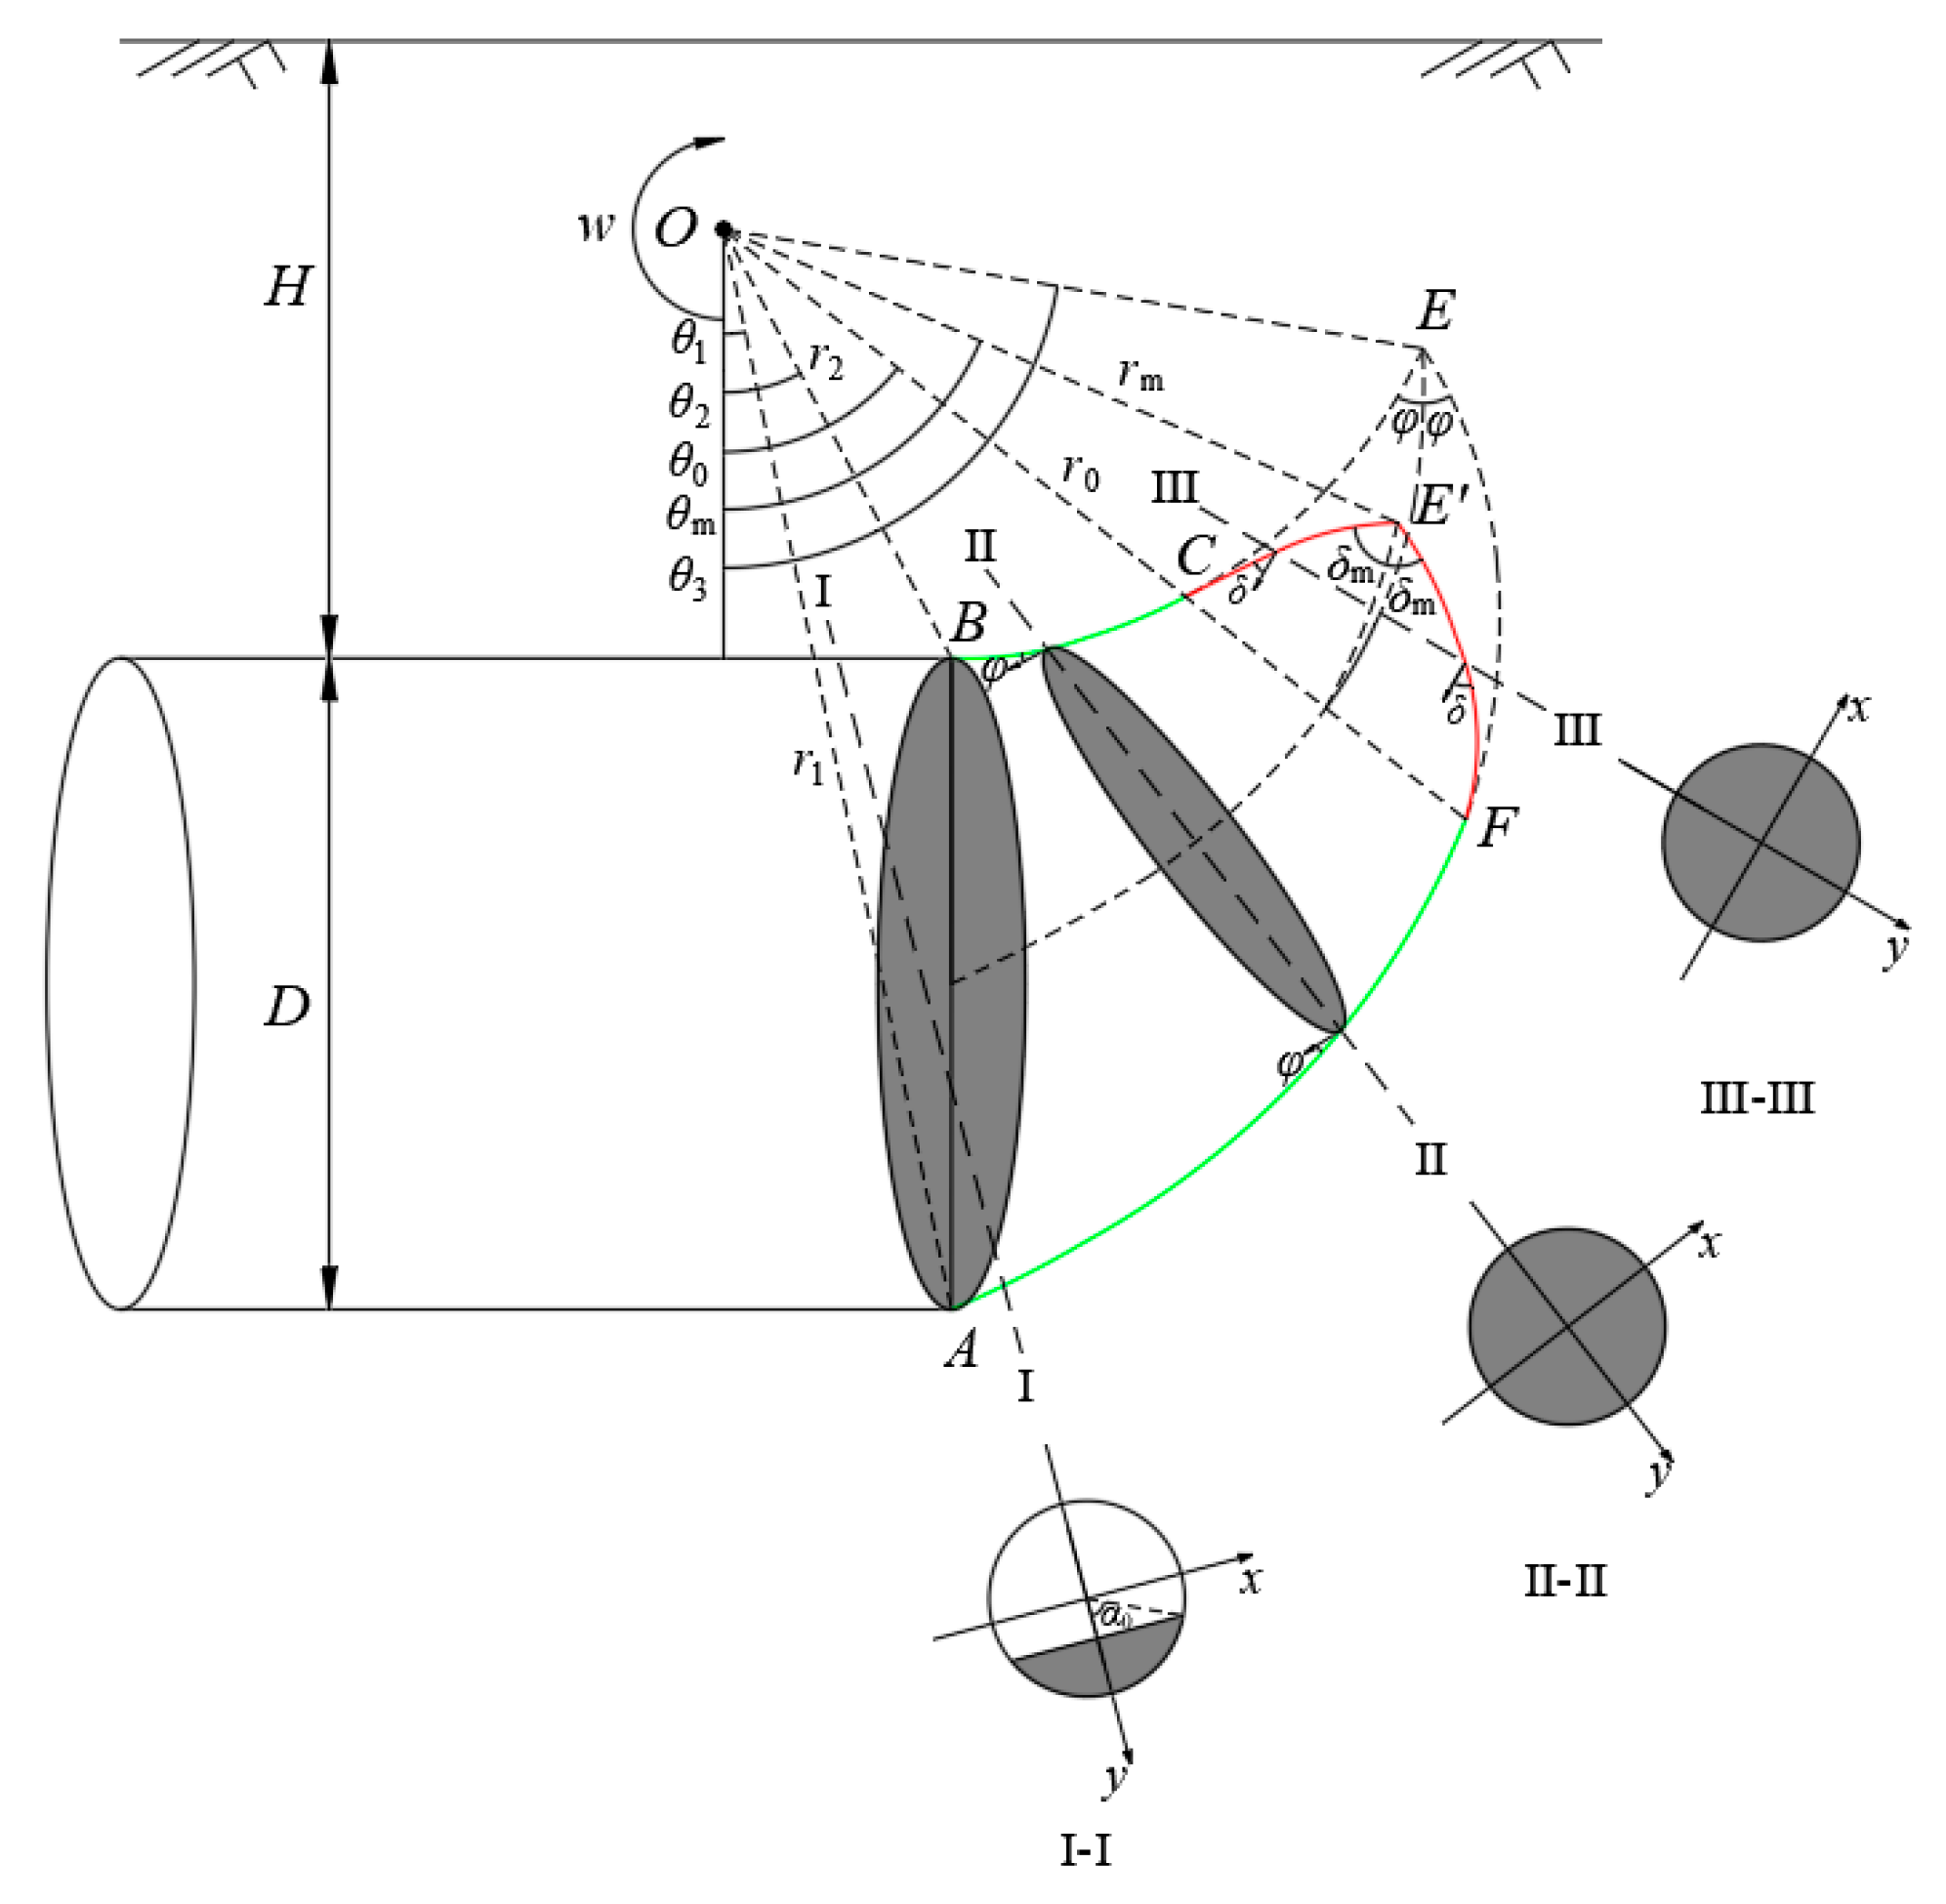
The three-dimensional failure mode of shield tunnelling under tensile strength reduction conditions is shown in Figure 5. H denotes the depth at which the burial occurs, whilst D represents the diameter of the tunnel. According to the compatibility velocity field requirements of the upper limit method of limit analysis, ABCEF rotates around point O at an angular velocity of ω. The angles θ1, θ2, θ0, θm, and θ3 are the angles between OA, OB, OC, OE′, OE, and the perpendicular line. When θ is between θ1 and θ0, the soil fails in a shear fashion, with the upper and lower contours of the sliding block formed by logarithmic spirals BC and AF. The angle between the tangent on BC and AF and the velocity direction is φ. When θ is greater than θ0, the soil failure is tensile shear failure, and the upper and lower contours of the sliding block are formed by curves CE′ and FE′, respectively. The angle between the tangents on CE′ and FE’ and the velocity direction is δ(θ). At this point, the CE′ and FE′ cease to follow logarithmic spiral patterns, instead adopting trajectories governed by δ(θ). Within this range, the value of δ varies linearly with the rotation angle θ from φ to δm. Therefore, δ(θ) can be written as follows:
δ θ = δ m φ θ m θ 0 θ θ 0 + φ
From the geometric relationship shown in Figure 5, we can see the following:
r 1 = sin θ 2 sin θ 2 θ 1 D
r 2 = sin θ 1 sin θ 2 θ 1 D
In addition, the expressions for AF, BF, FE′, and CE′ are as follows:
r AF θ = r 1 exp θ 1 θ tan φ r BF θ = r 2 exp θ θ 2 tan φ r FE θ = r 0 exp θ 0 θ tan δ θ d θ r CE θ = r 0 exp θ 0 θ tan δ θ d θ
Among them are the following:
r 0 = r 1 exp θ 1 θ 0 tan φ
r 0 = r 2 exp θ 0 θ 2 tan φ
At point E′, the curves CE′ and FE′ intersect, with δ reaching its maximum value, δm. At this point, rFE′ (θm) = rCE′ (θm) can be derived from the following equation:
cos δ m = exp δ m φ 2 θ m θ 0 ln r 2 exp θ 0 θ 2 tan φ r 1 exp θ 1 θ 0 tan φ cos φ
To simplify the analysis, the distance from O to the centre of the circular cross-section is defined as rm1 and rm2, while the diameter takes the values R1 and R2, respectively, for different rotation angles, as shown below:
r m 1 = r AD θ + r BD θ 2 , θ 1 < θ < θ 0 r m 2 = r DE θ + r D E θ 2 , θ 0 < θ < θ m
R 1 = r AD θ r BD θ 2 , θ 1 < θ < θ 0 R 2 = r DE θ r D E θ 2 , θ 0 < θ < θ m
In section I-I, the longitudinal coordinate of the circle intersecting the working surface is l, and the angle between it and the y-axis is α0. According to the geometric relationship, we obtain the following:
cos α 0 = l R 1
r m 1 + l = r 2 sin θ 2 sin θ

4. Upper Bound Solution

According to the upper limit theorem of limit analysis, the following assumptions need to be made [14]:
(1)
Assume that the rock mass is an ideal elastic–plastic material and obeys the associated flow law.
(2)
Assume that the failure body is a rigid body, and its volume does not change during the failure process, with energy dissipated only along the velocity discontinuity line.
(3)
Assume that, after applying a uniformly distributed minimum support force to the working face in the horizontal direction to the right, the failure body is in a limit state.

4.1. Gravitational Work Power

As shown in Figure 5, the energy resulting from the destructive mass’s own weight splits into two parts, namely, the power Pγ1 generated by the compression–shear destructive region ABCF and the power Pγ2 generated by the tension–shear destructive region CE′F, as shown below:
P γ 1 = 2 ω γ θ 1 θ 2 l R 1 0 R 1 2 y 2 r m 1 + y 2 sin θ d x d y d θ + θ 2 θ 0 R 1 R 1 0 R 1 2 y 2 r m 1 + y 2 sin θ d x d y d θ
P γ 2 = 2 ω γ θ 0 θ m R 2 R 2 0 R 2 2 y 2 r m 2 + y 2 sin θ d x d y d θ
In summary, the Pγ resulting from the destructive mass’s self-weight is defined as follows:
P γ = P γ 1 + P γ 2

4.2. Internal Energy Dissipation

As shown in Figure 1, when the tensile strength envelope is truncated under stress conditions, the internal energy dissipation rate per unit area on the sliding surface is formulated as the dot product of the traction force T and velocity vectors v [35]:
P 0 = v f c 1 sin δ 2 + f t sin δ sin φ 1 sin φ
Figure 1c shows what happens when the minimum tensile strength is reduced. Parameters fc and fm are determined based on the Mohr–Coulomb strength criterion:
f c = 2 c cos φ 1 sin φ f m = 2 c cos φ 1 + sin φ
The per-unit-area energy dissipation rate for the sliding surface may be derived using Equations (20) and (21) [35]:
P 0 = c v cos φ 1 sin δ 1 sin φ + 2 ξ sin δ sin φ 1 cos φ
According to Figure 5, the internal energy dissipation rate can be categorised into two components, namely, the power Pv1 of the compression–shear failure region ABCF and the power Pv2 of the tension–shear failure region CE’F, as shown below:
P v 1 = ω R 1 θ 1 θ 2 α 0 α 0 c r m 1 + R 1 cos α 2 d α d θ + θ 2 θ 0 π π c r m 1 + R 1 cos α 2 d α d θ
P v 2 = θ 0 θ m π π ω c R 2 r m 2 + R 2 cos α 2 cos φ 1 sin δ θ 1 sin φ + 2 ξ sin δ θ sin φ cos φ 1 cos δ θ d α d θ
In summary, the internal energy dissipation rate Pv is as follows:
P v = P v 1 + P v 2

4.3. Power Generated by Support Force

Under the assumption that the ultimate support force σ is uniformly distributed as a pressure on the tunnel working face, the external work power PT performed by the support force can be expressed as follows:
P T = 2 ω σ θ 1 θ 2 0 R 1 2 l 2 r m 1 + l 2 cos θ sin θ d x d θ

4.4. Ultimate Support Force

Under the allowable velocity field and boundary conditions at the equilibrium condition, the rate of internal energy dissipation balances the external work power. Consequently, the power resulting from external forces matches the internal energy dissipation rate, which is formulated as follows:
P γ + P T = P V
Based on the above analysis, the formula for σ at the tunnel working face is derived as follows:
σ = P γ P v 2 ω θ 1 θ 2 0 R 1 2 l 2 r m 1 + l 2 cos θ sin θ d x d θ
The preceding equation can be expressed as follows: f (σ, θ1, θ2, θ0, θm) = 0, which must be solved under the constraint condition (29). This equation contains five unknown variables (σ, θ1, θ2, θ0, θm) but only one equation, so it has an infinite number of solutions. In this study, the exhaustive search algorithm implemented in MATLAB R2023a is utilised to address the problem. By substituting the optimized angles θ1, θ2, θ0, and θm into Equation (28), the optimal upper limit solution for σ is obtained. The constraints are formulated based on the geometric configuration depicted in Figure 5, and are expressed as follows:
φ < δ m < π 0 < θ m < π 0 < θ 1 < θ 2 < π / 2 θ 2 < θ 0 < π

5. Comparative Verification

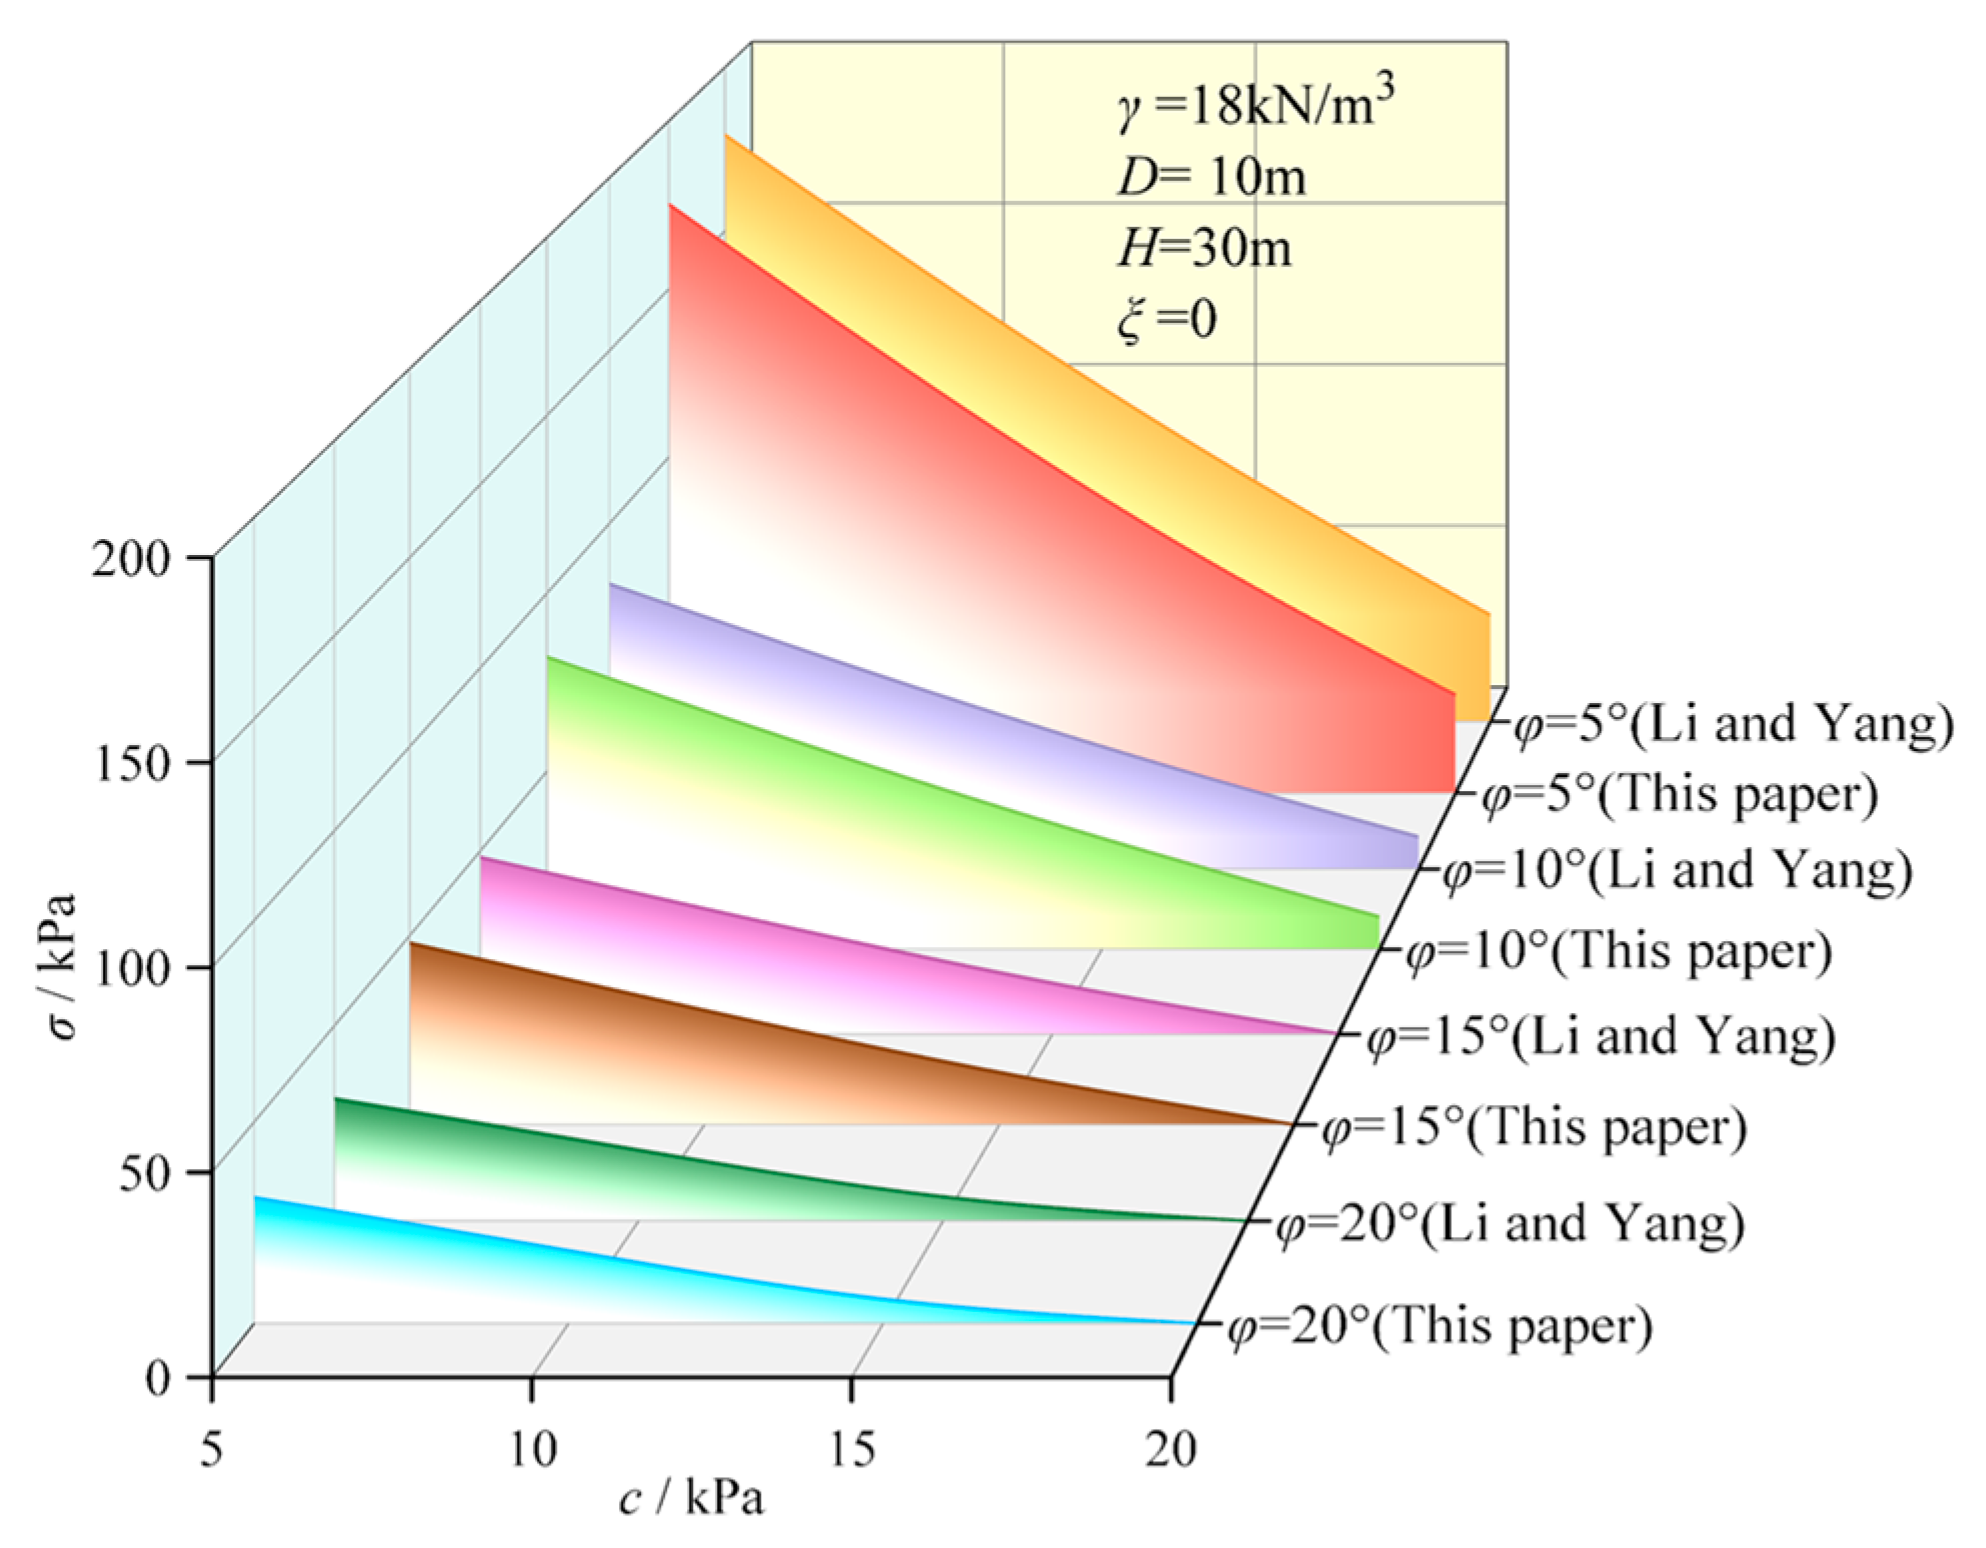
Li and Yang [39] revised the Mohr–Coulomb failure criterion through the integration of a tensile strength reduction factor, and employed the limit analysis technique to determine the upper limit of the support force at the tunnel face. This paper adopts the same computational parameters as Li and Yang [39] and compares the results with those reported in the literature by Li and Yang [39]. As shown in Figure 6, the evolution pattern of the ultimate support force in the present study is consistent with the findings of Li and Yang [39]. The relative error is defined as the absolute value of the difference between the results calculated in this paper and those in the reference literature, divided by the results in the reference literature. The specific formula is shown in Formula (30). All subsequent relative errors are compared with the relevant literature using this method, and will not be repeated here. Table 1 indicates that the maximum relative deviation of the ultimate support force derived from the present analysis compared to Li and Yang’s [39] calculations reaches 6.98%, while the minimum deviation is 0.31%. The congruence between the extant findings and those reported by Li and Yang serves to substantiate the validity of the adopted computational approach.
relative   error = σ ( This   paper ) σ ( literature ) σ ( literature ) × 100 %
Zhang and Zhang [38] considered the heterogeneity and anisotropy of the soil, and used the limit analysis method to solve the upper limit of the tunnel working face support force. This paper uses the same calculation parameters as Zhang and Zhang [38] for comparison. The comparison of support forces under different non-homogeneous coefficients is shown in Table 2. The soil parameters are as follows: D = 6 m, H = 12 m, γ = 18 kN/m3, c0 = 6 kPa, φ = 10°, β = 0°, k = 1. In Table 2, the maximum relative difference between the ultimate support force obtained in this paper and the calculation results of Zhang and Zhang [38] is 1.54%, and the minimum is 0.14%. The comparison of support forces under different anisotropy coefficients is shown in Table 3. The soil parameters are as follows: D = 6 m, H = 12 m, γ = 18 kN/m3, c0 = 6 kPa, φ = 10°, β = 0°, ρ = 0 kPa/m. In Table 3, the maximum relative difference between the ultimate support force obtained in this paper and the calculation results of Zhang and Zhang [38] is 4.99%, and the minimum is 0.22%.

6. Results Analysis

6.1. The Influence of Soil Strength Indicators

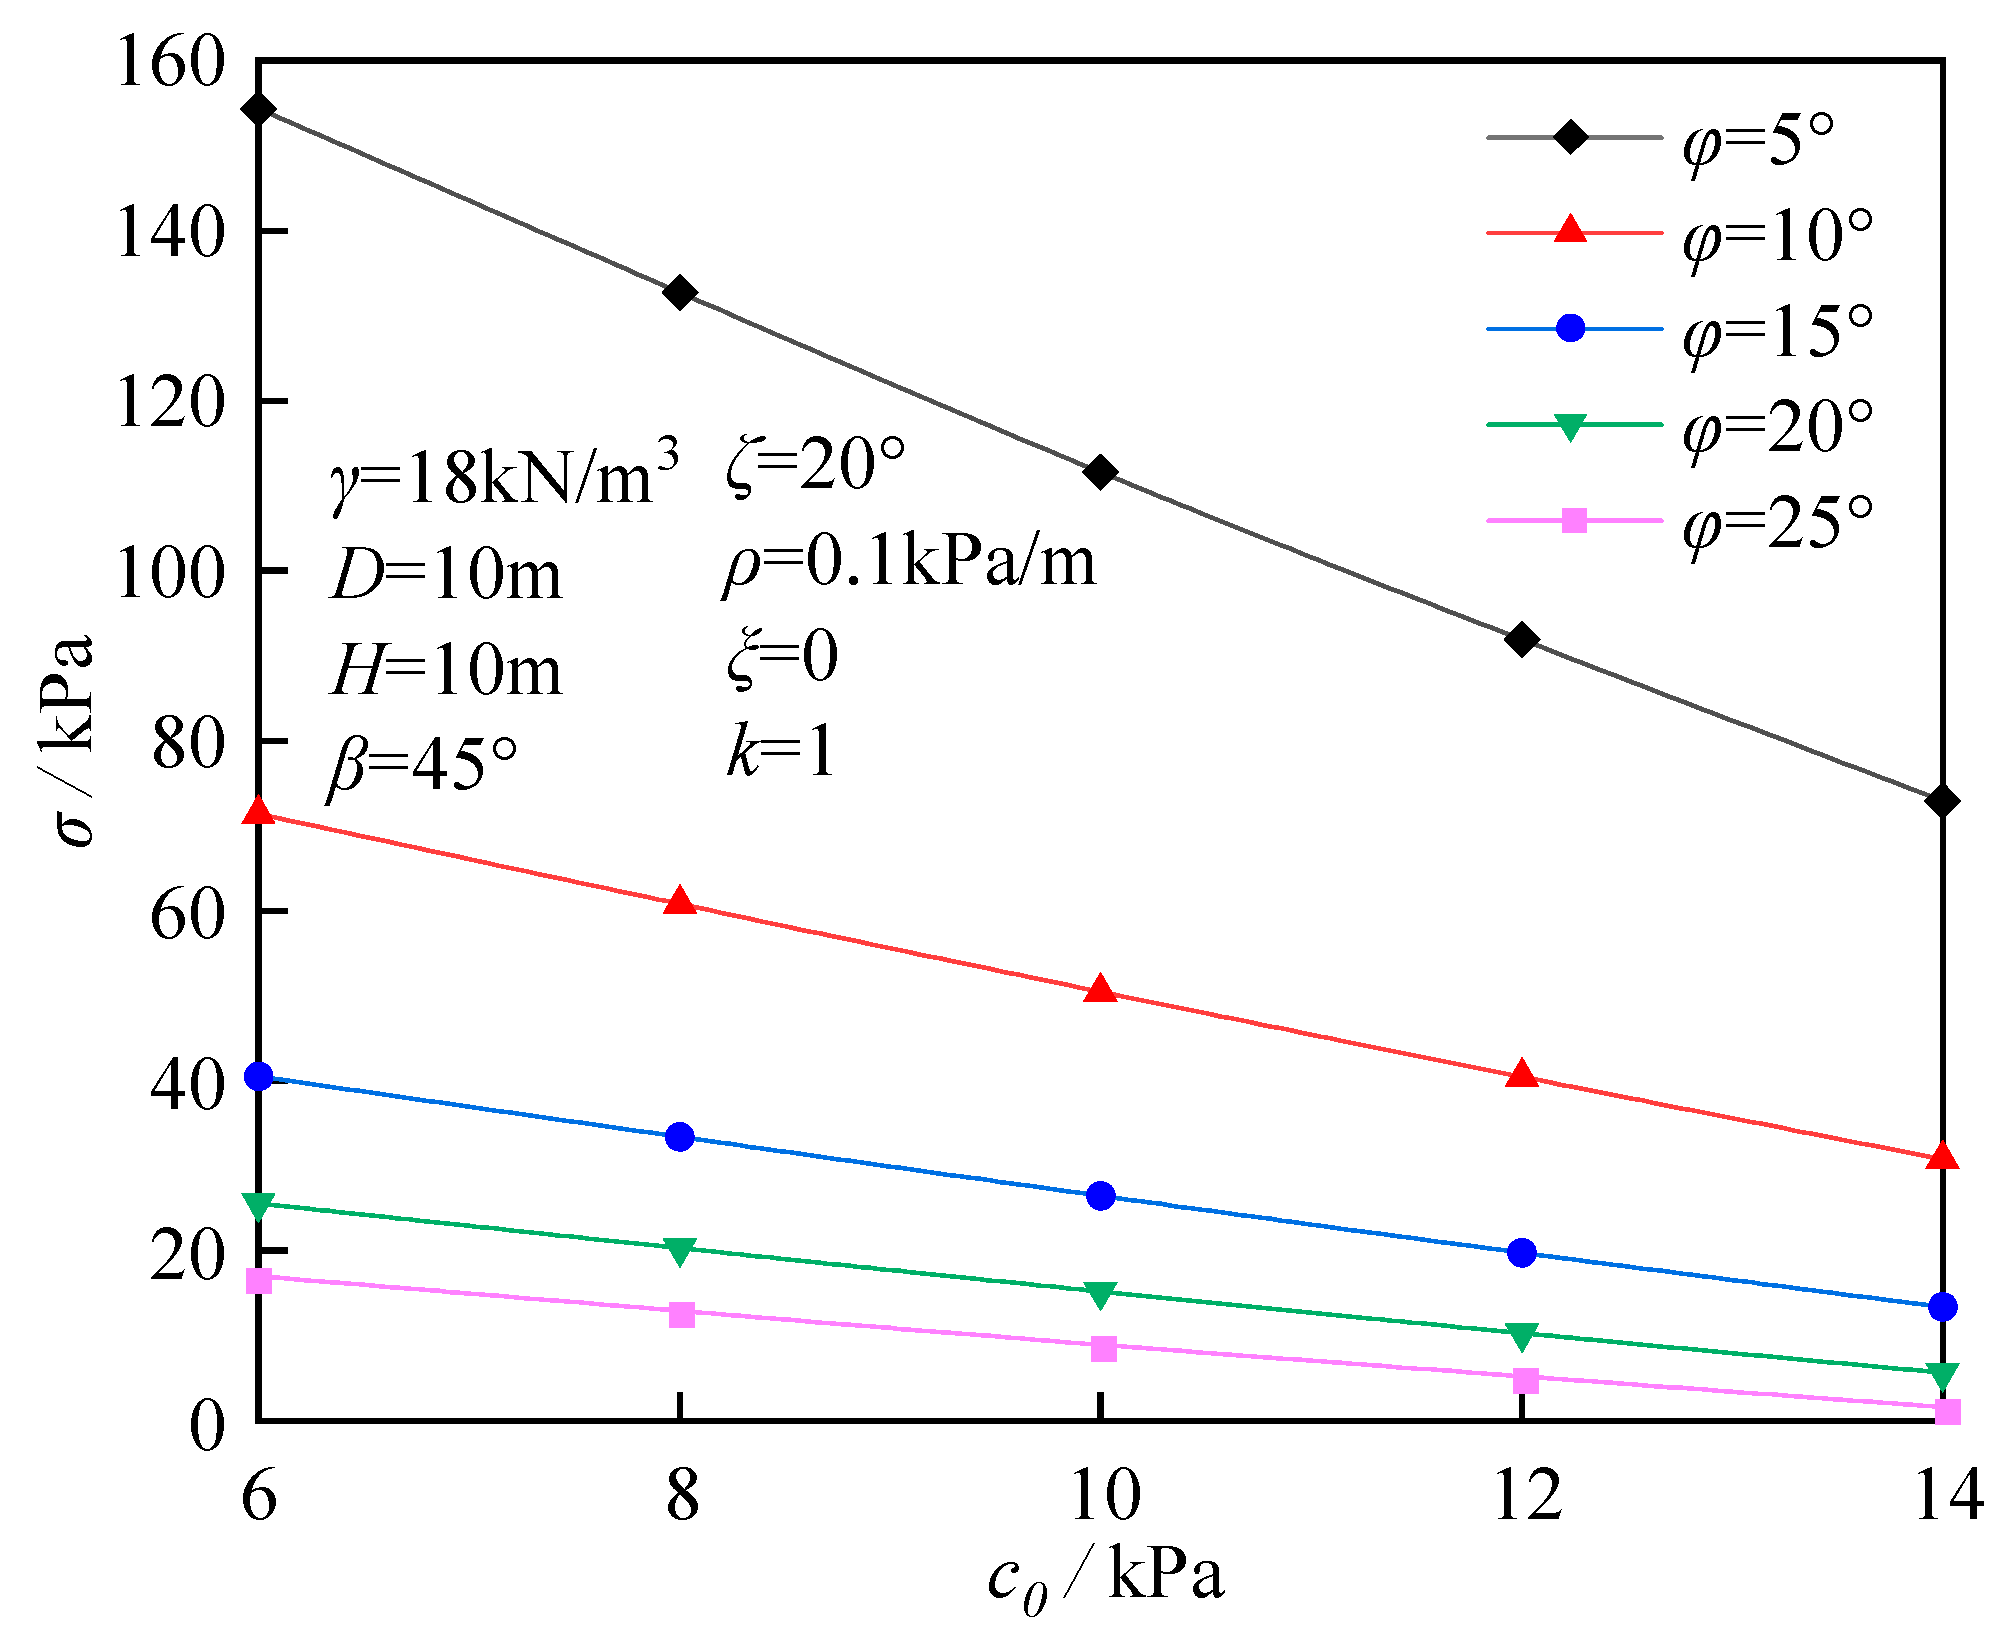
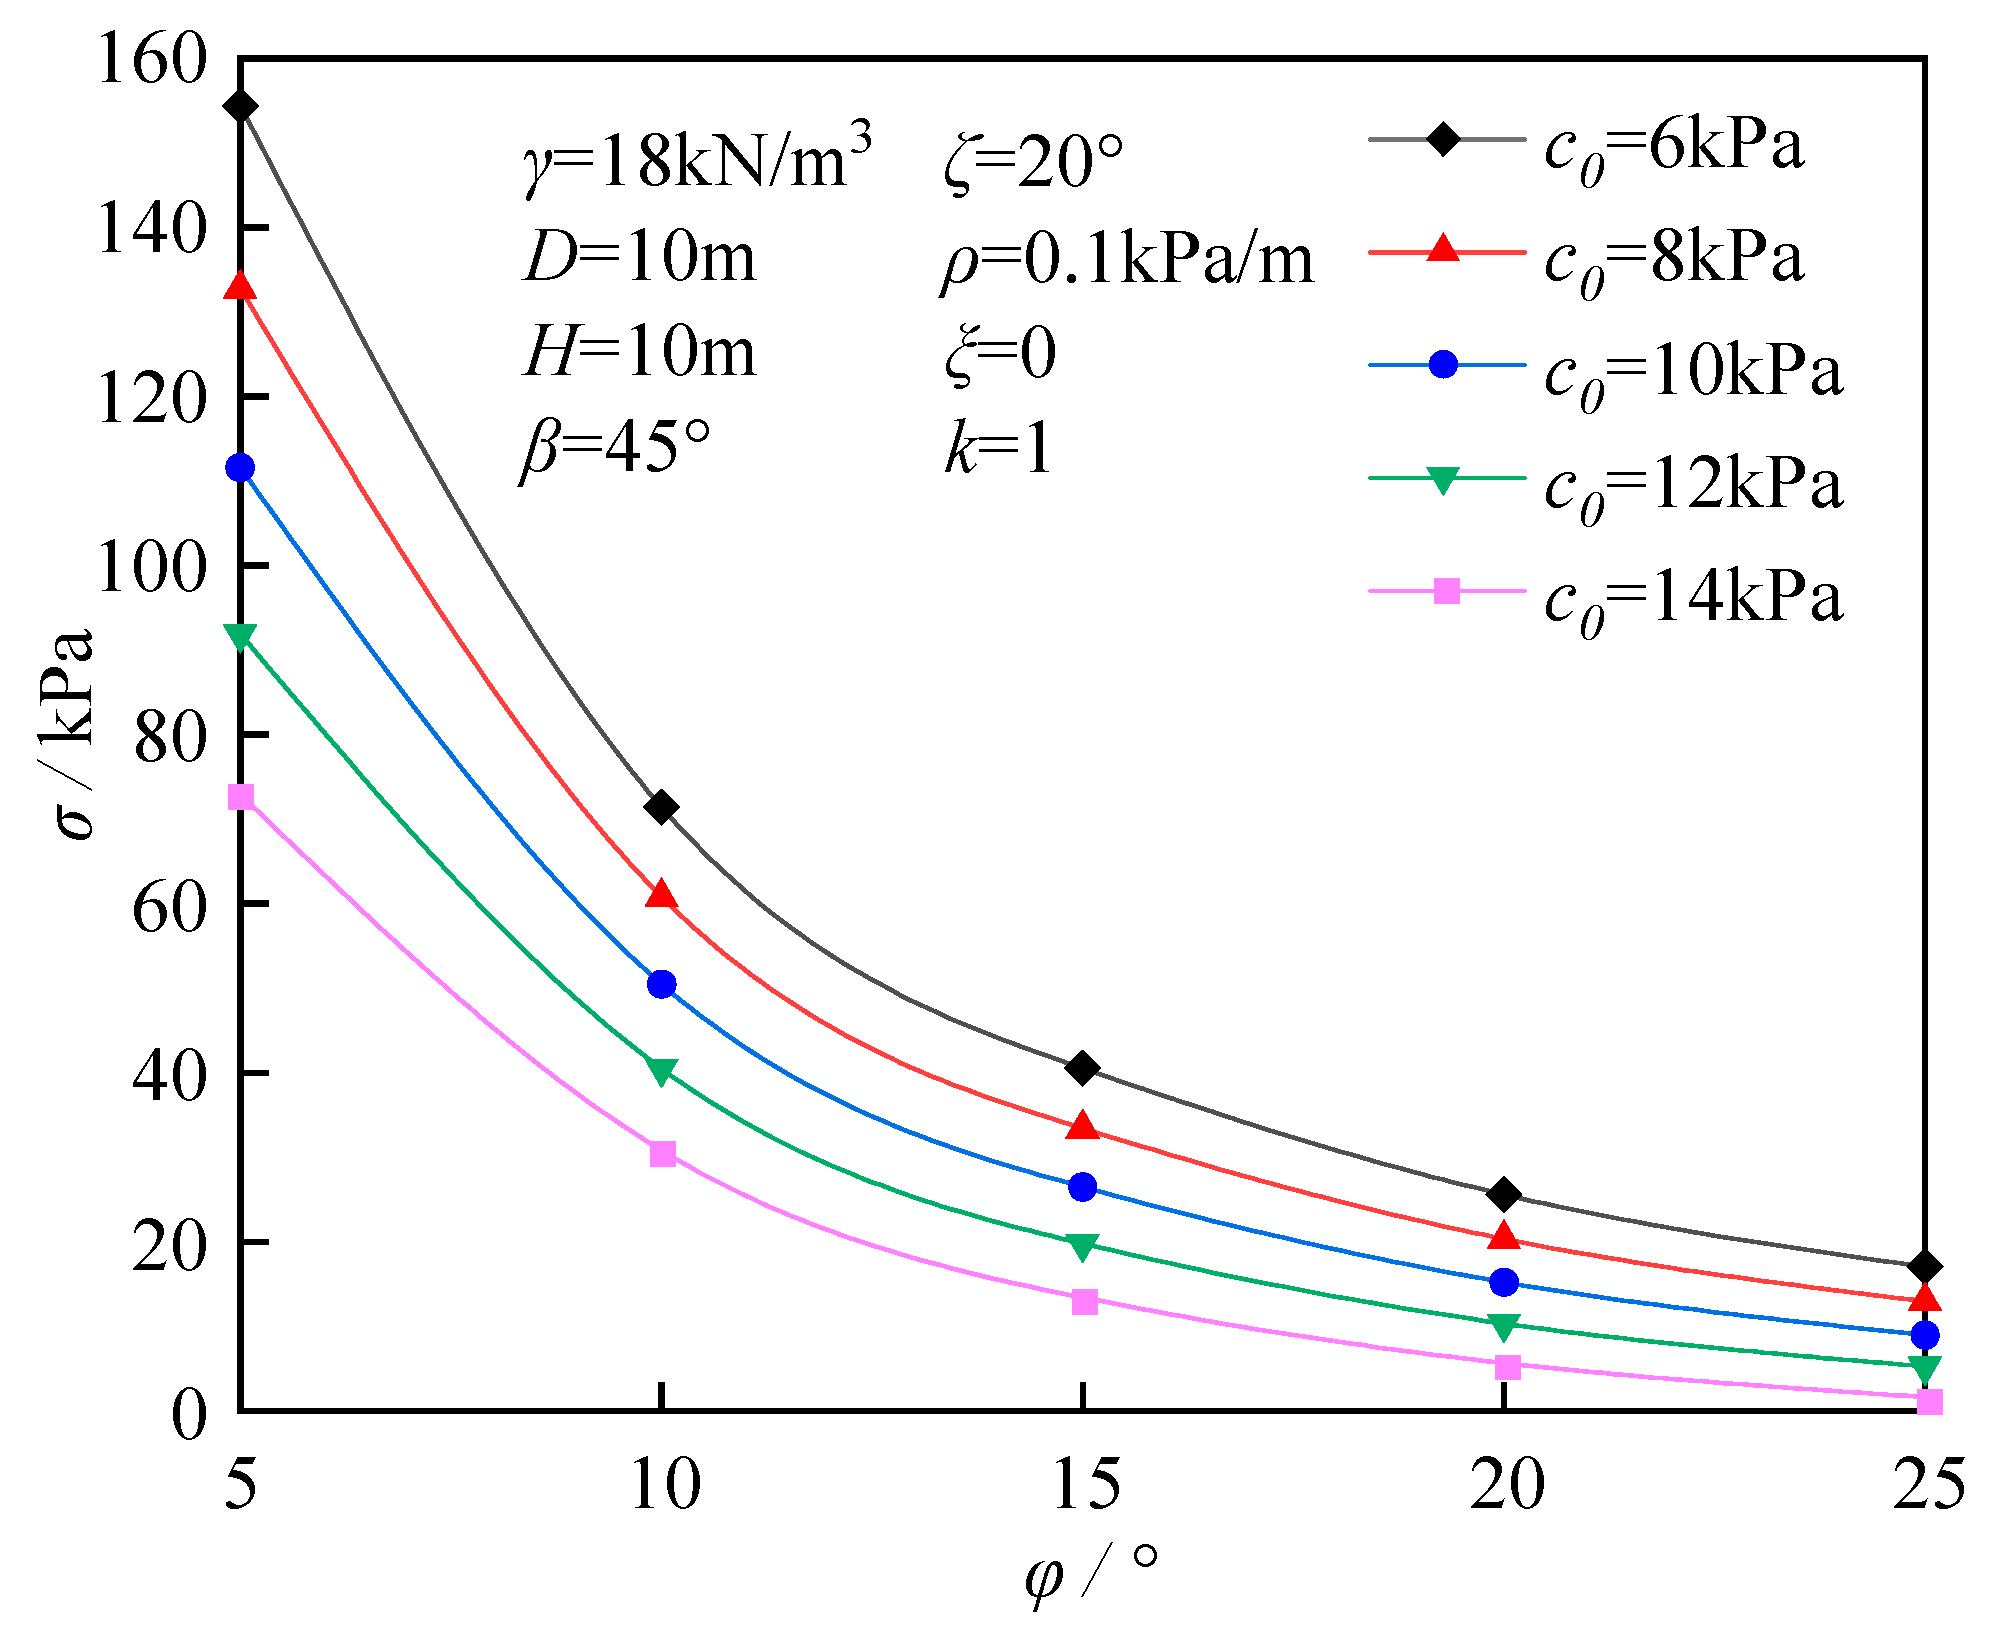
Figure 7 depicts the influence of initial cohesion c0 on the ultimate support force σ. When other parameters remain constant, the parameter σ decreases linearly with increasing initial cohesion c0. As the parameter φ decreases, the slope of this linear relationship gradually increases. This indicates that an increase in initial cohesion c0 enhances tunnel stability, consequently reducing the necessary support force for stability maintenance. The effect of the parameter φ on the parameter σ is illustrated in Figure 8. When other parameters remain constant, an increase in parameter φ is accompanied by a decrease in parameter σ, which exhibits a trend from steep to gradual.

6.2. The Influence of Tensile Strength Reduction Parameter

This section discusses the effect of different tensile strength reduction parameters ξ on the parameter σ. The ultimate support force at the tunnel working face under different ξ values is presented in Table 4. The calculation parameters are listed as follows: γ = 18 kN/m3, D = 10 m, H = 10 m, k = 1, ζ = 0°, ρ = 0 kPa/m, the range of the parameter c0 is 6 kPa to 18 kPa, and the range of the parameter φ is 5° to 25°. As the parameter ξ increases from 0 to 1, the ultimate support force gradually decreases. When the parameter c0 and the parameter φ are small, changes in the parameter ξ have a minimal effect on the ultimate support force. For example, when the parameter c0 is 6 kPa and the parameter φ is 5°, increasing the parameter ξ from 0 to 1 yields a marginal reduction of roughly 0.18% in the ultimate support force. When the parameter c0 and the parameter φ are large, changes in the parameter ξ exert a substantial influence on the ultimate support force. For example, when the parameter c0 is 16 kPa and the parameter φ is 20°, increasing the parameter ξ from 0 to 1 reduces the ultimate support force by approximately 58.32%. At this juncture, in the absence of consideration for tensile strength cut-off, the ultimate support force diminishes by approximately 75.22% in comparison with the scenario where the parameter ξ is set to 0. Analysis indicates that when the parameter c0 is small, the influence of tensile strength cut-off on support force proves negligible; however, when the parameter c0 is large, ignoring this failure mechanism will significantly underestimate the required support force. Therefore, tensile strength cut-off must be considered in support force design, especially in soils with large c0 parameter values.

6.3. The Effect of Nonhomogeneity of Soil

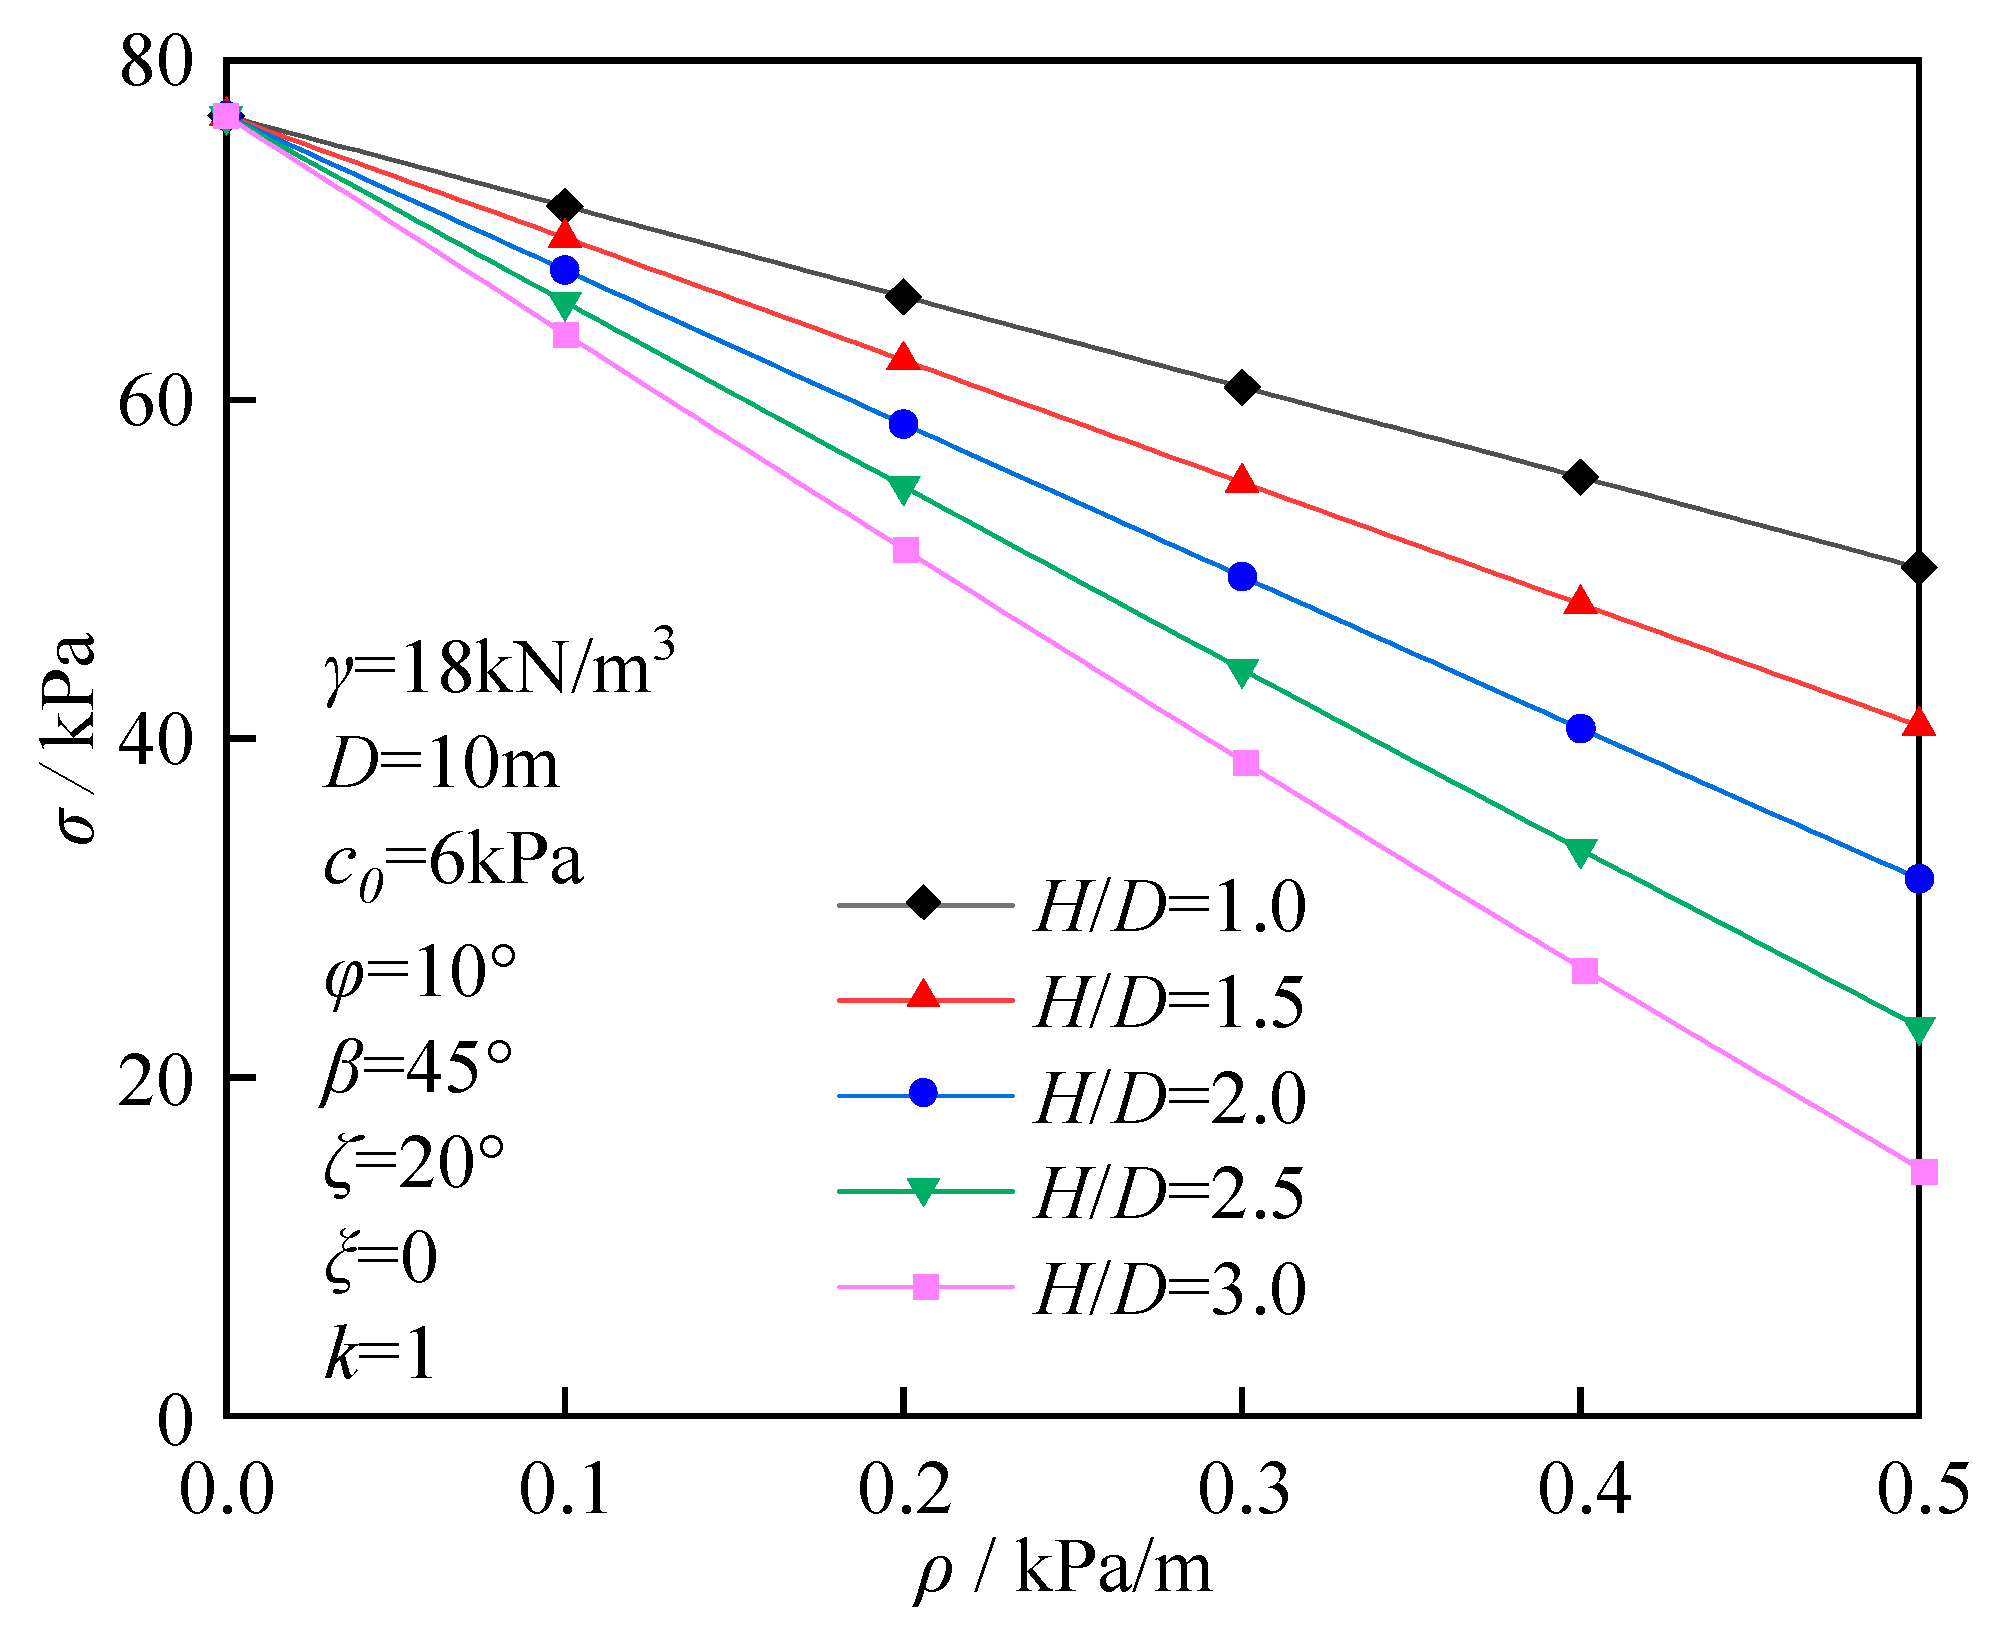
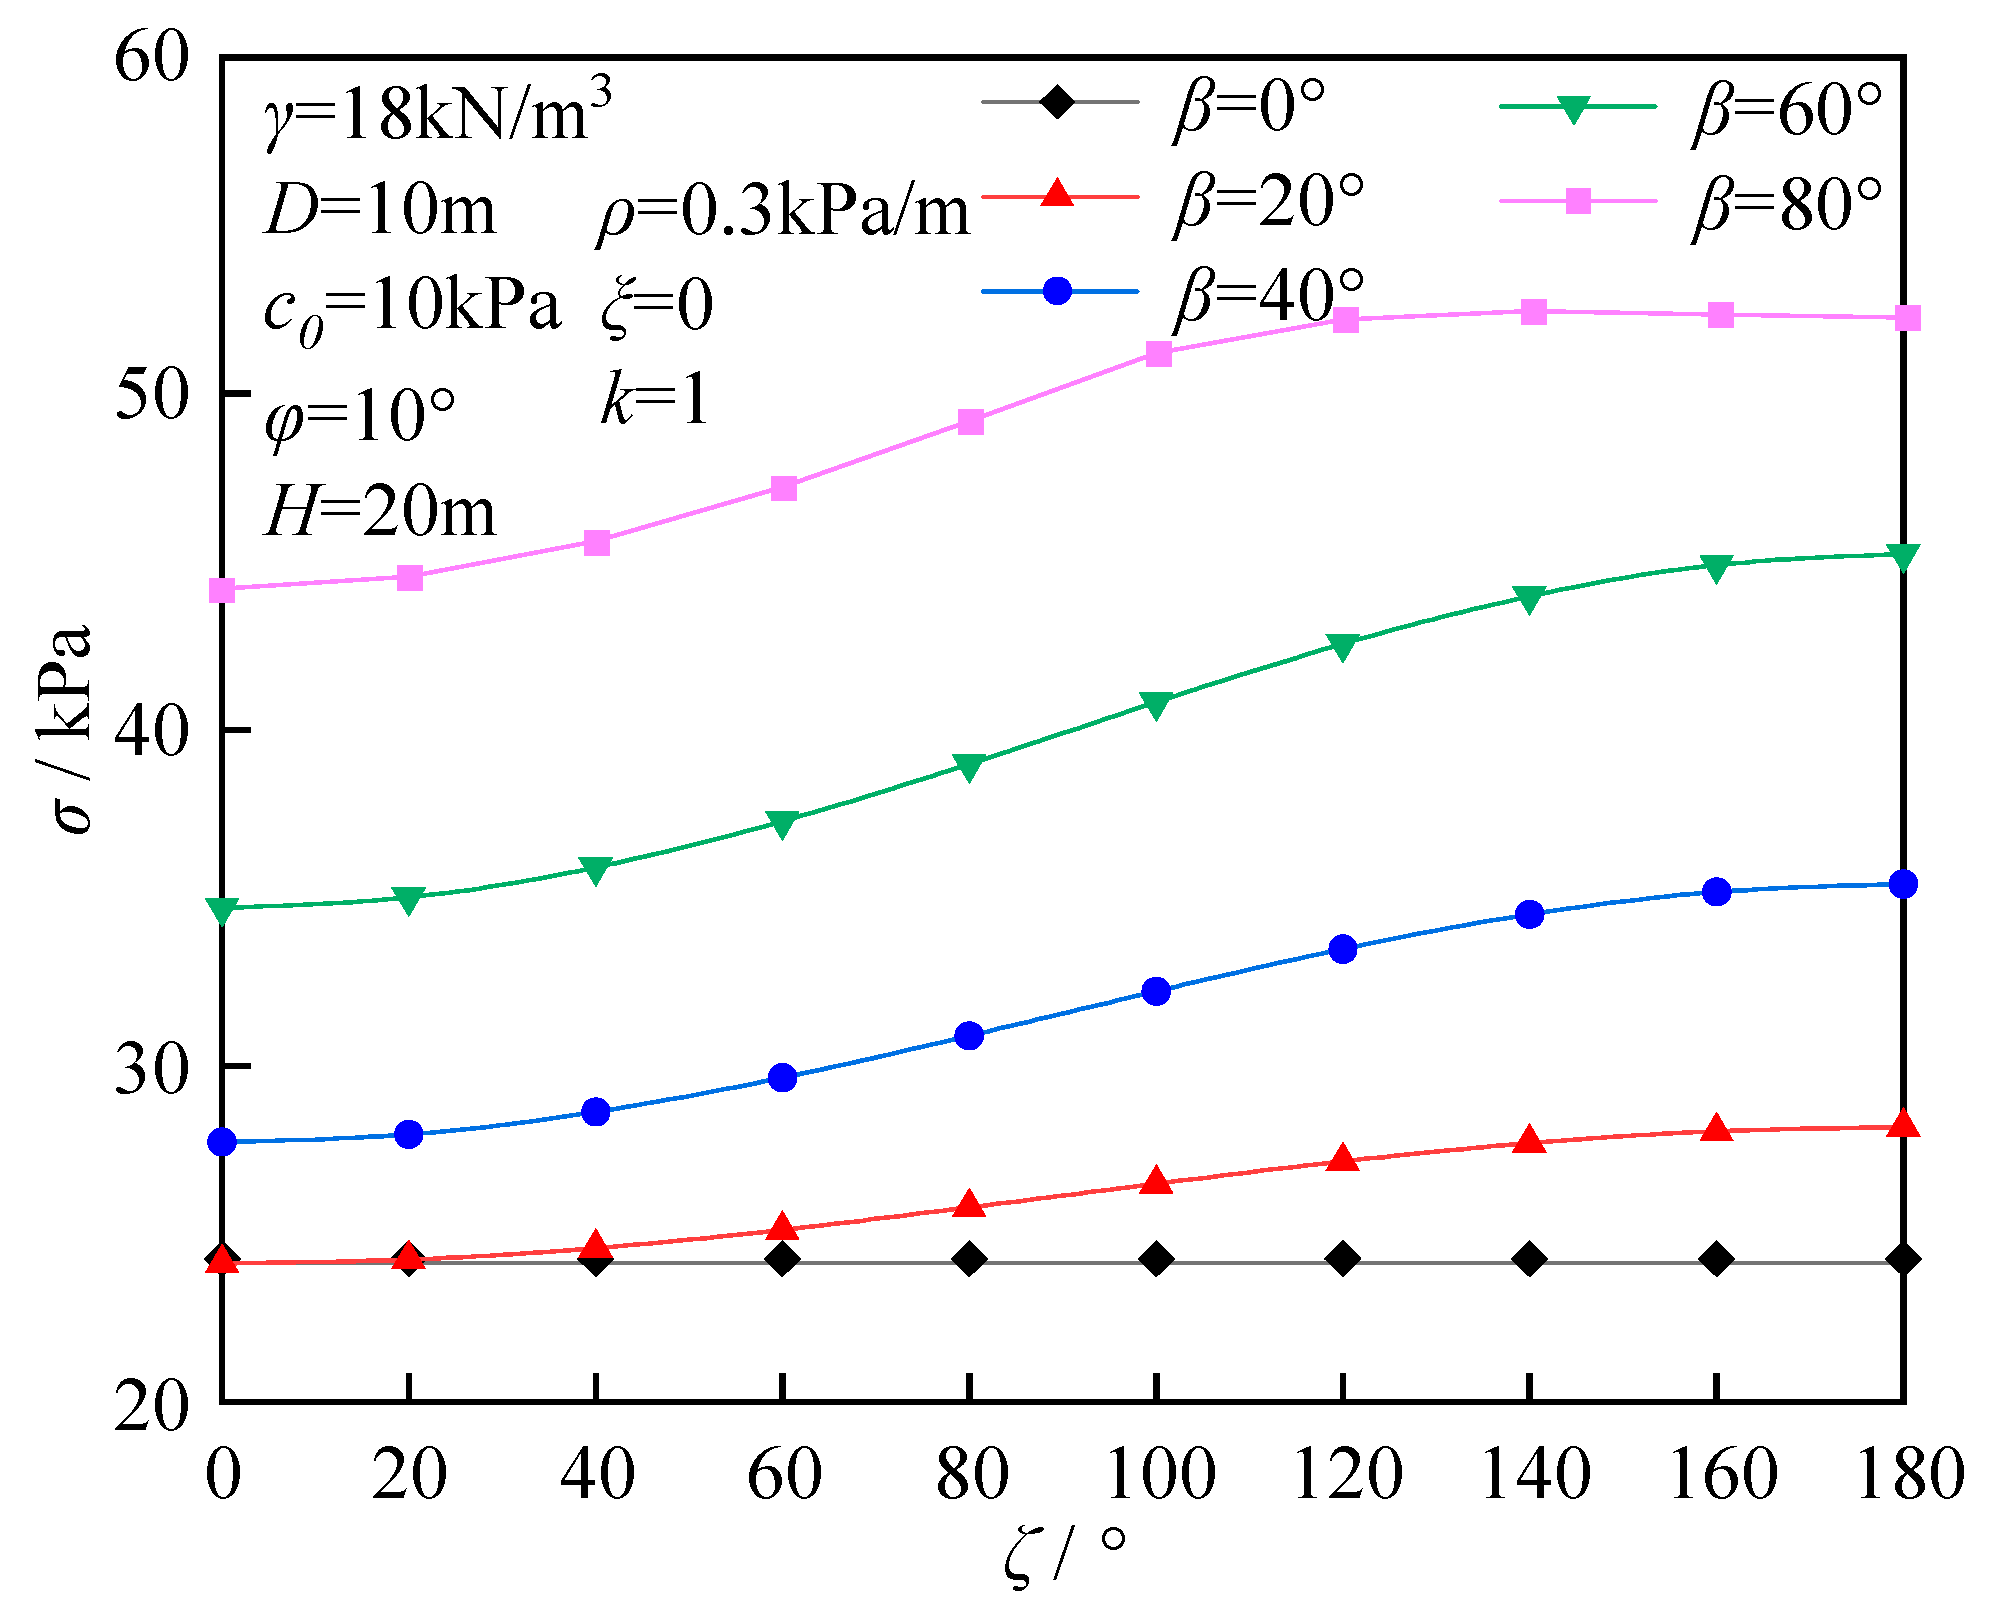
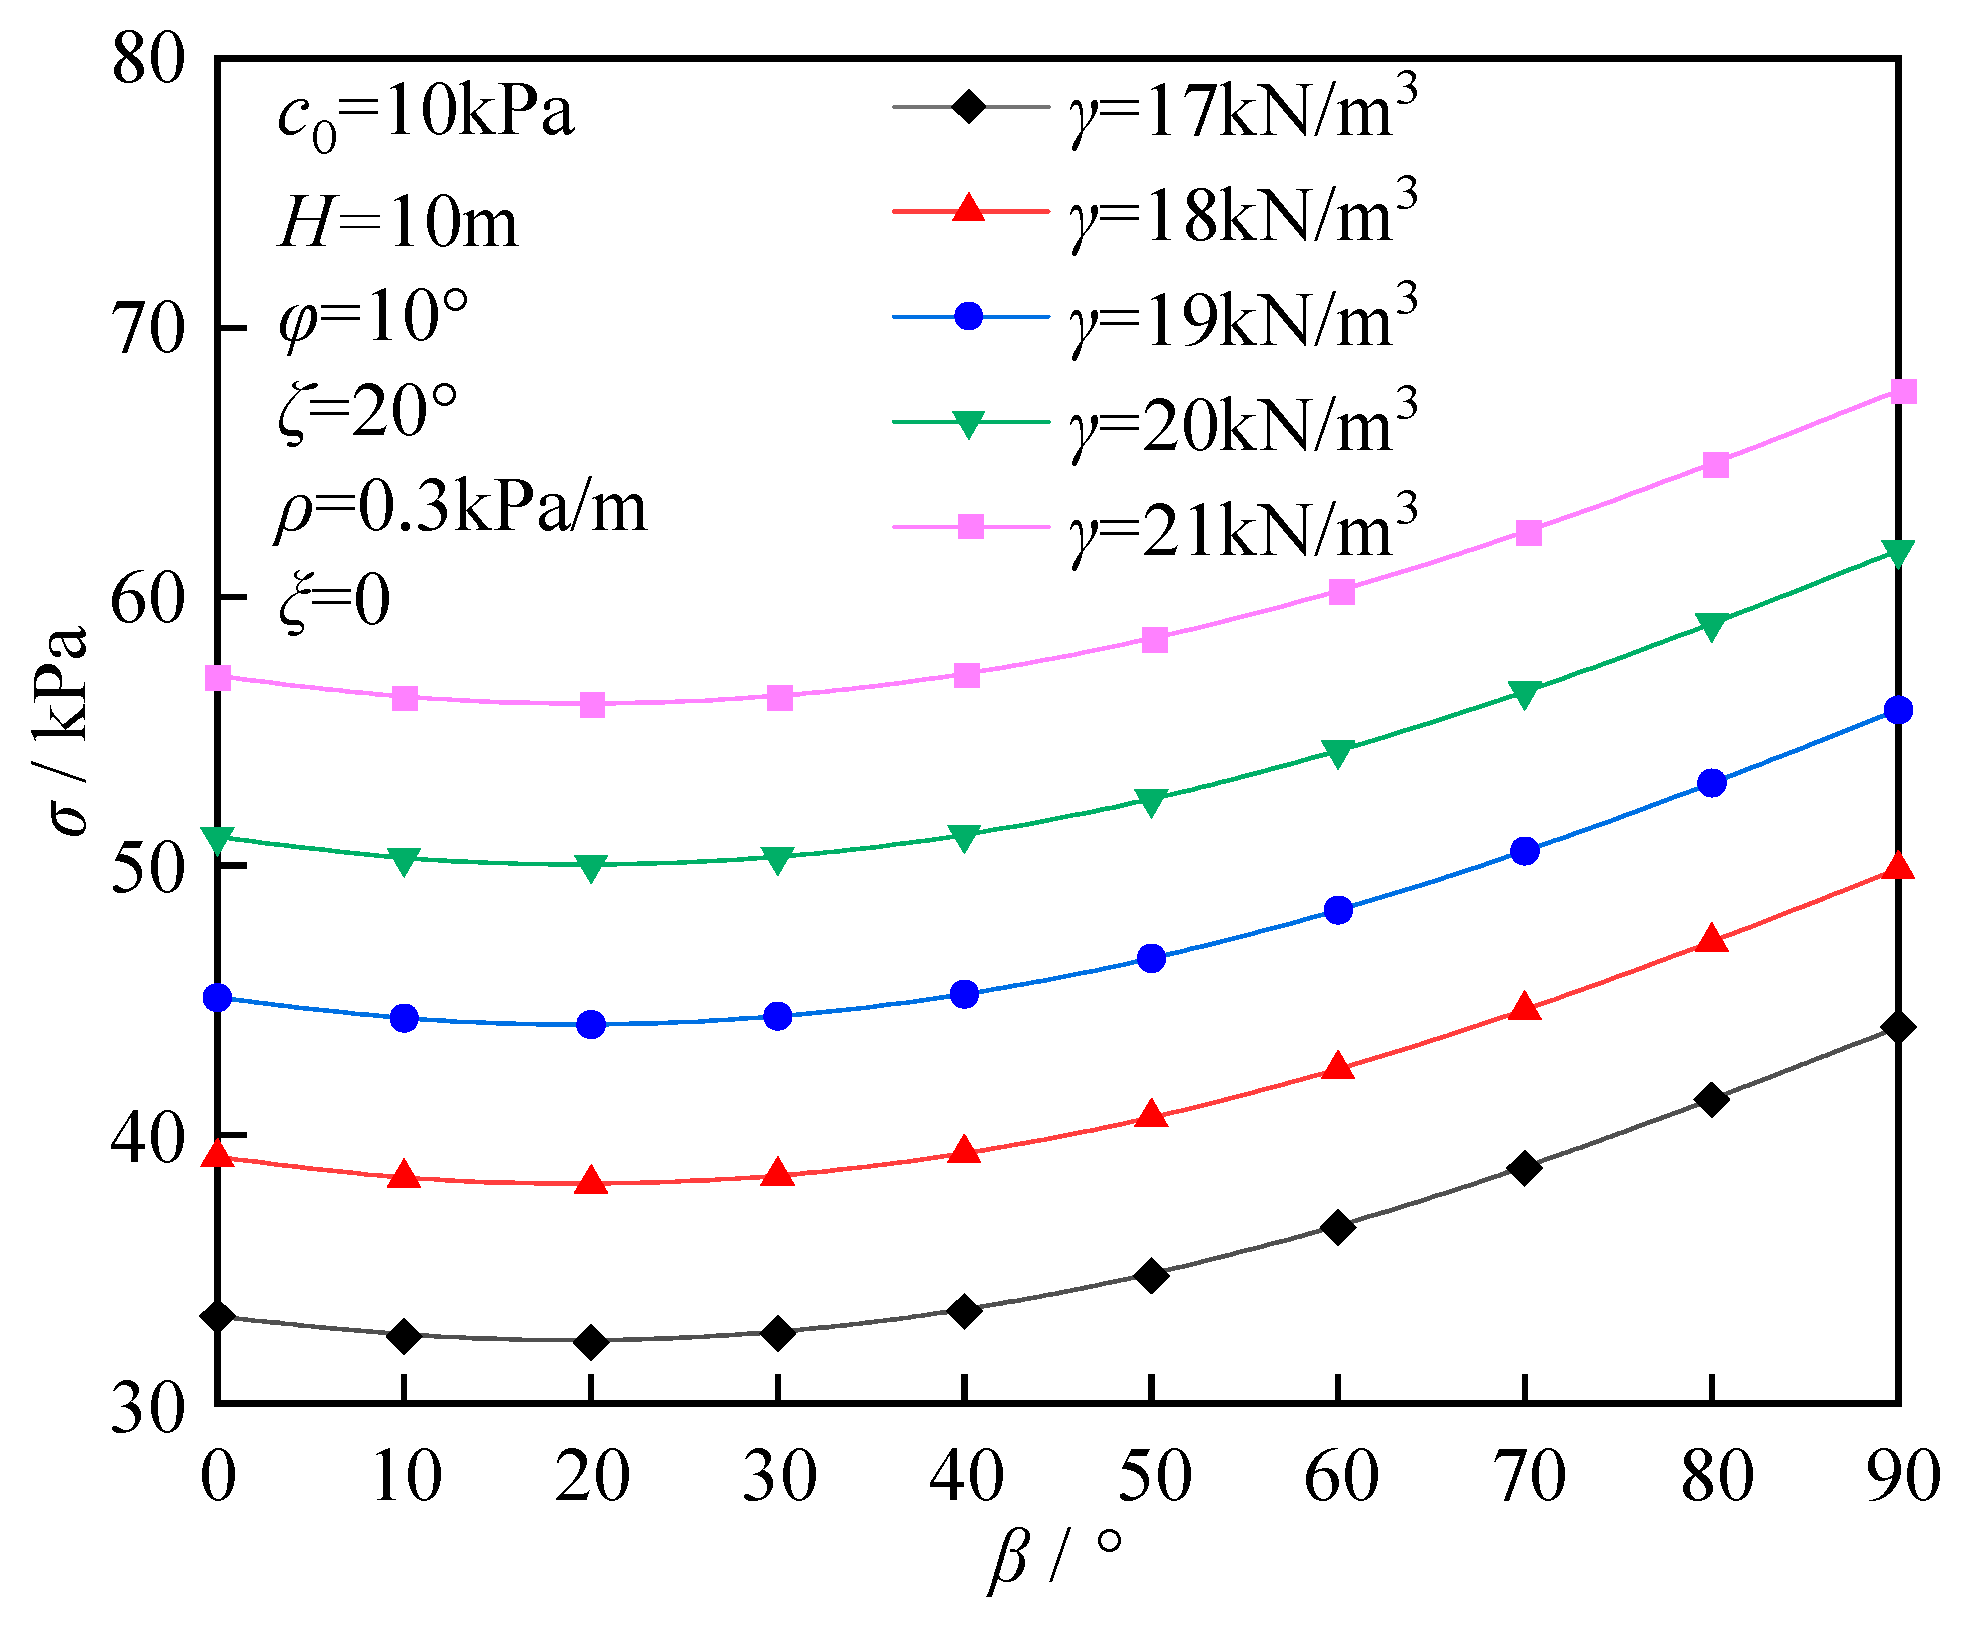
The influence of the nonhomogeneous coefficient ρ on the ultimate support force is shown in Figure 9. As the parameter ρ increases, the ultimate support force decreases linearly; however, as the parameter H/D increases, the slope of this linear relationship gradually increases. When the parameter ρ is 0, the ultimate support force is independent of the parameter H/D. The effect of the nonhomogeneously directional angle ζ on support force is shown in Figure 10. When the parameter β is constant (β ≠ 0), as the parameter ζ increases, the parameter σ increases nonlinearly, with the growth rate first increasing and then decreasing. When the parameter ζ is 90°, the growth rate reaches its maximum value. Additionally, when the parameter ζ is constant, as the parameter β increases, the parameter σ increases nonlinearly. Therefore, when designing the direction of tunnel excavation, reducing the parameter ζ can effectively lower the parameter σ requirements at the working face. The effect of the inclined angle of the soil layer β on the parameter σ is shown in Figure 11. Under identical conditions, as the parameter β increases, the ultimate support force exhibits a nonlinear change, first decreasing and then increasing, reaching a minimum value when the parameter β is between 10° and 30°. When the parameter β is constant, the parameter σ increases linearly with increasing soil weight γ.
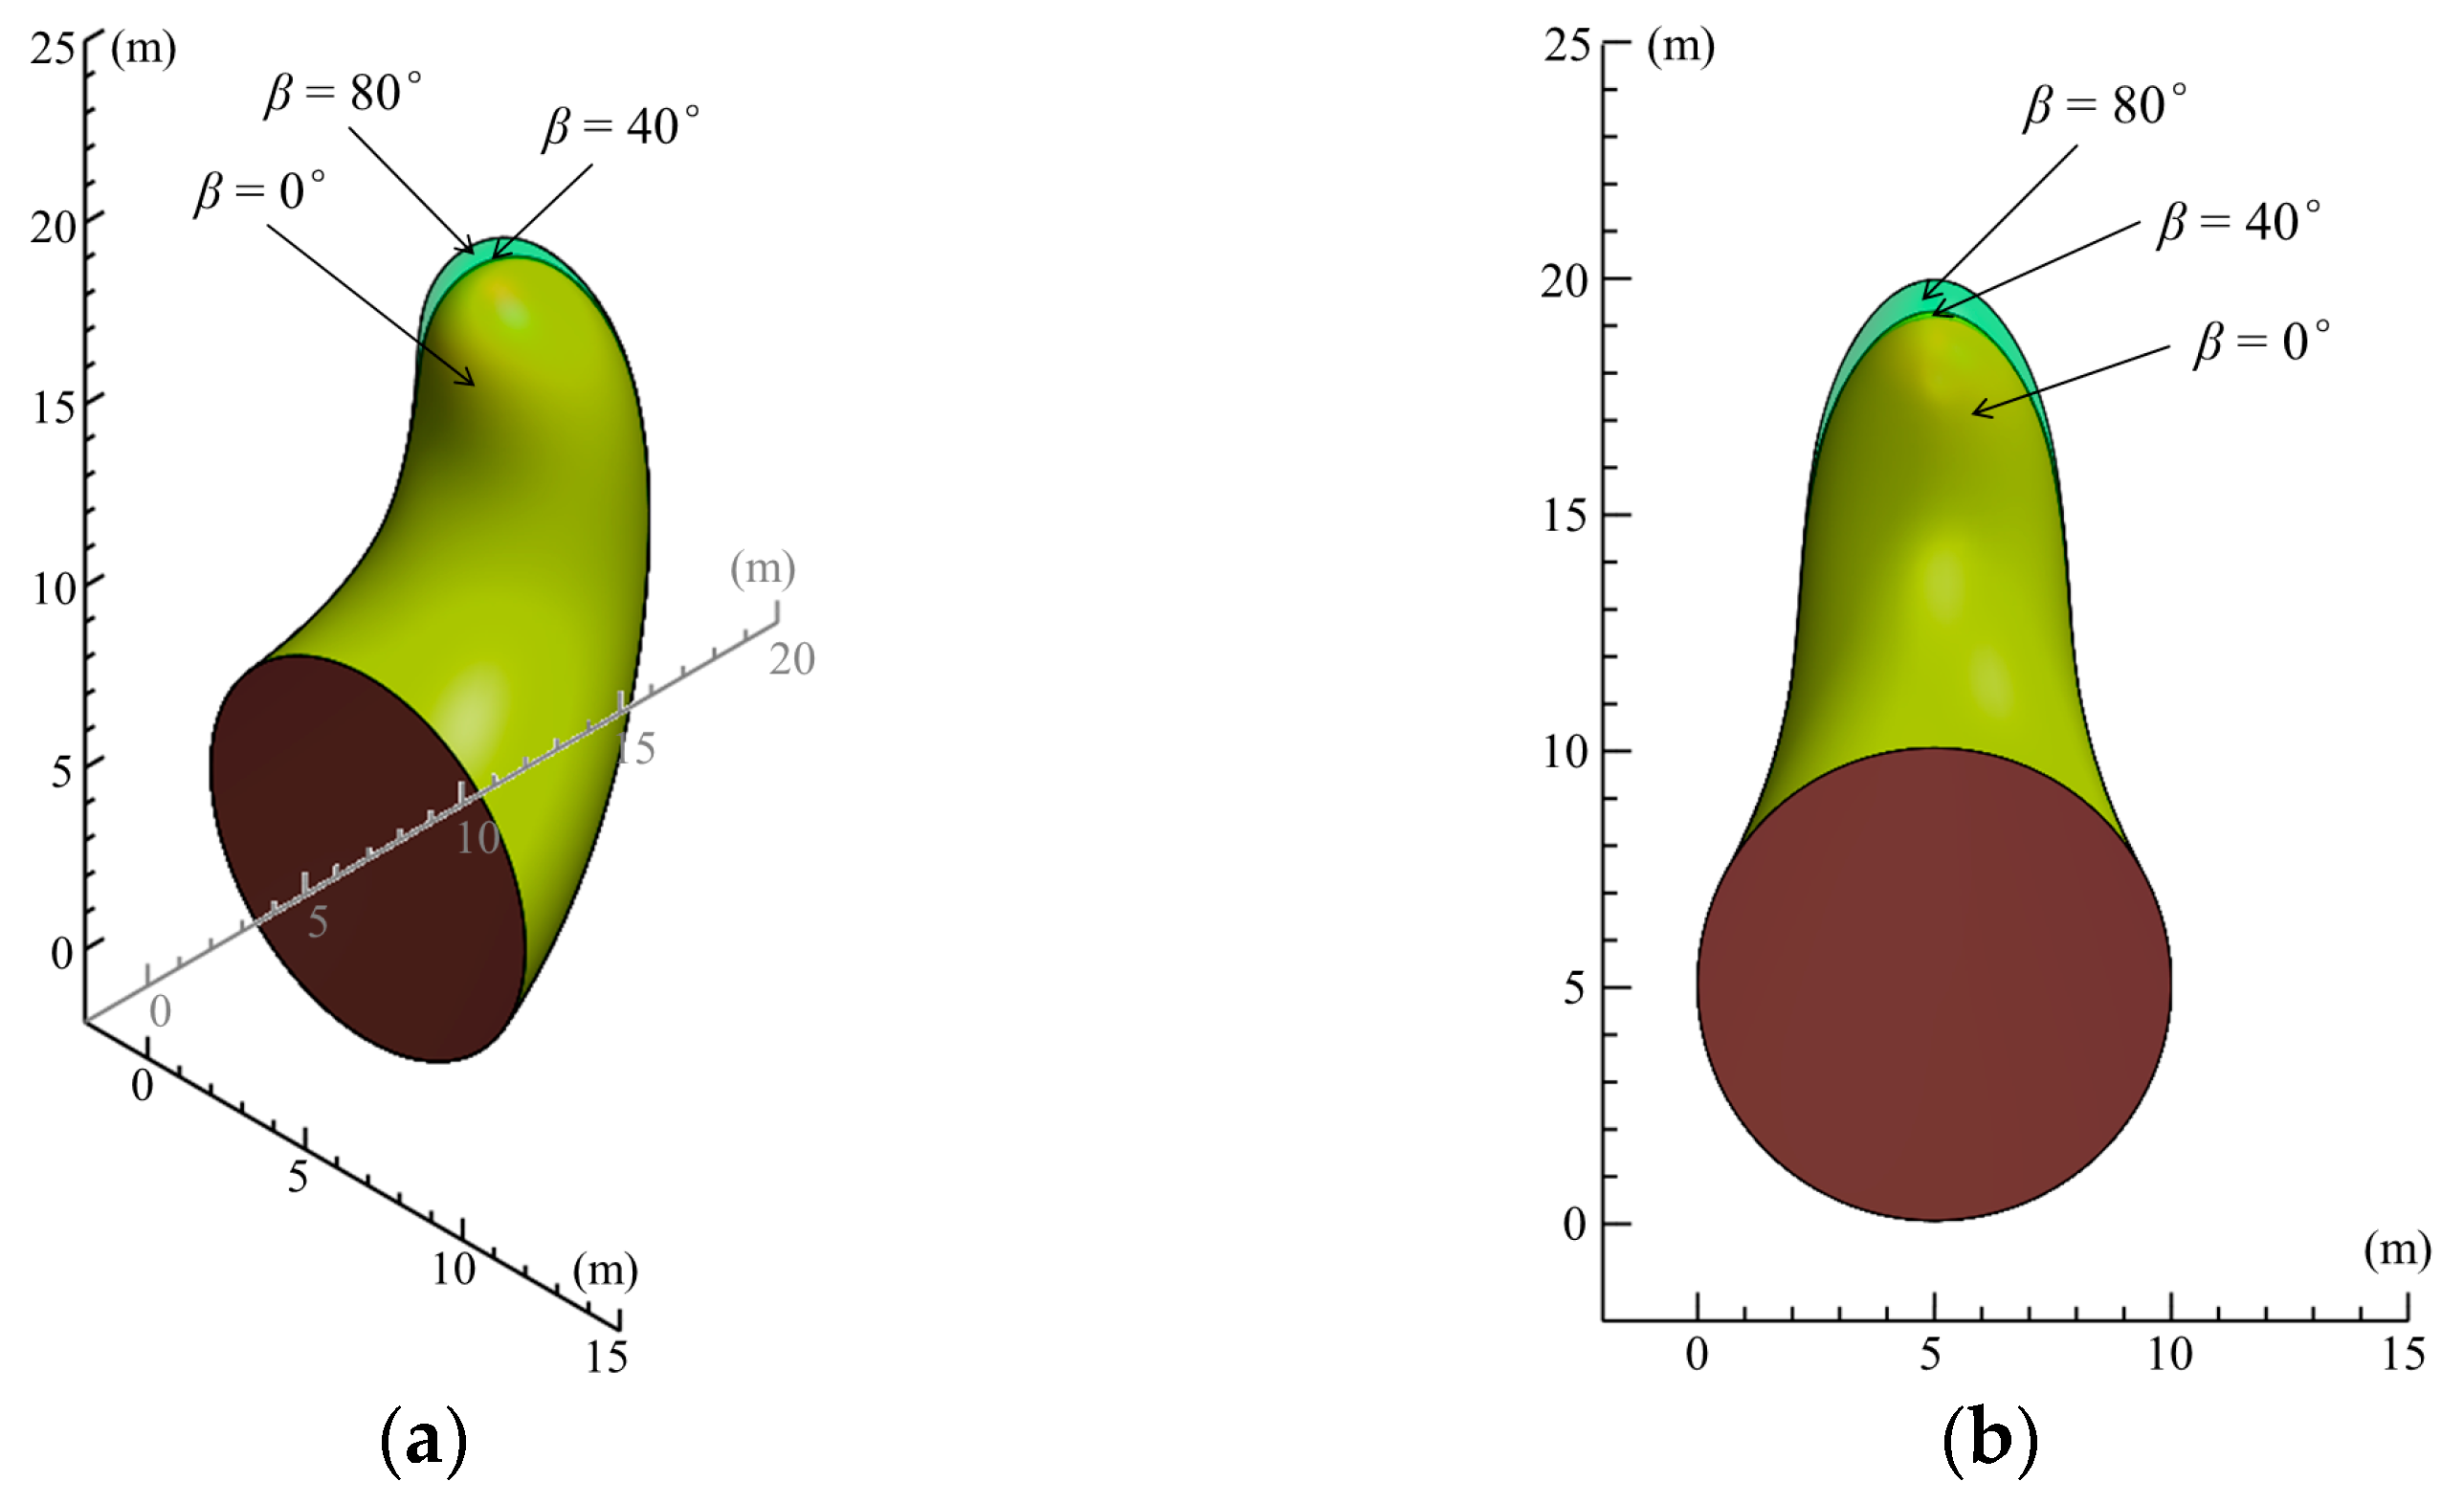
Figure 12 illustrates the influence of the nonhomogeneous coefficient ρ on the failure surface, with the following parameter settings: γ = 18 kN/m3, D = 10 m, c0 = 6 kPa, φ = 10°, H = 20 m, β = 45°, ζ = 20°, ξ = 0, k = 1. The failure surface gradually expands outward as the parameter ρ decreases, and the expansion rate gradually slows down. Figure 13 illustrates the influence of the nonhomogeneously directional angle ζ on the failure surface, with the following parameter settings: γ = 18 kN/m3, D = 10 m, c0 = 10 kPa, φ = 10°, H = 20 m, β = 60°, ρ = 0.3 kPa/m, ξ = 0, k = 1. The failure surface exhibits a tendency to expand outward as the parameter ζ increases, with a relatively small variation in the rate of expansion. Figure 14 illustrates the influence of the parameter β on the failure surface, utilising the specified values for γ = 18 kN/m3, D = 10 m, c0 = 10 kPa, φ = 10°, H = 20 m, ζ = 20°, ρ = 0.3 kPa/m, ξ = 0, and k = 1. As shown in Figure 14, the failure surface exhibits an outward expansion trend as the parameter β increases. When the parameter β is between 0° and 40°, the morphology of the failure surface remains relatively stable. As the parameter β continues to increase, the expansion rate gradually accelerates.

6.4. The Effect of Soil Anisotropy

Figure 15 presents the influence of the anisotropic coefficient k on the ultimate support force. Figure 15a illustrates the following: When the parameter φ is constant, the ultimate support force increases nonlinearly with increasing k, exhibiting a trend from steep to gentle. When the parameter φ decreases, the growth rate gradually increases. Additionally, when the parameter k is constant, the parameter σ increases nonlinearly with decreasing internal friction angle φ, exhibiting a trend from gentle to steep. It is worth noting that the larger the parameter φ, the smaller the impact of changes in the direction angle of heterogeneity on the parameter σ. Figure 15b demonstrates that when other conditions are the same, the larger the parameter ρ, the lower the growth rate of the ultimate support force as the parameter k increases. When the parameter ρ decreases to a certain extent, its effect on the ultimate support force tends to be limited.
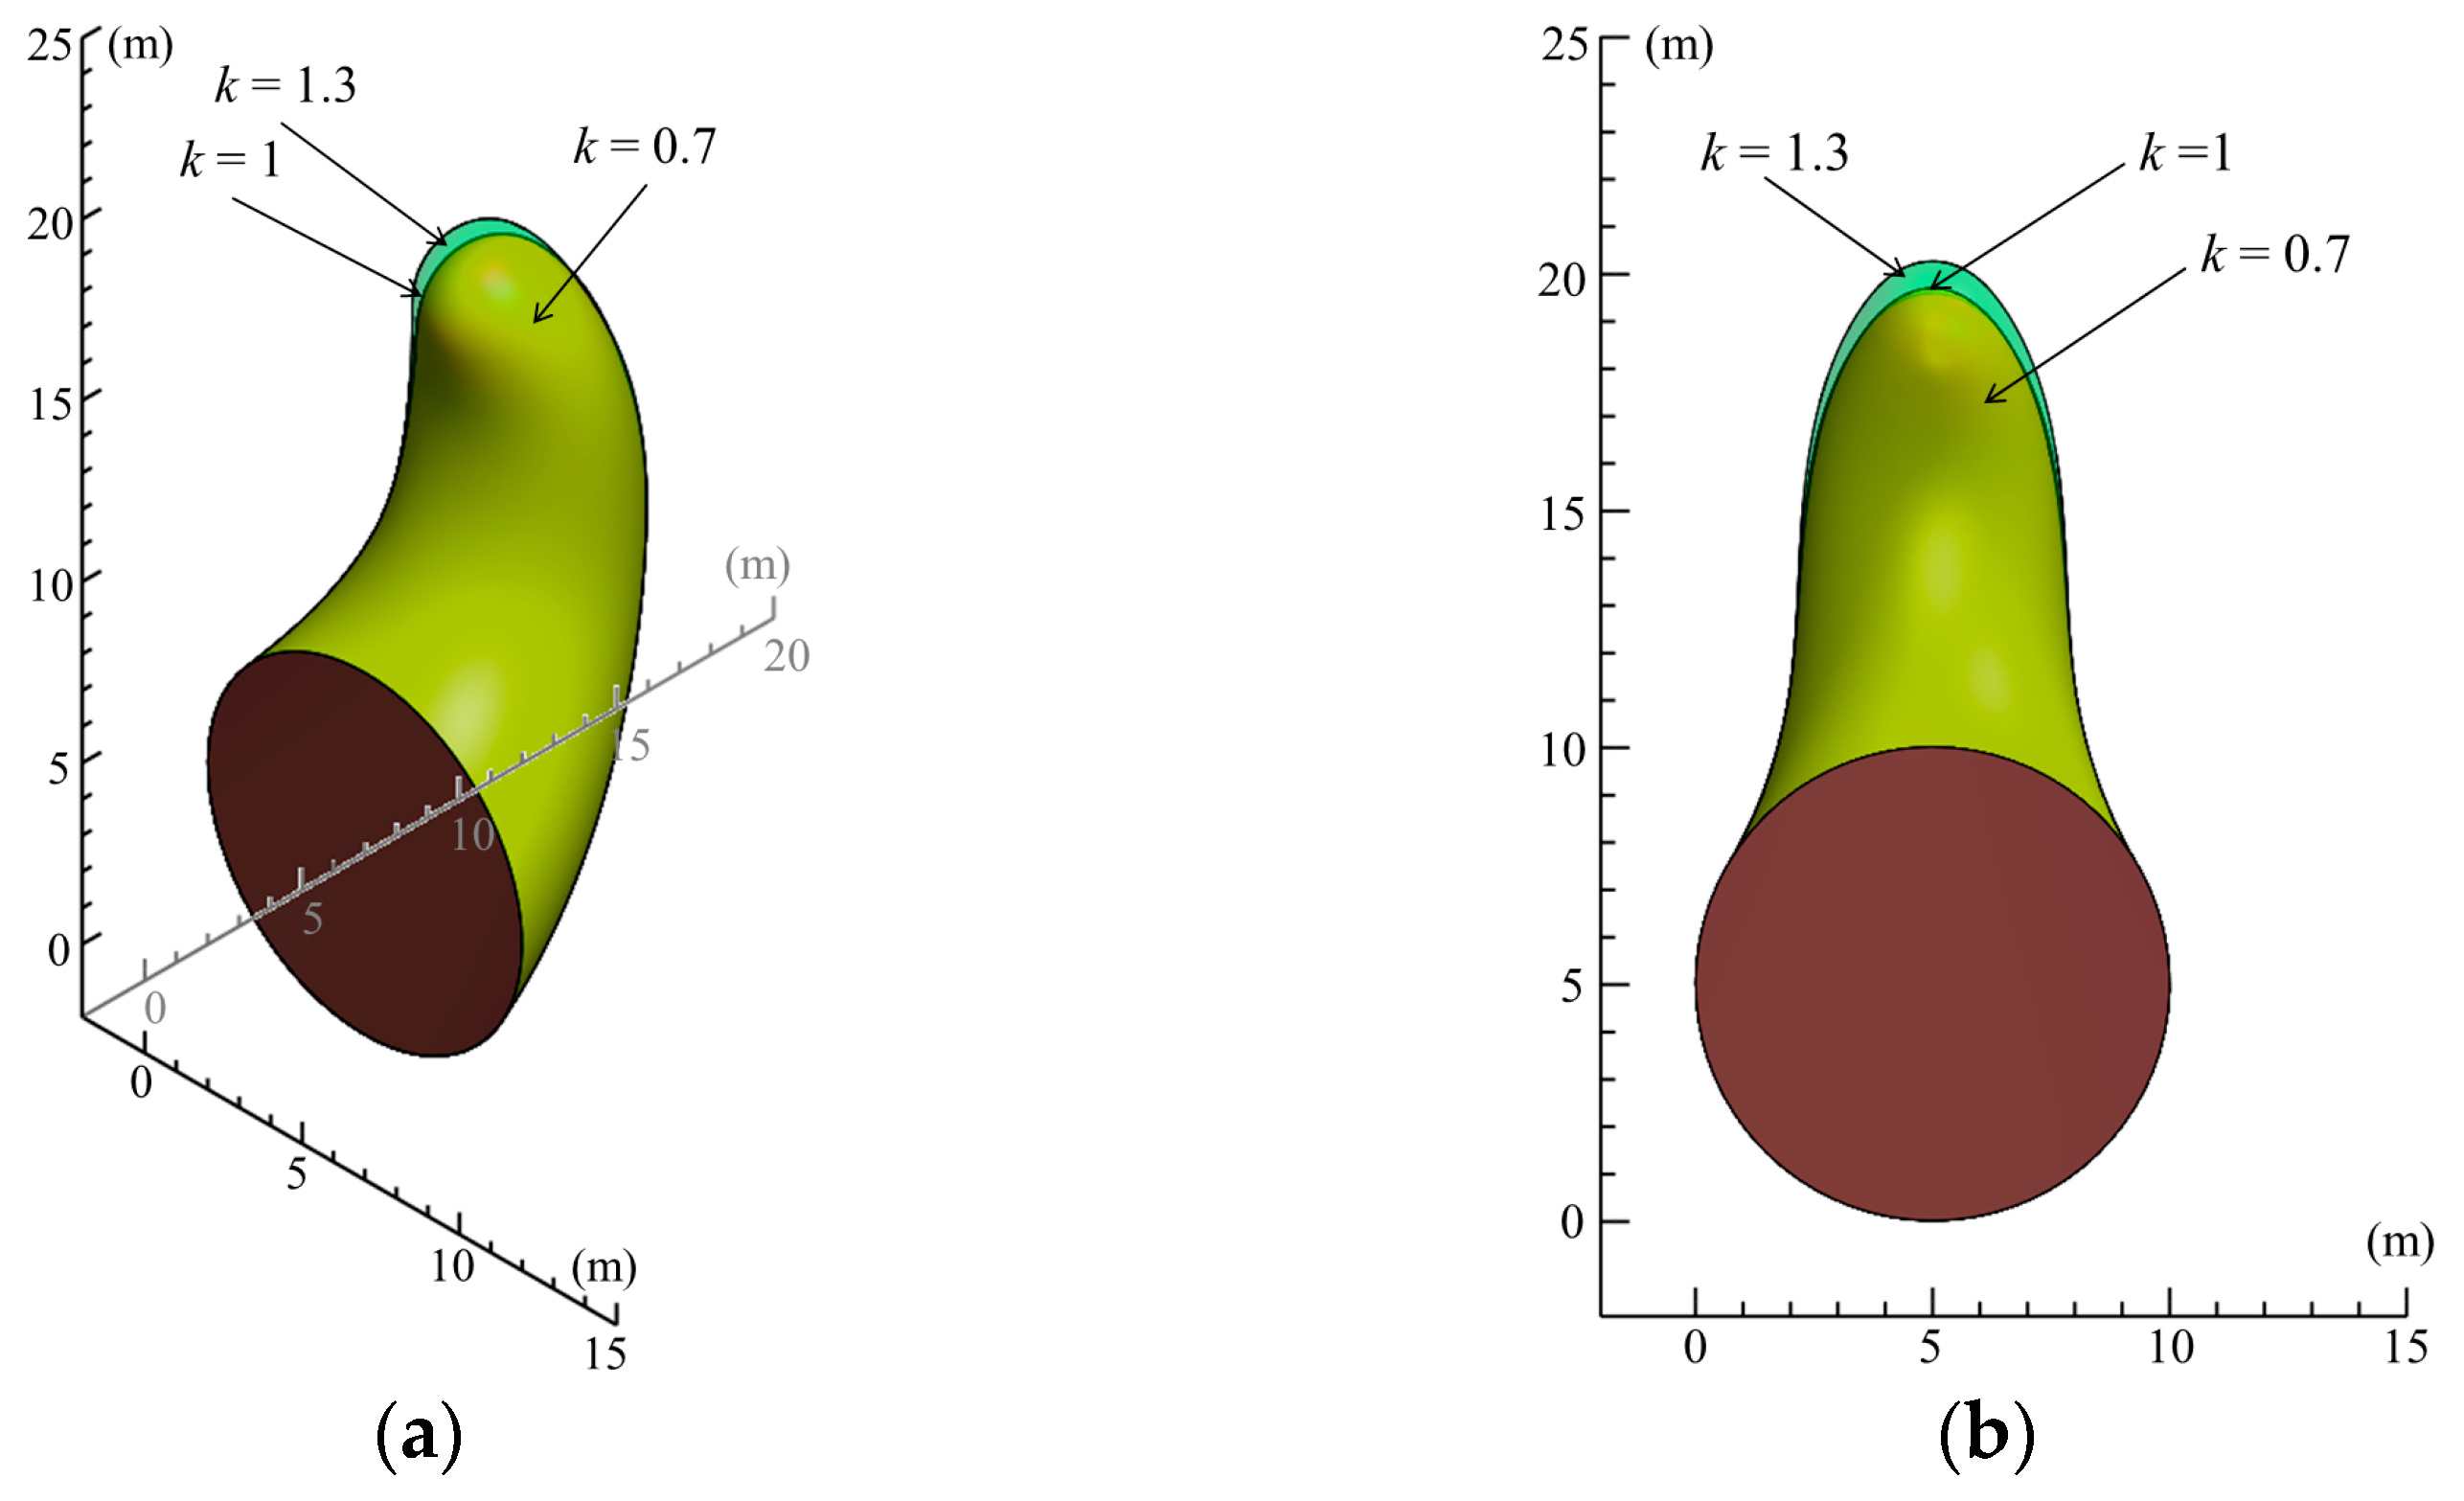
Figure 16 illustrates the impact of the anisotropic coefficient k on the failure plane. The model parameters are configured as follows: γ = 18 kN/m3, D = 10 m, c0 = 10 kPa, φ = 10°, H = 20 m, β = 45°, ζ = 45°, ρ = 0.3 kPa/m, and ξ = 0. With the change in the anisotropic coefficient k, the extent of the damage has little effect, that is, the volume and height of the damaged body do not change significantly.

7. Engineering Case Comparison

The geological structure of a certain section of Metro Line 3 is complex, and a surface collapse accident occurred during construction. The parameters of each soil layer were selected according to reference [37], as shown in Table 5: D = 6 m, H = 12 m, ρ = −1 kPa/m, γ = 19 kN/m3, c0 = 12 kPa, φ = 18°, β = 0°, k = 1, ξ = 0. Substituting the above parameters into Equation (28) for calculation, the calculated results are presented in Table 6. When studying the stability of tunnel working faces, Liao et al. [37] simplified the working face into a two-dimensional plane problem, resulting in a calculated relative error of approximately 38.24% compared to the actual value, which is on the conservative side. Zhang and Zhang [38] employed the upper limit method of limit analysis to analyse the impact of the working face, reducing the relative error to 5.79%, which is closer to the actual measured values on-site. In this paper, after introducing the parameter ξ, the relative error was further reduced to 1.92%, indicating that the method is feasible. Taking the reduction in tensile strength cut-off into account when calculating the support force of a tunnel working face can provide a more accurate assessment of its stability.

8. Conclusions

(1)
The ultimate support force decreases linearly with an increasing initial cohesion, decreases nonlinearly with an increasing internal friction angle, and decreases gradually with an increasing tensile strength reduction parameter. Among these, when the initial cohesion is relatively high, changes in the tensile strength reduction factor exert a more pronounced influence on the support force. For example, under the conditions of initial cohesion being 16 kPa and internal friction angle being 20°, increasing its tensile strength reduction parameter from 0 to 1 causes the ultimate support force to decline by approximately 58.3%.
(2)
When the nonhomogeneous directional angle increases, the ultimate support force demonstrates a progressive growth pattern. When ζ is 90°, the rate of increase reaches its maximum value. As the inclined angle of soil layer increases, the ultimate support force exhibits a nonlinear change, first decreasing and then increasing. The ultimate support force reaches its minimum value within the inclined angle of soil layer range of 10° to 30°. Additionally, under conditions of low internal friction angle, the effect exerted by the anisotropic coefficient on the ultimate support force diminishes.
(3)
Changes in the nonhomogeneous coefficient have a significant impact on the failure plane position, while the nonhomogeneously directional angle has a relatively minor influence on the location of the failure plane. The inclined angle of soil layer and anisotropy have a negligible impact on the failure plane position. As demonstrated by engineering examples, the application of the tensile strength cut-off to the computation of tunnel face support force results in an error margin of approximately 1.92% relative to field measurements. This enhancement in the precision of tunnel face stability evaluation is a key finding of this study.

Author Contributions

Conceptualization, B.Z. and Y.Z.; methodology, B.Z.; software, Y.Z.; validation, D.Z.; formal analysis, B.Z. and Y.Z.; investigation, D.Z.; resources, Y.Z.; data curation, D.Z. and S.Z.; writing—original draft preparation, B.Z. and Y.Z.; writing—review and editing, D.Z. and S.Z.; visualization, Y.Z.; supervision, D.Z.; project administration, D.Z. and S.Z.; funding acquisition, D.Z. All authors have read and agreed to the published version of the manuscript.

Funding

This work was supported by the National Natural Science Foundation of China (52074116).

Institutional Review Board Statement

Not applicable.

Informed Consent Statement

Not applicable.

Data Availability Statement

The raw data supporting the conclusions of this article will be made available by the authors on request.

Acknowledgments

The authors would like to acknowledge all authors whose works have been cited in this study.

Conflicts of Interest

The authors have no relevant financial or non-financial interests to disclose.

References

  1. Jin, D.; Yuan, D.; Li, X.; Zheng, H. Analysis of the settlement of an existing tunnel induced by shield tunneling underneath. Tunn. Undergr. Space Technol. 2018, 81, 209–220. [Google Scholar] [CrossRef]
  2. Cui, H.; Tao, R.; Bao, X.; Wu, X.; Qiu, T.; Shen, J.; Han, Z.; Chen, X. Seismic Resilience Evolution of Shield Tunnel with Structure Degradation. Appl. Sci. 2023, 14, 72. [Google Scholar] [CrossRef]
  3. Yang, X.; Huang, F. Collapse mechanism of shallow tunnel based on nonlinear Hoek–Brown failure criterion. Tunn. Undergr. Space Technol. 2011, 26, 686–691. [Google Scholar] [CrossRef]
  4. Li, W.; Zhang, C.; Tu, S.; Chen, W.; Ma, M. Face stability analysis of a shield tunnel excavated along inclined strata. Undergr. Space 2023, 13, 183–204. [Google Scholar] [CrossRef]
  5. Shi, X.; Liu, B.; Tannant, D.; Qi, Y. Influence of consolidation settlement on the stability of inclined TBM tunnels in a coal mine. Tunn. Undergr. Space Technol. 2017, 69, 64–71. [Google Scholar] [CrossRef]
  6. Li, L.; Shang, C.; Chu, K.; Zhou, Z.; Song, S.; Liu, Z.; Chen, Y. Large-scale geo-mechanical model tests for stability assessment of super-large cross-section tunnel. Tunn. Undergr. Space Technol. 2021, 109, 103756. [Google Scholar] [CrossRef]
  7. Liu, W.; Zhao, Y.; Shi, P.; Li, J.; Gan, P. Face stability analysis of shield-driven tunnels shallowly buried in dry sand using 1-g large-scale model tests. Acta Geotech. 2018, 13, 693–705. [Google Scholar] [CrossRef]
  8. Wu, W.; Liu, X.; Guo, J.; Sun, F.; Huang, X.; Zhu, Z. Upper limit analysis of stability of the water-resistant rock mass of a Karst tunnel face considering the seepage force. Bull. Eng. Geol. Environ. 2021, 80, 5813–5830. [Google Scholar] [CrossRef]
  9. Li, S.; Zhang, Y.; Cao, M.; Wang, Z. Study on excavation sequence of pilot tunnels for a rectangular tunnel using numerical simulation and field monitoring method. Rock Mech. Rock Eng. 2022, 55, 3507–3523. [Google Scholar] [CrossRef]
  10. Zhang, B.; Jiang, J.; Zhang, D.; Liu, Z. Upper bound solution of collapse pressure and permanent displacement of 3D tunnel faces using the pseudo-dynamic method and the kinematic approach. Geomech. Eng. 2021, 25, 521–533. [Google Scholar]
  11. Zhong, J.; Yang, X. Two-dimensional face stability analysis in rock masses governed by the Hoek-Brown strength criterion with a new multi-horn mechanism. Int. J. Min. Sci. Technol. 2023, 33, 963–976. [Google Scholar] [CrossRef]
  12. Song, Q.; Su, D.; Pan, Q.; Han, W.; Chen, X. Limit equilibrium models for passive failure of a large-diameter shield tunnel face in reinforced soft clay. Acta Geotech. 2024, 19, 5231–5247. [Google Scholar] [CrossRef]
  13. Mollon, G.; Dias, D.; Soubra, A.H. Face stability analysis of circular tunnels driven by a pressurized shield. J. Geotech. Geoenviron. Eng. 2010, 136, 215–229. [Google Scholar] [CrossRef]
  14. Zhang, B.; Qu, F. Stability analysis of unsaturated soils at the end of starting point of shield tunnels after well dewatering. KSCE J. Civ. Eng. 2025, 29, 100030. [Google Scholar] [CrossRef]
  15. Zhang, D.; Sun, W.; Wang, C.; Yu, B. Reliability Analysis of Seismic Stability of Shield Tunnel Face under Multiple Correlated Failure Modes. KSCE J. Civ. Eng. 2021, 25, 3172–3185. [Google Scholar] [CrossRef]
  16. Zhang, J.; Zhang, B. Reliability analysis for seismic stability of tunnel faces in soft rock masses based on a 3D stochastic collapse model. J. Cent. South Univ. 2019, 26, 1706–1718. [Google Scholar] [CrossRef]
  17. Drucker, D.C.; Prager, W. Soil mechanics and plastic analysis or limit design. Q. Appl. Math. 1952, 10, 157–165. [Google Scholar] [CrossRef]
  18. Park, D.; Michalowski, R.L. Three-dimensional stability analysis of slopes in hard soil/soft rock with tensile strength cut-off. Eng. Geol. 2017, 229, 73–84. [Google Scholar] [CrossRef]
  19. Liu, J.; Luo, W.; Liu, L. Seismic Stability of 3D Tunnel Face considering Tensile Strength Cut-Off. KSCE J. Civ. Eng. 2022, 26, 3620–3632. [Google Scholar] [CrossRef]
  20. Park, D. Influence of the Hoek–Brown failure criterion with tensile strength cut-off on the roof stability in deep rock tunnels. Tunn. Undergr. Space Technol. 2023, 136, 105016. [Google Scholar] [CrossRef]
  21. Huang, F.; Wang, Y.; Zhang, M.; Yang, Z. Face stability analysis of longitudinally inclined shield tunnel considering the effect of tensile strength cut-off and pore water pressure. J. Cent. South Univ. 2025, 32, 1080–1098. [Google Scholar] [CrossRef]
  22. Hou, C.; Yang, X. Seismic stability of 3D tunnel face considering tensile strength cut-off. KSCE J. Civ. Eng. 2020, 24, 2232–2243. [Google Scholar] [CrossRef]
  23. Zou, J.; Qian, Z.; Xiang, X.; Chen, G. Face stability of a tunnel excavated in saturated nonhomogeneous soils. Tunn. Undergr. Space Technol. 2019, 83, 1–17. [Google Scholar] [CrossRef]
  24. Du, D.; Dias, D.; Yang, X. Analysis of earth pressure for shallow square tunnels in anisotropic and non-homogeneous soils. Comput. Geotech. 2018, 104, 226–236. [Google Scholar] [CrossRef]
  25. Meng, Q.; Qu, X.; Wang, X.; Yuanita, V.; Wong, S. Quantitative risk assessment modeling for nonhomogeneous urban road tunnels. Risk Anal. 2011, 31, 382–403. [Google Scholar] [CrossRef]
  26. Wang, W.; Liu, H.; Deng, R.; Wang, Y. Active stability analysis of 3D tunnel face in nonhomogeneous and anisotropic soils. Geotech. Geol. Eng. 2023, 41, 3013–3033. [Google Scholar] [CrossRef]
  27. Chen, X.; Zhang, K.; Wang, W. Seismic stability analysis of tunnel faces in heterogeneous and anisotropic soils using modified pseudodynamic method. Sustainability 2023, 15, 11083. [Google Scholar] [CrossRef]
  28. Keawsawasvong, S.; Ukritchon, B. Design equation for stability of a circular tunnel in anisotropic and heterogeneous clay. Undergr. Space 2022, 7, 76–93. [Google Scholar] [CrossRef]
  29. Zhang, T.; Baroth, J.; Dias, D. Probabilistic basal heave stability analyses of supported circular shafts in non-homogeneous clayey soils. Comput. Geotech. 2021, 140, 104457. [Google Scholar] [CrossRef]
  30. Zou, J.; Peng, Z. Stability analyses of shallow rectangular tunnels in anisotropic and nonhomogeneous soils using a kinematic approach. Int. J. Geomech. 2024, 24, 04024127. [Google Scholar] [CrossRef]
  31. Chi, S.; Feng, W.; Jia, Y.; Zhang, Z. Application of the soil parameter random field in the 3D random finite element analysis of Guanyinyan composite dam. Case Stud. Constr. Mater. 2022, 17, e01329. [Google Scholar] [CrossRef]
  32. Jamhiri, B.; Xu, Y.; Shadabfar, M.; Jalal, F.E. Probabilistic estimation of thermal crack propagation in clays with Gaussian processes and random fields. Geomech. Energy Environ. 2023, 34, 100454. [Google Scholar] [CrossRef]
  33. Li, J.; Zhou, Y.; Zhang, L.; Tian, Y.; Cassidy, M.J.; Zhang, L. Random finite element method for spudcan foundations in spatially variable soils. Eng. Geol. 2016, 205, 146–155. [Google Scholar] [CrossRef]
  34. Li, M.; Cai, G.; LI, H.; Yang, B.; Zhao, C. Infinite unsaturated soil slopes stability with tensile strength cut-off. Chin. J. Geotech. Eng. 2020, 42, 705–713. [Google Scholar]
  35. Michalowski, R.L. Stability of intact slopes with tensile strength cut-off. Géotechnique 2017, 67, 720–727. [Google Scholar] [CrossRef]
  36. Luan, M.T.; Nian, T.K.; Yang, Q. Stability analysis of pile-stabilized slopes considering both nonhomogeneity and anisotropy of soil strength using upper bound method of limit analysis. Rock Soil Mech. 2006, 27, 530–536. [Google Scholar]
  37. Liao, B.; Huang, M.; Lu, Y.; Huang, Y.; Xu, J. Upper bound solution of shield tunnel face supporting pressure in non-homogeneous fault fracture zone. J. Eng. Geol. 2023, 31, 2008–2019. [Google Scholar]
  38. Zhang, D.; Zhang, B. Stability analysis of the pressurized 3D tunnel face in anisotropic and nonhomogeneous soils. Int. J. Geomech. 2020, 20, 04020018. [Google Scholar] [CrossRef]
  39. Li, T.; Yang, X. Three-dimensional face stability of shallow-buried tunnels with tensile strength cut-off. Comput. Geotech. 2019, 110, 82–93. [Google Scholar] [CrossRef]
Figure 1. Mohr–Coulomb strength criterion envelope under different tensile strength cut-offs: (a) full cut-off (ξ = 0); (b) partial cut-off (0 < ξ < 1); (c) minimum cut-off (ξ = 1).
Applsci 15 09507 g001
Figure 2. Spatially nonhomogeneous model.
Applsci 15 09507 g002
Figure 3. Anisotropy of cohesive force.
Applsci 15 09507 g003
Figure 4. Calculation schematic diagram of i: (a) BD′ section curve; (b) AD section curve; (c) D′E′ section curve; (d) DE′ section curve.
Applsci 15 09507 g004
Figure 5. Three-dimensional failure mode of shield tunnelling under tensile strength cut-off conditions.
Applsci 15 09507 g005
Figure 6. Comparison of limit support forces under tensile strength cut-off with literature [39].
Applsci 15 09507 g006
Figure 7. Effect of initial cohesion on ultimate support force.
Applsci 15 09507 g007
Figure 8. Effect of internal friction angle on ultimate support force.
Applsci 15 09507 g008
Figure 9. Effect of nonhomogeneous coefficient on ultimate support force.
Applsci 15 09507 g009
Figure 10. Effect of nonhomogeneously directional angle on ultimate support force.
Applsci 15 09507 g010
Figure 11. Effect of inclined angle of soil layer on ultimate support force.
Applsci 15 09507 g011
Figure 12. Effect of nonhomogeneous coefficient on failure surface: (a) Three-dimensional image; (b) Front view.
Applsci 15 09507 g012
Figure 13. Effect of nonhomogeneously directional angle on fracture surface: (a) Three-dimensional image; (b) Front view.
Applsci 15 09507 g013
Figure 14. Effect of inclined angle of soil layer on the failure surface: (a) Three-dimensional image; (b) Front view.
Applsci 15 09507 g014
Figure 15. Effect of anisotropic coefficient on ultimate support force: (a) internal friction angle; (b) nonhomogeneous coefficient.
Applsci 15 09507 g015
Figure 16. Effect of anisotropic coefficient on fracture surface: (a) Three-dimensional image; (b) Front view.
Applsci 15 09507 g016
Table 1. Comparison of the results of this paper with existing findings.
nγ
(kN/m3)
c0 (kPa)φ (°)σ (kPa)Relative
Error
Li and Yang [39]This Paper (ξ = 0)
11855179.360175.2262.31%
21851082.45082.1610.35%
31851548.31048.1150.40%
41852031.37031.2720.31%
518105126.290121.0424.16%
618101056.03055.7830.44%
718101530.55030.3190.76%
818102018.20018.1220.43%
91815576.98071.6036.98%
1018151031.38031.2290.48%
1118151514.01013.8840.90%
121815206.2506.1012.38%
Table 2. Comparison of support forces under different nonhomogeneous coefficients.
nρ
(kPa/m)
σRelative Error
Zhang and Zhang [38]This Paper (ξ = 0)
1075.922476.75541.10%
20.170.458871.20011.05%
30.264.995265.64481.00%
40.359.531560.08990.94%
50.454.067954.53520.86%
60.548.604348.9810.78%
70.643.182743.42630.56%
80.737.772837.87220.26%
90.832.362932.31810.14%
100.926.95326.76420.70%
11121.54321.21061.54%
Table 3. Comparison of support forces under different anisotropic coefficients.
nkσRelative Error
Zhang and Zhang [38]This Paper (ξ = 0)
10.663.590460.41514.99%
20.767.994766.25052.57%
30.871.297970.62750.94%
40.973.867174.03190.22%
5175.922476.75541.10%
61.177.604178.98391.78%
71.279.005480.8412.32%
81.380.191282.41242.77%
Table 4. Ultimate support force at tunnel working face considering tensile strength cut-off.
nc0 (kPa)φ (°)Mohr–CoulombCut-Off
ξ = 0ξ = 0.5ξ = 1
165166.011164.114163.963163.812
261075.93076.74976.58676.576
361544.23644.48444.37944.371
462028.44328.59428.52428.520
585143.153142.324141.971141.637
681064.59066.14265.82165.802
781536.77437.32337.18137.170
882022.95023.29923.14523.122
9105120.296121.042120.405119.782
10101053.25055.78355.09155.067
11101529.31230.31929.98329.969
12102017.45718.12217.78117.752
1312597.438100.35999.31698.273
14121041.91045.69644.57544.332
15121521.85023.53922.78522.768
16122011.96413.12812.45512.382
1714574.58180.87378.75677.243
18141030.57035.94834.30733.597
19141514.38817.02815.74515.568
2014206.4718.3557.2467.012
2116551.72362.64659.48156.868
22161019.23026.57424.29722.862
2316156.92610.7998.9198.367
2416200.9773.9422.1431.643
Table 5. Soil parameters.
Soil Layerγ (kN/m3)c0 (kPa)φ (°)Thickness (m)
artificial fill17.312.028.01.4
silty soil18.56.018.07.6
alluvial deposits19.50.818.06.0
Strongly weathered mudstone21.6200.024.023.0
Table 6. Comparison between theoretical calculation and field measurement of tunnel support force.
Actual Measured Value (kPa)Theoretical Value (kPa)Relative Error
Literature
[37]
Literature
[38]
This PaperLiterature
[37]
Literature
[38]
This Paper
3852.5335.838.7338.24%5.79%1.92%
Disclaimer/Publisher’s Note: The statements, opinions and data contained in all publications are solely those of the individual author(s) and contributor(s) and not of MDPI and/or the editor(s). MDPI and/or the editor(s) disclaim responsibility for any injury to people or property resulting from any ideas, methods, instructions or products referred to in the content.