Article

Multi-Fidelity Aerodynamic Optimization of the Wing Extension of a Tiltrotor Aircraft

Dipartimento di Scienze e Tecnologie Aerospaziali, Politecnico di Milano, Via La Masa 34, 20156 Milan, Italy
Appl. Sci. 2025, 15(17), 9491; https://doi.org/10.3390/app15179491
Submission received: 6 August 2025 / Revised: 22 August 2025 / Accepted: 25 August 2025 / Published: 29 August 2025

Abstract

Given the fast-evolving context of electrical vertical takeoff and landing vehicles (eVTOL) based on the concept of tiltrotor aircraft, this work describes a framework aimed at the preliminary aerodynamic design and optimization of innovative lifting surfaces of such rotorcraft vehicles. In particular, a multiobjective optimization process was applied to the design of a wing extension representing an innovative feature recently investigated to improve the aerodynamic performance of a tiltrotor aircraft wing. The wing/proprotor configurations, selected using a Design Of Experiment (DOE) approach, were simulated by the mid-fidelity aerodynamic code DUST, which used a vortex-particle method (VPM) approach to model the wing/rotor wakes. A linear regression model accounting for nonlinear interactions was used by an evolutionary algorithm within a multiobjective optimization framework, which provided a set of Pareto-optimal solutions for the wing extension, maximizing both wing and rotor efficiency. Moreover, the present work highlighted how the use of a fast and reliable numerical modeling for aerodynamics, such as the VPM approach, enhanced the capabilities of an optimization framework aimed at achieving a more accurate preliminary design of innovative features for rotorcraft configurations while taking into account the effects of the aerodynamic interaction between wings and proprotors.

1. Introduction

The tiltrotor concept was developed to surpass the forward speed limitations of traditional helicopters while retaining the ability to hover. This configuration merges the speed and range characteristics of a conventional fixed-wing aircraft with the vertical takeoff and landing capability of a helicopter. In such aircraft, the rotors are initially oriented horizontally, generating lift like a standard helicopter rotor. As forward velocity increases, the rotors gradually rotate until their plane becomes vertical, functioning as propellers, while the fixed wing provides aerodynamic lift.
The XV-3 pioneered the design of modern tiltrotors as the first aircraft capable of safely transitioning between helicopter and airplane modes. Despite facing major technical challenges, it was extensively tested through flight trials, ground evaluations, and wind tunnel experiments, as detailed by Maisel et al. [1]. The program ended in 1966 after a wind tunnel accident in which both pylons detached from the wing. During the 1970s, large experimental tiltrotor models were tested in the Ames Research Center wind tunnel. These experimental test results served as the basis for the first numerical codes to predict tiltrotor aircraft performance [2,3], and they were also utilized to gain a fundamental knowledge of the physical phenomena connected to the interaction between wing and rotor [4]. In the late 1970s, a collaborative effort among NASA Ames research facility, the US Army, and Bell Helicopter Textron resulted in the development of the Bell XV-15 tiltrotor. It is commonly deemed one of the most adaptable research aircraft to emerge from aeronautical development. In fact, it became the subject of a vast number of experimental tests, not only wind tunnel [5] and flight tests [6], but also numerical activities [7]. The XV-15’s principal distinction is the engine placement: two separate engines were positioned within the nacelles as opposed to the XV-3 configuration, which had only one engine inside the fuselage. This arrangement required a driveshaft to join the two engines in the event of a failure. The XV-15 tiltrotor could attain cruising speeds of more than 200 knots after resolving the instability difficulties of its predecessor. Despite remaining a prototype, its design’s success paved the way for the future Bell-Boeing V-22 Osprey and Bell-Agusta BA609.

1.1. The Tiltrotor Concept and Challenges

A tiltrotor is an aircraft, as mentioned, that combines the capacity to hover, typical of helicopters, with the potential to fly in cruise at high speed, similar to propeller-driven aircraft. Due to this type of aircraft’s remarkable adaptability, the tiltrotor idea is now a highly appealing solution for the civil industry [8], albeit accompanied by several challenges. Indeed, the aerodynamic interaction between the wing and rotors significantly impacts the hovering performance and lifting capacity of this type of aircraft. The presence of the wing under the rotor in helicopter flight mode significantly alters the rotor wake and is thus responsible for a reduction in rotor performance [9]. Furthermore, a download force between 10% and 15% of the rotor’s thrust is produced when the rotor wake reaches the wing surface [10]. To get around these restrictions, larger rotors have been added to the existing tiltrotors (XV-15, V-22 Osprey, and AW609), despite increasing aerodynamic interference from wing/rotor and rotor/rotor interaction, which limits maximum cruise speed. Many experiments have indeed been conducted in order to investigate the rotor/wing interactions, spanning from the early stages of the JVX program [11,12] to the present day [13,14].
Although the tiltrotor idea has been developed to its current degree of maturity over a long period of time, reliable high-fidelity aerodynamic simulations involving tiltrotors have only been performed in the last 20 years. Postdam et al. performed one of the first CFD calculations on the V-22 tiltrotor and concluded that solving the Navier–Stokes equations, thanks to CFD methods, can provide a broad range of flowfield details—such as rotor sectional data, separated regions, and download distributions—that can be investigated to improve performance [15]. The XV-15 was also the subject of several CFD simulations. Lim and colleagues explored the primary interaction between the rotor and the wing by simulating the aircraft under its various operating modes [16,17]. Rotor/wing interference effects were studied for high-speed cruise mode [18], along with the quantification of some of the intricate aerodynamic interactions that take place when a tiltrotor aircraft performs a conversion maneuver [19].
These are examples of time-accurate URANS simulations of tiltrotor aircraft configurations that require substantial computational effort. Thus, high-fidelity CFD tools are usually employed for the detailed study of a limited number of tiltrotor configurations in steady-state conditions. For this reason, in the realm of rotorcraft simulations, mid-fidelity unstable panel-based aerodynamic models are considered to be of significant importance. In fact, the low computational cost required by these numerical tools makes it possible to perform the numerous simulations needed during the early design of revolutionary rotary-wing vehicles. The numerical works by the University of Roma Tre [20,21] and the one developed by DLR to examine the Airbus RACER compound helicopter [22] are examples of numerical works that include the usage of unstable panel methods for rotorcraft applications. The vortex particle method (VPM), employed in recent studies for modeling wakes, exhibits a relatively realistic description of the aerodynamic interactions among the many bodies typical of complex rotorcraft configurations. An example is the GENeral Unsteady Vortex Particle (GENUVP) software, developed by the National Technical University of Athens and based on a panel approach paired with a VPM solver and utilized for both aerodynamic and aeroacoustic simulations of rotorcraft [23]. Additionally, Tan et al. studied the complex rotorcraft-to-rotorcraft interference problems that arise during shipboard operations using a vortex-based approach coupled with a viscous boundary model [24]. In recent years, a flexible mid-fidelity computational tool named DUST (https://www.dustproject.org (accessed on 24 August 2025)) was developed through a collaboration between Politecnico di Milano and A3 by Airbus LLC. Its purpose is to provide a fast and reliable numerical framework for simulating the aerodynamics of complex rotorcraft, including eVTOL aircraft [25]. The tool has been successfully applied to the Vahana vehicle designed by A3 by Airbus LLC [26], showing excellent agreement with both flight test measurements and high-fidelity CFD simulations [27]. Furthermore, DUST has been employed to perform a parametric study of rotor–rotor aerodynamic interactions during cruise flight for an eVTOL aircraft [28]. Consequently, DUST is considered suitable for analyzing the intricate aerodynamic interactions between rotors and wings in complex rotorcraft designs, and it has been adopted as the aerodynamic solver in the present study.

1.2. The Wing Extension Concept

Wingspan constraints for civil tiltrotors, compared to ship-borne tiltrotors such as the V-22, make it feasible for aerodynamic wing surfaces to extend beyond the nacelle, with wing extensions and winglets, reducing induced drag by increasing wing span [29].
The lift-to-drag ratio of the aircraft during cruise conditions determines its efficiency, namely the payload carried multiplied by the distance traveled per unit of fuel spent. Wing aspect ratio is the ratio of the wing span to the average wing chord. There is a strong incentive to raise the wing aspect ratio to obtain higher glide ratios, but long and narrow wings are limited in weight and structural dynamics. Prior art tiltrotor aircraft have wing aspect ratios of about 5.5—with engines and nacelles located at the wing tips—a reasonably modest value considering that gliders have wing aspect ratios of 25–30. A very stiff wing is indeed required to avoid whirl flutter, an aeroelastic instability concerning wing and rotor coupling.
In order to increase lift-to-drag ratio, aircraft efficiency, and fuel economy, tiltrotor aircraft can be improved by adding wing extensions outboard of the tilting rotor nacelles. Such extensions are designed to increase wing span and aspect ratio and will be the object of study in this work. These wing extensions tilt together with the rotor nacelle. As a result, there is no need to increase the rotor size, engine power, or gearbox torque to generate the additional lift that would otherwise be necessary during hover. These surfaces are shown in Figure 1 on the Bell V-247 during a conversion maneuver.
An outboard wing with a span corresponding to roughly 25–40% of the inboard section and a total surface area of about 10-20% of the inboard wing can provide significant aerodynamic benefits [30]. These include a reduction of induced drag by approximately 50% during cruise in airplane mode, a 25% lower rotor power requirement for economical cruise at a given aircraft weight, a 25% improvement in fuel efficiency, a 25% increase in range, a notable increase in achievable cruise altitude for improved weather avoidance, and over a 50% enhancement in maximum sustained maneuver capability without loss of altitude or speed. Additionally, maximum wing lift is expected to increase by around 50% at a given speed and altitude, resulting in greater instantaneous maneuverability, reduced stall speed, and a significantly wider “conversion corridor” between airplane and helicopter modes, thereby improving safety during these critical flight phases. A tiltrotor aircraft provided with wing extensions will have slightly higher empty weight than conventional tiltrotors. In fact, the weight cost of the wing area outboard of the rotor will significantly be lower than that of the inboard wing since the extensions are not required to withstand the forces that generate whirl flutter or bear the concentrated lift loads of the rotor [31]. As a result, the weight cost of the wing area outboard of the rotor is significantly lower than that of the inboard wing (approximately 16% of wing weight for 29% of area).
It is also worth mentioning that these surfaces can strongly influence the aeroelastic characteristics of the entire rotor/pylon/wing system. An investigation of the effect of wing extensions on whirl flutter stability concluded that they could significantly increase both wing beam mode and torsion mode damping, thereby increasing flutter speeds of the wing beam and torsion modes by 60 knots and 80 knots, respectively [29]. Moreover, a composite tailoring of the wing extension beam could provide additional beneficial effects on wing mode damping.
In addition to these performance advantages, practical considerations regarding the use of these wing extensions must be taken into account. These outboard wing extensions are indeed vulnerable to significant stalls and severe buffeting while transitioning from hover to forward flight, much like conventional tilt-wing aircraft. This wing region acts as an airbrake during conversion maneuvers; even if the rotor-induced velocity is sufficient to keep the flow attached and prevent stall, the resulting section lift points rearward in the direction of drag. A fixed extension avoids this problem, but at the greater cost of a higher download force during hover flight in helicopter mode.

1.3. Present Work

The goal of the present research activity is to provide a methodology for designing and thus optimizing aerodynamic surfaces for complex tiltrotor configurations, employing a multi-fidelity approach. The motivation of this work is to address the lack of efficient optimization frameworks for tiltrotor wing extensions under rotor–wing aerodynamic interaction. In this work, the outer wing of the XV-15 tiltrotor aircraft will be designed. Different shapes for the outer wing will be found thanks to an optimization strategy, in order to evaluate the different aerodynamic interaction phenomena that result from the various solutions: one solution will maximize wing efficiency, while the other will minimize wing root bending moment. Due to the overall complexity of a tiltrotor configuration, it is impossible to identify a single parameter that summarizes the machine’s total performance. To select one possible configuration for the final design, it is essential to assess the existence of a Pareto-optimal (PO) front from which to select the possible final configuration.
Given a design space for different explanatory variables of the wing extension, a set of simulations will be selected using a Design Of Experiment (DOE) approach as a function of the number of geometrical parameters chosen to be optimized [32]. The DOE approach significantly reduces the number of simulation points required. After this data-gathering phase, a regression model is obtained to predict aerodynamic coefficients based on different geometrical configurations. The genetic algorithm will then use this model to find the optimal solutions. The state-of-the-art evolutionary multi-objective optimization algorithm NSGA-II has been chosen for this work, given its proven performance [33]. In this context, the performance metric used to evaluate the solution is the hypervolume metric since it does not require knowledge of the true PO front.
Since the mid-fidelity approach used in this phase has some limitations, for example, those related to the estimation of aerodynamic resistance, a limited set of points of the PO are chosen to be simulated with an high fidelity CFD approach to bring the results back to more accurate quantities.
The implementation of a multi-objective optimization strategy based on a Design Of Experiment approach would further improve the subsequent studies of complex tiltrotor configurations. Indeed, when coupled with a mid-fidelity code like DUST, it will efficiently provide different solutions during the design phase of these vehicles. The other primary outcome will instead be the evaluation of interference effects between rotor and wing in the case of these wing extension configurations. Therefore, they will be thoroughly investigated by proposing different solutions and highlighting how they affect wing/rotor interaction.

2. Numerical Model

The goal of the present work is to demonstrate the capabilities of a numerical framework for the preliminary optimization of the outer wing of a tiltrotor aircraft based on the use of a multi-fidelity approach to aerodynamics. In particular, the framework was applied to a test case with open geometry, the XV-15 tiltrotor. The multi-fidelity approach makes use of mid-fidelity and high-fidelity CFD software, both open-source, i.e., DUST [34] and SU2 [35].
DUST is an open-source software developed at Politecnico di Milano since 2017 for simulating interactional aerodynamics in unconventional rotorcraft configurations. It is freely available under the MIT license (https://public.gitlab.polimi.it/DAER/dust (accessed on 24 August 2025)). The code is based on an integral boundary element formulation and employs a vortex particle model [36,37] to represent the wake. A DUST simulation can be constructed from multiple aerodynamic components connected to user-defined reference frames, whose positions and motions are hierarchically specified. The inclusion of different aerodynamic elements allows varying levels of fidelity, from lifting line elements to zero-thickness lifting surfaces and surface panels for thick solid bodies. The time evolution of the simulation is handled through a time-stepping algorithm, which sequentially solves the Morino-like potential flow problem [38] and the nonlinear lifting line problem and updates the rotational velocity field by integrating the Lagrangian equations for wake particles. A full mathematical description of DUST is provided in [34].
SU2 [35] is a high-fidelity, open-source CFD software developed by the Aerospace Design Laboratory at Stanford University and distributed under the GNU Lesser General Public License. It addresses aeronautical problems involving turbulent compressible flows by solving the Unsteady Reynolds-Averaged Navier–Stokes (URANS) equations. SU2 uses a finite volume method on unstructured meshes, adopting a vertex-based approach where variables are stored at the mesh vertices rather than at the cells. The software includes turbulence models such as the one-equation Spalart–Allmaras (SA) and the two-equation Menter Shear Stress Transport (SST) model.

2.1. Mid-Fidelity Numerical Model

The numerical model of the XV-15 tiltrotor was built considering the full-scale dimensions of the aircraft. In particular, since the work was focused on the preliminary design of a tiltrotor wing, a semi-model of the complete wing and rotor system was considered in order to limit the computational effort required by the several numerical simulations selected for the optimization framework. Moreover, this choice could also be justified by our focus on a symmetric flight condition, namely cruise, characterized by a negligible interference between the two proprotors positioned at the outer region of the wing.
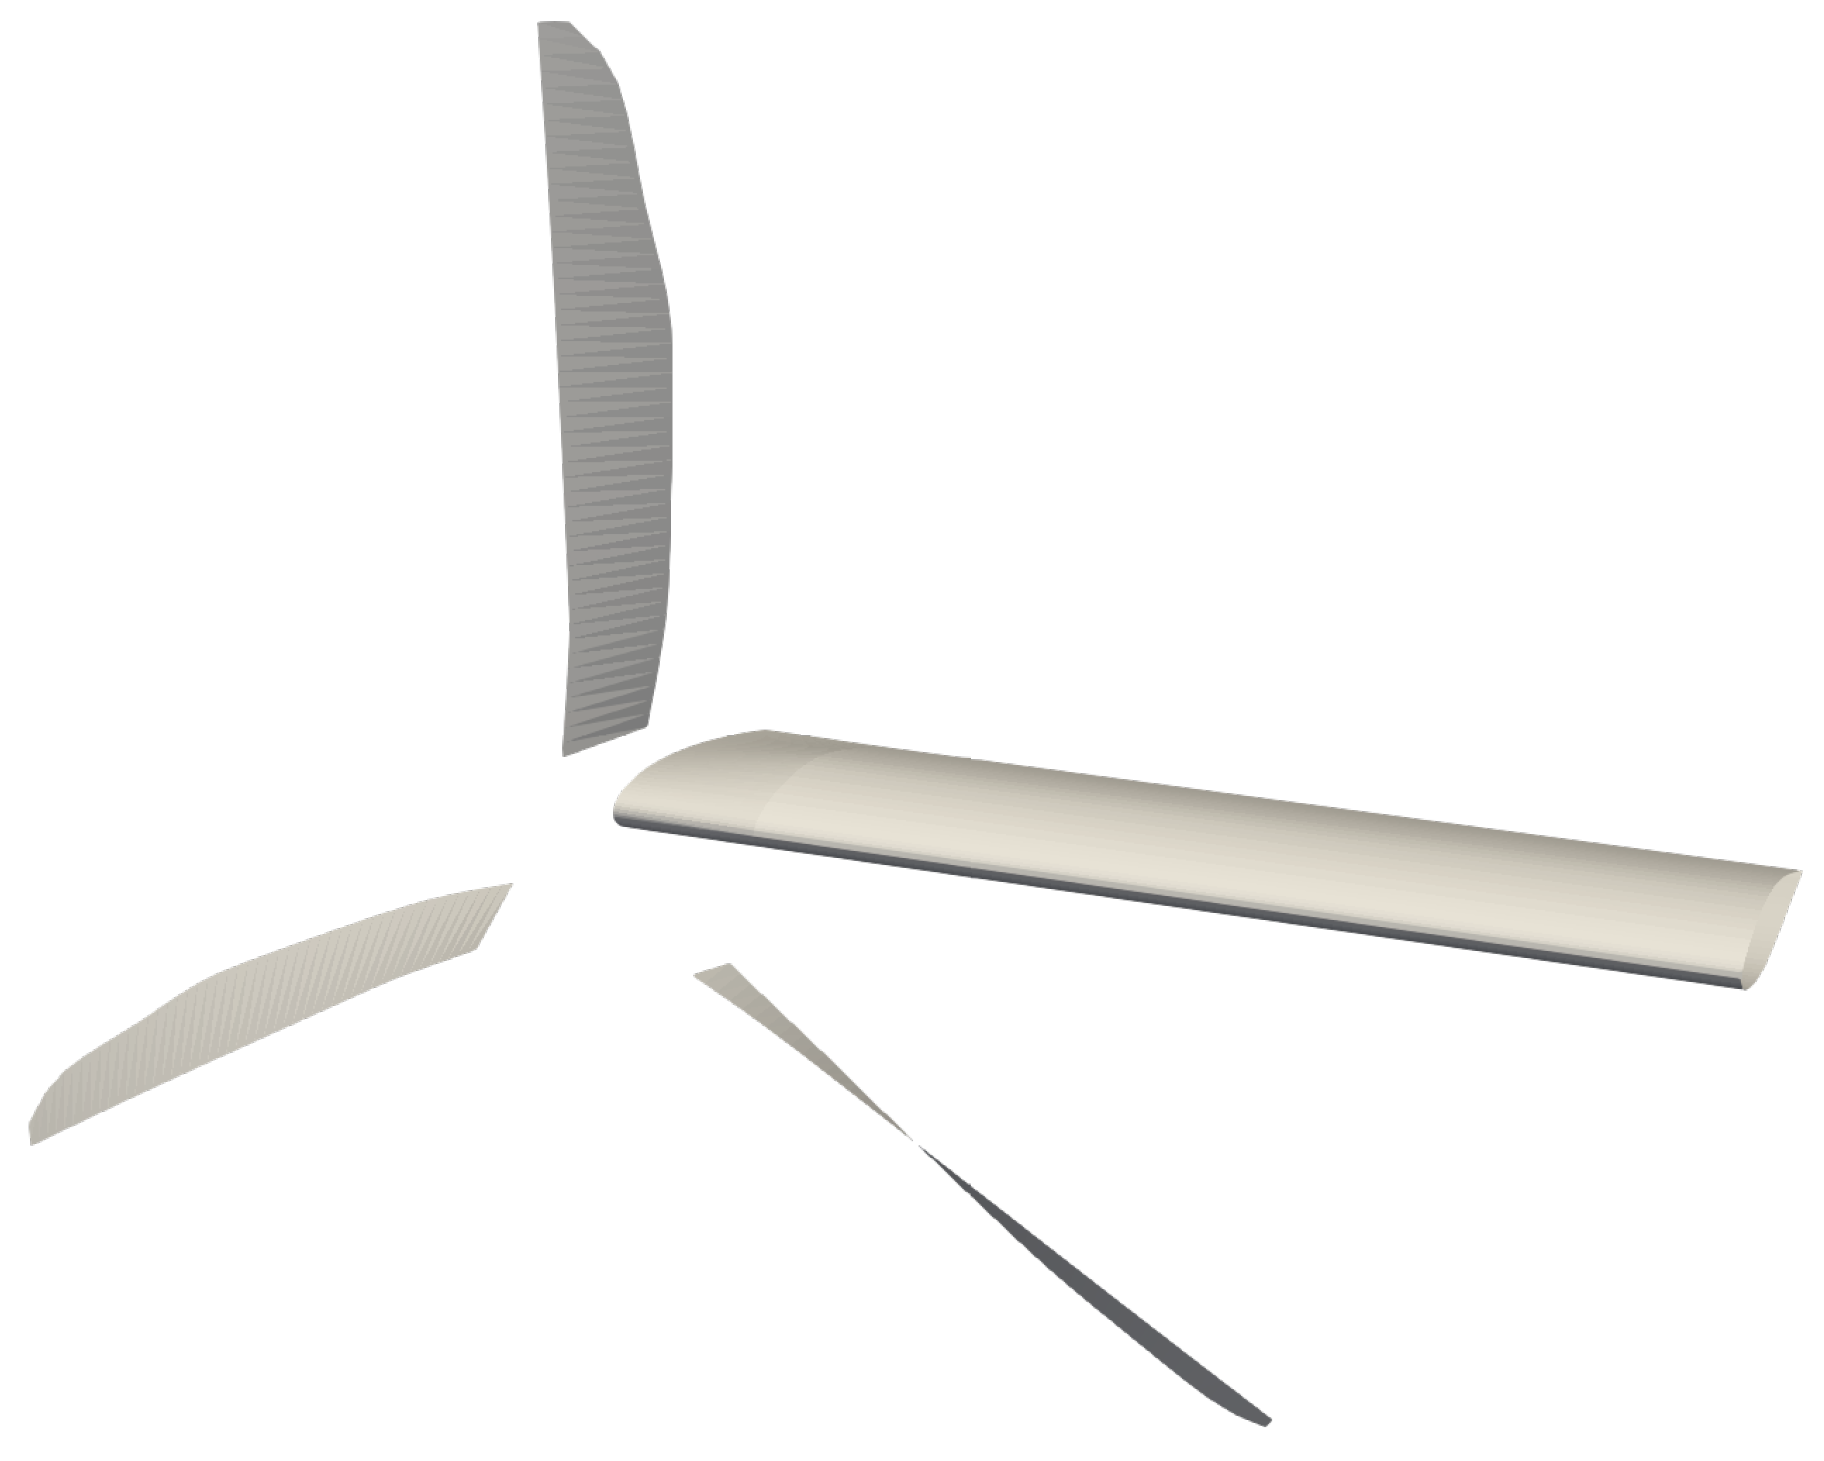
A baseline model was made up of both the semi-span wing and the proprotor model, as shown in Figure 2. The reference system’s origin is located at the wing root. At the same time, the azimuthal angle of the blades ψ is defined as anticlockwise looking in the downstream direction, with ψ = 0° being the blade pointing toward the z-direction. The main rotor data taken from the original CAMRAD-JA model presented in [39] are listed in Table 1.
The numerical model of the full-scale XV-15 right-hand proprotor was built based on the actual airfoil shape, chord, twist, sweep, and dihedral distributions for the blades provided by [39]. Lifting line elements were used to model each of the three blades, enabling us to consider the viscosity contributions to aerodynamic loads from tabulated sectional aerodynamic data. The aerodynamic characteristics of the blade airfoils were initially obtained using XFOIL simulations [40], up to the stall angle of attack. These two-dimensional lift and drag curves were then extrapolated to cover the full range of angles of attack, from −180° to +180°, following the procedures described in [41,42].
A spatial and time dependence analysis on the DUST proprotor model was performed in a previous work [43], showing an optimal spatial discretization of 25 lifting line elements for each blade that was also used in the present model. Moreover, preliminary simulations with DUST were performed for the single proprotor at different flight speeds. These simulations enabled us to find the collective angle to be used in DUST simulations to trim the proprotor thrust and torque evaluated by CAMRAD-JA in [44], considered as reference target for the proprotor performance. The results of these preliminary simulations presented in Figure 3 show that the DUST numerical model effectively matches the proprotor thrust and torque in the whole range of flight speed tested by using a downward shift of the collective angle with respect to the CAMRAD-JA model. We want to match the comparison of the computed trimming collective pitch angle, such as the targeting rotor performance of [44], in terms of thrust and torque reported in Figure 3a,b, which indicates the correlation goodness of the DUST numerical model.
The baseline wing geometry was reproduced using the airfoil data of the aircraft given by [45] and was modeled in DUST using surface panel elements, whereas the wake was modeled by vortex particles. At the airfoil’s trailing edge, one vortex panel is shed in the wake before conversion to vortex particles. The evolution of the particles is obtained thanks to a fast-multipole method [46]. The spatial discretization of the wing was selected considering preliminary simulations performed with DUST on the same geometry described in previous works [34,43]. In particular, the use of 35-chord panels represented a fair compromise between accuracy and little computational effort.
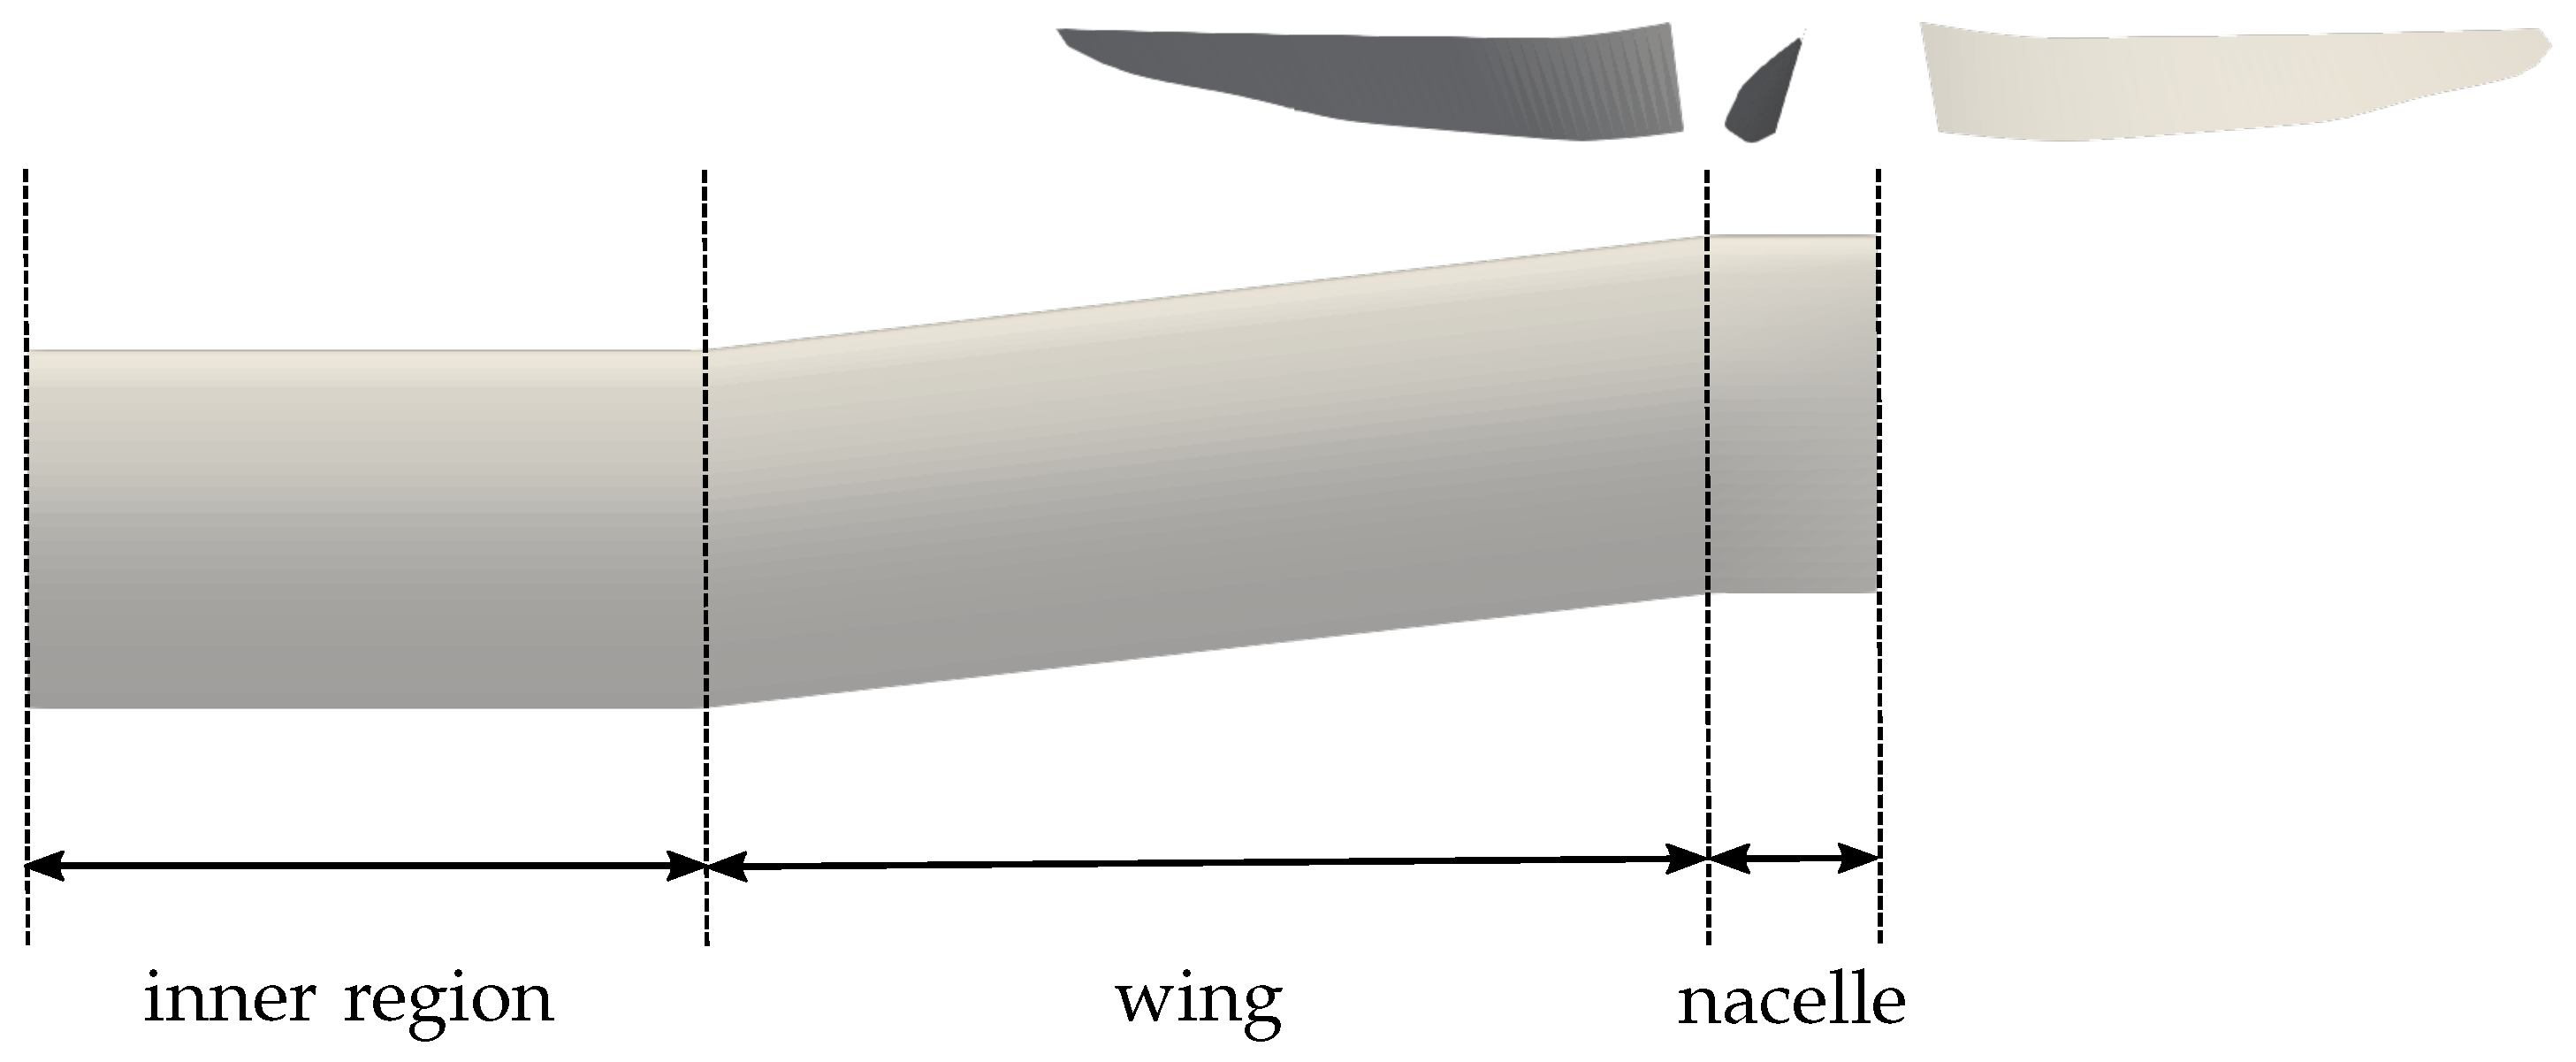
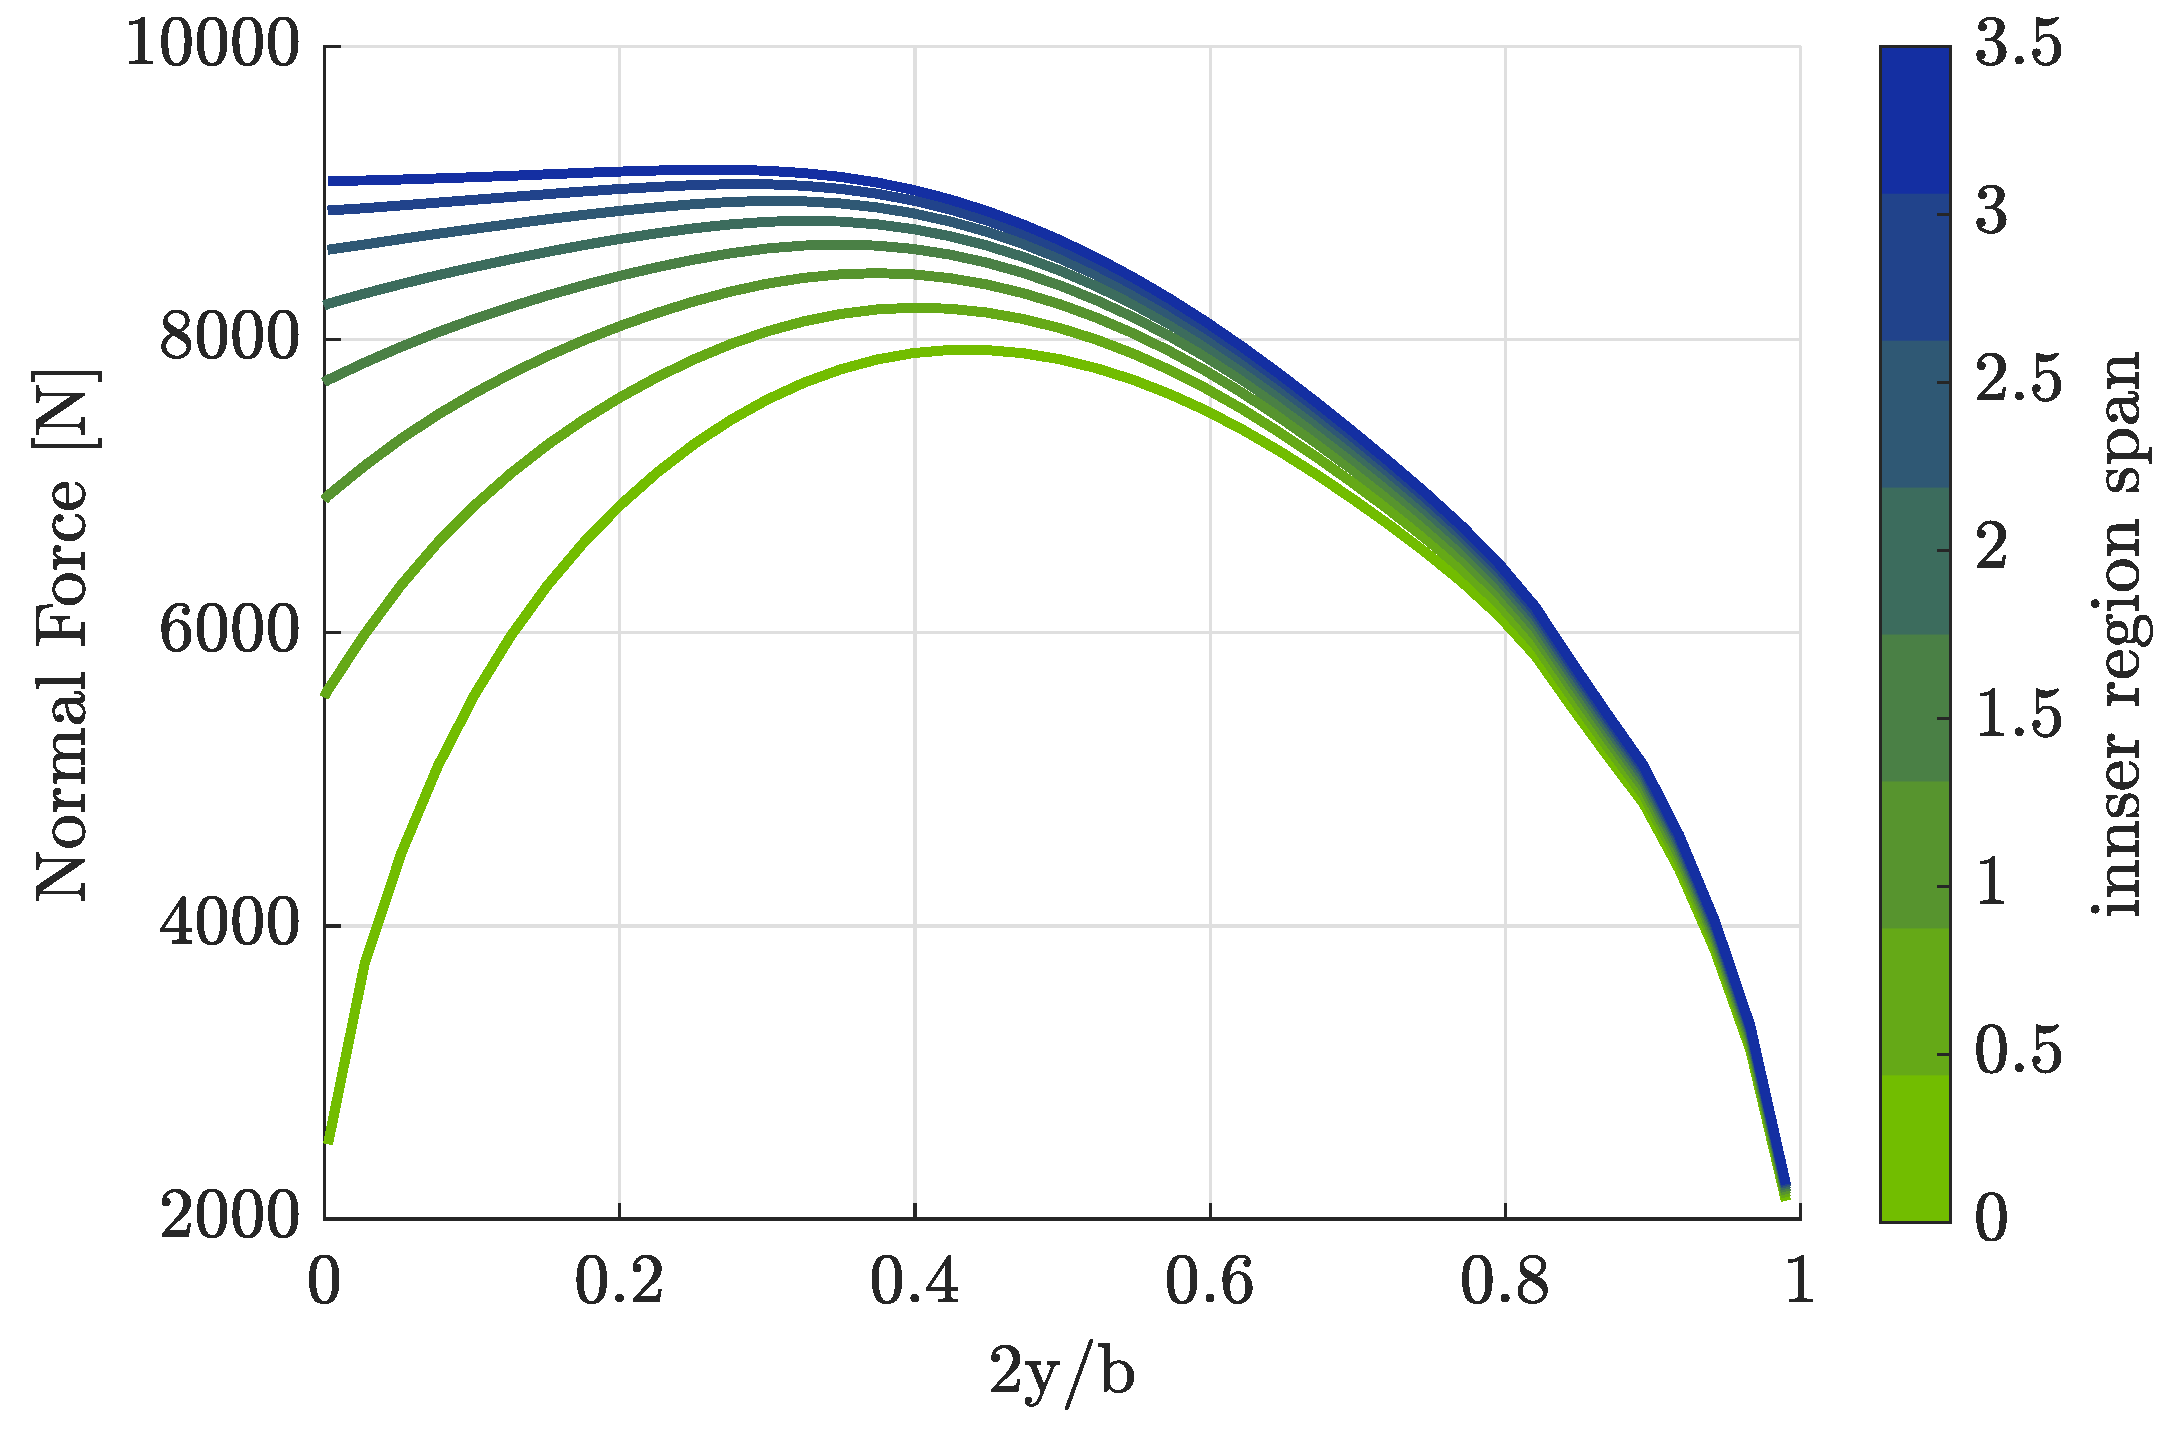
The wing is modeled with a transition region behind the proprotor instead of the nacelle to link the outboard section of the baseline wing with the inner section of the wing extension, which is the object of the optimization. The choice to not model the nacelle geometry was dictated by the will to limit the computational effort of the simulations, as required by a typical optimization procedure performed in the preliminary design of a novel aircraft, and to avoid possible uncertainties related to the simulation of the aerodynamics of a bluff body, which is difficult to capture with a potential approach implemented in mid-fidelity solvers. For the same reasons, the effect of the fuselage on the loads at the wing root was modeled by lengthening the wing inwards. The complete baseline model, with the inner and nacelle region, is illustrated in Figure 4. Figure 5 shows the analysis performed by DUST simulations that led to the final selection of the length of this inner region. The plot reports the sectional normal load per unit wingspan as a function of the inner region length. As it can be seen, a 3 m inner region provides a flat behavior of the normal load at the wing root, resembling the effect of the fuselage [25,43].
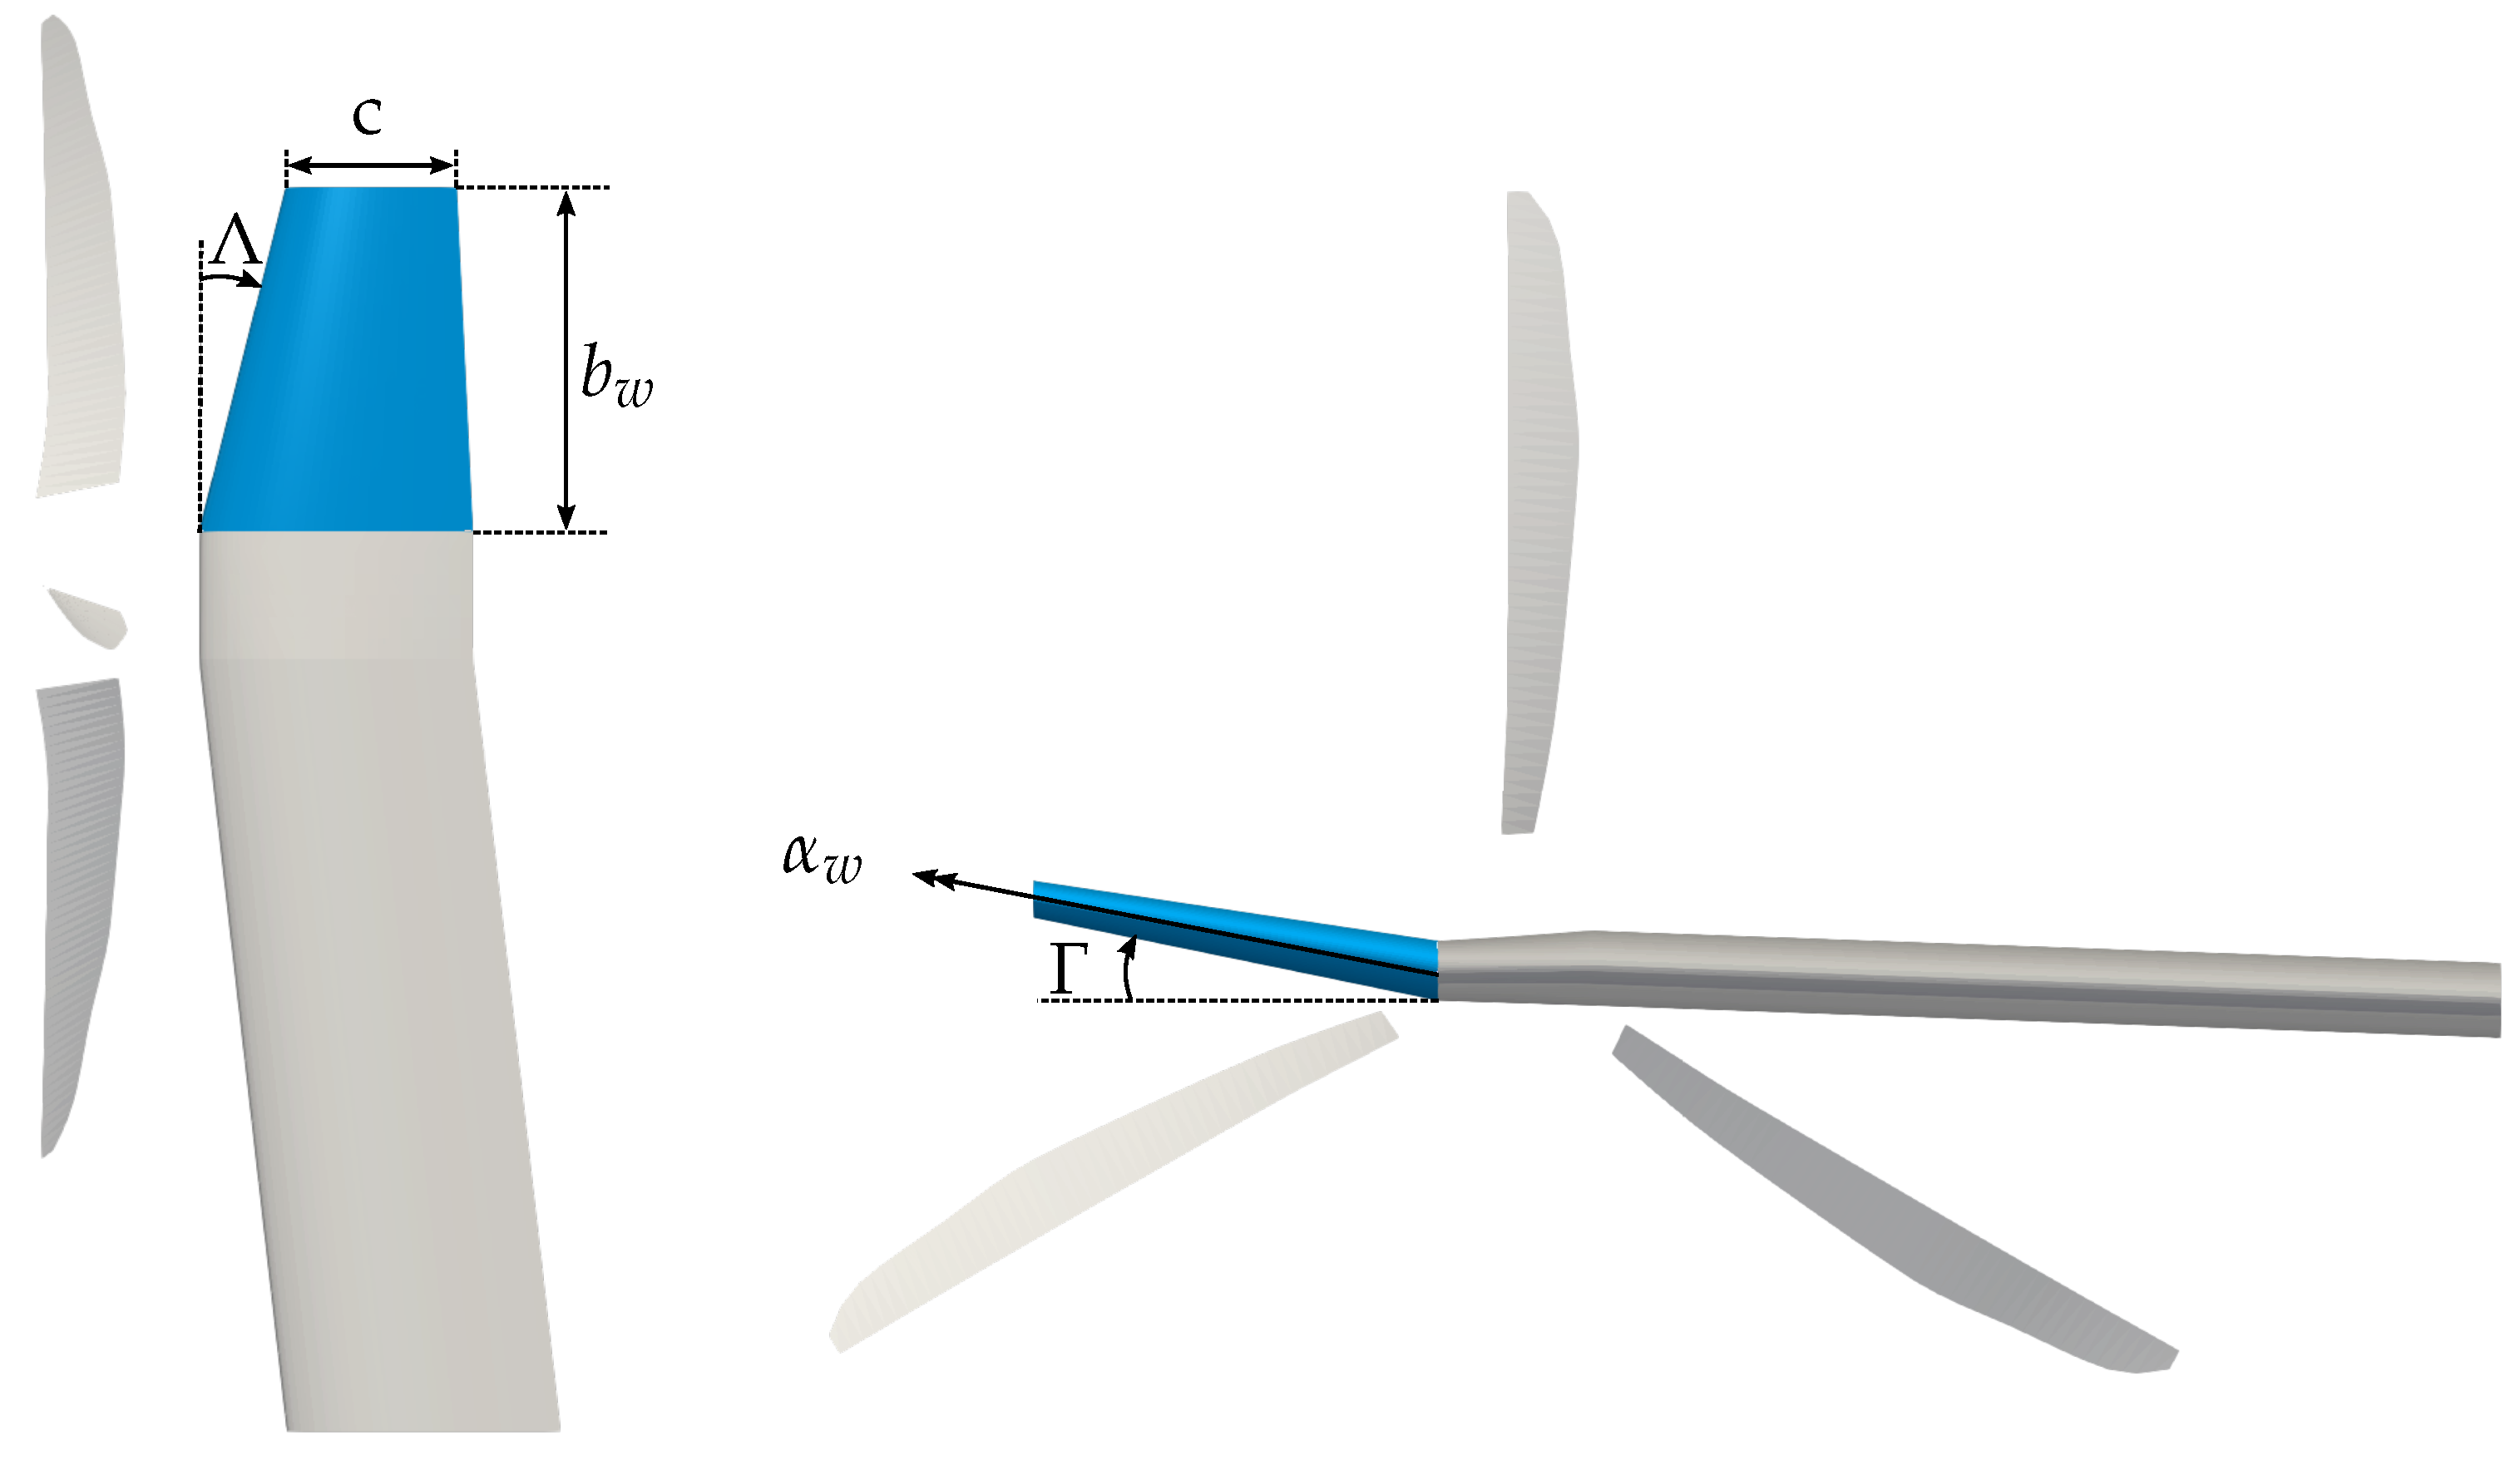
The numerical model is completed with the addition of an outboard wing extension that is the subject of the present study. The selection of design parameters was guided by industrial requirements derived from a parallel investigation on the Advanced Tiltrotor Aircraft (ATA) in collaboration with Leonardo Helicopters, while preserving confidentiality of proprietary data. This outboard region is highlighted in Figure 6 and is characterized by five parameters: the sweep angle Λ , the dihedral angle Γ , the span b w , the incidence angle α w and the tip chord c. These five parameters allow for a complete geometrical design of the wing extension. The mesh for the complete model is illustrated in Figure 7.
In the present work, a representative example of cruise flight condition was considered at 133.8 m s−1 with the proprotor operating at 82% RPM. Indeed, takeoff and landing are performed through vertical flight conditions; thus, unlike fixed-wing aircraft, these conditions do not constrain the design process of the wing extensions in a tiltrotor vehicle.
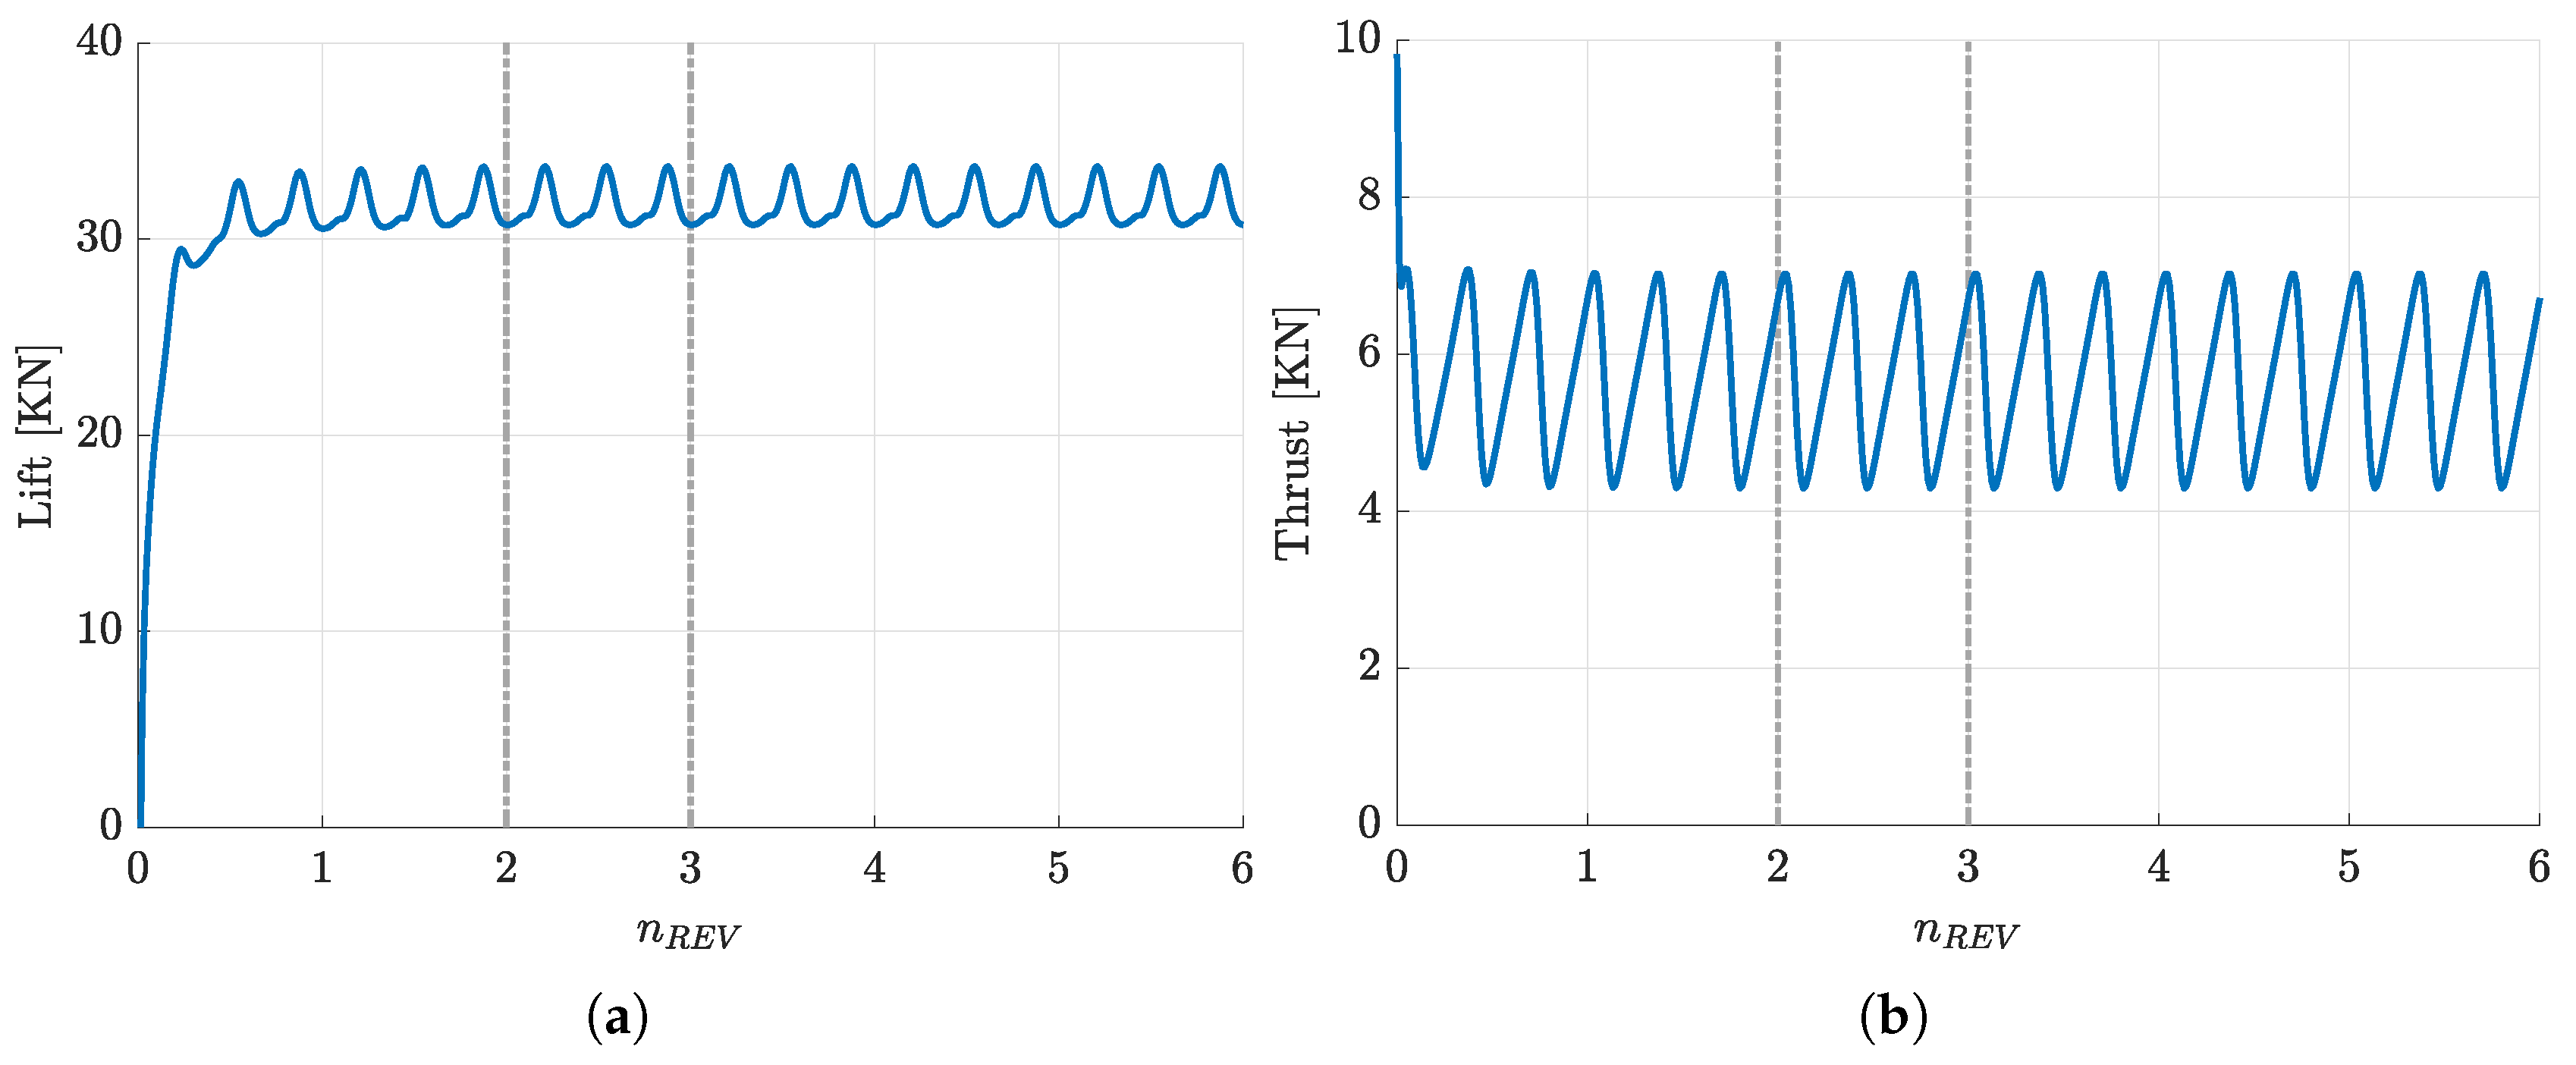
Based on the time dependence analysis performed on DUST proprotor models in previous works [25,43], 90-time steps for every rotor revolution have been chosen for the complete model simulations. This choice provides a negligible change in the average thrust and torque coefficients after two revolutions, as shown by the time histories shown in Figure 8. Thus, in the following, the loads on the system to be used in the optimization methodology are collected during the third proprotor revolution.
Each DUST simulation performed on the complete proprotor/wing model took less than 12 min on a workstation equipped with an Intel® CoreTM i7-10700 processor running at a base frequency of 2.90 GHz with 8 physical cores and 2 threads for each core. Such short timeframes required by the simulations allowed for enlarging the dataset of parameters to be considered in the optimization framework as described in the following section. The very low computational effort required by DUST thus highlights the suitability of the solver for a valuable preliminary design of a complex rotorcraft configuration, which requires a huge number of configurations to be investigated and is not affordable with high-fidelity CFD.

2.2. High-Fidelity Numerical Model

The numerical model built for the CFD analysis includes the wing with span equal to the real aircraft and the proprotor modeled as an actuator disk based on a simple momentum theory with a constant static pressure jump across the disk as described in [47]. A symmetry boundary condition on the longitudinal plane is directly imposed to reproduce a half-model configuration. The adopted grid is a mixed-element unstructured mesh composed of tetrahedra, prisms, and pyramids around a surface discretized using quads for the wing and triangles–quads for the actuator disk baffle surface. A grid refinement between the rotor region and the wing is achieved by two sub-zones, see Figure 9a, to improve the capability to capture the interaction between the rotor/wing wakes. The far-field boundary is located approximately more than 50 body chord lengths away from the aircraft. The thickness of the first boundary layer element is set to allow y + 1 (see Figure 9b).
Convective fluxes are computed using a JST-centered scheme, turbulent variables are convected with a first-order upwind method, viscous fluxes are calculated with the corrected average-gradient approach, and the implicit solver with local time stepping and BCGSTAB ensures convergence to the steady-state solution with a tolerance of 𝒪(10−4).
The pressure drop across the actuator disc is derived from the trimmed thrust value evaluated by the preliminary DUST simulations on the single proprotor at the corresponding flight condition considered in the present work (see Figure 3a). A grid convergence study was performed using three grids with 8, 14, and 20 million elements, respectively. Simulation results on the intermediate mesh provide a difference of less than 0.5% in terms of both wing lift and drag coefficient compared to the finer mesh, with calculation time approximately halved. Thus, the high-fidelity simulations considered in the optimization methodology were performed using the intermediate mesh. Each simulation required 3000 iterations to reach load convergence and a computational time of about 3 h using a workstation equipped with a Dual Intel Xeon Gold 6230R @ 2.10 Ghz with a processor of 52 cores.

3. Design Methodology

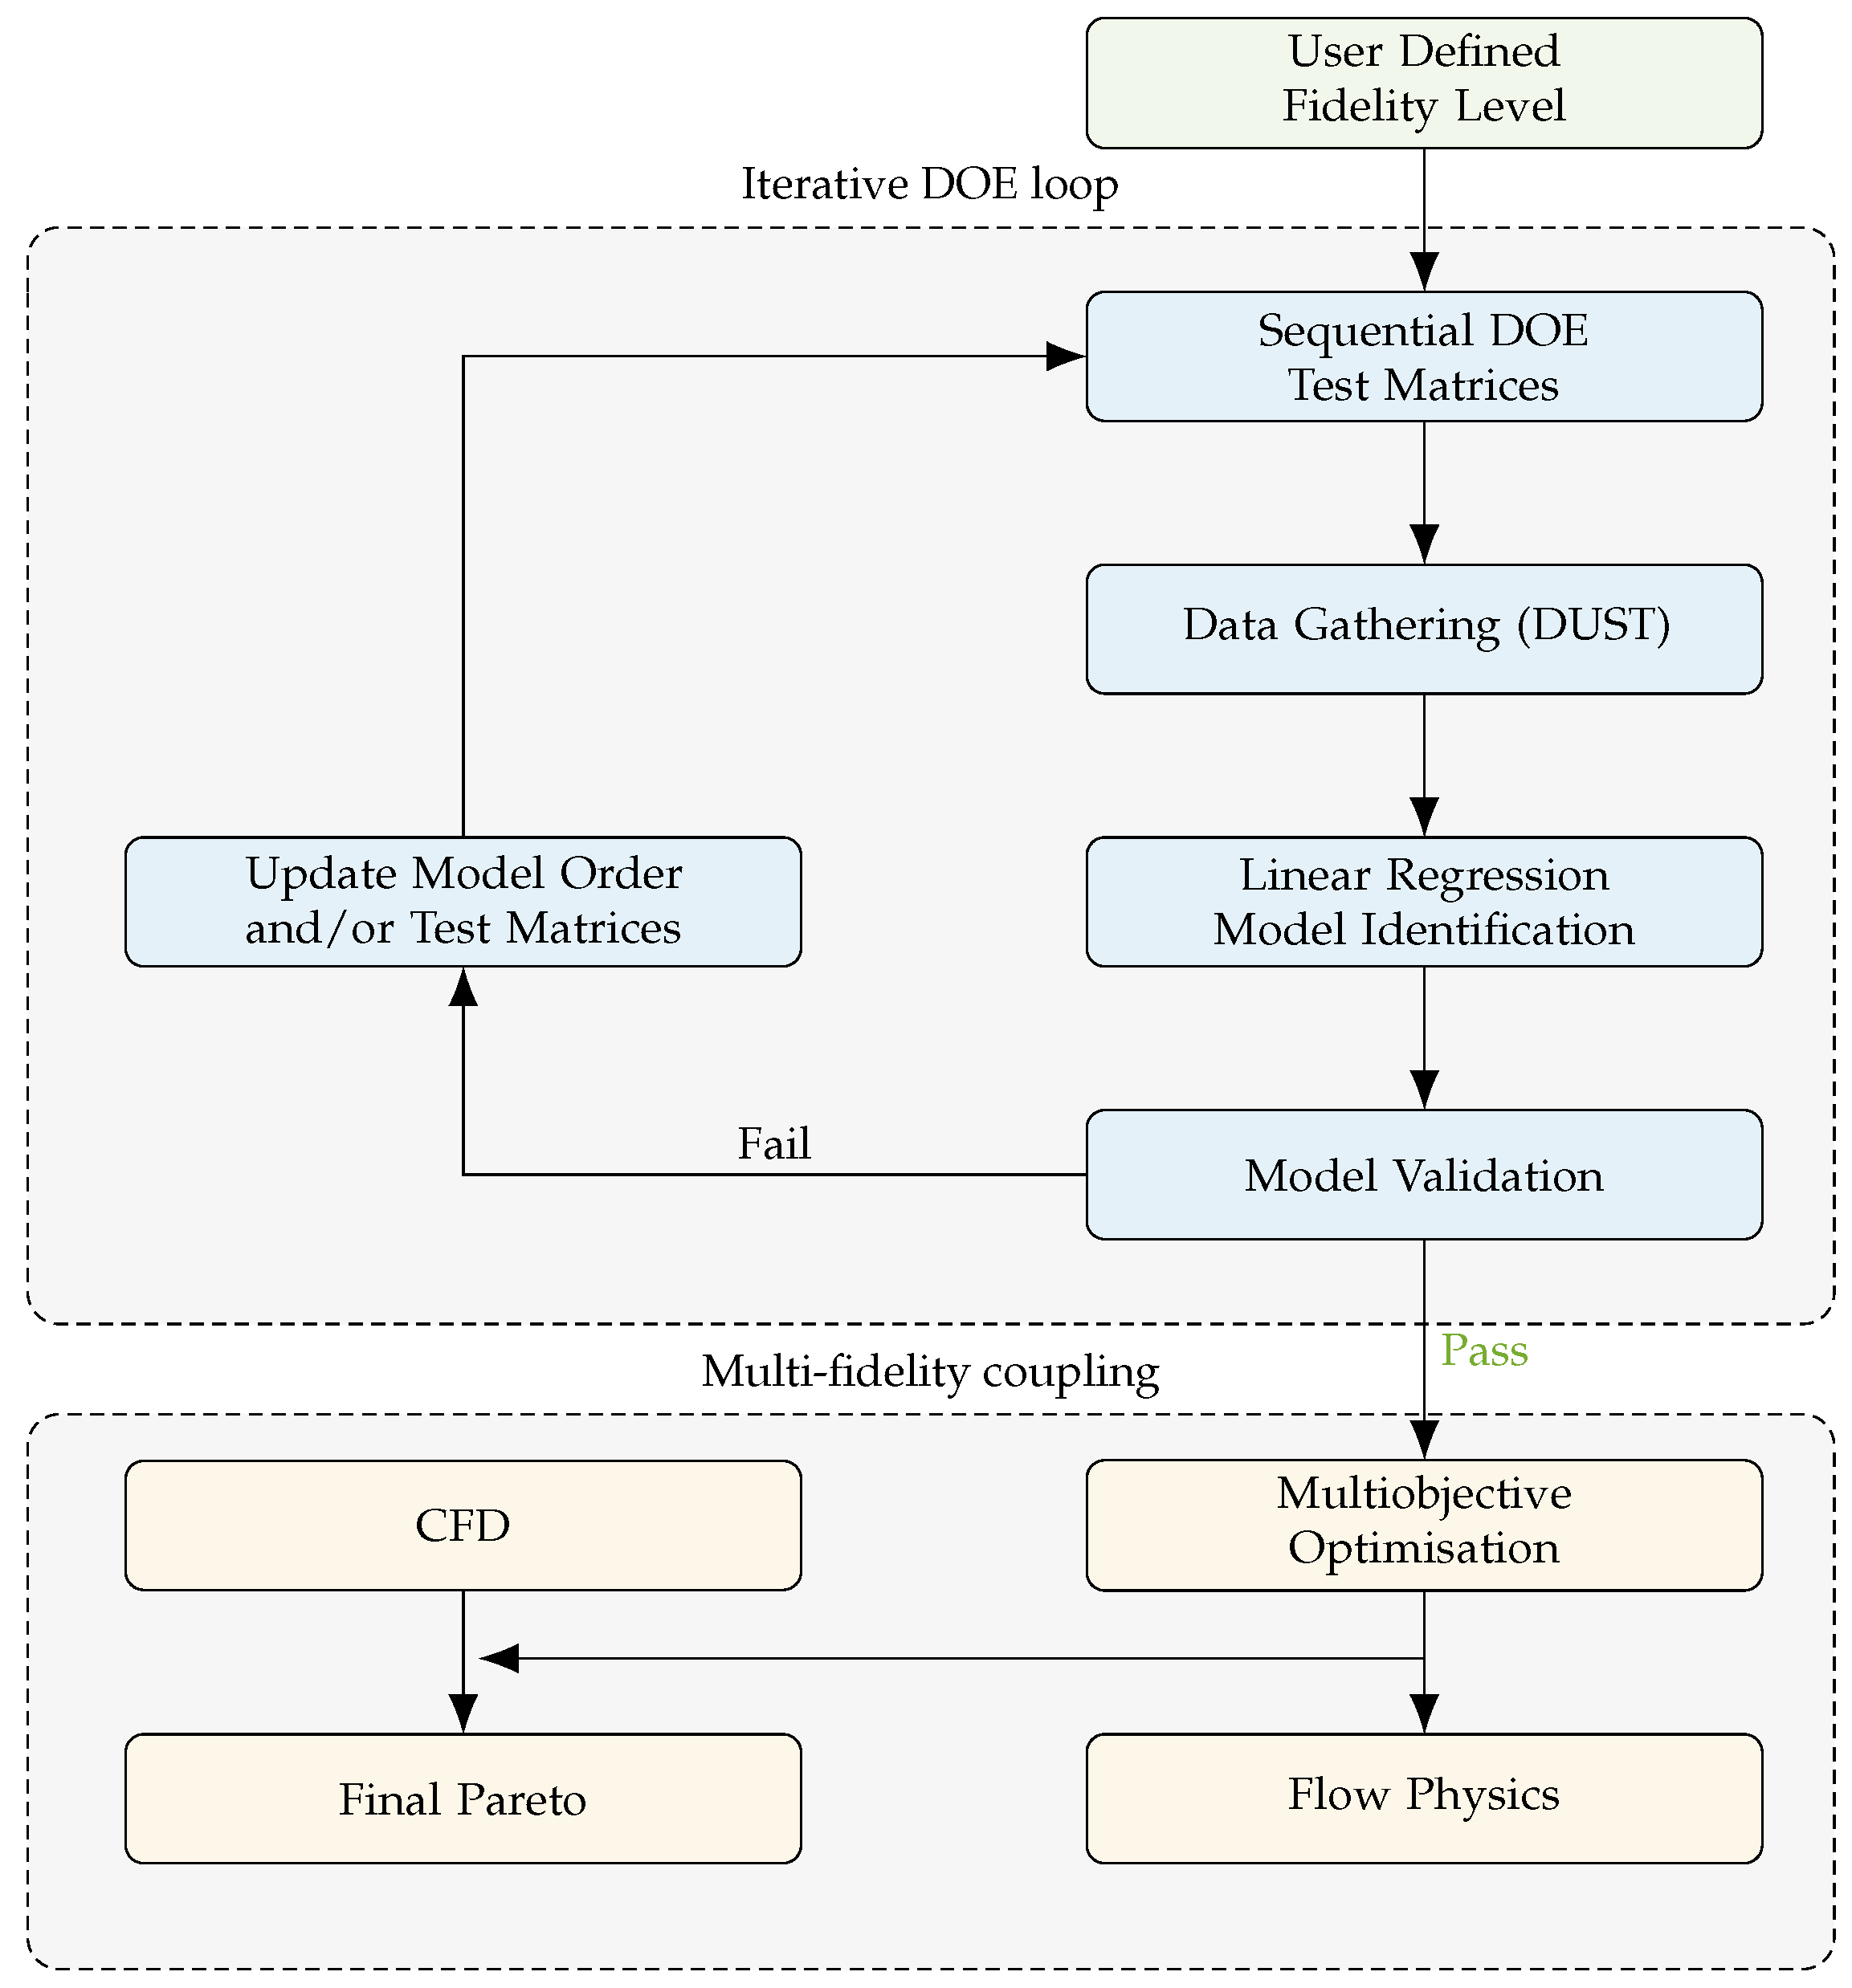
The methodology proposed in this work to optimize the geometry of the outer wing of the XV-15 Tiltrotor Aircraft is based on Rapid Aero Modeling (RAM), developed at NASA Langley Research Center, described in Murphy [48] and Simmons [32,49,50]. This methodology is focused on a Design Of Experiment (DOE) approach [51] where, in the present case, the use of mid-fidelity numerical simulations performed with DUST allows to meet a high level of fidelity for the aerodynamic performance of the wing by keeping low the computational effort required for the optimization process, thus highlighting the suitability of this process for an efficient preliminary design of novel aircraft configurations. Moreover, the use of a physics-based numerical model of the wakes, such as the one implemented in DUST, enables us to investigate the influence of this novel wing extension concept regarding rotor/wing interaction, thus highlighting the differences in rotor and wing loads for some selected configurations identified by the genetic algorithm used for multi-objective optimization. The individual steps of the methodology used in this work are shown in the block diagram of Figure 10 and will be described in more detail in the following subsections.

3.1. Iterative DOE Loop

Experimental design is a crucial tool for optimizing the production process in science and engineering [51]. Experiments frequently incorporate many variables, and finding how these elements affect the system’s output response is often relevant. A researcher can employ a variety of strategies of experimentation. One of the simplest is the one-factor-at-a-time (OFAT) approach to experimentation, which is often employed in practice but typically yields inferior results. On the other hand, a statistical technique would always be more effective, as conducting a factorial experiment is the appropriate course of action when dealing with several variables, as in the present test case. Indeed, this technique makes the most efficient use of the experimental data. Before beginning with the procedure, a fidelity level was chosen for the aerodynamic model of the wing and rotor system. In particular, in the present work, the desired accuracy when predicting forces and moments was less than 1% difference for both the response variables chosen. The feedback loop ensures that the selected fidelity level is reached by updating the DOE approach.
Before the iterative loop, the statement has to be recognized, and the response variables have to be selected. In this case they are wing efficiency E and bending moment M b at the wing root. The other, and most important, step in pre-experimental planning is the choice of the design factors and their range. The design factors are the parameters that vary in the experiment and, therefore, are considered to influence the system’s performance. Here, the sweep angle Λ , dihedral angle Γ , span b w , tip chord c, and incidence α w of the winglet were chosen as shown in Figure 6. These allow for a complete geometrical design of the aerodynamic surface object of investigation. Ultimately, the design factor ranges selected in the present investigation are shown in Table 2. In particular, span and tip chord ranges were chosen in order to provide the minimum and maximum surface area as suggested in [30].
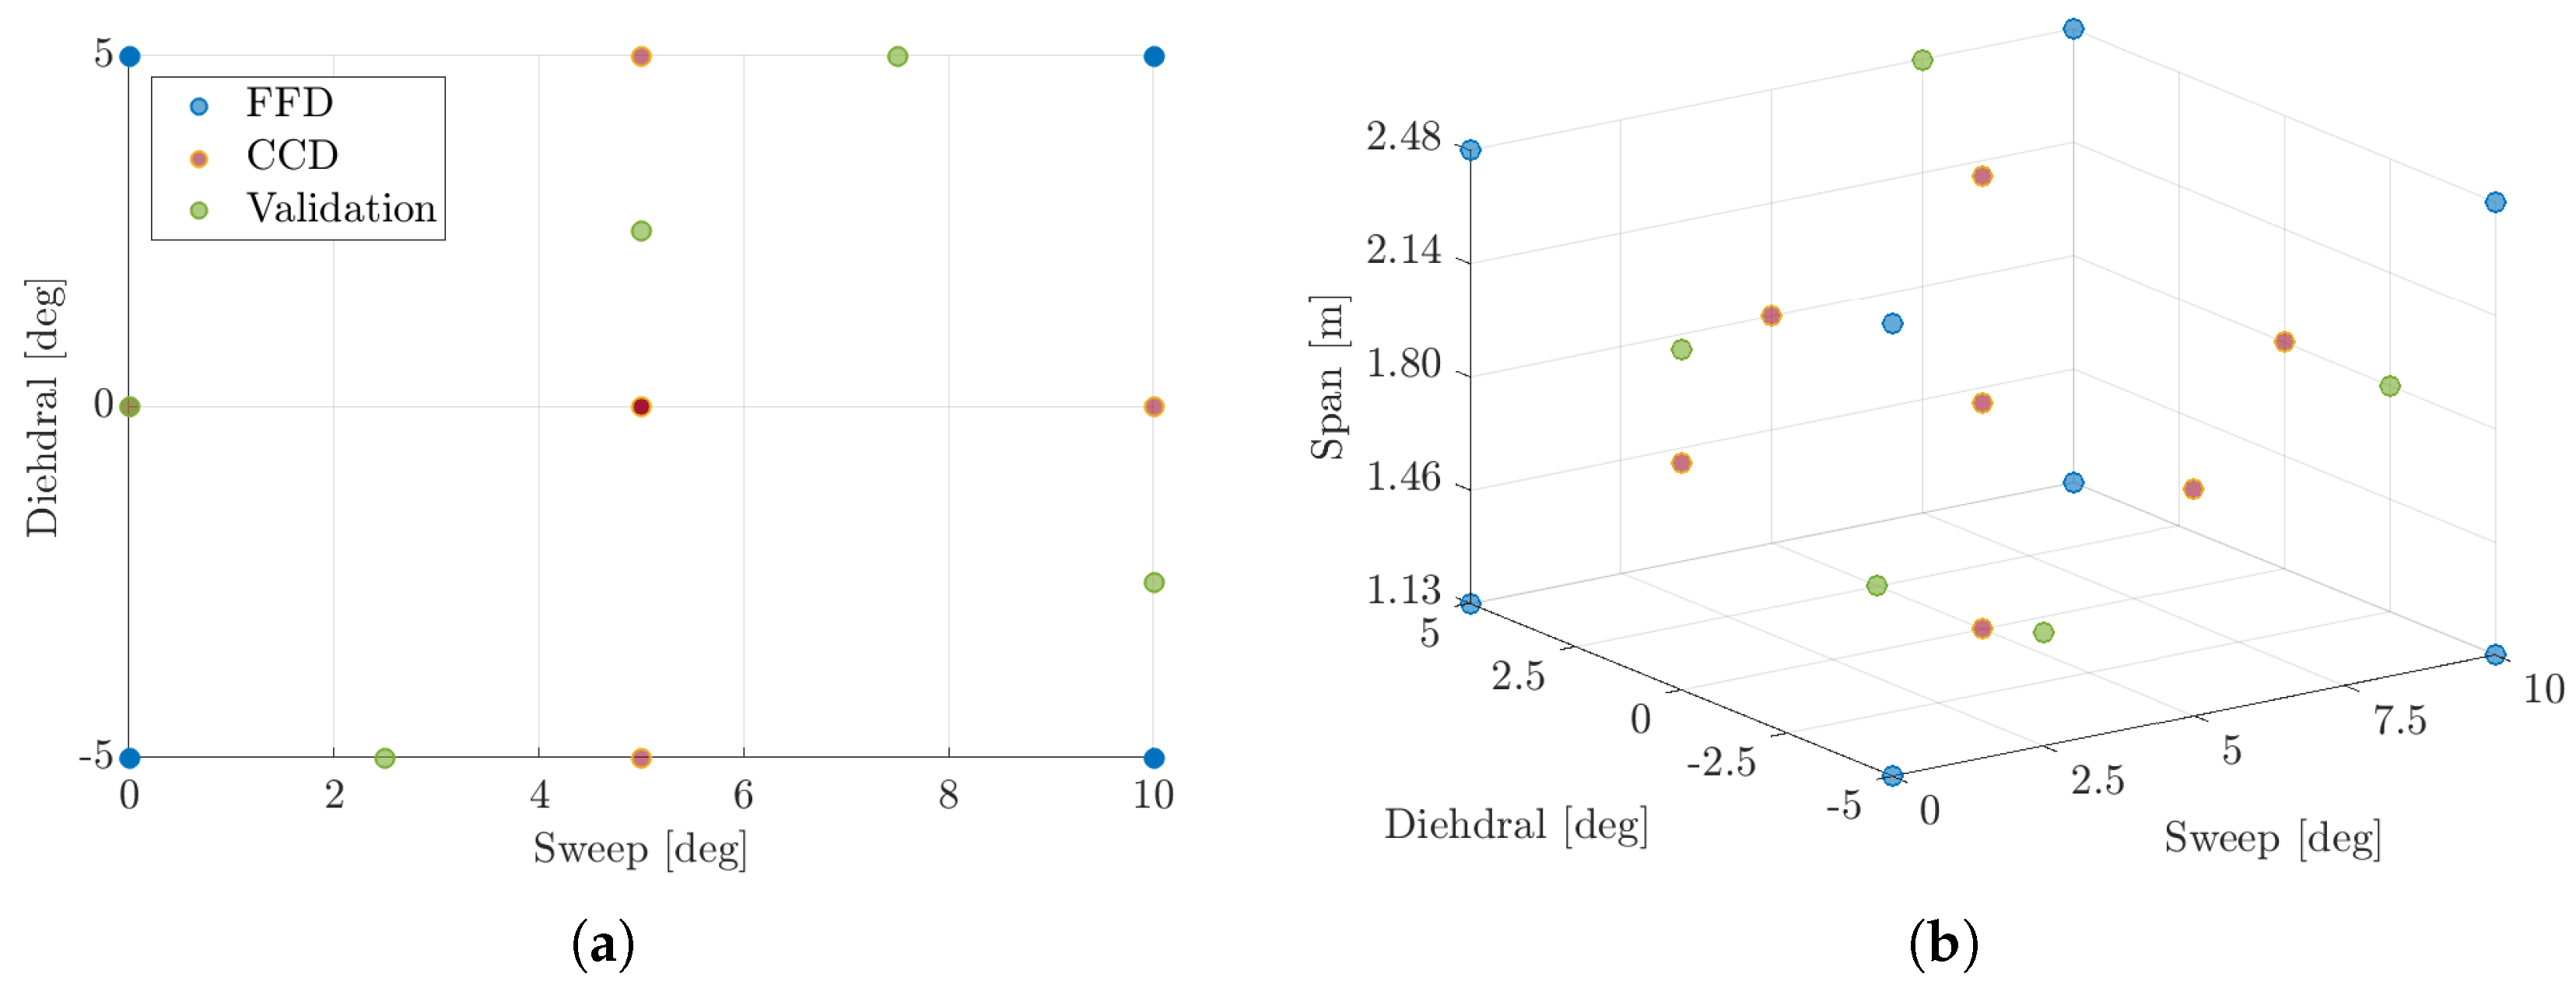
The next step is to select an appropriate experimental design. A Full Factorial Design (FFD) including all the potential factor combinations is chosen as the first design. The factors are divided into two levels, which leads to a 2 5 factorial design. This design could be completed using a Central Composite Design (CCD), where a group of 10 axial points and their center points are added to the previous design. The two blocks are shown in Figure 11a and Figure 11b, respectively, for two and three variables; see Figure 11b. These figures also show the validation block, composed of five points provided by a Latin Hypercube Design (LHD), which are used during the model’s validation process.
The selected points of the DOE test matrices are then simulated in the test facility to gather data. In the present work, computational experiments are performed by using the mid-fidelity aerodynamic tool DUST that, in this phase, allows for a comprehensive number of fast and reliable simulations as required in a preliminary design process.
The DOE procedure enabled us to identify the aircraft system. The next step in the methodology is to use a regression model to fit the sample data gathered in order to reveal the relationship between the response variables and the independent geometrical variables coming from the DOE. In the following, details of the multivariate linear regression model implemented in this work, to be then used by a genetic algorithm in the context of multi-objective optimization, are given.
As mentioned, regression analysis is used to predict the relationship between the response variables and the explanatory factors. In particular, finding a proper mathematical description of aerodynamic forces and moments, described in terms of geometrical variables, is the goal of this phase of the methodology. The result of the system’s identification is a model that predicts the wing’s efficiency E and root bending moment M b based on the values of a set of predictor geometrical variables. In this work, multivariate linear regression [52] was used to estimate the coefficients of the following linear equation,
Y i j = a 0 j + a 1 j X i 1 + a 2 j X i 2 + a 3 j X i 3 + + a p j X i p ,
for all observations indexed as i = 1 , , n , for all dependent variables indexed as j = 1 , , m , and for all p independent variables. A regression model was implemented using Scikit-learn, a Python library that provides a wide range of advanced machine learning algorithms [53]. Polynomial features were employed to capture the often nonlinear interactions between input variables. While linear regression is linear with respect to the model parameters, adding polynomial terms allows the model to approximate non-linear relationships [54]. These polynomial features are generated by raising existing input variables to a given power. For instance, if a dataset contains a single input feature X, a new feature X2 is added to represent its square. This procedure can be applied to all input variables, producing a transformed dataset. Additionally, interaction terms are created by multiplying two or more features together to capture their combined effects. In the implemented code, a new feature matrix consisting of all polynomial combinations of the features with a degree less than or equal to n is created, where n is an input parameter that has to be tuned inside the iterative loop in order to obtain the user-defined level of fidelity.
Model validation involves testing the adequacy of the model using data that were withheld from the model identification [50], demonstrating that the regression model discovered is applicable. With this aim, the results for the validation points obtained from DUST are compared to the results calculated with the identified model. Thus, the percentage error between them is evaluated and compared to a defined error threshold for all output variables. If the validation test is passed, the process is finalized, and the model can be used for the multi-objective optimization. These validation tests will confirm that the regression model represents the aerodynamic model within some pre-defined acceptable fidelity level.
Table 3 shows the percentage errors during the iterative loop, while changing the order of the polynomial features n in the linear regression and the block matrices for the DOE. As reported, the FFD block alone already delivers good results for second-order polynomial features. The error can be decreased below 0.5%, which is the threshold in this work for both E and M b , when adding the CCD block to the FFD. Consequently, in the present work, the selected model makes use of second-order polynomial features and FFD+CCD DOE test matrices. Indeed, as can be observed by results reported in Table 3, higher-order polynomial features would produce poorer results, resulting in overfitting in the data.

3.2. Multi-Fidelity Coupled Design

Once the aerodynamic model is established, it is employed within a multi-objective optimization framework. The aim is to achieve multiple objectives simultaneously, which naturally results in a set of trade-off solutions, often referred to as Pareto-optimal (PO) solutions. Evolutionary algorithms are particularly well-suited for these problems, as they use a population-based approach where multiple solutions evolve simultaneously, generating a new population at each iteration [55]. This allows the algorithm to identify multiple non-dominated solutions in a single run, capturing the trade-offs among objectives.
Non-dominated points are those that are not outperformed by any other solution in all objectives. A gain in one objective can only be achieved at the expense of another. When plotted in the objective space, these points form the Pareto-optimal front, and the corresponding design variable sets are called PO solutions [55].
The original Non-dominated Sorting Genetic Algorithm (NSGA) [56] was among the first evolutionary methods for multi-objective problems. However, it suffered from high computational cost for non-dominated sorting, lack of elitism, and the need to specify a sharing parameter. To overcome these limitations, this work employs the Elitist Non-dominated Sorting Genetic Algorithm 2 (NSGA-II) [33], which incorporates an elitist strategy, explicit diversity-preserving mechanisms, and emphasizes non-dominated solutions.
Since the exact optimal set of solutions is unknown, convergence performance indicators that do not use knowledge of the exact PO front must be used. In this work, the hypervolume metric is used to analyze the convergence of the solution. The hypervolume only needs a reference point to be provided since it calculates the area that is dominated by the provided set of solutions with respect to this reference point.
Once the regression model is found, it is used inside the multiobjective optimization code, which has been implemented using pym∞, a multiobjective optimization framework in Python [57].
Since the Pareto front is obtained using mid-fidelity aerodynamic simulations, the information about the boundary layer will not be present. Therefore, the efficiency E calculated for the wing will not be physical and will have wrong values. This can be corrected with high-fidelity CFD simulations, which carry the information about viscosity. Only a few selected points on the Pareto front will be simulated in CFD, given its high computational cost. These points will form a new and more accurate Pareto front and will be used to correct the one found with DUST. This multi-fidelity approach is of best use since finding a Pareto front exclusively with CFD could be very costly in terms of computational time, especially in the case of a complex configuration.

4. Results

The major outcomes of the numerical simulations performed using DUST are presented in the following section. The results of the Design Of Experiment procedure will be used to find the PO front. From the latter, four configurations will be analyzed, highlighting the aerodynamic interactions between the proprotor and wing. CFD simulations of these four configurations will finally performed to correct the PO front.
The first significant result presented here is that by adding a wing extension, the 50% increase in wing lift at the considered flight condition has been obtained, whereas the decrease in induced drag was of 20%. Furthermore, by adding a wing extension, the wing efficiency has improved by more than 30% over the mean results from the 25 DOE configurations. Therefore, the predicted benefits of using wing extensions in tiltrotor applications [30] are confirmed for the wing.

4.1. Pareto-Optimal Front: Optimization

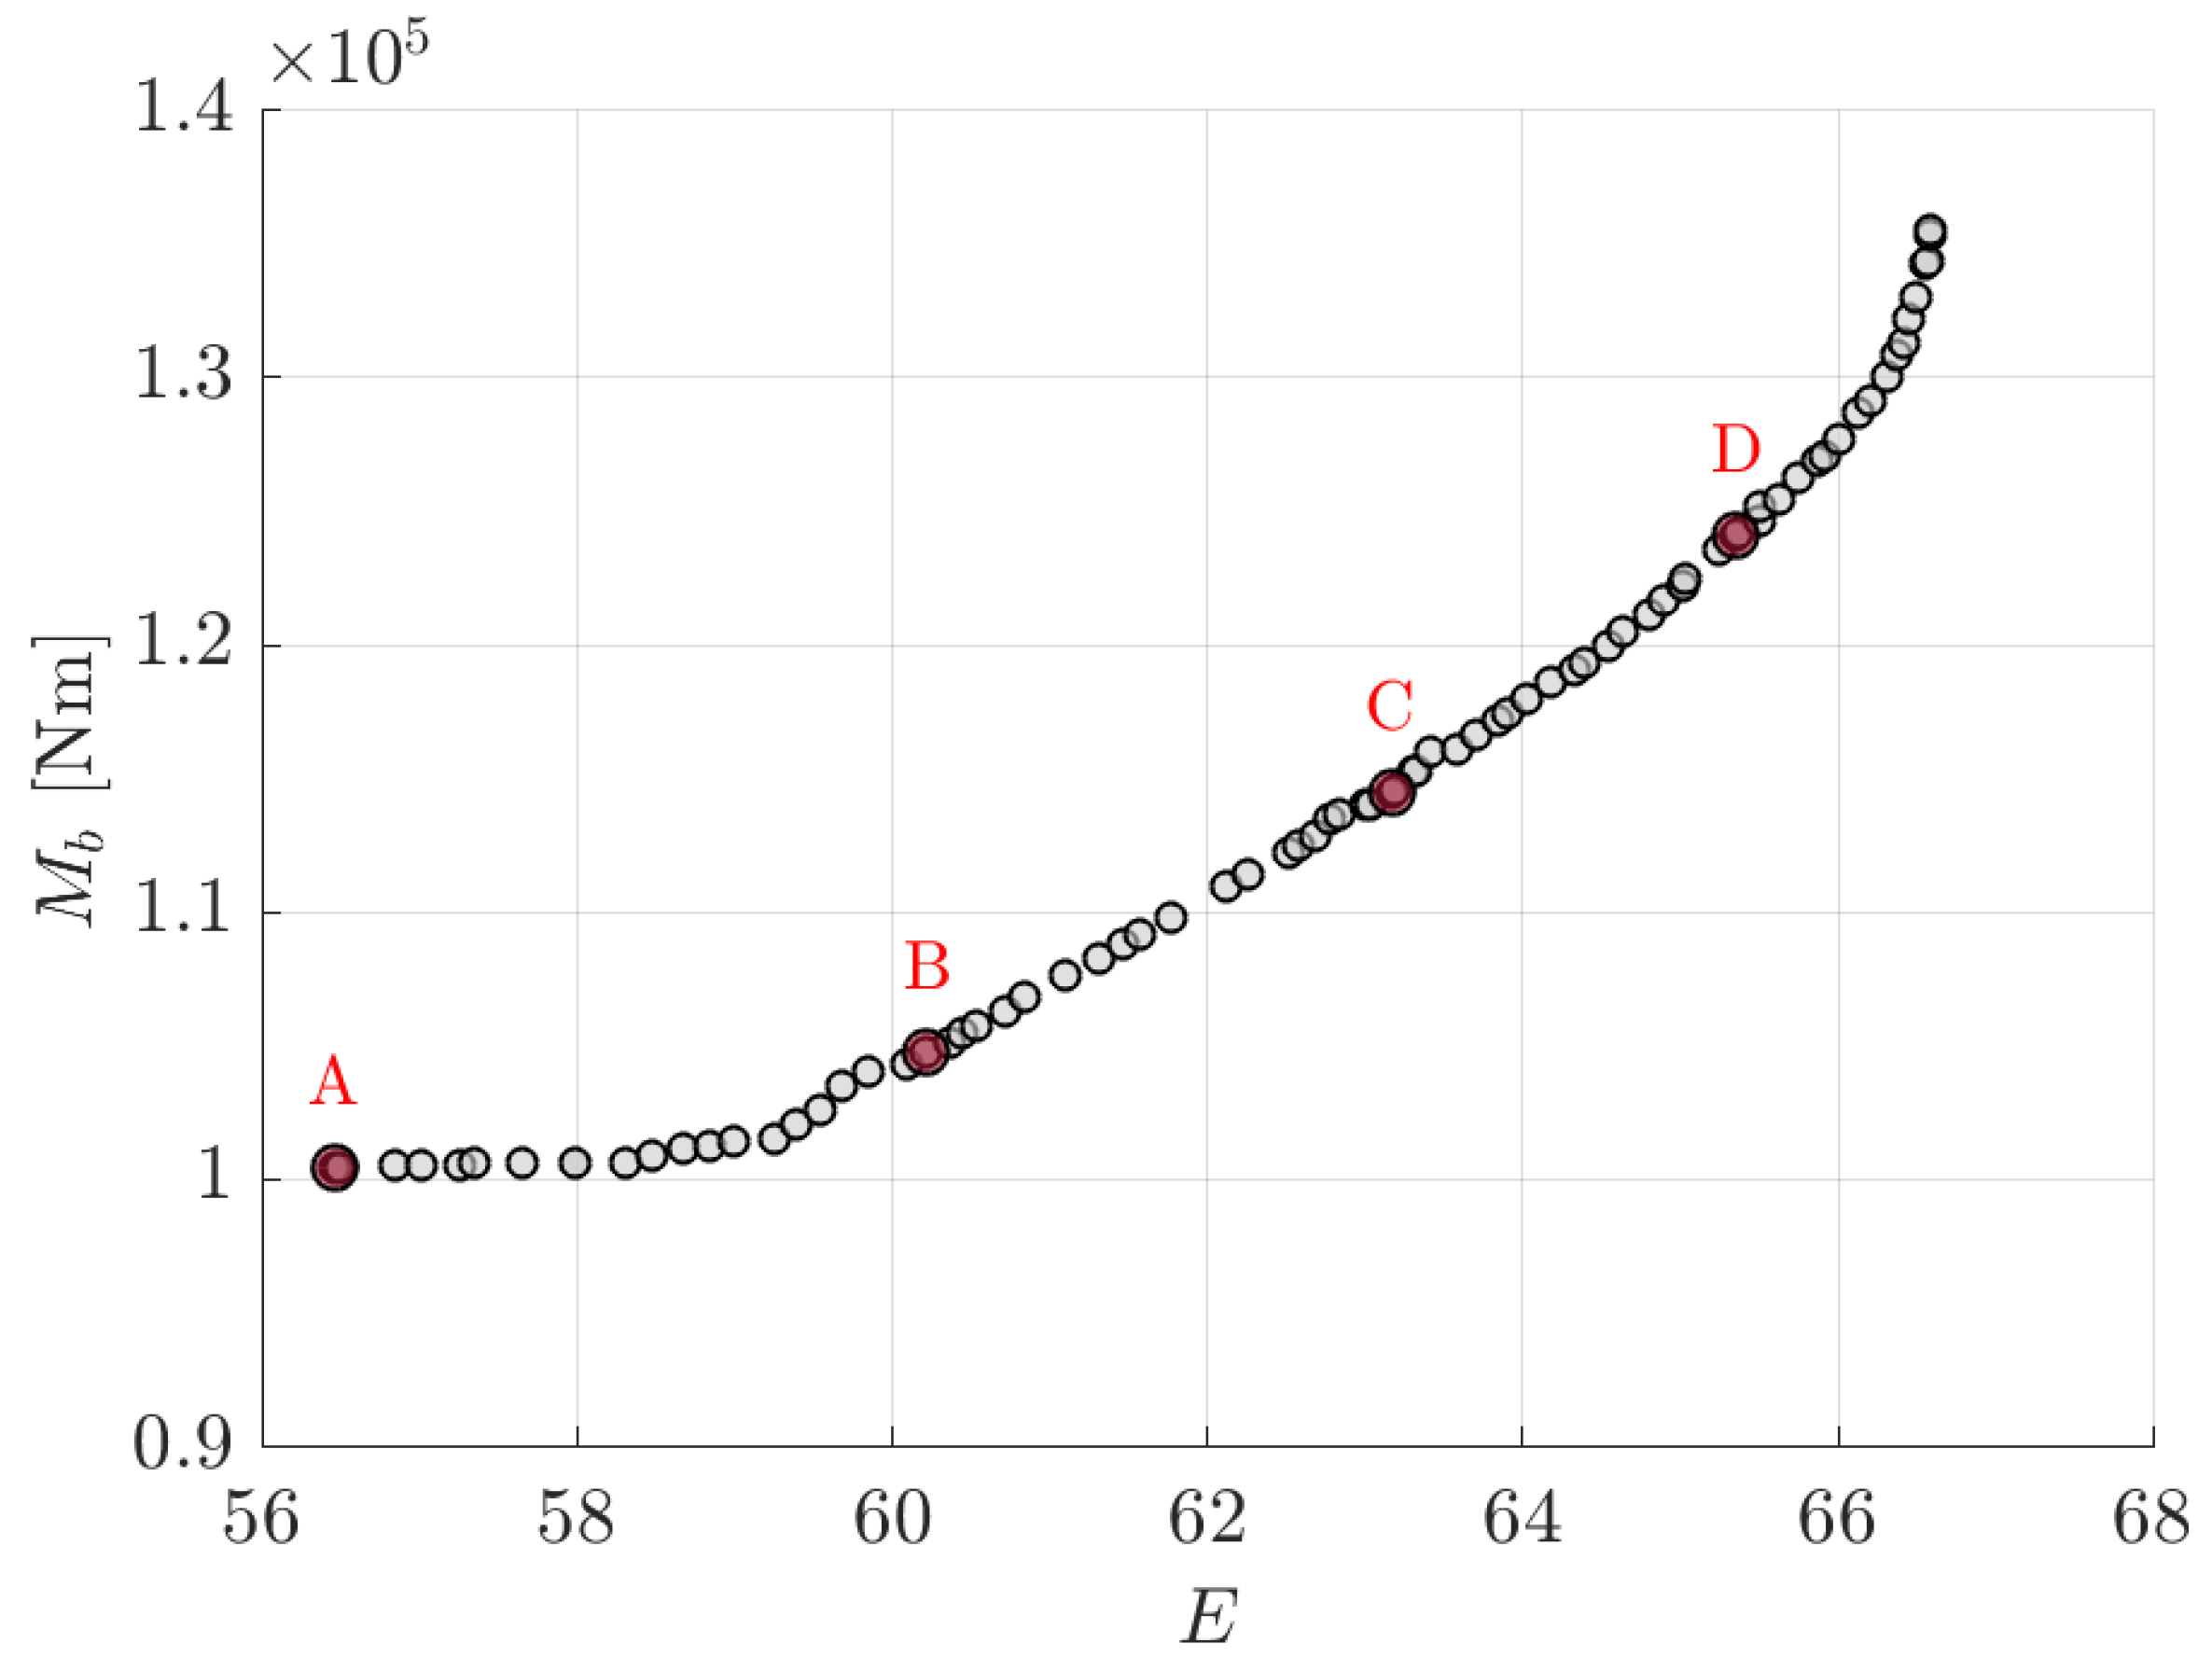
From the results obtained through the DOE, the regression model that predicts the aerodynamic coefficients is now used in the multiobjective optimization to find the best configurations in terms of wing and rotor efficiency. As shown in Figure 12, the PO front found is maximizing both wing efficiency E and minimizing wing root bending moment M b . An 18 % increase in wing efficiency throughout the configurations is obtained, as well as a decrease of 30 % in root wing bending moment.
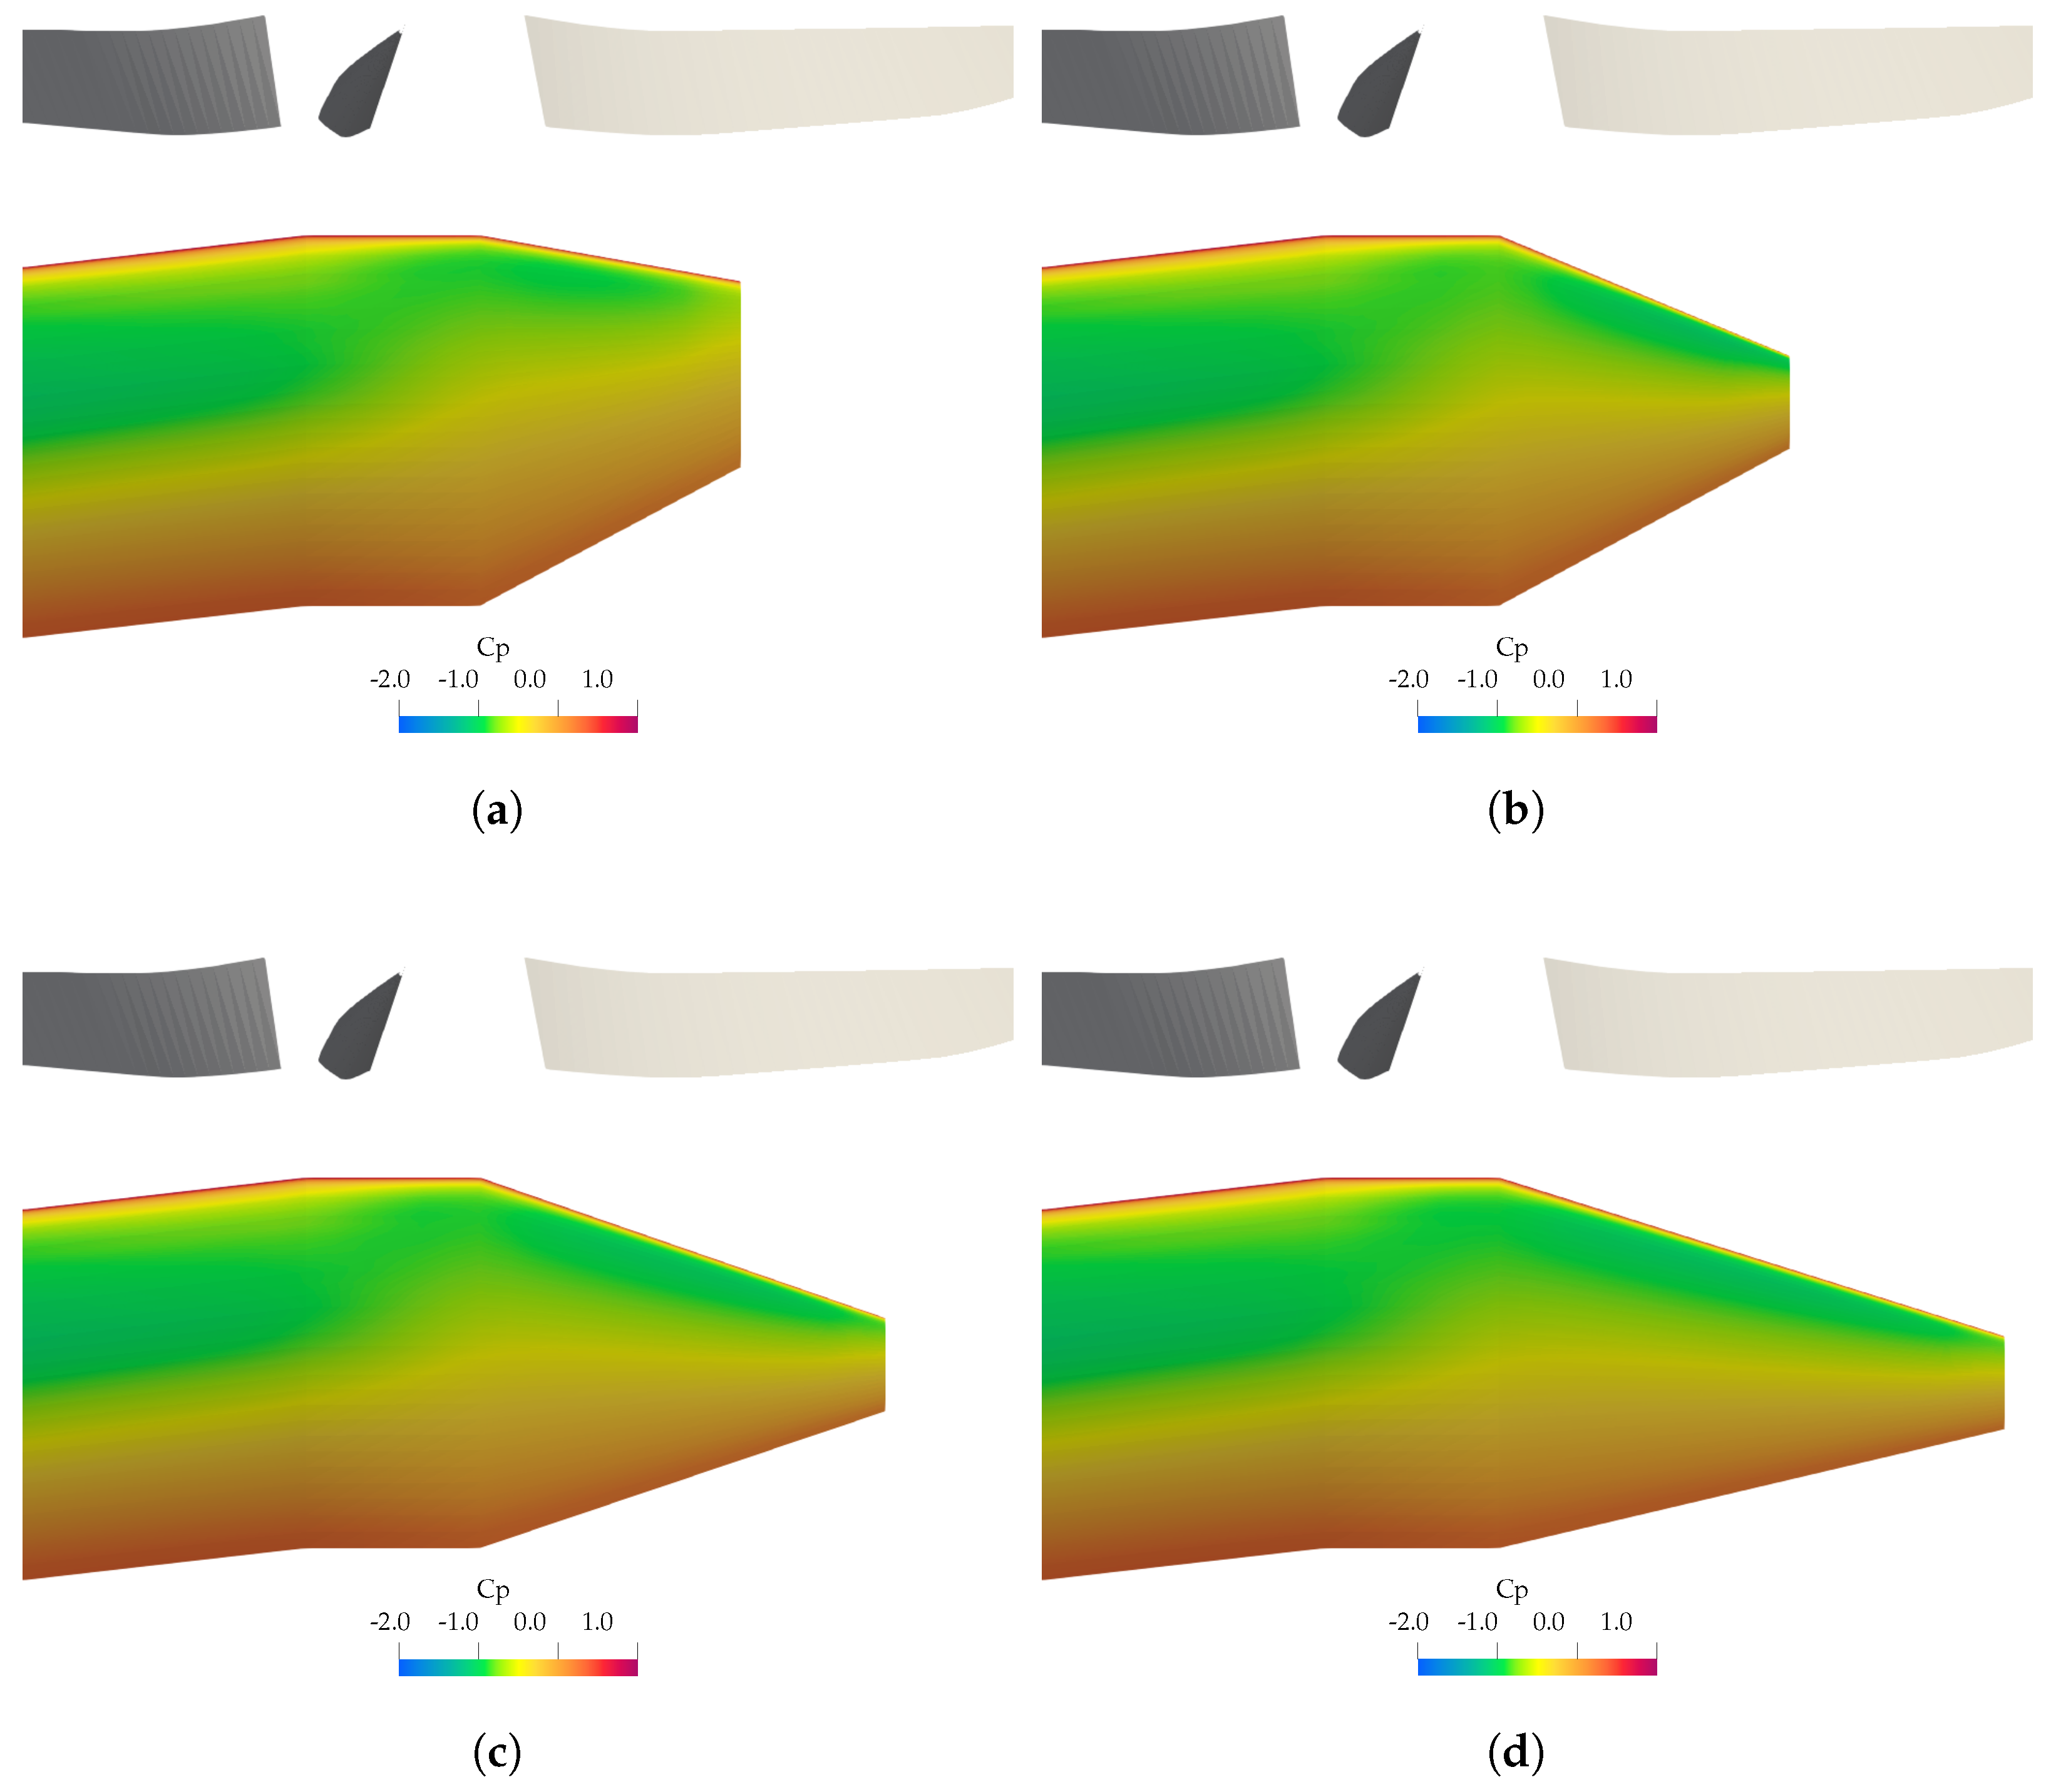
Figure 12 illustrates all of the 80 non-dominated solutions. From these, four have been selected to be analyzed in more detail and to be compared with CFD simulations. These four winglet configurations, named A, B, C, and D, are illustrated in Figure 13 with the geometrical properties reported in Table 4. The wing planform is colored according to the mean pressure coefficient, averaged over a full rotor revolution, allowing visualization of both the differences in winglet shapes and the resulting aerodynamic loading. Note that these four configurations were chosen as equispaced points within the Pareto front. This presentation helps us understand the relationship between winglet design and Pareto-optimal aerodynamic performance, and it makes it easier to interpret the results of the CFD simulations.
The span is increasing from A to D, as the root bending moment and the wing’s efficiency are increasing, given the higher aspect ratio. The dihedral angle is also increasing, providing more efficiency, while sweep is stable at 10°. Also, the wing tip chord is stable at 0.4 m, while incidence varies between the configurations. These four chosen configurations, together with the one without a wing extension, are considered to highlight the differences in aerodynamic interaction between the wing and the proprotor.

4.2. Rotor Loads

The effect of the wing on the global loads acting on the proprotor is investigated in this section. Indeed, in airplane mode, where the weight of the aircraft is predominantly supported by the wing, the large circulation from the wing itself interacts with the proprotor. The aerodynamic angles of attack on the blade vary due to interactions with the wing as the blade passes through the flow field in front of the wing (close to 270° rotor azimuth) [16].
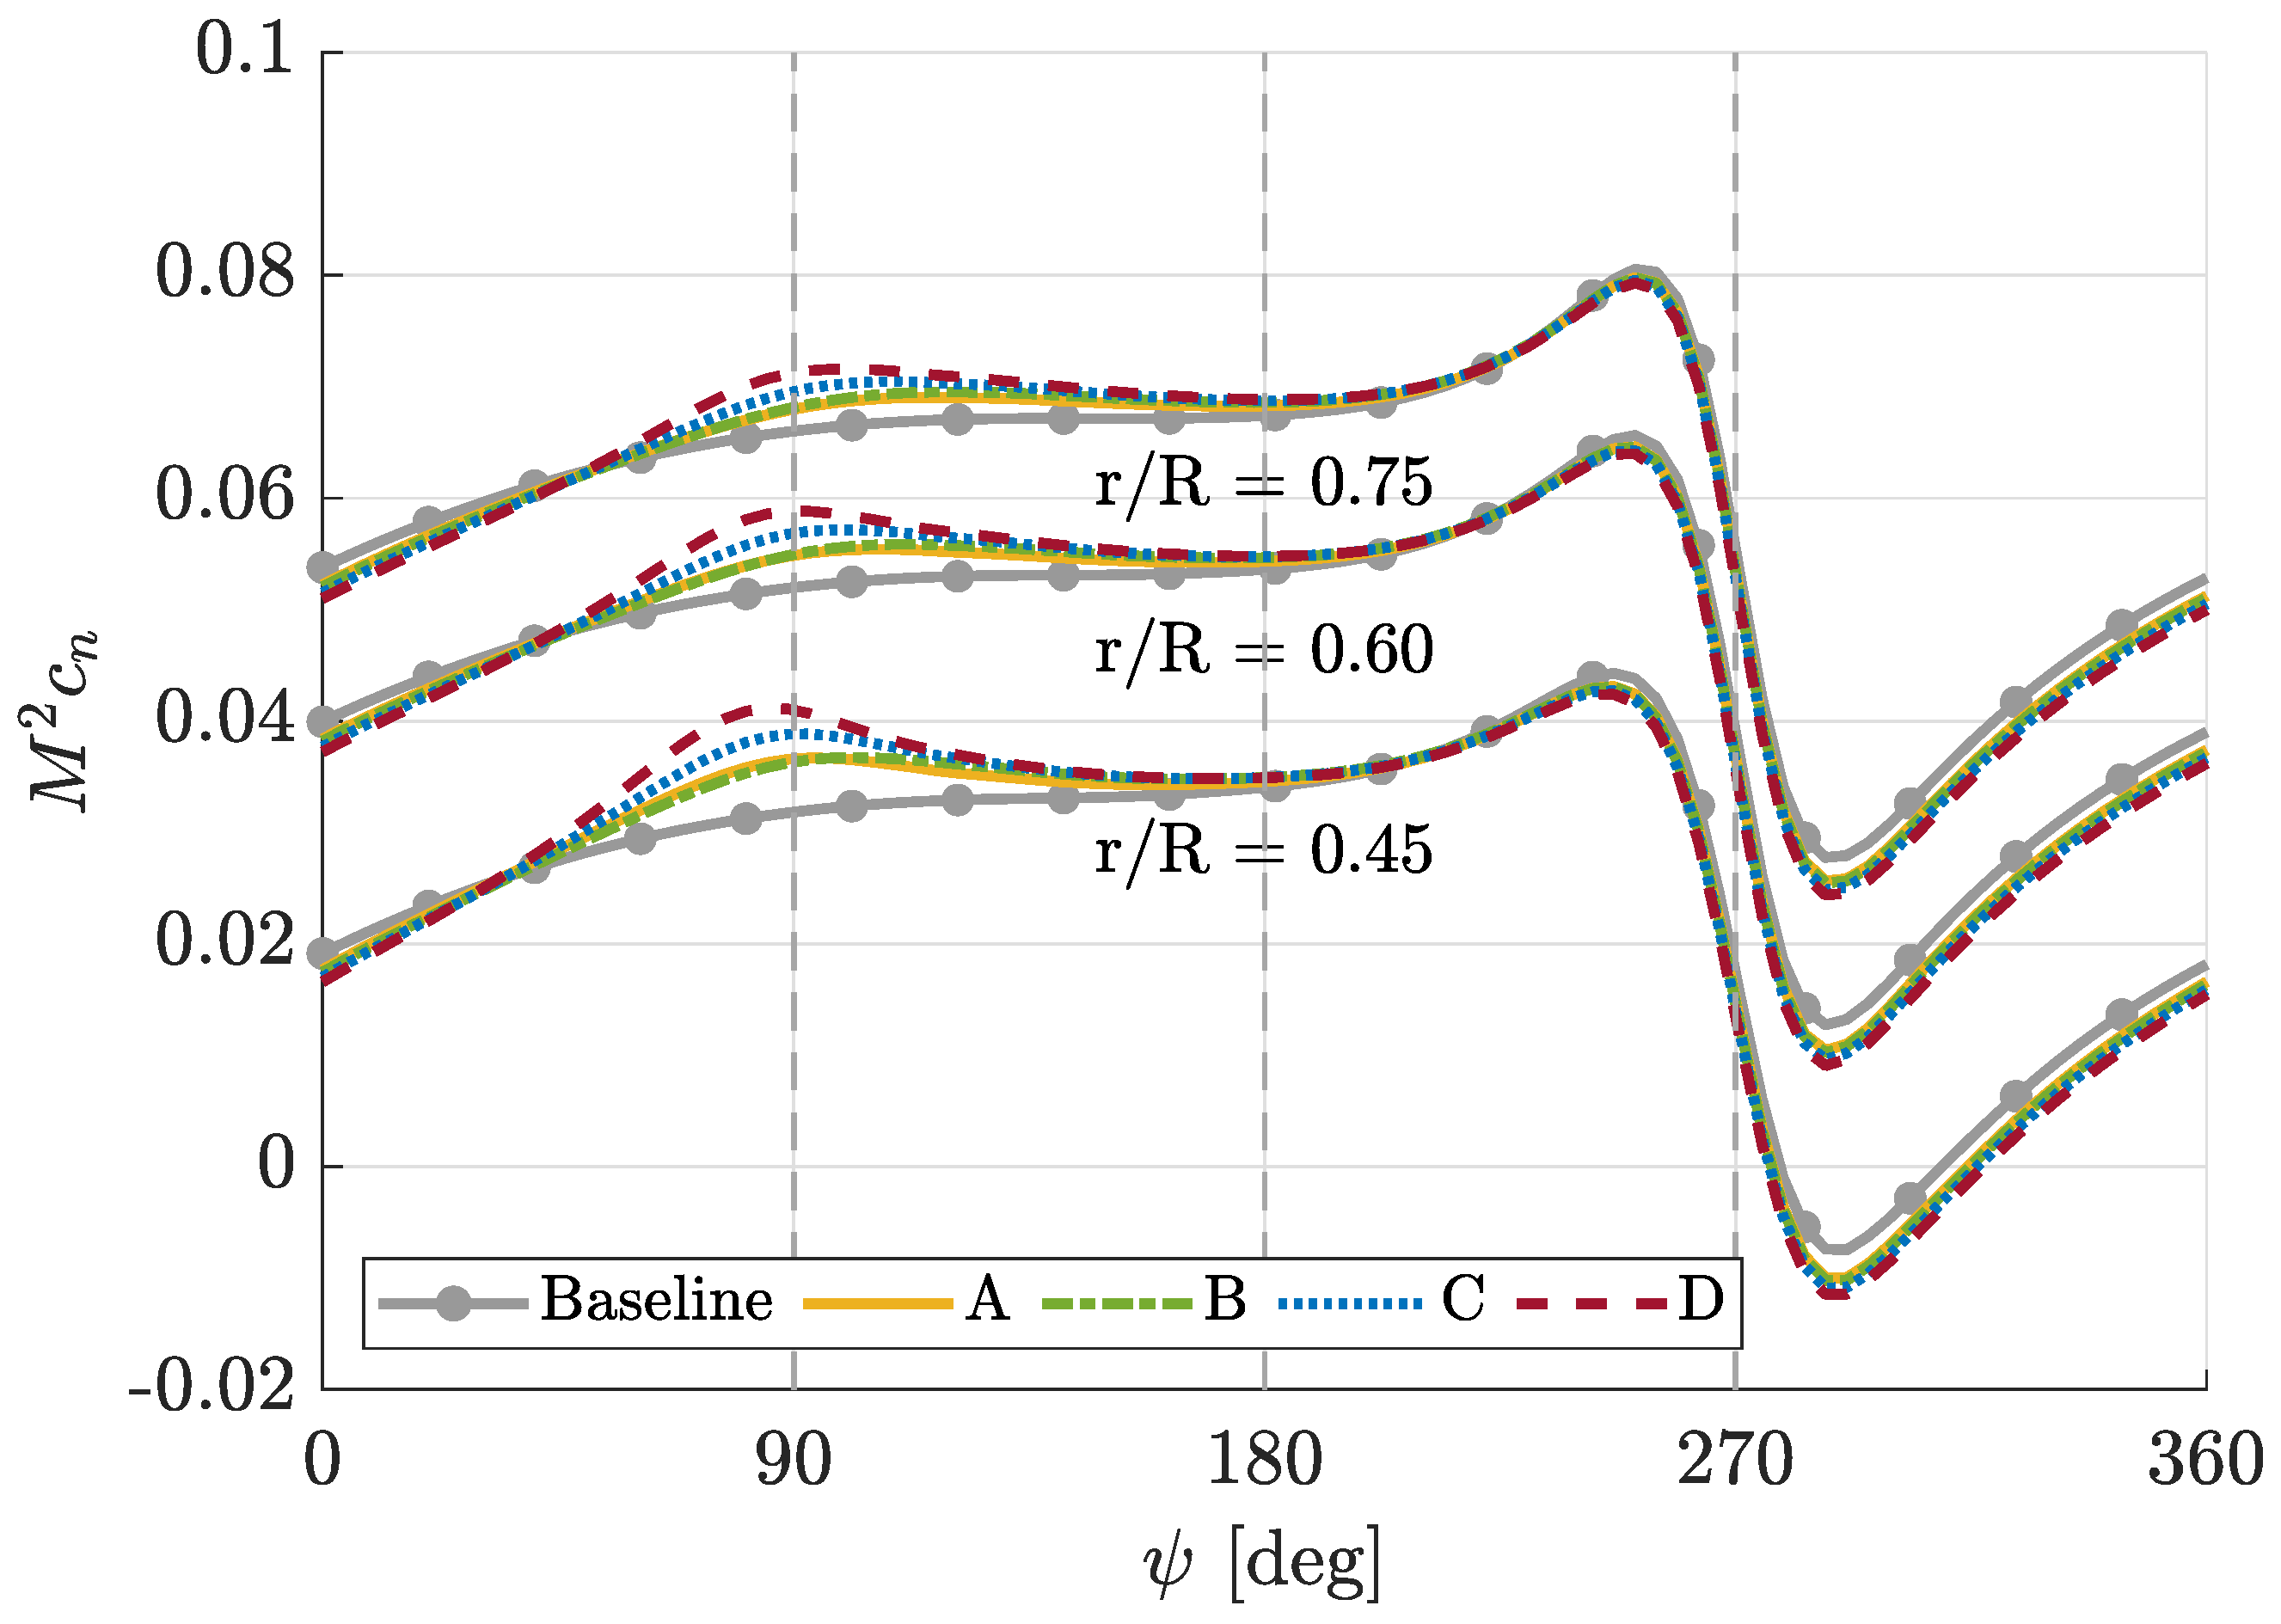
Figure 14 compares the blade sectional airloads at different span-wise stations r / R . A doublet loading near the 270° azimuth is displayed for the non-dimensional blade sectional normal force M 2 c n , caused by the interactions with the wing. The configurations with a wing extension installed exhibit a peak also in the region where the blade passes in front of the wing extension itself, at around 90° azimuth. It can also be noted that the three configurations with a wing extension exhibit the same behavior everywhere except in the region at around 90° azimuth, meaning the shape of the wing extension has no remarkable influence on the loads at other azimuths.
To thoroughly understand proprotor/wing aerodynamic interaction on the local blade airloads, Figure 15 compares the contours of the blade non-dimensional normal force M 2 c n computed across one proprotor revolution, considering configuration D and the baseline one. The Figures show the doublet of the blade’s normal force occurring in the region of azimuth around 270° due to the blade’s passage in front of the wing. From these results the influence of the wing extension on the blade airloads is more evident. Adding a wing extension outboard of the nacelle significantly increases the total time spent by the blade under high loading, with the creation of a second peak when the blade passes in front of the wing extension at around 90°. The addition of a wing extension loads the blade more during the whole sweep from 90° to 270°, ultimately increasing the traction force of the proprotor.

4.3. Wing Loads

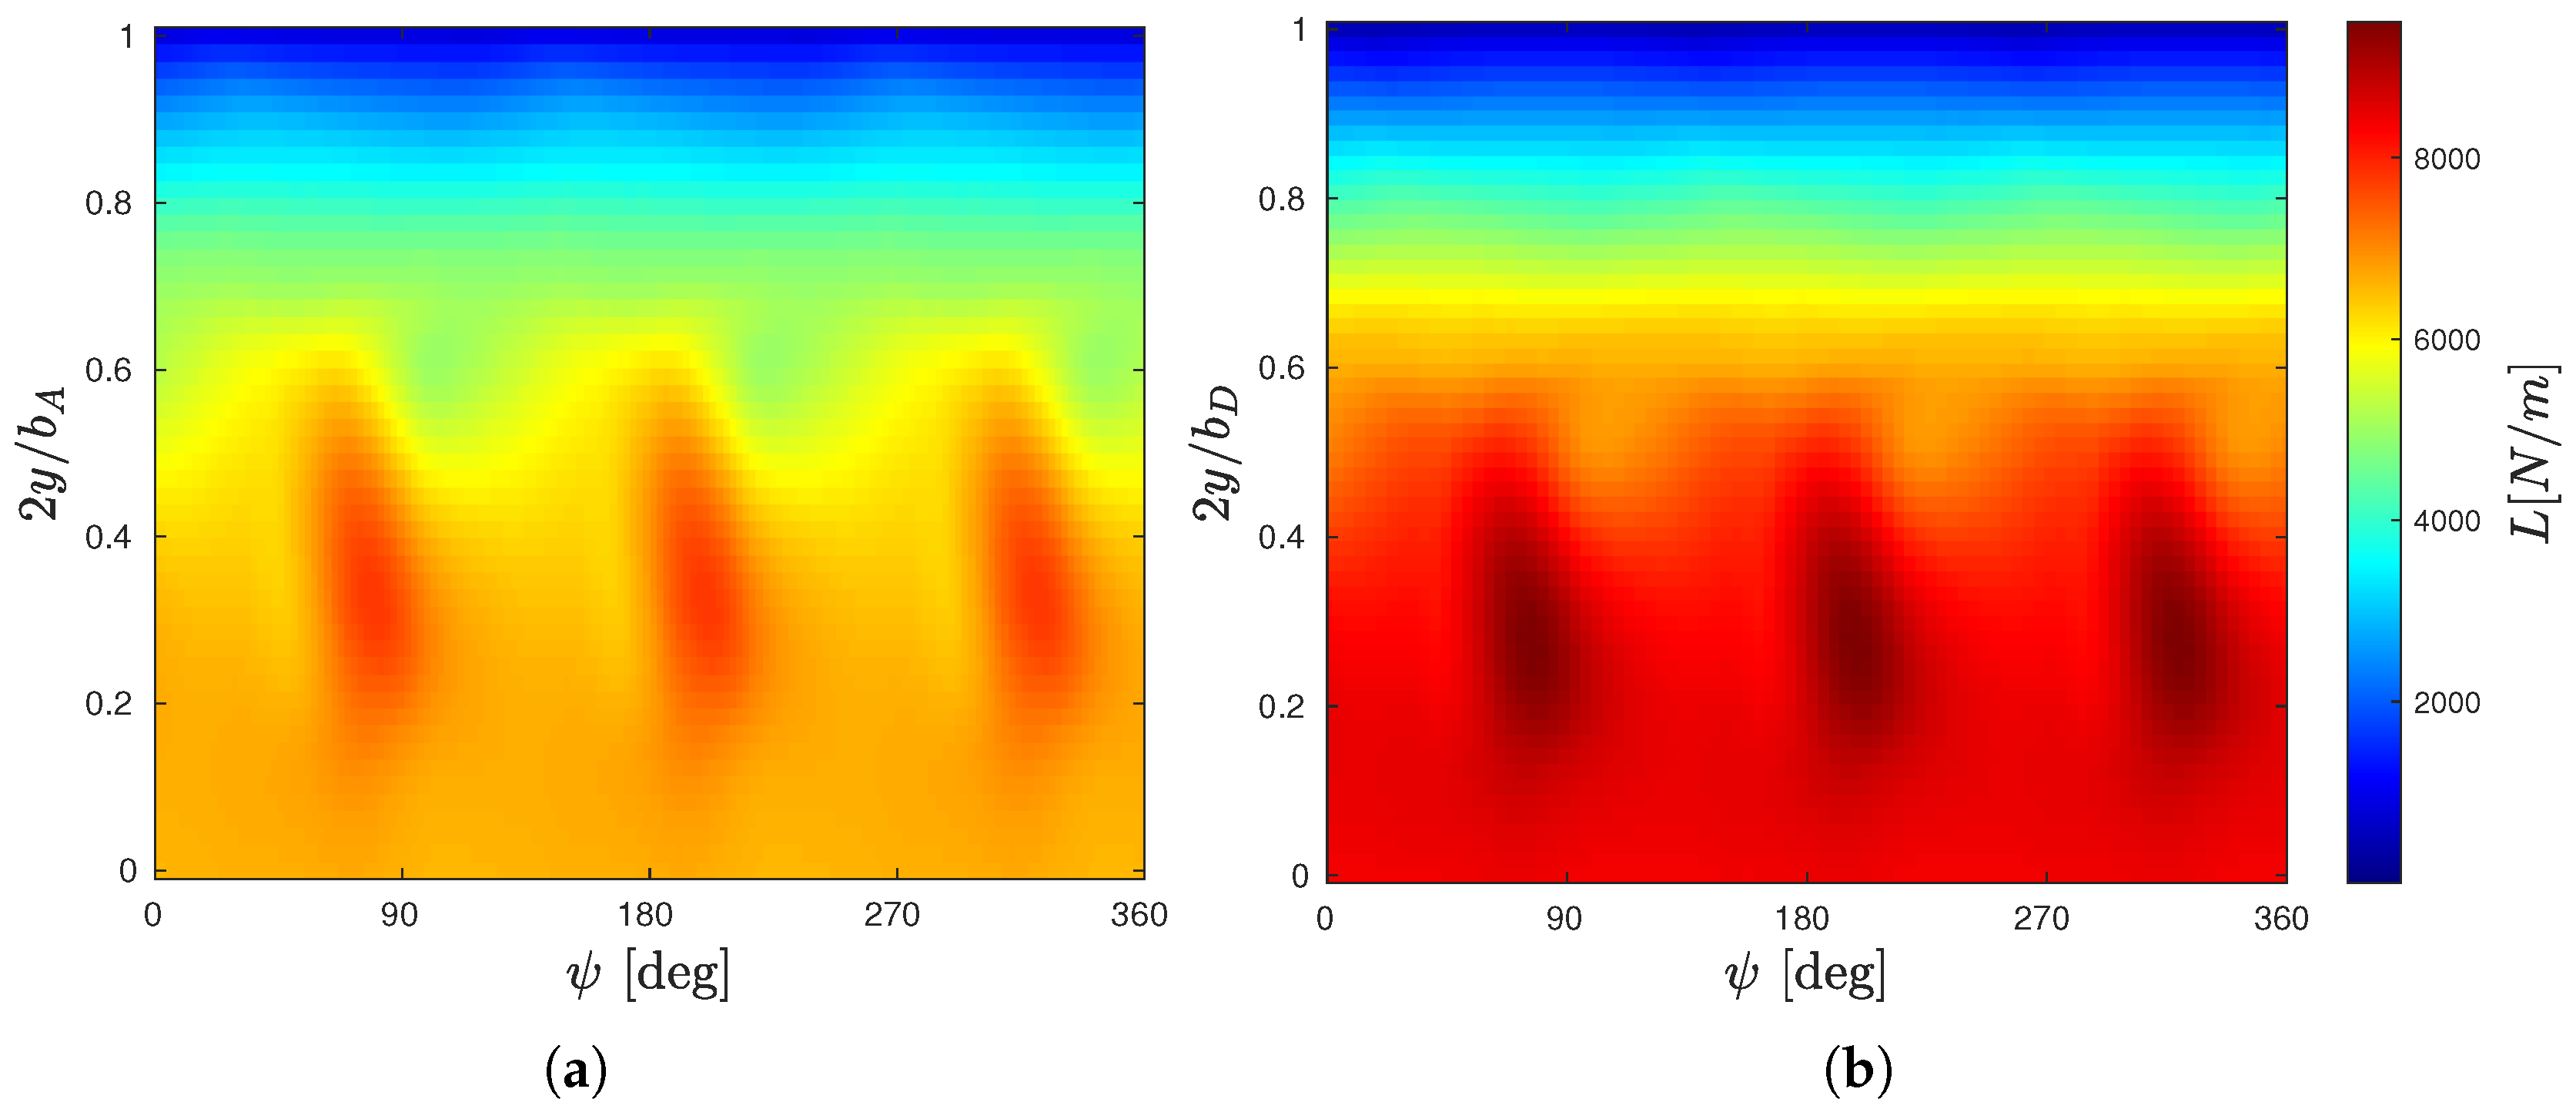
In order to investigate the aerodynamic load acting on the wing and highlight how geometric design differences impact loads, Figure 16 shows the Lift per unit length along the span coordinates 2 y / b a considering a complete rotor revolution. The sectional lift force for configuration D, Figure 16a, is significantly greater over almost the entire wing span compared to configuration A, Figure 16b. Only in the region near the wingtip, the sectional force of configuration D is lower than that of A, but this is related to the significantly smaller chord length. This general increase in aerodynamic load on the winglet is clearly responsible for the increase in the bending moment value M b at the wing root highlighted by the PO in Figure 12.
From the perspective of aerodynamic interactions, in both cases, the three peaks related to the passage of the blades are evident.
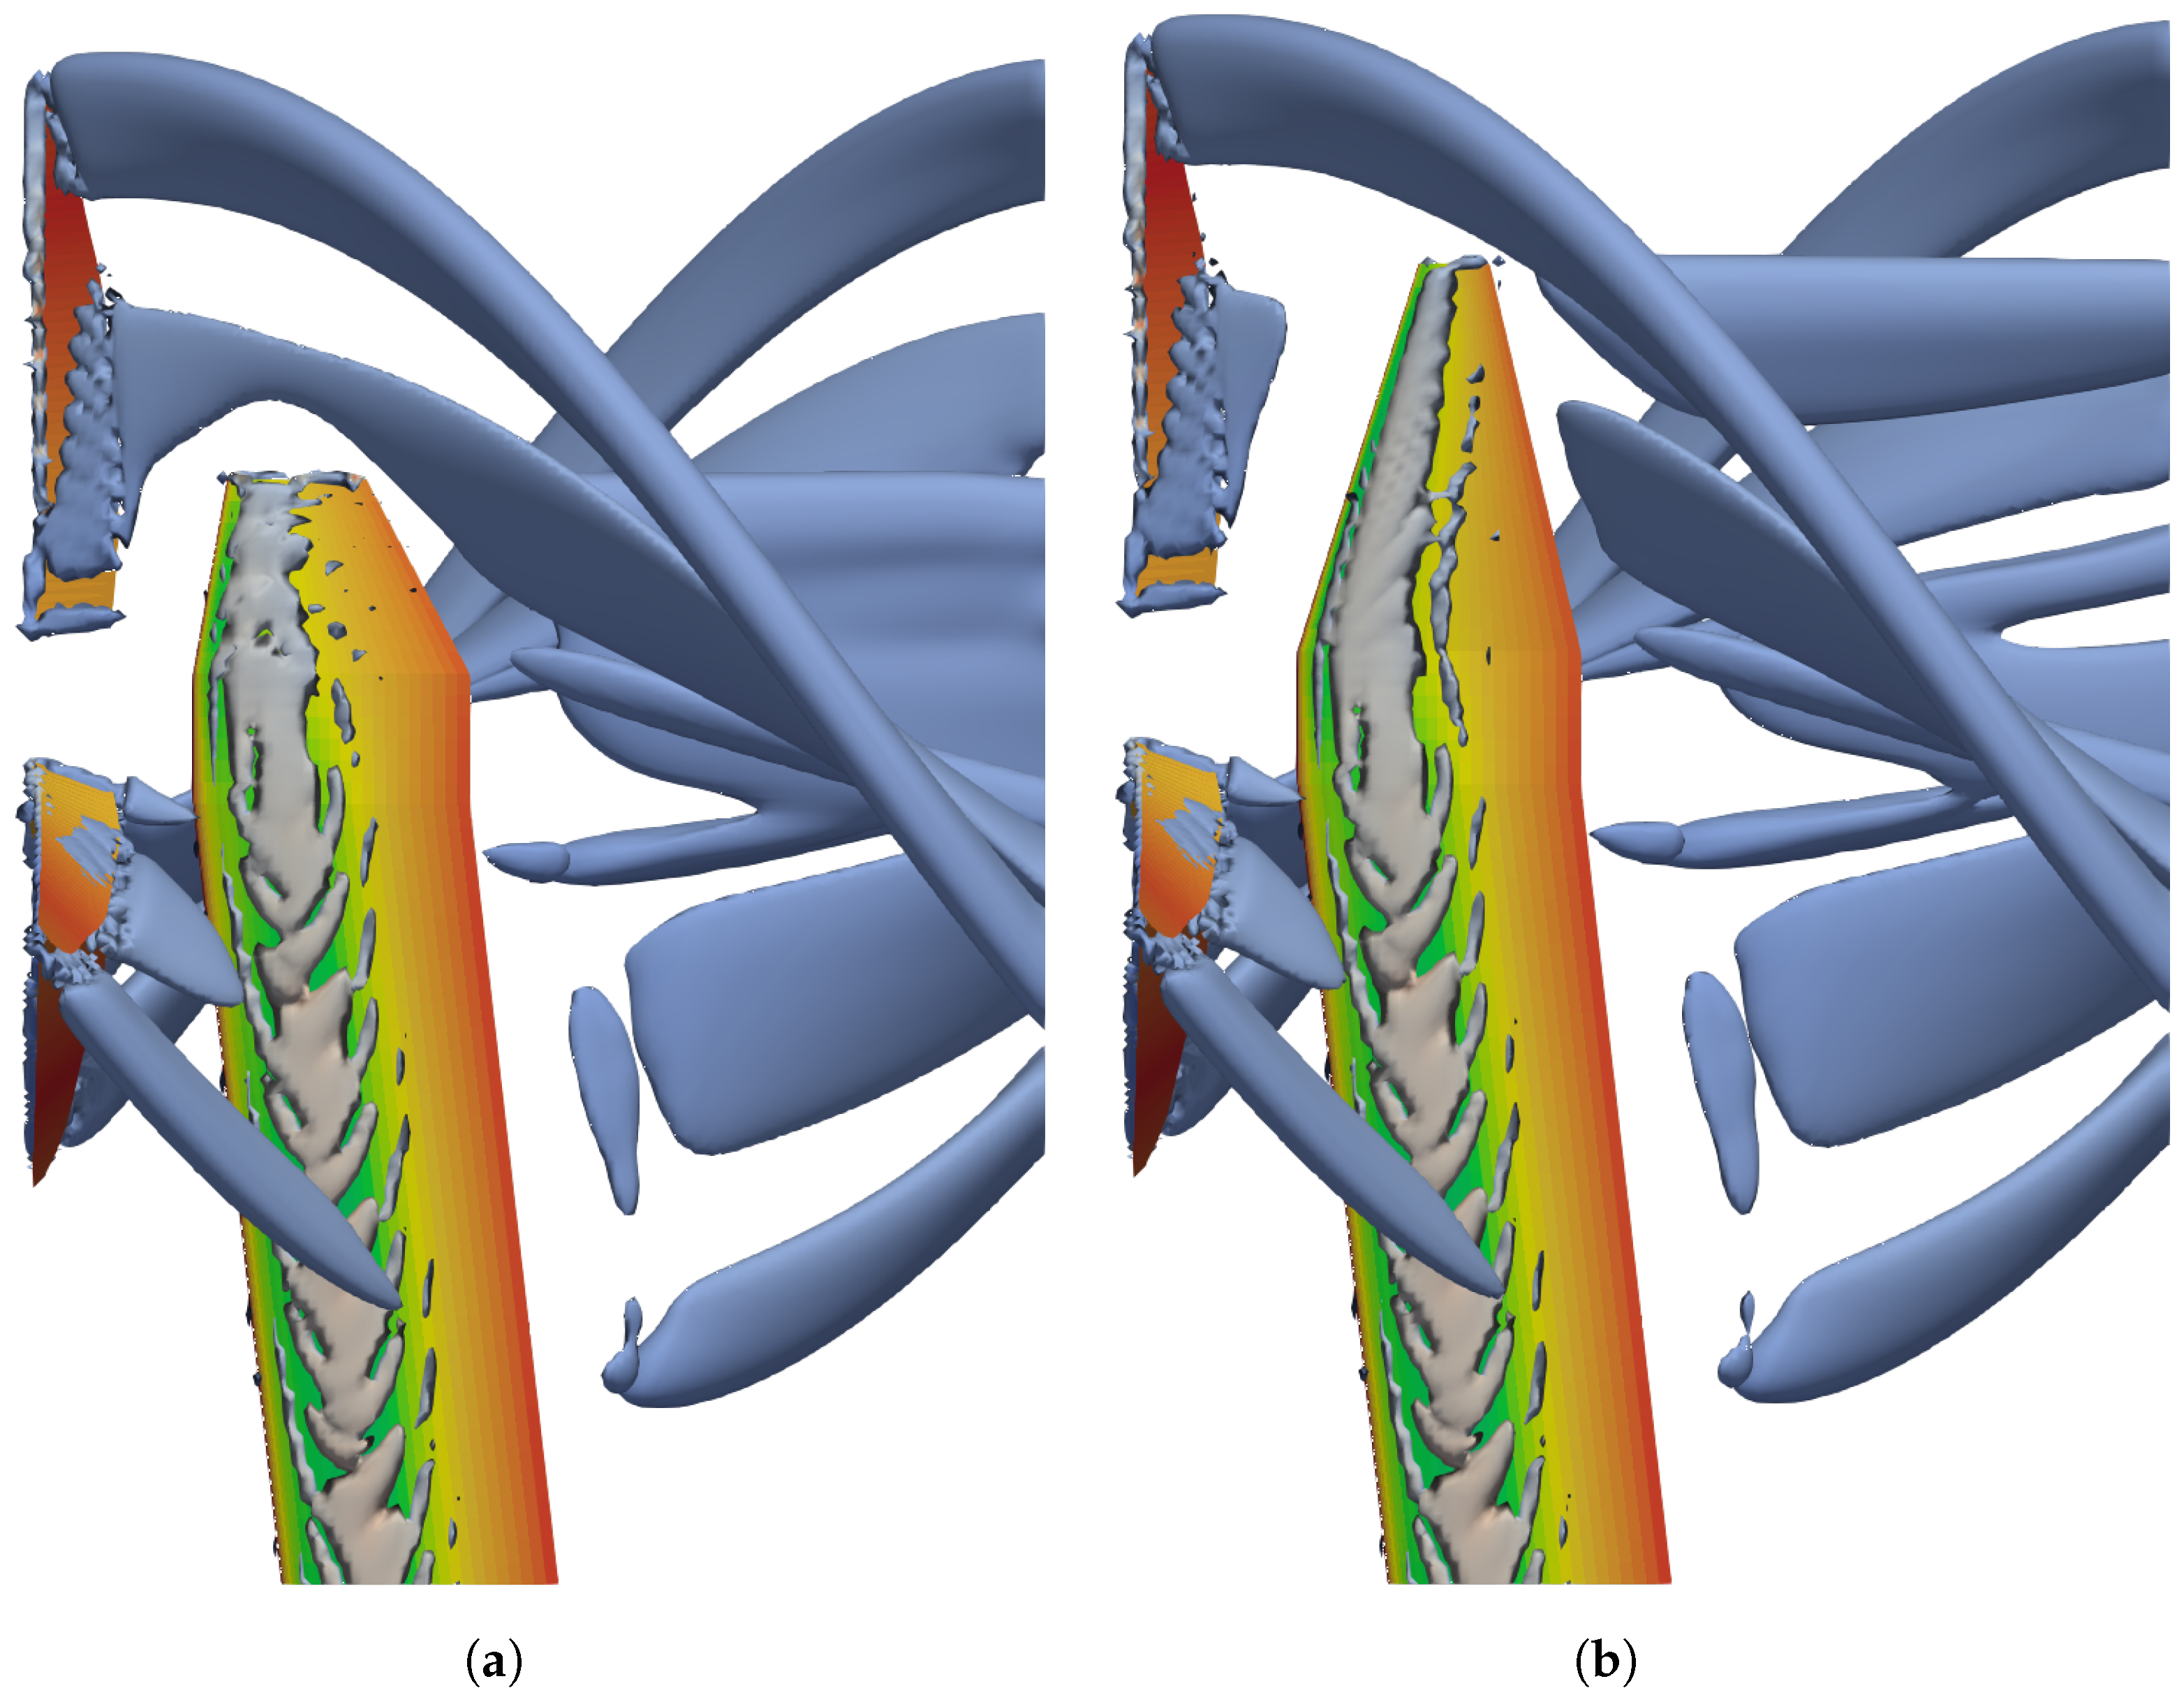
In Figure 17, the main vortex structures associated with the wake of the blades are shown in terms of Q-criterion isosurfaces.
As expected, the main differences are in the winglet region. In particular, in configuration A, the secondary structure released from approximately halfway along the blade impacts the wingtip, interacting with the tip vortex. In configuration D, on the other hand, this structure impacts at approximately halfway along the winglet. Since the rotor rotates counterclockwise, when viewed from the front, this vortical structure detaches from the blade in the winglet region.
Since the rotor rotates counterclockwise when viewed from the front, the vortex structure released by the blade in the winglet region rotates in the opposite direction compared to the wingtip vortex. This fact causes the induced drag to decrease, contributing to the increase in aerodynamic efficiency. This portion of resistance also decreases by increasing the aspect ratio; in fact, the solutions with higher efficiency are those in which the optimization solution increases the value of the wing’s span b w and reduces the wing’s chord c. Another parameter that seems to contribute to the increase in efficiency is the increase in sweep angle λ , which moves the leading edge of the winglet further away from the rotor disc. In addition to the effects related to the vortex structures generated by the blades discussed earlier, due to the counterclockwise rotation of the blades, the rotor creates a downwash component acting on the winglet, causing a decrease in lift. By moving the lifting surface away from the rotor plane, this effect decreases, contributing to a smaller downwash component and therefore an increase in aerodynamic efficiency.

4.4. CFD Comparison

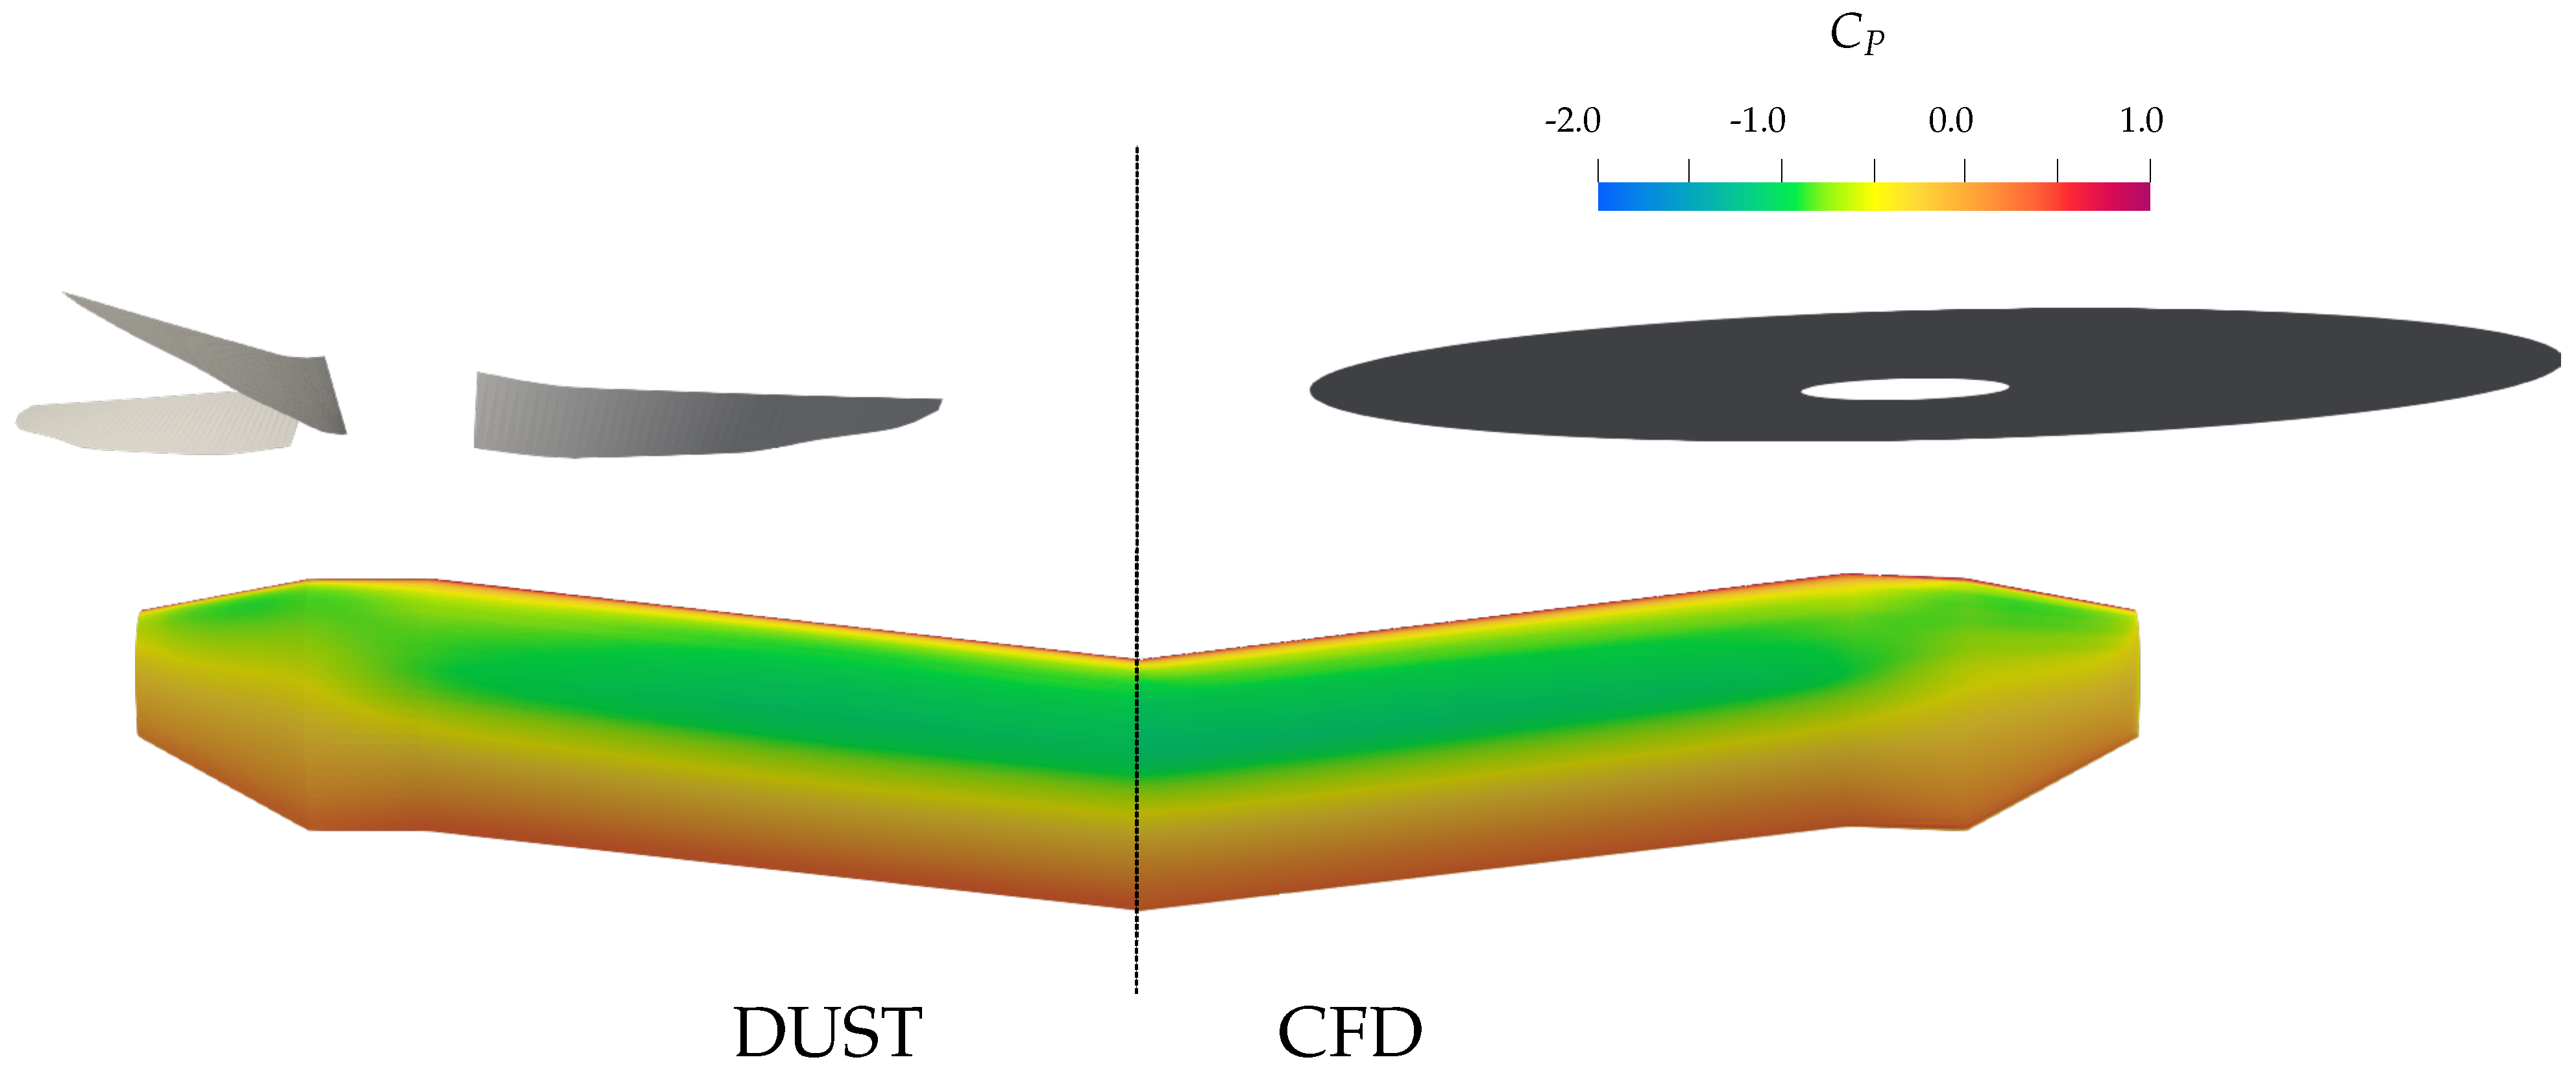
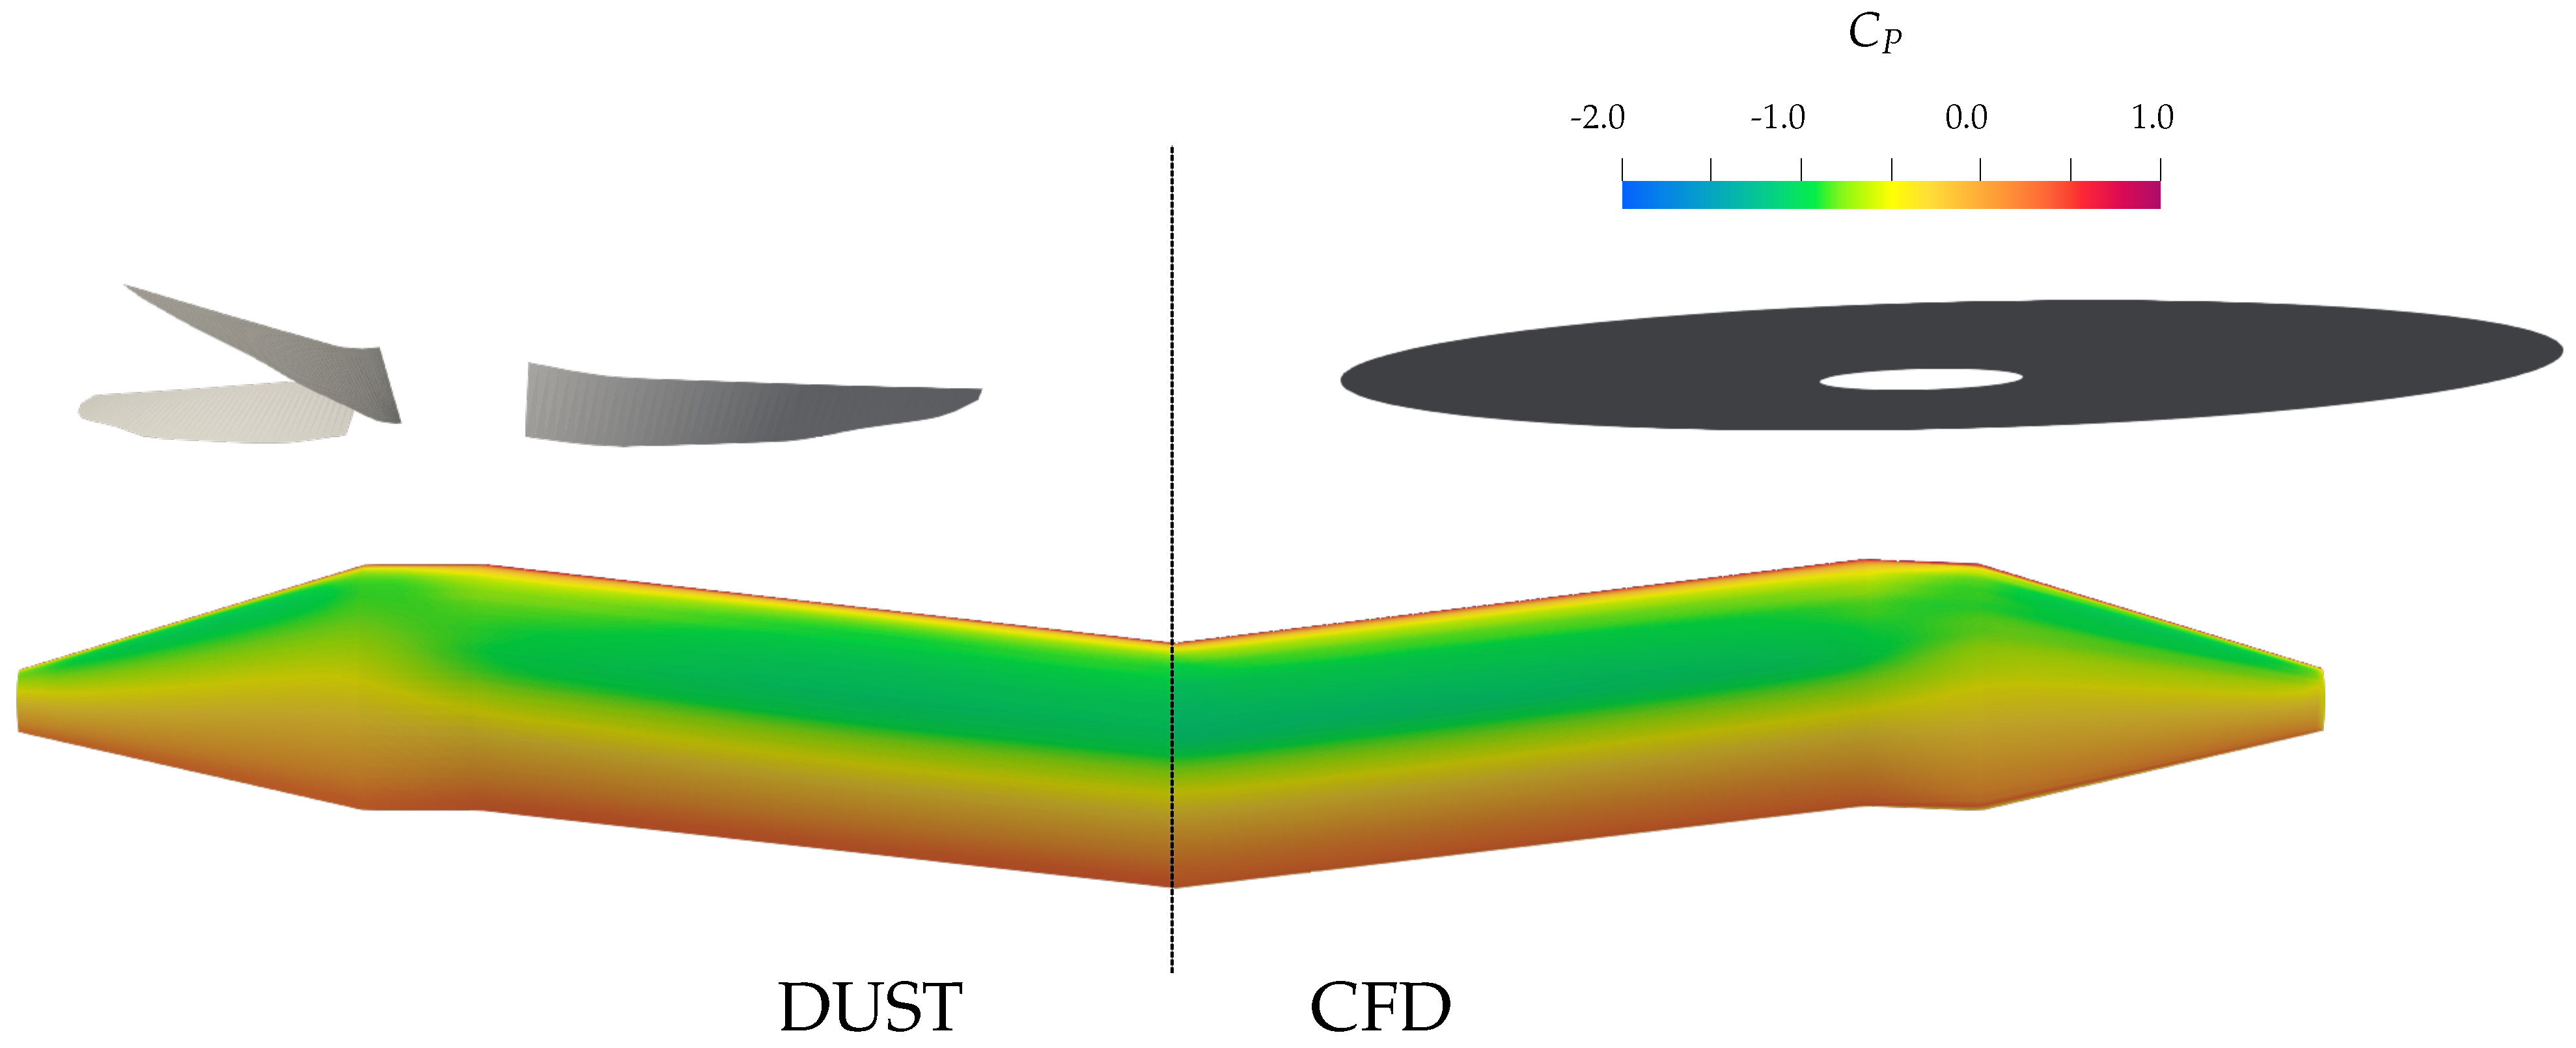
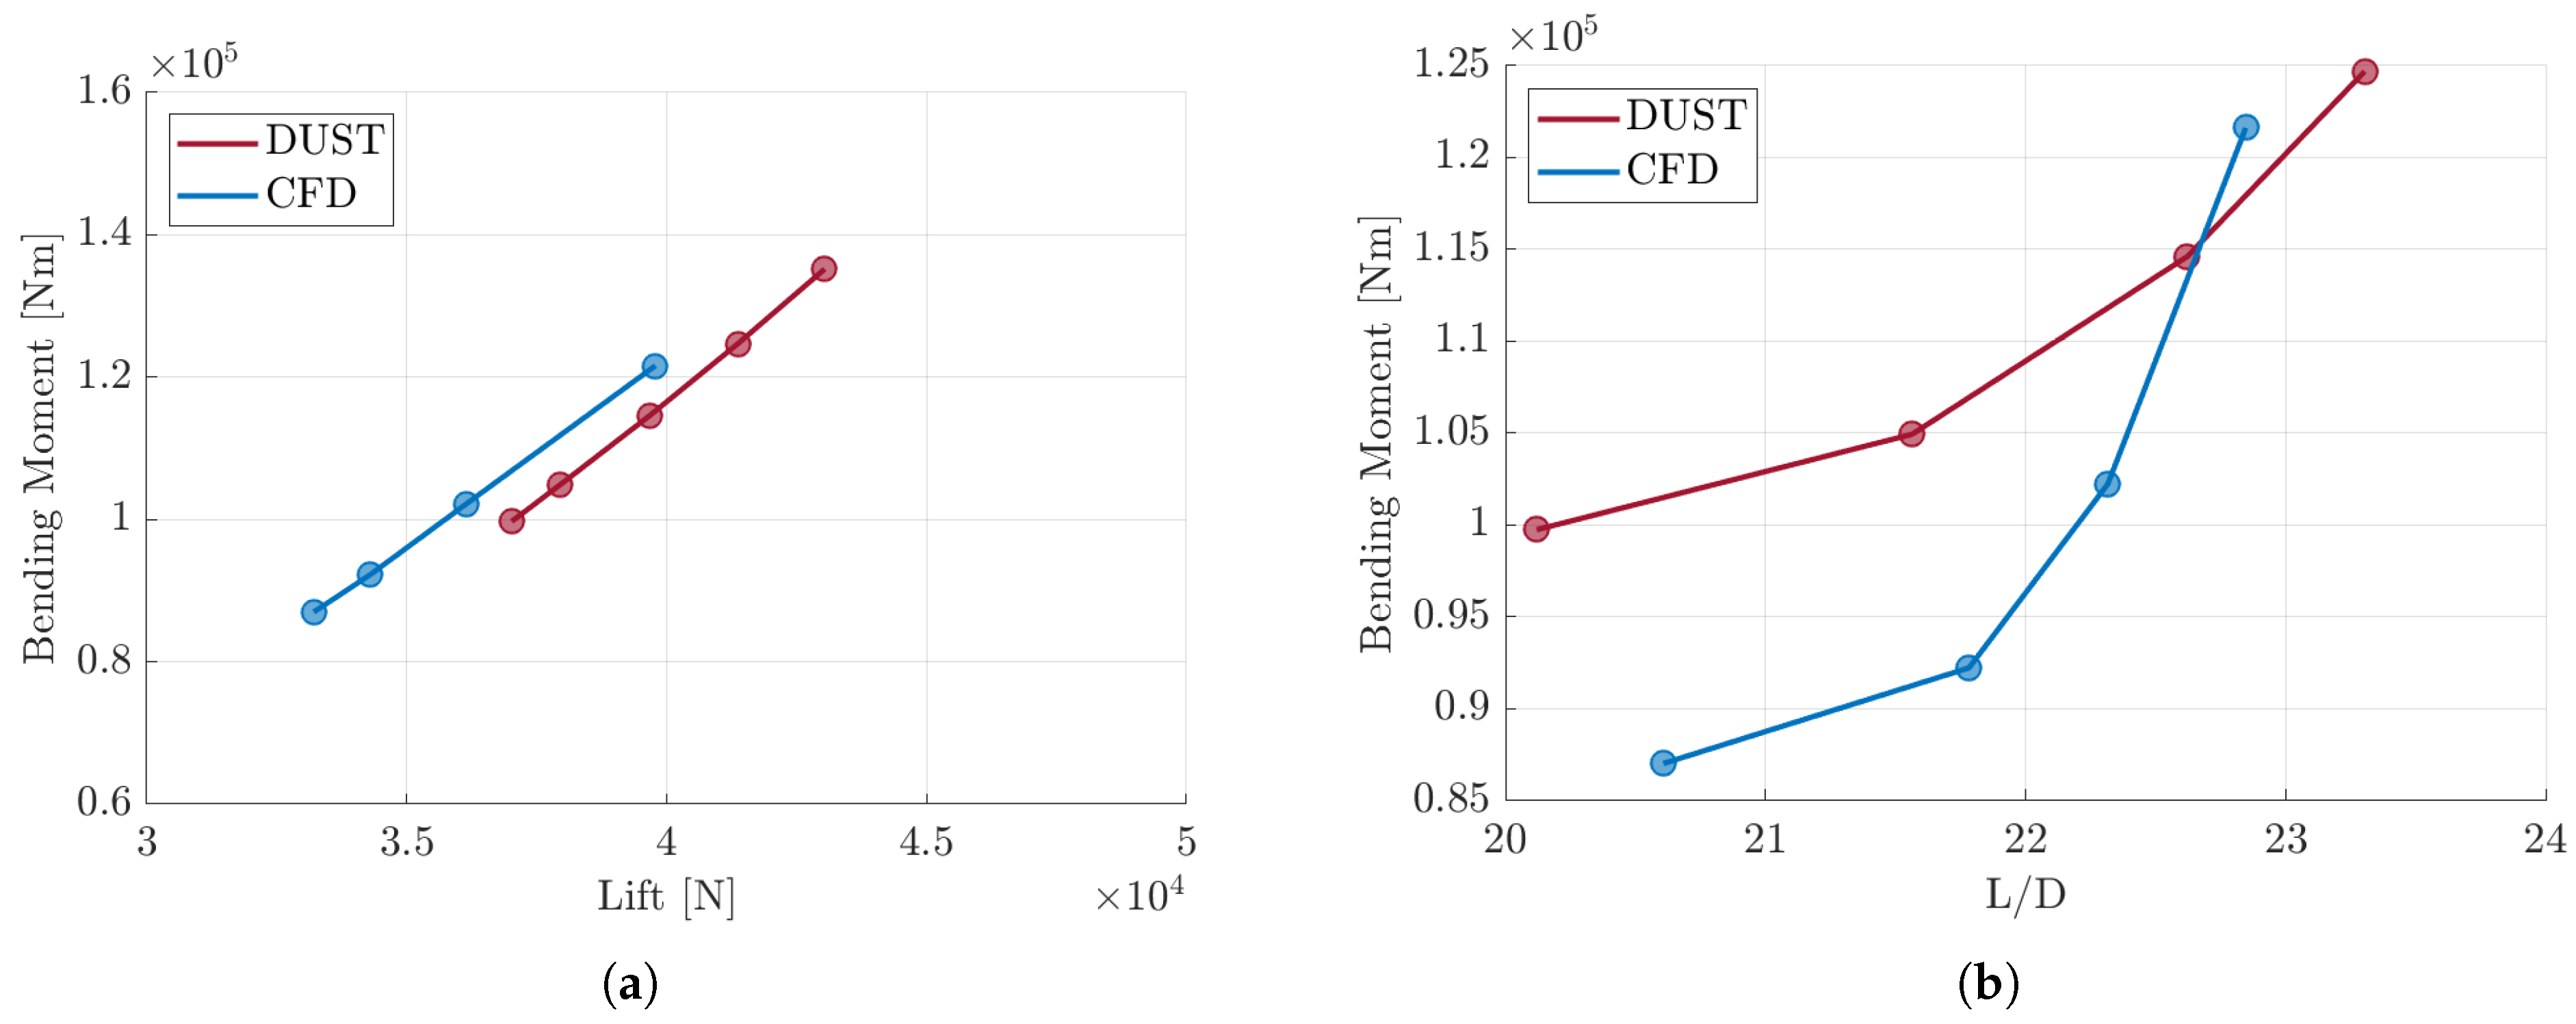
In this section the results from DUST simulations are compared with the ones from CFD. Figure 18 and Figure 19 illustrate the C p contour plot of the wings from the mid-fidelity and high-fidelity simulations. No difference can be found other than slightly more suction right behind the proprotor for the CFD case. This provides evidence that the mid-fidelity approach can be of great use when dealing with these complex structures, as is the case for tiltrotor wings. Indeed, without separations on the wing, the method is capable of predicting the correct surface pressure and, moreover, is capable of correctly investigating the wake of the propeller, describing it with vorticity particles. The results shown in Table 5 show the lift force from DUST being indeed very close to the values from SU2 simulations: they only differ by a maximum of 10%. The same goes for the root bending moment, which is correctly predicted by DUST. These results are shown in Figure 20a: great correlation is present when looking at the normal forces on the wing, which again is due to the fact that the mid-fidelity solver is able to correctly predict the pressure distribution over the wing. What is missing is the wall shear stress on the surface of the wing, hence an indication of the viscous drag. Indeed, this is why efficiency values from DUST are almost three times higher than the ones in CFD. Since the scope here is to use these CFD simulations to evaluate the correctness of the Pareto curve found with DUST, the mid-fidelity results have to be scaled down in order for the two Pareto curves to be compared. In this case the scaling factor is the mean value of the ratio between DUST’s efficiency and SU2’s one: this value is 2.8 for the results presented in Table 5. The two Pareto curves are compared in Figure 20b.
It is undeniably clear that the curve generated through the application of the DUST algorithm closely mirrors the trend exhibited by the counterpart computed with a high-fidelity solver. Remarkably, this alignment in trends is accompanied by a significantly reduced computational time, underscoring the efficiency and effectiveness of the DUST approach. This final comparison lends strong support to the validity of the Pareto curve discovered in the course of this research. The ability of this curve to closely approximate the high-fidelity solution reinforces the confidence in the optimization process it underpins. The efficiency gains achieved through the use of DUST not only streamline the optimization process but also validate its practical utility. In essence, this comparison serves as a resounding endorsement of the optimization methodology employed in this study. It not only affirms the accuracy and reliability of the results but also highlights the potential for significant time and resource savings, which are invaluable in today’s fast-paced and resource-constrained research and development environments. Through this analysis, we can confidently conclude that the optimization derived from the Pareto curve is a robust and sound solution, poised to make a meaningful impact in its respective field.

5. Conclusions

This work presented a systematic multi-fidelity aerodynamic optimization framework for the design of a wing extension for a tiltrotor aircraft, representing one of the first studies of its kind. By leveraging a Design of Experiment (DOE) methodology combined with a mid-fidelity aerodynamic solver based on the Vortex Particle Method (VPM), a wide range of wing/proprotor configurations were efficiently evaluated. The use of a multi-objective optimization algorithm enabled the identification of Pareto-optimal designs that improve both rotor and wing aerodynamic efficiency, providing a structured approach that goes beyond previous tiltrotor optimization studies.
The results demonstrated that the integration of wing extensions can lead to substantial performance enhancements, particularly when aerodynamic interactions between the proprotor and the lifting surface are accurately captured. The adoption of a fast and reliable mid-fidelity tool like DUST proved effective in balancing computational cost and modeling accuracy, thus improving the feasibility of performing extensive design space explorations during preliminary aircraft design.
Overall, the proposed framework shows promise for accelerating the design of innovative features in advanced rotorcraft configurations, including those in the emerging eVTOL sector. Future developments may include the integration of structural and aeroelastic constraints into the optimization process, as well as experimental validation of selected configurations to further verify the numerical predictions.

Funding

This research received no external funding.

Institutional Review Board Statement

Not applicable.

Informed Consent Statement

Not applicable.

Data Availability Statement

The data that support the findings of this study are available from the corresponding author upon reasonable request.

Acknowledgments

The author would like to express sincere gratitude to Davide Molini for his valuable support in this work.

Conflicts of Interest

The author declares no conflicts of interest.

Abbreviations

The following abbreviations are used in this manuscript:
VPMVortex Particle Method
CFDComputational Fluid Dynamics
POPareto Optimal front
DOEDesign of Experiment
NSGANon-dominated Sorting Genetic Algorithm
OFATOne Factor At a Time
FFDFull Factorial Design
CCDCentral Composite Design

References

  1. Maisel, M.D. The History of the XV-15 Tilt Rotor Research Aircraft: From Concept to Flight; NASA: Washington, DC, USA, 2000; p. 17. [Google Scholar]
  2. Johnson, W. Analytical Model for Tilting Proprotor Aircraft Dynamics, Including Blade Torsion and Coupled Bending Modes, and Conversion Mode Operation. Technical Report. 1974. Available online: https://ntrs.nasa.gov/citations/19740023385 (accessed on 24 August 2025).
  3. Johnson, W. Dynamics of Tilting Proprotor Aircraft in Cruise Flight. Technical Report. 1974. Available online: https://ntrs.nasa.gov/citations/19740019387 (accessed on 24 August 2025).
  4. Kvaternik, R.G. Studies in Tilt-Rotor VTOL Aircraft Aeroelasticity. Ph.D. Thesis, Case Western Reserve University, Cleveland, OH, USA, 1973. [Google Scholar]
  5. Weiberg, J.A.; Maisel, M.D. Wind-Tunnel Tests of the XV-15 Tilt Rotor Aircraft. Technical Report. 1980. Available online: https://ntrs.nasa.gov/api/citations/19800015802/downloads/19800015802.pdf (accessed on 24 August 2025).
  6. Magee, J.; Wernicke, K. XV-15 flight test results compared with design goals. In Proceedings of the Aircraft Systems and Technology Meeting, New York, NY, USA, 20–22 August 1979; p. 1839. [Google Scholar]
  7. McVeigh, M.; Rosenstein, H.; McHugh, F. Aerodynamic design of the XV-15 advanced composite tilt rotor blade. In Proceedings of the American Helicopter Society, Annual Forum, 39th, St. Louis, MO, USA, 9–11 May 1983; Volume 9. [Google Scholar]
  8. Gazdag, D. Potential Use of Tiltrotor Aircraft in Canadian Aviation; Ames Research Center, National Aeronautics and Space Administration: Washington, DC, USA, 1990; Volume 102245. [Google Scholar]
  9. McVeigh, M. The V-22 Tilt-rotor large-scale rotor performance/wing download test and comparison with theory. Vertica 1986, 10, 281–297. [Google Scholar]
  10. Felker, F.F. Wing Download Results from a Test of a 0.658-Scale V-22 Rotor and Wing. J. Am. Helicopter Soc. 1992, 37, 58–63. [Google Scholar] [CrossRef]
  11. Felker, F.F.; Signor, D.B.; Young, L.A.; Betzina, M.D. Performance and Loads Data from a Hover Test of a 0.658-Scale V-22 Rotor and Wing. Technical Report. 1987. Available online: https://ntrs.nasa.gov/citations/19870015863 (accessed on 24 August 2025).
  12. Felker, F.F.; Shinoda, P.R.; Heffernan, R.M.; Sheehy, H.F. Wing Force and Surface Pressure Data from a Hover Test of a 0.658-Scale V-22 Rotor and Wing. Technical Report. 1990. Available online: https://ntrs.nasa.gov/api/citations/19920013621/downloads/19920013621.pdf (accessed on 24 August 2025).
  13. Droandi, G.; Gibertini, G.; Grassi, D.; Campanardi, G.; Liprino, C. Proprotor–wing aerodynamic interaction in the first stages of conversion from helicopter to aeroplane mode. Aerosp. Sci. Technol. 2016, 58, 116–133. [Google Scholar] [CrossRef]
  14. Droandi, G.; Zanotti, A.; Gibertini, G.; Grassi, D.; Campanardi, G. Experimental investigation of the rotor-wing aerodynamic interaction in a tiltwing aircraft in hover. Aeronaut. J. 2015, 119, 591–612. [Google Scholar] [CrossRef]
  15. Potsdam, M.A.; Strawn, R.C. CFD simulations of tiltrotor configurations in hover. J. Am. Helicopter Soc. 2005, 50, 82–94. [Google Scholar] [CrossRef]
  16. Lim, J.W. Fundamental investigation of proprotor and wing interactions in tiltrotor aircraft. In Proceedings of the 75th Annual Vertical Flight Society Forum and Technology Display, Philadelphia, PA, USA, 13–16 May 2019; pp. 13–16. [Google Scholar]
  17. Tran, S.A.; Lim, J.W. Investigation of the interactional aerodynamics of the XV-15 tiltrotor aircraft. In Proceedings of the 76th Annual Vertical Flight Society Forum and Technology Display, Virtual, 5–8 October 2020; pp. 6–8. [Google Scholar]
  18. Lim, J.; Tran, S. Interactional structural loads of the xv-15 rotor in airplane mode. In Proceedings of the 45th European Rotorcraft Forum, Warsaw, Poland, 17–20 September 2019; pp. 17–20. [Google Scholar]
  19. Tran, S.; Lim, J.; Nunez, G.; Wissink, A.; Bowen-Davies, G. CFD Calculations of the XV-15 tiltrotor during transition. In Proceedings of the American Helicopter Society 75th Annual Forum, Philadelphia, PA, USA, 13–16 May 2019; pp. 13–16. [Google Scholar]
  20. Gennaretti, M.; Bernardini, G. Novel boundary integral formulation for blade-vortex interaction aerodynamics of helicopter rotors. AIAA J. 2007, 45, 1169–1176. [Google Scholar] [CrossRef]
  21. Gennaretti, M.; Colella, M.M.; Bernardini, G. Prediction of tiltrotor vibratory loads with inclusion of wing-proprotor aerodynamic interaction. J. Aircr. 2010, 47, 71–79. [Google Scholar] [CrossRef]
  22. Wentrup, M.; Yin, J.; Kunze, P.; Streit, T.; Wendisch, J.H.; Schwarz, T.; Pinacho, J.P.; Kicker, K.; Fukari, R. An overview of DLR compound rotorcraft aerodynamics and aeroacoustics activities within the CleanSky2 NACOR Project. In Proceedings of the AHS Forum 2018, San Francisco, CA, USA, 16–18 January 2018. [Google Scholar]
  23. Opoku, D.G.; Triantos, D.G.; Nitzsche, F.; Voutsinas, S.G. Rotorcraft aerodynamic and aeroacoustic modelling using vortex particle methods. In Proceedings of the 23rd International Congress of Aeronautical Sciences (ICAS 2002), Toronto, ON, Canada, 8–13 September 2002; pp. 8–13. [Google Scholar]
  24. Tan, J.F.; Zhou, T.Y.; Sun, Y.M.; Barakos, G.N. Numerical investigation of the aerodynamic interaction between a tiltrotor and a tandem rotor during shipboard operations. Aerosp. Sci. Technol. 2019, 87, 62–72. [Google Scholar] [CrossRef]
  25. Zanotti, A.; Savino, A.; Palazzi, M.; Tugnoli, M.; Muscarello, V. Assessment of a Mid-Fidelity Numerical Approach for the Investigation of Tiltrotor Aerodynamics. Appl. Sci. 2021, 11, 3385. [Google Scholar] [CrossRef]
  26. Droandi, G.; Syal, M.; Bower, G. Tiltwing multi-rotor aerodynamic modeling in hover, transition and cruise flight conditions. In Proceedings of the AHS International 74th Annual Forum & Technology Display, Phoenix, AZ, USA, 14–17 May 2018; AHS International: Fairfax, VA, USA, 2018; Volume 1, pp. 46–62. [Google Scholar]
  27. Montagnani, D.; Tugnoli, M.; Zanotti, A.; Syal, M.; Droandi, G. Analysis of the interactional aerodynamics of the vahana evtol using a medium fidelity open source tool. In Proceedings of the VFS Aeromechanics for Advanced Vertical Flight Technical Meeting, San Jose, CA, USA, 21–23 January 2020; Vertical Flight Society: Fairfax, VA, USA, 2020; pp. 436–451. [Google Scholar]
  28. Piccinini, R.; Tugnoli, M.; Zanotti, A. Numerical Investigation of the Rotor-Rotor Aerodynamic Interaction for eVTOL Aircraft Configurations. Energies 2020, 13, 5995. [Google Scholar] [CrossRef]
  29. Zhang, J.; Smith, E. Influence of aeroelastically tailored wing extensions and winglets on whirl flutter stability. In Proceedings of the 2nd Asian/Australian Rotorcraft Forum, ARF 2013, Tianjin, China, 8–11 September 2013; American Helicopter Society International: Fairfax, VA, USA, 2013; pp. 188–200. [Google Scholar]
  30. Karem, A. Tilt Outboard Wing for Tilt Rotor Aircraft. US Patent 7,802,754, 2010. [Google Scholar]
  31. Acree, C.W. Aerodynamic limits on Large Civil Tiltrotor sizing and efficiency. In Proceedings of the Decennial AHS Aeromechanics Specialists’ Conference, San Francisco, CA, USA, 22–24 January 2014; p. ARC-E-DAA-TN12696. [Google Scholar]
  32. Simmons, B.M.; Buning, P.G.; Murphy, P.C. Full-envelope aero-propulsive model identification for lift+ cruise aircraft using computational experiments. In Proceedings of the AIAA Aviation 2021 Forum, Virtual, 2–6 August 2021; p. 3170. [Google Scholar]
  33. Deb, K.; Pratap, A.; Agarwal, S.; Meyarivan, T. A fast and elitist multiobjective genetic algorithm: NSGA-II. IEEE Trans. Evol. Comput. 2002, 6, 182–197. [Google Scholar] [CrossRef]
  34. Tugnoli, M.; Montagnani, D.; Syal, M.; Droandi, G.; Zanotti, A. Mid-fidelity approach to aerodynamic simulations of unconventional VTOL aircraft configurations. Aerosp. Sci. Technol. 2021, 115, 106804. [Google Scholar] [CrossRef]
  35. Economon, T.D.; Palacios, F.; Copeland, S.R.; Lukaczyk, T.W.; Alonso, J.J. SU2: An open-source suite for multiphysics simulation and design. AIAA J. 2016, 54, 828–846. [Google Scholar] [CrossRef]
  36. Winckelmans, G.S. Topics in Vortex Methods for the Computation of Three-and Two-Dimensional Incompressible Unsteady Flows. Ph.D. Thesis, California Institute of Technology, Pasadena, CA, USA, 1989. [Google Scholar]
  37. Cottet, G.; Mas-Gallic, S. A particle method to solve the Navier-Stokes system. Numer. Math. 1990, 57, 805–827. [Google Scholar] [CrossRef]
  38. Morino, L.; Kuot, C.C. Subsonic potential aerodynamics for complex configurations: A general theory. AIAA J. 1974, 12, 191–197. [Google Scholar] [CrossRef]
  39. Acree, C.W., Jr. An Improved CAMRAD Model for Aeroelastic Stability Analysis of the XV-15 with Advanced Technology Blades; TM 4448; NASA: Washington, DC, USA, 1993. [Google Scholar]
  40. Drela, M. XFOIL: An Analysis and Design System for Low Reynolds Number Airfoils. In Proceedings of the Low Reynolds Number Aerodynamics, Notre Dame, IN, USA, 5–7 June 1989; Mueller, T.J., Ed.; Springer: Berlin/Heidelberg, Germany, 1989; pp. 1–12. [Google Scholar]
  41. Viterna, L.A.; Janetzke, D.C. Theoretical and Experimental Power from Large Horizontal-Axis Wind Turbines; Technical Report; Washington Procurement Operations Office: Washington, DC, USA, 1982. [Google Scholar]
  42. Johnson, W. CAMRAD II, Comprehensive Analytical Model of Rotorcraft Aerodynamics and Dynamics, Volume I: Theory; Johnson Aeronautics: Palo Alto, CA, USA, 1992. [Google Scholar]
  43. Palazzi, M. Mid-Fidelity Approach to Tiltrotor Aerodynamics. Master’s Thesis, Politecnico di Milano, Milan, Italy, 2020. [Google Scholar]
  44. Muscarello, V.; Quaranta, G. Structural Coupling and Whirl-Flutter Stability with Pilot-in-the-Loop. J. Am. Helicopter Soc. 2021, 66, 1–16. [Google Scholar] [CrossRef]
  45. Maisel, M. NASA/Army XV-15 Tilt-Rotor Research Aircraft Familiarization Document; TM X-62,407; NASA: Washington, DC, USA, 1975. [Google Scholar]
  46. Lindsay, K.; Krasny, R. A particle method and adaptive treecode for vortex sheet motion in three-dimensional flow. J. Comput. Phys. 2001, 172, 879–907. [Google Scholar] [CrossRef]
  47. Saetta, L.; Tognaccini, R. Implementation and validation of a new actuatordisk model in SU2. In Proceedings of the SU2 Conference, Princeton, NJ, USA, 10–12 June 2020. [Google Scholar]
  48. Murphy, P.C.; Hatke, D.; Aubuchon, V.V.; Weinstein, R.; Busan, R.C. Preliminary Steps in Developing Rapid Aero Modeling Technology. In Proceedings of the AIAA Scitech 2020 Forum, Orlando, FL, USA, 6–10 January 2020; p. 0764. [Google Scholar]
  49. Murphy, P.C.; Buning, P.G.; Simmons, B.M. Rapid Aero Modeling for Urban Air Mobility Aircraft in Computational Experiments. In Proceedings of the AIAA SciTech 2021 Forum, Online, 19–21 January 2021; p. 1002. [Google Scholar]
  50. Murphy, P.C.; Simmons, B.M.; Hatke, D.B.; Busan, R.C. Rapid Aero Modeling for Urban Air Mobility Aircraft in Wind-Tunnel Tests. In Proceedings of the AIAA SciTech 2021 Forum, Online, 19–21 January 2021; p. 1644. [Google Scholar]
  51. Montgomery, D.C. Design and Analysis of Experiments; John Wiley & Sons: Hoboken, NJ, USA, 2017. [Google Scholar]
  52. Alexopoulos, E.C. Introduction to multivariate regression analysis. Hippokratia 2010, 14, 23. [Google Scholar]
  53. Pedregosa, F.; Varoquaux, G.; Gramfort, A.; Michel, V.; Thirion, B.; Grisel, O.; Blondel, M.; Prettenhofer, P.; Weiss, R.; Dubourg, V.; et al. Scikit-learn: Machine Learning in Python. J. Mach. Learn. Res. 2011, 12, 2825–2830. [Google Scholar]
  54. Kuhn, M.; Johnson, K. Feature Engineering and Selection: A Practical Approach for Predictive Models; CRC Press: Boca Raton, FL, USA, 2019. [Google Scholar]
  55. Deb, K. Multi-objective optimisation using evolutionary algorithms: An introduction. In Multi-Objective Evolutionary Optimisation for Product Design and Manufacturing; Springer: Berlin/Heidelberg, Germany, 2011; pp. 3–34. [Google Scholar]
  56. Srinivas, N.; Deb, K. Muiltiobjective optimization using nondominated sorting in genetic algorithms. Evol. Comput. 1994, 2, 221–248. [Google Scholar] [CrossRef]
  57. Blank, J.; Deb, K. pymoo: Multi-Objective Optimization in Python. IEEE Access 2020, 8, 89497–89509. [Google Scholar] [CrossRef]
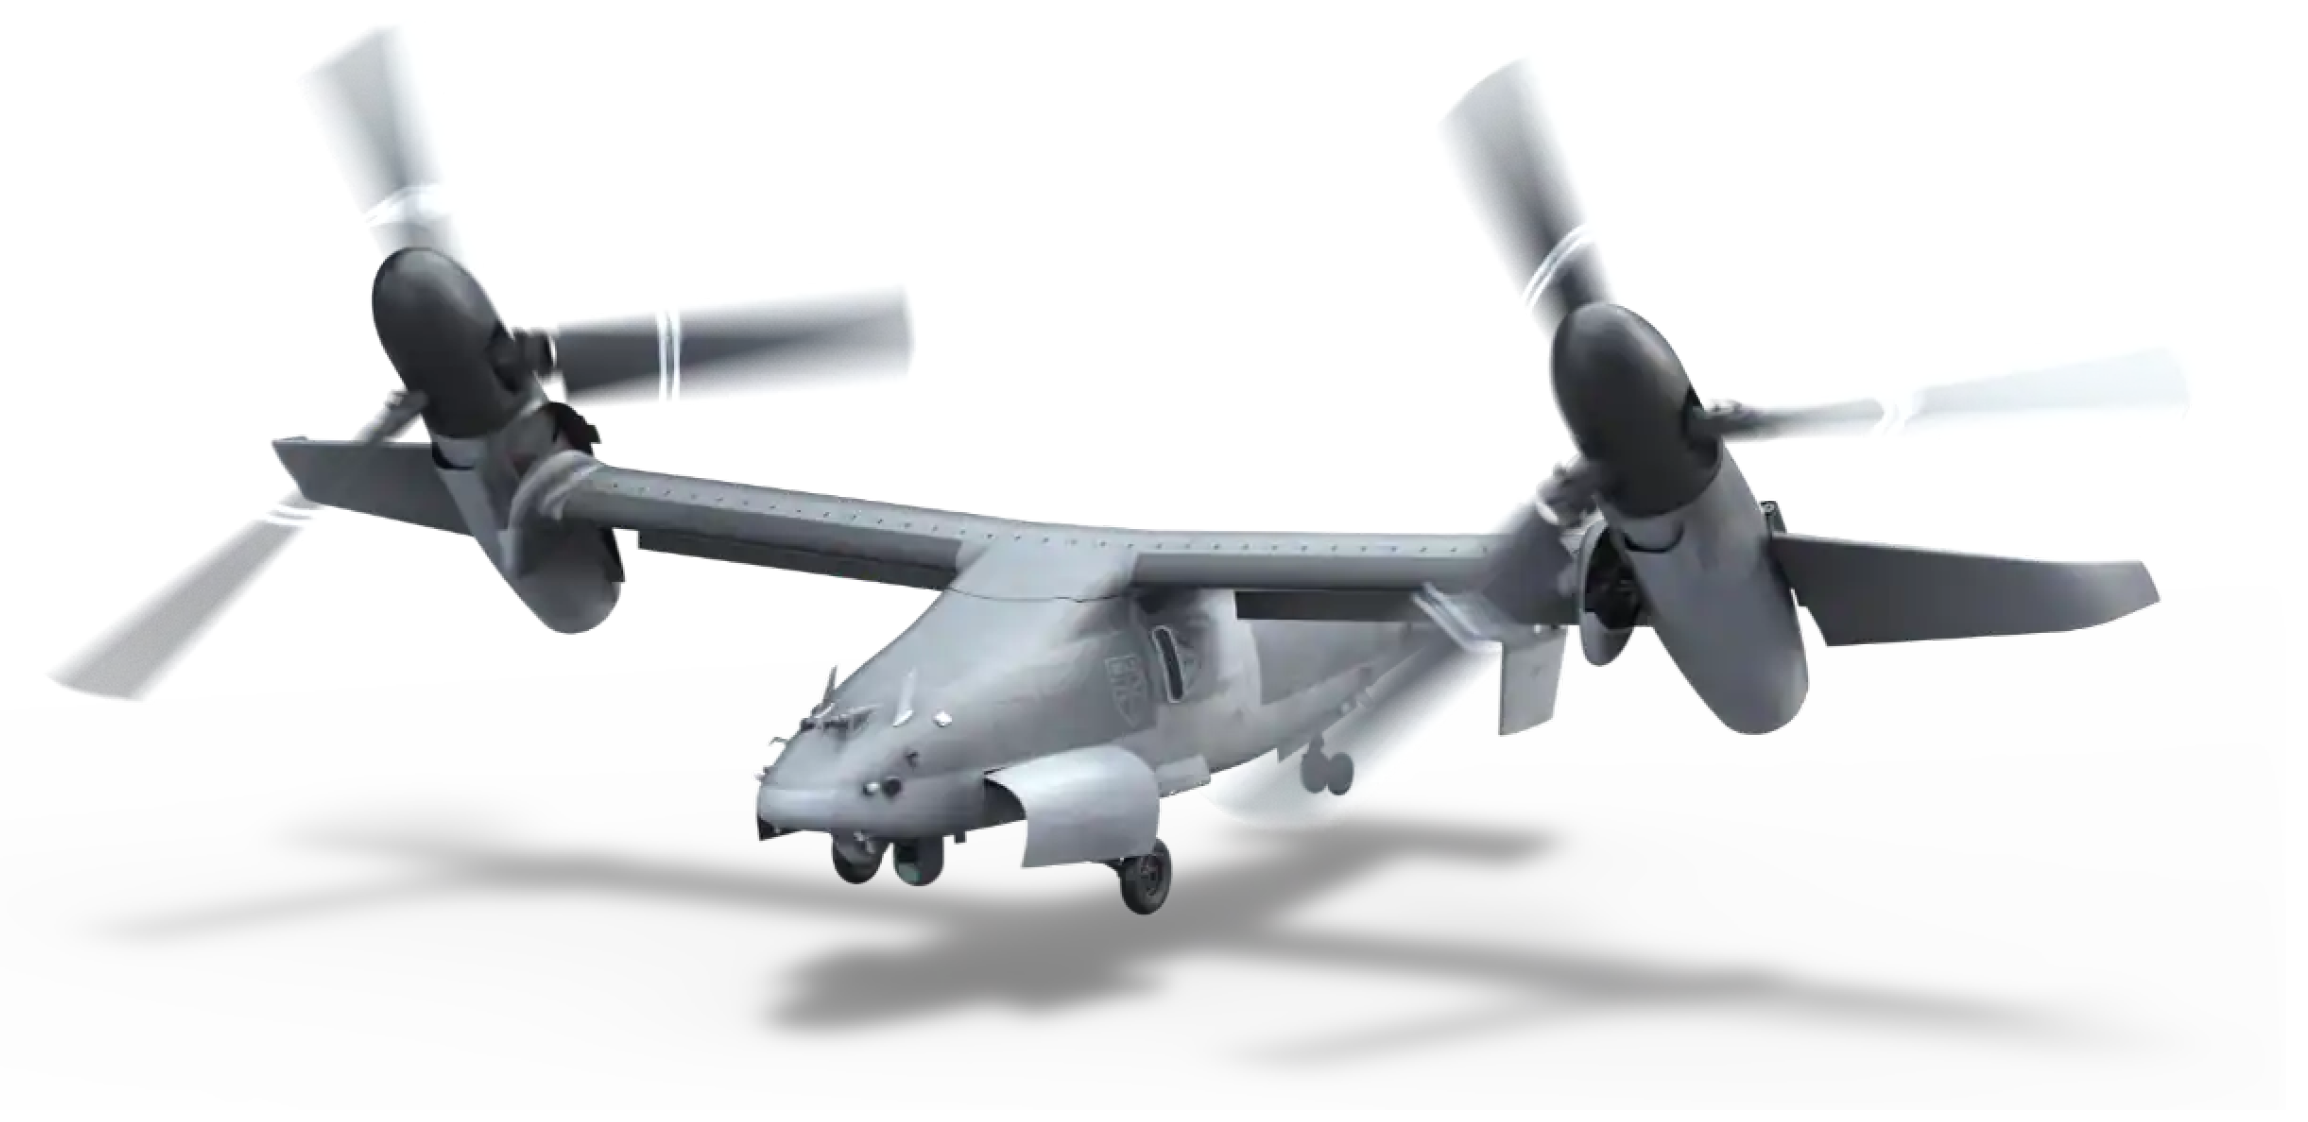
Figure 1. Bell V-247. https://bellflight.com (accessed on 24 August 2025).
Applsci 15 09491 g001
Figure 2. Baseline configuration of the wing and rotor system.
Applsci 15 09491 g002
Figure 3. Comparison of the single proprotor collective angle and performance between DUST numerical model and CAMRAD-JA [44] as a function of flight speed. (a) Thrust. (b) Torque. (c) Collective angle.
Applsci 15 09491 g003
Figure 4. Baseline geometry definiton.
Applsci 15 09491 g004
Figure 5. Inner region span analysis.
Applsci 15 09491 g005
Figure 6. Winglet parameter definiton.
Applsci 15 09491 g006
Figure 7. Mesh for the numerical model implemented in DUST.
Applsci 15 09491 g007
Figure 8. Aerodynamic loads convergence as function of rotor revolutions at U = 133.8 m s−1. (a) Wing lift. (b) Rotor thrust.
Applsci 15 09491 g008
Figure 9. CFD volume unstructured grid. (a) Volume mesh refinement regions. (b) Wing surface mesh and boundary layer cells.
Applsci 15 09491 g009
Figure 10. Block diagram of the optimization methodology.
Applsci 15 09491 g010
Figure 11. Selected blocks for the DOE process: explanatory variables and validation points. (a) Blocks 1-2-3: 2 explanatory variables. (b) Blocks 1-2-3: 3 explanatory variables.
Applsci 15 09491 g011
Figure 12. Pareto front and selected points.
Applsci 15 09491 g012
Figure 13. Geometry and C p distribution (suction side) for the four selected wing extension configurations. (a) Configuration A. (b) Configuration B. (c) Configuration C. (d) Configuration D.
Applsci 15 09491 g013
Figure 14. Time history of the non-dimensional blade normal force M 2 c n during one proprotor revolution.
Applsci 15 09491 g014
Figure 15. Contour plot of the non-dimensional normal force M 2 c n during one proprotor revolution. (a) Baseline. (b) Winglet D.
Applsci 15 09491 g015
Figure 16. Contour plot of the sectional normal force on the wing during one proprotor revolution. (a) Configuration A. (b) Configuration D.
Applsci 15 09491 g016
Figure 17. Isosurface of Q-criterion at ψ = 90°. (a) Configuration A. (b) Configuration D.
Applsci 15 09491 g017
Figure 18. Winglet configuration A.
Applsci 15 09491 g018
Figure 19. Winglet configuration D.
Applsci 15 09491 g019
Figure 20. Selected points of the Pareto front from DUST and CFD: DUST results re-scaled by the scaling factor. (a) Bending moment vs. lift. (b) Bending moment vs. efficiency.
Applsci 15 09491 g020
Table 1. XV-15 main rotor data [39].
Rotor Data
Number of blades3
Solidity0.103
Radius3.81 m
Precone1.5deg
Helicopter speed (HP)601RPM
Airplane speed (AP)480.8RPM
Table 2. Range of the wing extension design variables.
Design VariablesMinimumMaximum
Sweep ( Λ )10°
Dihed ( Γ )−5°
Span ( b w )1.125 m2.275 m
Incidence ( α w )
Chord (c)0.4 m1.2 m
Table 3. Percentage errors of E and M x for different blocks and order n of polynomial features.
E M b
n 234234
FFD1.4%3.0%1.5%0.7%13%10%
FFD+CCD0.3%2.0%10%0.1%1.2%12%
Table 4. Four geometrical configuration selected.
Design VariablesABCD
Sweep ( Λ )10°9.96°10°
Dihed ( Γ )−5°−4.55°−0.42°3.37°
Span ( b w )1.125 m1.253 m1.75 m2.18 m
Incidence ( α w )1.83°0.09°0.27°
Chord (c)0.8 m0.4 m0.4 m0.4 m
Table 5. Numerical results from DUST and CFD simulations.
DUSTSU2
L [N] D [N] M b [N m−1] E L [N] D [N] M b [N m−1] E
A37,01765999,72156.233,211161286,99720.6
B37,958630104,91960.234,290157492,20421.8
C39,673628114,59563.136,1521620102,22122.3
D41,365636124,67565.139,7831741121,60522.8
E43,036649135,19666.339,6821776123,49322.3
Disclaimer/Publisher’s Note: The statements, opinions and data contained in all publications are solely those of the individual author(s) and contributor(s) and not of MDPI and/or the editor(s). MDPI and/or the editor(s) disclaim responsibility for any injury to people or property resulting from any ideas, methods, instructions or products referred to in the content.