Abstract
The present study aims to explore the technical feasibility of simulating in advance, and thus forecasting, the occurrence of low-level windshear at an airport in the complex terrain of the Qinghai–Tibet Plateau. Three cases of windshear at Xining Airport are investigated. They are related to synoptic scale subsidence flow and downward momentum transfer, terrain modification of a cold front, and wind convergence arising from synoptic- and mesoscale high-pressure areas. The simulation results are compared with actual Doppler LIDAR observations. It is found that the simulations reproduce the windshear features reasonably well. The low-level wind speed and/or wind direction convergence are clearly represented in the simulations. The simulated LIDAR radial velocity has a correlation coefficient of over 0.9 with the actual LIDAR radial velocity. Though the present study involves a limited number of cases, it is found to be feasible to use a high-resolution numerical weather prediction model to simulate low-level windshear at an airport on the plateau. It is hoped that this methodology could be extended from the Hong Kong International Airport to the plateau airports, and then to airports in other parts of the world.
1. Introduction
Low-level windshear refers to sustained changes in headwinds to be encountered by an aircraft. This would cause changes to the lift of the aircraft and could be hazardous when the aircraft is close to the ground. Timely alerting of windshear is important for the assurance of aviation safety. Windshear may arise from the weather phenomenon itself, such as a wet microburst associated with thunderstorms. It may also occur as a result of the impact of complex terrain around an airport on the prevailing airflow.
Windshear has been an active area of research in the aviation community. The earliest research includes studies of windshear at Juneau Airport in Alaska, United States of America, due to complex terrain [1]. There are other airports with complicated terrain in which windshear is an issue, such as the St. Helena Airport. Robinson [2] performed a case study on St. Helena airport and utilized computational modeling to illustrate the generation of windshear in the vicinity of the airport. Various analyses and studies on windshear and turbulence were conducted in airports around the world, like Nice Côte d’Azur Airport [3], six airports in Saudi Arabia [4], Garoua Airport [5], Constantine Airport in France [6], etc.
In order to detect, alert, and forecast windshear in areas of complex terrain, different observational instruments have been adopted, such as Doppler Light Detection and Ranging (LIDAR) [7] and airborne radar [8]. These detection and alerting systems can only warn windshear at the nowcast time range (0 to 2 h) as they are based mainly on observations, tracking, and short-term prediction. For an operating airport, an early alerting system or evaluation of the windshear risk for the next 2 to 12 h will be crucial for the planning of airport operations or flight planning by the airlines. Therefore, the use of a numerical simulation model is essential for extending the usable forecast lead times for windshear. Current global numerical weather prediction model on the scale of tenths of kilometres cannot capture the effect of mountainous terrain on the low-level wind pattern around the airport.
Downscaling methods to localized terrain features have been tried, for instance by Wang et al. [9], who used the Weather Research and Forecasting—California Meteorological Model (WRF-CALMET) to stimulate low-level windshear at Zhongchuan Airport. In addition, numerical simulation with high spatial resolution has been studied for the complex terrain at Hong Kong International Airport [10]. Large eddy simulations (LESs) have been used extensively for simulating terrain-disrupted airflow, e.g., [11,12,13], including mountain waves, rotors, and other phenomena. They are also employed for investigating aircraft operations in areas of complex terrain, such as in [14,15]. LES has been used together with Doppler LIDAR data for the retrieval of eddy dissipation, as in [16]. In this study, LES is utilized to investigate the features of airflow in areas of complex terrain at the Qinghai–Tibet Plateau and their potential impact on aircraft operation.
It would be desirable to forecast windshear in advance, so that the air traffic controllers and the air pilots could prepare for the possible wind changes potentially affecting aircraft operations. For an area with complex terrain, a high-resolution numerical weather prediction (NWP) model with a horizontal resolution of 40 m has been tried out for windshear forecasting for the Hong Kong International Airport (HKIA), which is located in an area of complex terrain [10].
In the present paper, it is the first time that high-resolution NWP modeling of low-level windshear on the actual windshear encounters at Xining Airport (IATA: XNN, ICAO: ZLXN) is reported. Three windshear cases would be considered. The first two cases occurred on the same day, on 13 February 2020, and were related to the large-scale meteorological pattern, with strong subsidence and downward momentum transfer, leading to the strengthening up of the winds near the surface. This is followed by the arrival of a cold front, whose wind pattern is modified by complex terrain at the airport. The third windshear case is related to a “double high-pressure pattern” near the airport, causing convergence of low-level winds with opposing wind direction. This study aims to investigate whether the use of the high-resolution NWP and LES is able to reproduce the complex wind pattern and main windshear features for ZLXN, which is an airport surrounded by mountainous terrain. It also attempts to appraise if the high-resolution modeling used for HKIA for terrain-disrupted flow can be applied to other airports facing similar issues of low-level turbulence due to terrain. Note that the settings of climatic conditions, large-scale circulation, and the height of mountains differ for ZLXN and HKIA. The study will help to provide insights into the applicability of LES in different international airport settings, which can potentially forecast windshear in advance to safeguard aviation safety. In addition, the study is novel as the LES would be validated with the actual LIDAR and wind profiler observations (both qualitatively and quantitatively) at ZLXN. The comparison will be made at a high temporal resolution to investigate whether advance warnings are practical.
2. Qinghai–Tibet Plateau
Airports located at the Qinghai–Tibet Plateau may be susceptible to low-level windshear due to complex terrain. This study focused on the Xining Airport (IATA: XNN, ICAO: ZLXN), which is located in a valley in the plateau area. The terrain in the vicinity of the airport is shown in Figure 1a. There is also the Qinghai Lake at a location of ~150 km to the west of the airport (Figure 1b). This complex terrain environment may cause distortion of the prevailing airflow under certain meteorological conditions and may lead to low-level windshear. Some windshear events at Xining Airport have been documented. This includes the investigation of two types of windshear caused by different synoptic processes [17], analysis of pilot reports and observational networks to investigate the underlying meteorological factors [18], and analysis of the process of windshear caused by microbursts [19,20].
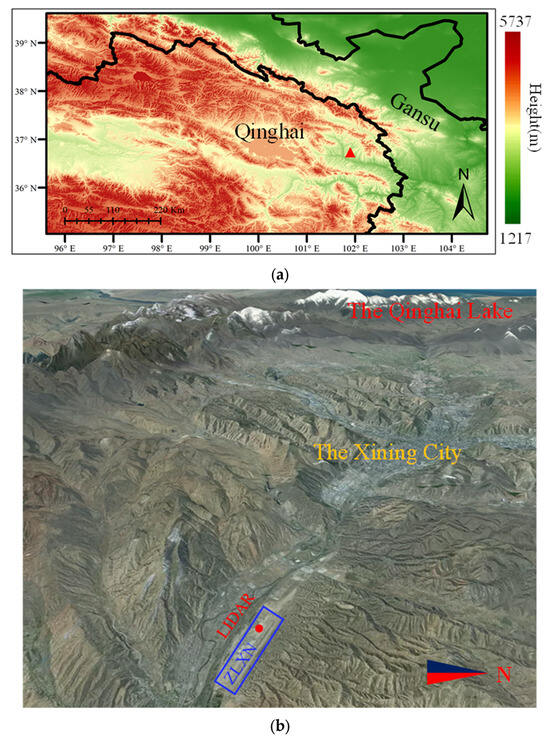
Figure 1.
The map showing the topography around Xining Airport, with the red triangle indicating the location of the airport (a). A three-dimensional map showing the location of Xining Airport (ZLXN), the LIDAR installed at the airport, Xining City, Qinghai Lake, and the terrain nearby (b).
Timely alerting of low-level windshear will depend on the meteorological conditions in which the changes of wind occur. For rainy weather conditions, the windshear at ZLXN is detected by a C-band Doppler Weather Radar. For clear air weather conditions, it is becoming more popular to use Light Detection and Ranging (LIDAR) for the detection of windshear, which was first reported in [21], having been applied at the Hong Kong International Airport. ZLXN is also equipped with a LIDAR (location indicated in Figure 1b), which is close to the centre of the runway. This LIDAR operates in the following modes, namely, conical scanning to produce the vertical wind profile (DBS), vertical cross section scanning along the runway direction to produce range-height-indicator (RHI) scans, and quasi-horizontal scanning with low elevation angles to produce the plan position indicator (PPI) scans, with elevation angles of 3 degrees, 4 degrees, and 6 degrees, for the detection of wind patterns around the airport and possible windshear reports for arriving and departing aircraft.
3. Numerical Simulation
The Regional Atmospheric Modeling System (RAMS) version 6.4 is employed in this study. The setup of the model is similar to the simulation setup described in [10]. The RAMS has been nested five times with ZLXN at the centre of the model domains, which are shown in Figure 2a,b. The spatial resolution of the simulation is increased by a factor of five, namely, 25 km, 5 km, 1 km, 200 m, and 40 m. The first model level is about 30 m above the sea surface with a stretching ratio (ratio of model level heights between the adjacent model levels) of 1.08. The choices of turbulence parameterization schemes are as follows: the Smagorinsky scheme [22] is utilized for the first two nests, and the Deardorff scheme [23] is employed for the remaining three nests. This combination of parametrization is chosen following a study at the HKIA [24].
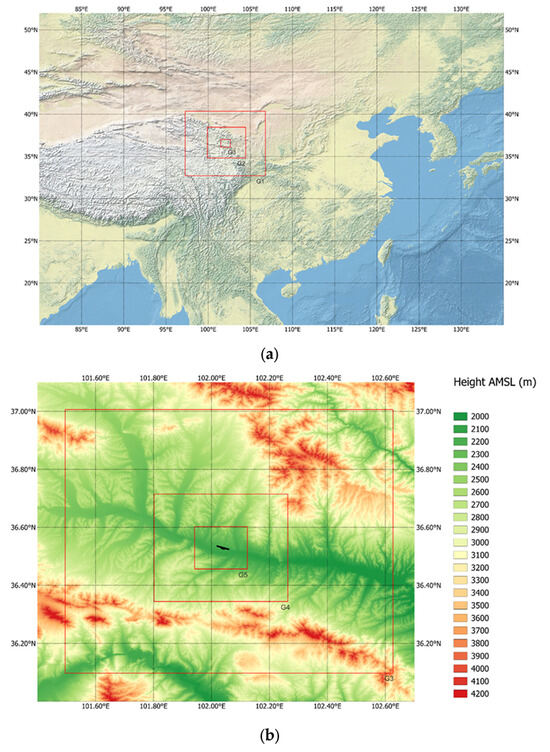
Figure 2.
The model domains, 1, 2, and 3 (a) and 3, 4, and 5 (b) are indicated by red boxes.
There are two major changes to the modeling system, reported in [10], for the present study:
- High-resolution (30 m) terrain data around ZLXN is used in order to have a good representation of the complex terrain near the airport.
- While National Centres for Environmental Prediction (NCEP)’s Global Forecast System (GFS) data are used as a boundary for the simulation of the first two cases (similar to [10]) with a resolution of 0.25 degrees and a temporal resolution of 6 h. It is found to have insufficient temporal resolution to simulate the third case because, as discussed below, the high-pressure system to the west of the airport turns out to be too transient to be captured by the NCEP data with a temporal resolution of 6 h only. As such, the European Centre of Medium-Range Weather Forecast (ECMWF) Reanalysis v5 (ERA5) data with a temporal resolution of 1 h has been adopted for the simulation of the third case.
The details of the initialization of the model are mentioned individually below for each of the cases.
4. Simulation Results
4.1. Cases 1 and 2—Downward Wind Burst and Cold Front
The synoptic pattern in the morning of 13 February 2020 is shown in Figure 3a. There was a broad trough at the 500 hPa level upstream of ZLXN. The passage of the trough over the airport led to downward momentum transfer, which caused strengthening of winds near the surface of ZLXN. This sudden temporal change in wind speed resulted in low-level windshear. However, due to the relatively low air traffic of the airport, there were no pilot reports of windshear for this case. Detailed synoptic analysis and observational data for this windshear case could be found in [17].
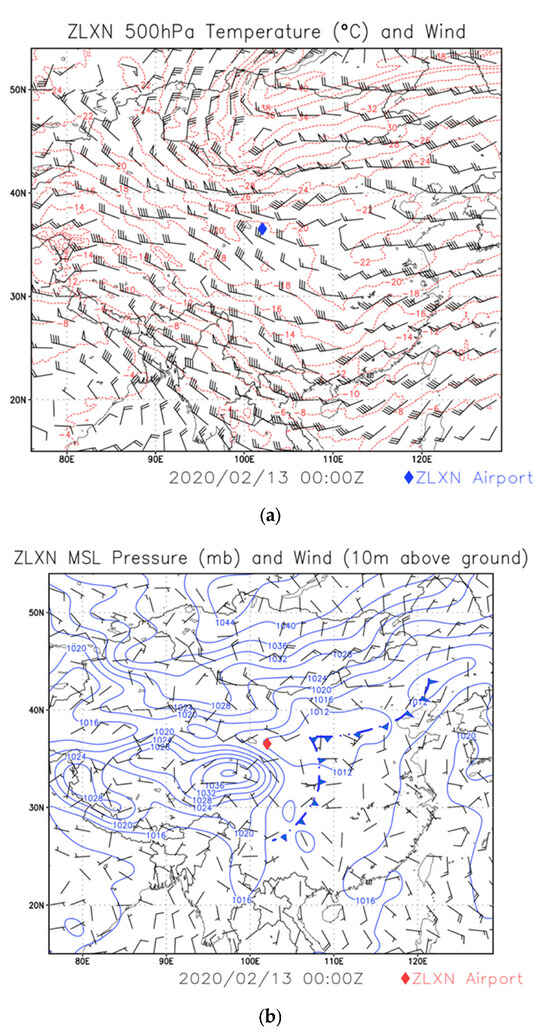
Figure 3.
Wind and temperature map for 500 hPa (a) and surface pressure and wind pattern (b) at 00Z on 13 February 2020. The blue dotted line with arrows in (b) represents the cold front. The diamond icon indicates the location of ZLXN airport.
The present study mainly focuses on the capability of a high-resolution NWP model to capture this sudden momentum transfer. The model was initialized at 06 UTC, 13 February 2020, and run for 6 h. The simulated vertical wind profile at the ZLXN LIDAR location is shown in Figure 4a. There is a sharp change in the wind at a height of 200 m or so within an hour between 07 UTC and 08 UTC of the day, with the wind speed picking up abruptly from around 30 knots to more than 50 knots (highlighted inside the orange box in Figure 4a). This is accompanied by strong downward motion, with downward vertical velocity more than 3 m/s up to a height of around 2200 m above ground (highlighted inside the yellow box in Figure 4a). The simulations are generally consistent with the actual LIDAR observations (Figure 4b). The simulation can capture the strengthening of the winds to 50 knots at around 07 UTC to 08 UTC, but the actual downward vertical velocity is much shallower than the simulation. A comparison of the simulated velocity and the LIDAR radial velocity (Figure 5a) shows a linear positive relationship with high correlation between the simulated and the actual velocity, validating that the strengthening of westerlies is well captured. As such, this synoptic pattern leading to downward momentum transfer is well reproduced in the NWP model. The simulation model can provide at least 1 h lead time for denoting the change in wind strength.
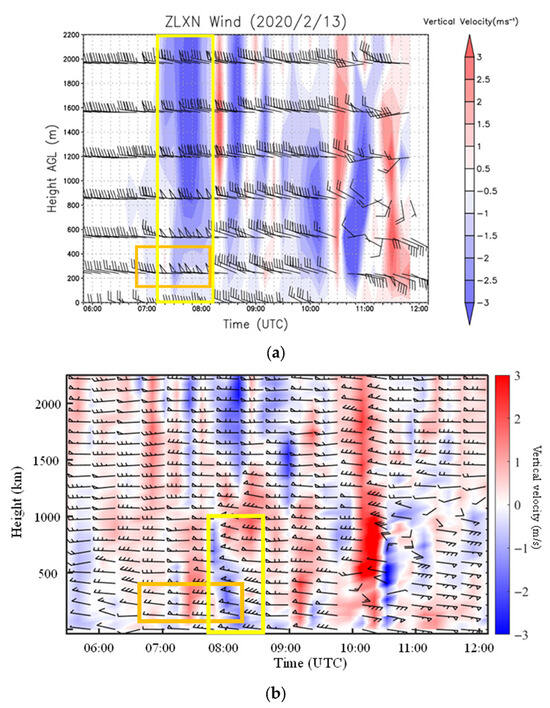
Figure 4.
The simulated vertical wind profiles for the ZLXN LIDAR (a) and the actual vertical wind profiles from the ZLXN LIDAR (b) for 06Z to 12Z on 13 February 2020.
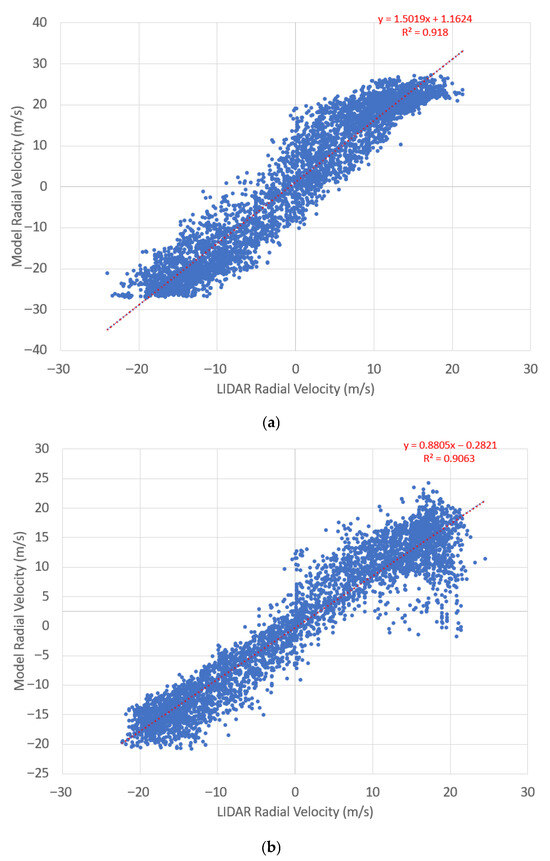
Figure 5.
The simulated radial velocity against actual LIDAR radial velocity at 08:09Z (a) and 11:10Z (b) on 13 February 2020. The red dashed line is the linearly fitted line and the equation and coefficient of determination is shown in red on the top right corner of the figure.
Later in the day, the second windshear case occurred, following the arrival of the cold front, which is depicted in Figure 3b. Due to the complex terrain to the north of the airport, the northerly winds to the west of the airport flow around the mountain to become westerly winds, whereas the northerly winds to the east of the airport flow around the mountain and become easterly winds. As such, westerly and easterly winds converge over the airport, leading to low-level windshear, which is simulated very well in RAMS (Figure 6a). Moreover, there is a vertical change in the wind direction as a result of the cold front, with easterly winds near the surface changing to westerly winds at a height of around 1200 m above ground (Figure 4a, near 11 UTC). There were two pilot reports of windshear for this case, noting sharp changes in wind direction from westerly to easterly on arriving at the airport from the west. The wind changes reported by the pilots were generally consistent with the actual LIDAR observations (Figure 6b) and the present simulation results. The onset of the easterlies was also well captured in the model, with a strong correlation between the simulated and actual radial velocity (Figure 5b). Comparison between the simulated vertical wind speed against and the LIDAR wind profiler observations (Figure 6c) showed a strong positive relationship, with the downward motion of the wind captured in the simulation. The onset of the easterlies at 10Z and the windshear were well captured for a simulation model initialized at 06Z, giving a four-hour lead time for preparing for the windshear event.
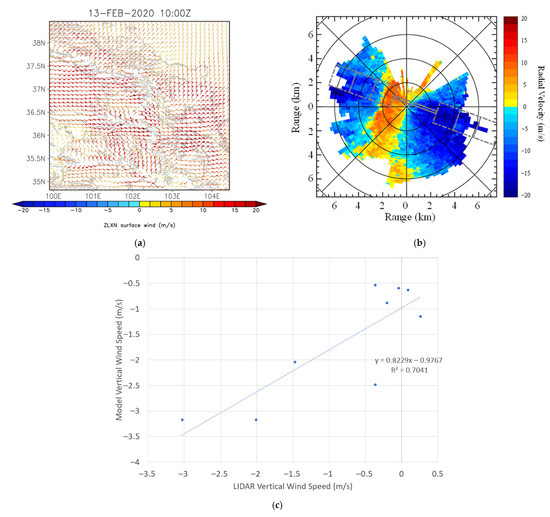
Figure 6.
The simulated surface wind pattern around the airport at 10Z on 13 February 2020 (a). The actual LIDAR PPI scan at 09:46Z (b) on the same day. The simulated vertical wind speed against actual LIDAR observations at 10:09Z (c) on the same day. The blue dashed line is the linearly fitted line and the equation and coefficient of determination is shown in black on the right side of the figure.
4.2. Case 3—Double High-Pressure Areas
The third case is related to a rather complex pattern of high-pressure areas near ZLXN. The 500 hPa weather pattern is shown in Figure 7a. There is a broad trough over the northern part of China, leading to a broad high-pressure area over that region. At the same time, there is a short wave upstream of ZLXN, and it is associated with a relatively small high-pressure area at the surface just to the west of the airport. The locations of these two high-pressure areas are shown in Figure 7b. The high-pressure area to the east leads to prevailing easterly flow at the airport. On the other hand, the relatively small and transient high-pressure area to the west of ZLXN also leads to the occurrence of westerly winds to the west of the airport for a short while. Due to the west–east-oriented valley channel at the airport, there is convergence between easterly winds to the east and westerly winds to the west, and as such low-level windshear occurs at ZLXN. The high-pressure area to the west of the airport is rather transient and weakens later in the day (Figure 7c).
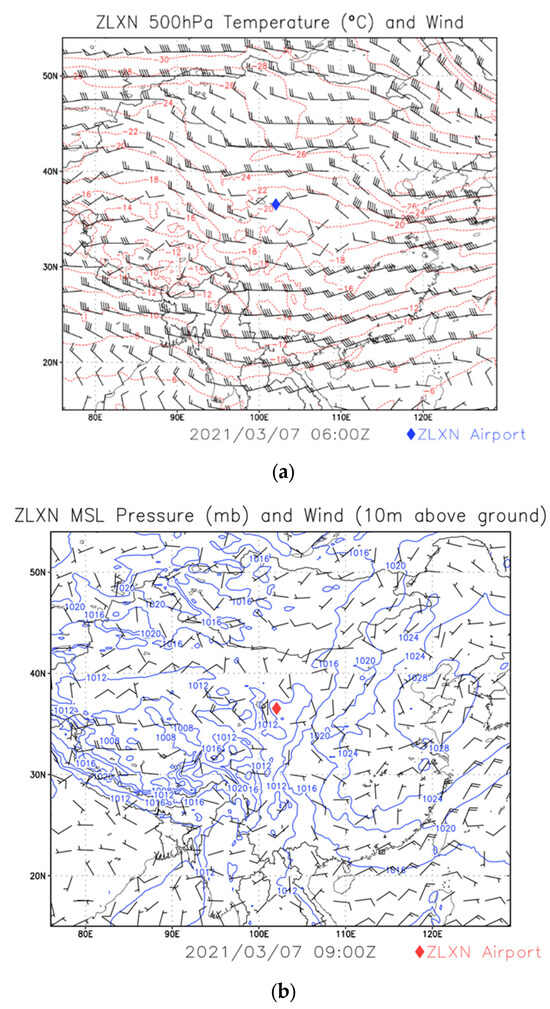
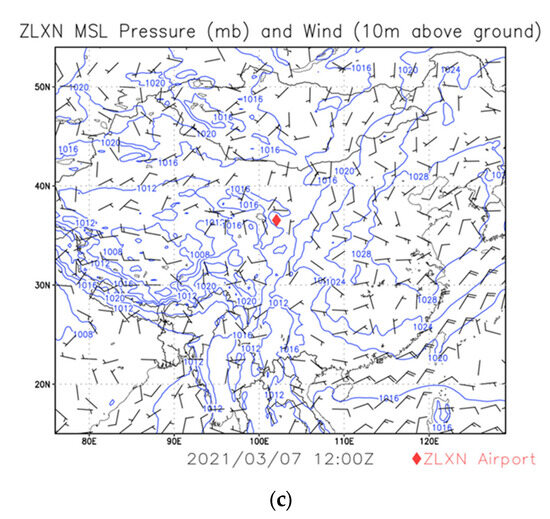
Figure 7.
Wind and temperature map for 500 hPa at 06Z on 7 March 2021 (a). Surface pressure and wind pattern at 09Z (b) and 12Z (c) on the same day. The diamond icon indicates the location of ZLXN airport.
The model simulated three-degree PPI scans of the LIDAR, as shown in Figure 8. In Figure 8a, prevailing east-to-southeasterly winds are present due to the high-pressure area to the east. On the other hand, a westerly wind starts to appear in the northwestern corner of the simulation domain. The westerly wind then strengthens, spreads eastward, and dominates the western part of the airport later (Figure 8b). About an hour later, the easterly flow picks up again due to the gradual weakening of the high-pressure area to the west of the airport and spreads westward (Figure 8c). Eventually, there is prevailing easterly flow across the entire airport region, associated with the dominance of the high-pressure area to the east (Figure 8d). The process is quite consistent with the actual LIDAR observations (Figure 9a). Comparison between the simulated and actual radial velocity shows a general positive relationship (Figure 9b) but the correlation is smaller than in Cases 1 and 2, which may be attributed to the small features of the surface high and the much lower wind speed compared with Cases 1 and 2. Nonetheless, the model successfully simulates the convergence and change of wind direction during the transition time around 14Z.
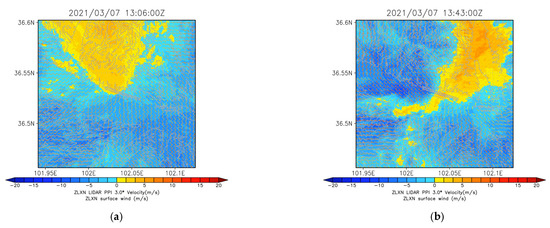
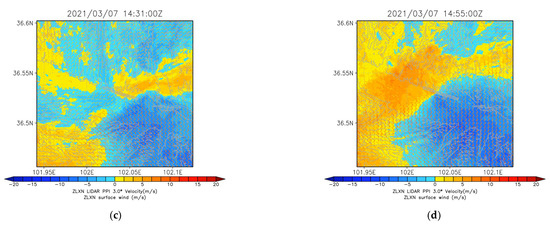
Figure 8.
Simulated 3-degree PPI Doppler velocity of the LIDAR and the simulated wind at (a) 13:06Z, (b) 13:43Z, (c) 14:31Z, and (d) 14:55Z, on 7 March 2021.
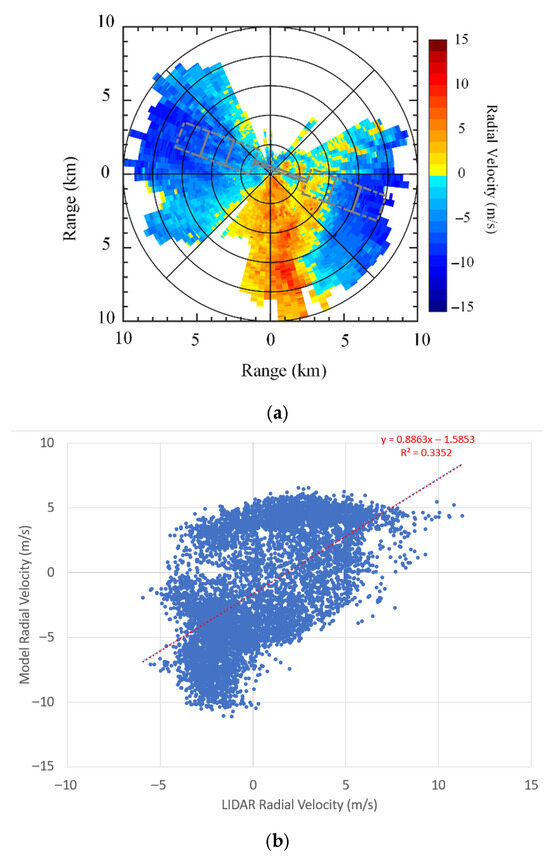
Figure 9.
The actual LIDAR PPI scan for Doppler velocity at 11:22Z (a) on 7 March 2021 and the simulated radial velocity against actual LIDAR radial velocity at 13:57Z (b) on the same day. The red dashed line is the linearly fitted line and the equation and coefficient of determination is shown in red on the top right corner of the figure.
The vertical cross section (mainly west–east oriented along the valley) of the LIDAR in the simulation is shown in Figure 10. There is a slight amount of westerly wind to the west of the airport at first (Figure 10a), and then it dominates over the runway (Figure 10b). The westerly winds are undercut by the background easterly flow, and there is uplifting of the westerly wind just to the east of the LIDAR. Later on, the easterly winds pick up (Figure 10c) and undercut the westerly winds. They eventually dominate over the whole airport area (Figure 10d). The convergence of the westerly and the easterly, as well as the transient undercutting, also show up in the actual LIDAR cross sections (Figure 10e). While the outcomes of the windshear simulations are temporally slightly later than those identified by the actual LIDAR observations, the simulations are deemed to be quite reasonable. A difference of a couple of hours is already the best the simulation could do, and similar temporal discrepancies are also found in the simulations for windshear in Hong Kong. This case illustrates the challenges in the numerical simulation for cases involving small weather features, where the simulated time may differ from the actual by a couple of hours.
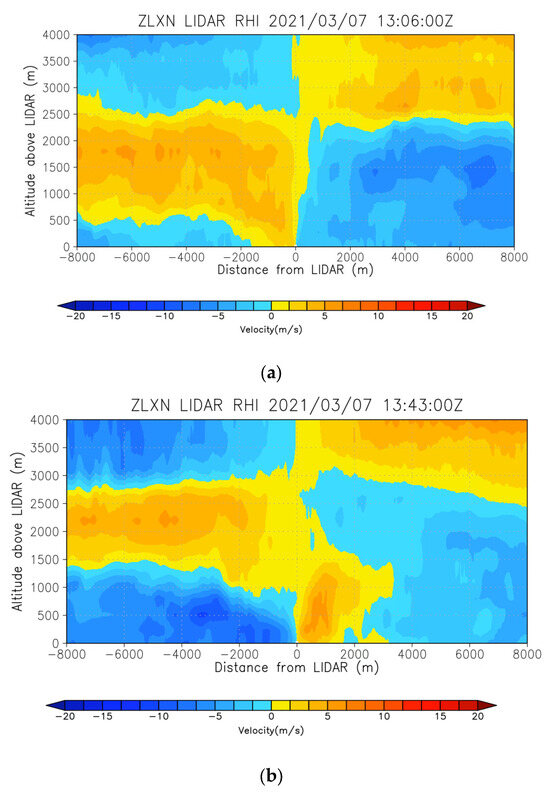

Figure 10.
Simulated vertical cross section of Doppler velocity of LIDAR at (a) 13:06Z, (b) 13:43Z, (c) 14:31Z, and (d) 14:55Z on 7 March 2021. The actual LIDAR RHI scan for Doppler velocity at 12:15Z on the same day (e).
The simulated vertical wind profile is shown in Figure 11. The change of the wind from easterly to westerly and then back to easterly shows up nicely between 13 and 15 UTC (highlighted inside the orange box in Figure 11). The simulation shows the depth of the westerly wind is rather shallow, just about 1000 m or so above ground. Although there are no windshear reports from pilots for this event, these shallow and transient changes of the winds will lead to low-level windshear and pose a safety threat to aircraft, especially affecting the headwind/tailwind condition for arrival flights. Although the actual simulated time for the wind change does not match exactly with the actual change, it is shown that the simulation can still capture rather shallow and transient wind changes for ZLXN.
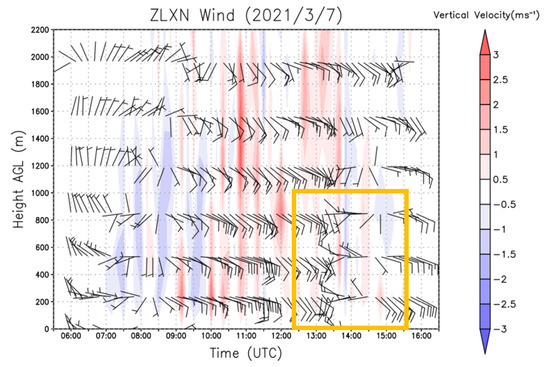
Figure 11.
The simulated vertical wind profiles at ZLXN airport for 06Z to 16Z on 7 March 2021.
5. Conclusions
The present paper is the first attempt to simulate low-level windshear at ZLXN Airport using a high-resolution NWP model. Three cases are considered, and the simulated results are presented. The simulated windshear processes generally align with the actual observations. Quantitative analysis shows that the radial and vertical wind for Cases 1 and 2 are well simulated. Specifically, the simulated LIDAR radial velocity has a correlation coefficient of over 0.9 with the actual LIDAR radial velocity. The simulation model initialized at 06Z successfully captures the strengthening of westerlies at 07Z (1 h later) and the onset of easterlies at around 10Z (4 h later), providing early alerts of windshear risk to airport operators and airlines. This demonstrates that it is technically feasible to forecast windshear events at ZLXN using high-resolution NWP models. However, it is noted that the simulations perform better in capturing the strengthening of winds due to large-scale circulation than representing small local meteorological features. The simulation also has limitations in capturing the precise timing of windshear events, with uncertainties on the order of hours. This is illustrated in Case 3 presented in this paper. Further improvements in the model settings may be investigated in the future. The authors are collecting more windshear cases at Xining Airport, and further simulation studies could be carried out. The goal is to prove that high-resolution NWP models are capable of forecasting terrain-induced low-level windshear not only at Hong Kong but also at airports in other parts of the world.
Author Contributions
X.H.: formal analysis. P.-W.C.: conceptualization, writing (original draft). K.-K.L.: formal analysis. A.-M.S.: methodology. Y.-Y.L.: writing (review and editing), visualization. All authors have read and agreed to the published version of the manuscript.
Funding
This research received no external funding.
Institutional Review Board Statement
Not applicable.
Informed Consent Statement
Not applicable.
Data Availability Statement
The data presented in this study are available on request from the corresponding author.
Conflicts of Interest
The authors declare no conflicts of interest.
References
- Wilson, W.F.; Goodrich, K.R.; Carson, S. Aircraft Measurement of Terrain-Induced Wind Shear on the Approaches to Juneau Airport. National Center for Atmospheric Research. 2005. Available online: https://ams.confex.com/ams/pdfpapers/81587.pdf (accessed on 26 August 2025).
- Robinson, D. Winds of change: Understanding terrain-induced wind shear and turbulence: A case study of St Helena Airport. In Airports International; Key Publishing, Limited: Stamford, UK, 2017. [Google Scholar]
- Boilley, A.; Mahfouf, J.F. Wind shear over the Nice Côte d’Azur airport: Case studies. Nat. Hazards Earth Syst. Sci. 2013, 13, 2223–2238. [Google Scholar] [CrossRef]
- Zamreeg, A.O.; Hasanean, H.M. Windshear analysis over six airports in Saudi Arabia. Discov. Sustain. 2024, 5, 233. [Google Scholar] [CrossRef]
- Augustin, D.; Cesar, M.B. Analysis of wind shear variability and its effects on the flights activities at the Garoua Airport. J. Extrem. Events 2022, 9, 2250006. [Google Scholar] [CrossRef]
- Mahiddine, I.E.H.; Mokhtari, M.; Deiboune, K. Analysis of Wind Shear Intensity at Constantine Airport. 2024. Available online: https://www.umr-cnrm.fr/accord/IMG/pdf/analysis_of_wind_shear_intensity_at_constantine_airport.pdf (accessed on 30 July 2025).
- Liu, X.; Wu, S.; Zhang, H.; Zhang, J.; He, Z.; Zhang, X. Detection of Complex Terrain-Induced Wind Shear by Doppler Lidar at Beijing Capital International Airport. EPJ Web Conf. 2020, 237, 06004. [Google Scholar] [CrossRef]
- Li, H.; Xie, R.; Meng, L. Low-altitude Wind Shear Wind Speed Estimation Method Based on GAMP-STAP in Complex Terrain Environment. J. Electron. Inf. Technol. 2023, 45, 576–584. [Google Scholar] [CrossRef]
- Wang, X.; Lei, Y.; Shi, B.; Wang, Z.; Li, X.; Wang, J. Study on the influence of topography on wind shear numerical simulations based on WRF–CALMET. Geosci. Instrum. Methods Data Syst. 2024, 13, 277–287. [Google Scholar] [CrossRef]
- Chan, P.W.; Lai, K.K.; Li, Q.S. High-resolution (40 m) simulation of a severe case of low-level windshear at the Hong Kong International Airport—Comparison with observations and skills in windshear alerting. Meteorol. Appl. 2021, 28, e2020. [Google Scholar] [CrossRef]
- Schalkwijk, J.; Jonker, H.J.; Siebesma, A.P.; Bosveld, F.C. A year-long large-eddy simulation of the weather over Cabauw: An overview. Mon. Weather Rev. 2015, 143, 828–844. [Google Scholar] [CrossRef][Green Version]
- Uchida, T. Numerical investigation of terrain-induced turbulence in complex terrain by large-eddy simulation (LES) technique. Energies 2018, 11, 2638. [Google Scholar] [CrossRef]
- Smith, C.M.; Skyllingstad, E.D. Investigation of upstream boundary layer influence on mountain wave breaking and lee wave rotors using a large-eddy simulation. J. Atmos. Sci. 2009, 66, 3147–3164. [Google Scholar] [CrossRef]
- Ito, J.; Niino, H.; Yoshino, K. Large Eddy simulation on horizontal convective rolls that caused an aircraft accident during its Landing at Narita Airport. Geophys. Res. Lett. 2020, 47, e2020GL086999. [Google Scholar] [CrossRef]
- Shimoyama, K.; Nakanomyo, H.; Obayashi, S. Airport terrain-induced turbulence simulations integrated with weather prediction data. Trans. Jpn. Soc. Aeronaut. Space Sci. 2013, 56, 286–292. [Google Scholar] [CrossRef]
- Krishnamurthy, R.; Calhoun, R.; Fernando, H. Large-Eddy simulation-based retrieval of dissipation from coherent Doppler Lidar data. Bound. Layer Meteorol. 2010, 136, 45–57. [Google Scholar] [CrossRef]
- Huang, X.; Zheng, J.; Zhang, J.; Ma, X.; Tian, W.; Hua, Z. Study on the structure and characteristic of a low-level wind shear process that happened over Xining Airport. Laser Technol. 2022, 46, 206–212. [Google Scholar]
- Huang, X.; Zheng, J.; Shao, A.; Xu, D.; Tian, W.; Li, J. Study of low-level wind shear at a Qinghai-Tibetan Plateau airport. Atmos. Res. 2024, 311, 107680. [Google Scholar] [CrossRef]
- Yan, Y.Q.; Tian, W.D.; Li, J.H.; Han, B.H. Comprehensive Application of Multi-source Data in the Analysis of a Low-level Wind Shear Process over Plateau Airport. Plateau Meteorol. 2020, 39, 1329–1338. [Google Scholar] [CrossRef]
- Huang, X.; Zheng, J.; Che, Y.; Wang, G.; Ren, T.; Hua, Z.; Tian, W.; Su, Z.; Su, L. Evolution and structure of a dry microburst line observed by multiple remote sensors in a Plateau airport. Remote Sens. 2022, 14, 3841. [Google Scholar] [CrossRef]
- Shun, C.M.; Chan, P.W. Applications of an infrared Doppler lidar in detection of wind shear. J. Atmos. Ocean. Technol. 2008, 25, 637–655. [Google Scholar] [CrossRef]
- Smagorinsky, J. General circulation experiments with the primitive equations. Part I, the basic experiment. Mon. Weather Rev. 1963, 91, 99–164. [Google Scholar] [CrossRef]
- Deardorff, J.W. Stratocumulus-capped mixed layers derived from a three-dimensional model. Bound. Layer Meteorol. 1980, 18, 495–527. [Google Scholar] [CrossRef]
- Chan, P.W. Observation and numerical simulation of vortex/wave shedding for terrain-disrupted airflow at Hong Kong International Airport during typhoon Nesat in 2011. Meteorol. Appl. 2014, 21, 512–520. [Google Scholar] [CrossRef]
Disclaimer/Publisher’s Note: The statements, opinions and data contained in all publications are solely those of the individual author(s) and contributor(s) and not of MDPI and/or the editor(s). MDPI and/or the editor(s) disclaim responsibility for any injury to people or property resulting from any ideas, methods, instructions or products referred to in the content. |
© 2025 by the authors. Licensee MDPI, Basel, Switzerland. This article is an open access article distributed under the terms and conditions of the Creative Commons Attribution (CC BY) license (https://creativecommons.org/licenses/by/4.0/).