1. Introduction
The mechanical response of twisted steel wire pairs has significant implications for various engineering fields, including civil infrastructure, agricultural fencing, cable systems, and structural reinforcement. Understanding their stress and deformation characteristics is critical for selecting the most appropriate material and manufacturing process, predicting service life, ensuring structural integrity, and optimizing performance.
One of the main applications of a twisted steel wire pair is for tying various objects together. In construction, wires are commonly used to tie reinforcing bars in reinforced concrete structures, ensuring their proper positioning and preventing displacement during concrete pouring. The literature addresses various aspects of the tying technology, ergonomics, and process automation [
1,
2], but not the mechanical behavior of the twisted pair. In industry, wire tying is used for packaging, bundling products, securing equipment during transport or storage, and fastening components during assembly. Due to the nature of these joints—temporary, usually low-load and low-criticality—they have also not been addressed in the specialized literature.
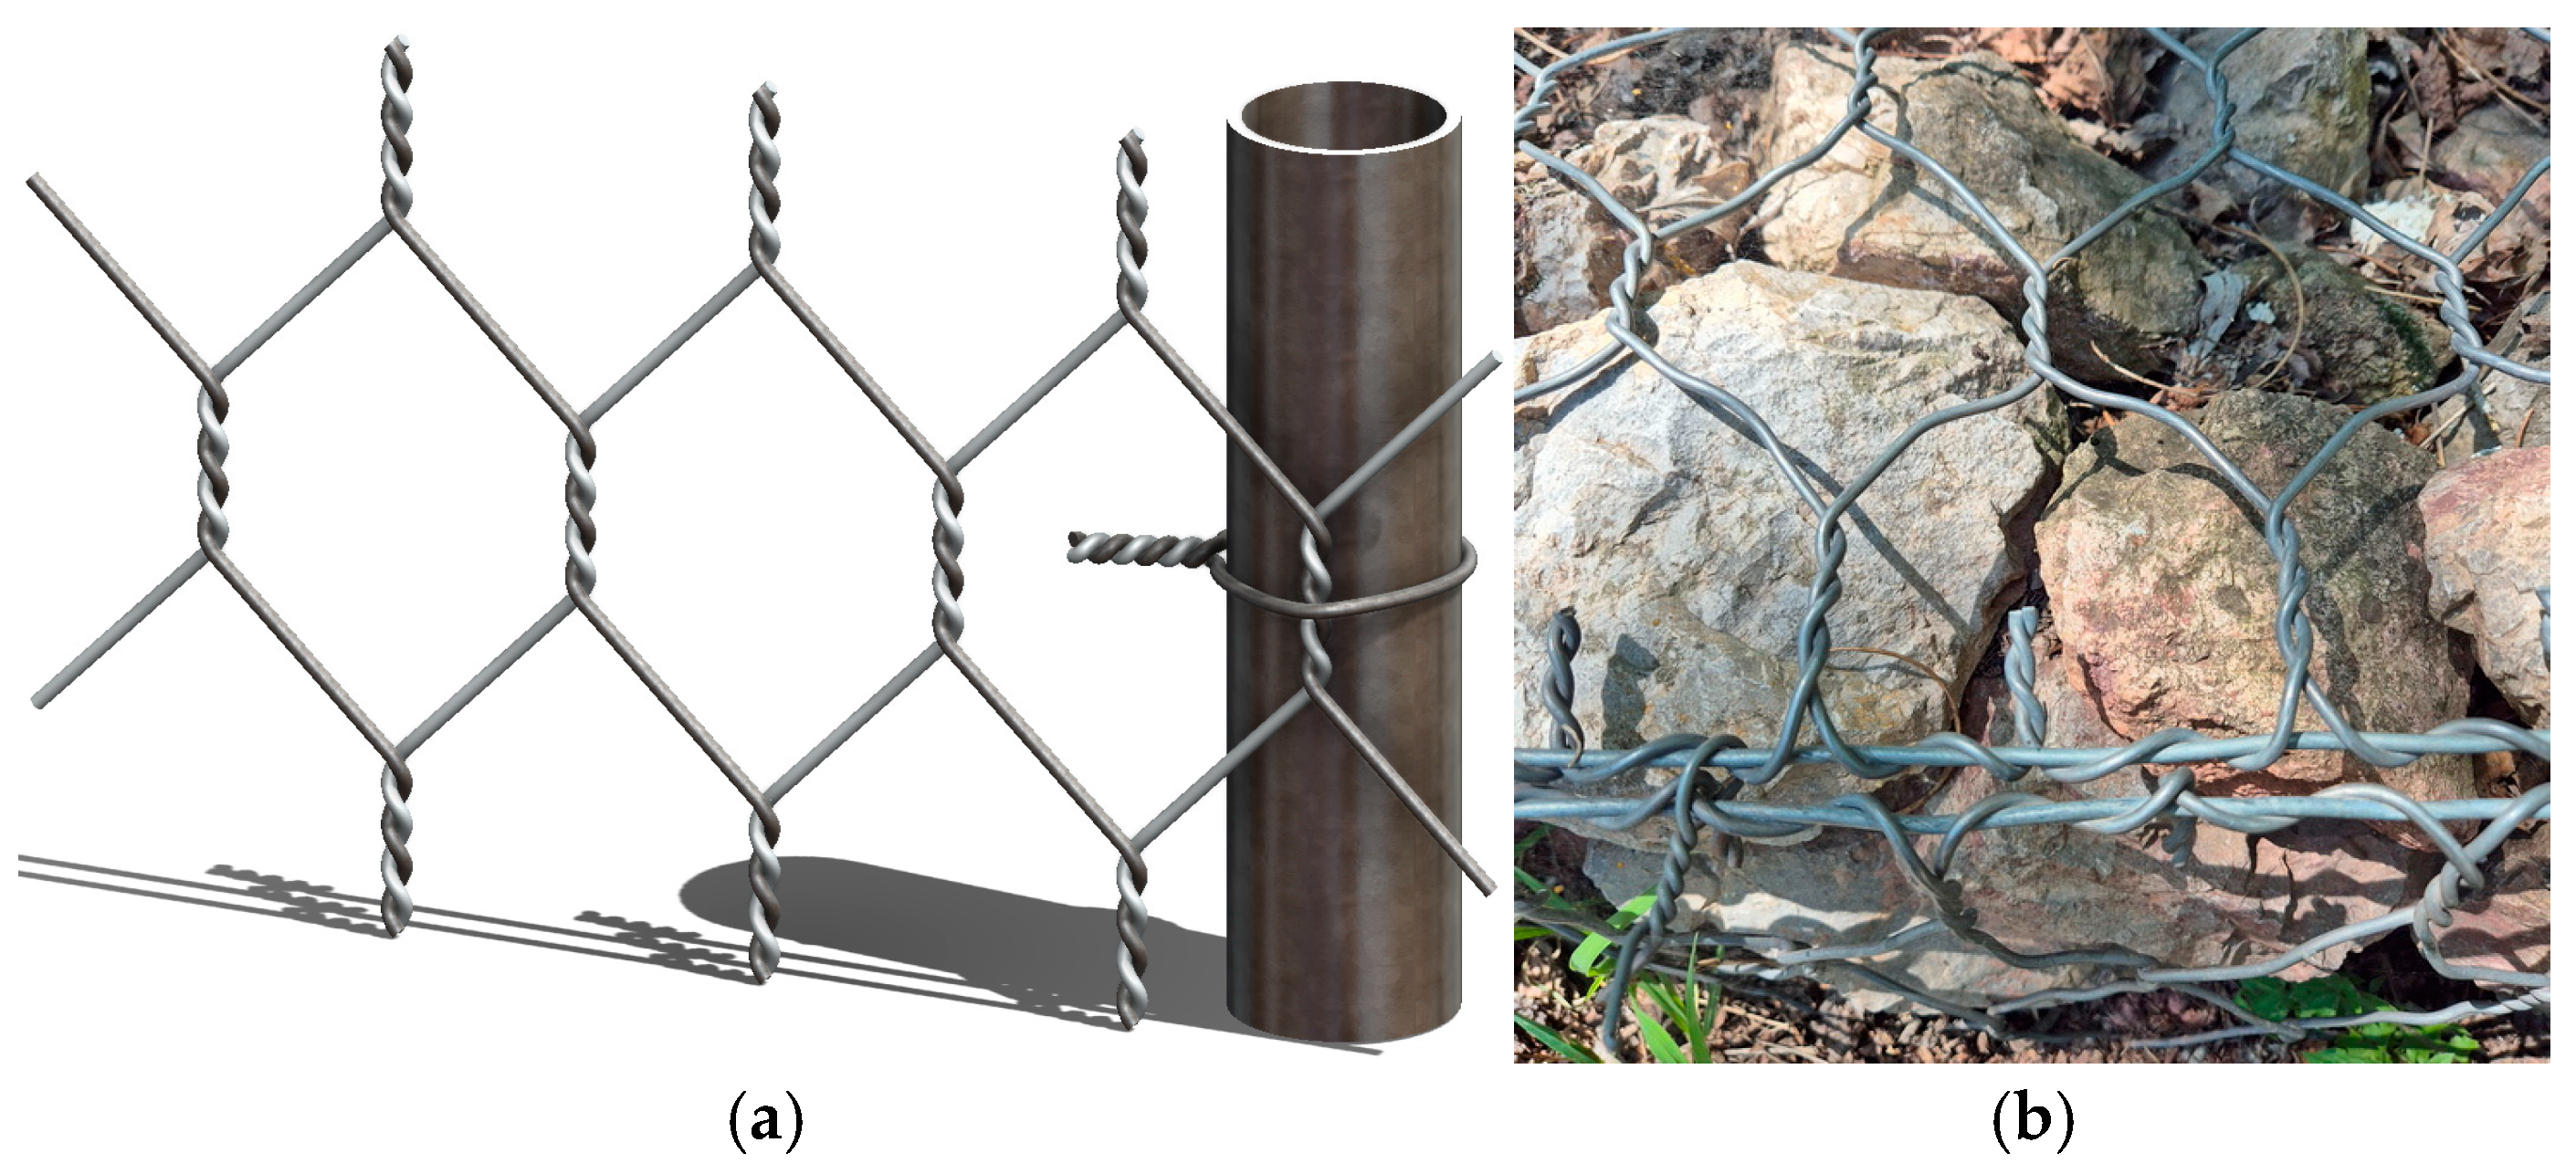
Twisted-pair tying is widely used for attaching a wire mesh to a post, as illustrated in
Figure 1a. The proper execution of this connection is described in a standard ASTM F567-14 [
3], which states that the two ends of the tie wire must be mechanically twisted into a tight spiral, performing at least three full twists, to ensure a secure attachment. However, the standard does not specify the pitch of the twisted pair that achieves this tight spiral, nor does it address the stresses induced in the wire during the twisting process. A literature review reveals that this issue is often overlooked, and there is a lack of studies illustrating the stress distributions at different twist pitches.
Another characteristic application of twisted wire pairs is in hexagonal meshes, which are widely used in agriculture and construction—
Figure 1a,b. These meshes are commonly employed for rockfall protection and in the production of gabions filled with inert materials. The critical importance of this mesh type for safety, as well as its performance under high mechanical loads has led to numerous studies focused on modeling and mechanical testing under various conditions, most notably tensile testing [
4,
5,
6]. The tensile behavior of double-twisted hexagonal gabion wire mesh is also examined in ref. [
7] where a complex, nonlinear tensile response is reported. The findings highlighted the influence of twist density, wire diameter, and mesh geometry on the overall mechanical performance. In many studies, the response of hexagonal wire meshes to rockfall impacts is modeled using finite element methods [
8,
9]. Although these studies provided valuable insights into the mechanical behavior of the mesh, they did not address the stress–strain history of the wires during mesh production.
Some studies have analyzed how twisting alters the mechanical properties of steel wires. Twisting introduces a helical geometry that significantly affects load distribution, internal stress states, and deformation mechanisms compared to straight wires. The large plastic deformations involved in mesh production generate high stress levels, which can lead to premature or undesired failure [
10]. For this reason, the same study investigates various testing methods for evaluating the plastic properties of wires, though without conducting a full stress–strain analysis. Furthermore, in ref. [
11] tensile tests were performed on multiple batches of steel wires from different manufacturers intended for fence mesh production. The authors concluded that standard mechanical tests were insufficient for accurately assessing wire quality due to the complex combination of tension, bending, and torsion that arises during both the manufacturing and in-service conditions of fence meshes.
In agricultural applications, such as vineyard trellis systems, the traditional method of securing wire involves wrapping the wire end around a post and twisting the free end around the main wire. This process subjects the material at the connection point to significant plastic deformation and a complex combination of tension, bending, and torsion. Such conditions can lead to stress concentrations and potential failure, underscoring the need for detailed mechanical characterization of these connections. Reference [
12] showed that steel wires used in vineyard trellis systems are subjected to tensile forces proportional to the anticipated crop yield. However, the effects of large deformations and residual stresses in the twisted wire on the strength and reliability of the tension-bearing connection have not been sufficiently investigated.
Twisted wires are also used in the production of steel wire ropes, which are critical structural components. A large number of studies have been devoted to modeling and analyzing the stress distribution in steel ropes under loading. For example, references [
13,
14] investigate the elasto-plastic behavior of various steel rope constructions subjected to tension and torsion, using analytical and numerical models that are experimentally validated. References [
15,
16] focus on stress distribution in the presence of broken strands. The importance of contact interactions between strands is emphasized in ref. [
17], showing that friction must be accounted for to achieve a more realistic mechanical response, while ref. [
13] investigates the contact stresses. Reference [
18] explores stress states in the rope under both tension and bending, using finite element modeling, with additional strain gauge measurements used for experimental validation. Overall, the manufacturing process of wire ropes induces much smaller initial stresses and strains in the wires compared to the previously discussed cases. Consequently, these studies do not address the stress arising during rope fabrication.
One of the few publications that considers the mechanical phenomena during wire mutual twisting is [
19], which investigates the residual twisting moment in a steel cord during the twisting of three wires. The study analyzes von Mises equivalent stresses developed during twisting, as well as residual stresses after unloading. Their final results show significant internal stresses after manufacturing.
The aim of the present study is to investigate the stresses and deformations that arise when two pieces of wire are twisted around each other. The literature review indicates that this topic has been insufficiently explored. The investigation will be carried out through a numerical simulation using finite element method (FEM). Since the stresses and deformations depend on the geometry of the twisted pair, the main variable will be the twist pitch, expressed in millimeters per turn. Reducing the pitch results in a tighter connection, but at the cost of increased stresses and deformations. Beyond a certain threshold, this may become critical and lead to failure. Residual stresses will also be analyzed, as they play an important role in the long-term performance and may lead to undesirable effects such as accelerated corrosion. In addition, the torsional moment required to achieve a given pitch will be determined both numerically and experimentally. This parameter is important whether the twisting is performed manually or with a mechanical tool and will be used for the verification of the numerical model.
2. Geometrical Study
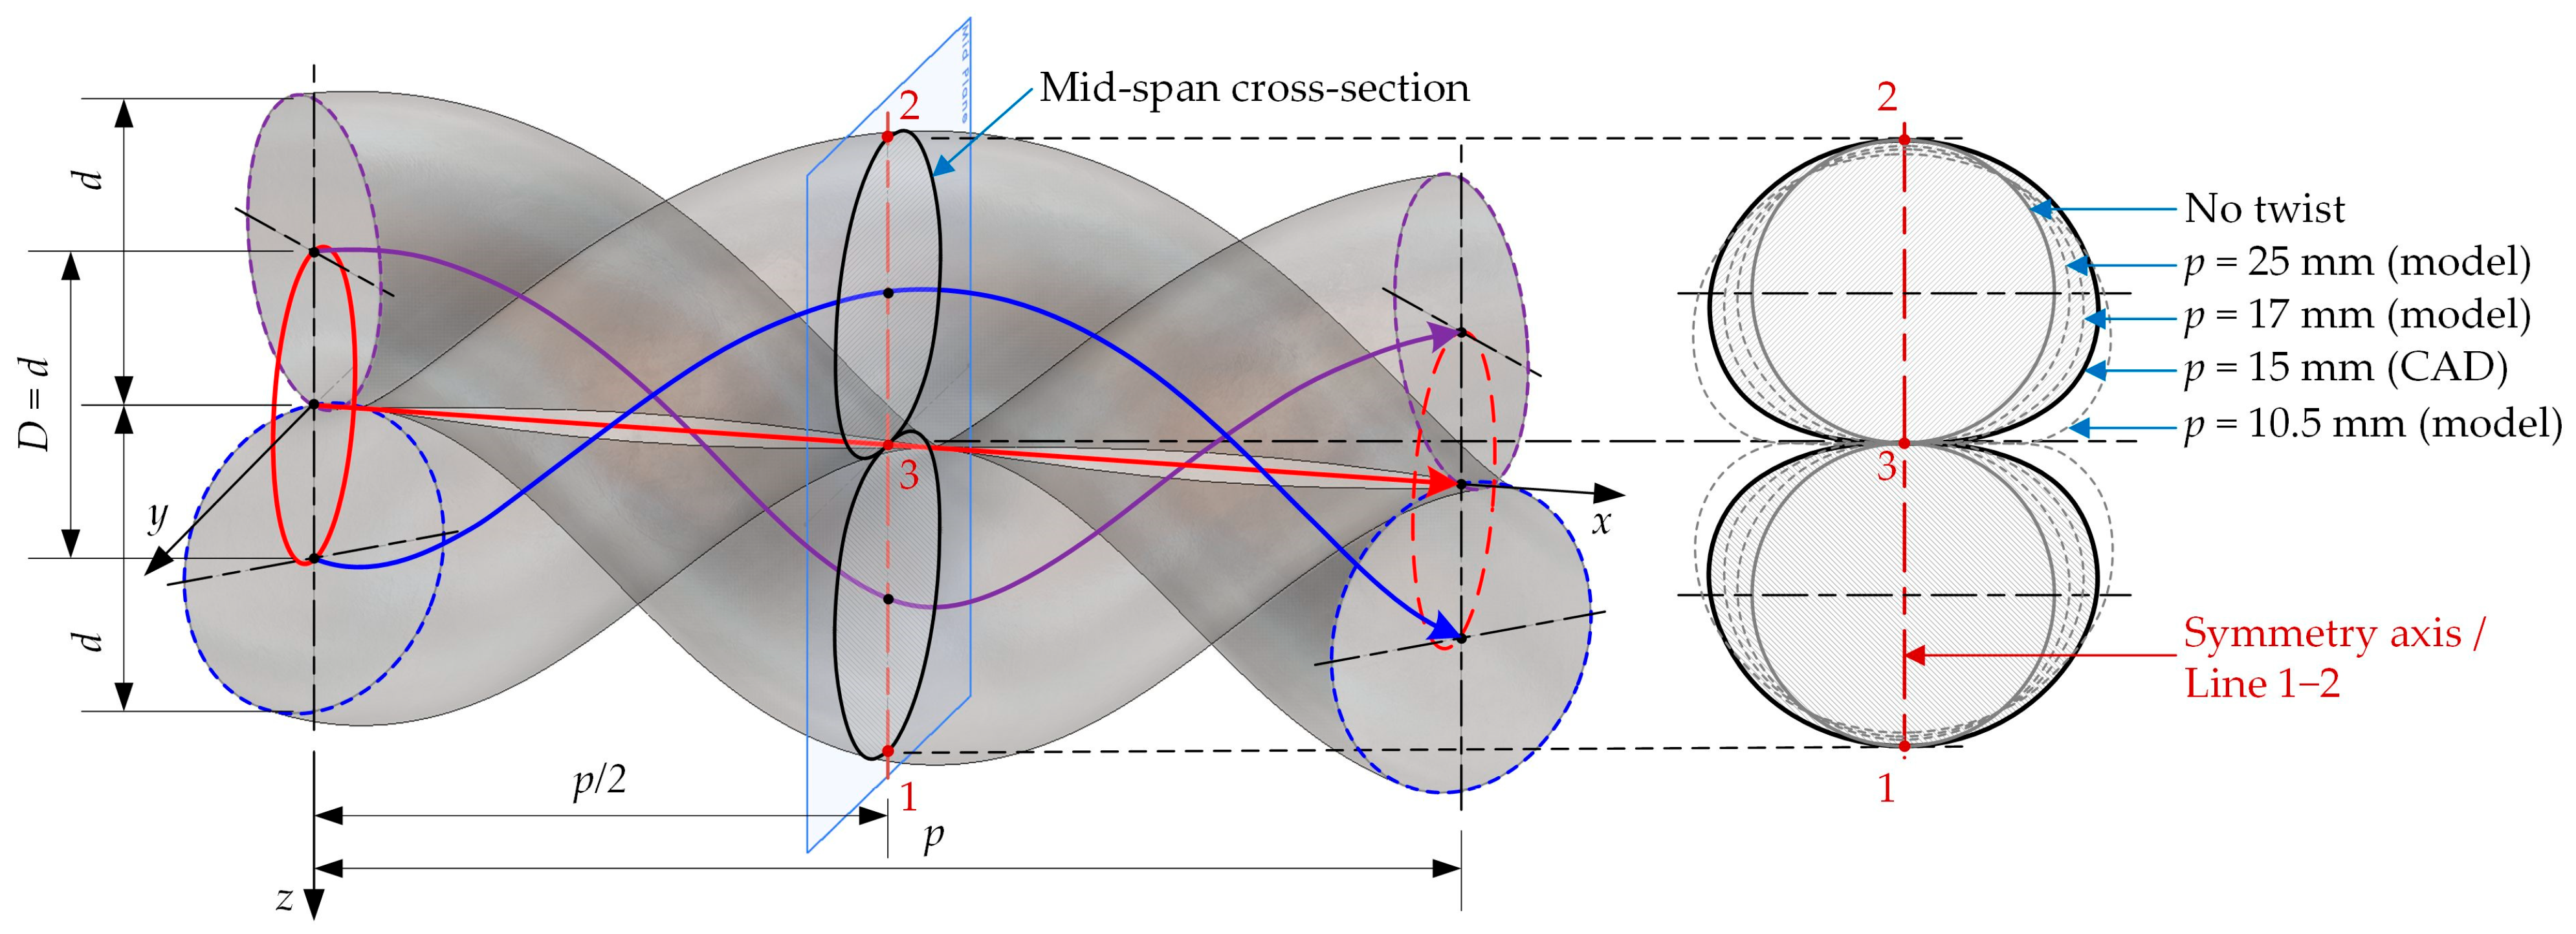
When two deformable cylinders are twisted together, as shown in
Figure 2, the wire centerlines follow helical curves. If the cylinder axis along which the helix is defined coincides with the
-axis, then the helical curve can be described by the following equations [
20]:
where
is the diameter of the cylinder around which the helical curve is formed. In the present study, the two wires have equal diameter and are twisted around each other, rather than around a third body. Therefore, ;
In the case of two helical curves, as shown in
Figure 2, their phases differ by
.
To create a geometric model suitable for structural analysis at different pitch values, it is necessary to properly determine the initial wire length
. Since the length of one helix turn is the hypotenuse of a right triangle with legs corresponding to the circumference of the base circle
and the pitch
, we obtain
To obtain a reliable distribution of stresses and deformations in the numerical simulation—unaffected by boundary conditions and applied loads—a sufficiently large value of
is required. On the other hand, an excessively large
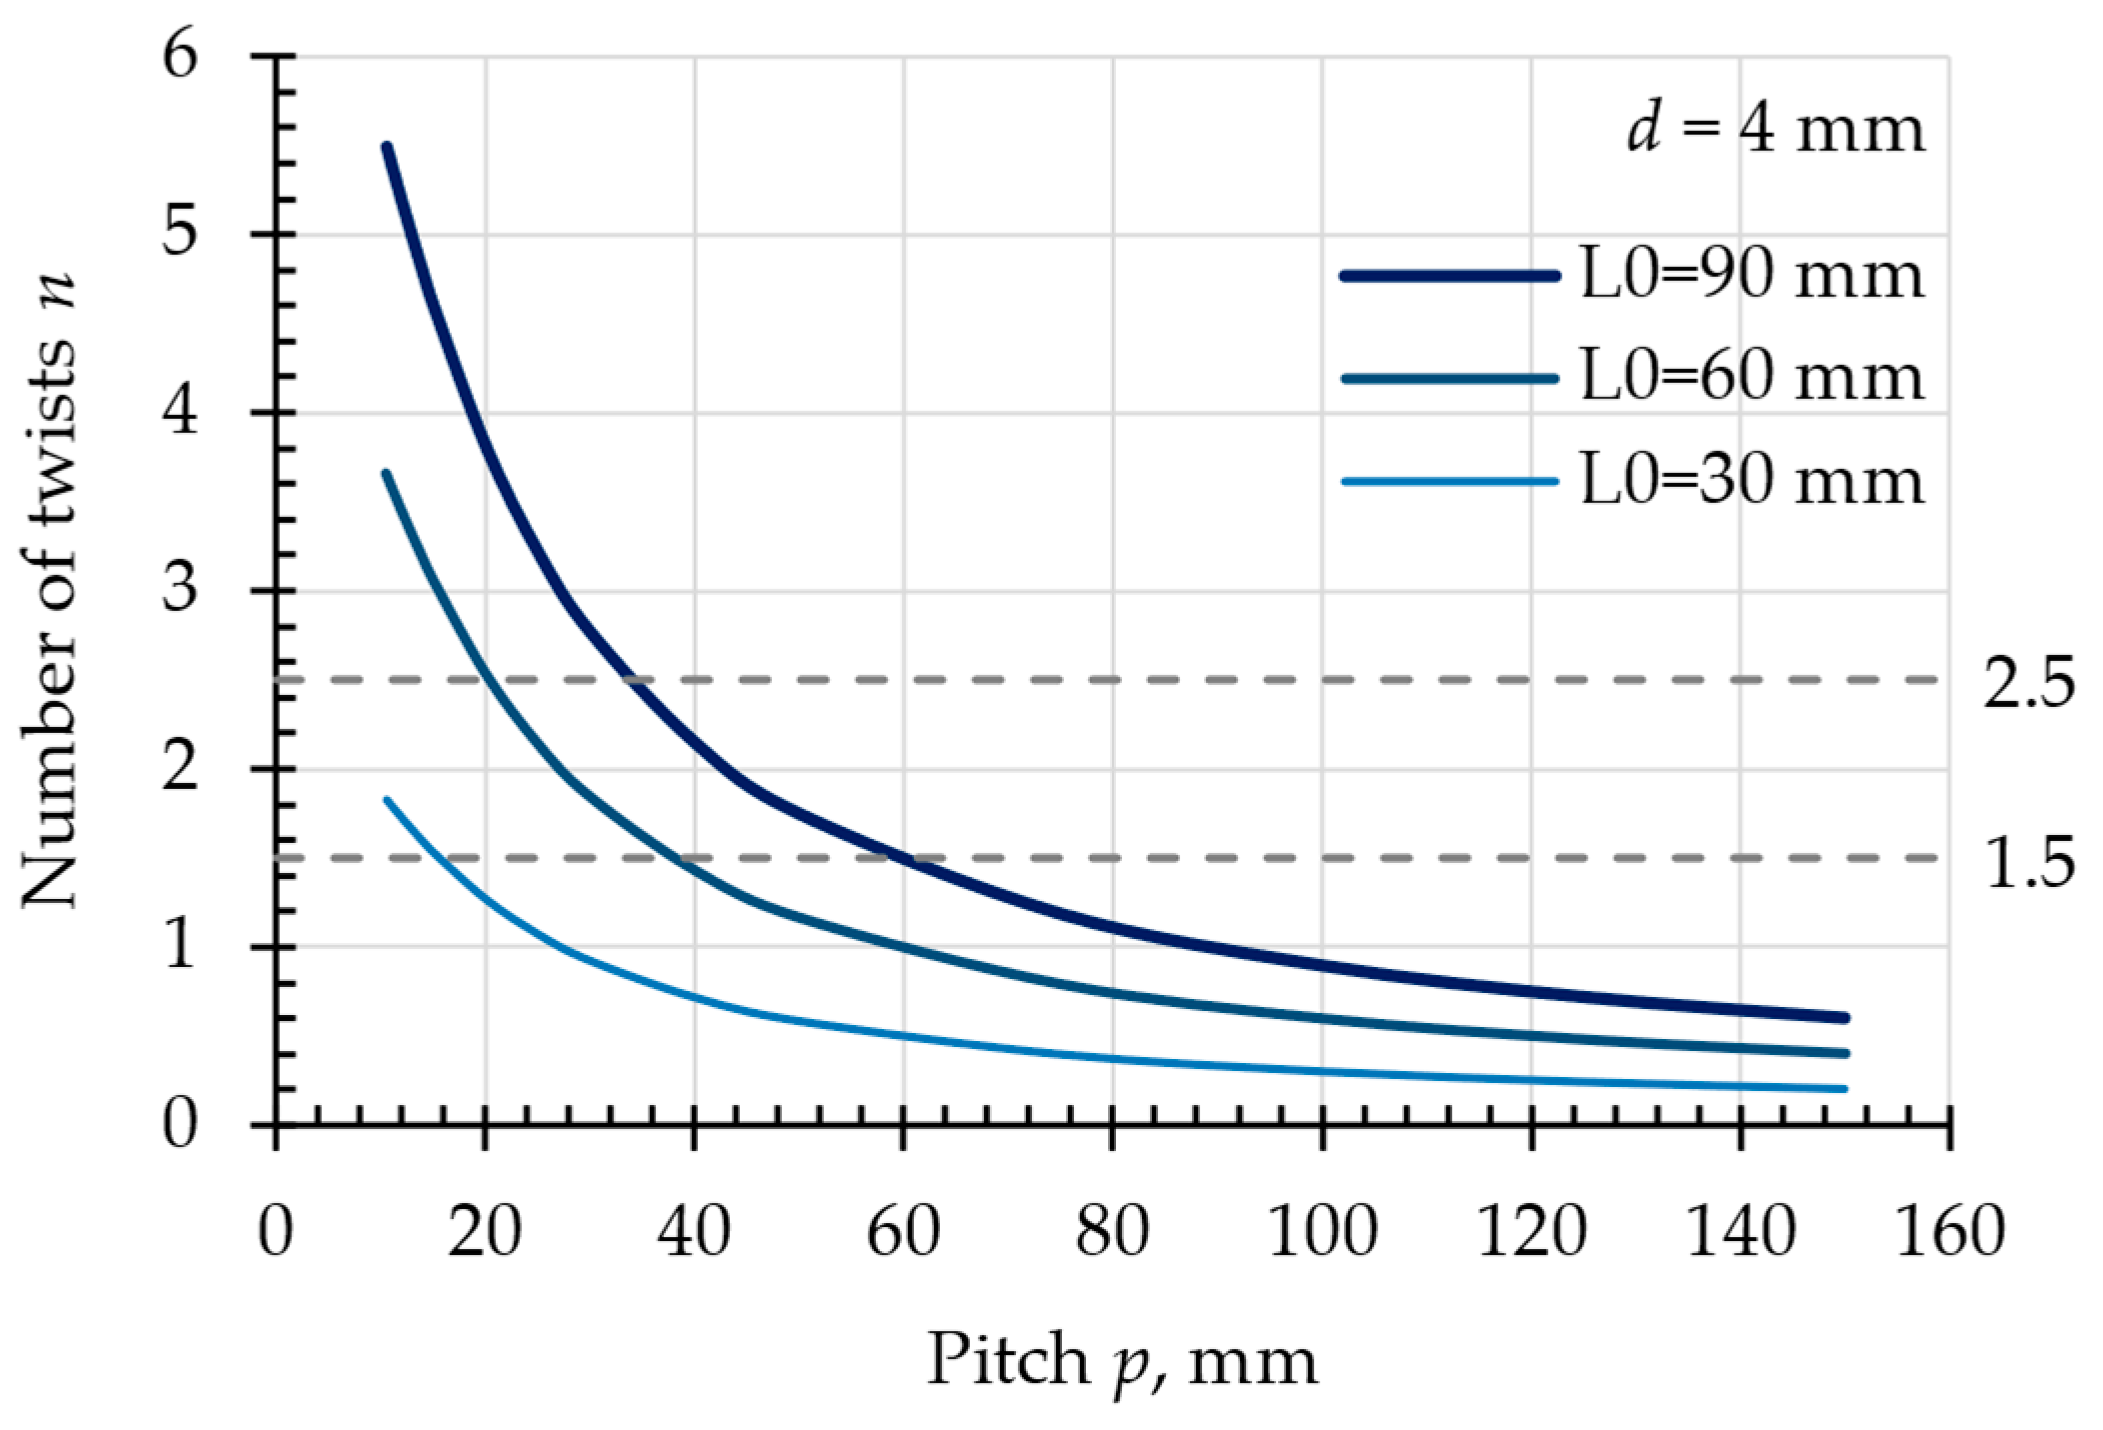
leads to a high number of finite elements, an increased number of turns, longer computation times, and convergence issues. Using the numerical model, it was established that for pitches below 50 mm, the required number of turns
to accurately modeling the stresses in the mid-span cross-section (as shown in
Figure 2) ranges between 1.5 and 2.5. The relationship
for three different values of
is presented in
Figure 3. It is shown that, as the pitch decreases, the required initial length also decreases.
Various values of (ranging from 30 mm to 120 mm) were tested in the simulations, but a final value of was adopted, as a testing machine with this grip-to-grip distance was available for model verification. This relatively large value of allows the investigation of stresses and deformations for pitches as large as 150 mm.
Subsequently, the stresses and deformations in the twisted wires are examined as the pitch
varies in the range from 10.5 mm to 150 mm. The lower values in this range allow the formation of a tight spiral [
3], as required in tying applications or certain types of wire meshes. Larger values of
are also encountered in practice—for example, in some types of barbed wire and fencing meshes.
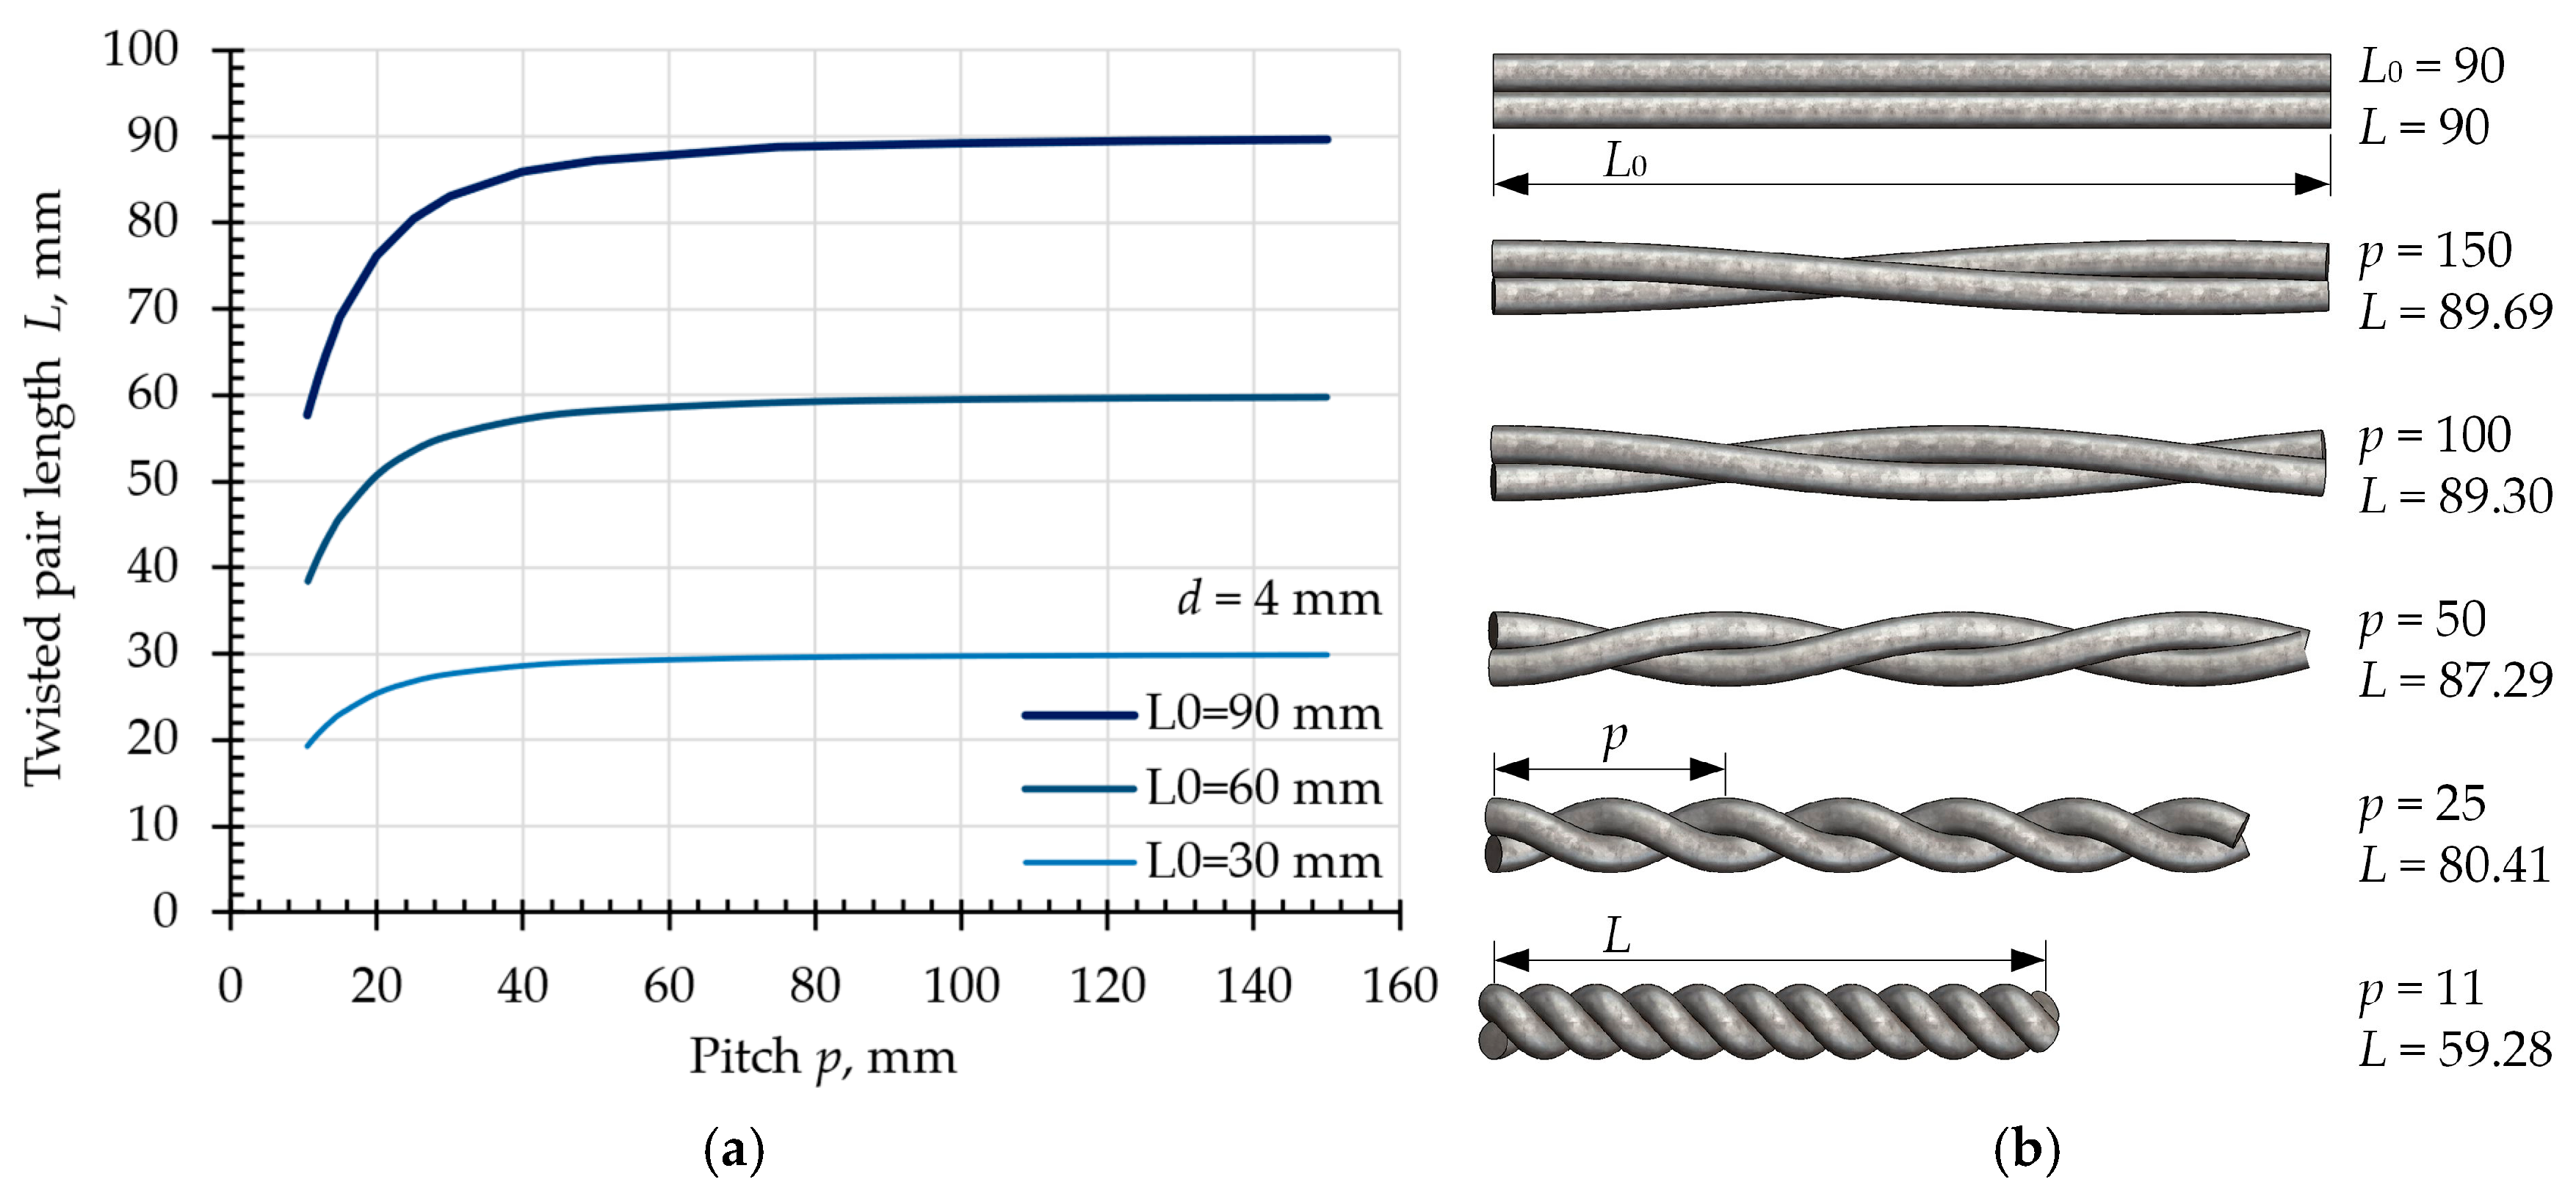
To define appropriate boundary conditions for the model, it is important to determine the final length
of the twisted pair along the
-direction after twisting (
Figure 4). Since
is the leg of a right triangle with hypotenuse
and the other leg
, we obtain
For an initial wire length of
= 90 mm, Equation (3) shows that twisting down to the minimum investigated pitch of 10.5 mm results in a shortening of 32.3 mm, which is a significant value and must be taken into account when defining the supports. The influence of pitch
on the final length
, as well as the overall shape of the twisted pair at different pitch values, is illustrated in
Figure 4.
During mutual twisting, the twisted pair cross-section deforms. As the pitch decreases, the angle between the longitudinal axis of each wire and the
-axis increases. Consequently, the intersection of each wire with a plane perpendicular to the
-axis changes from a circle to an ellipse-like shape, and its area increases as illustrated in
Figure 2. The pitch values of 10.5, 15, 17, and 25 mm belong to the set of 14 values used later in the structural analysis and clearly illustrate the change in cross-sectional shape.
Each cross-section has a symmetry axis, shown in dark red in
Figure 2. The inclination of this axis relative to the
- and
-axes depends on the pitch
and the cross-section coordinate
. Only the mid-span cross-section has a symmetry axis whose spatial orientation is unaffected by twisting. Points along the symmetry axis of this central section are labeled as Line 1–2. The transverse deformations shorten Line 1–2, as Points 1 and 2 move toward Point 3, which is the centroid of the mid-span cross-section and the center of the entire model. Point 3 is the only point that remains stationary during twisting.
3. Material Properties
In the present study, soft galvanized (GI) steel wire with diameter of 4 mm was used. The mechanical properties were determined by means of tensile and torsion tests [
21,
22]. A description of the equipment and methods used is provided in refs. [
23,
24]. In both tests the specimens were unmachined pieces with total length of 130 mm. For the torsion test, the specimen ends were bent at 90°, as shown in ref. [
24], and the test length was 90 mm.
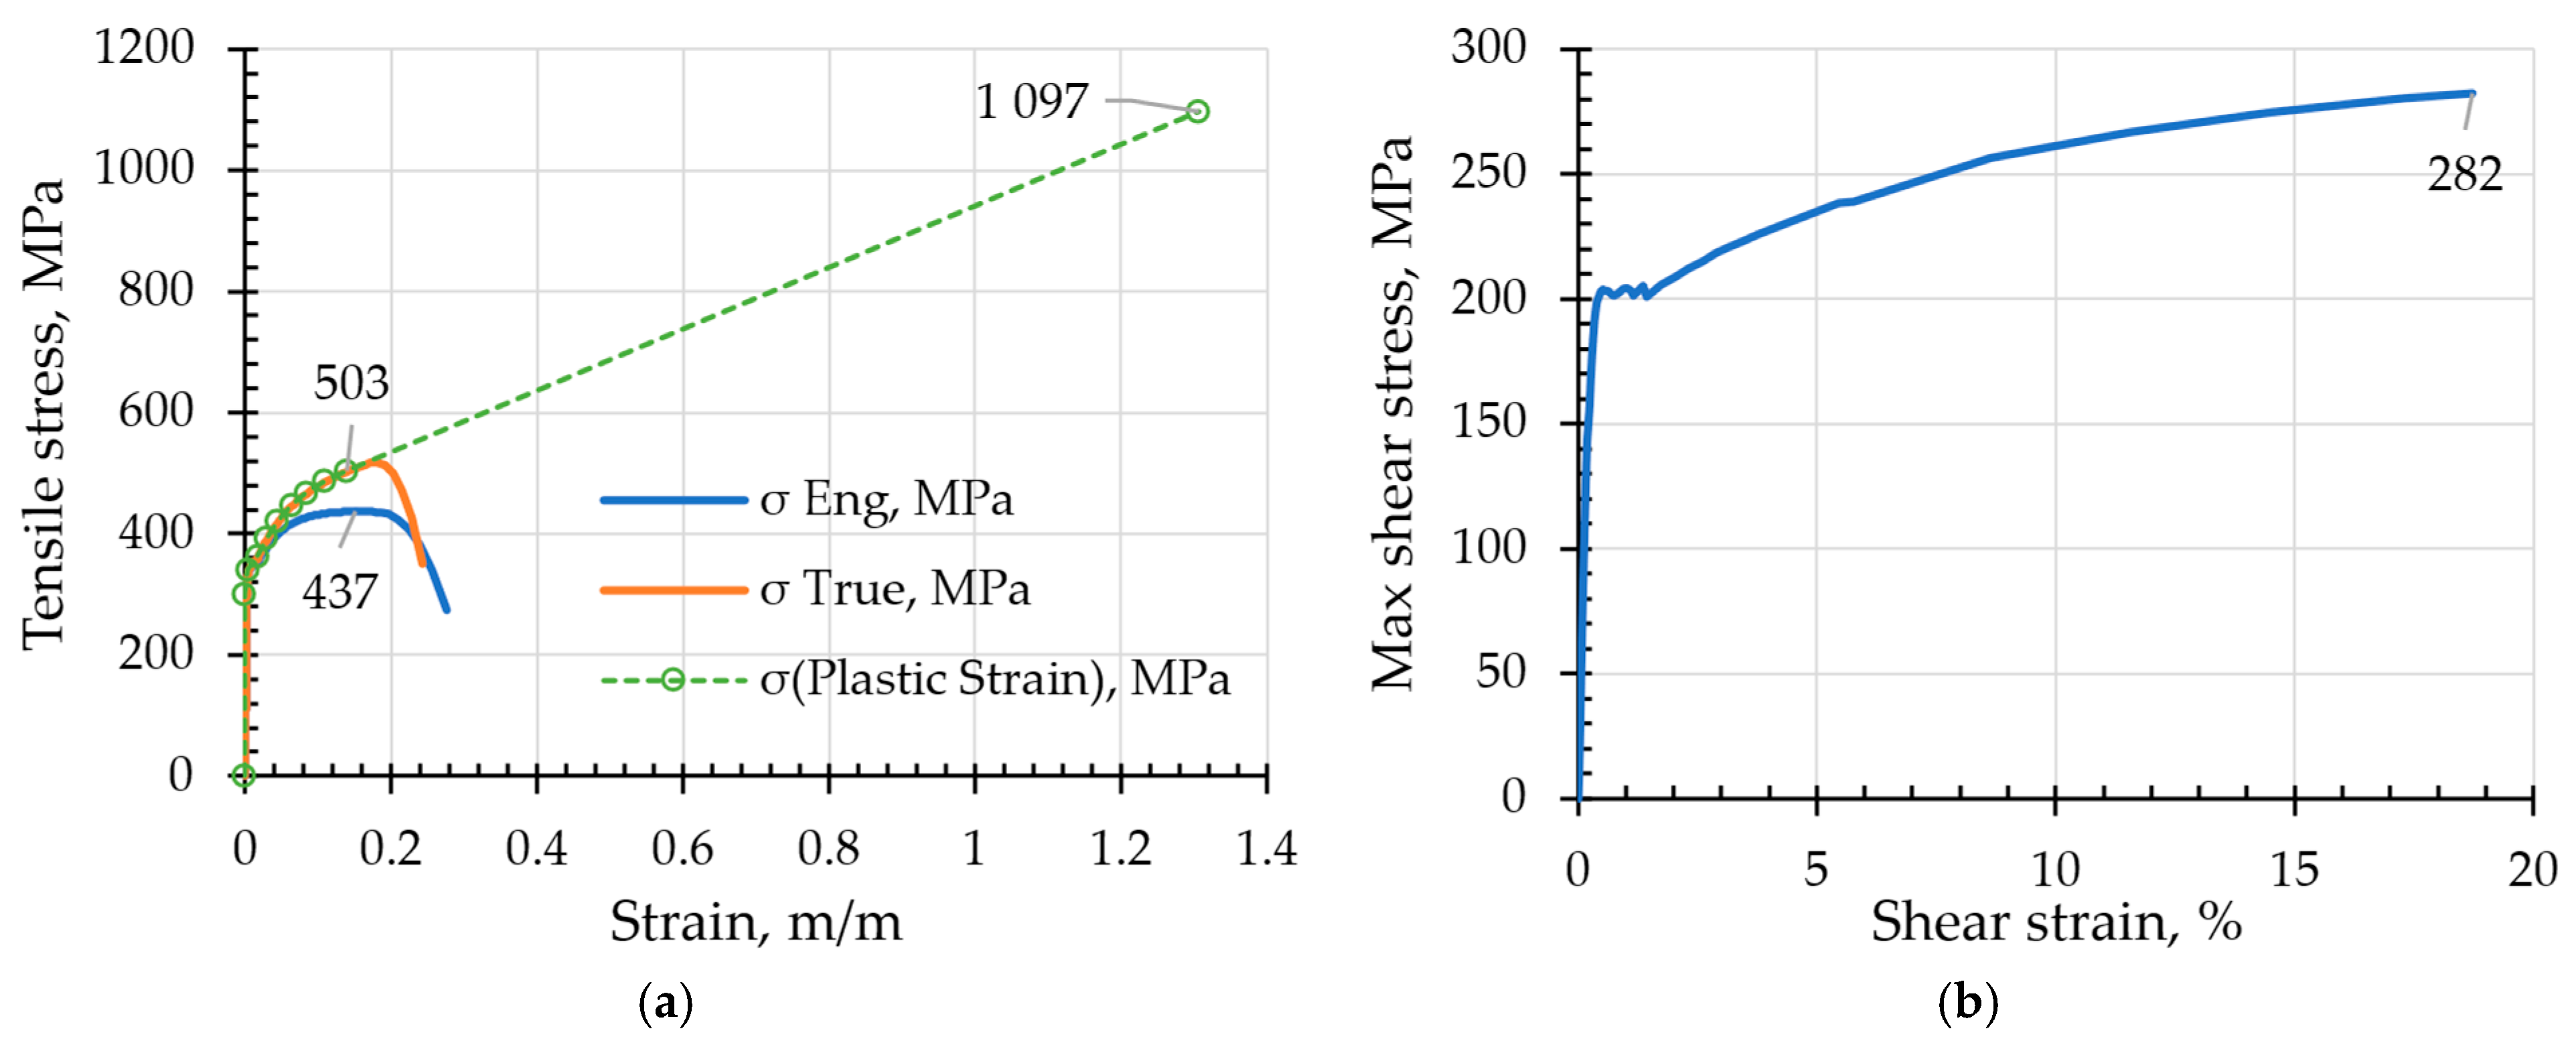
The resulting stress–strain curves are shown in
Figure 5 (in blue). The maximum shear stress was calculated using the plastic torsion formula [
25].
The following material constants were determined from the stress–strain curves:
Elasticity modulus: 200,798 MPa;
Shear modulus: 78,237 MPa;
Poisson’s ratio: 0.28;
Elasticity limit: 300 MPa;
Yield strength: 350 MPa;
Engineering tensile strength: 437 MPa;
Torsional strength: 282 MPa.
For the numerical simulations, the Multilinear Isotropic Hardening plasticity model was used, where it is crucial to accurately define the plastic portion of the material’s stress–strain curve, obtained from a uniaxial tensile test. The presence of large plastic deformations and maximum stresses significantly exceeding the yield strength requires the use of the true stress–strain curve , where is the true normal stress and is the true longitudinal strain, rather than the experimentally obtained engineering stress–strain curve where is the true engineering normal stress and is the engineering longitudinal strain measured with a longitudinal extensometer (assuming fracture occurs within the gauge length).
The following formulas were used to transform the engineering curve into the true curve in the pre-necking region [
26]:
The curve
obtained using Equation (4) is shown in orange in
Figure 5a. Equation (4) are valid only under the assumption of uniform deformation and a homogeneous, isotropic material. However, after necking occurs, the deformation in the specimen becomes non-uniform and is concentrated in the neck region. Determining the true stress and strain in the neck is complex and typically requires additional measurements during the tensile test [
27,
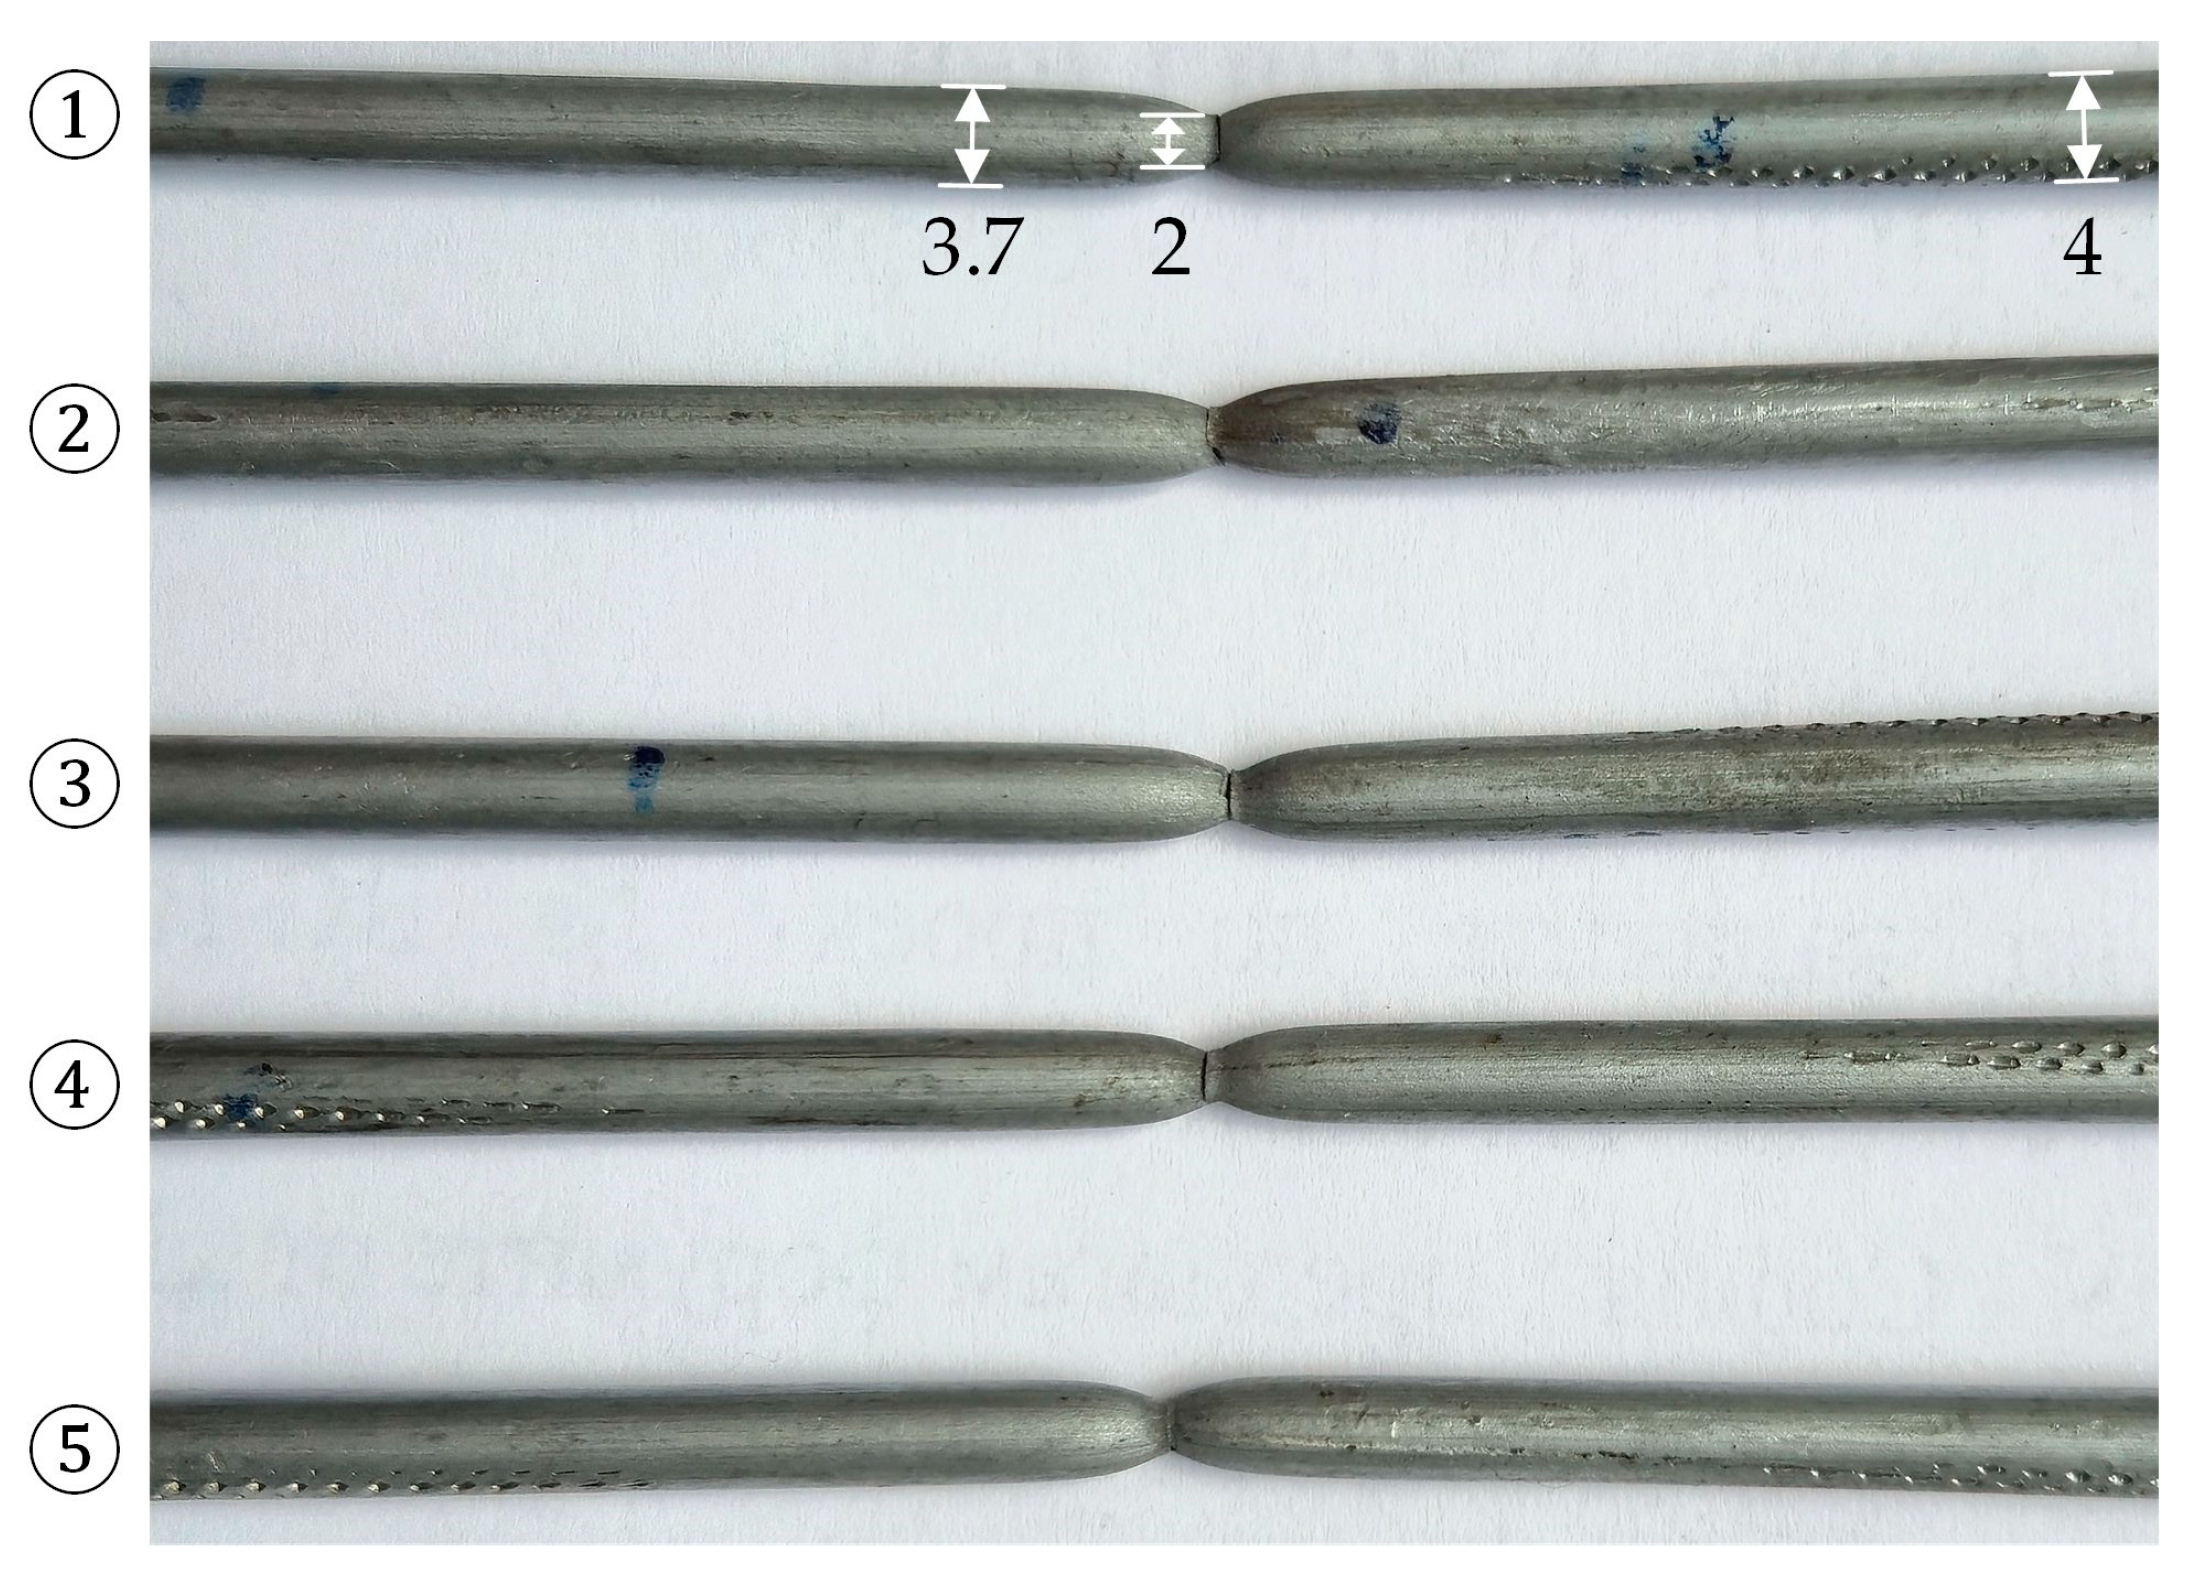
28], with Digital Image Correlation (DIC) being the preferred method for such measurements today. In the present study, such measurements were not performed. Nevertheless, from the tested specimens (
Figure 6), the minimum neck diameter can be measured, allowing for the calculation of the minimum cross-sectional area at fracture,
. This value makes it possible—within an acceptable approximation—to determine the true strain at fracture
and the true tensile strength
[
26], which define the final point of the material’s true stress–strain curve:
where
is the initial cross-sectional area of the tested wire, and
is the fracture force obtained from the tensile test. For
(corresponding to an initial diameter of 4 mm),
(corresponding to the minimum diameter in the necked region of 2 mm, obtained through multiple measurements and shown in
Figure 6), and
(from the tensile test), Equation (5) correspond to
at
. It should be noted that the true stress–strain curve beyond necking is not linear as shown in
Figure 5a, and that the presence of a neck introduces a certain error in
calculated using Equation (5). When high precision is required, more advanced methods should be employed to determine this curve.
To define the
Multilinear Isotropic Hardening model, the plastic portion of the curve
up to the onset of necking was used, along with the point of fracture. A total of 10 points were defined, shown in green in
Figure 5a. The first point is 300 MPa at plastic strain 0, and the final point is 1097 MPa at plastic strain 1.307.
4. Finite Element Model
4.1. Geometric Model
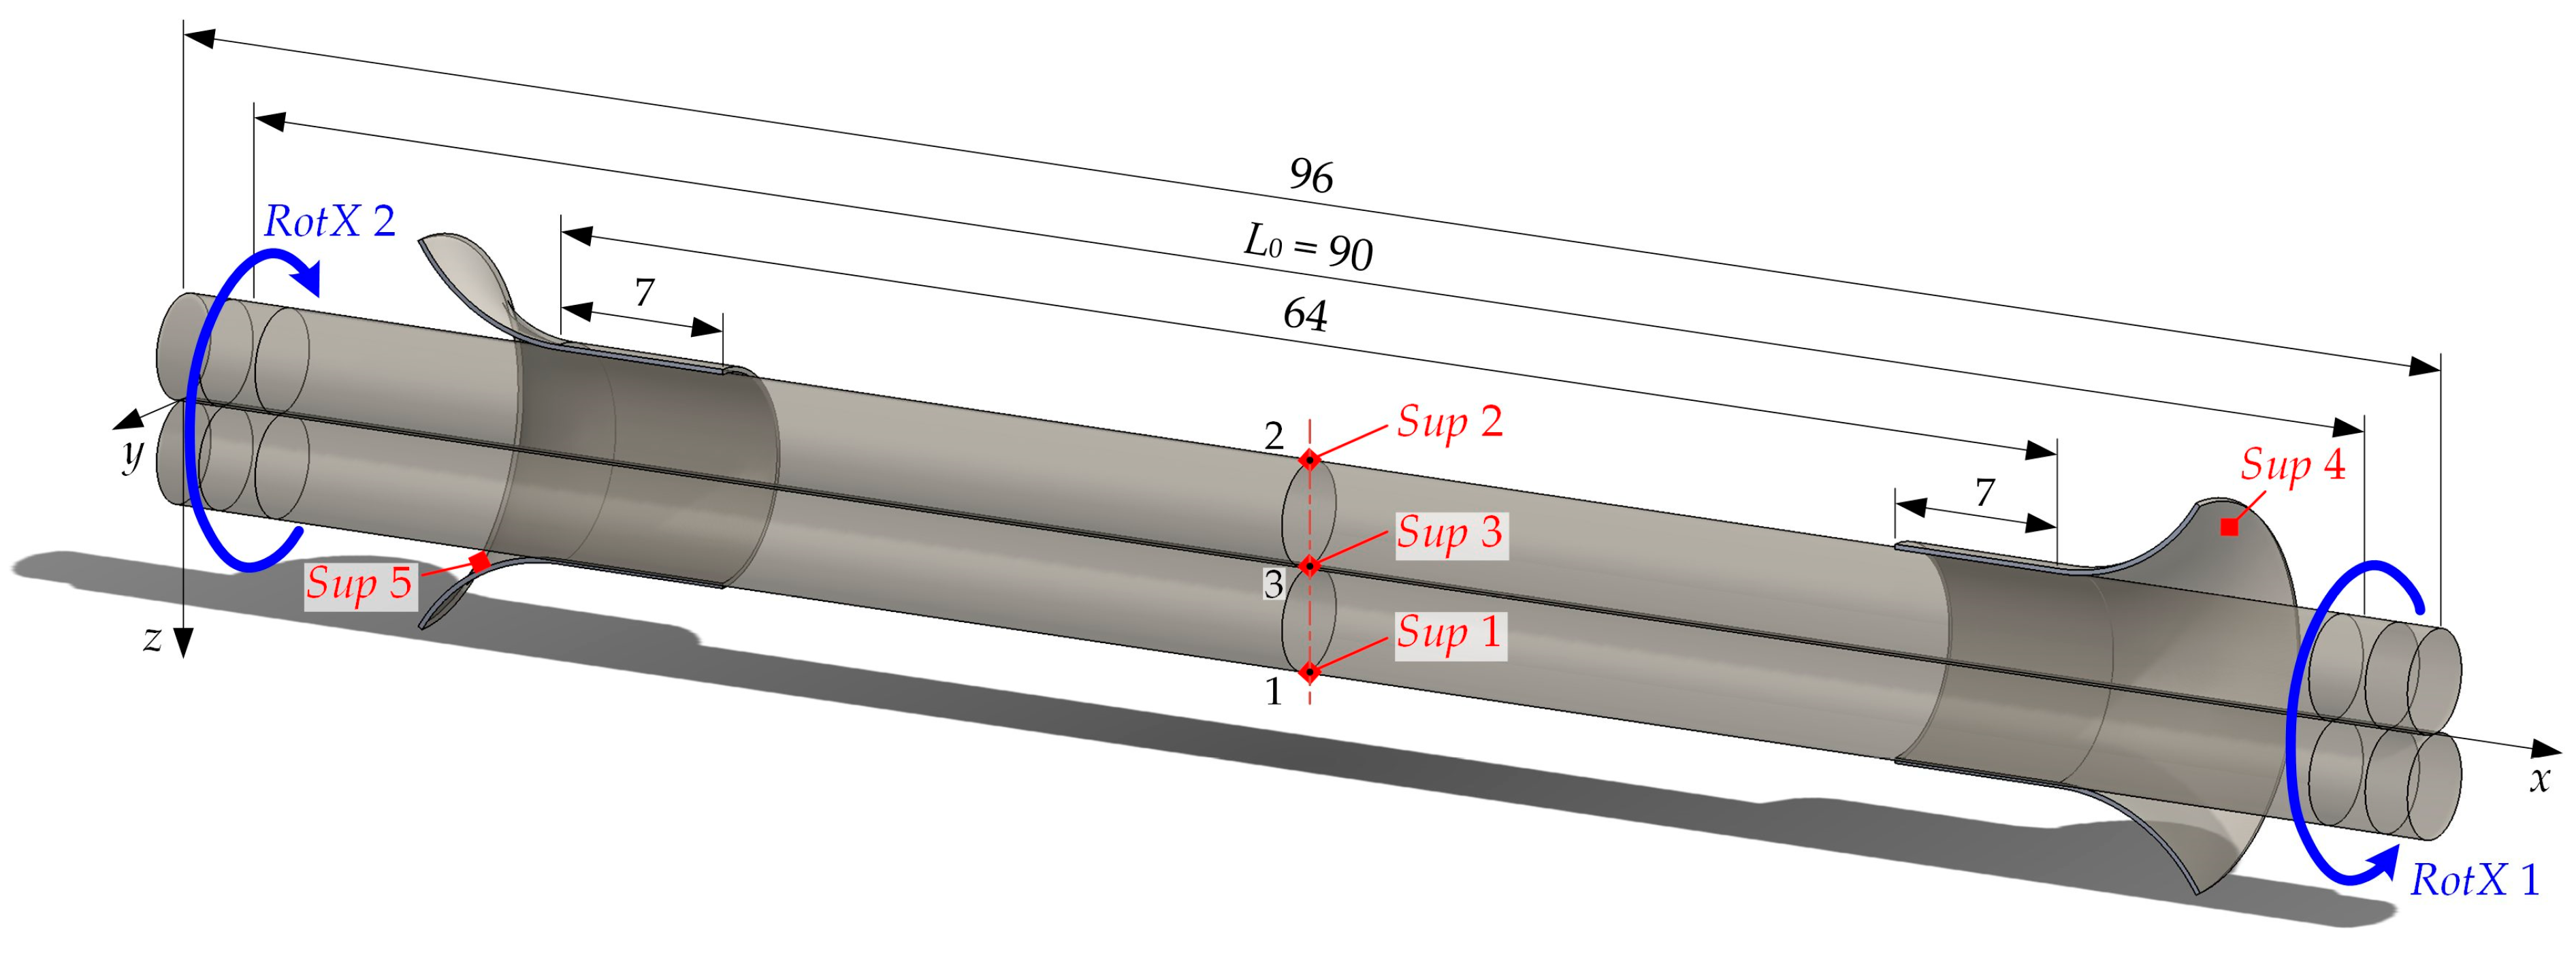
The geometric model used is shown in
Figure 7. It allows for free twisting of the wires, closely replicating real-world conditions. The longitudinal dimensions were selected to provide the desired initial length of 90 mm. An additional 3 mm was added at each end to enable smooth application of the torque and to keep the stresses near the ends relatively low. Thus, the total length of the wires is 96 mm.
To ensure good convergence, and to avoid plastic deformation unrelated to the formation of the twisted pair, it is necessary—wherever possible—to avoid edge-to-edge and edge-to-surface contacts. It is also advisable to prevent contact between the loaded areas and the supports. Based on Equation (3),
Figure 4a and a process of trial and error, the support surface geometry shown in
Figure 7 was developed, featuring outwardly curved ends. At the beginning of twisting, the wires initially contact only with the cylindrical portion of the supports, which is 7 mm long. As the twisting progresses, transverse deformations increase, leading to the formation of a gap in these cylindrical regions. The contact progressively shifts to the curved section of the support surfaces, where the wire ends engage at an appropriate angle.
4.2. Loading
Two equal in magnitude but opposite in direction rotations about the
-axis were imposed, denoted in
Figure 7 as
and
. A maximum value of 1080° was prescribed for each
, corresponding to 5.75 turns. Using Equation (3), this results in a pitch of 9.34 mm. However, Equation (3) does not account for the deformation of the cross-section and underestimates the pitch. In the numerical model, the applied
= 1080° yielded the minimum twist pitch of 10.5 mm.
The rotations are not active throughout the entire simulation. Once the desired twist pitch is achieved, they are deactivated, leaving the plastic deformations and residual stresses only.
4.3. Supports
Although
and
cancel each other out, a static structural finite element analysis still requires the model’s movement to be restrained, which is achieved by adding supports. Since the wire ends are free and their cylindrical surfaces deform continuously during twisting, the options for constraining the wires in space are limited. The only point that remains stationary during the deformation process is the center of the model—Point 3. Therefore, a
Fixed Support is applied at this point, denoted as
in
Figure 7. This support constrains translations along the
,
, and
axes. Rotations around
is constrained by the supports
and
, which are fixed in space. At the beginning of twisting, contact between the wires and the cylindrical parts of the supports occurs along a straight line parallel to the
-axis, which does not sufficiently restrict movement (allowing minor displacements in the
-direction and rotations about the
-axis). This creates convergence issues and necessitates additional constraints.
During the mutual twisting of the wires, Line 1–2 retains its position in space but shortens as a result of transverse deformations. To account for this behavior, Displacement-type supports and were applied at Points 1 and 2. These supports restrict translation in the and directions but allow free movement along , thereby enabling the shortening of Line 1–2.
As transverse deformations increase (as shown in
Figure 2), the gap between the twisted pair and the support surfaces becomes significant, allowing small rotations about the
and
axes. To avoid constraining this motion,
and
are deactivated once
and
reach 270°. At that point, contact between the wires and the supports
and
occurs along helical lines, providing sufficient constraint without compromising the convergence of the numerical solution.
4.4. Contacts
The contact between the two wires is defined as Frictional. Determining the friction coefficient is a nontrivial task and is best addressed through experiment. Since friction has only a minor influence on the stresses and deformations, a value from the literature was adopted. Nevertheless, μ remains important for the present study, as it affects the torsional moment, which was evaluated both experimentally and numerically.
When determining the friction coefficient, the type and condition of the contacting surfaces are important factors. In the present study, the galvanized (GI) steel surfaces were clean, free from visible contaminants, and have a smooth, shiny appearance. The wires were not specially cleaned after delivery, and residual traces of grease remain on the surfaces.
According to engineering reference manuals, the static coefficient of friction for Zn–Zn surfaces ranges from 0.04 to 0.6 [
29], with the lower values corresponding to the presence of lubrication. The sliding coefficient of friction is lower than these values. Specific values of
under well-defined conditions can be found in scientific studies—particularly in research related to the forming of galvanized steel. The values reported in ref. [
30] range approximately from 0.06 to 0.2, depending on the steel properties, sliding speed, and contact pressure. The friction coefficient was determined using a cup test in ref. [
31], resulting in values between 0.053 and 0.119, with the lowest value observed for surfaces treated with a thin organic coating (TOC).
During the development of the present numerical model, values of ranging from 0.05 to 0.2 were used. The simulations showed that for pitch values below 70 mm, the influence of on the torsional moment is minimal. The best agreement between the numerical and experimental results was obtained with = 0.05, which was therefore adopted as the final value.
The contacts between the wires and the support surfaces are defined as Frictionless. They allow sliding without friction as well as separation between the contacting surfaces.
4.5. Numerical Simulation Timeline
Depending on the active supports and loads, the simulation proceeds in three stages:
Stage 1: All supports and loads shown in
Figure 7 are active. This stage continues until each of the
rotations reach 270°.
Stage 2: Supports and are deactivated to allow maximum freedom of twisting under large transverse deformations. This stage continues until the desired pitch of mutual twisting is achieved. At the end of this stage, the maximum stress values are reached.
Stage 3: The rotations are deactivated. This unloads the model, leaving the plastic deformations and residual stresses only.
4.6. FEM Mesh, Mesh Independence Study
The numerical model was implemented using Ansys
® Workbench
™, version 2022 R2. The finite element mesh used is shown in
Figure 8.
The mesh is fully hexahedral, composed of 8-node Solid185 elements. The mesh quality is high, with a maximum skewness of 0.5 and an average skewness of 0.208. It consists of 52,738 elements and 43,840 nodes. The node spacing is 0.6 mm in the longitudinal direction and 0.333 mm in the transverse direction, for example, along Line 1–2. Using this mesh, the solution was achieved after 7374 iterations, requiring 9 h on the workstation equipped with an Intel® Core™ i9-14900K processor.
The mutual twisting of the wires induces a complex stress state, which is why the strength analysis considers both the individual stress tensor components and the von Mises equivalent stress. Since Line 1–2 does not change its position in space, it is most convenient to track the stress diagrams along this line using the Ansys
® Workbench
™ Linearized Stress tool. The number of evaluation points along Line 1–2 corresponds to the number of nodes located on that line, which in turn depends on the selected mesh density. For the model shown in
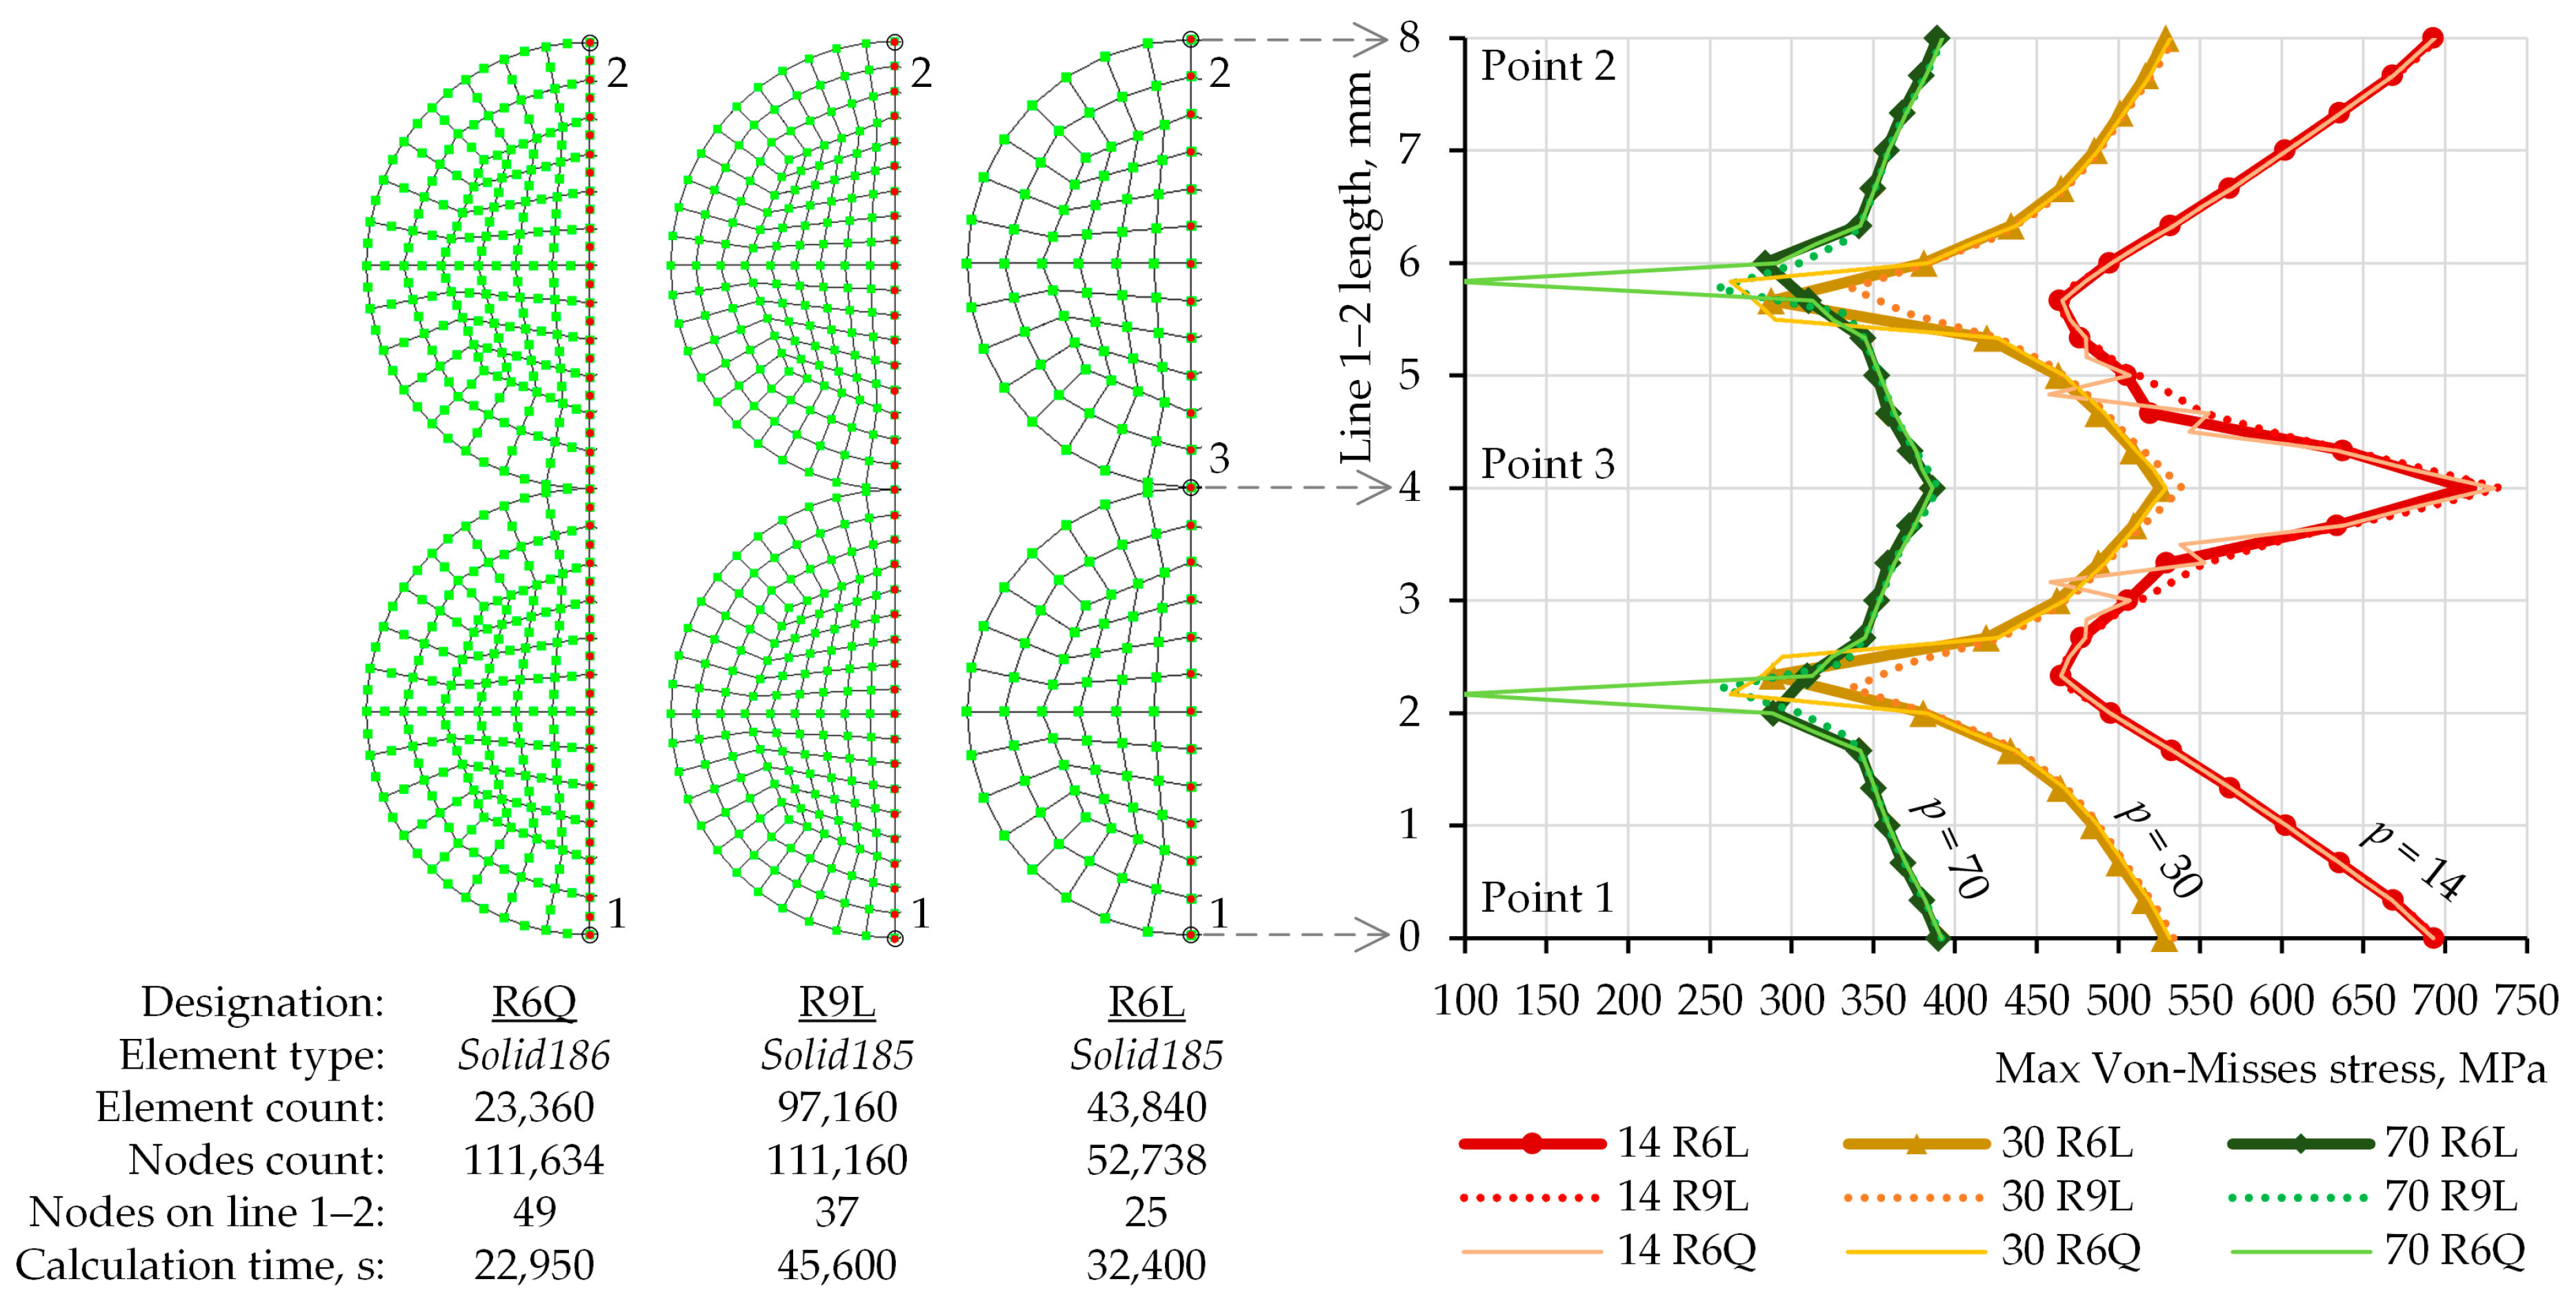
Figure 8 (denoted as R6L in
Figure 9), this number is 25. The nodes along Line 1–2 are marked with red dots in
Figure 9. The mesh definitions used ensure a uniform distribution of nodes along Line 1–2.
The stress diagrams shown in
Figure 9 are complex and feature sharp peaks and steep gradients, whose accurate reproduction requires a fine mesh and significant computational resources. In this case, it is beneficial to perform a mesh independence study to determine the optimal mesh density that ensures the necessary level of detail and accuracy while maintaining a reasonable computation time.
Figure 9 presents three of the tested mesh configurations. They differ in both the type of finite elements and in the number of nodes along Line 1–2. The R6Q mesh uses 20-node
Solid186 elements, while R6L and R9L use 8-node
Solid185 elements. Nine elements are placed along a single radius of 2 mm in R9L, whereas six elements are placed along the same distance in R6Q and R6L. The node spacing is 0.6 mm in the longitudinal direction of the wires, which means that in R9L and R6L the elements are 0.6 mm long, while in R6Q they are 1.2 mm long due to the presence of mid-side nodes. The longitudinal element length was selected after multiple trials in the range of 0.25–1.4 mm. Its variation did not significantly affect the stress distribution in the cross-sections.
The presence of mid-side nodes in
Solid186 elements doubles the node density along Line 1–2 and on the contacting cylindrical surfaces. This results in very good convergence, which at first glance appears advantageous. Unfortunately, under large plastic deformations (
≤ 30 mm), artificially low values of equivalent stress were observed at some mid-side nodes (
Figure 9). When working with
Linearized Stress, it became necessary to use only the values at the corner nodes, which reduced resolution and complicated the post-processing. This made the use of
Solid186 elements disadvantageous. In the R9L and R6L mesh variants, the results were very similar, except in regions with pronounced peaks and stress gradients. Therefore, the R6L mesh was finally selected, as it provides sufficient detail while requiring relatively low computational resources.
5. Numerical Study
5.1. Description of the Obtained Results
Simulations were performed using the described FEM model for 14 different pitch values: 10.5, 12, 14, 17, 20, 25, 30, 40, …, 150 mm. Distributions and diagrams of von Mises equivalent stress
were obtained (
Figure 10), as well as the stress components along Line 1–2, including normal stresses
, and shear stresses
. The stresses resulting from the maximum applied torque are denoted as
. After the torque is deactivated, residual stresses remain in the model, denoted as
.
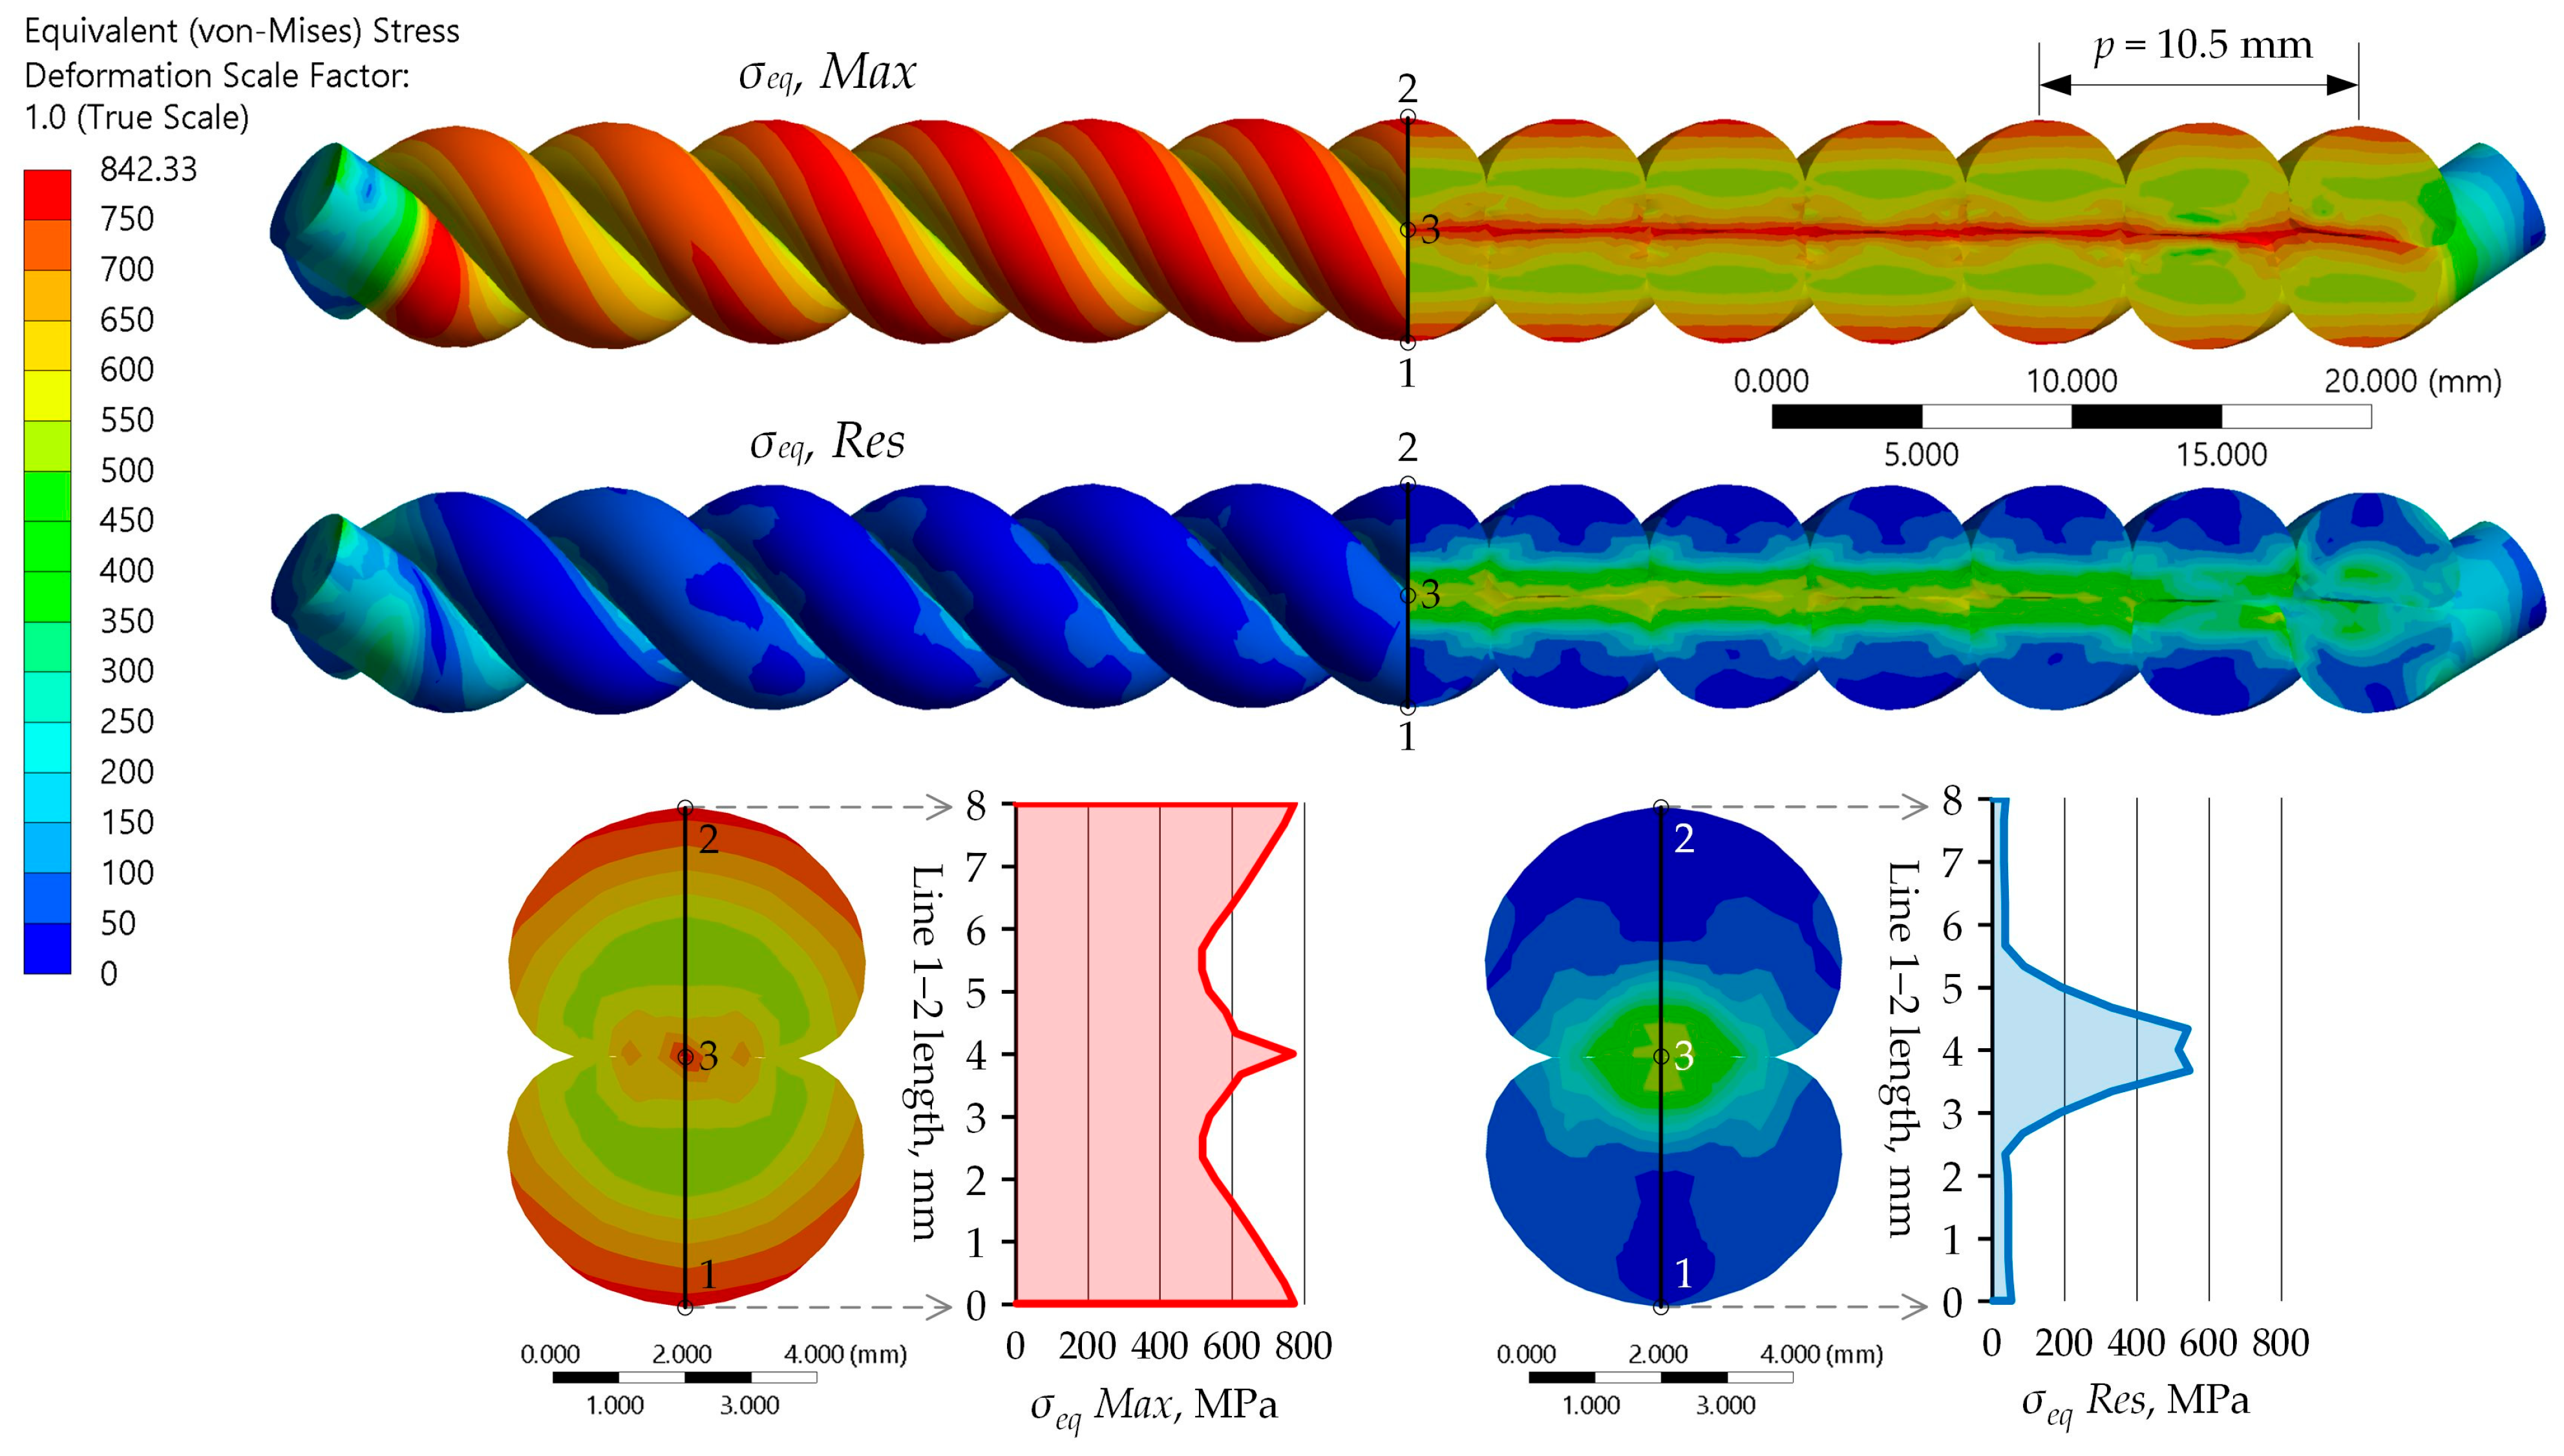
Figure 10 shows the distribution of equivalent stress
at the minimum investigated pitch of 10.5 mm, at which the maximum stresses and strains are reached. The figure includes the stress distribution on the outer surfaces, in a longitudinal and cross-sectional view of the twisted pair, as well as the stress diagram along Line 1–2.
reaches values of up to 772 MPa in the middle and at the ends of Line 1–2. The maximum
is 547 MPa, located close to Point 3 and the longitudinal axis of the twisted pair. The distributions and peak values of
and
depend on the pitch and are therefore analyzed in detail in the following sections.
5.2. Maximum and Residual Stresses—Diagrams and Analysis
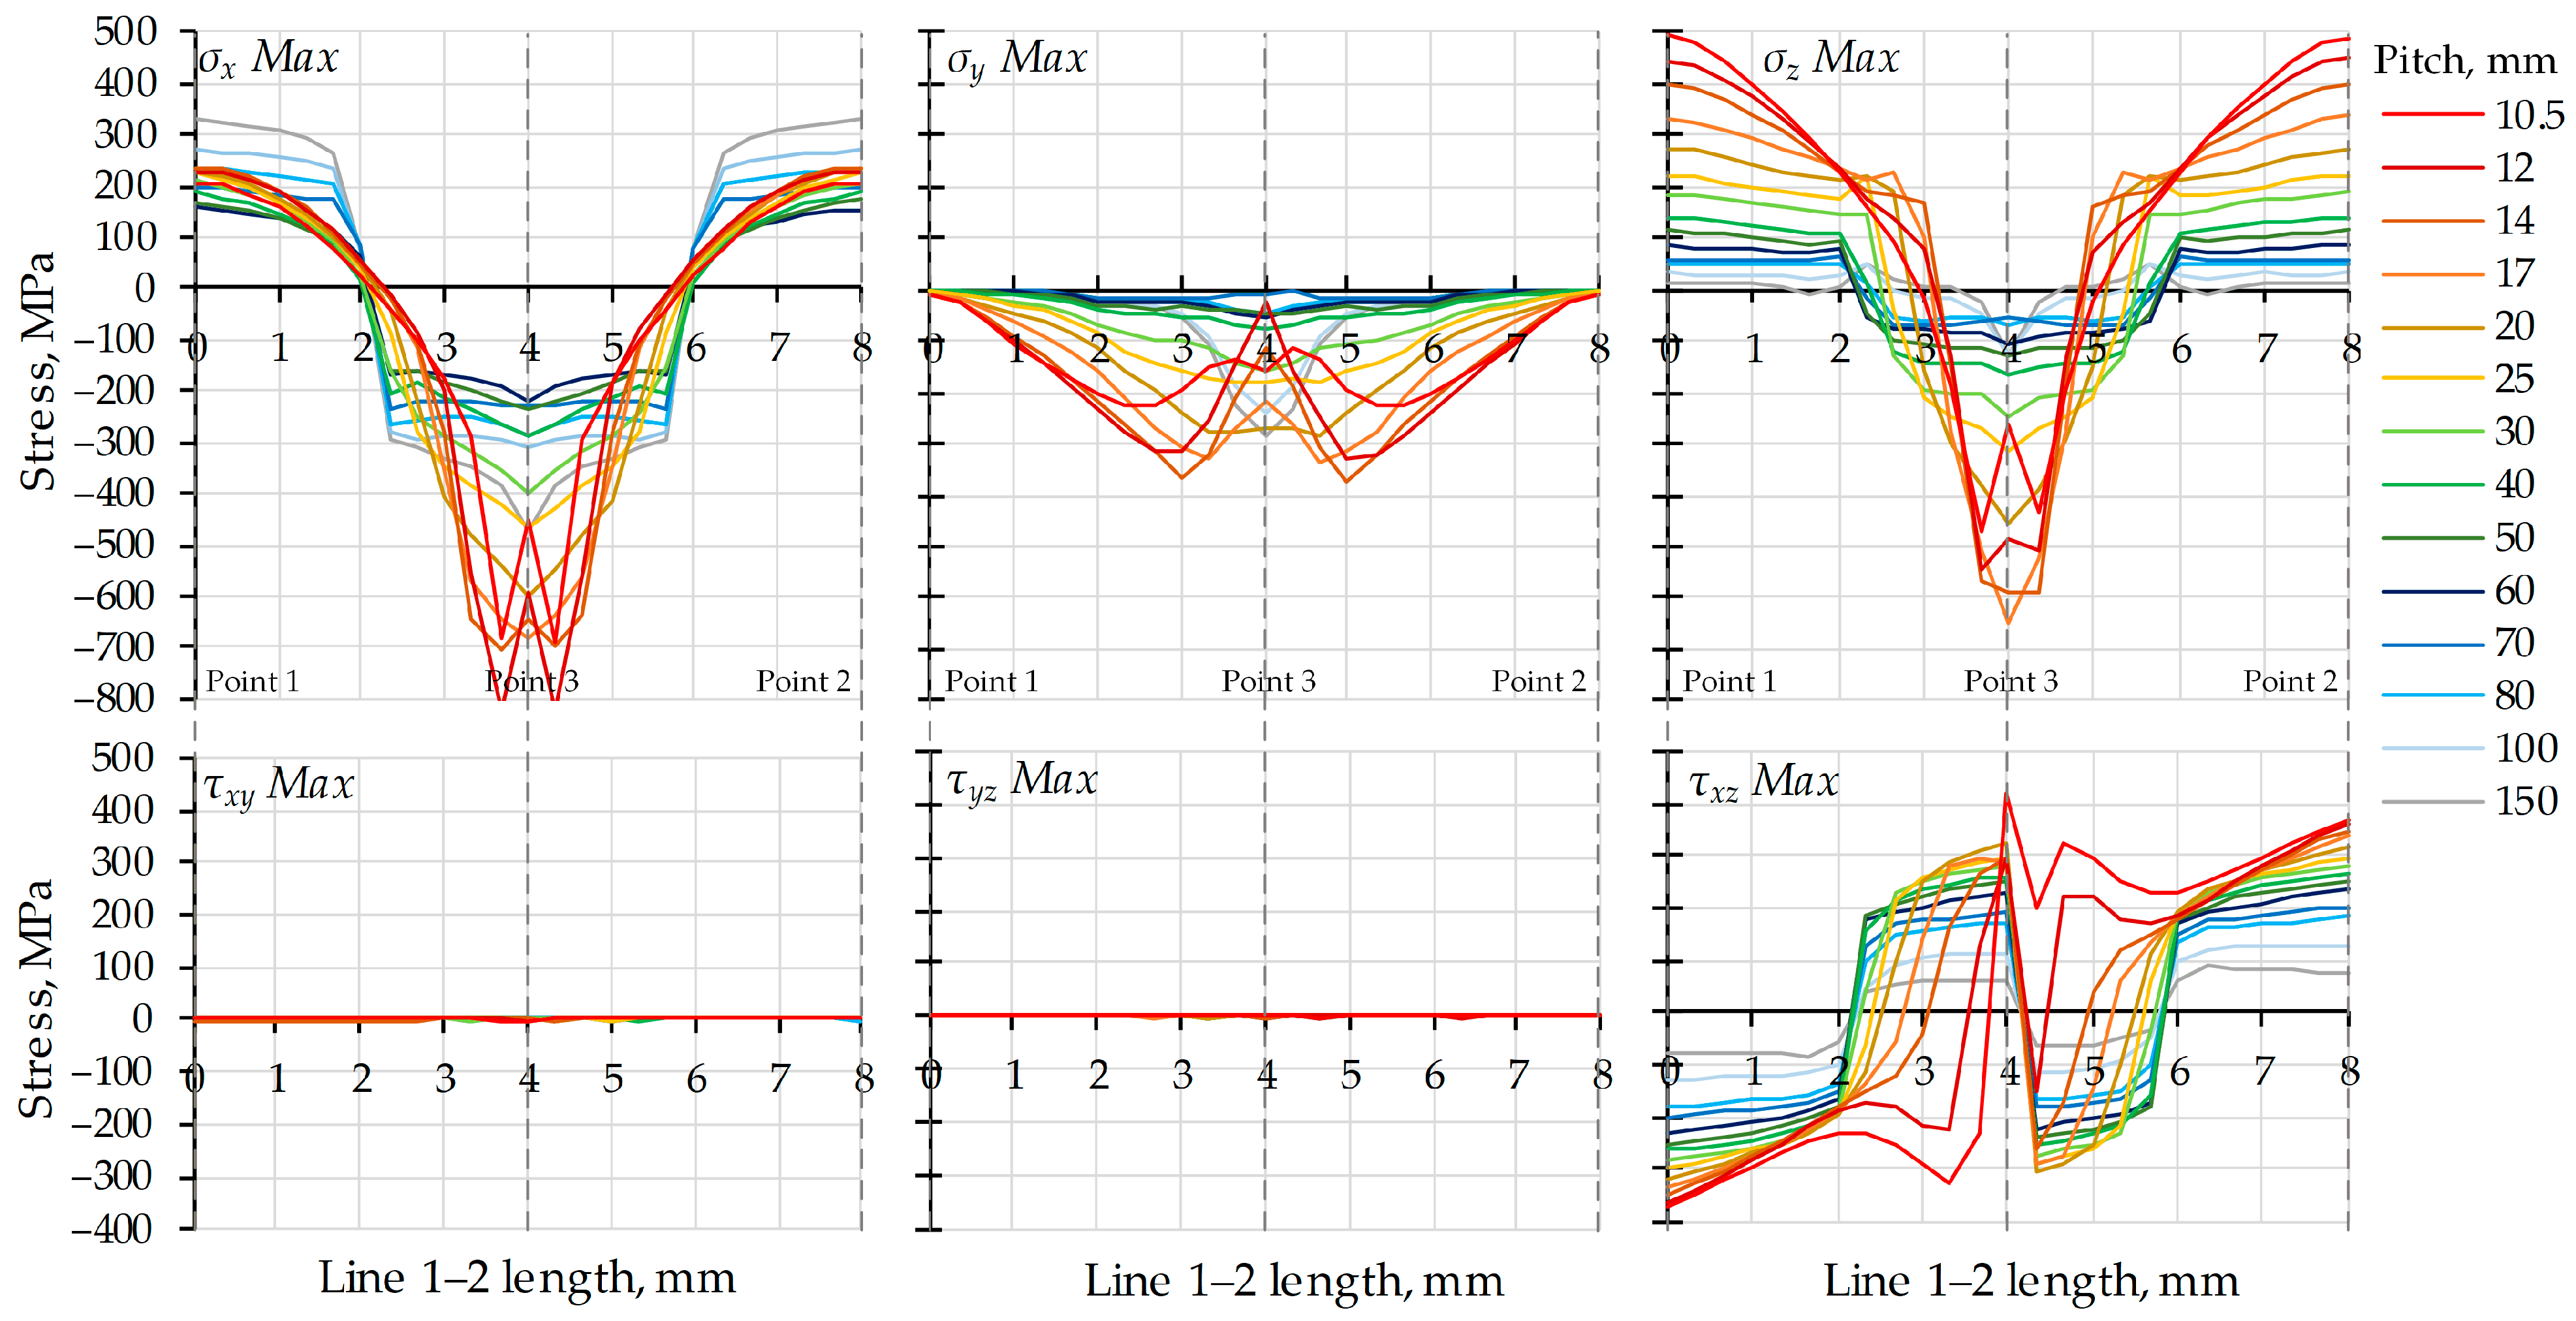
Figure 11 shows stress diagrams of the maximum normal and shear stresses along Line 1–2, obtained during twisting up to the corresponding pitch. The dominant components are
and
, which exhibit high values both on the surface (Points 1 and 2) and in the interior. The normal stress
can also reach significant values, but only for pitches smaller than 40 mm, and only in the interior.
The normal stresses
and
arise due to simultaneous bending about the
y- and
z-axes. It may be assumed that at the initial stage of mutual twisting, the two wires bend individually and independently of each other around a central axis. It is known from theory [
32], that in pure bending of a cylindrical body, the stresses are maximal at the points farthest from the bending axis (in this case, Points 1, 3, and 2 with coordinates 0, 4, and 8 mm along Line 1–2, respectively) and vanish along the bending axis (the centers of the two wires lie at coordinates 2 and 6 mm). The diagram of normal stresses is linear up to the yield limit, beyond which a plastic region with a small slope appears on the stress diagram, progressing inward from the outermost fibers. Such appearances are observed in the
and
diagrams of the individual wires for pitches
> 60 mm, where the cross-sections remain only slightly deformed. In the range
= 17–50 mm, significant plastic deformation occurs, particularly in the contact region near Point 3, leading to increased stress in this area. In the interval
= 10.5–14 mm
and
decrease again near the Point 3. The large deformations enlarge the contact area, the two wires come into increasingly tight contact, and the tight spiral described in ref. [
3] is formed.
For a cylindrical body subjected to pure torsion, the
shear stress diagram follows the same pattern as
and
, both in the elastic and plastic regions [
32]. This is illustrated in
Figure 11, where the
diagrams can also be classified into three groups according to the pitch. For large pitches (
> 30 mm), the
diagram for each wire resembles that of a single twisted wire. For intermediate pitches (
= 17–25 mm), the compaction of the twisted pair leads to an expansion of the regions where
has the same sign and direction as the applied torque. For small pitches (
p < 17 mm), the regions where
is opposite to the twisting direction decrease sharply. This indicates a behavior typical of tight contact, in which the two wires act as if mechanically bonded to each other.
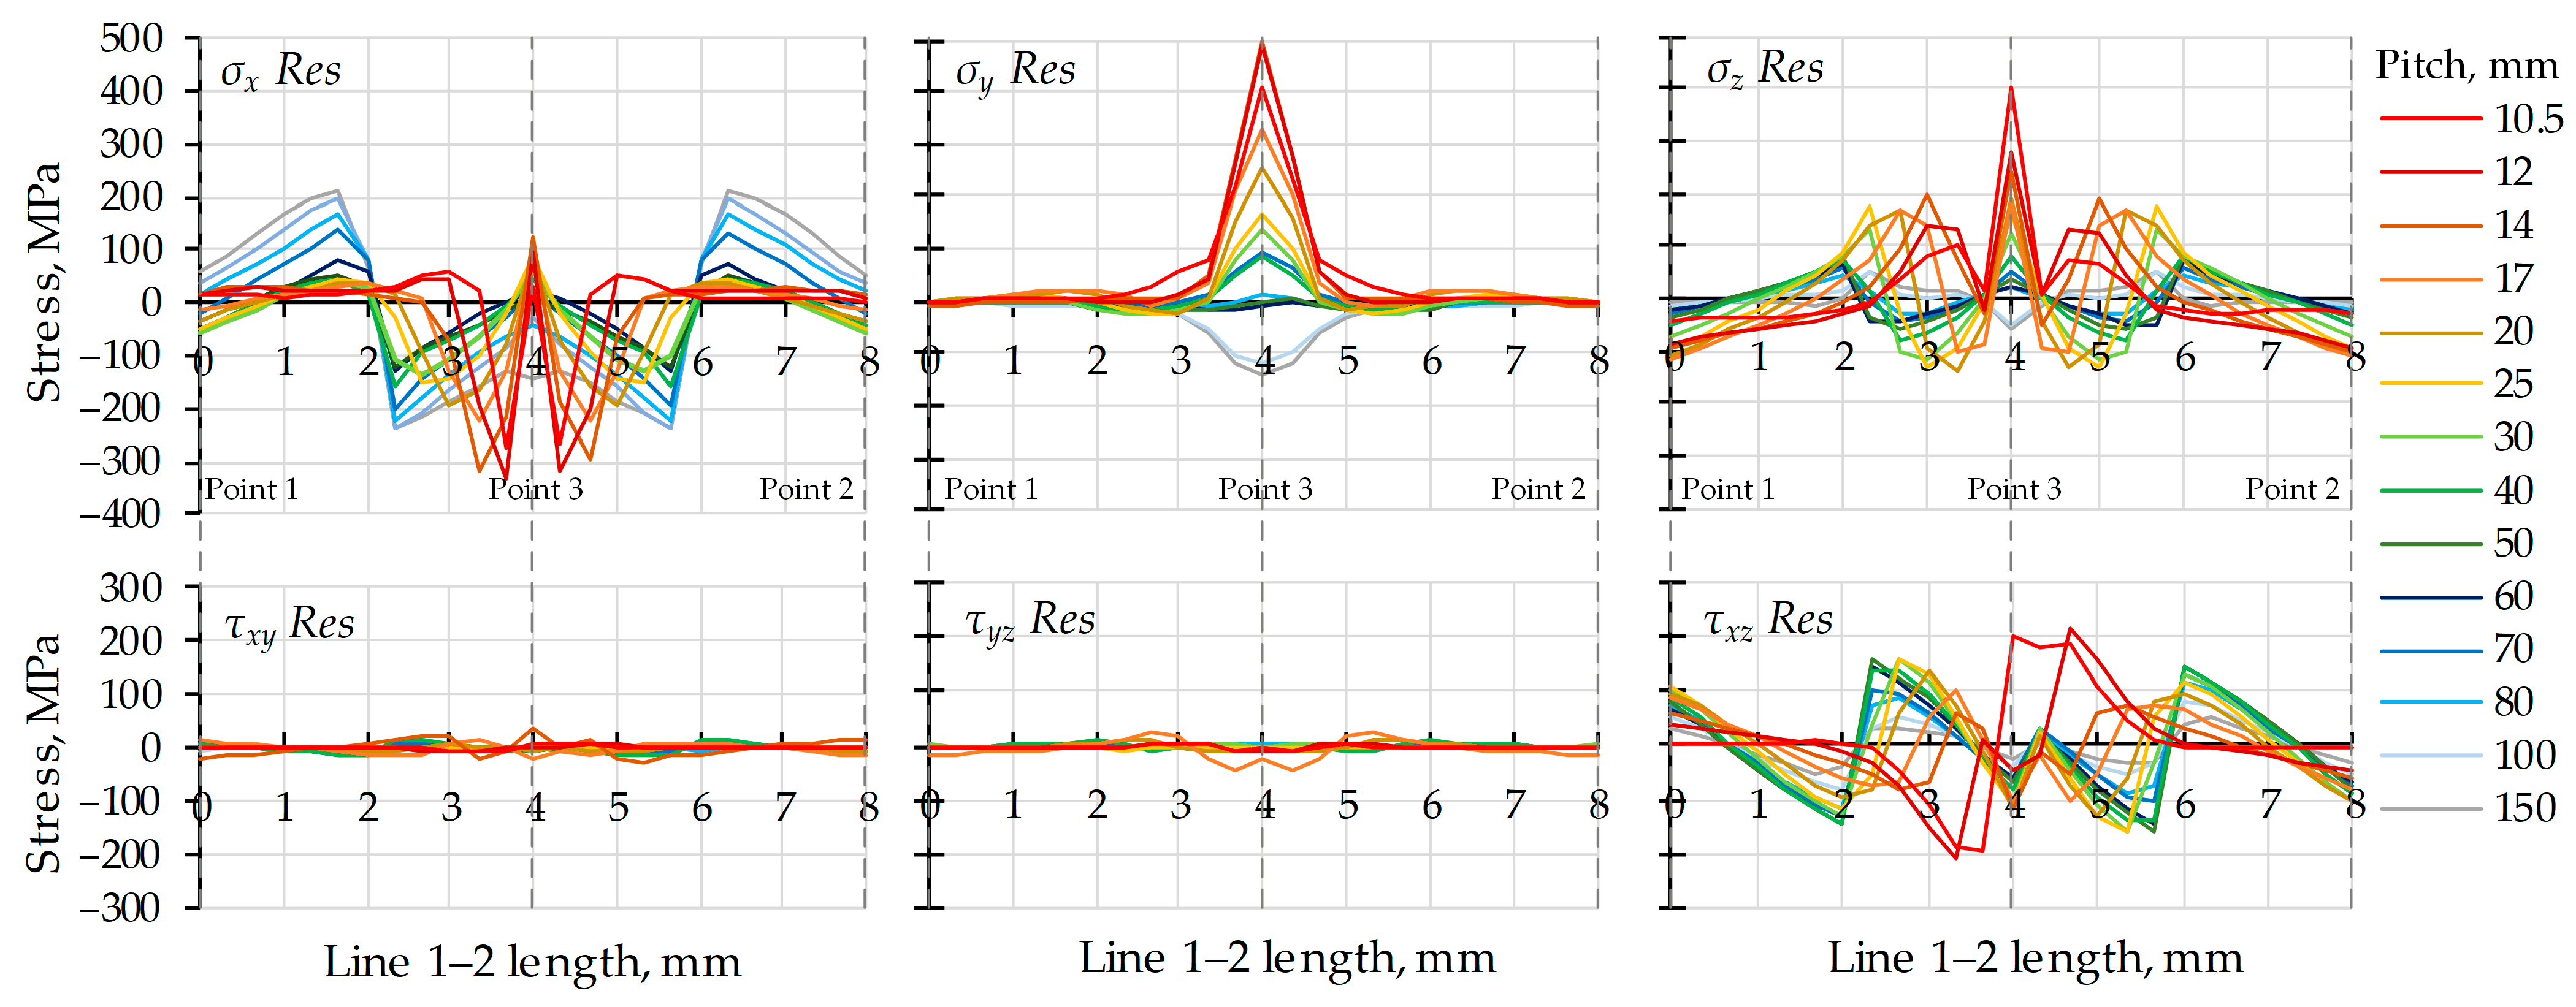
Figure 12 shows the residual stress diagrams along Line 1–2, obtained after deactivation of the applied torque and unloading of the twisted pair. The stress values at the surface (Points 1 and 2) are relatively low and do not exceed 100 MPa. Given the complexity of the stress state and the stress distribution in the cross-sections, the use of von Mises equivalent stress is appropriate for further analysis.
5.3. Equivalent Stress—Cross-Sectional Distribution, Diagrams and Analysis
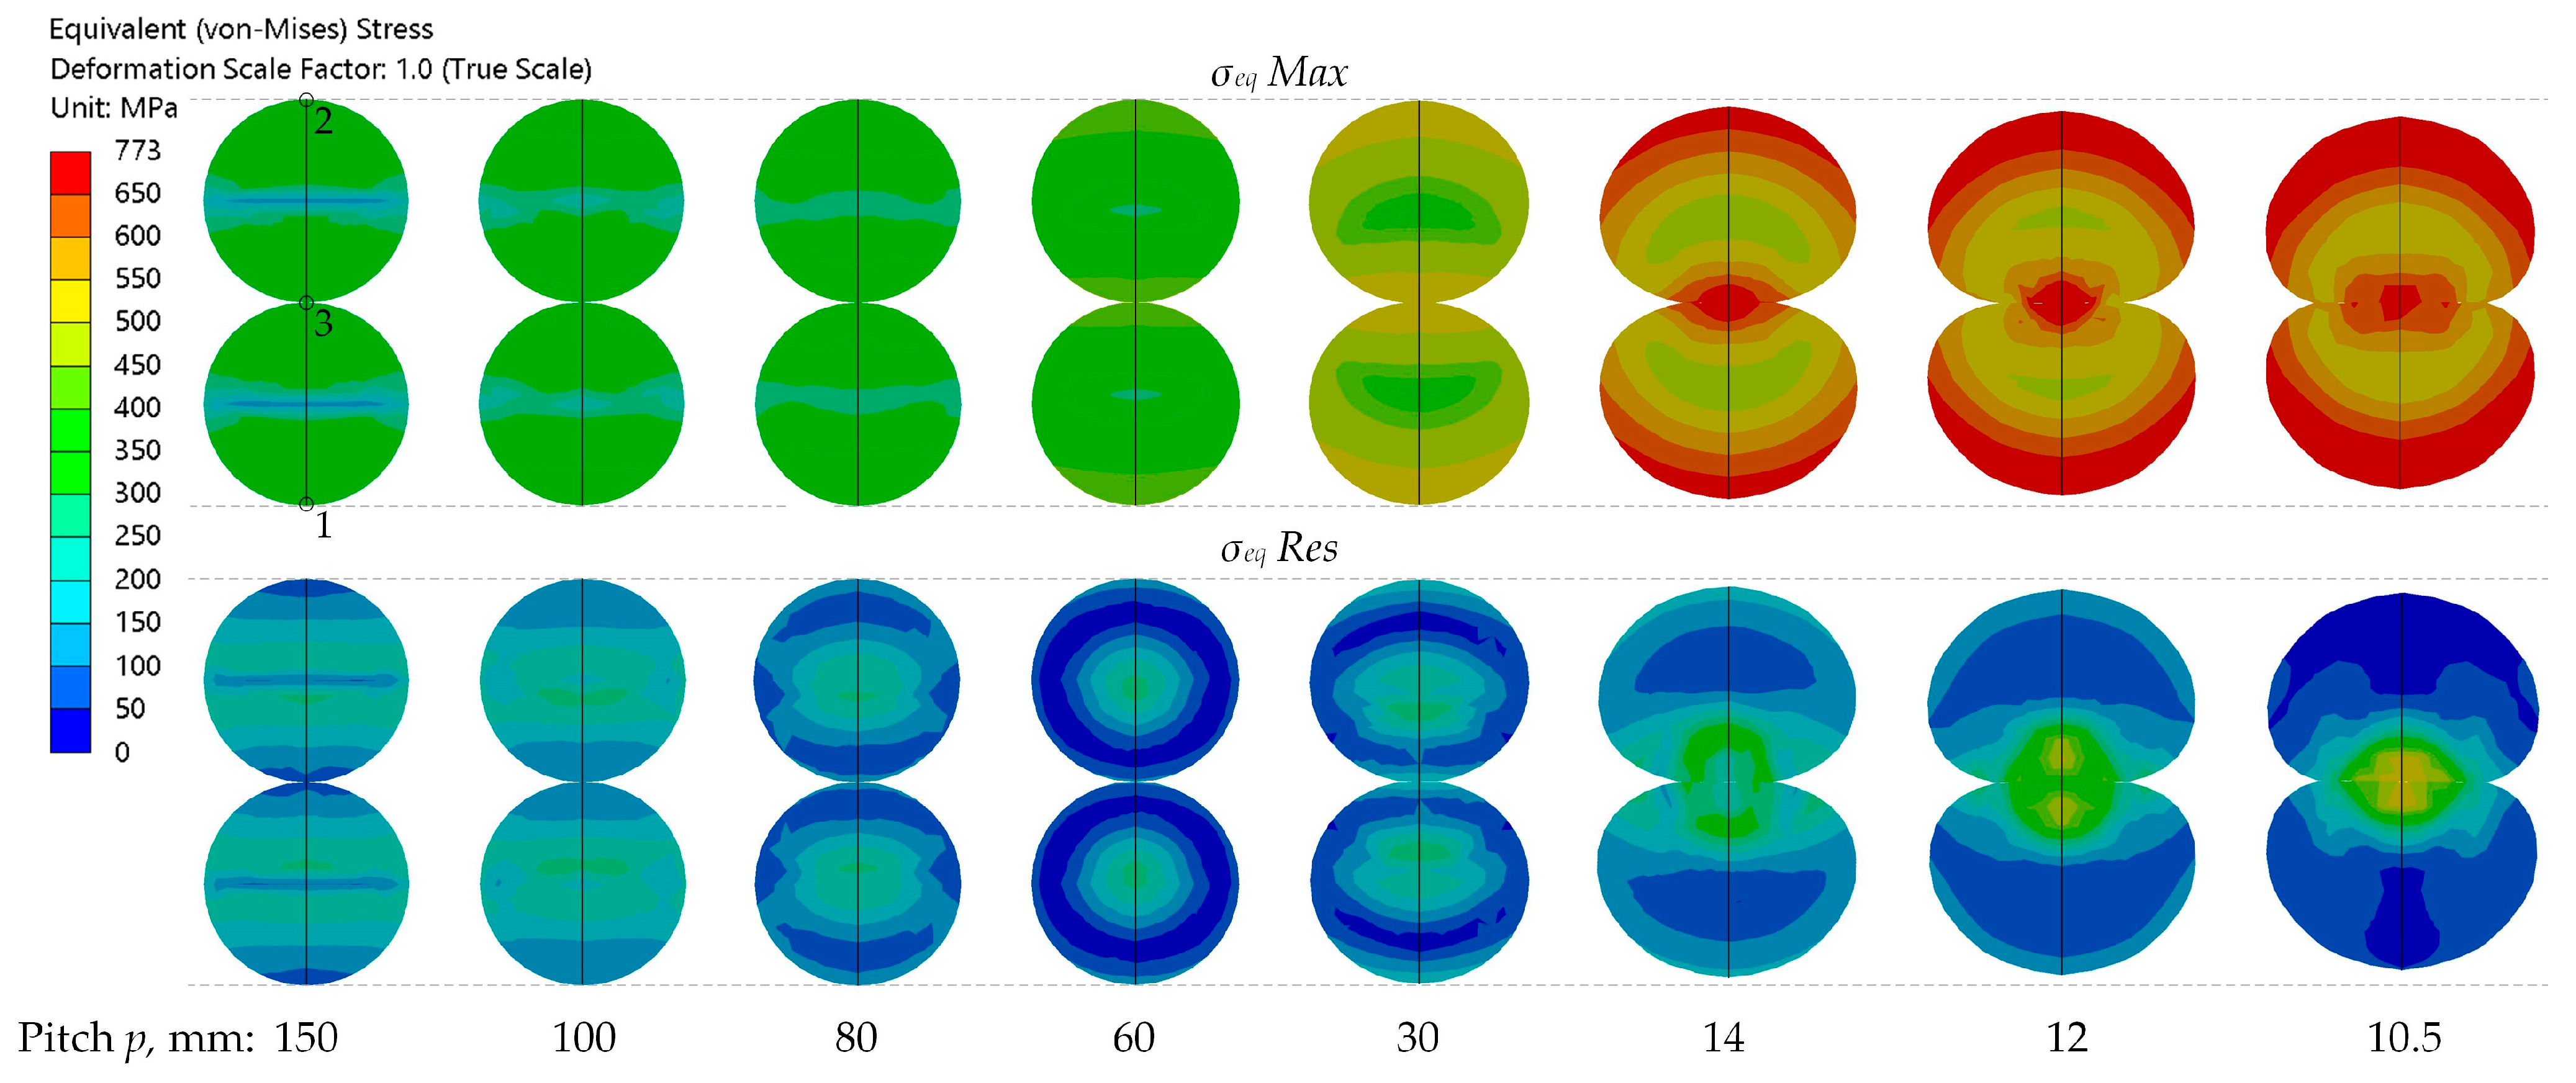
The distributions of
and
in the deformed mid-span cross-section for eight of the considered pitches are shown in
Figure 13.
For a more precise evaluation of the stresses shown in
Figure 13 and
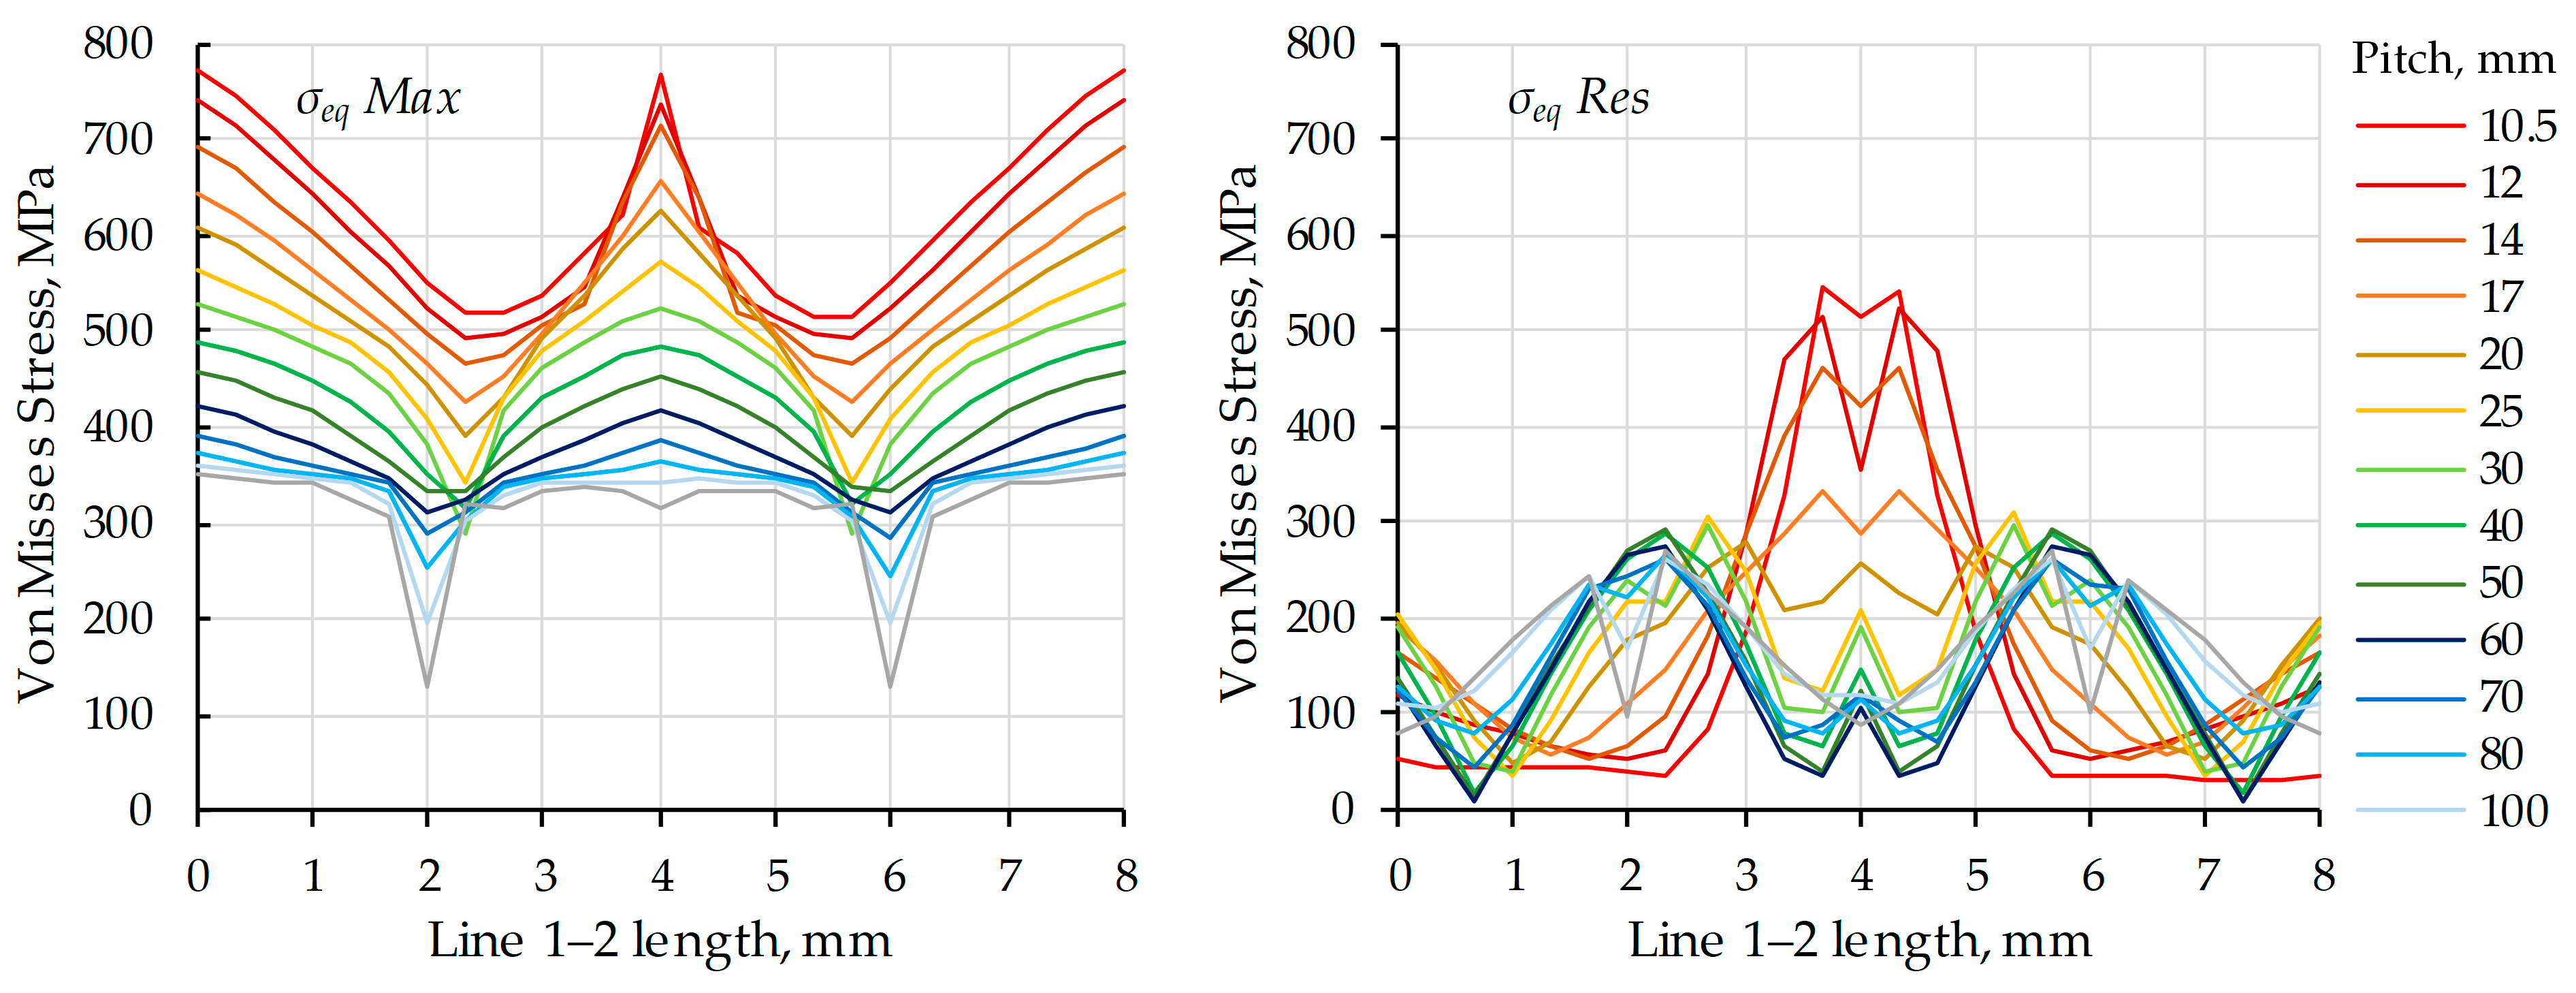
Figure 14 presents the corresponding diagrams of
and
along Line 1–2. In these diagrams, Points 1, 2, and 3 correspond to Line 1–2 lengths of 0, 4, and 8 mm, while the centers of the two wires are located at 2 and 6 mm.
For large pitches ( > 40 mm), the contact interaction between the two wires is weak. The distribution of is relatively uniform, with a distinct minimum at the centers of the wires. The equivalent residual stresses have a maximum near the wire centers, while the stress levels near the surface (Points 1, 2, and 3) are comparatively low—on the order of 100 MPa.
For intermediate pitches ( = 17–40 mm) a plastically deformed contact region forms and grows between the wires. As a result, the residual equivalent stresses near the contact point (Point 3) increase rapidly, while the stresses at the wire centers decrease. At = 17 mm, the shape of the residual stress diagram changes notably: a maximum appears near Point 3, at a Line 1–2 length of approximately 4 mm, while the stress levels at the wire centers become close to their minimum values.
For small pitches (p < 17 mm), the twisted pair becomes significantly shorter and more compact. The cross-sectional area, as well as the contact area between the two wires, increases. The residual stresses become further concentrated in the vicinity of Point 3, while they decrease outside this zone. This trend becomes more pronounced with decreasing pitch, and for < 12 mm leads to reduction in the average value of .
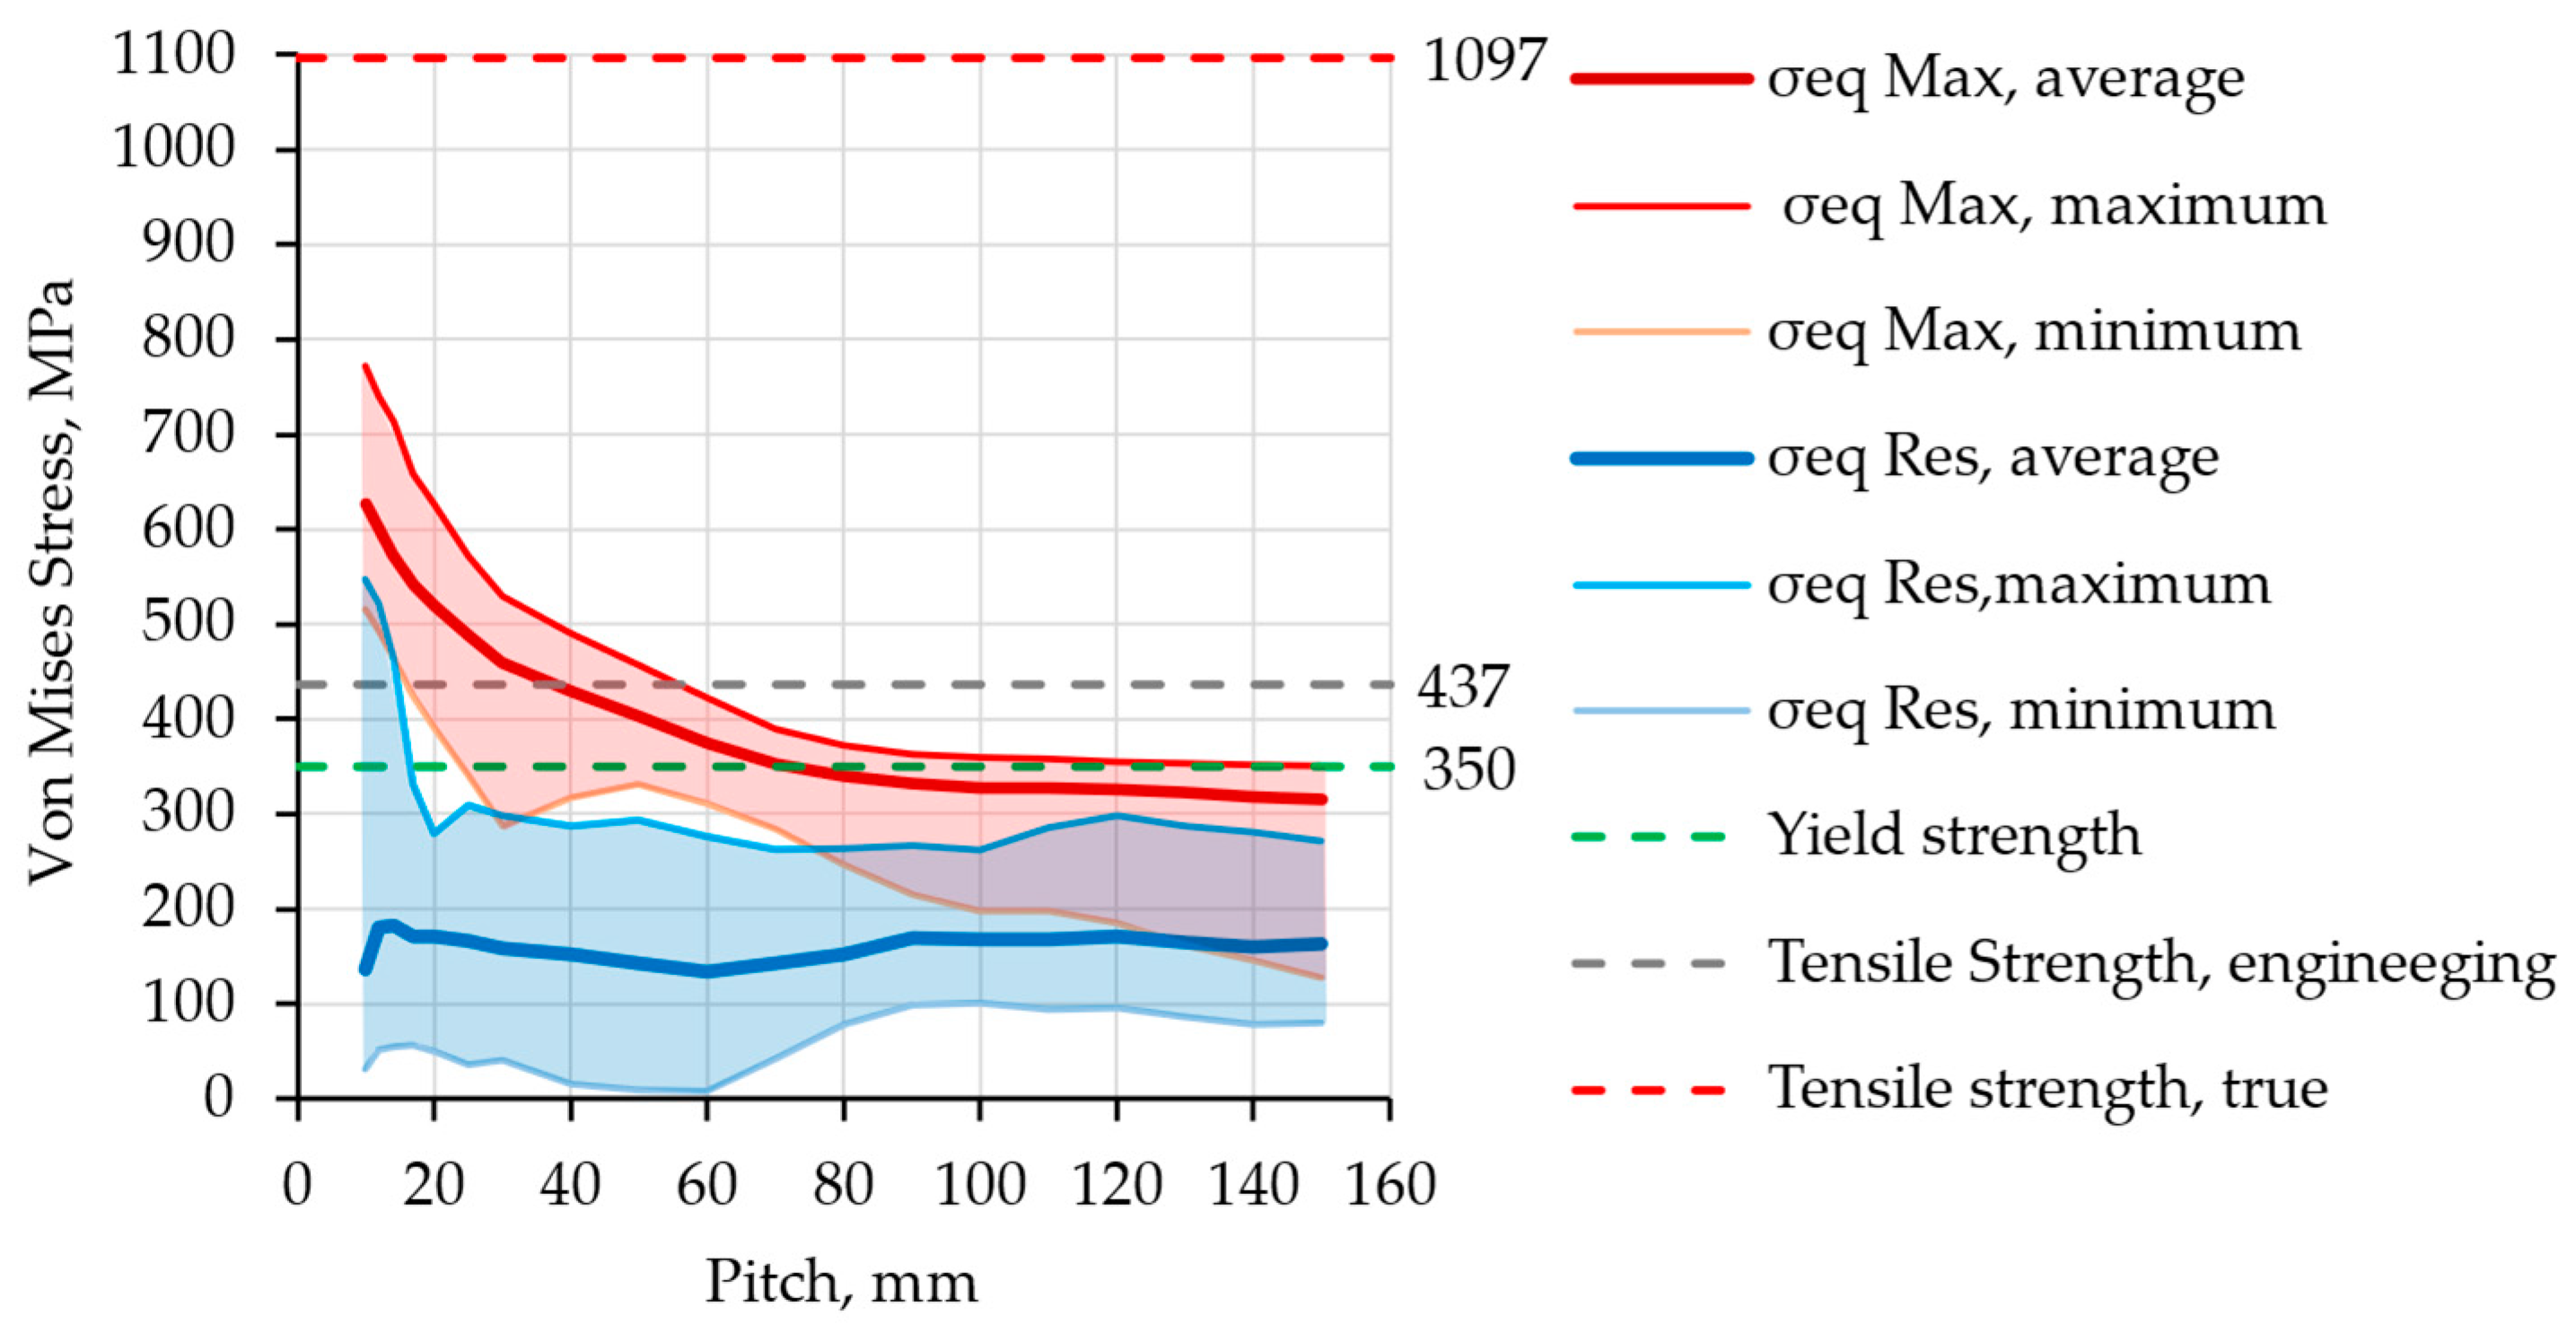
Figure 15 presents the maximum, average, and minimum values of
and
along Line 1–2 at different pitches. The figure also indicates the yield strength, the engineering tensile strength, and the true tensile strength of the material.
For large pitches, the maximum and average values of are practically independent of pitch, with the average values slightly below the material’s yield strength. As the pitch decreases, increase, and the slope of the (both maximum and average) becomes progressively steeper. At the relatively large pitch of p = 55 mm, reaches the engineering tensile strength of 437 MPa. At = 10.5 mm, the highest value recorded in the entire study, 775 MPa, is observed. Relative to the yield strength and engineering tensile strength, these stress levels are significantly elevated. This highlights the importance of selecting steel with appropriate mechanical properties, which depend on its chemical composition, as well as on its mechanical and thermal treatment. Moreover, accurately defining the material behavior beyond the yield point is essential for conducting a reliable static structural analysis at small pitch values of the twisted pair.
Figure 15 also shows that the twist pitch has virtually no effect on the average value of the residual stress
throughout the investigated interval, which suggests that residual stresses have a comparable influence on service performance across all pitch values.
6. Experimental Verification
In addition to the results presented in the previous section, the numerical model also provides the moment reaction corresponding to the applied rotations
(
Figure 2). This reaction is equal to the torsional moment required to form the twisted pair and can be measured experimentally. The comparison between the numerically and experimentally obtained torque is the main approach for verifying the developed numerical model.
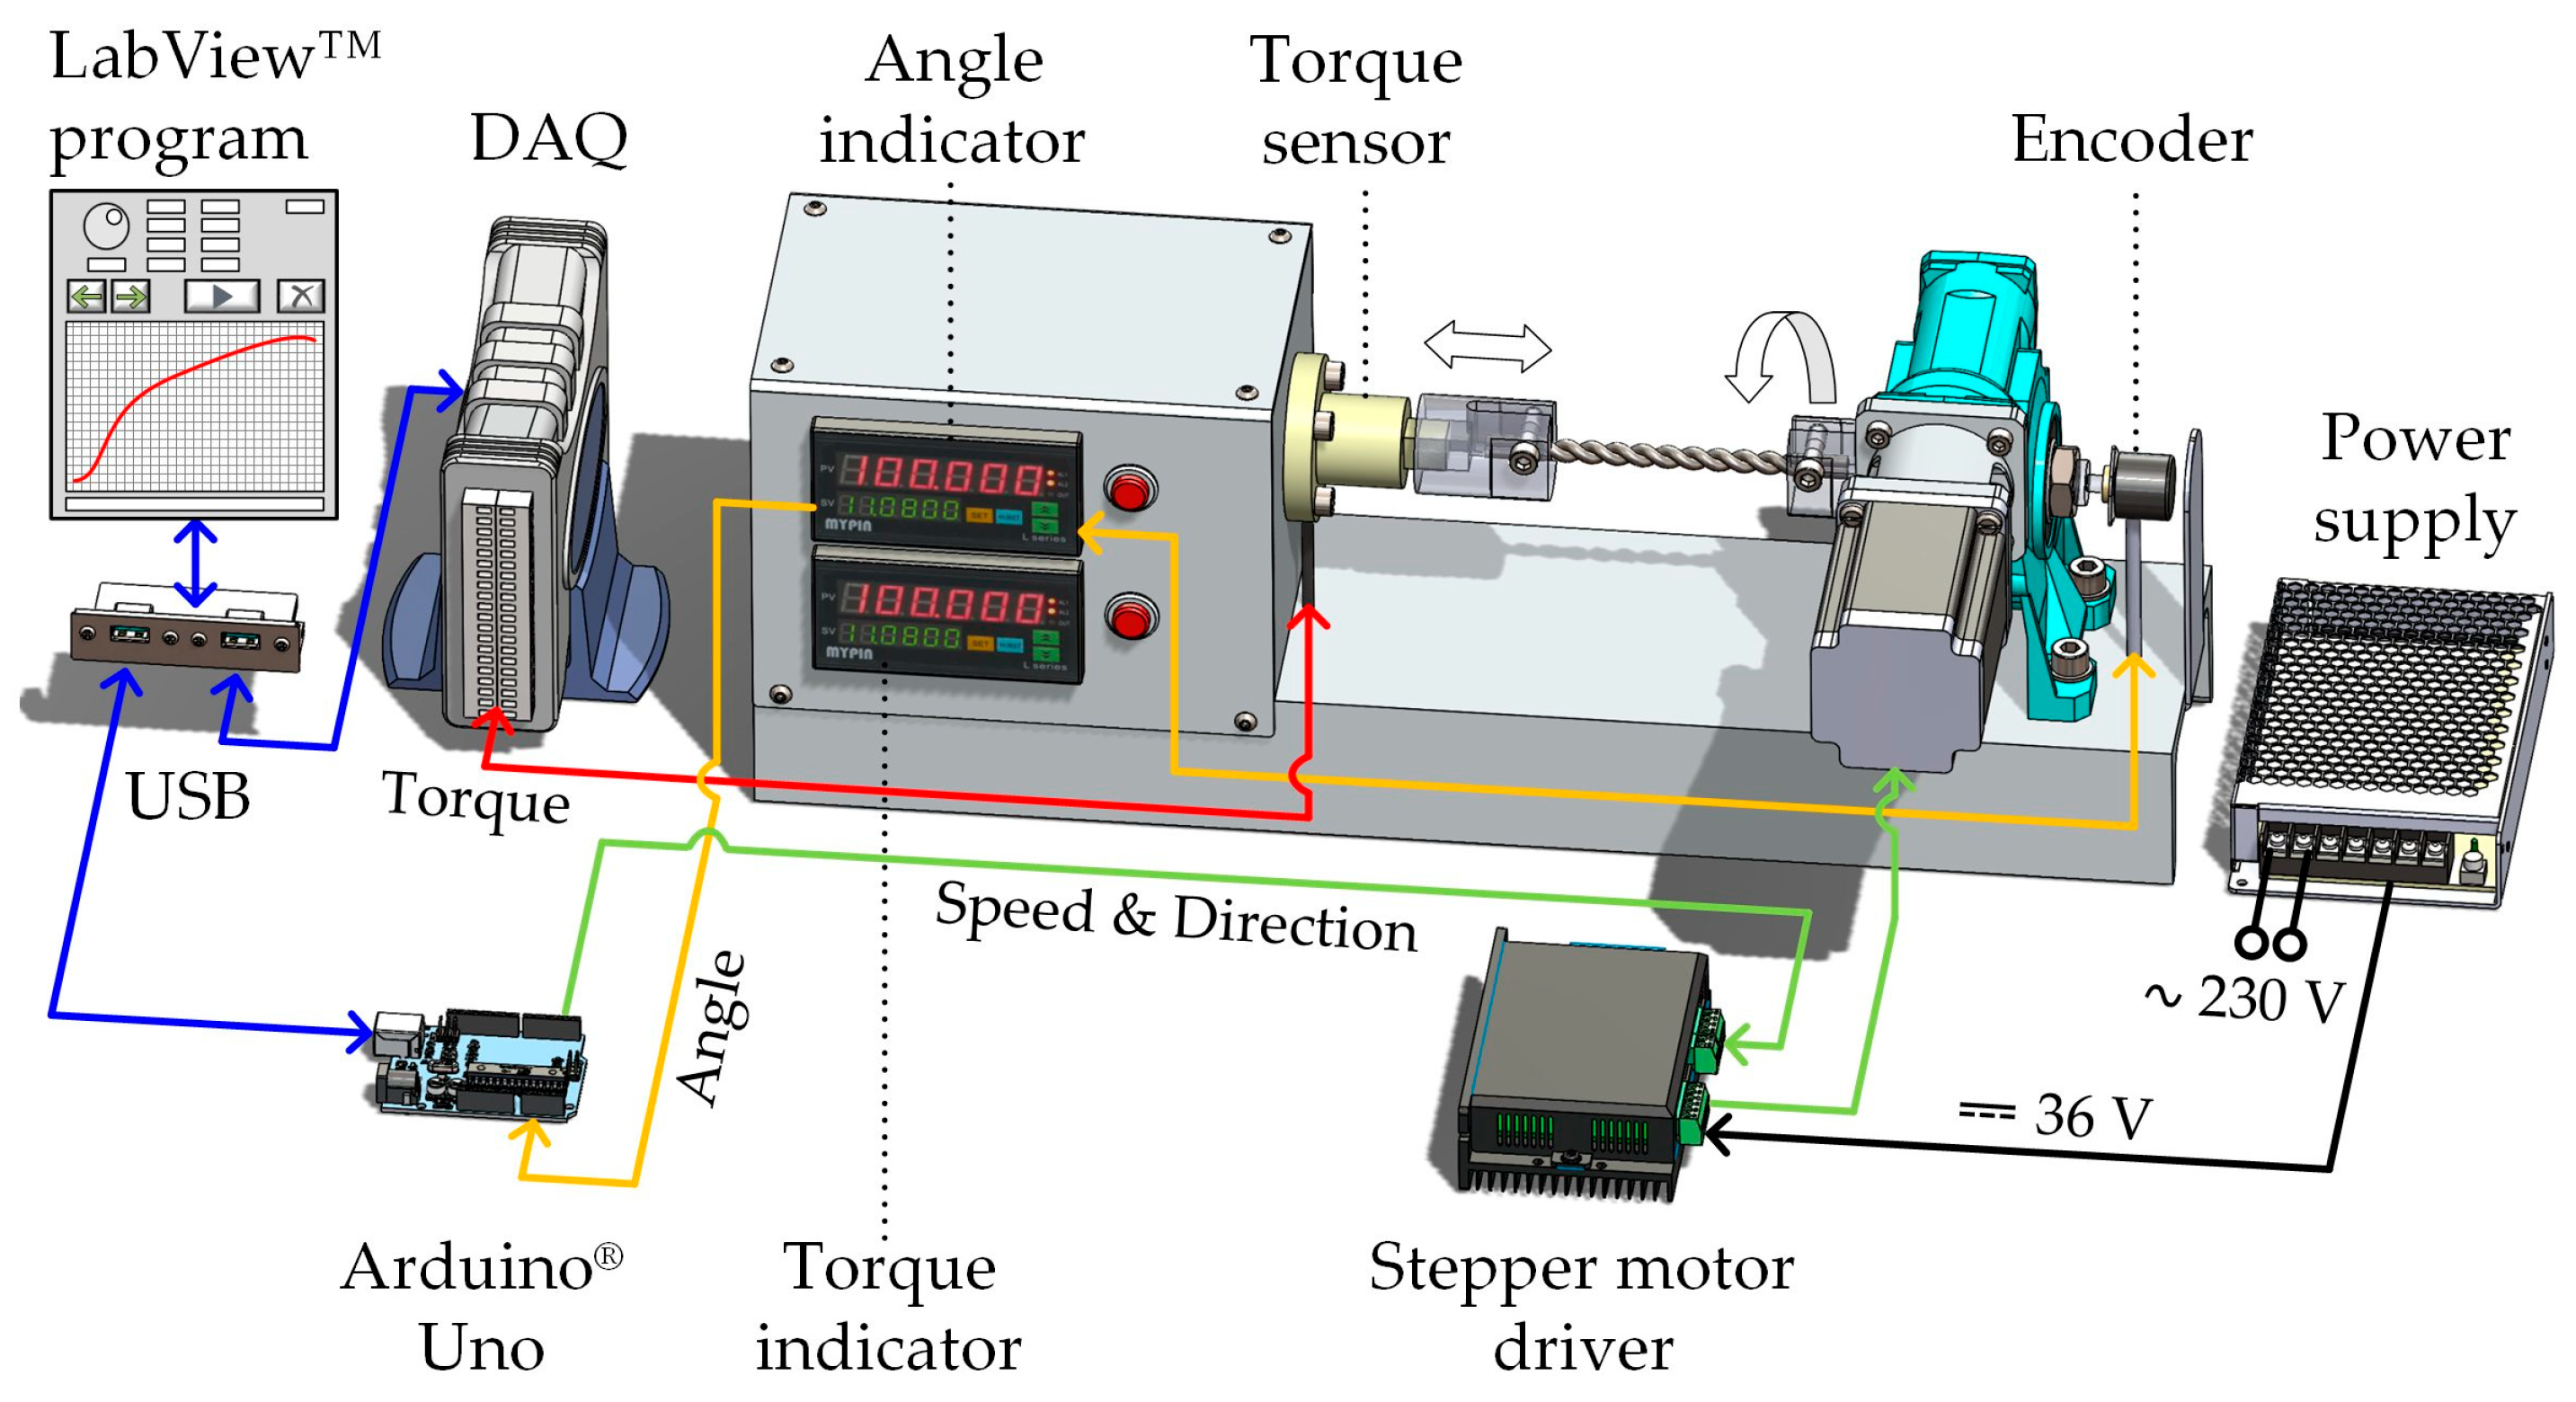
The experimental setup used is shown in
Figure 16.
An available torsion testing machine was employed in which the torque is transmitted from a stepping motor type 60BHH86-300E-24DB to the test specimen via a worm gearbox Tramec® A65B3H14 (Tramec SRL, Calderara di Reno, Italy) with a gear ratio of 65:1. The stepping motor is powered and controlled by a stepper motor driver type DM860D, which receives speed and direction signals from an Arduino® Uno microcontroller board (Arduino SRL, Scarmagno, Italy). One end of the gearbox output shaft is equipped with a rotary grip while the other end is connected to an optical incremental encoder Scancon® 2RMHF360 (Scancon Encoders A/S, Hillerød, Denmark) with a nominal resolution of 360 pulses per revolution. The torque reaction of the specimen is measured via a strain gauge-based static torque sensor ‘Sensor and Control’ SCYH71A (SENSOR AND CONTROL Co., Ltd., Hong Kong, China) with a measurement range of 50 Nm. The second grip of the machine is loosely mounted onto the torque sensor, allowing axial displacement when necessary. This configuration prevents tensile loading of the twisted pair which shortens significantly during the experiment and whose ends may become jammed in the grips under high torsional moments. The encoder and torque sensor readings are displayed in real time on digital indicators integrated into the machine. These indicators also supply the corresponding sensors and provide output signals for data acquisition equipment.
For the purposes of the present study and to achieve high measurement accuracy, the torque sensor was connected directly to a DAQ module (Adlink® USB-2401 (ADLINK Technology Inc., Taipei, Taiwan)), which is specialized for strain gauge measurements. The corresponding digital indicator of the testing machine was temporarily disabled. The information on the twist angle was transmitted from the machine’s indicator to the Arduino® Uno. Both the microcontroller board and the USB-2401 DAQ communicate with a personal computer via USB.
The control and data acquisition program was specifically developed using LabVIEW™ 2019 software. The program allows the user to control the twisting speed and direction through a graphical interface and plots in real time the recorded relationship between torsional moment and twist angle. In the present experiment, mutual twisting was carried out at a speed of 0.58 RPM, in a counterclockwise direction when viewed from the torque sensor side. The sampling rate of the USB-2401 module was set to the minimum value of 20 samples per second, while the synchronized recording rate of the torque sensor and encoder signals on the personal computer was 6 Hz.
During the experiment, two effects occurred that are not accounted for by the numerical model. First, in addition to deformation within the working section, the wires also deform within the grips. Second, as the twisted pair shortens, part of the wire is drawn from the grips into the working section, which affects both the twisting rate and the resulting pitch. As a result, the angular reading from the encoder alone is insufficient to establish an accurate relationship between the measured torque and the actual twist pitch. To overcome this limitation, a high-resolution digital camera and a millimeter-scale reference line were added to the setup. The camera simultaneously captures the twisted pair and the angular indicator display at a frame rate of 2 frames per second, allowing the recorded images to be synchronized with the data stored on the personal computer.
One of the images captured during the experiment is shown in
Figure 17a. After the experiment, the frames corresponding to the specific pitches used in the numerical analysis were identified. From these frames, the corresponding twist angles were determined, and the torque values for those angles were extracted from the recorded data.
Six twisted wire pairs were produced using the described method. Twisting was continued until either yielding occurred near the grips or failure took place within the grips. The minimum pitch achieved was 12.5 mm. Further twisting beyond this point led to yielding or failure at the ends of the twisted region, which had been weakened by deformation in the grips. One of the twisted pairs obtained is shown in
Figure 17b, where a numerically generated twisted pair with the same pitch is also included for comparison, shown at the same scale. It can be seen that the numerical model reproduces the mutual twisting well in the region unaffected by the grips.
Figure 18 presents the torsional moment–pitch relationships obtained from both the experiment and the numerical model. For pitches above 20 mm, the experimental and numerical results show nearly perfect agreement, confirming the adequacy of the developed numerical model. For pitches below 20 mm, the experimental results indicate lower torsional moment values compared to the simulation, which is attributed to effects not accounted for in the modeling and occurring only under large deformations. An example of such an effect is material yielding at the ends of the twisted region, as shown in
Figure 17b.
7. Discussion
The numerical and experimental results presented in this study provide a comprehensive view of the stresses and deformations arising in a pair of twisted steel wires. The finite element model, validated through torque–pitch measurements, proved capable of accurately reproducing the physical behavior observed during twisting.
One of the key findings is that the equivalent von Mises stresses under maximum applied torque can reach very high values, reaching 773 MPa. These levels significantly exceed the typical engineering tensile strength of general-purpose steels used in wire production. In the present study, for instance, the engineering tensile strength was 437 MPa. To obtain a twisted pair with a small pitch (tight spiral) without the risk of premature fracture, it is important to use a suitable mild steel with sufficiently high true strength. The requirements increase as the pitch decreases. With a true tensile strength of 1097 MPa, the investigated steel allows for achieving a very tight pitch, as long as other risks, such as stress concentration at the grips, are avoided.
In contrast, the residual stresses remaining after unloading exhibit a more uniform trend. While their spatial distribution becomes complex and pitch-dependent, their average magnitude remains within a narrow range of approximately 137–183 MPa. This suggests that residual stresses are a consistent feature of the twisting process.
The deformation of the twisted pair leads to increased area and more balanced moments of inertia of the cross-section, which actually enhance the axial and flexural performance under service conditions. However, the presence of residual stresses at the surface could potentially accelerate corrosion or cause other negative effects. These aspects merit further investigation.
The obtained results do not allow a definitive answer to the question of which pitch value corresponds to the formation of a tight spiral. From a practical point of view, this boundary is to some extent subjective. The experimental study showed that there is no clear transition in either the observed deformation patterns or in the applied torque that could serve as a reliable criterion. Nevertheless, the stress analysis from the numerical study allows the twist pitches to be grouped into three categories: large, intermediate, and small, but no exact boundaries can be defined between them. The influence of pitch is most clearly assessable in the residual stress diagrams shown in
Figure 14. These diagrams reveal a distinct change in shape at twist pitch
= 17 mm, which can be considered as the objective onset of tight spiral formation.
8. Conclusions
Using a verified FEM model, the stresses and deformations arising in a twisted pair of steel wires were successfully obtained and analyzed. It was found that, for tight twist pitches, the maximum stresses reach very high values, significantly exceeding the yield strength of the material. In contrast, the residual stresses remain within narrower limits and are less sensitive to pitch variation. Future research may provide further insight into how the resulting residual stresses and plastic deformations affect the performance of the twisted pair, including mechanical integrity and corrosion resistance.
