Article

The Study on the Relation Between Rock Indentation Crater Morphology and Rock Mechanical Index Based on Indentation Experiments

1
School of Automation, China University of Geosciences, Wuhan 430074, China
2
Hubei Key Laboratory of Advanced Control and Intelligent Automation for Complex Systems, Wuhan 430074, China
3
Engineering Research Center of Intelligent Technology for Geo-Exploration, Ministry of Education, Wuhan 430074, China
4
Faculty of Engineering, China University of Geosciences, Wuhan 430074, China
5
National Center for International Research on Deep Earth Drilling and Resource Development, Wuhan 430074, China
*
Author to whom correspondence should be addressed.
Appl. Sci. 2025, 15(17), 9410; https://doi.org/10.3390/app15179410
Submission received: 20 July 2025 / Revised: 25 August 2025 / Accepted: 26 August 2025 / Published: 27 August 2025

Abstract

Understanding rock behavior under cutting tools is critical for enhancing cutting processes and forecasting rock behavior in engineering contexts. This study examines the link between mechanical properties and indentation crater morphology of six rocks using a conical indenter until initial fracture. Through indentation testing, mechanical properties (indentation stiffness index k and hardness index HI) were assessed, and crater morphology was analyzed using a 3D laser profilometer. The rocks were categorized into three groups based on specific energy: Class I (slate, shale), Class II (sandstone, marble), and Class III (granite, gneiss). The morphological features of their indentation craters were analyzed both quantitatively and qualitatively. The linear model was used to establish the relationship between crater morphology indices and mechanical properties, with model parameters determined by linear regression. Key findings include: (1) Fracture depth, cross-sectional area, and contour roundness are independent morphological indicators, serving as characteristic parameters for crater morphology, with qualitative and quantitative analyses showing consistency; (2) Post-classification linear fitting revealed statistically significant morphological prediction models, though patterns varied across rock categories due to inherent properties like structure and grain homogeneity; (3) Classification by specific energy revealed distinct mechanical and morphological differences, with significant linear relationships established for all three indicators in Classes II and III, but only roundness showing significance in Class I (non-significant for cross-sectional area and depth). However, all significant models exhibited limited explanatory power (R2 = 0.220–0.635), likely due to constrained sample sizes. Future studies should expand sample sizes to refine these findings.

1. Introduction

With the increasing global demand for energy and mineral resources, drilling technology, as a pivotal component of geological exploration, oil and gas extraction, geothermal development, and subterranean construction, assumes ever-growing significance [1]. Particularly in rapid advancement towards automation and intelligence in drilling operations, a profound understanding of the interaction between drill bits and rock formations becomes critical for optimizing drilling processes and enhancing operational efficiency. Against this backdrop, this study zeroes in on the intrinsic correlation between rock mechanical properties and indentation crater morphology, aiming to furnish guidelines for drill bit design and drilling parameter optimization, thereby contributing to the enhancement of drilling efficiency [2,3,4].
Rock fragmentation in drilling primarily occurs through drill bit pressure, where cutting teeth penetrate the rock, causing localized fractures. While indentation tests cannot fully replicate the complete cutting-induced fracture process, they provide valuable insights into localized fracture mechanisms. Supported by extensive literature [5,6,7,8], these tests effectively simulate cutter-induced fracture while offering practical laboratory advantages. The resulting indentation craters directly indicate rock properties and fracture characteristics, enabling us to evaluate breakage efficiency and infer underlying mechanisms [9].
Indentation crater studies encompass three primary aspects: the geometric characteristics of the indentation crater, the surface morphology, and the fractured residual zone beneath the indentation crater. Geometric characteristics, such as volume, depth, contour circumference, diameter, and projected area of the indentation crater, are commonly employed to assess the efficiency of rock breakage under the action of an indenter [10,11,12]. Surface morphology, defined by the undulation state and regularity of the indentation crater’s surface, facilitates the evaluation of rock damage patterns [13], where the distinction between plastic and brittle failure modes can be discerned through the geometry of the crater edges [14,15]. The fractured residual zone, rich in cracks, is indispensable for unraveling the mechanics of rock fragmentation, allowing for a deeper investigation into crack propagation dynamics influenced by rock microstructure and composition [14]. Collectively, the indentation crater emerges as a pivotal object for assessing breakage efficiency and elucidating fracture mechanisms [1,16,17].
Regarding methodologies for capturing indentation crater morphology, conventional volumetric and depth measurements through filling or direct measurement [18] are straightforward but susceptible to inaccuracies, particularly due to potential underestimation with solid filling and overestimation with fluid filling [19]. Thin-section analysis provides precise results for specific cross-sections but falls short in offering comprehensive insights into the crater, making it more suitable for qualitative assessments [19]. In contrast, non-contact three-dimensional reconstruction techniques, such as computed tomography (CT) scanning and optical scanning [20,21,22], have gained prominence for their quantitative assessment capabilities across multiple orientations. These methods deliver high-precision representations of fracture morphology, laying a robust foundation for accurate crater evaluations. It is noteworthy that CT images, typically grayscale, are especially adept at analyzing cracks and pores [14], while optical scanning yields colorful visible images, combined with laser measurement technology, providing three-dimensional height information of the indentation crater at lower costs than CT methods, thus presenting a superior alternative for capturing indentation morphology.
The indentation process encompasses complex interactions between indenters and rocks, with fracture outcomes contingent upon many factors, including rock properties, indenter type, loading method, and loading conditions [23,24,25]. Distinct rock physical properties dictate varying mechanical performances [26], influencing stress distributions within rocks during indentation experiments and manifesting in the morphological features of the indentation craters. Previous research has established models correlating indentation crater depth and apex angle, with Poisson’s ratio and internal friction angle of rocks [27], along with linear relationships between rock roughness index and tensile strength [28], further substantiating the intimate link between fracture morphology and mechanical indicators. However, current investigations into the relationship between fracture morphology and mechanical indicators predominantly focus on the acquisition of mechanical indicators [28,29,30,31]. Within the drilling domain, assessing rock properties to inform drill bit design and evaluating cutter performance to optimize drilling parameters is paramount. Regrettably, few studies have endeavored to establish a relationship between mechanical indicators and indentation crater morphology, suggesting that such a relationship would permit the assessment of cutter suitability and the prediction of breakage efficiency, providing new insights into parameter optimization in drilling operations.
This study performed indentation tests on six different rock samples, and non-contact 3D profilometry was used to obtain high-precision data on indentation crater morphology. By categorizing rock samples, we will thoroughly analyze crater morphology characteristics from both qualitative and quantitative perspectives, thereby exploring the inherent correlation between indentation crater morphology and mechanical indicators. The ultimate objective is to develop a predictive model for indentation crater morphology to guide strategies for enhancing rock breakage efficiency and offer fresh insights into the relationship between rock properties and indentation crater characteristics. It should be noted that, given the conical or spherical shapes of many drill bit cutting teeth, or simplified models thereof, conducting indentation tests using conical or spherical indenters will provide valuable insights into the morphological features potentially produced by drill bits [32,33]. Consequently, the study will primarily concentrate on the rock response to indentation under conical indenter application.

2. Methodology

2.1. Rock Samples

Six rocks, including gneiss, marble, granite, sandstone, shale, and slate, were selected from different places to cover a wide range of rock types. To meet the requirements of the indentation test, the diameter or side length of all specimens is not less than 50 mm, and the height is not less than 50 mm. Such dimensions ensure that the shape and size of the specimen do not significantly impact the results during the press-in process. All the upper and lower surfaces used for testing are sanded and kept parallel, which ensures that crushing morphology reflects the rock’s physical properties and mechanical behavior during indentation. Some of the rock samples are shown in Figure 1.

2.2. Indentation Test

Experiments were conducted using a HYY-B tester, as shown in Figure 2a, capable of applying up to 10 kN of load, equipped with a 60° carbide conical indenter with a 1 mm2 tip area. Displacement was applied by manually controlling the hydraulic valve, which was set to a predetermined position to maintain slow movement of the indenter. To conform to realistic drilling conditions, the focus is on initial volume failure rather than complete specimen splitting. At least four replicates were performed per rock type, with care taken to avoid interference between indentation sites.
A schematic diagram of the general fracture system of the rock under a single indenter is shown in Figure 2b. The under-indenter mainly includes the crushing zone and the crack zone. The crushing zone is in high triaxial stress under the indenter, and the rock is seriously damaged. In the process of increasing pressure, this area will undergo the process of compaction and expansion and promote the propagation of surrounding cracks when the lateral cracks or radial cracks are driven by tensile stress to propagate along the curve and intersect the free surface to form chips, and volumetric failure occurs. At the same time, the crush zone will be crushed again. After that, the crushing zone under the indenter will again undergo a process of compaction and generate new chips [34]. This study mainly focuses on the indentation crater formed after the first volume crushing, which includes the crushed zone and the volumetric crushed zone.
During the experiment, the displacement and load data will be recorded in real time. Figure 2c is a schematic diagram of the indentation curve. The OA section is the elastic deformation stage, the AB section is the yield stage, and the curve drops abruptly after point B, marking the rock breakage. h0 and h are the depths of the indenter corresponding to points D and B, respectively. Based on the indentation curve, three indices were obtained: the hardness index, the indentation stiffness index, and the crushing work. The hardness index is the value of the maximum load (F), denoted by HI. The indentation stiffness index, denoted by k , is the slope of segment OB ( k O B ). It represents the combined deformation behavior during rock breakage, capturing the effects of plasticity, microcracking, creep, pore collapse, and surface compliance. The crushing work represents the total energy consumed during the test, which is numerically equal to the area enclosed by curve OABC in the load-displacement diagram (SOABC). The specific energy is then calculated by dividing this total crushing work by the volume of the crushed crater.

2.3. 3D Topography Measurement

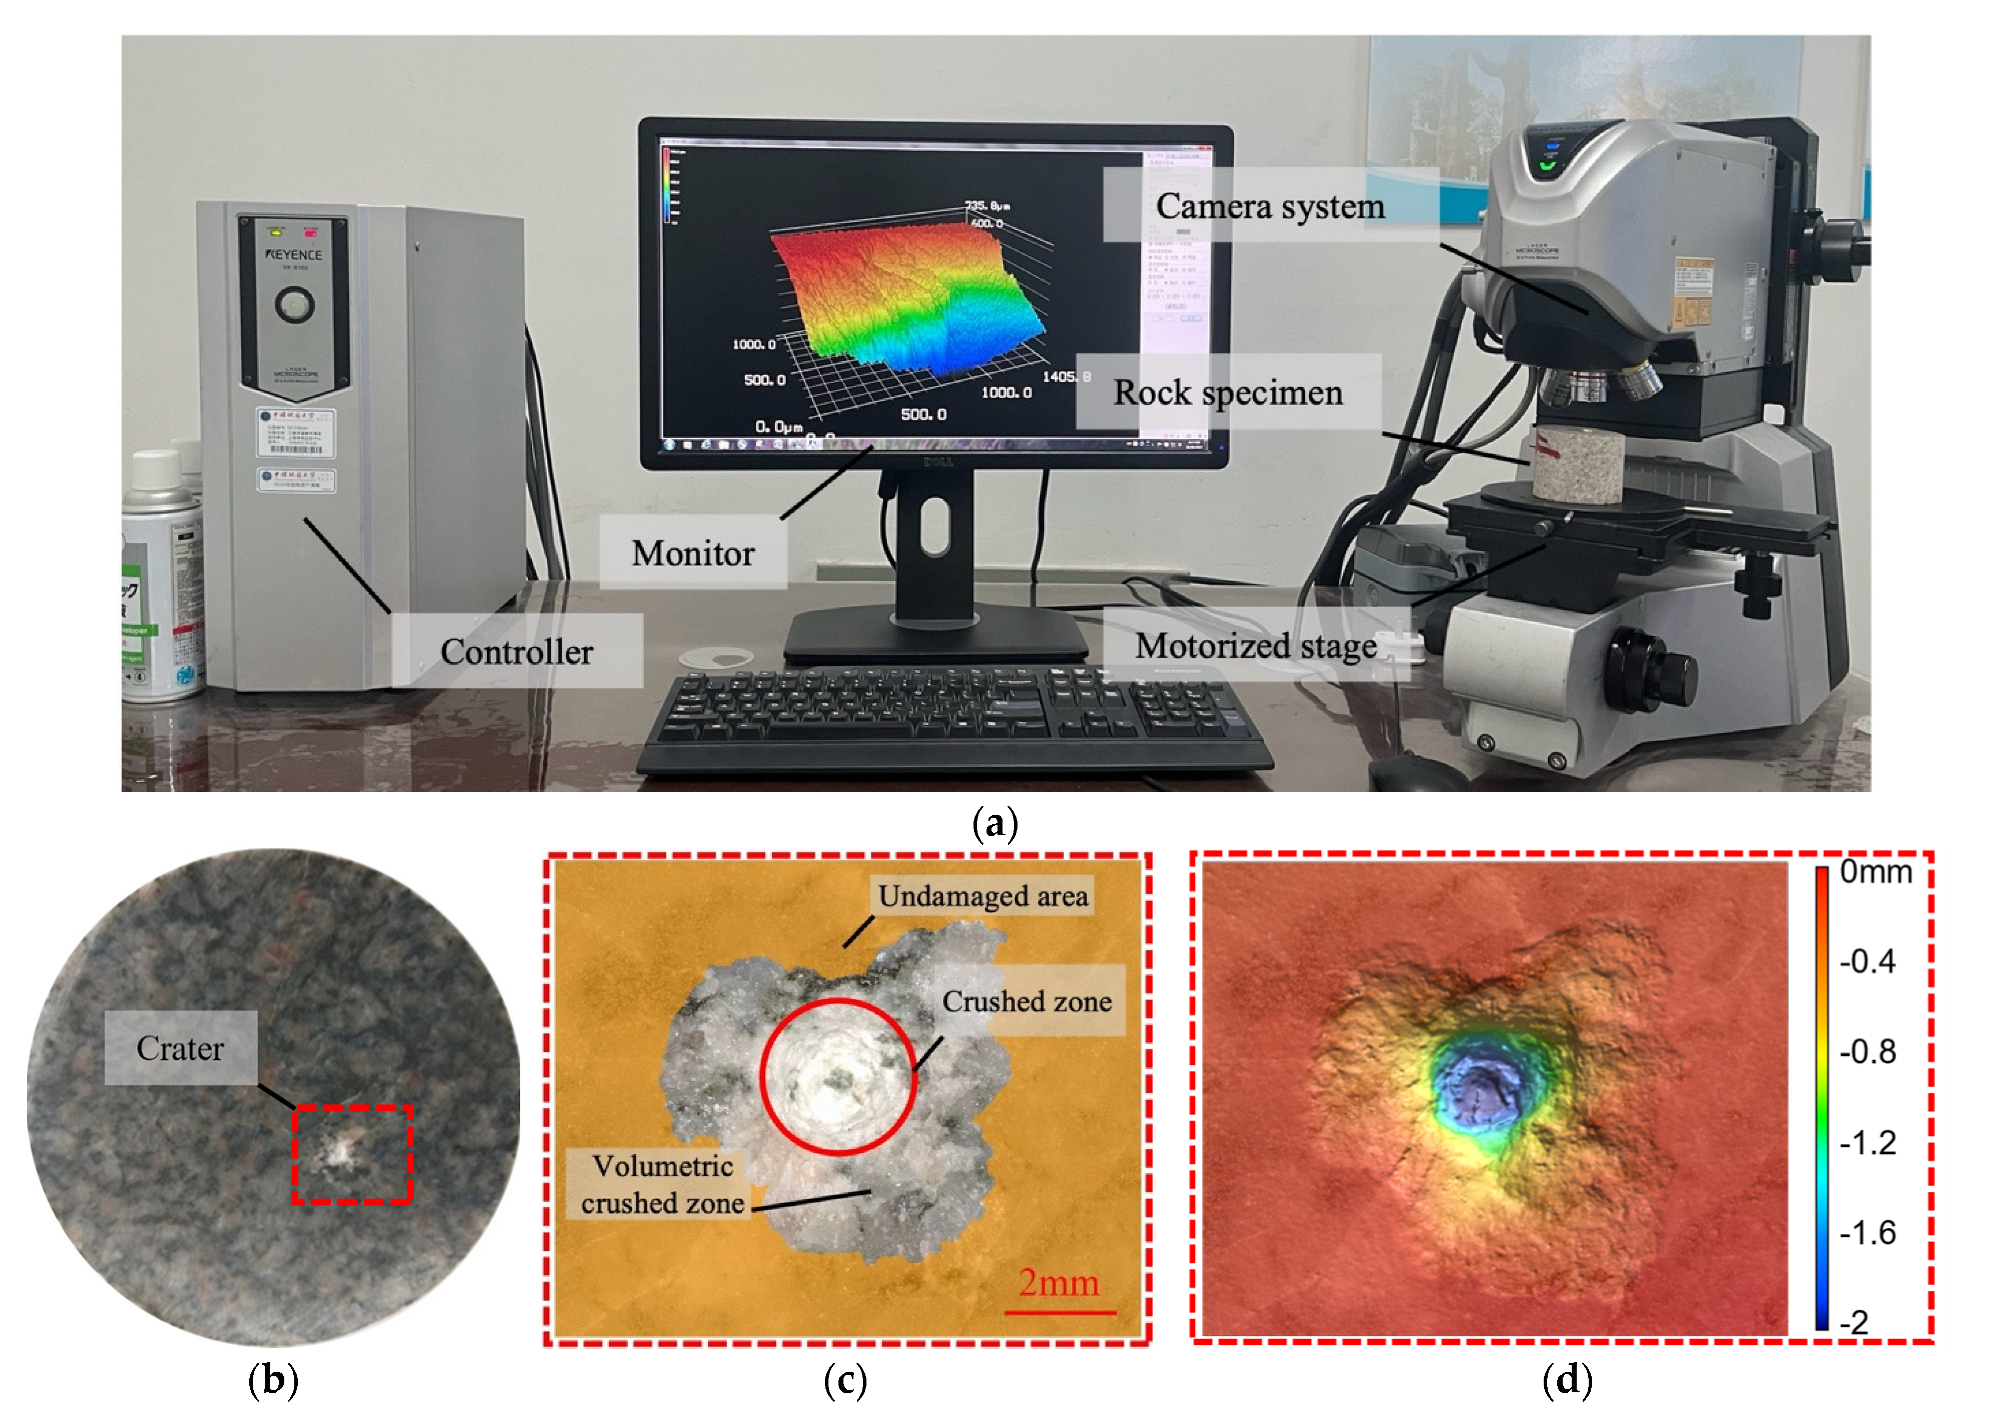
After the indentation experiment is completed and the fragments on the rock surface are removed, the VK-X3000 non-contact profilometer (Keyence, Osaka, Japan, as shown in Figure 3a) is selected to obtain the 3D topography of the indentation crater. The profilometer is based on the optical principle and has a measuring range of approximately 200 × 100 mm and a depth of up to 50 mm. Color visible images and 3D height images can be scanned in minutes. The obtained color visible image and 3D height image are shown in Figure 3c and Figure 3d, respectively. The built-in analysis software of the profilometer allows the acquisition of various topography indicators for the analysis of indentation crater topography. This study evaluated morphology at 12× magnification with an accuracy of 11.75 μm for horizontal and 1 μm for vertical measurements. The measurement accuracy is ensured, and the measuring range of the instrument is large enough relative to the indentation crater.

3. Results & Discussion

We conducted a total of 42 valid indentation tests, with the number of samples for each rock type detailed in Table 1. Based on this data, we first categorized the rocks by their fragmentation index. We then analyzed their mechanical and morphological properties before finally examining the relationship between these two sets of characteristics.

3.1. Rock Classification

To classify the rocks, we used three key indicators that reflect fracture efficiency [35]: maximum crushing depth, indentation crater volume, and specific energy (SE). As shown in Figure 4, the scatter points represent experimental data for each rock category, with bold black lines indicating the mean values and the shorter lines above and below representing standard deviations. The rock types are sorted in ascending order based on their mean values.
The analysis of the three crushing indicators revealed relatively small differences in mean values for both crushing depth and crater volume, with significant data variability observed within each rock type. In contrast, while similar dispersion existed, the mean values of SE showed distinct variations across different rock types. Qualitative observations led to grouping the six rock types into three categories: Class I (slate and shale) exhibiting the lowest SE (indicating easiest crushability), Class II (sandstone and marble) with intermediate values, and Class III (gneiss and granite) demonstrating the highest SE (representing the most difficult to crush).
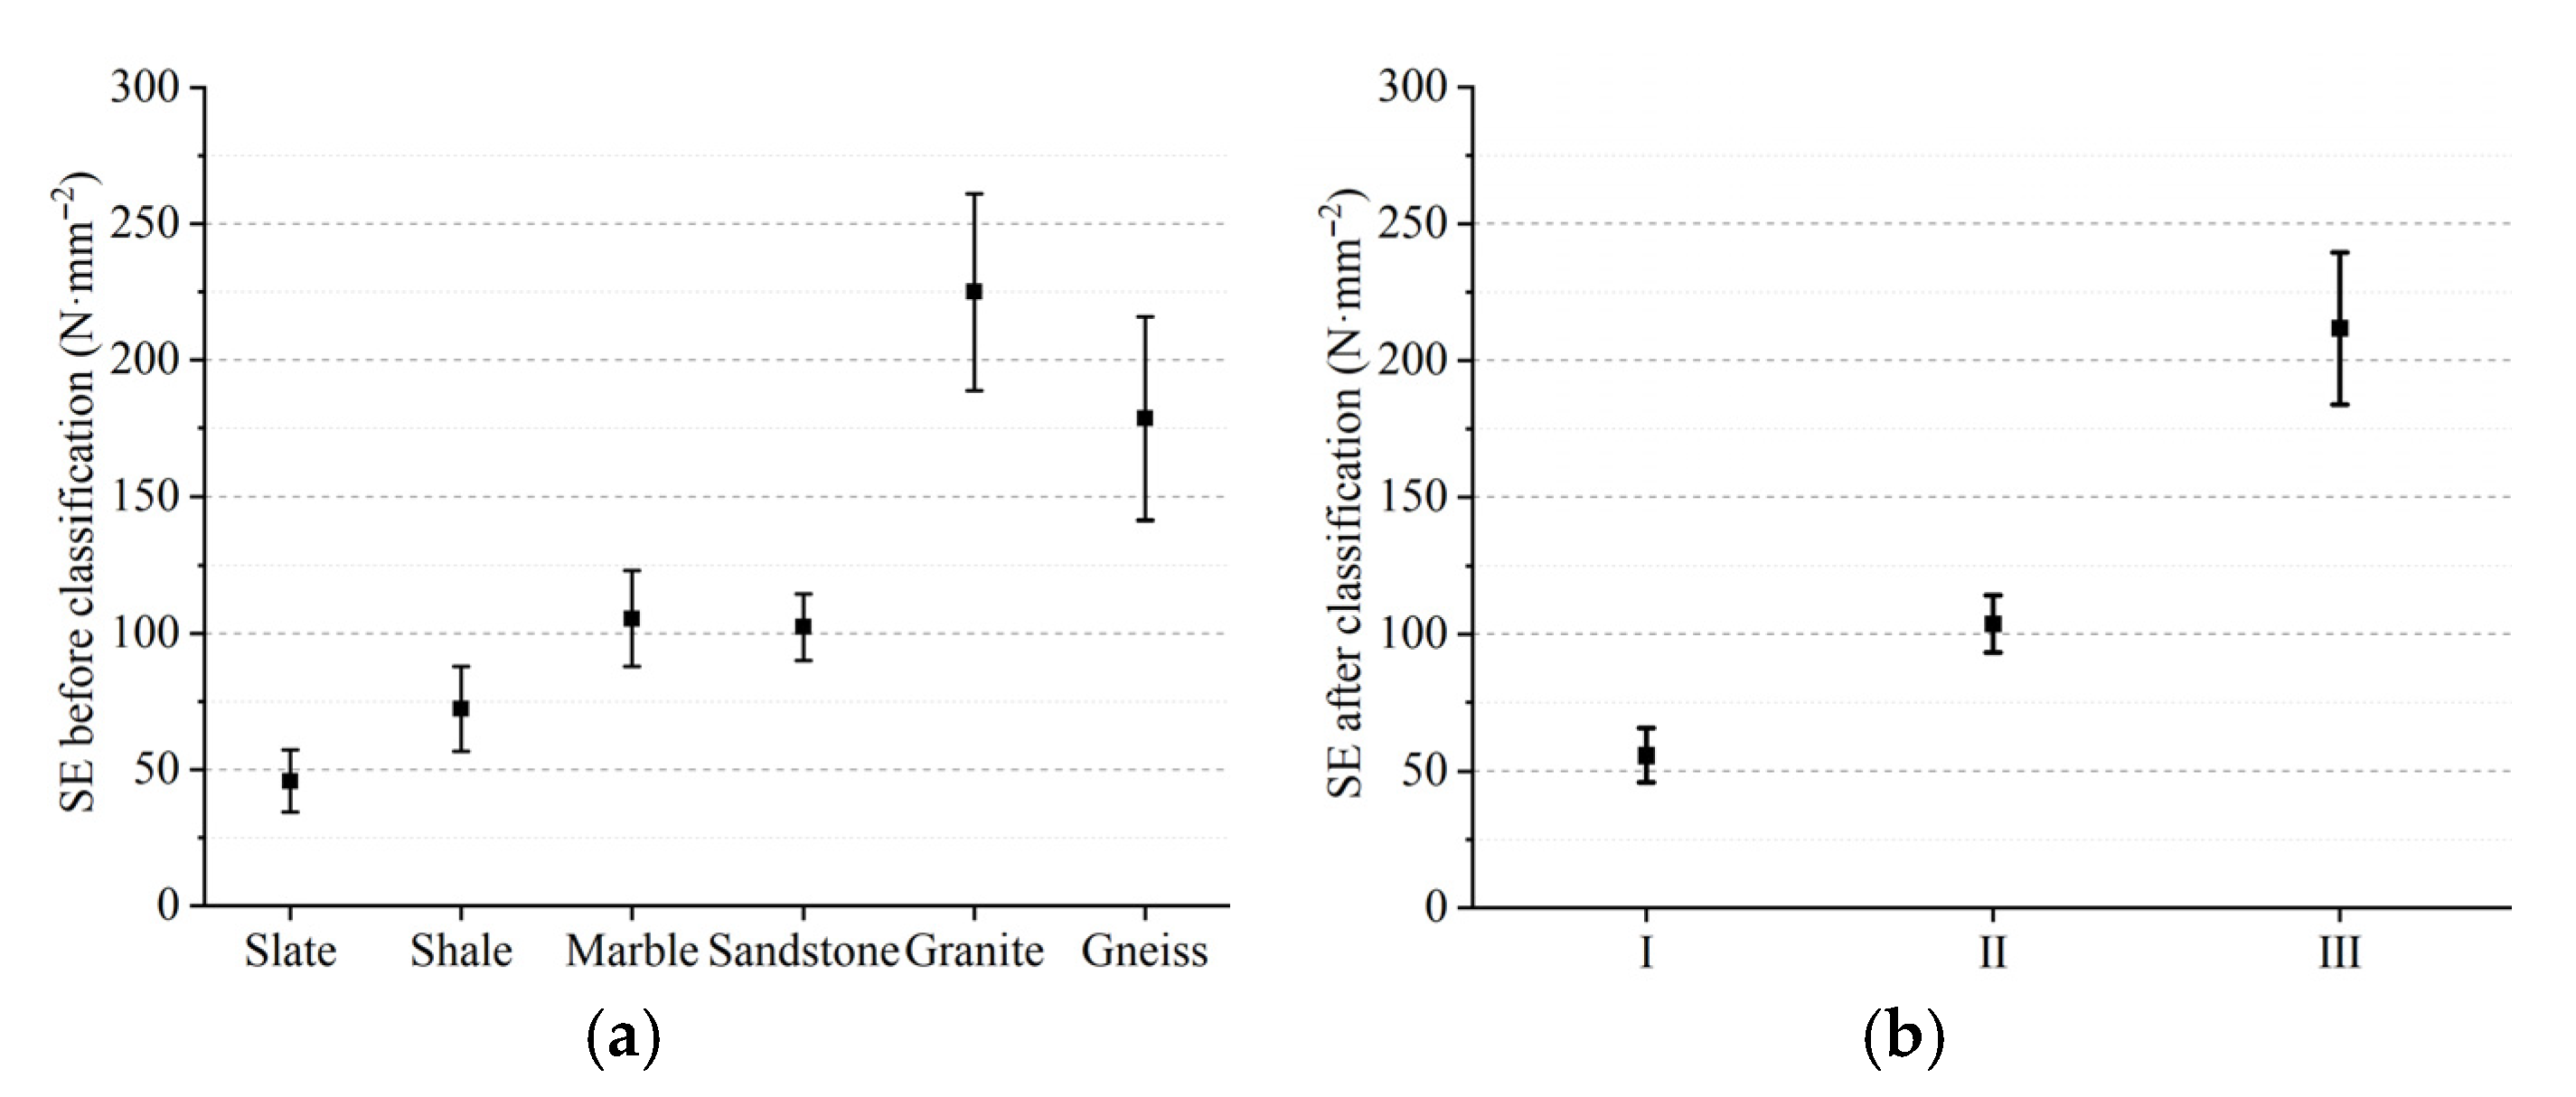
The one-way ANOVA results (as shown in Table 2) confirmed that prior to classification, only SE showed statistical significance, consistent with the observations in Figure 4. After classification, the inter-group differences became markedly more significant (p = 9.39 × 10⁻⁶ vs. 2.44 × 10⁻⁴), with test power approaching 1 (0.999). Although homogeneity of variance remained unchanged, these results strongly support the validity of the classification scheme. Figure 5 clearly shows increased inter-class separation and reduced intra-class mean errors after classification.
The boundaries between the three classes were determined based on the mean and standard deviation of the SE for each class. The 95% confidence intervals were calculated, and the boundaries were defined as the midpoints between the endpoints of the confidence intervals of the means of two adjacent classes. Table 3 presents the key statistical values used to determine the boundaries: the mean, standard deviation, t-critical value, and the calculated confidence intervals. After calculation, the boundary between Class I and Class II is approximately 80.50, and that between Class II and Class III is approximately 138.68. For ease of application, these two boundary values were rounded to 80 and 140. This process rigorously validates the classification boundaries from a statistical perspective. Table 4 displays the range of SE for each type. This classification system successfully distinguishes rock types while revealing their crushing efficiency variations, establishing a solid foundation for subsequent rock fragmentation morphology analysis.

3.2. Mechanical Index Results

Figure 6 shows the indentation hardness test curves for six types of rocks. The horizontal axis represents indentation depth, while the vertical axis shows the corresponding load as the indenter moves. Red hollow circles mark the maximum load value for each curve, which determines the hardness and indentation stiffness index used in this study.
The load-displacement curves from indentation tests reveal systematic differences in fracture behavior among three rock types. For Class I (Figure 6a,b), smooth pre-peak curves indicate progressive plastic deformation and stable micro-crack propagation within their layered structures or weak mineral components, demonstrating continuous energy absorption. This observation aligns with their minimal specific fracture energy, supporting a ductile-dominated damage mechanism. In contrast, Class III (Figure 6e,f) exhibits pronounced fluctuations and step-like changes before peak load, reflecting abrupt brittle fractures at hard mineral grain boundaries (e.g., quartz, feldspar). Their high-strength structures induce discontinuous energy release, corresponding to the maximum fracture energy. Class II (Figure 6c,d) displays localized curve fluctuations but maintains stable overall slopes, suggesting limited micro-fractures at cementation interfaces or crystal boundaries absorbed by the matrix. This behavior demonstrates a brittle-plastic transition, with intermediate fracture energy values. Collectively, these curve patterns distinguish internal damage evolution modes (continuous/d134iscontinuous) and hierarchical fracture resistance.
Figure 7 presents the statistical results of hardness and indentation stiffness index for the three classified rock types. Significant differences are evident in both properties across the categories, with a progressive increase observed in their values. This trend indicates that the hardness and indentation stiffness index correlate positively with increasing SE. Overall, these mechanical properties demonstrate that the rock classification method applied in this study is well-founded.

3.3. Selection and Characterization of Morphological Parameters

3.3.1. Correlation Analysis of Morphological Parameters

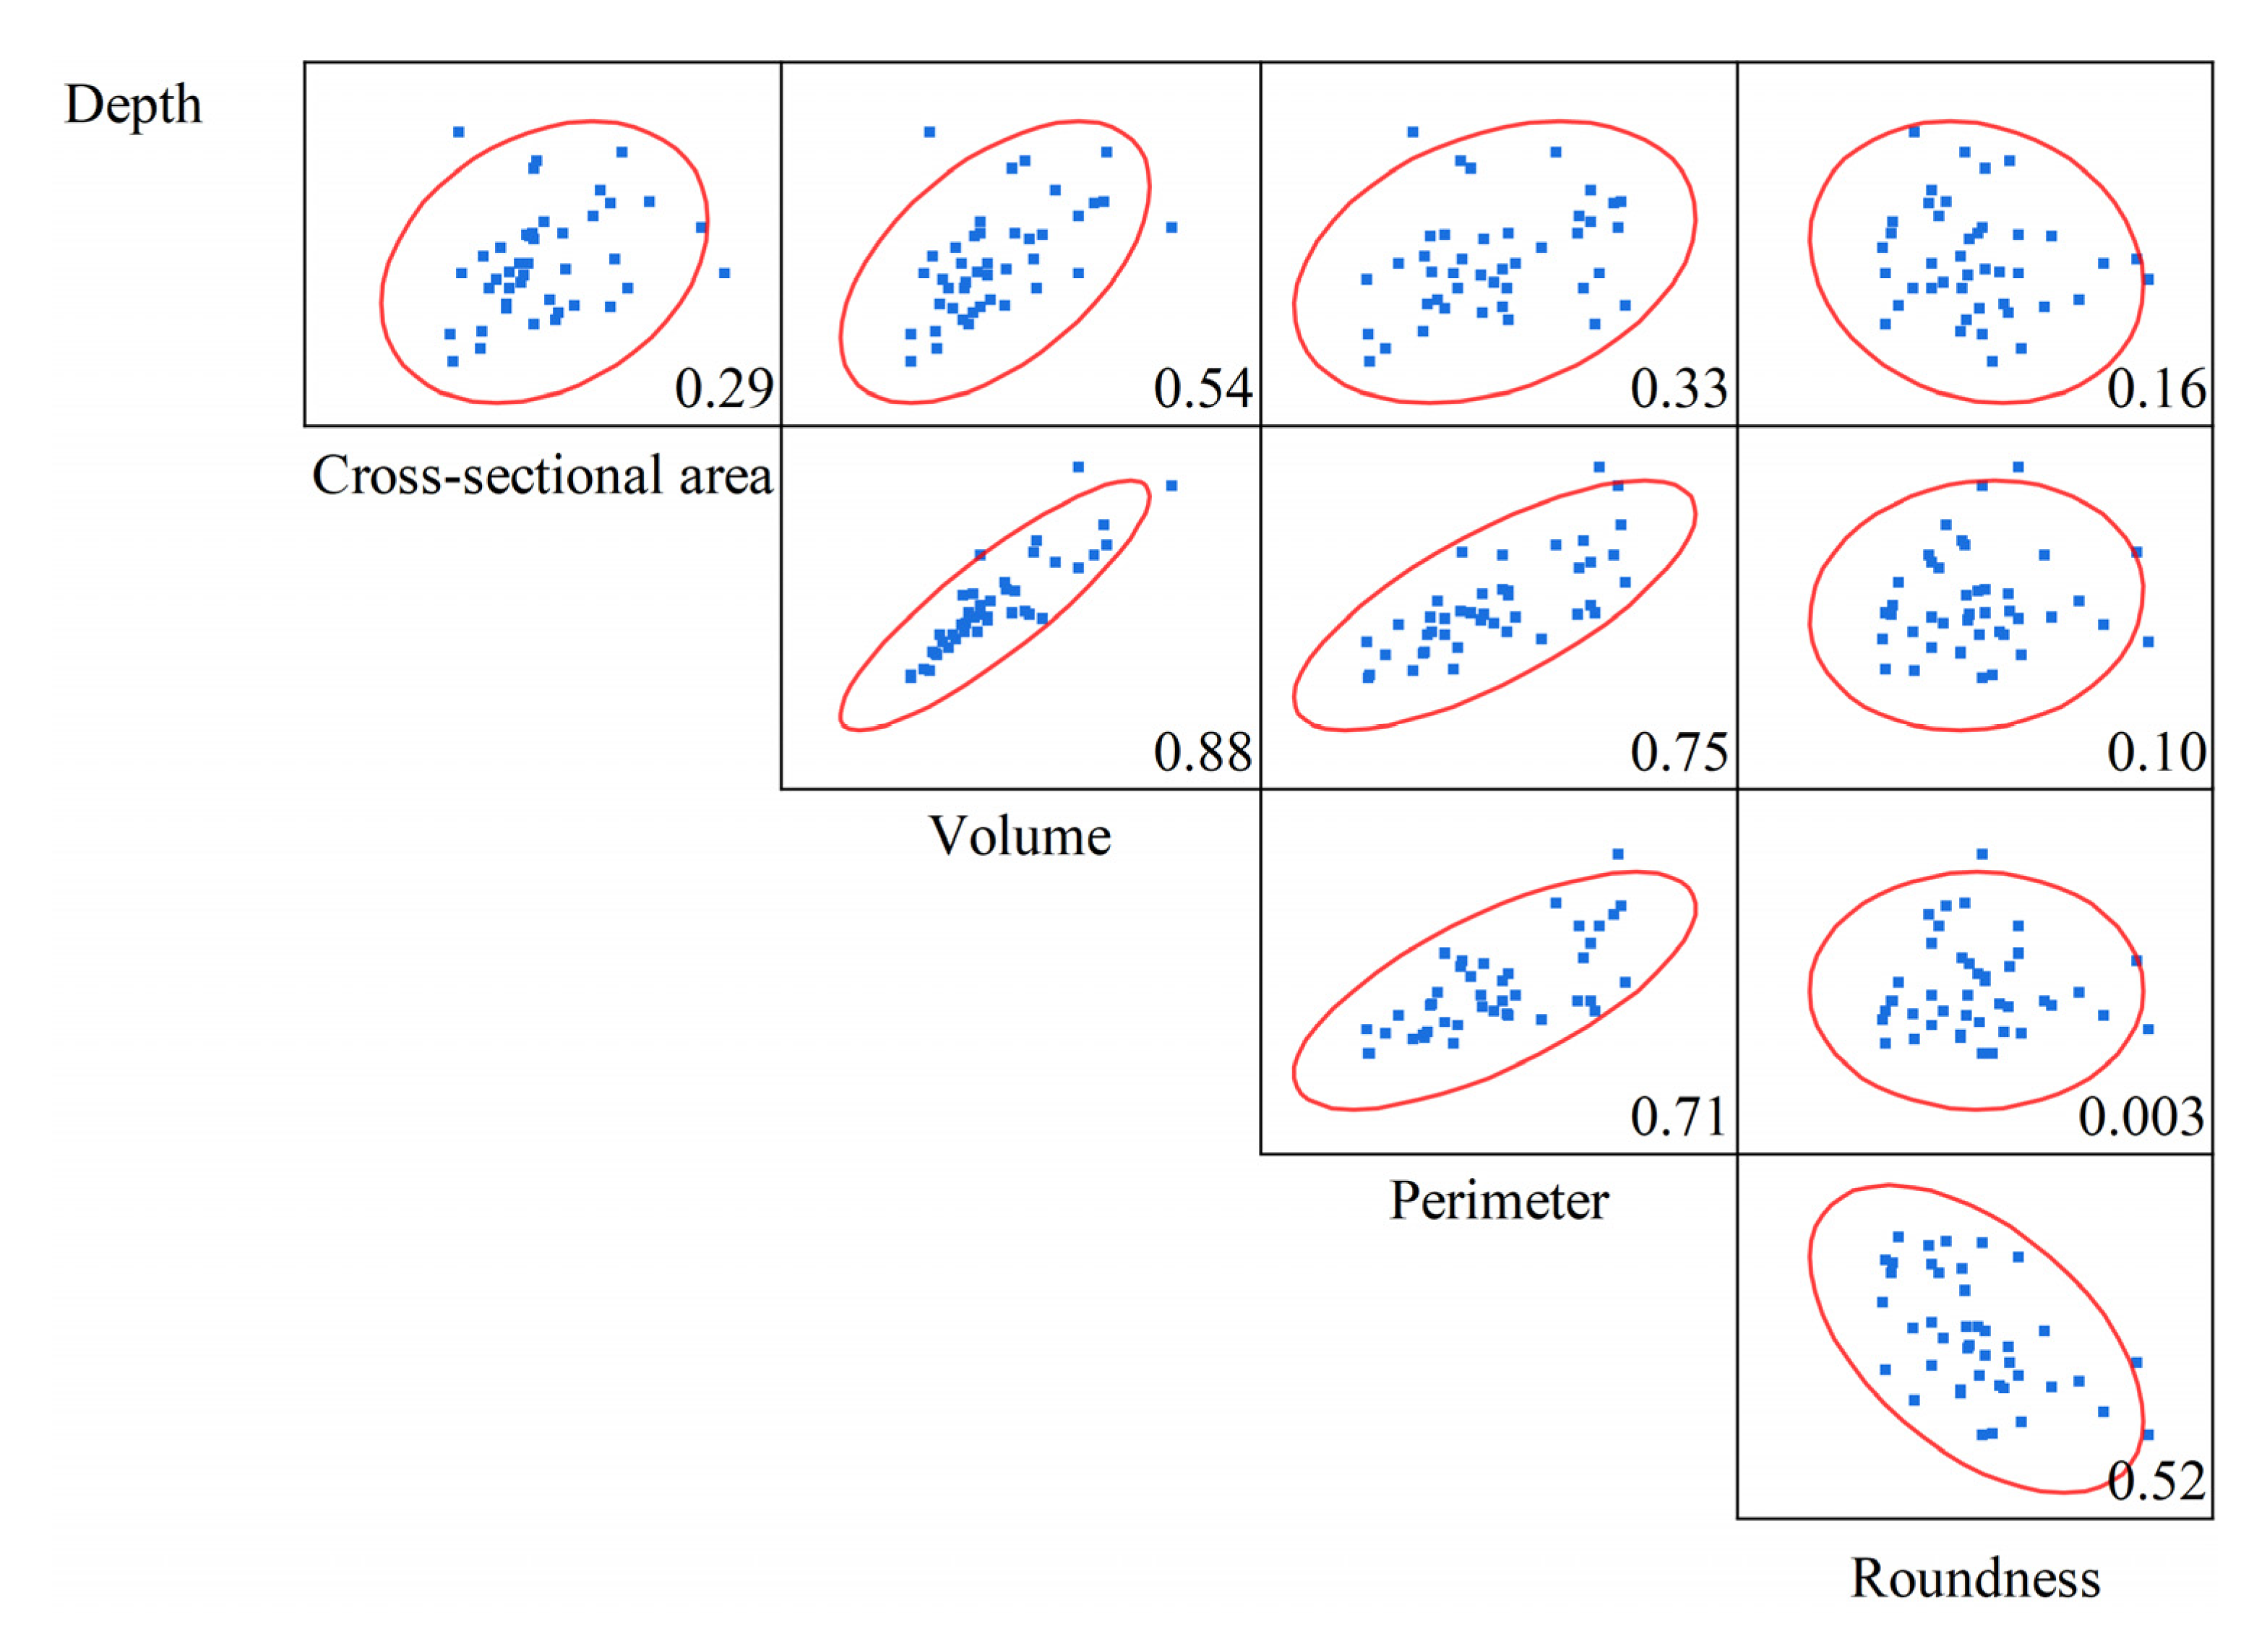
The profilometer can obtain the crushing crater’s depth, cross-sectional area, volume, contour perimeter, and contour roundness. However, since some correlations may exist between these indicators, we first calculated the correlations between the morphology parameters to avoid redundant analysis before conducting quantitative crater morphology analysis. Figure 8 displays the correlation coefficients and confidence ellipses for each parameter pair. The analysis showed significant correlations between depth and both crushing volume and contour perimeter, as well as between cross-sectional area and both crushing volume and contour perimeter. Contour perimeter itself correlated significantly with roundness. The strongest correlation (0.88) existed between cross-sectional area and crushing volume. Other notable correlations included contour perimeter with cross-sectional area (0.75), crushing volume (0.71), and roundness (−0.52). While statistically significant, the correlations between crushing depth and perimeter (0.33) and between roundness and perimeter (−0.52) were relatively weak. To align with qualitative crater contour analysis, roundness was retained as a morphological indicator. Consequently, depth, cross-sectional area, and contour roundness were selected as the key morphological indicators.

3.3.2. Crater Morphological Analysis

Figure 9 shows the data distribution for the different categories of selected topography indicators. The three indices are different in various types of rocks. Specifically, Class III rocks have the largest crushing depth, and Class I and II have similar crushing depths. The cross-sectional area and contour roundness of Class I are the largest, while Class II rocks and Class III are similar in roundness and cross-sectional area. The difference between these morphology indicators suggests that these indicators can be used as useful indicators to evaluate the crushing effect. In addition, the analysis results of the contour roundness of the fracture profile suggest that the crushing process of the first type of rock may be more inclined to form circular indentation craters. In contrast, the other two types of rocks may form more irregularly shaped indentation craters.
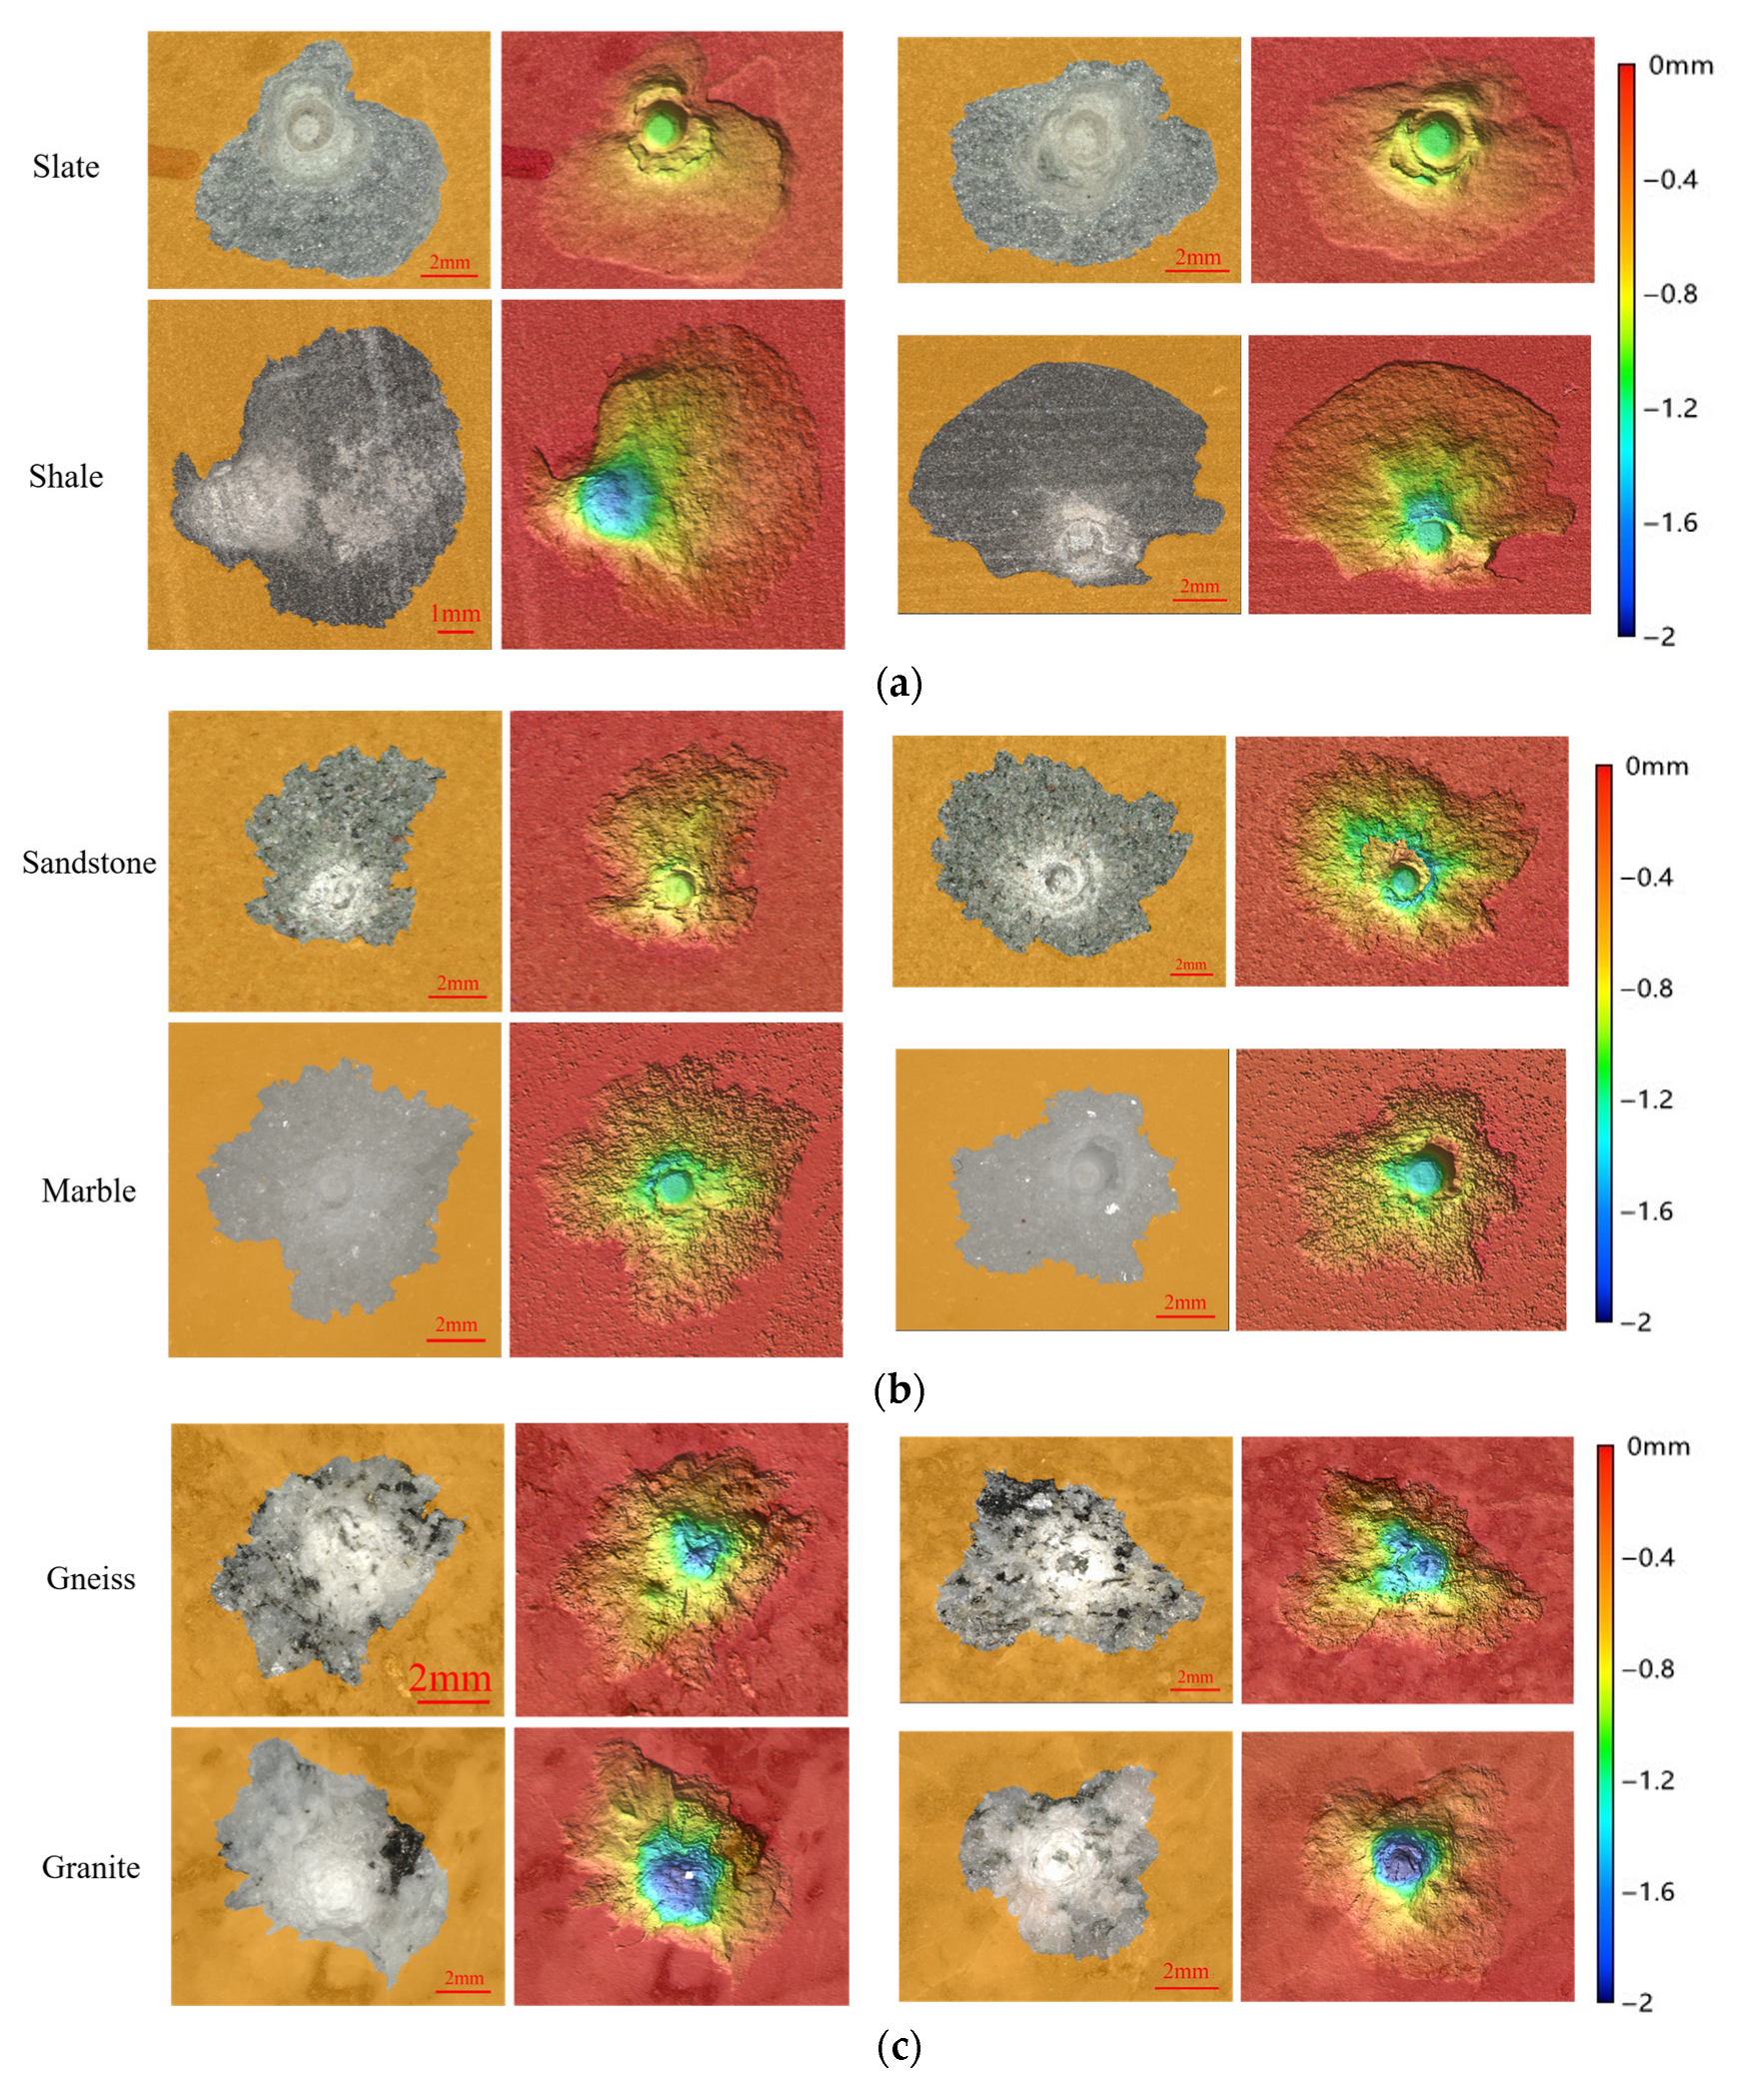
As shown in Figure 10, the typical crushing crater morphologies of six rock types are presented, with each rock type containing two craters. For each crater, both a 3D height map (right) and a visible-light color image (left) are provided. The 3D height maps show that Class III craters exhibit darker blue coloration at their bottoms, indicating greater crushing depths—a finding consistent with the previous quantitative analysis. Additionally, Class I rock crushing craters exhibit nearly circular contours, while Classes II and III show irregular contours. Quantitative contour roundness measurements confirm that Class I has the highest roundness values, with Classes II and III showing significantly lower values. Observations of indentation features demonstrate that complete circular indenter marks remain visible at the crater bottom of Class I, while no residual marks exist in Class III, and Class II exhibits partial marks. Visible light images show that Class I features a uniform, fine-grained mineral structure, whereas Class III presents an uneven mineral distribution.
Contour irregularity primarily originates from disordered stress distribution caused by rock heterogeneity, along with disruption of elastoplastic boundaries due to lateral accumulation of crushed material [1]. Uniform mineral structure and fine-grained characteristics (Class I) promote axisymmetric crack propagation, forming smooth circular contours. Coarse and unevenly distributed mineral grains (Classes II and III) cause crack paths to deviate from the symmetrical axis, resulting in irregular contours [4].
Differences in indentation mark completeness reflect variations in deformation behavior within the contact zone. Class I rocks, dominated by elastic recovery and brittle spalling, therefore retain complete indenter shapes. Class III exhibits complete obscuration of marks due to plastic flow and debris backfilling. Class II demonstrates transitional elastoplastic behavior.
From an energy perspective, low-energy Class I forms shallow-wide craters through radial crack propagation, while high-energy Class III generates deep-narrow craters via axial plastic deformation and deep-shear. Ultimately, macroscale crack path symmetry controls contour roundness, whereas microscale deformation behavior in the contact zone determines indentation mark retention.

3.4. Relationship Between Mechanical Indicators and Crater Morphology

Based on the selected mechanical indicators (HI and k) and morphological parameters (cross-sectional area, crushing depth, and surface contour roundness), we established linear relationship models between them and compared the fitting effects before and after classification (The fitting results are summarized in Table 5). Initially, the overall fitting results for all unclassified data (Class 0) showed a general lack of significant linear relationships between mechanical indicators and morphological parameters. The only exception was the model between hardness index (HI) and crushing depth, which showed statistical significance (p = 0.0007), but its goodness-of-fit (R2) was only 0.2523. All other combinations of models were not significant (p-value > 0.05), with very low R2 values not exceeding 0.1. This indicates that when all rock types are treated as a single group, it is difficult to observe clear linear correlations between mechanical indicators and morphological parameters.
After classification analysis (Classes I, II, and III), the situation changed significantly. In specific rock subclasses, some previously weak or insignificant linear relationships became significant and clearer. For example, for HI and crushing cross-sectional area, the models for Class II and Class III became significant (p-values of 0.0327 and 0.0055, respectively), with R2 values (0.229 and 0.487) much higher than the unclassified result of 0.02309. Although the model between k and crushing cross-sectional area remained insignificant after classification, the relationship between crushing depth and mechanical indicators improved. The relationship between HI and depth remained significant in Class II (p = 0.0099), with a slightly higher R2 (0.3160) than the unclassified result. More importantly, the relationship between k and depth became significant in Class III (p = 0.0185), with its R2 (0.382) much higher than the weak 0.0156 in the unclassified data. For surface contour roundness, although its models with HI did not reach significance after classification, Class I showed a relatively high R2 (0.436) and a p-value (0.0747) close to significance, with the small sample size (n = 8) possibly being a contributing factor. The relationship between roundness and k strengthened noticeably after classification, with models for Class I and Class II becoming significant (p-values of 0.01792 and 0.03708, respectively), and Class I showing a very high goodness-of-fit (R2 = 0.635). The model for Class III, while not reaching statistical significance (p = 0.0685), approached the threshold and demonstrated substantially improved explanatory power with an R2 of 0.2503 compared to the unclassified result’s weak 0.058.
Overall, classification modeling effectively revealed hidden patterns in the data. Relationships that were insignificant or weak in the unclassified state showed significant statistical meaning and higher goodness-of-fit in specific subclasses. Even the HI-depth relationship, which was already significant in the unclassified data, remained significant in relevant subclasses with improved fitting. These results clearly demonstrate that establishing models after classification based on SE is more effective than overall modeling in revealing potential connections between mechanical indicators and morphological parameters.
Figure 11 and Figure 12 show the scatter plot and linear fitting results between the HI and k and morphological parameters, respectively.
For Class I rocks (shale and slate), k showed a significant positive correlation with roundness (slope 1.9471 × 10⁻⁴, R2 = 0.635). This is primarily because shale and slate have layered structures and low SE, making them prone to brittle fractures along bedding planes. When k increases (indicating higher contact stiffness), the rock’s resistance to deformation increases, resulting in more uniform stress distribution during indentation that reduces localized irregular fractures, thereby forming more regular circular crushing craters (increased roundness). This phenomenon aligns with the energy release characteristics of low SE rocks—stiffer rocks tend to release energy more concentratedly during fracture, creating smoother fracture surfaces.
In Class II rocks (sandstone and marble), all three combinations showed significant correlations. First, HI positively correlated with cross-sectional area (slope 0.0167, R2 = 0.229), because the granular or crystalline structures of sandstone and marble with medium SE require higher loads to initiate fracture. When HI increases, the greater rock strength and indentation energy lead to larger fracture volumes and consequently increased cross-sectional areas. Second, HI also positively correlated with depth (slope 3.6789 × 10⁻⁴, R2 = 0.316), attributable to the mechanical response during indentation—higher maximum loads directly drive the indenter deeper into the rock, especially for medium-hardness rocks with higher plastic deformation components, where increased load effectively promotes deeper material failure. Finally, k negatively correlated with roundness (slope −1.1214 × 10⁻⁴, R2 = 0.220), reflecting the negative impact of high stiffness on fracture morphology. As k increases (signifying greater stiffness), the rock’s behavior, combined with its heterogeneous granular structure, tends to produce irregular fractures (like grain detachment) under high pressure, reducing roundness. This indicates that for medium SE rocks, increased stiffness exacerbates localized brittle failure and compromises fracture surface regularity.
For Class III rocks (gneiss and granite), two combinations were significant. HI positively correlated with cross-sectional area (slope 0.0151, R2 = 0.487), similar to Class II but stronger. Gneiss and granite have high SE and dense crystalline structures—high HI values (greater strength) mean fracture requires more energy, leading to more extensive microcrack propagation and material removal that increases cross-sectional area. Additionally, k negatively correlated with depth (slope −4.3073 × 10⁻⁴, R2 = 0.382), highlighting the brittle behavior of high-stiffness rocks—when k increases (indicating greater stiffness), the rock tends to undergo brittle fracture near the surface rather than deeper plastic deformation, resulting in reduced crushing depth. This matches the energy absorption characteristics of high SE rocks—the high stiffness makes energy release rapid during indentation, preferentially producing shallow fractures.
Overall, these patterns originate from the inherent properties of rocks classified by SE. The significant relationships in low SE rocks (e.g., shale) are dominated by layered structures, medium SE rocks (e.g., sandstone) show responses influenced by granular heterogeneity where increasing mechanical parameters may simultaneously enhance and compromise morphological regularity, while high SE rocks (e.g., granite) demonstrate how high stiffness and brittleness inhibit crushing depth. Among all significant combinations, the generally low R2 values (0.220–0.635) indicate that other unmeasured factors (like micro-defects or loading rate) also affect morphology, though the linear models have captured the core mechanisms.
Table 6 summarizes predictive models for morphological indicators across the three rock classes. The results indicate that, except for Class I rocks, statistically significant predictive models could be established for the other rock types. Additionally, it is shown that both the hardness and stiffness indices can be used to predict fracture morphology, with varying degrees of success across different morphological parameters. Furthermore, although some of the fitted relationships exhibit relatively low R2 values, they remain statistically significant and thus provide meaningful guidance for interpretation.
The predictive potential of these correlations varies substantially depending on the R2 values. For instance, stronger correlations, such as the R2 of 0.635 for k-roundness in Class I rocks, are considered highly important and applicable for predictive modeling. Given the complex nature of rocks, where numerous unmeasured confounding factors are common, an R2 value of around 0.6 accounts for a substantial proportion of the variance. Models derived from such relationships can reliably predict the direction and approximate magnitude of outcomes, offering valuable preliminary insights into penetration-induced fragmentation morphology.
In cases with moderate correlations, such as the R2 of 0.316 for HI-depth in Class II rocks, the R2 of 0.382 for k-depth in Class III rocks, and the R2 of 0.487 for HI-cross-sectional area in Class III rocks, the relationships are significant but suggest that other influencing factors are involved. These models are more suitable for explaining associative trends rather than yielding precise quantitative predictions. They underscore the relevance of the mechanical indicators used in this study as key factors, although their predictive use entails larger error margins.
Weaker correlations, such as the R2 of 0.229 for HI-cross-sectional area in Class II rocks, the R2 of 0.220 for HI-roundness in Class II rocks, and the R2 of 0.250 for k-roundness in Class III rocks, though statistically significant, explain only a limited portion of the variance. These are presented primarily to indicate potential influencing trends that merit further investigation through more targeted experimental approaches or alternative methodologies.
Given the inherent complexity of rocks and their fragmentation behavior, future studies should prioritize expanding sample sizes to address missing predictive models, particularly for Class I, and to refine existing models for improved explanatory and predictive performance.

4. Conclusions

This study focused on the response characteristics of indentation-indentation craters of six rock types under the conical indenter. The rocks were divided into three categories according to the specific energy (+SE) of crushing, and on this basis, the morphological characteristics of various types of rock indentation craters were quantitatively and qualitatively studied, and the relationship between the morphological indexes of indentation craters and the hardness index (HI) and indentation stiffness index (k) was analyzed. The main conclusions are as follows:
  • Quantitative studies indicate that fracture depth, cross-sectional area, and contour roundness are three independent morphological indicators that can serve as characteristic parameters for fracture crater morphology. Qualitative and quantitative analyses after classification reveal significant differences among rock types in terms of indentation state at the crater bottom, fracture surface morphology, contour roundness, and fracture depth. These differences are related to mineral distribution and localized micro-deformation: mineral distribution affects crack paths, thereby shaping distinct contour features and surface morphology, while localized micro-deformation may cause variations in crater bottom indentations. Qualitative and quantitative results are consistent.
  • Linear fitting between fracture morphology and mechanical indicators shows that multiple post-classification morphological prediction models are statistically significant. However, the same morphological indicator exhibits inconsistent patterns across categories, attributable to inherent rock properties (e.g., structure, grain homogeneity), which may influence mechanical behavior. Further research on fracture crater formation mechanisms is needed.
  • Classifying the six rocks into three types based on SE is meaningful. Post-classification, significant differences in mechanical and morphological parameters were observed, uncovering previously obscured correlations. However, due to limited data, linear fitting yielded low correlation values (0.220–0.635), and the Class I lacked significant predictive models. Future studies should expand sample sizes and experimental repetitions to refine these findings.
  • Furthermore, the rock samples used in this study were sourced from different geological regions, and thus, variations in their structural homogeneity cannot be ruled out. This heterogeneity may also contribute to the relatively low correlations observed in the results. Additionally, the indentation tests in this work were conducted using a 60° indenter angle. Future studies could investigate the influence of different indenter angles to further validate the applicability of the conclusions drawn herein.

Author Contributions

Conceptualization: Z.W., S.T., L.D. and Y.H.; methodology: Z.W., H.G., Y.Y., S.T. and X.F.; formal analysis and investigation: Z.W. and X.F.; writing—original draft preparation: Z.W.; writing—review and editing: H.G., S.T., Y.Y., Y.H. and L.D.; funding acquisition: L.D.; resources: X.F. and Y.H.; supervision: H.G. and L.D. All authors have read and agreed to the published version of the manuscript.

Funding

This research was funded by the National Key Research and Development Program of China (grant number 2023YFC3007003) and the National Natural Science Foundation of China (grant number 42272366).

Data Availability Statement

Data will be made available on request.

Acknowledgments

The authors would like to thank Hongyu Ye from Wuhan Wanbang Laser Diamond Tools Co., Ltd. for providing the profilometer to measure the 3D morphology of crushing craters. This significantly improved the efficiency of obtaining and analyzing the crater morphology.

Conflicts of Interest

The authors declare no conflicts of interest relevant to this study.

Abbreviations

The following abbreviations are used in this manuscript:
HIHardness index
k Indentation stiffness index
SESpecific energy

References

  1. Li, A.L. Rock Indentation Characteristics Induced by Spherical Button Subjected to Dynamic and Quasi-Static Loads. Rock Mech. Rock Eng. 2023, 56, 5253–5273. [Google Scholar] [CrossRef]
  2. Liu, H.Y.; Kou, S.Q.; Lindqvist, P.A.; Tang, C.A. Numerical Simulation of the Rock Fragmentation Process Induced by Indenters. Int. J. Rock Mech. Min. Sci. 2002, 39, 491–505. [Google Scholar] [CrossRef]
  3. Lindqvist, P.A.; Lai, H.H.; Alm, O. Indentation Fracture Development in Rock Continuously Observed with a Scanning Electron Microscope. Int. J. Rock Mech. Min. Sci. Geomech. Abstr. 1984, 21, 165–182. [Google Scholar] [CrossRef]
  4. Saadati, M.; Weddfelt, K.; Larsson, P.L. A Spherical Indentation Study on the Mechanical Response of Selected Rocks in the Range from Very Hard to Soft with Particular Interest to Drilling Application. Rock Mech. Rock Eng. 2020, 53, 5809–5821. [Google Scholar] [CrossRef]
  5. Mishnaevsky, L.L. Physical Mechanisms of Hard Rock Fragmentation under Mechanical Loading: A Review. Int. J. Rock Mech. Min. Sci. Geomech. Abstr. 1995, 32, 763–766. [Google Scholar] [CrossRef]
  6. Zhang, X.P.; Yang, X.M.; Xie, W.Q.; Liu, Q.S.; Tang, S.H. Comparison and Selection of Index for Macro-Indentation Test of Brittle Rock. Rock Mech. Rock Eng. 2023, 56, 6375–6394. [Google Scholar] [CrossRef]
  7. Kou, S.Q. Some Basic Problems in Rock Breakage by Blasting and by Indentation. Ph.D. Thesis, Luleå University of Technology, Luleå, Sweden, 1995. [Google Scholar]
  8. Xie, W.; Liu, X.; Zhang, X.; Yang, X.; Zhou, X. A Review of Rock Macro-Indentation: Theories, Experiments, Simulations, and Applications. J. Rock Mech. Geotech. Eng. 2024, 16, 2351–2374. [Google Scholar] [CrossRef]
  9. Liu, W.; Zhu, X.; Zhou, Y.; Li, T.; Zhang, X. Bonded-Cluster Simulation of Tool-Rock Interaction Using Advanced Discrete Element Method. Struct. Eng. Mech. 2019, 72, 469–477. [Google Scholar] [CrossRef]
  10. Song, H.; Shi, H.; Yuan, G.; Xia, Y.; Li, J.; Liu, T. Experimental Study of the Energy Transfer Efficiency and Rock Fragmentation Characteristics in Percussive Drilling. Geothermics 2022, 105, 102497. [Google Scholar] [CrossRef]
  11. Aldannawy, H.A.; Rouabhi, A.; Gerbaud, L. Percussive Drilling: Experimental and Numerical Investigations. Rock Mech. Rock Eng. 2022, 55, 1555–1570. [Google Scholar] [CrossRef]
  12. Shariati, H.; Saadati, M.; Weddfelt, K.; Larsson, P.; Hild, F. A Damage Model for Granite Subjected to Quasi-static Contact Loading. Int. J. Numer. Anal. Methods Geomech. 2022, 46, 374–391. [Google Scholar] [CrossRef]
  13. Ji, Z.S.; Shi, H.Z.; Dai, X.W.; Song, H.Y.; Li, G.S.; Shen, Z.H. Fragmentation Characteristics of Rocks under Indentation by a Single Polycrystalline Diamond Compact Cutter. J. Energy Resour. Technol. 2021, 143, 100903. [Google Scholar] [CrossRef]
  14. Wu, G.; Liu, K.; Hu, W.R.; Li, J.C.; Dehkhoda, S.; Zhang, Q.B. Quantification of Dynamic Damage and Breakage in Granite under Confined Indentation. Int. J. Rock Mech. Min. Sci. 2021, 144, 104763. [Google Scholar] [CrossRef]
  15. Dai, X.; Huang, Z.; Zou, W.; Wu, X.; Shi, H. Failure Characteristics of Rocks Subjected to PDC Cutter Indentation. J. Pet. Sci. Eng. 2021, 207, 108992. [Google Scholar] [CrossRef]
  16. Zou, J.Q.; Yang, W.H.; Zhang, T.; Wang, X.F.; Gao, M. Experimental Investigation on Hard Rock Fragmentation of Inserted Tooth Cutter Using a Newly Designed Indentation Testing Apparatus. Int. J. Min. Sci. Technol. 2022, 32, 459–470. [Google Scholar] [CrossRef]
  17. Li, Y.L.; Peng, J.M.; Zhang, P.Y.; Huang, C.Y. Hard Rock Fragmentation in Percussion Drilling Considering Confining Pressure: Insights from an Experimental Study. Int. J. Rock Mech. Min. Sci. 2021, 148, 104961. [Google Scholar] [CrossRef]
  18. Murthy, C. Rock Indentation: Experiments and Analyses; CRC Press: Boca Raton, FL, USA, 2021; ISBN 978-0-429-01995-1. [Google Scholar]
  19. Li, Z.; Mao, K.; Liu, J.; Zhang, K.X. Analysis of Fracture Surface Morphology and Study of Seepage Diffusion Characteristics. KSCE J. Civ. Eng. 2023, 28, 428–443. [Google Scholar] [CrossRef]
  20. MŁynarczuk, M. Description and Classification of Rock Surfaces by Means of Laser Profilometry and Mathematical Morphology. Int. J. Rock Mech. Min. Sci. 2010, 47, 138–149. [Google Scholar] [CrossRef]
  21. Xie, H.P.; Wang, J.A.; Kwaśniewski, M.A. Multifractal Characterization of Rock Fracture Surfaces. Int. J. Rock Mech. Min. Sci. 1999, 36, 19–27. [Google Scholar] [CrossRef]
  22. Gao, M.Z.; Hao, H.C.; Xue, S.N.; Lu, T.; Cui, P.F.; Gao, Y.A.; Xie, J.; Yang, B.G.; Xie, H.P. Discing Behavior and Mechanism of Cores Extracted from Songke-2 Well at Depths below 4,500 m. Int. J. Rock Mech. Min. Sci. 2022, 149, 104976. [Google Scholar] [CrossRef]
  23. Aldannawy, H.A.; Gerbaud, L.; Rouabhi, A. On the Influence of Tool Shape on Percussive Drilling in Hard Rocks. In Proceedings of the 55th U.S. Rock Mechanics/Geomechanics Symposium, Virtual, 18–25 June 2021; p. ARMA-2021-1145. [Google Scholar]
  24. Ji, Z.S.; Jiang, J.B.; Shi, H.; Li, B. Experimental Studies on Rock Failure Mechanisms under Impact Load by Single Polycrystalline Diamond Compact Cutter. Pet. Sci. 2023, 20, 3100–3109. [Google Scholar] [CrossRef]
  25. Liu, Z.; Yu, J.; Ren, C.; Elbaz, K.; Zhu, D.; Cai, Y. Fatigue Behaviour Characteristics and Life Prediction of Rock under Low-Cycle Loading. Int. J. Min. Sci. Technol. 2025, 35, 737–752. [Google Scholar] [CrossRef]
  26. Zhao, J.; Jin, J.; Li, Y. Macro-Micro Failures of Shear Creep and Creep Damage Model of Deep Hard Rocks Induced by Initial Disturbances. Eng. Fract. Mech. 2025, 324, 111269. [Google Scholar] [CrossRef]
  27. Zhang, L.; Fu, X.F.; Liu, G.R.; Li, S.B.; Li, W.; Qu, S. Models for Evaluating Craters Morphology, Relation of Indentation Hardness and Uniaxial Compressive Strength via a Flat-End Indenter. Open Geosci. 2018, 10, 289–296. [Google Scholar] [CrossRef]
  28. Cui, Z.; Qian, S.; Zhang, G.; Maochu, Z. An Experimental Investigation of the Influence of Loading Rate on Rock Tensile Strength and Split Fracture Surface Morphology. Rock Mech. Rock Eng. 2021, 54, 1969–1983. [Google Scholar] [CrossRef]
  29. Lai, Y.; Zhao, K.; He, Z.; Yu, X.; Yan, Y.; Li, Q.; Shao, H.; Zhang, X.; Zhou, Y. Fractal Characteristics of Rocks and Mesoscopic Fractures at Different Loading Rates. Geomech. Energy Environ. 2023, 33, 100431. [Google Scholar] [CrossRef]
  30. Zhang, M.; Sheng, Q.; Cui, Z.; Ma, Y.; Zhou, G. Effect of loading rate on tensile strength of rock materials and morphology of fracture joint surface. Rock Soil Mech. 2020, 41, 1169–1178+1188. [Google Scholar] [CrossRef]
  31. Li, B.; Zhang, W.; Xue, Y.; Li, Z.; Kong, F.; Kong, R.; Wang, G. Approach to Characterize Rock Fracture Surface: Insight from Roughness and Fractal Dimension. Eng. Geol. 2023, 325, 107302. [Google Scholar] [CrossRef]
  32. Souissi, S.; Hamdi, E.; Sellami, H. Microstructure Effect on Hard Rock Damage and Fracture During Indentation Process. Geotech. Geol. Eng. 2015, 33, 1539–1550. [Google Scholar] [CrossRef]
  33. Ajibose, O.K.; Wiercigroch, M.; Akisanya, A.R. Experimental Studies of the Resultant Contact Forces in Drillbit–Rock Interaction. Int. J. Mech. Sci. 2015, 91, 3–11. [Google Scholar] [CrossRef]
  34. Tan, X.C.; Kou, S.Q.; Lindqvist, P.A. Application of the DDM and Fracture Mechanics Model on the Simulation of Rock Breakage by Mechanical Tools. Eng. Geol. 1998, 49, 277–284. [Google Scholar] [CrossRef]
  35. Zhu, X.; Liu, W. The Rock Fragmentation Mechanism and Plastic Energy Dissipation Analysis of Rock Indentation. Geomech. Eng. 2018, 16, 195–204. [Google Scholar] [CrossRef]
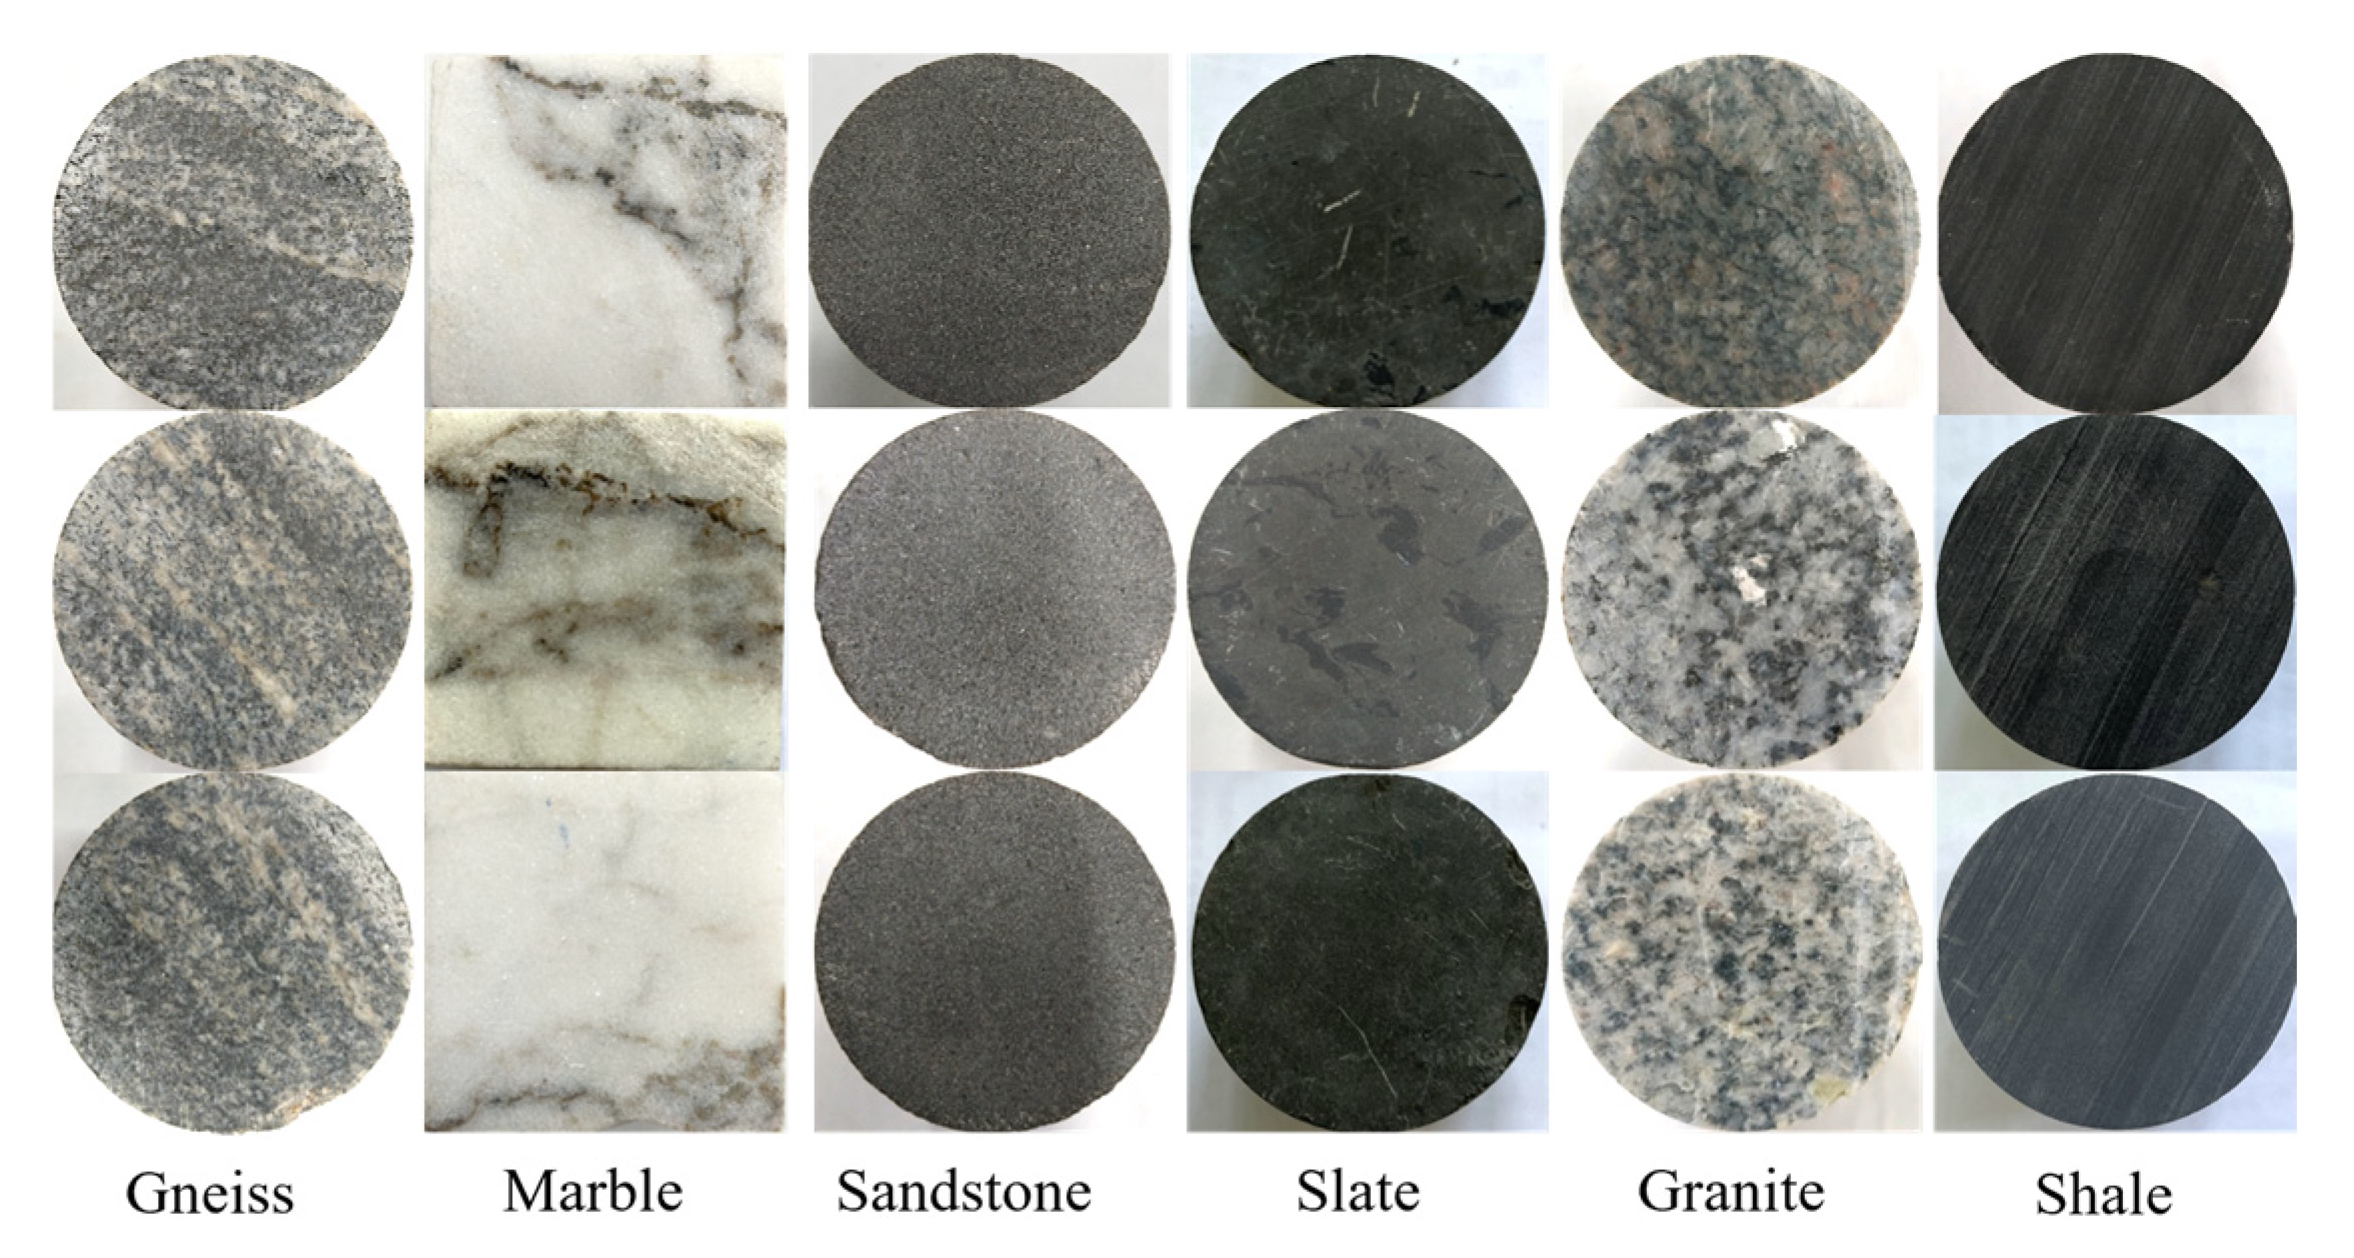
Figure 1. Some rock samples were used in the experiment.
Applsci 15 09410 g001
Figure 2. Indentation test experimental setup and schematic illustration for the general fracture system in the rock under a single button. (a) Indentation test experimental; (b) Schematic of the general fracture system; (c) Schematic of the mechanical index. The red double-headed arrow in Figure (a) shows the loading and unloading via stage movement. The red curve in Figure (c) displays the indentation curve from loading, with load (N) on the vertical axis and displacement (mm) on the horizontal axis.
Applsci 15 09410 g002
Figure 3. 3D profilometer and obtained results: (a) Non-contact profilometer; (b) Indentation craters obtained after indentation; (c) Color visible image of the indentation crater; (d) The three-dimensional topography of the indentation crater, and different colors represent different depths.
Applsci 15 09410 g003
Figure 4. Individual measurements (scatter points) with mean ± SD indicators for crushing efficiency across six rock types, ordered by ascending mean value of each rock type: (a) depth, (b) volume, and (c) SE.
Applsci 15 09410 g004
Figure 5. Mean specific energy (SE) ± standard error by category, (a) Before classification, (b) After classification.
Applsci 15 09410 g005
Figure 6. Loading curves of the indentation experiment of different types of rocks. (a) Slate, (b) Shale, (c) Marble, (d) Sandstone, (e) Gneiss, (f) Granite. Red hollow circles mark the maximum load value for each curve.
Applsci 15 09410 g006
Figure 7. Box plots with scatter points showing (a) HI and (b) k values across three classes.
Applsci 15 09410 g007
Figure 8. Correlation analysis of topography parameters. The numbers in the figure represent correlation coefficients, and the red ellipses indicate confidence ellipses.
Applsci 15 09410 g008
Figure 9. Distribution characteristics of (a) depth, (b) cross-sectional area, and (c) roundness among three classes.
Applsci 15 09410 g009
Figure 10. Representative 3D morphology and visible-light images of (a) Class I, (b) Class II, and (c) Class III indentation craters.
Applsci 15 09410 g010
Figure 11. Relationship between hardness index and various morphological indicators: (a) depth, (b) cross-sectional area, and (c) roundness. The parameters a and b denote the slope and intercept of the linear regression, respectively. R2 is the coefficient of determination, and the p-value is for the regression model. The red straight line in each individual scatter plot represents the fitted line.
Applsci 15 09410 g011
Figure 12. Relationship between indentation stiffness index (k) and various morphological indicators: (a) Depth; (b) Cross-sectional area; (c) Roundness. The parameters a and b denote the slope and intercept of the linear regression, respectively. R2 is the coefficient of determination, and the p-value is for the regression model. The red straight line in each individual scatter plot represents the fitted line.
Applsci 15 09410 g012
Table 1. The number of effective indentation tests for each type of rock.
Rock TypeShaleSlateMarbleSandstoneGneissGranite
Test number351010410
Table 2. One-way ANOVA test results before and after classification.
ClassificationIndicatorOverall Anova Prob > FHomogeneity of Variance TestPowers
NoSE2.4392 × 10−40.00740.9914
Depth0.08830.14030.6250
Volume0.70390.57280.1934
Yes-9.3880 × 10−60.00580.9990
Table 3. Statistical values of the SE of the three classes after classification.
ClassN AnalysisMean/N·mm−2Standard Deviationt-Critical ValueLower LimitUpper Limit
I855.6828327.82822.36532.4178.95
II20103.8146146.521042.09382.04125.58
III14211.73696103.870482.160151.78271.70
Note. The 95% confidence intervals were constructed using the t-distribution due to the relatively small.
Table 4. The SE range and the type of rock corresponding to different classes.
ClassSE Range/N·mm−2Rock Types
I≤80Slate, shale
II80~140Sandstone, marble
III≥140Gneiss, granite
Table 5. Linear fitting results of different types of mechanical indicators and morphological parameters.
ClassMechanical
Indicator
Morphological
Parameter
SlopeInterceptR2p Value
0HICross-sectional area0.0025138.53960.0230.3367
Depth1.4657 × 10−41.03200.252* 6.9953 × 10−4
Roundness−2.3902 × 10−50.37570.076** 0.0773
kCross-sectional area−0.002749.33110.0080.5670
Depth6.6056 × 10−51.274040.0160.4314
Roundness−3.7781 × 10−50.38290.0580.1259
IHICross-sectional area−0.025791.78770.2090.2542
Depth2.1649 × 10−40.97740.2720.1851
Roundness1.6987 × 10−40.23970.4360.0747
kCross-sectional area−0.030292.68210.3210.1432
Depth1.2412 × 10−41.11380.0990.4478
Roundness1.9471 × 10−40.23940.635* 0.0179
IIHICross-sectional area0.01677.41810.229* 0.0327
Depth3.6788 × 10−40.59900.316* 0.0099
Roundness−5.4506 × 10−50.39450.0720.2523
kCross-sectional area0.013318.81870.1040.1650
Depth1.2608 × 10−41.10190.0270.4910
Roundness−1.1214 × 10−40.46160.220* 0.0371
IIIHICross-sectional area0.0151−14.00730.487* 0.0055
Depth8.0839 × 10−51.28950.0350.5239
Roundness1.9984 × 10−50.19950.1050.2596
kCross-sectional area1.1180 × 10−444.08650.0000.9913
Depth−4.30730 × 10−42.62960.382* 0.0185
Roundness4.9665 × 10−40.15840.250** 0.0685
* Indicates that the p-value of the fitted model is significant, and ** indicates that the p-value of the fitted model is close to significant.
Table 6. Summary of the model for predicting the crushing morphological parameters of the mechanical indicators.
ClassMorphological ParametersPredict Model
IDepth-
Cross-sectional area-
RoundnessY = 1.9471 × 10⁻⁴ × k + 0.2394 (R2 = 0.635)
IIDepthY = 3.6789 × 10⁻⁴ × HI + 0.5990 (R2 = 0.316)
Cross-sectional areaY = 0.0167 × HI + 7.4181 (R2 = 0.229)
RoundnessY = −1.1214 × 10⁻⁴ × k + 0.4616 (R2 = 0.220)
IIIDepthY = −4.3073 × 10⁻⁴ × k + 2.6296 (R2 = 0.382)
Cross-sectional areaY = 0.0151 × HI − 14.0073 (R2 = 0.487)
Roundness* Y = 4.9666 × 10⁻⁵ × k + 0.1584 (R2 = 0.250)
* This prediction model is not significant under the linear model, but close to significant.
Disclaimer/Publisher’s Note: The statements, opinions and data contained in all publications are solely those of the individual author(s) and contributor(s) and not of MDPI and/or the editor(s). MDPI and/or the editor(s) disclaim responsibility for any injury to people or property resulting from any ideas, methods, instructions or products referred to in the content.