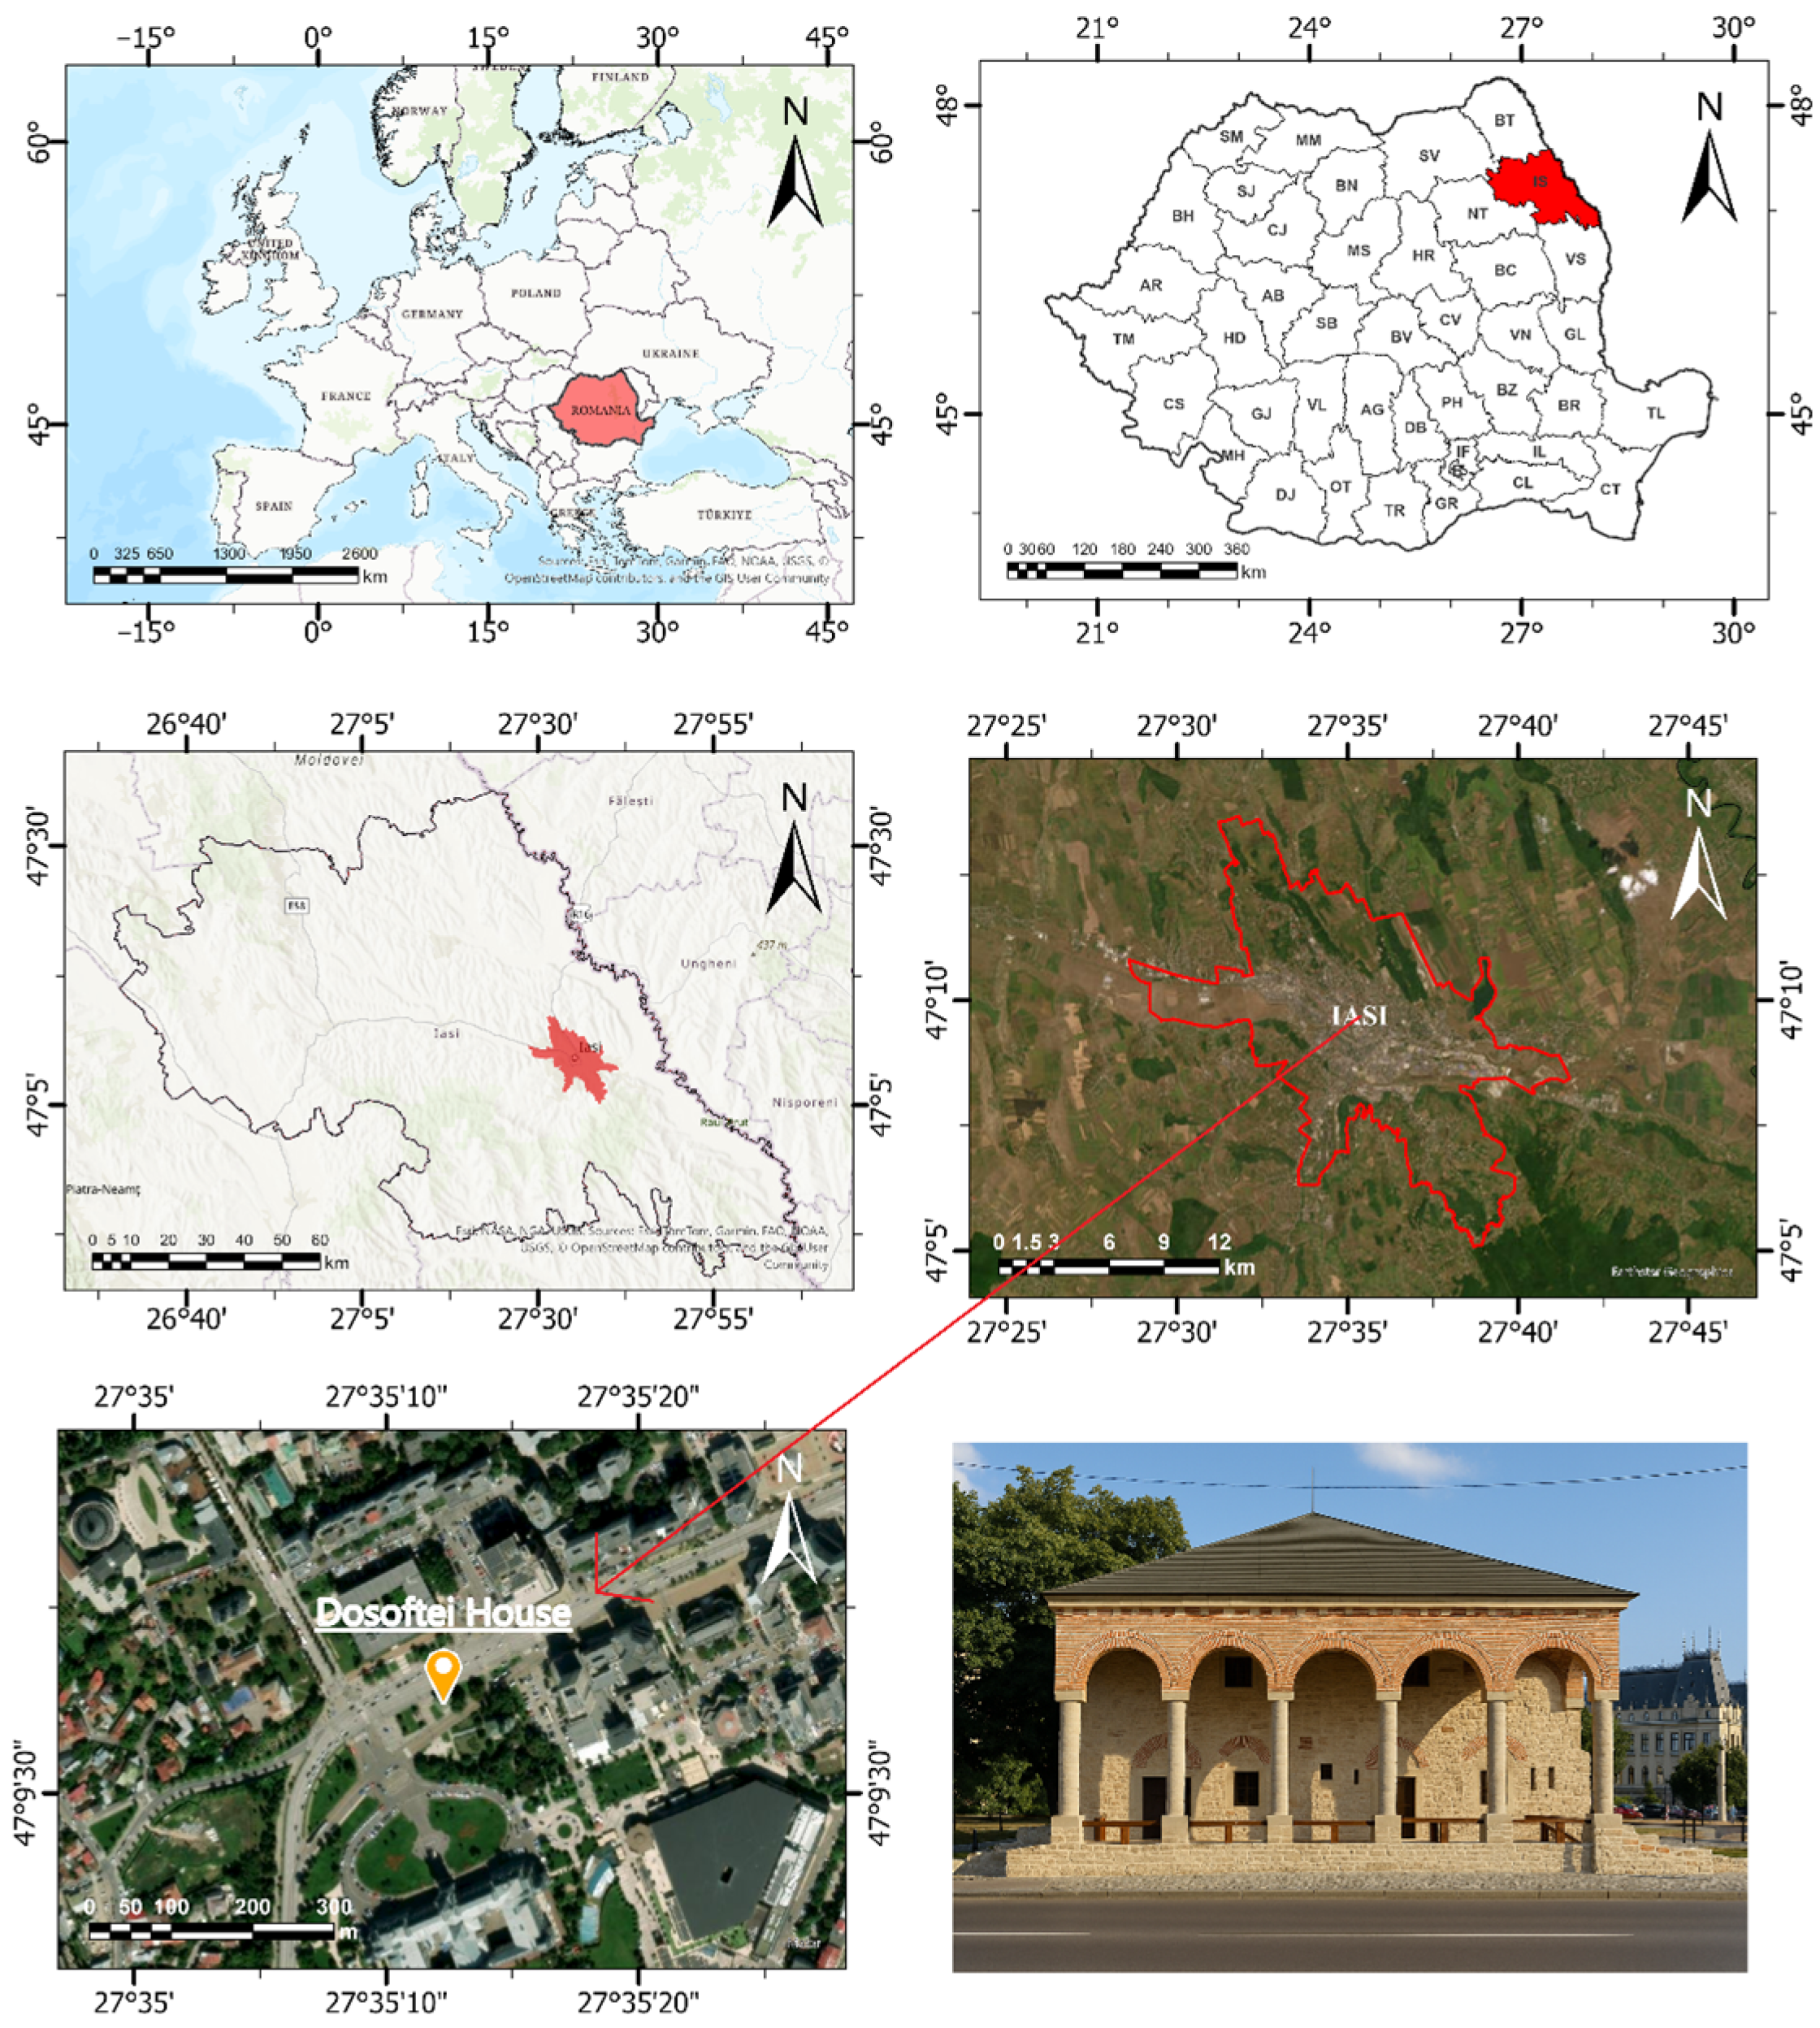
1. Introduction
Built heritage represents an invaluable cultural, historical, and economic resource, whose conservation is essential in the face of ongoing degradation caused by natural factors, wear, and human interventions [
1,
2]. In this context, high-fidelity 3D digitization of historic monuments has become indispensable for their documentation, monitoring, and conservation [
3]. Technological advancements in recent decades that have made it possible to develop non-invasive methods, such as laser scanning and photogrammetry that allow the acquisition of dense, texture point clouds of historic buildings [
4]. These point clouds can serve as the input for later stages in the modeling workflow.
The challenges associated with long-term management of heritage buildings have stimulated a shift from purely geometric 3D models to informational models capable of integrating metadata about materials, deterioration, interventions, or topological relationships [
5]. In this respect, Building Information Modeling (BIM) has gained a central role, being employed not only in the design and construction of new buildings but increasingly in the conservation and management of existing heritage assets [
6].
Heritage digitization often relies on two complementary modeling approaches. One is mesh-based reconstruction, which produces detailed polygonal models of surfaces and the other is BIM, which represents structures as semantic, parametric building elements. Each approach has strengths and weaknesses in the heritage context. Mesh models accurately record complex, irregular geometry, while BIM models encode structured information (materials, history, maintenance) in a unified environment. However, historic buildings’ irregular forms challenge BIM’s assumptions. As Chiabrando et al. [
7] noted, “buildings concerned often have very irregular geometry” making point-cloud-to-BIM conversion “not easy”. Likewise, Rocha et al. [
8] observe that historic structures “exude a geometric complexity” that renders scan-to-BIM “intricate and time-intensive”. In general, heritage sites with non-orthogonal vaults, curved walls, or organic ornamentation demand far more modeling effort than typical modern buildings. For example, modeling a complex vault or carved cornice in Revit can require custom profiles or B-rep/NURBS [
9]. Survey studies report that scan-to-BIM workflows “mostly remain a manual process” due to enormous data volumes, occlusions, and missing semantics in the raw scans [
10]. In short, creating a parametric BIM that preserves the true form of a historic structure is laborious and often relies on hand-crafted primitives or shape grammars [
11]. Even with simplified geometries, BIM models can be highly valuable for structural and seismic assessments of existing buildings, especially when geometric approximations help to reduce computational demand [
12,
13].
Mesh reconstruction, by contrast, excels at capturing fine geometric detail. When a point cloud is processed into a surface mesh, the result is a continuous model of the actual as-built shape [
9]. Advanced meshing algorithms (e.g., Poisson surface, ball-pivoting, advancing-front) can automatically generate dense, watertight meshes from unorganized points [
14]. Such meshes accurately reproduce irregular features like carved columns, moldings, or weathered façades without having to fit them into idealized primitives. Baik et al. highlight that post-processing (registration, filtering, meshing) “refines the raw point cloud into precise and visually appealing reconstructions” [
15]. In practice, mesh models can preserve the exact contours and textures of heritage surfaces (phototextures or true-color scans can be applied), making them excellent for archival and visualization. For instance, Rocha et al. [
8] imported a CloudCompare-generated mesh of ornate handrail balusters into Revit simply as a modeling reference, enabling an “accurate depiction of ornamental details”.
In summary, mesh models’ strengths are high geometric fidelity and the ability to handle any shape that was present in the scan. However, mesh models also have drawbacks. They are purely geometric and not structured: they contain no parametric hierarchy or semantics (walls, windows, material) that BIM provides. A mesh’s triangles encode no building logic or attributes, and they cannot easily support queries about the building or integration of historical data. Moreover, very dense meshes can be heavy (large file sizes) and unwieldy to edit. As Sun and Zhang [
16] point out, “a mesh surface can accurately represent the irregular shapes of architectural heritage and their as-built conditions, but it is rarely manageable in a BIM environment”. Converting a high-detail mesh into a BIM object usually requires segmentation and approximation. In practice, users often avoid simply importing complex meshes directly into Revit because the resulting objects lack classification and cannot serve as true BIM elements [
8]. That is, mesh-only models remain “visual” records, whereas BIM models support information-rich documentation and downstream planning.
Applying BIM to irregular heritage geometries remains challenging. As noted, most BIM tools lack native support for freeform shapes [
17]. Revit, for instance, primarily builds by extruding profiles along axes, which does not directly suit curved or warped walls. BIM libraries are often lacking in complex historical elements [
11] forcing custom solutions. Manual modeling in BIM of non-standard forms (like irregular stone arches or twisted cornices) is time-consuming [
10]. Even when shape libraries exist, fitting them to as-built scans usually require extensive adjustment. In practice, as Rocha et al. [
8] describe, scan-to-BIM workflows often end up modeling only the “main architectural elements” with parametric, while more organic forms are either approximated or left out. In short, pure BIM methods prioritize data structure over geometric exactness, sometimes at the cost of losing irregular detail.
Given these complementary strengths and weaknesses in the heritage context, several researchers advocate hybrid workflows that combine meshes and BIM. One strategy is to use mesh geometry as an intermediate representation or guide for BIM creation. For example, Yang et al. [
18] developed a “mesh-to-BIM” pipeline: they segmented an architectural mesh into parts, used Dynamo scripts to thicken and convert each mesh segment into a solid Revit primitive, and assembled these into a BIM model. This semi-automated approach reduced manual drafting and directly leveraged the scan-derived shapes. Similarly, Yang et al. [
9] proposed a mesh-to-HBIM workflow where surface meshes are segmented and converted to NURBS solids, which are then transferred as BIM families. These methods show that mesh geometry can accelerate BIM, though the final level of detail still depends on user refinement [
18].
Overall, Scan-to-mesh workflows, reviewed by [
3] and implemented by Baik et al. [
15], use surface reconstruction algorithms to produce dense, watertight meshes that pre-serve fine detail but lack semantic information, require extensive pre-/post-processing, and are difficult to integrate into BIM. Scan-to-BIM methods, as applied by [
7,
8,
10,
16,
17], create semantic, parametric models directly from point clouds, enabling integration with conservation and management processes, but face significant challenges with irregular historic geometries and a tendency to simplify complex features. To the best of our knowledge, only one study has focused on a Mesh-to-BIM hybrid approach. Yang et al. [
18] developed a semi-automated workflow combining Revit and its Dynamo visual programming environment to reconstruct HBIM models from segmented mesh elements, reducing manual effort in documenting ruined or unbuilt heritage. This approach, however, presents certain limitations: their study lacked an accuracy verification step, limiting the ability to assess the reliability of the resulting BIM models and the workflow itself remains complex, requiring significant programming knowledge within Dynamo to be effectively implemented.
This paper aims to investigate the complementary potential of these two modeling methods using an integrated point cloud obtained from terrestrial laser scanning of the Dosoftei House monument in Iasi city, Romania. The study focuses on the creation and comparison of two 3D models derived from the same point cloud: a manually crafted BIM model developed in Autodesk Revit 2024.3 and a semi-automatically generated mesh model in CloudCompare 2.14 using Poisson Surface Reconstruction [
19]. While the BIM model offers functional advantages, its construction requires assisted reconstruction based on visual interpretation of the point cloud and definition of specific geometric elements. In parallel, the mesh model, though faster to produce, involves steps of cleaning, segmentation, and normal estimation to obtain a coherent and detailed surface.
In addition, this study explores the potential of integrating Triangulated Irregular Network (TIN) surfaces [
20], typically used in terrain modeling within Civil 3D 2024, into the BIM environment. Unlike previous heritage workflows, our approach transforms segmented point cloud data into high-fidelity solid geometries that can be directly embedded in Autodesk Revit with a simple-to-use workflow and without the need for advanced programming skills, thus lowering the entry barrier for heritage practitioners. The study also incorporates a verification process providing measurable evidence of accuracy. Through this approach, the study seeks not only to highlight the specific characteristics of each modeling method, but also to examine the possibility of integrating them into a unified workflow capable of meeting the complex requirements of heritage documentation.
The core contributions of this study are as follows: (1) it proposes a dual-model comparative framework that evaluates deviations between BIM and mesh-based models derived from the same point cloud; (2) it introduces an integrated workflow that incorporates complex, irregular geometries into the BIM environment using segmented TIN surfaces processed in Civil 3D and imported into Revit; and (3) it demonstrates the complementary potential of BIM (for semantic structuring and management) and mesh models (for geometric fidelity and visualization) in heritage documentation. This integrated approach is validated through a real-world case study of the Dosoftei House in Iași, Romania, providing insights into its applicability and limitations.
3. Materials and Methods
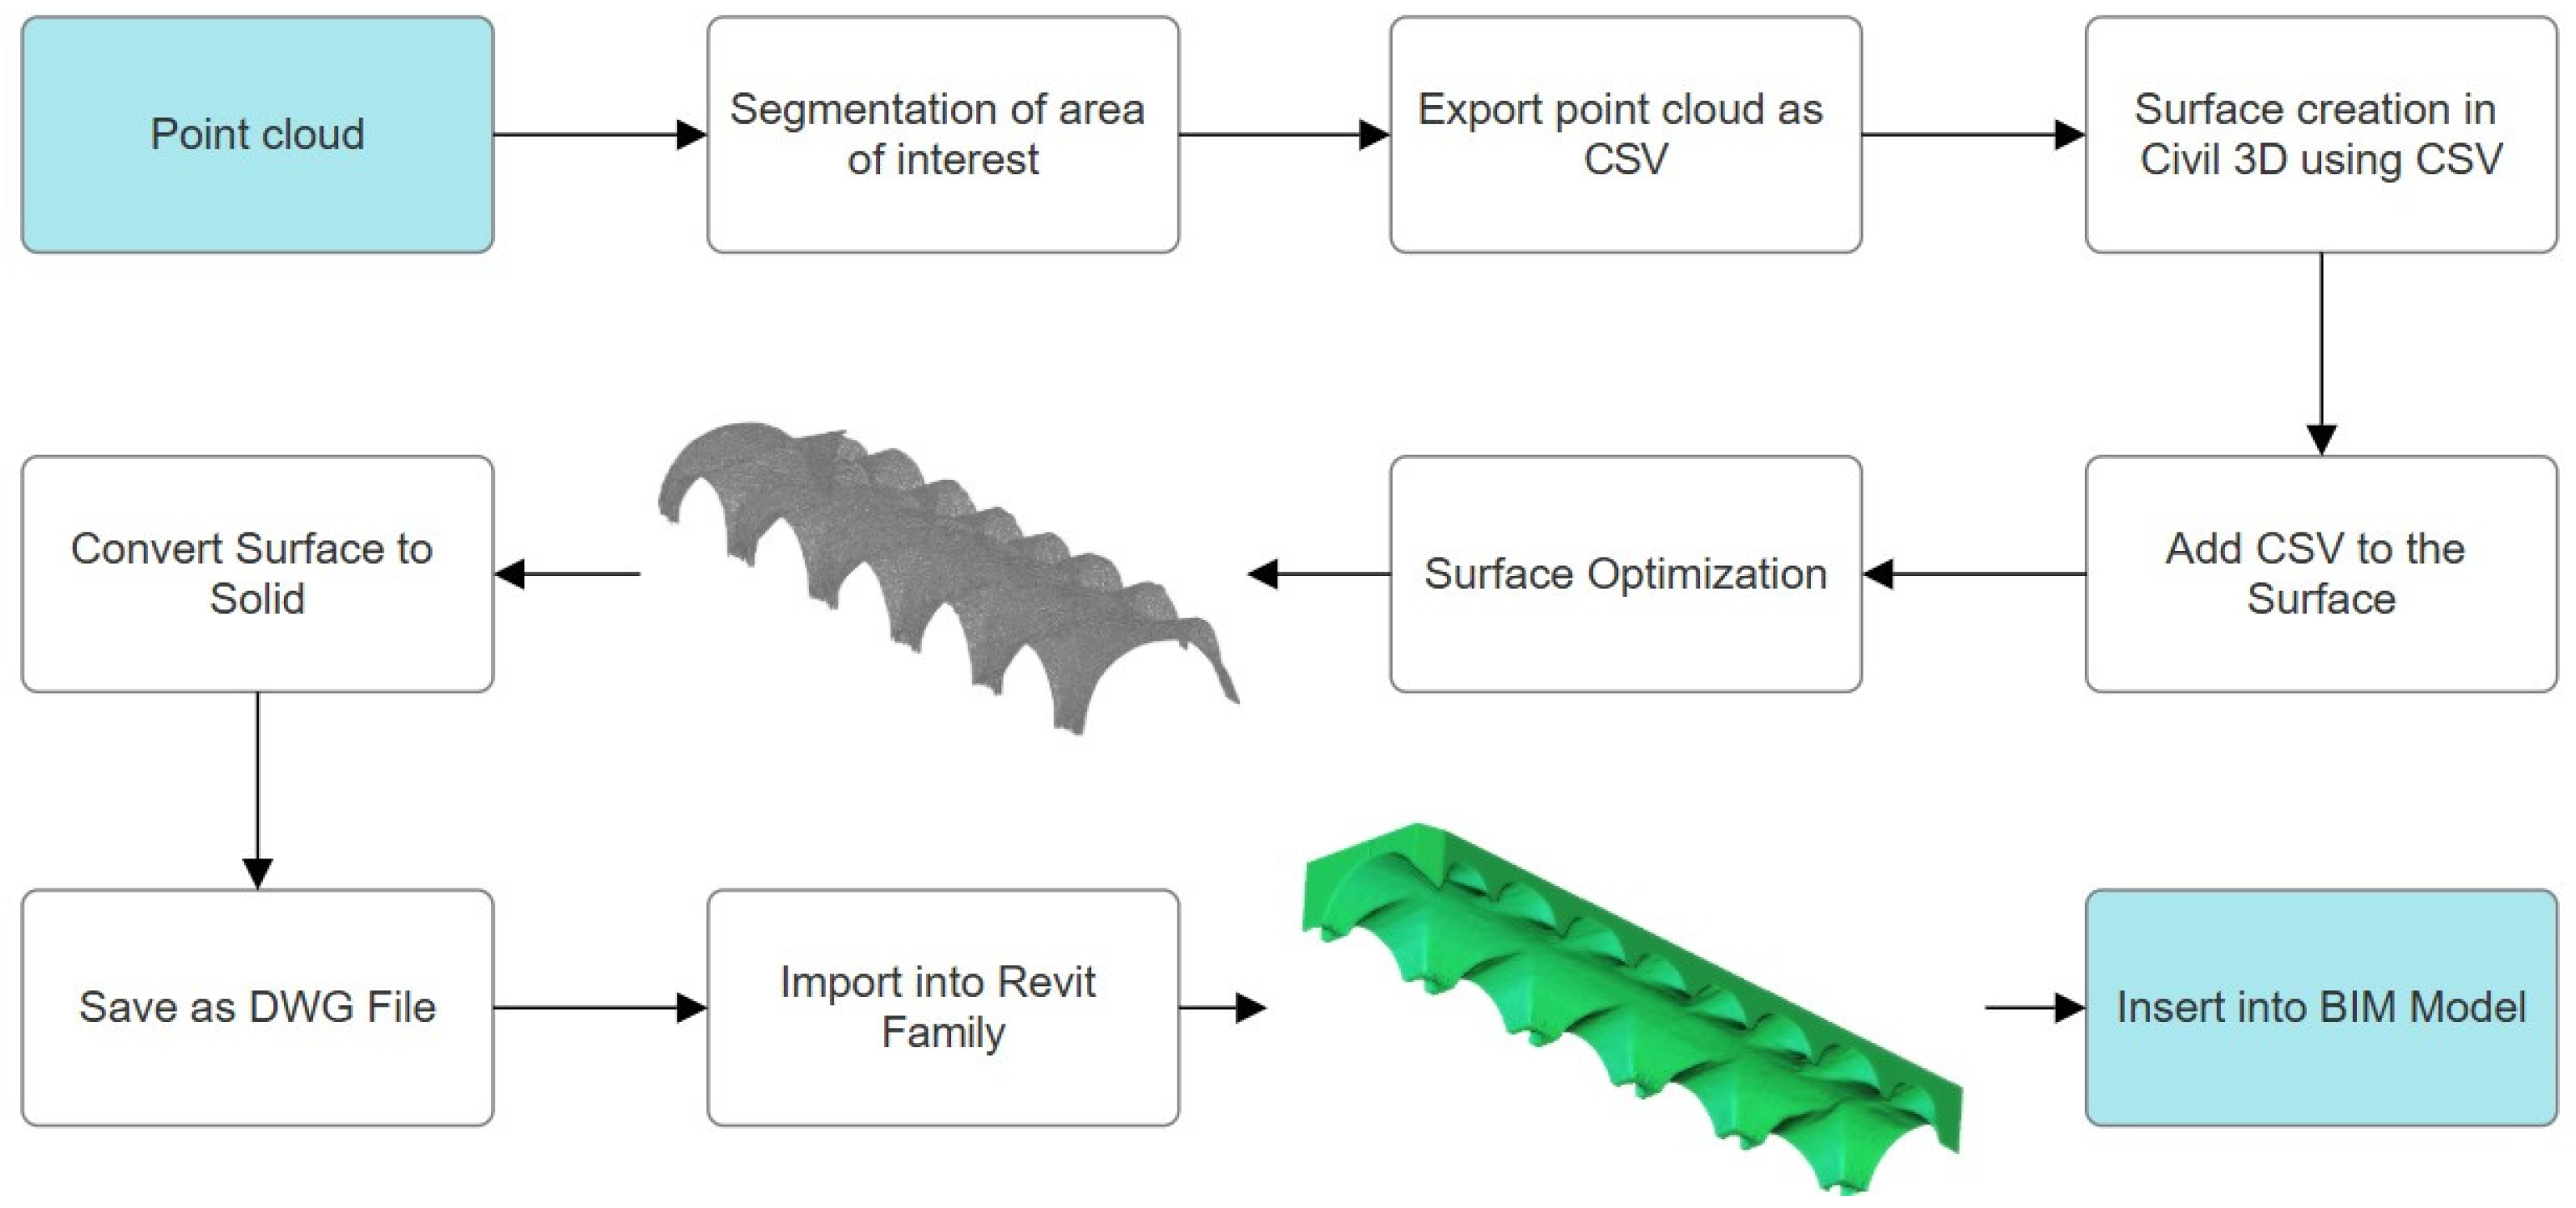
The 3D scanning of the Dosoftei House was carried out using two types of laser scanner equipment, both static and mobile, resulting in a dense and complete point cloud. Based on this dataset, two models were developed: a BIM model created in Revit, which includes parametric and semantic organization, and a mesh model reconstructed in CloudCompare. In addition, a complementary method was applied to integrate complex architectural elements such as the main arcade into the BIM environment. This process involved the use of Autodesk Civil 3D 2024 software. The segmented point cloud was exported in CSV format and used to create a surface in Civil 3D. After optimizing the triangulation, the surface was converted into a solid model and saved as a *.dwg file. This solid was imported into a Revit family, enriched with custom parameters, and then placed and aligned with the point cloud in the main BIM model.
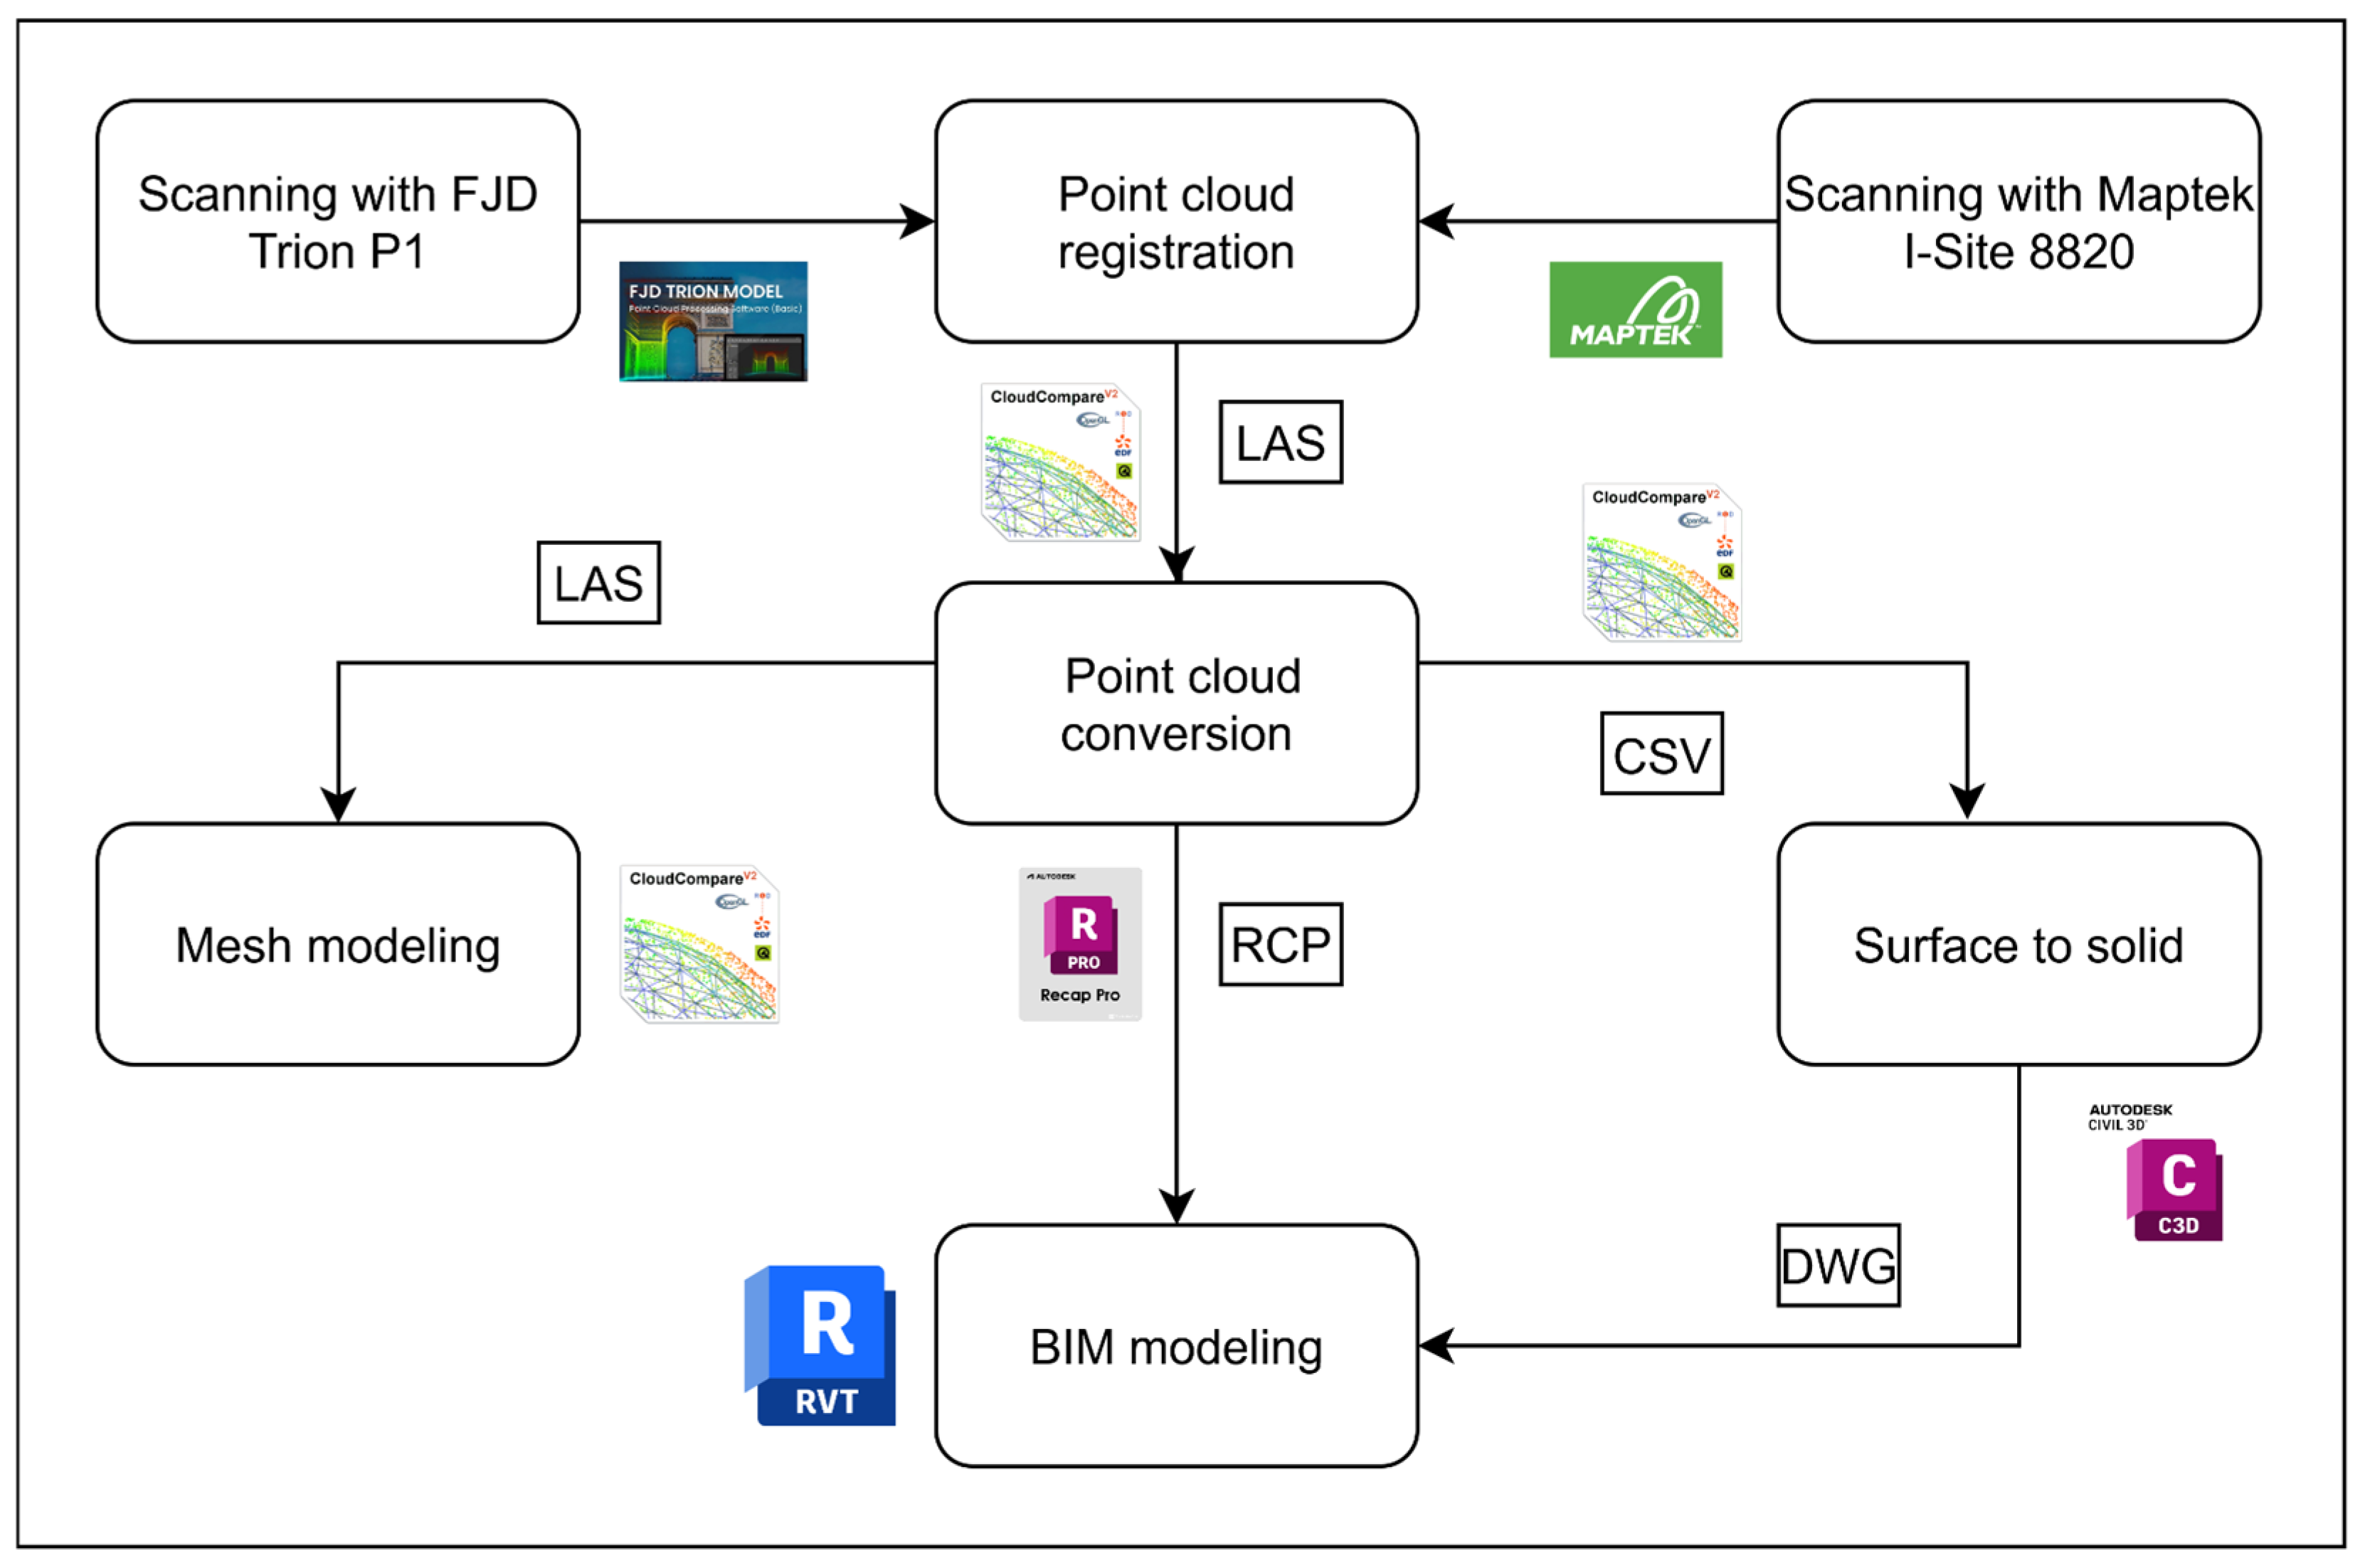
The workflow applied for this historical monument can be structured in the following parts: (1) data acquisition using the FJD Trion P1 HMLS laser scanner (FJDynamics, Shenzhen, China); (2) post-processing with the FJD Trion Model software (V201) to calculate the scanner trajectory during acquisition and obtain the HMLS point cloud; (3) data acquisition using the Maptek I-Site 8820 TLS laser scanner (Maptek, Adelaide, Australia); (4) registration and georeferencing of the four individual TLS point clouds with the PointStudio 8.0 software to obtain the final point cloud; (5) the registration of the HMLS and TLS point clouds to obtain the dense integrated point cloud; (6) conversion of the point cloud into formats compatible with BIM and mesh re-construction workflows; (7) generating a parametric BIM model using the Revit software having the integrated point cloud as reference, emphasizing semantic organization and management functions; (8) mesh model reconstruction in CloudCompare using the Poisson algorithm, focusing on geometric fidelity and surface detail point cloud filtering and normal estimation; (9) using a complementary method designed to improve the BIM environment by integrating complex and irregular architectural elements, such as the main arcade, through the use of Civil 3D for surface reconstruction and subsequent embedding of solid geometries into Revit (
Figure 2).
3.1. Data Acquisition
To create accurate and detailed digital models, the 3D data acquisition process was conducted using laser scanning technology by combining mobile and static equipment to ensure complete coverage of the building, both interior and exterior.
3.1.1. Data Acquisition Using the FJD Trion P1 HMLS Equipment
The initial scanning phase was carried out using HMLS equipment, specifically the FJD Trion P1 scanner, which captures data in real time as the operator moves (
Figure 3a). The scanning was performed also indoor and outdoor, through two different paths. This technology allowed for efficient coverage of all areas, including hard-to-reach spaces that are difficult to scan with a static device, resulting in an accurate three-dimensional representation of the building’s geometry. FJD Trion P1 hand-held laser scanner, is a new-generation mobile scanning system that integrates Simultaneous Localization and Mapping (SLAM) technology with its own proprietary software interface—FJD Trion Model. The system is designed to offer maximum portability and high autonomy, making it ideal for use in heritage projects where mobility and accuracy are very important. Can be used also for indoor and outdoor mapping, scanning in an FOV of 360° × 270° at a maximum range of 120 m (depending on surface and lighting conditions) and collecting approximately 320,000 points/s with a relative accuracy of ±1.5 cm, as can be found in the laser specifications [
22].
As illustrated in
Figure 3b,c real-time visualization of the point cloud on mobile devices supported on-site monitoring and validation of the scanning process.
Systems equipped with native software interfaces can reduce data loss and optimize processing time by up to 40% compared to fragmented solutions that involve conversions and transfers between external applications. Thus, the FJD Trion P1 becomes not just a scanning tool, but a fully integrated platform for digital documentation and analysis, tailored to the contemporary demands of historical building digitization.
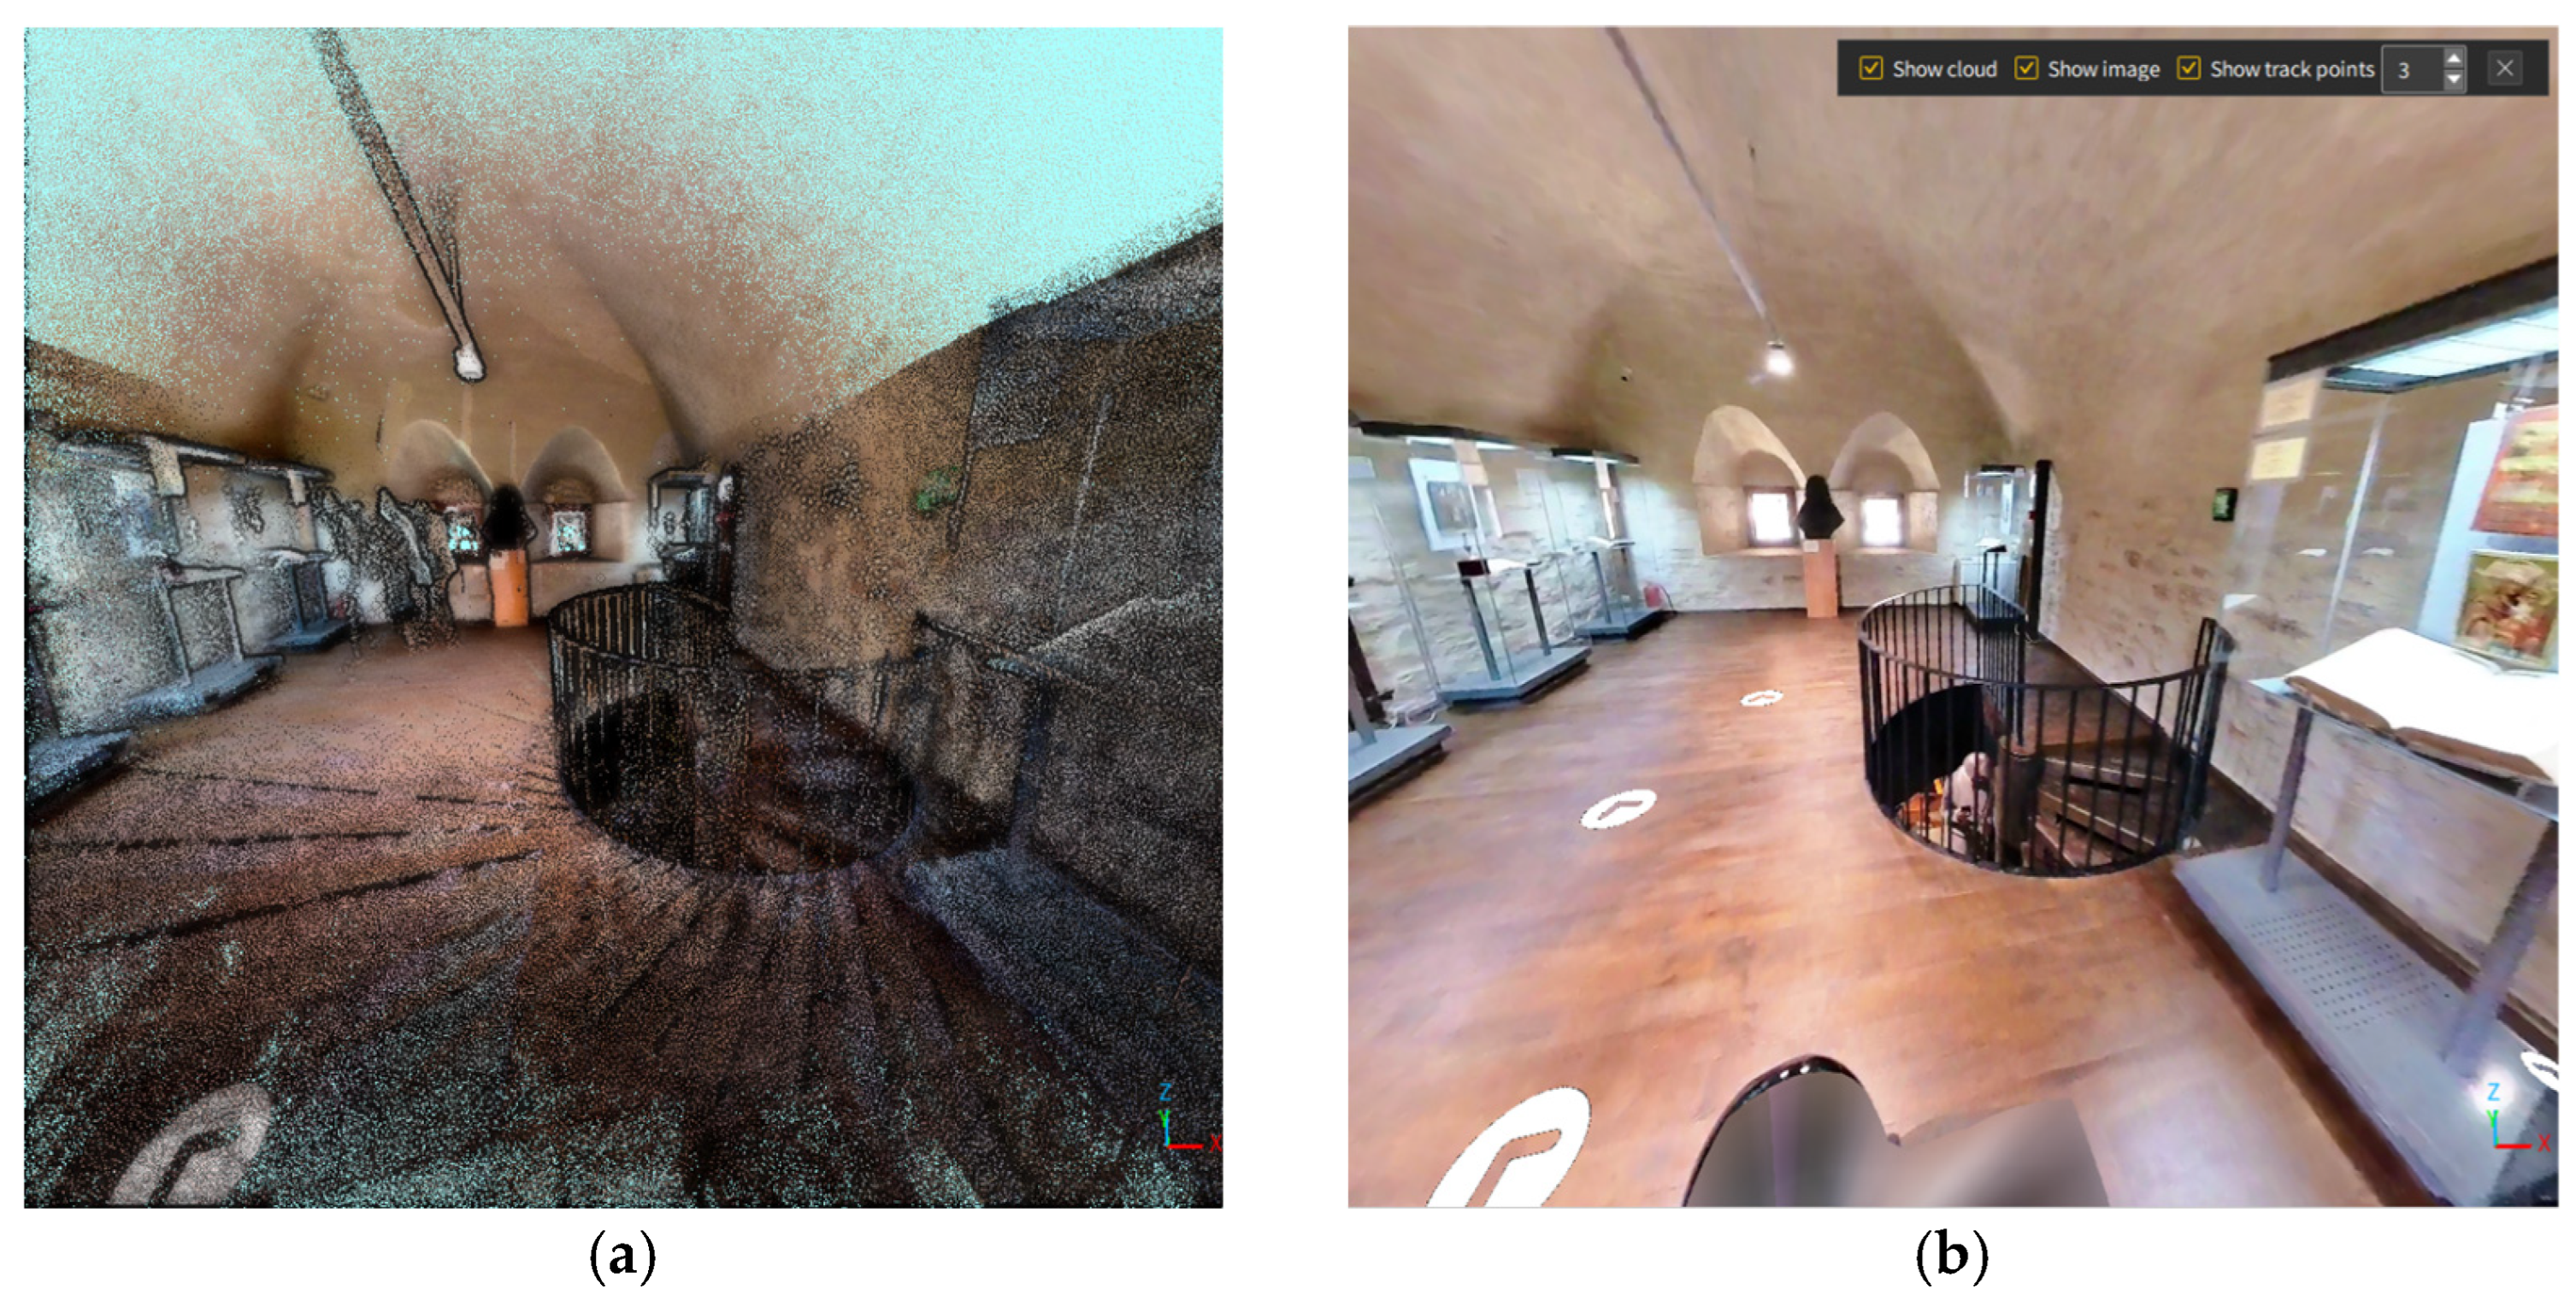
Figure 4 shows a representation of the point cloud displayed side by side with the corresponding 360-degree panoramic image using the FJD Trion Model software processing interface. The software also provided tools for noise filtering and visual coding using RGB colors or grayscale, which improved the readability of the structural elements.
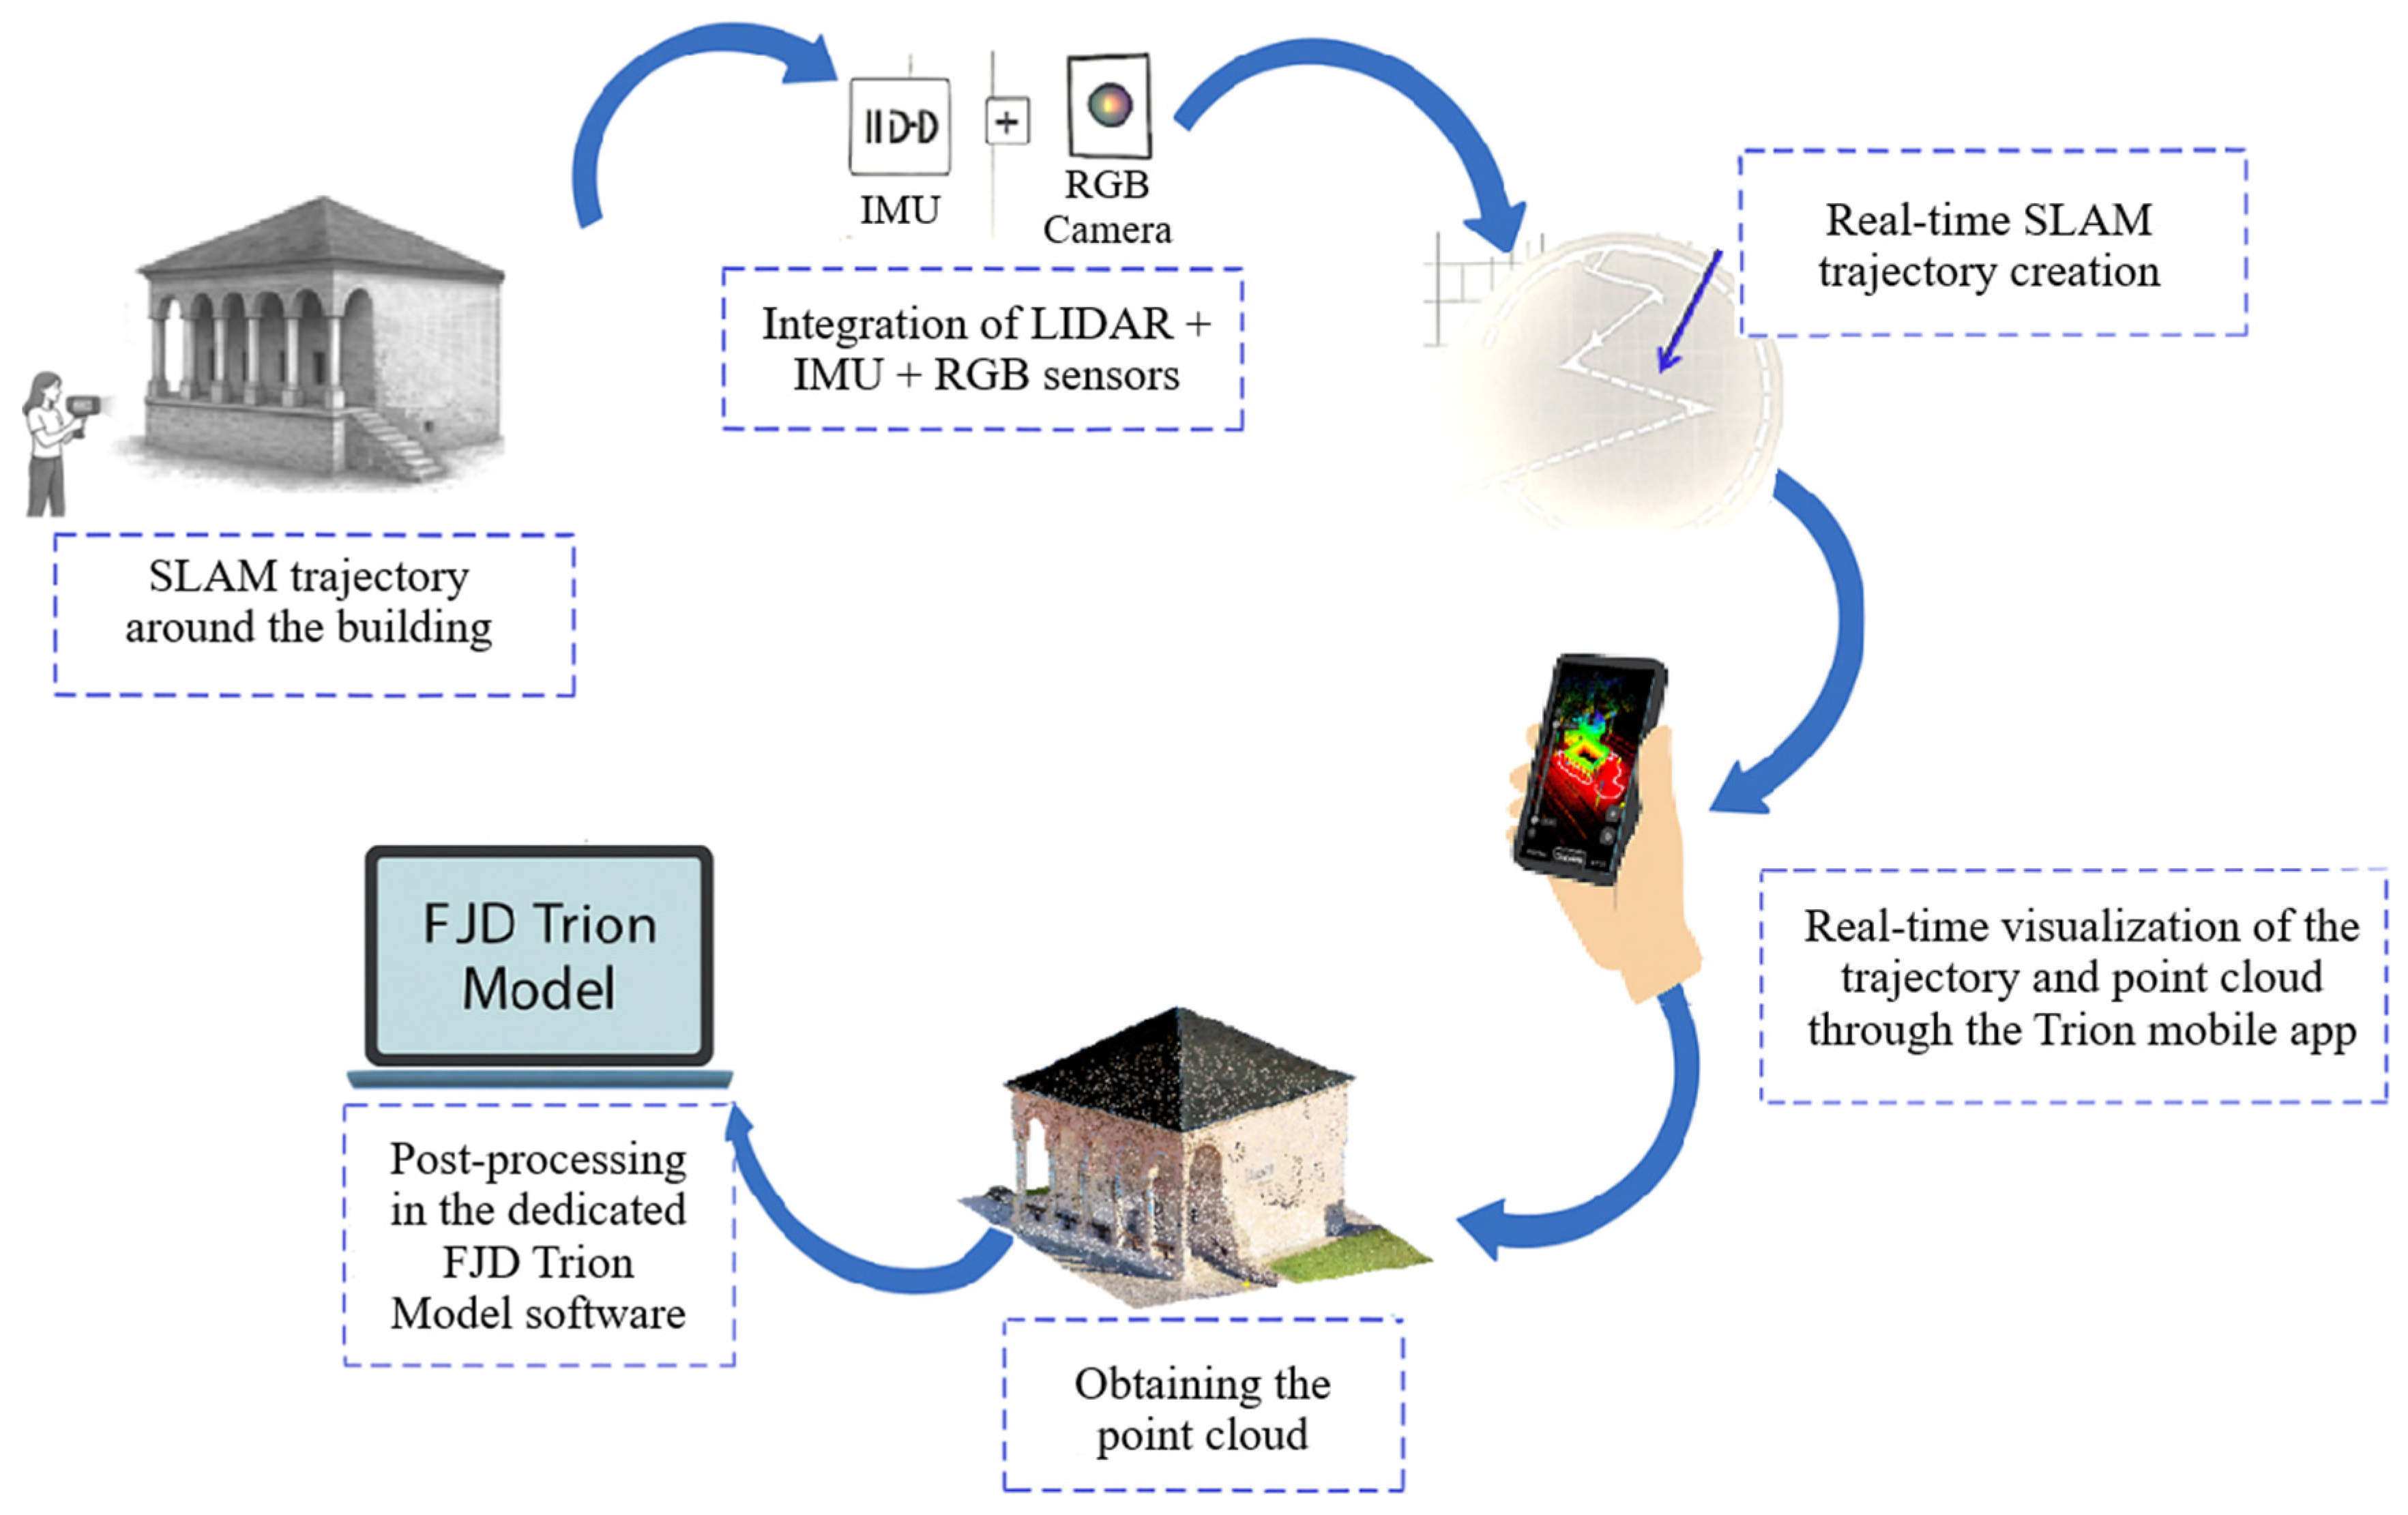
The essential components and operating principles of the HMLS equipment, with the direct connection between active sensors, SLAM algorithms, and the mobile control application are summarized in
Figure 5.
Using the HMLS technology, the exterior of the monument was scanned in approximately 6 min obtaining a number of 17,030,875 points (682 MB in size), while the interior was scanned in 8 min, resulting in a total of 11,637,905 points (466 MB in size).
Figure 6a shows the operator’s trajectory during the mobile scanning of the Dosoftei House exterior, automatically generated by the FJD Trion Model application.
Figure 6b,c present the HMLS-generated point cloud with texture information for the exterior and interior (excluding the ceiling), respectively.
3.1.2. Data Acquisition Using the Maptek I-Site 8820 Equipment
Initial scanning was performed with a handheld scanner, which is effective for close range capture but exhibits decreased positional precision and increased registration drift at longer distances. Because the roof is steep and required greater stand-off, a supplementary survey with the Maptek I Site 8820 terrestrial laser scanner was conducted to ensure reliable coverage and survey grade accuracy. The scanner is a high-precision instrument designed for topographic applications in complex or hard-to-reach environments. The technical specifications of the Maptek I-Site 8820 laser scanner are detailed in [
23,
24]. To achieve full coverage of previously inaccessible zones, the scanning was performed from four different station points, at greater stand-off distances. To align the individual scans within a common coordinate system, a fully automated registration process was applied using the Iterative Closest Point (ICP) algorithm, implemented within PointStudio, a software platform specifically designed for Maptek scanners. The registration followed the procedure outlined in [
23], using the first point cloud as the reference. This reference scan was georeferenced to the Romanian national projection system via PointStudio. The accuracy of the registration was evaluated using Root Mean Square Error (RMSE) and standard deviation, both automatically calculated by the software based on overlapping areas between scans. The resulting registration errors were minimal, with RMSE values under 1 cm and standard deviations around 5 mm. The final output was a unified point cloud comprising 22,263,605 points (
Figure 7b).
3.2. Obtaining the Integrated Point Cloud of the Interior and Exterior of the Dosoftei House
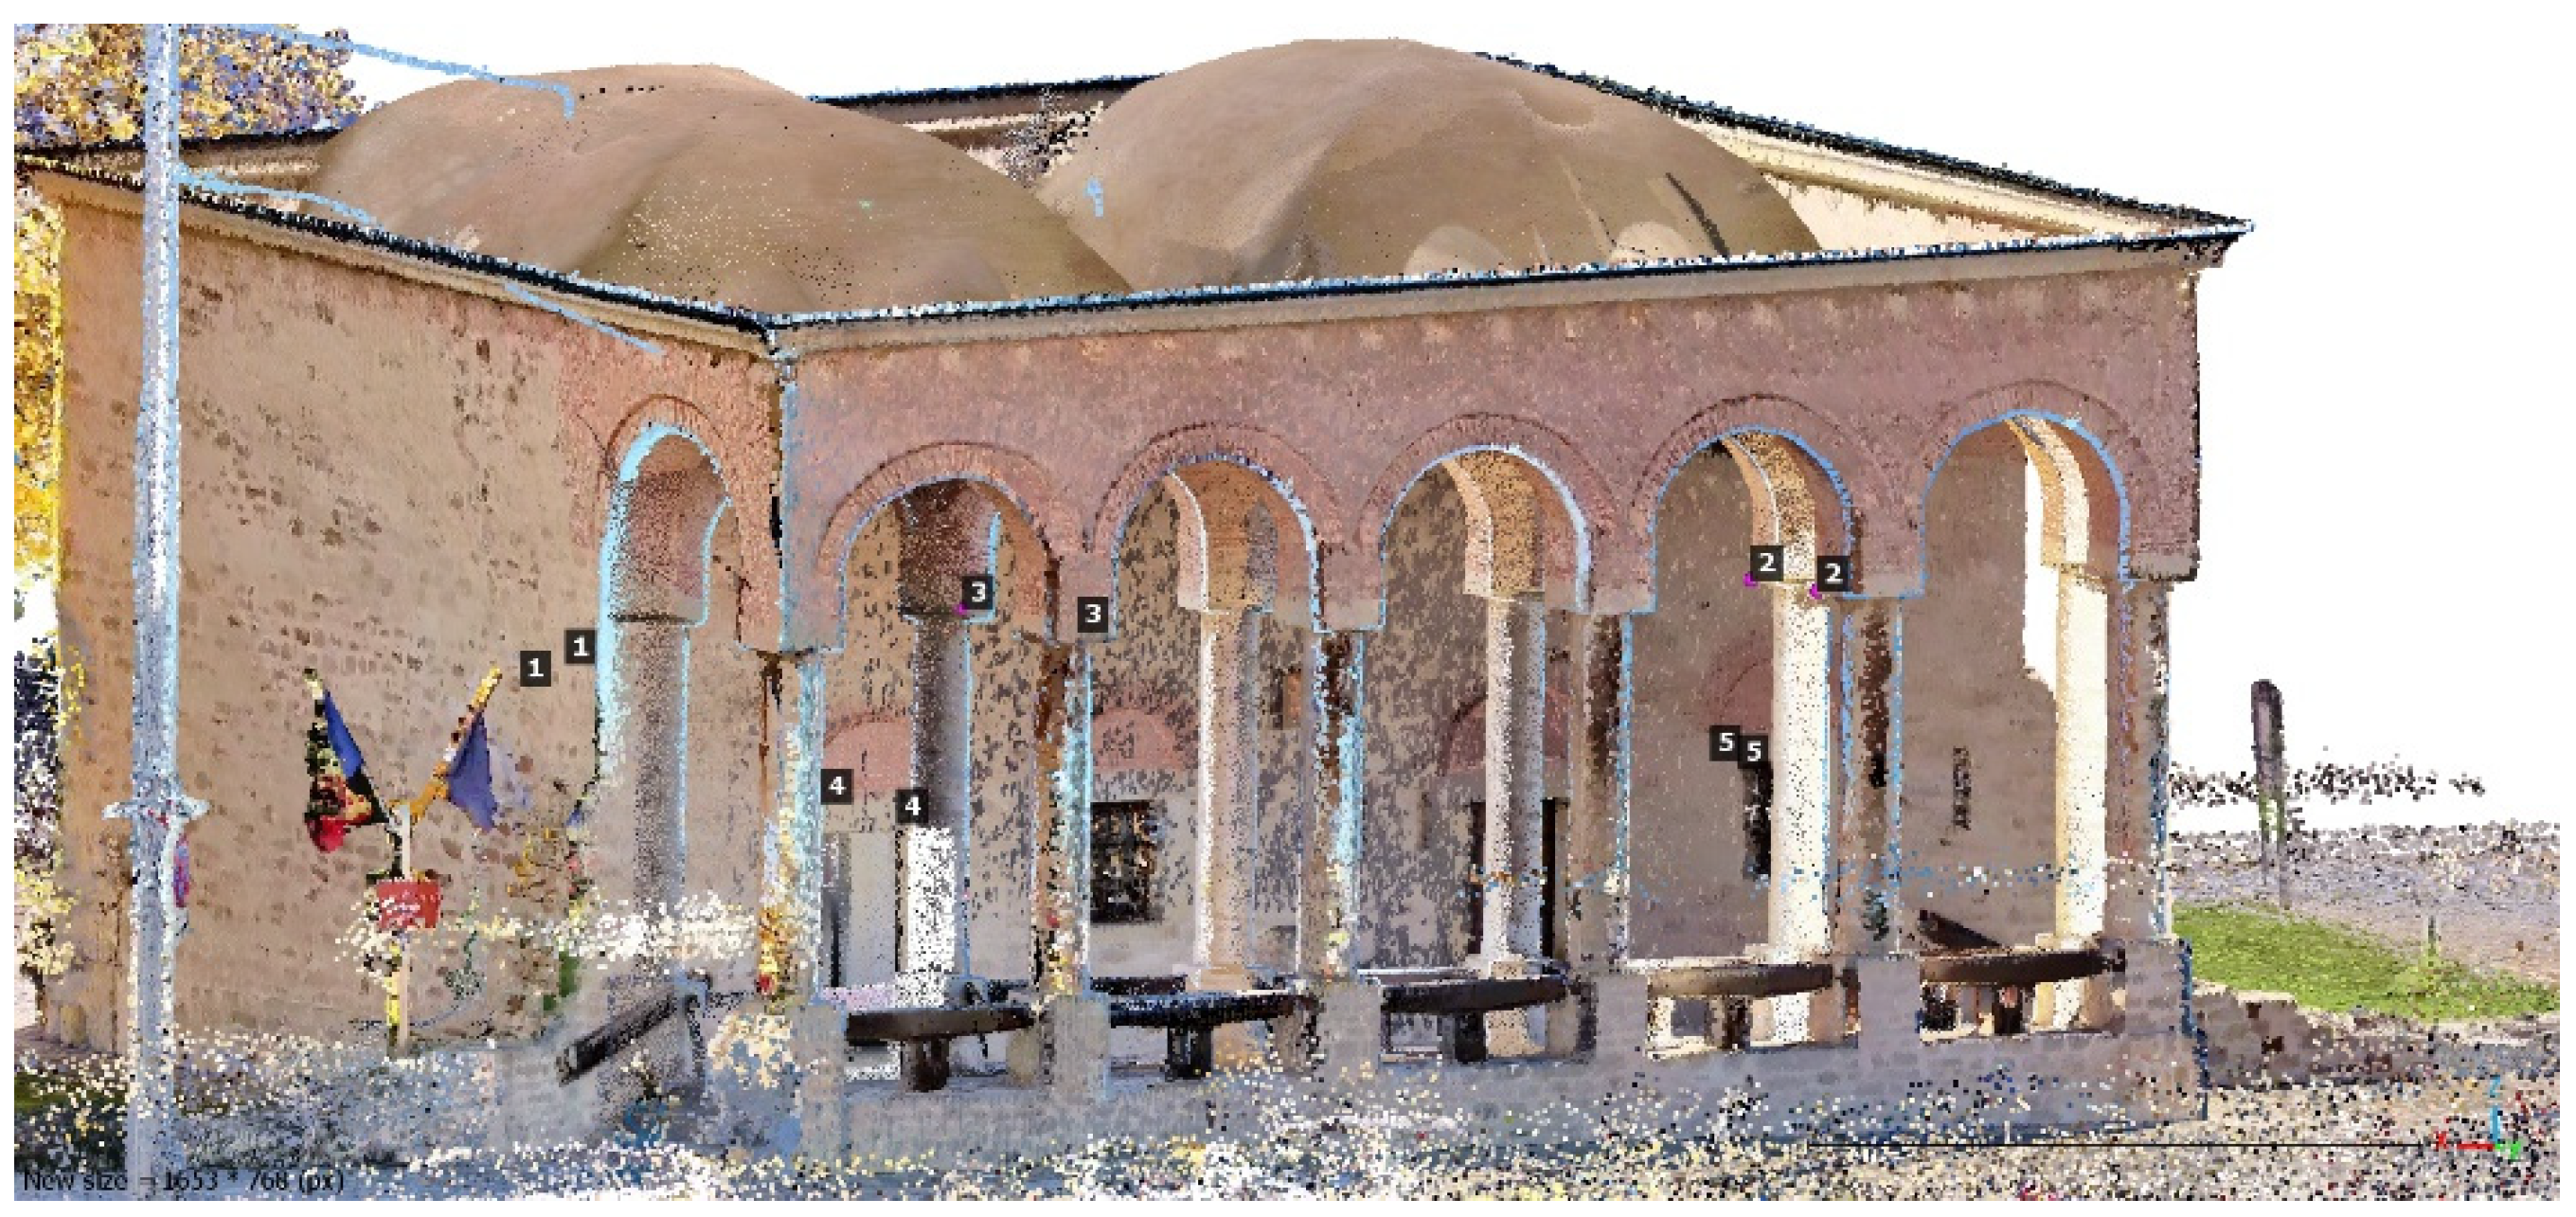
To generate the integrated point cloud, the interior HMLS point cloud was first aligned with the exterior HMLS point cloud. This alignment was performed using the Gauss–Helmert transformation, as implemented in CloudCompare, based on five well-defined common points that were manually identified and measured within both datasets (
Figure 8). CloudCompare facilitated both the computation and application of the transformation, as well as the validation of alignment accuracy, resulting in a root mean square error (RMSE) of 2.6 cm.
In the second step, the combined interior and exterior HMLS point cloud was registered with the TLS point cloud. Using the same registration method described previously, the alignment was performed with the TLS point cloud serving as the reference, as it was already georeferenced to the Romanian national coordinate system. The final registration yielded an RMSE of 3.7 cm. The resulting integrated point cloud is shown in
Figure 9.
The data completion phase provided a detailed and coherent geometric representation of the entire structure. The entire acquisition process was aimed at obtaining a robust digital foundation for the subsequent stages of analysis and modeling. The combination of the two scanning methods, mobile and static, not only allowed for the completion of missing portions but also enabled mutual validation of the datasets, contributing to the creation of a high-fidelity three-dimensional model adapted to the documentation requirements of architectural heritage. Similar hybrid approaches have been used effectively in previous heritage documentation studies. For instance, Oniga et al. (2021) [
23] demonstrated that although static TLS provides high-resolution data, it often leaves occluded or inaccessible areas unmapped.
3.3. Integration of Point Cloud Data into BIM for Accurate Digital Modeling
Following the data acquisition and processing stages, the resulting point cloud was integrated into the BIM environment, Autodesk Revit, with the aim of creating an accurate and parametric digital model of the monument. The import was carried out by converting the *.las file into the *.rcp format using Autodesk ReCap Pro [
25], ensuring compatibility with the Revit interface and preserving correct spatial coordinates. The point cloud was positioned in the model according to the previously defined reference system, and its high density provided a solid basis for modeling the architectural elements.
It is important to note that, given the current state of BIM technology, automatic modeling of historic buildings directly from point clouds is not yet possible [
26]. For structures with irregular geometric shapes, such as the building analyzed in this study, the use of automatic or even semi-automatic modeling algorithms presents major limitations due to geometric deviations and the construction specifics that do not fit the standard BIM component patterns [
10]. Therefore, the modeling process was carried out manually, using the point cloud solely as a visual and geometric reference to closely approximate the position and dimensions of the architectural elements. In Revit software, modeling was performed entirely manually, with the point cloud serving as the reference, and 360-degree panoramic images captured during scanning were also integrated for a more precise interpretation of architectural details. These images provided essential visual support in completing spatial information, contributing to a more accurate understanding of materials, textures, and the degradation state of architectural elements, both exterior and interior. Thus, in areas where the point cloud density was lower or geometries presented ambiguities, the panoramic images facilitated more well-founded modeling decisions and local geometric adjustments, improving the overall accuracy of the model.
For more efficient organization, levels corresponding to each floor were defined, and basic architectural elements such as walls, floors, roofs, and ceilings were modeled using the generic functions of the platform, such as Wall, Floor, Roof, and Ceiling. For structural components with irregular shapes, the Model In-Place function was used, allowing adaptation of the geometry to the documented reality on site, which was essential in areas with more complex geometric forms.
A particularly important aspect of the modeling process was the creation and integration of custom Revit families tailored to the unique architectural features of the building. Standard Revit components often failed to adequately represent elements such as historical doors, windows, or staircases. As a result, specific parametric families were developed, based on geometric profiles extracted from the point cloud and further validated using 360-degree images. For instance, staircase geometries required complex profiles and variable step heights, which were reproduced using in-place modeling and adaptive family components (
Figure 10a). Likewise, doors (
Figure 10b) and arched or irregularly framed windows (
Figure 10c) were modeled as custom families to preserve the proportions and detailing observed on-site.
To complete the model, materials specific to the building’s historical context were assigned. Where necessary, textures were adapted based on the visual data extracted from panoramic images and on-site analysis. The final result is an informative BIM model, geometrically coherent and fully prepared for technical documentation, which accurately reflects the architectural complexity of the monument. Using the point cloud as a reference throughout the modeling process ensured consistency and high geometric accuracy.
Figure 11a,b illustrates the final 3D BIM model of the case study building.
3.4. Mesh Reconstruction Process Using CloudCompare
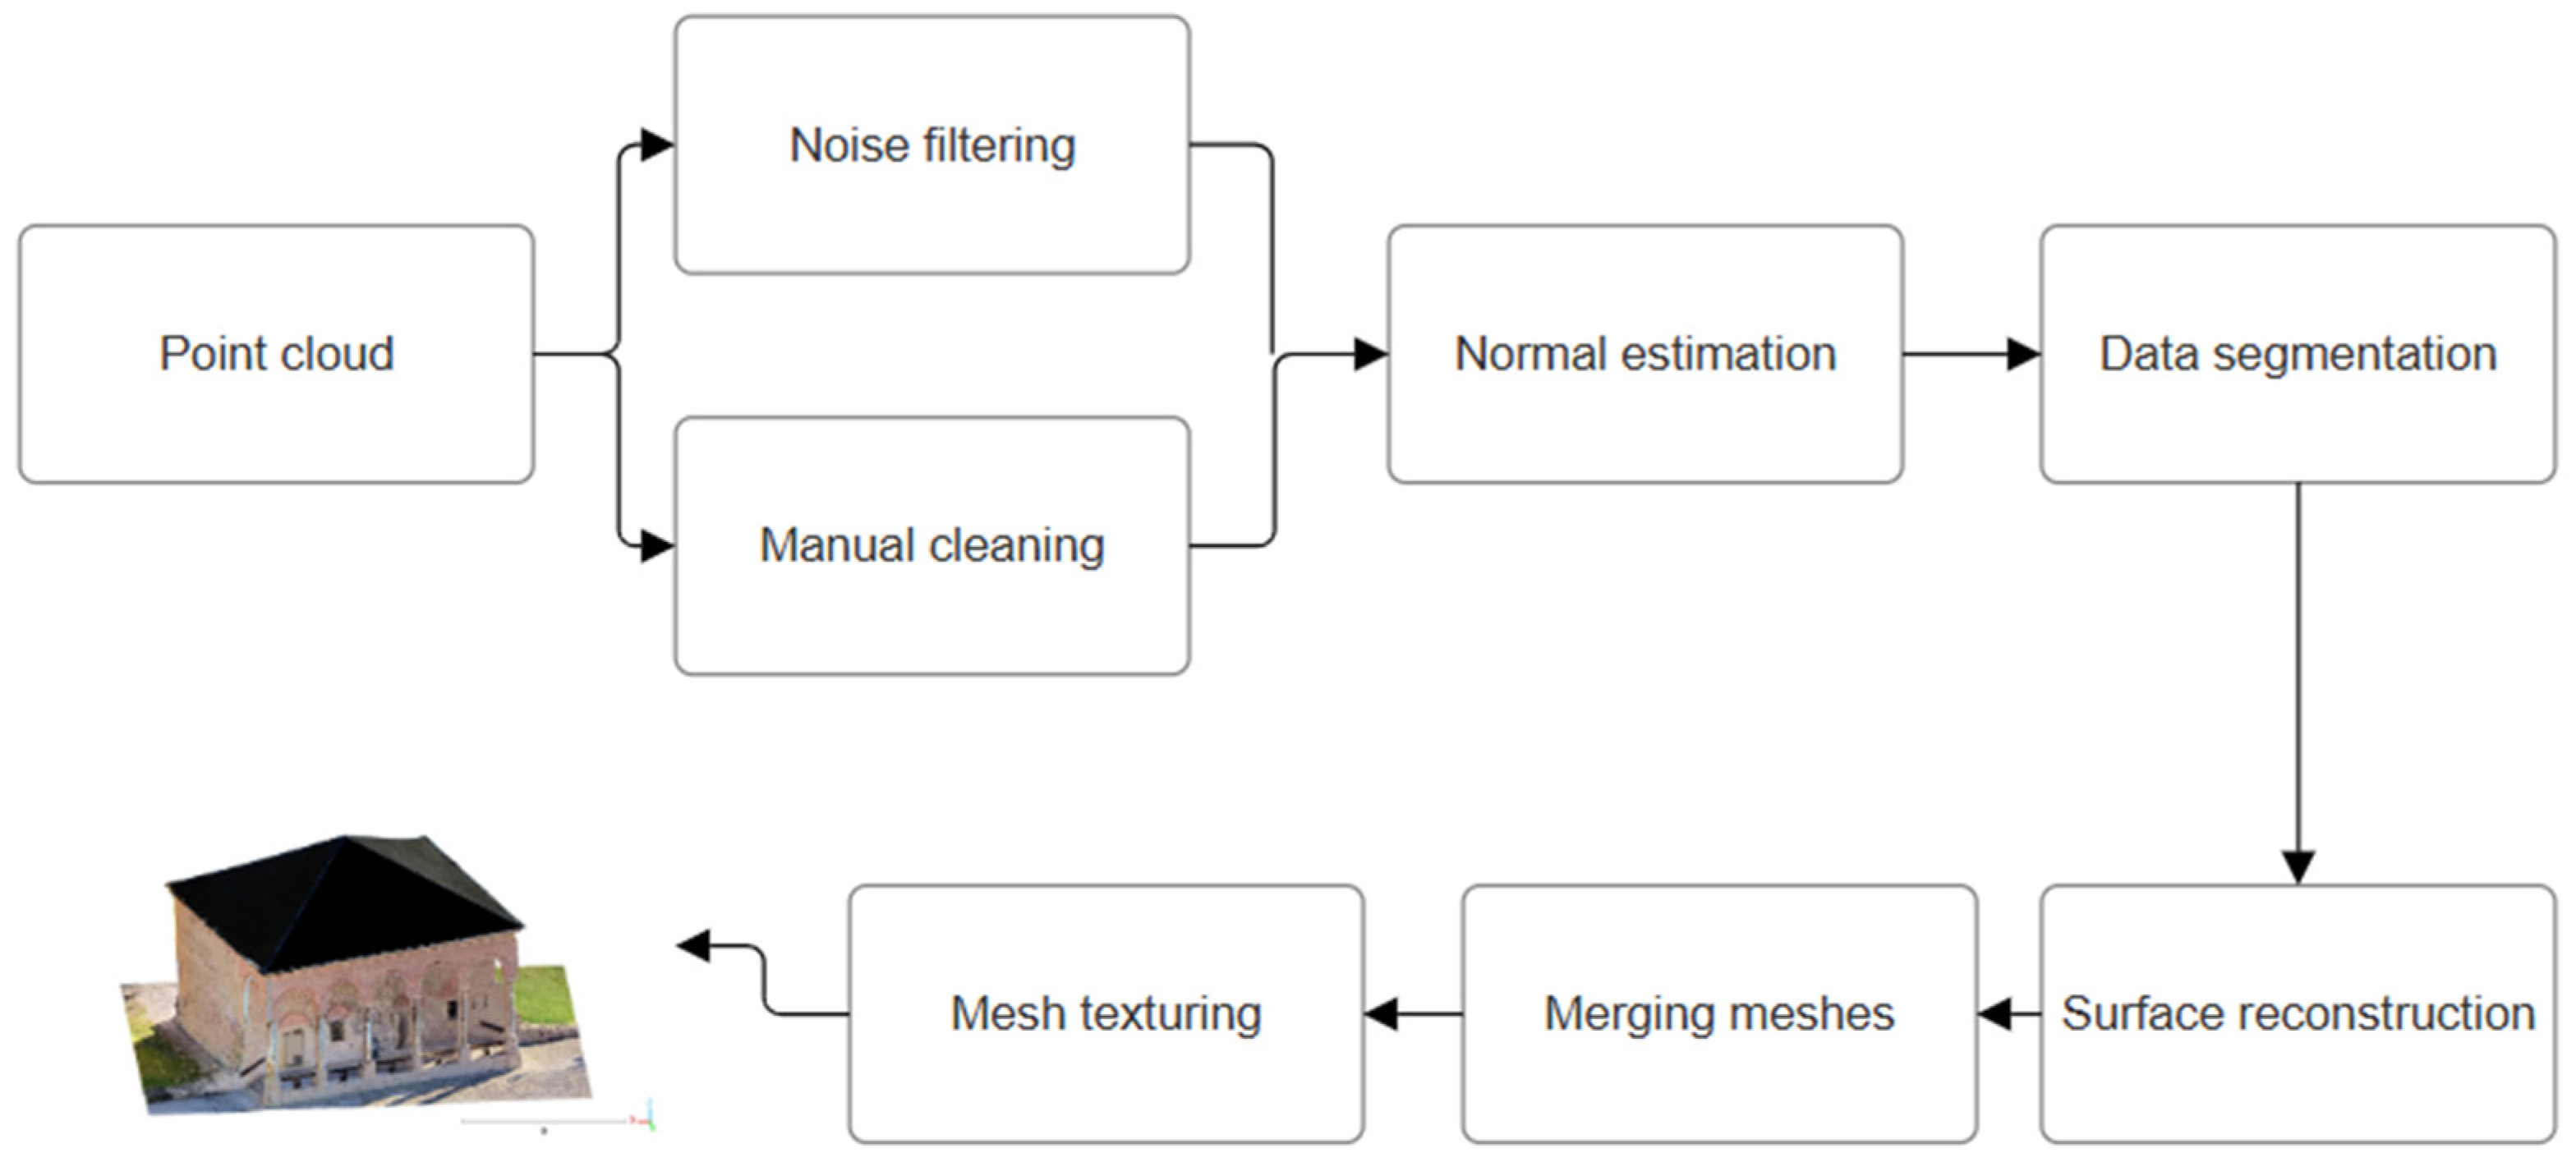
To convert the three-dimensional data into a continuous and coherent mesh model necessary for detailed visualization and advanced geometric analysis, the CloudCompare software was employed. The process involved several successive technical steps that facilitated the generation of a triangulated surface accurately representing the architectural features of the scanned building, the workflow is presented in
Figure 12.
Initially, the point cloud was filtered with scanning artifacts by applying a noise filter. The noise filter function in CloudCompare served to identify and eliminate isolated or spatially inconsistent points, those significantly deviating from the overall geometry of the scanned object. This step was important to prevent artifacts or distortions in the final mesh. At the same time, manual cleaning was also performed to further refine the data.
Next, to prepare the point cloud for surface reconstruction, normals were estimated for each point. Using the “compute normal” function [
27], the local neighborhoods of points were analyzed to determine the geometric orientation of the surface at each location. Accurate normal estimation is essential, as these directions directly influence the generation of the mesh’s triangular topology.
Due to the dataset’s complexity and size, the point cloud was manually segmented into several parts by selecting regions of interest and processing them individually. This approach allowed for more efficient processing and better control over the precision and quality of each reconstructed section.
Surface reconstruction was performed with the Poisson Surface Reconstruction plugin [
28]. Based on the algorithm by Kazhdan et al. [
19], this function generates a continuous triangular mesh from the point cloud and associated normals. It is particularly effective for surfaces with high continuity and produces clean results without significant holes or discontinuities. The Poisson Surface Reconstruction parameters were selected based on a series of iterative tests to balance detail preservation with noise reduction. The selection was guided by visual inspection of mesh smoothness and edge sharpness, aiming to retain architectural detail while minimizing surface artifacts. Reconstruction resolution was set to 0.002 m to retain maximum details. Neumann boundary conditions were chosen, in order to reduce the flattening of the edges. A value of 4.00 samples per node was used, and a point weight of 2.00 were adjusted to emphasize data fidelity over smoothing. Using density as a scalar field on the output mesh serves as a key component for refining the final model. It enables a more accurate representation by highlighting regions with varying point support, allowing users to visually evaluate how well the mesh aligns with the original point cloud. By adjusting the minimum displayed value in the mesh properties, low-density or less reliable areas can be excluded, helping to reduce noise and focus on well-defined structures. This selective filtering leads to a cleaner, more reliable mesh that is better suited for subsequent analysis or modeling workflows.
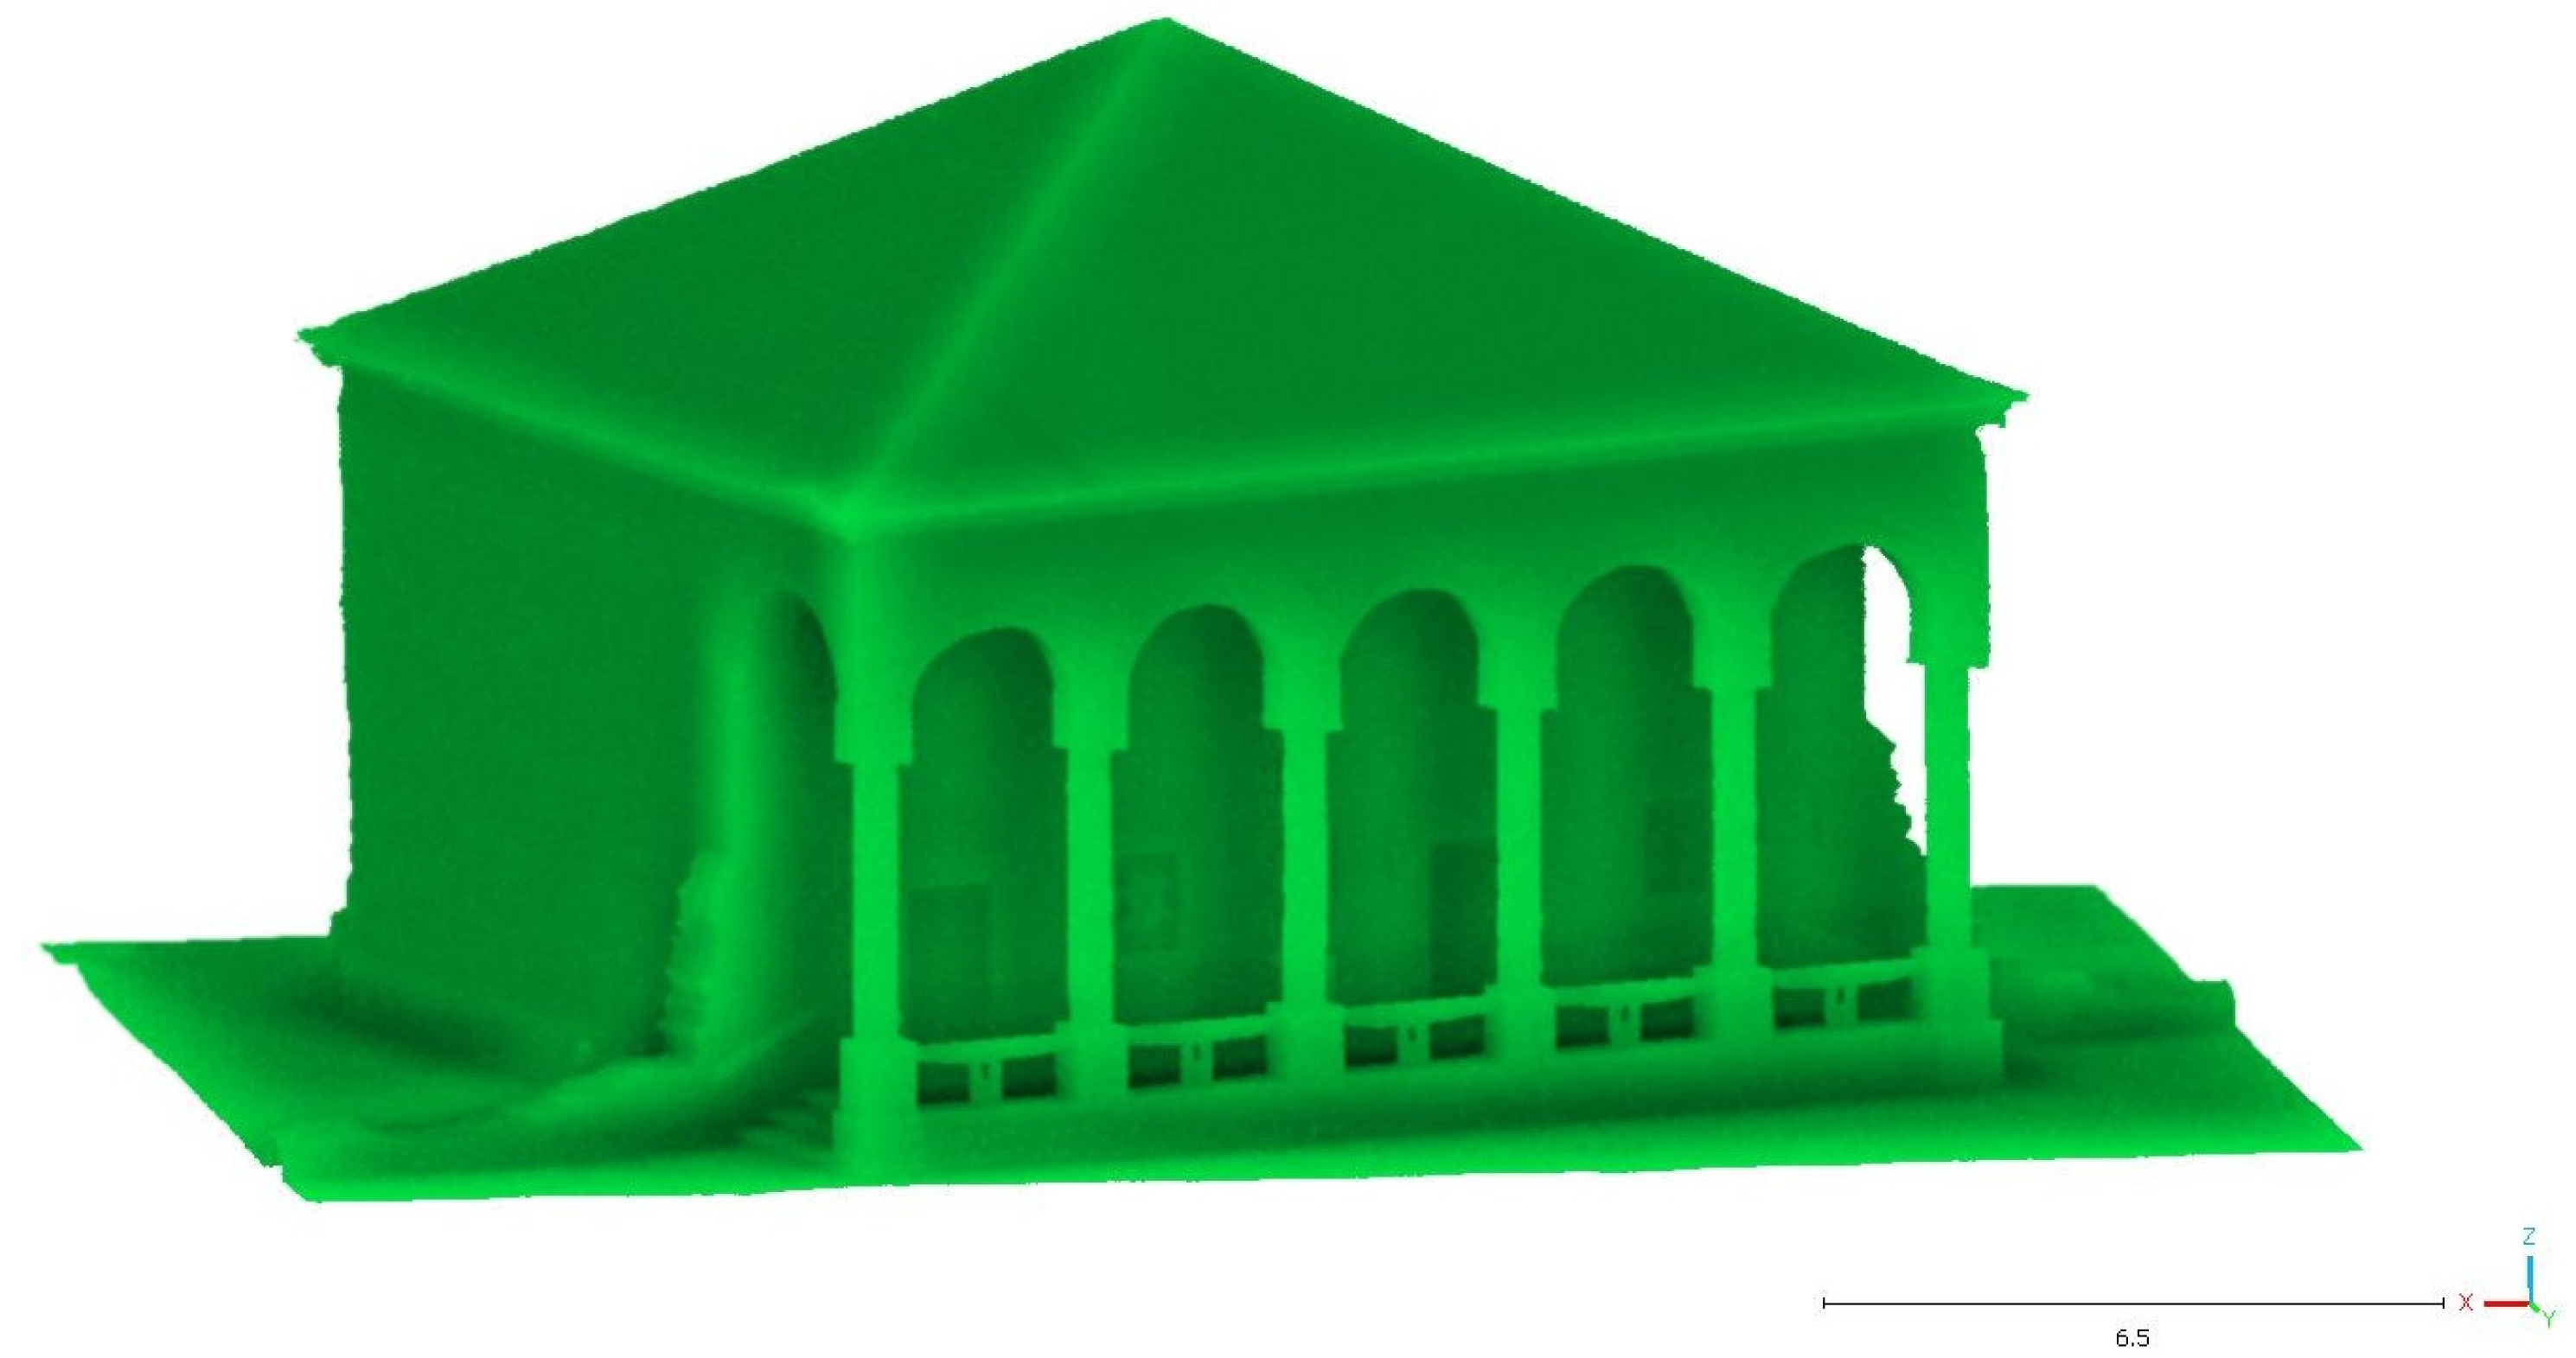
At the end of the process, all reconstructed segments were combined in CloudCompare using the Merge tool, which unifies the segments into a single entity without altering the underlying triangle topology. Although the individual meshes remain distinct at the geometric level, their accurate alignment in the common reference system ensures that overlapping boundaries give the visual impression of a continuous, complete mesh model, as shown in
Figure 13.
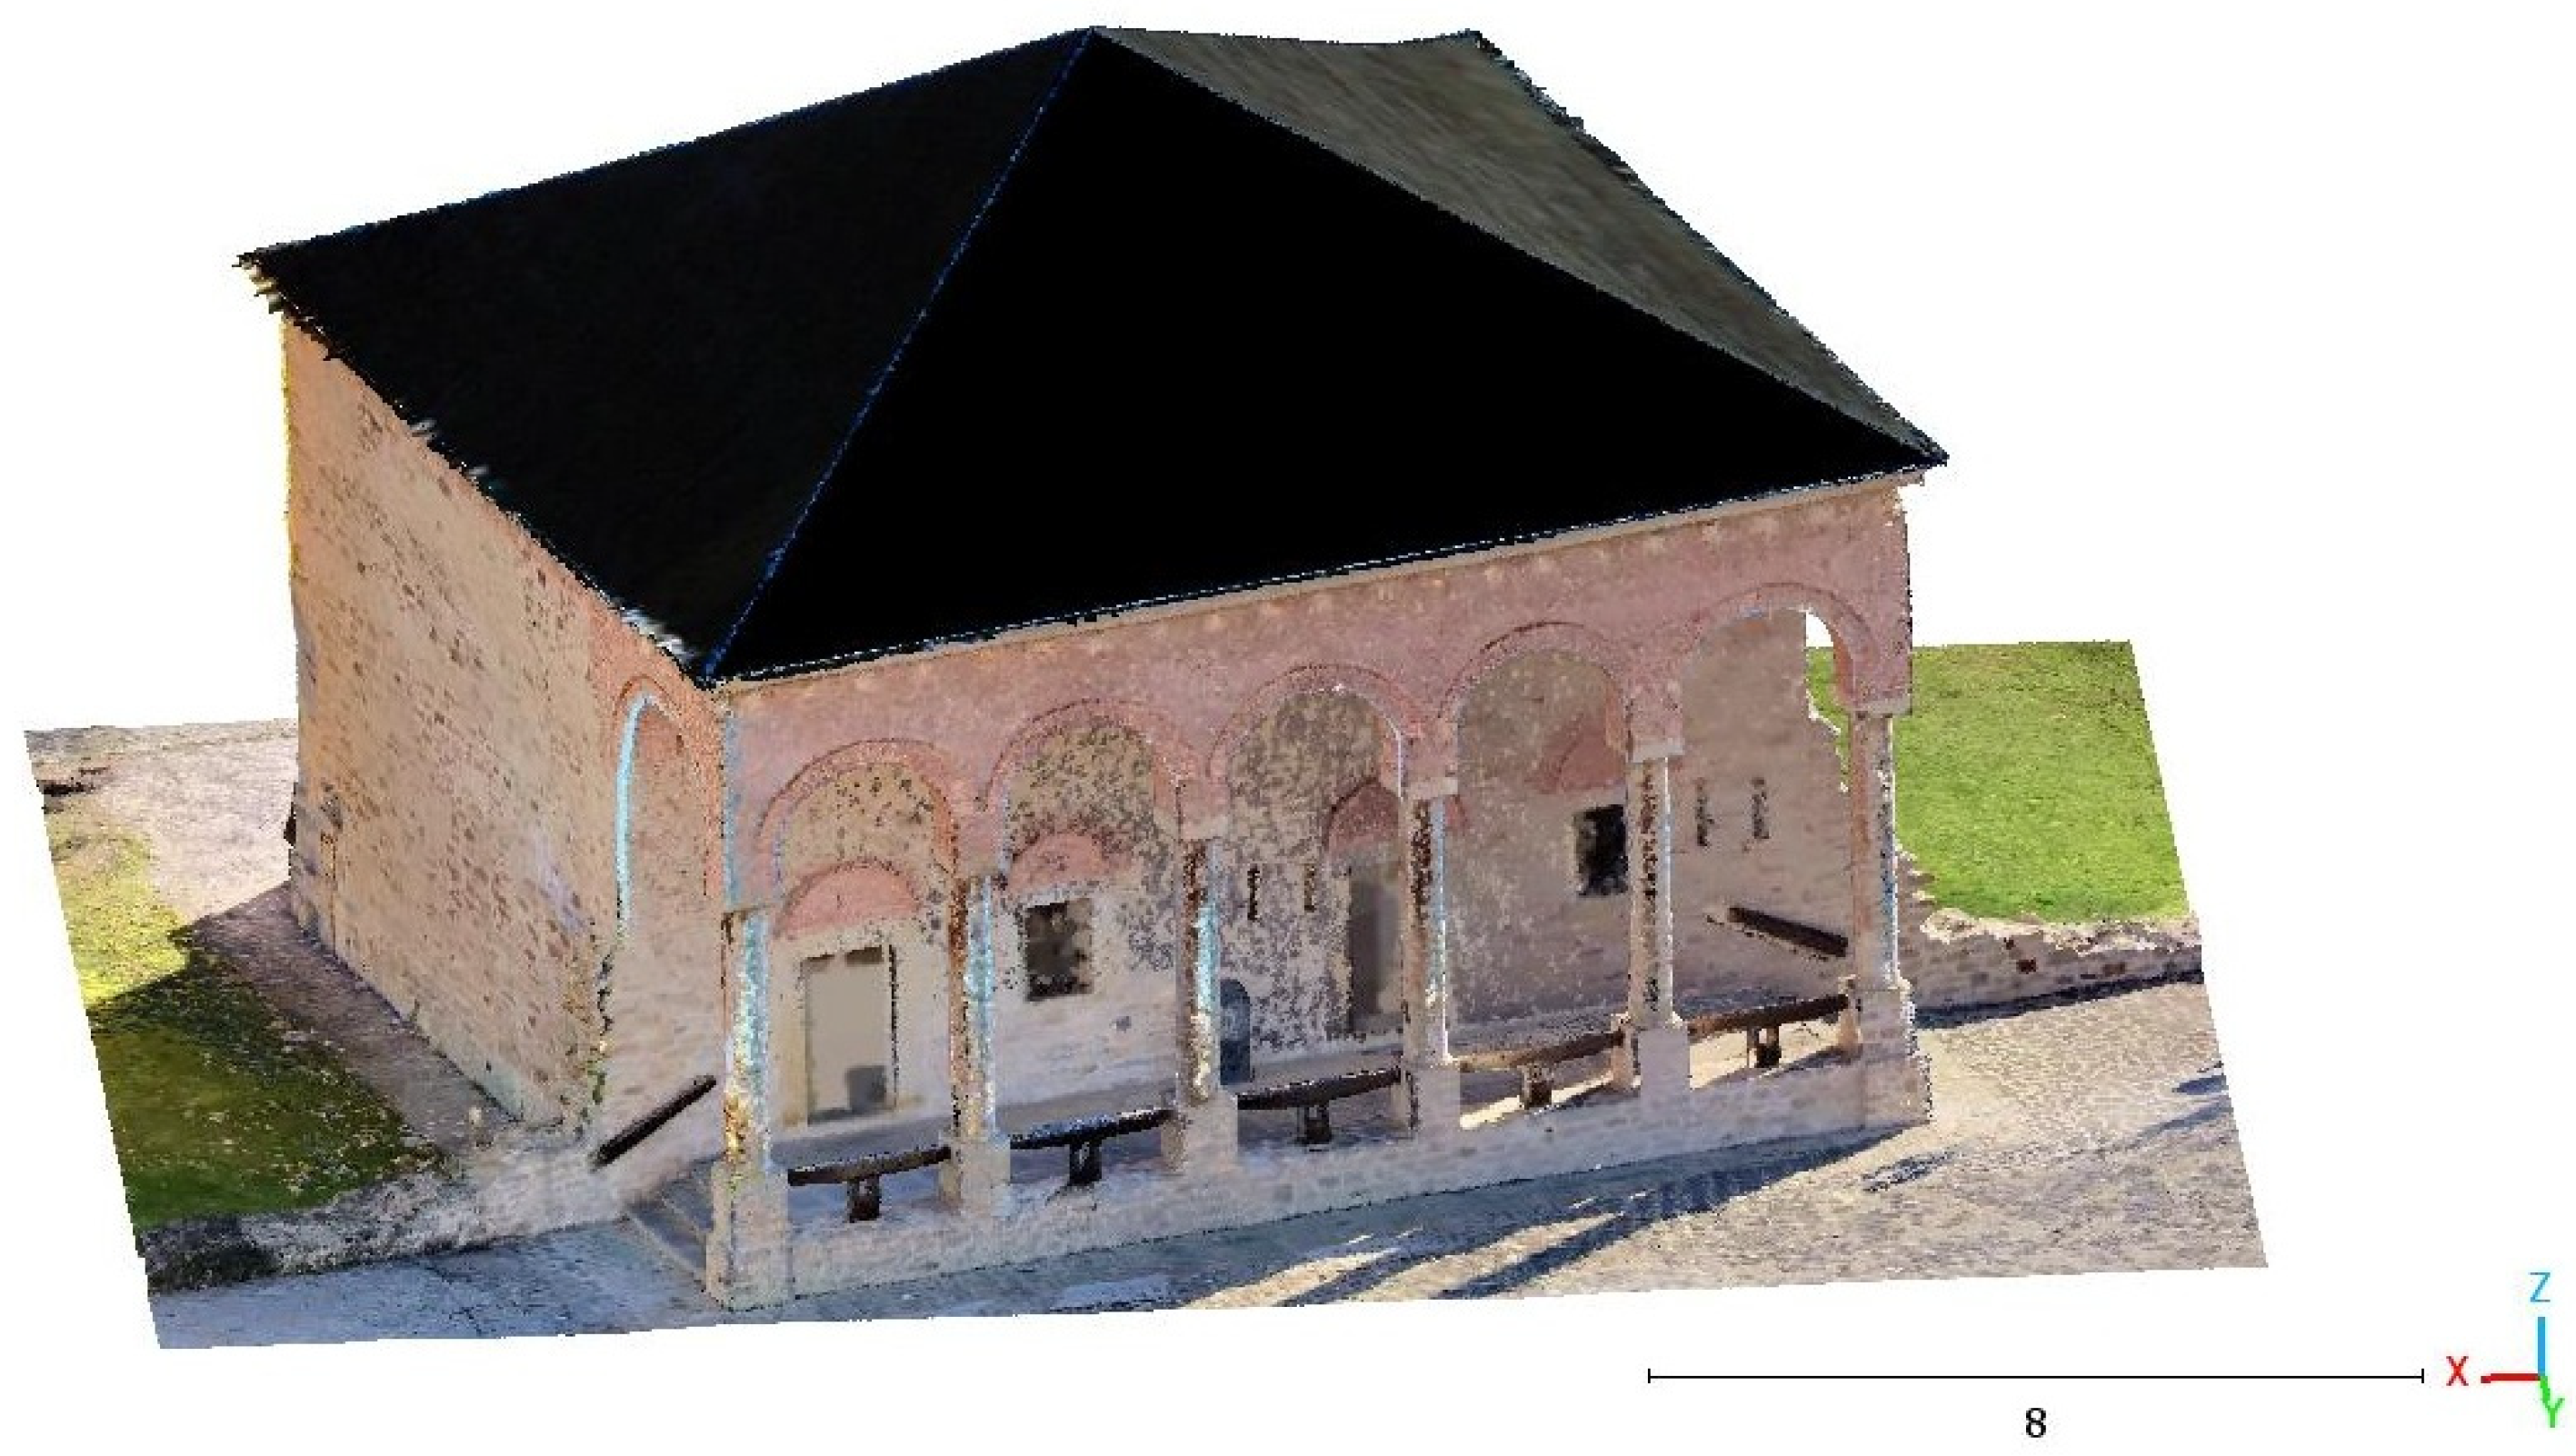
Figure 14 presents the textured mesh obtained as the outcome of the final processing step, which uses an interpolation process to apply color information directly from the point cloud. This function, available in CloudCompare, adds visual richness to the model and allows a more intuitive reading of material properties and surface conditions.
3.5. Integration of Surface Mesh Geometry into the BIM Workflow
To generate solid geometry suitable for integration into the BIM environment, Autodesk Civil 3D was used to process segmented point cloud data into a continuous and structured surface. This approach allowed the transformation of irregular architectural elements into simplified solid forms while preserving their spatial accuracy. The workflow involved a sequence of technical steps, including surface creation, mesh optimization, and solid extraction, adapted specifically for architectural applications. The complete process is illustrated in
Figure 15.
The process begins with the segmentation from the point cloud of the architectural element of interest, in this case the main arcade, because it was the most difficult part to model due to its irregular shape and the way several arches intersect. After segmenting the point cloud, “Surface Variation” tools were used to extract all the edge points, and the remainder of the cloud was decimated to improve performance of subsequent processing steps. The selected segment was then exported from CloudCompare in CSV format, containing cartesian X, Y, and Z coordinates. Within Autodesk Civil 3D, a new surface is created using the Toolspace panel under the Surfaces collection. In the Definition tab, a new point file is added, referencing the exported *.CSV file, with format and units verified against the project coordinate system. This generates a TIN surface representing the scanned geometry (
Figure 16).
Civil 3D surfaces are typically used for terrain modeling, but with some adjustments, their versatility permits repurposing for vertical or façade applications. The default triangulation settings that are initially inherited by the surface could lead to meshes that are excessively dense or topologically inconsistent. This can be fixed by modifying the surface properties, such as maximum triangle length or angle between TIN lines.
Civil 3D’s solid extraction from surfaces is limited to vertical extrusion along the Z-axis. To accommodate vertical architectural elements such as façades or other decorations, an orientation adjustment is required. The segmented point cloud can be rotated 90° about the local X or Y-axis, aligning the façade horizontally within the XY plane. Once the surface in created the “Extract Solids from Surface” tool is applied, extruding the surface to a user-defined thickness. The resulting solid body is then rotated back to its original orientation using an inverse transformation. The solid is saved as a 3D .DWG file for integration into the BIM model.
It is important to note that generating solids from high-density point clouds may negatively impact BIM performance. For this reason, the method is recommended primarily for elements with high geometric irregularity, decorative façade components, or cases where Revit’s native modeling tools are insufficient.
The exported *.dwg file is imported into Revit using a newly created “Generic Model” family template. Creating a new family is an essential step because it allows custom parameters to be assigned to the imported solid geometry, which is not possible if the file is imported directly into the project environment. The import is performed through the “Import CAD” function, with positioning set to “Auto—Origin to Origin” and units specified in meters. To add information to the imported geometry, several custom parameters are assigned, such as the material type, a condition index on a scale from 1 to 5 based on visual inspection or deformation analysis. The next step after creating the family is to import it into the main project and align it with the reference point cloud. This alignment is typically performed in orthographic views using section boxes and Revit tools. The result of this integration is shown in
Figure 17, where the solid geometry is placed correctly within the BIM environment.
4. Results
In order to objectively assess the discrepancies between the two models, a comparative analysis was carried out using the “Cloud to Mesh Distance” function available in CloudCompare software. This tool enabled the precise measurement of spatial deviations between the reference point cloud and both the parametric model created in Autodesk Revit and the mesh model derived from the same dataset. The analysis also identified the direction of deviations, distinguishing between positive and negative values.
To improve the accuracy of the analysis, the reference point cloud was preprocessed by removing non-essential elements such as vegetation and street furniture, as well as residual noise. This ensured a closer match to the actual geometry of the building. Following the comparison, the point cloud was automatically color-coded based on its distance to the 3D model. This generated a chromatic histogram that clearly illustrated the spatial distribution of geometric differences (
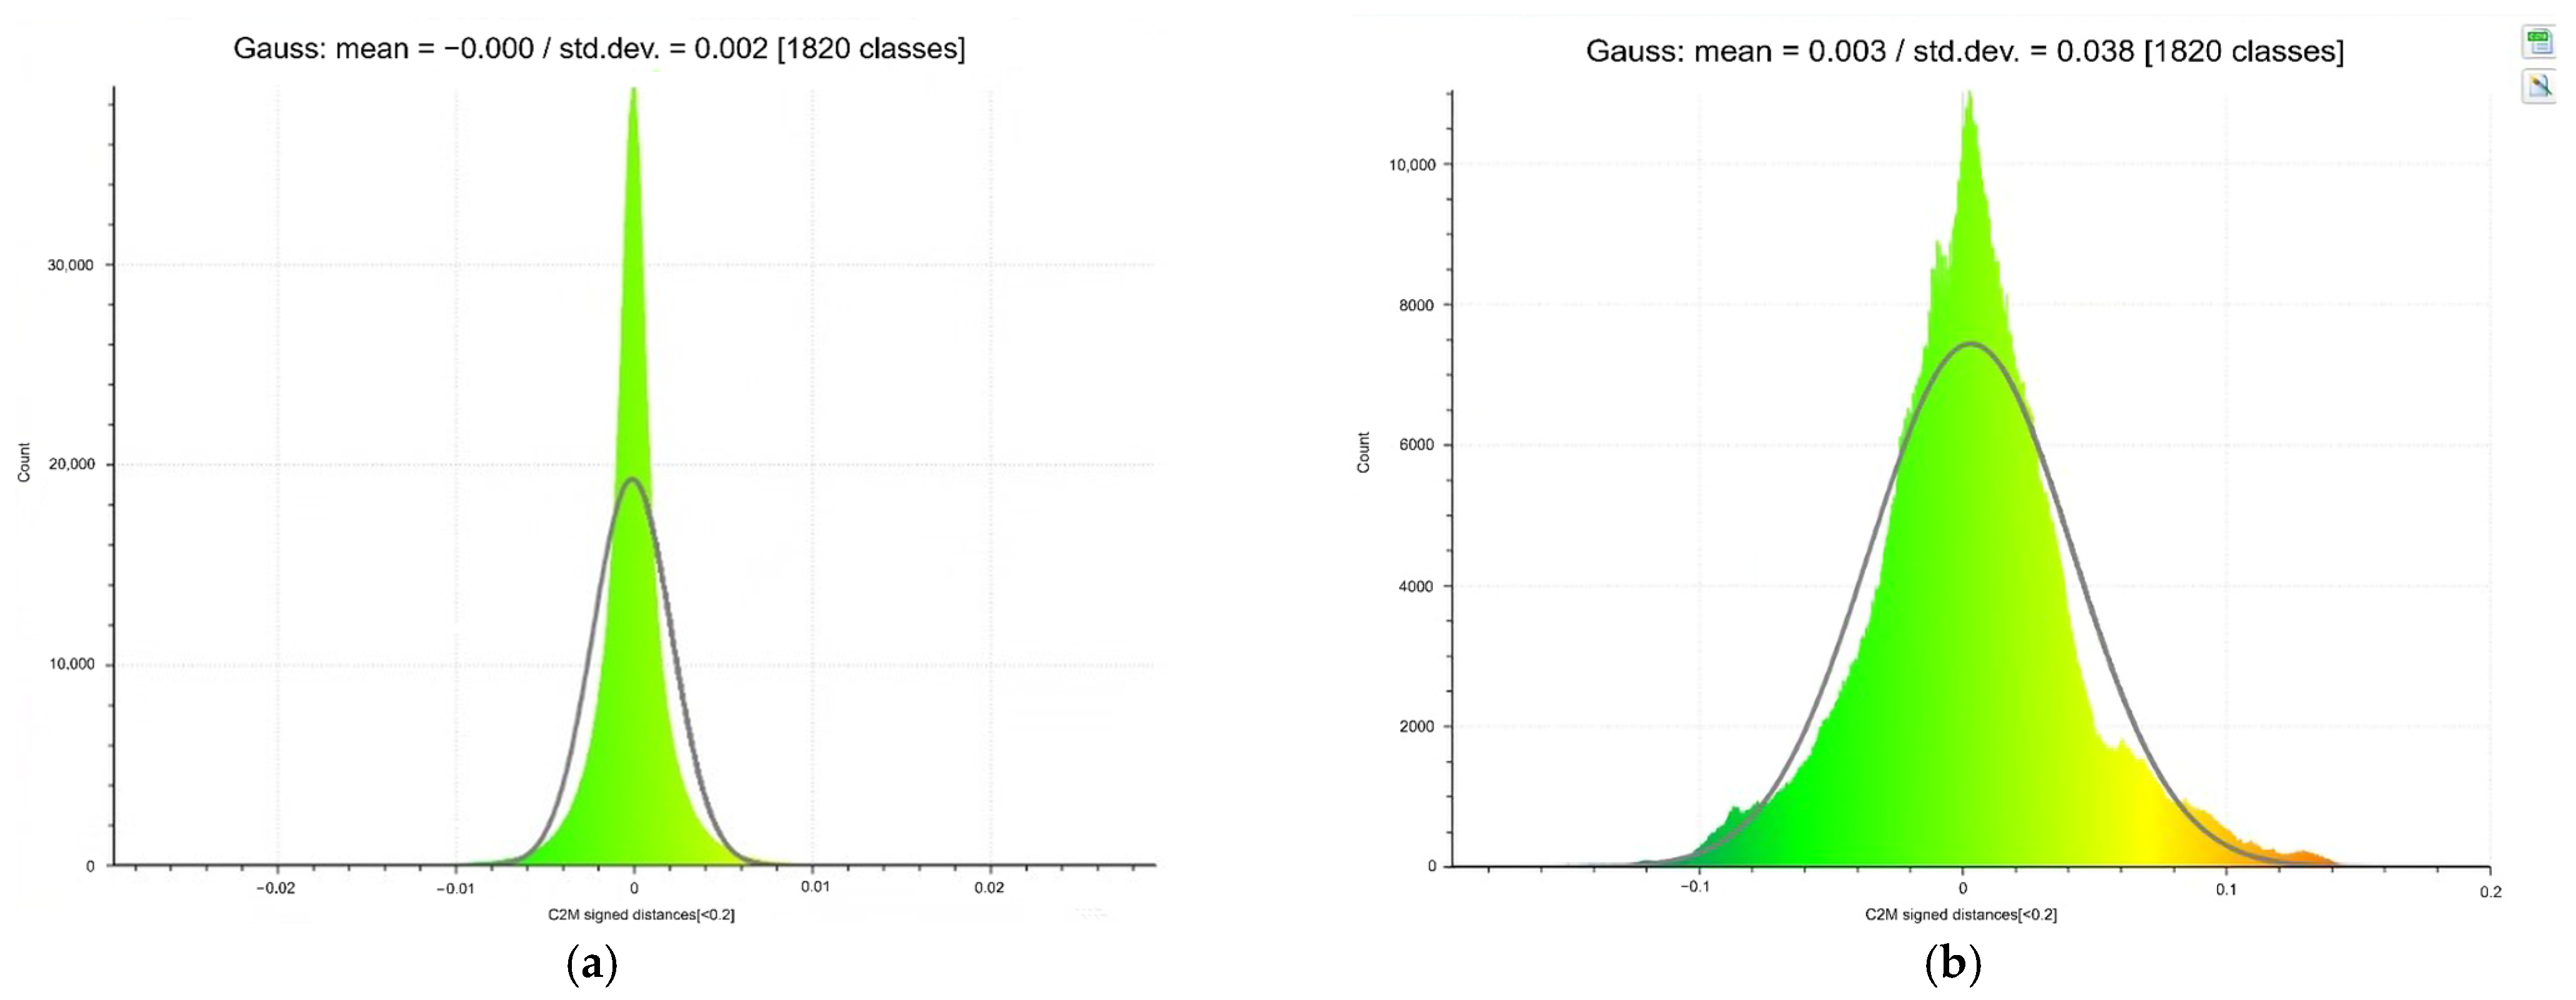
Figure 18a,b).
This visual output, together with the associated deviation histogram presented in
Figure 19 provided a detailed overview of the precision of each model and allowed the identification of areas with significant deviation. The results confirmed the relevance of such comparative analyses for validating digital representations of built heritage and for selecting the most appropriate modeling method based on the documentation objectives and required accuracy.
According to the chromatic deviation map (
Figure 20), which used a red-green-blue scale where red and blue indicate higher discrepancies and green values represent minimal deviations, the BIM model exhibited larger deviations in specific areas, particularly in the roof region and the arcades. The discrepancies observed in
Figure 19 are largely the result of limitations associated with the standardized components used in BIM and the challenges associated with manual adaptation in regions characterized by irregular geometry. In contrast, other architectural elements with simpler, more regular shapes show deviations concentrated near zero, reflected in the predominance of green tones.
The results of the geometric accuracy analysis reveal clear differences between the two modeling approaches. Based on the histograms generated in CloudCompare by computing point-to-surface distances from the reference point cloud to each tested model, the Revit-based (BIM) model showed maximum deviation values of up to 14 cm and a standard deviation of 3.8 cm (calculated by fitting a Gaussian distribution), highlighting its limitations in accurately reproducing areas with irregular geometry. In contrast, the mesh model recorded a standard deviation of only 2 mm and maximum deviations of up to 2 cm. Moreover, 95% of the compared points in the case of the mesh model exhibited deviations of less than ±0.5 cm. These findings are listed in
Table 1 and demonstrate the superior geometric fidelity of the mesh model relative to the reference point cloud, whereas the BIM model involves a series of approximations that can lead to greater deviations from the scanned reality, as illustrated in
Figure 19, which presents the histograms of spatial deviation values for both models.
Another key observation during the workflow was the significant time difference required to generate the two model types. The mesh model was produced in a relatively short time, as the geometric reconstruction relied on automated algorithms applied directly to the point cloud, requiring only preprocessing steps such as noise filtering, normal estimation, and the application of the Poisson Surface Reconstruction function. In contrast, the development of the BIM model required considerably more effort, with each architectural element modeled manually by referencing point cloud cross-sections.
The point-to-surface comparison between the Revit element and the Civil 3D-derived solid was carried out exclusively on the segmented point cloud corresponding to the main arcade. The results were consistent with the Poisson-reconstructed mesh analysis: the Revit model showed a standard deviation of 3.8 cm, while the Civil 3D method achieved a much higher geometric accuracy, with a standard deviation of only 2 mm.
Table 2 provides a comparative summary of the modeling workflows in this study and the approach proposed by Yang et al. (2019) [
18]. The comparison highlights differences in modeling strategy, input data, geometric accuracy, processing time, handling of complex geometries, software tools, and workflow limitations. While both approaches address complex geometries through segmentation and mesh thickening, the method used in this study has a simple, user-friendly workflow, without requiring advanced programming skills. The study also includes a validation procedure that quantifies the accuracy of the models.
5. Discussion
The results of the comparative analysis highlight the distinct strengths and limitations of both modeling approaches. A significant limitation of the BIM approach, particularly in the case of historical buildings, lies in the difficulty of accurately representing architectural elements with irregular geometry, such as arches, cornices, or sculptural decorations. In practice, when standard families cannot reproduce a complex form, the modeler must create or heavily adapt components. The process requires time-consuming manual adjustments and is influenced by the visual interpretation of the modeler, which inevitably introduces a degree of subjectivity and may lead to subtle detail loss or geometric simplifications, explaining the deviations of up to 14 cm. For example, when creating a ceiling in the form of an arc using two profiles, one at the beginning and one at the end, derived from two point cloud sections, the geometry in between these sections may vary in ways that are not captured by the model. This can result in further inaccuracies because the parametric family assumes a linear or interpolated form between the defined sections, failing to reproduce local undulations or irregularities present in the actual structure.
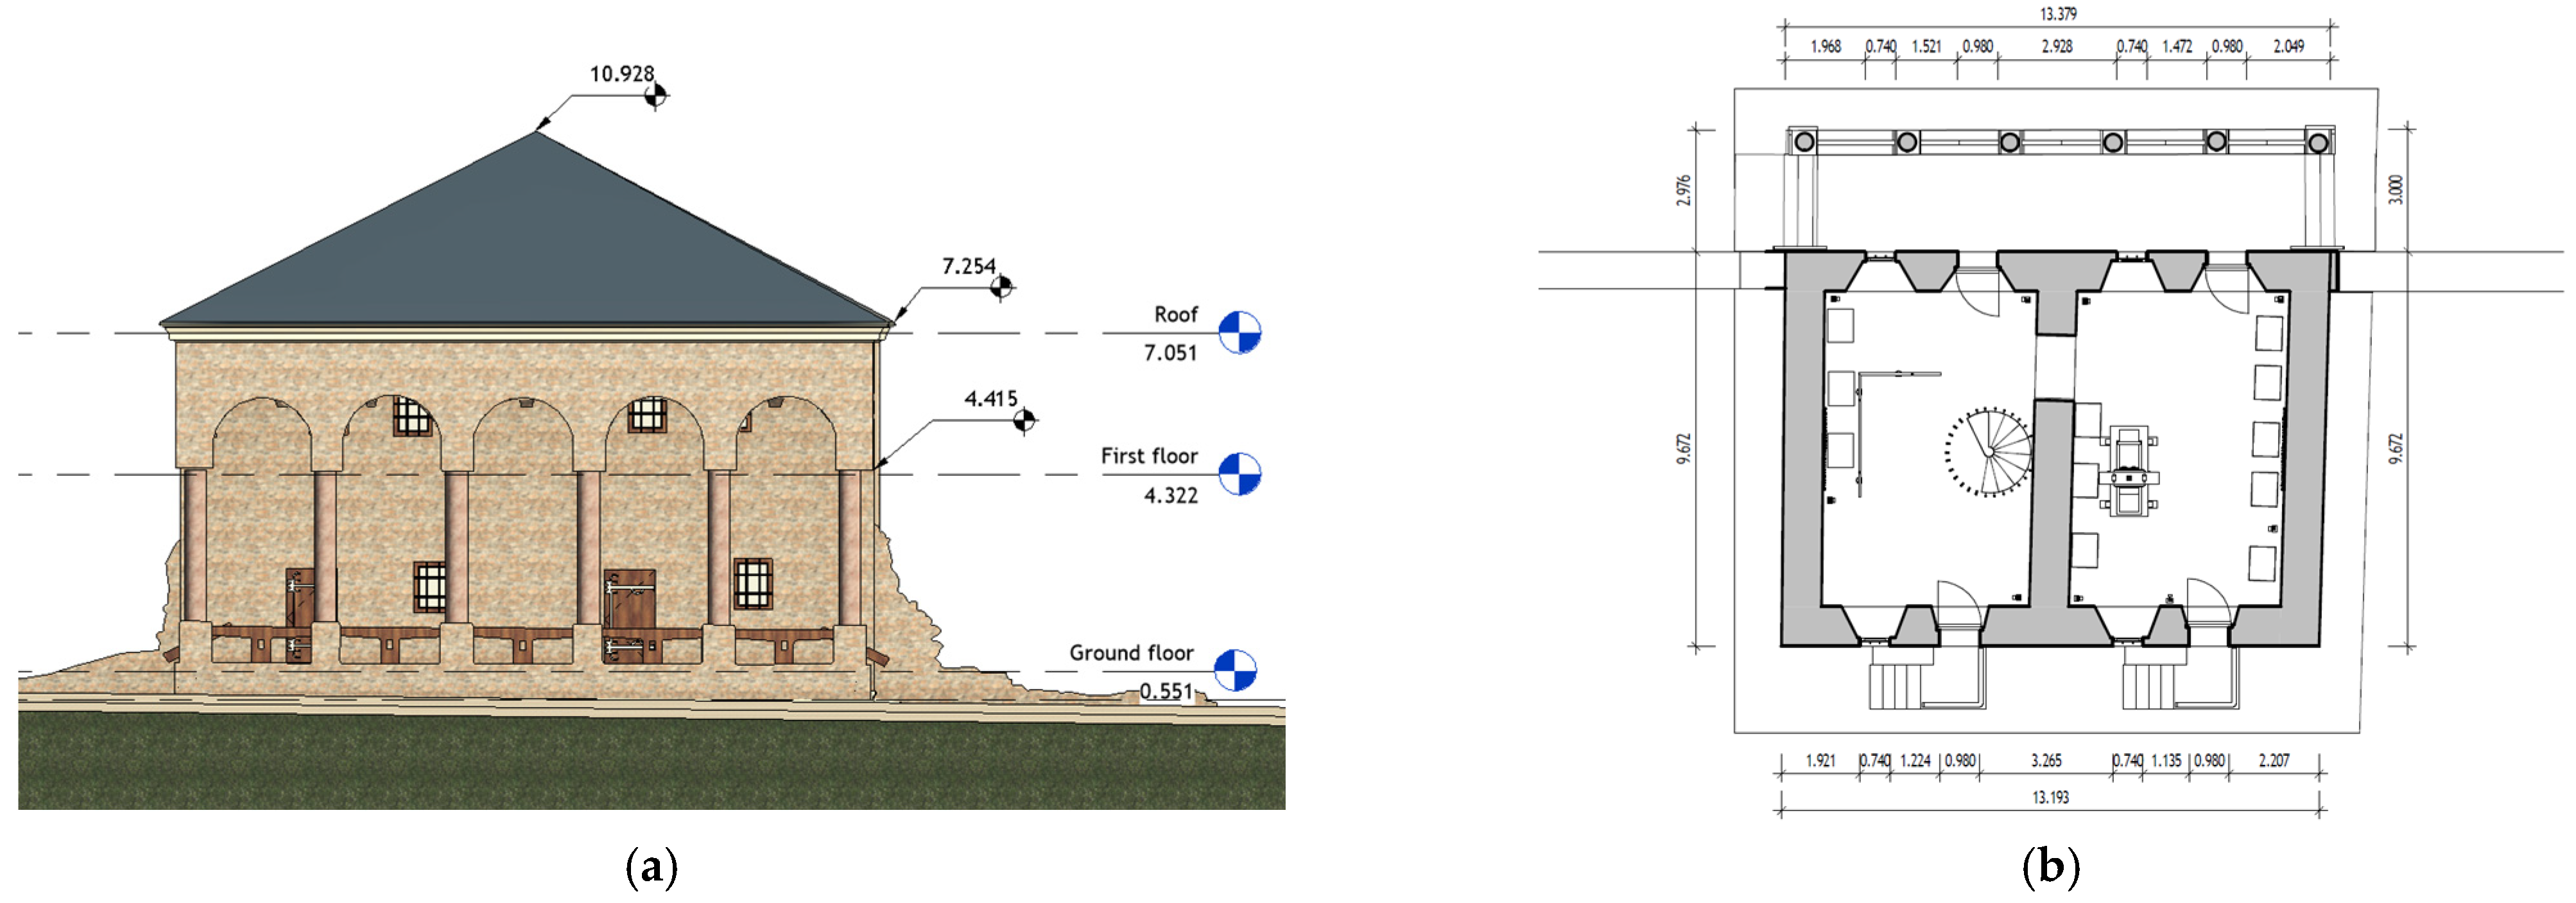
On the other hand, the BIM model proved to be highly valuable due to its parametric structure and its capacity to integrate metadata relevant for heritage management. It enables the logical segmentation of the building, the automation of calculations such as areas and volumes, the generation of technical documentation (
Figure 21), and supports decision-making processes related to conservation planning. Furthermore, the ability to associate descriptive, historical, or structural information with each element allows the BIM model to function as a comprehensive three-dimensional database.
In contrast, the mesh model, automatically generated through surface reconstruction from the point cloud, has the ability to accurately capture architectural irregularities, including surface textures, imperfections, and fine variations, as the deviation map for the mesh model displayed in
Figure 18. In other words, the mesh “sticks” to the scan data with very high accuracy. As one study notes, mesh reconstruction can create “irregular surfaces with a high degree of accuracy” that adhere to the cloud by design [
29]. This is exactly why the mesh errors were smaller than the BIM errors. This makes it particularly valuable for the authentic representation of historical buildings, where shapes do not follow strict geometric rules but are the result of craftsmanship and successive alterations over time. The mesh model thus enables detailed and realistic visualization, which is essential in applications such as virtual reconstructions, augmented reality, or digital museums.
In order to clearly emphasize the strengths and limitations of the two modeling approaches employed in this study,
Table 3 presents a synthesis of the key evaluation metrics used to compare the BIM model, developed in Autodesk Revit, and the mesh model, generated using CloudCompare.
Nonetheless, the mesh model lacks a semantic structure, limiting its utility for tasks that require logical segmentation, metadata integration, or parametric manipulation. This limitation necessitates a combined workflow, wherein both model types are used complementarily.
One such approach was further evaluated through application of the Civil 3D workflow to the main arcade, an element characterized by intersecting arches and pronounced irregularities. A triangulated surface was generated from the segmented point cloud and converted into a 3D solid, which was imported into a Revit family and positioned against the original scan. A point to surface comparison performed on the segmented arcade confirms the metric and visual correspondence: the Civil 3D derived solid achieved millimeter level agreement with the scan, with a standard deviation of approximately 2 mm and maximum deviations comparable to those measured for the Poisson mesh, while the equivalent Revit element exhibited centimeter level discrepancies, with a standard deviation of about 3.8 cm and larger local maxima. This demonstrates that it is the modeling method, not the data, that caused the BIM errors.
Despite its advantages, this method also has several limitations. First, solids imported from *.dwg files cannot host native Revit materials or textures and must rely entirely on parameters added to the geometry. Second, Civil 3D’s extrusion works only along the vertical axis, so façade data must be rotated, adding extra processing steps and risking cumulative alignment error. Third, using very dense solids while preserving geometric detail can significantly slow down BIM performance in large or complex projects. Finally, elements with double curvature or highly intricate forms cannot be captured.
Nonetheless, when applied carefully to key architectural features, the Civil 3D workflow represents an important advance in bringing detailed scan data into heritage BIM environments.
The workflow is scalable, but may face challenges when applied to larger or more intricate structures, especially those with reflective or vegetated surfaces that compromise scan quality. Data acquisition using TLS and HMLS remains time-intensive, and increasing architectural complexity can affect both data acquisition and processing times. Moreover, mesh reconstruction, whether through Poisson Surface Reconstruction or Civil 3D TIN surfaces can become computationally expensive with high-resolution scans. However, preprocessing techniques like down-sampling or selective segmentation can help balance detail with efficiency.
The results of this study have significant potential for practical applications in cultural heritage protection. By combining the parametric information inherent in BIM with the high-precision geometric characteristics of the reconstructed mesh models, conservation practitioners can make more informed decisions regarding preservation strategies, risk assessment, and restoration planning. For instance, accurate dimensional data models can identify areas of structural vulnerability, while BIM parameters enable scenario simulations and resource planning.
6. Conclusions
This study demonstrated the feasibility and efficiency of combining terrestrial laser scanning technologies with three-dimensional modeling methods, BIM and mesh reconstruction, for the documentation and analysis of a historically significant building, the Dosoftei House in Iasi city, Romania. The innovative contributions of the research consist of the proposal of a dual-model comparative framework that objectively evaluates deviations between BIM and mesh models, the development of a workflow that allows the integration of complex irregular geometries into the BIM environment through Civil 3D processing and Revit families, and the demonstration of a complementary strategy where BIM provides semantic organization and management functions while the mesh model ensures geometric fidelity and detailed visualization.
The comparative analysis between the two models, carried out using the “Cloud-to-Mesh Distance” function, highlighted localized geometric discrepancies and showed that in irregular areas such as arches and ornamental elements, the BIM tends to simplify the actual geometry. Moreover, the time required to produce a coherent BIM was found to be significantly greater than the time needed for mesh reconstruction, emphasizing the need for specialized teams and careful planning in heritage digitization projects.
Applied selectively to the main arcade, the Civil 3D workflow generated solids that aligned with the original scan within a 5 mm range, successfully capturing complex geometries that exceed the reach of conventional parametric methods.
The study also presents several limitations that must be acknowledged. The BIM model shows accuracy constraints due to reliance on standardized parametric components, which reduce its capacity to reproduce irregular geometries. The Civil 3D workflow is limited by the inability to host native Revit materials, restrictions in extrusion orientation, and the risk of reduced performance when handling very dense solids. The mesh model, despite its geometric precision, lacks semantic structure and therefore cannot support restoration planning or parametric operations on its own. In addition, the validation of the Civil 3D–based integration for specific features was limited to visual and metric assessment without a complete statistical deviation analysis.
Overall, these results show that using different modeling tools together really pays off for heritage work. When you combine BIM for detailed building data, mesh reconstruction for fine shapes, and Civil 3D only where it is needed, you achieve the better results. The integrated workflow holds potential beyond heritage applications. In industrial or infrastructure contexts where complex geometries coexist with the need for semantic modeling (e.g., for facilities management), our approach could support hybrid documentation strategies. However, the value proposition may differ, as modern structures are often more amenable to conventional BIM workflows.
Future research should explore automated segmentation, improved mesh-to-BIM pipelines, and performance optimizations to extend the Civil 3D approach to broader classes of architectural elements.
