Article

Biochar Control of Water Regime and Adsorption Rate in Soils

1
Faculty of Chemical Technology, University of Chemistry and Technology Prague, Technická 5, 166 28 Prague, Czech Republic
2
Faculty of Environmental Technology, University of Chemistry and Technology Prague, Technická 5, 166 28 Prague, Czech Republic
3
Institute of Chemical Process Fundamentals, The Czech Academy of Sciences, Rozvojová 1/135, 165 00 Prague, Czech Republic
*
Author to whom correspondence should be addressed.
Appl. Sci. 2025, 15(17), 9392; https://doi.org/10.3390/app15179392
Submission received: 8 July 2025 / Revised: 7 August 2025 / Accepted: 25 August 2025 / Published: 27 August 2025

Abstract

The effect of adding 10% biochar (B) or sludgechar (SL) on the water regime and adsorption properties of soils was tested on composites prepared by mixing two standard soils of loamy and clay type with B or SL in a 90:10 weight ratio. Water-holding capacity was assessed as initial (2 h) and equilibrium (24 h). Water retention time was estimated by evaporation from saturated samples at 20 °C to a constant weight. The composites exhibited a 60–90% increase in water absorption compared to the individual soils, retaining water up to 3–6 days longer than the individual soils. The adsorption properties were tested for cation (Pb2+) and anion (Sb(OH)6) adsorption and for Pb2+ and Sb(OH)6 co-adsorption from model solutions under laboratory conditions. All samples showed higher selectivity for Pb2+, with the adsorption efficiency from 40% to 99%. Sb(OH)6 adsorption achieved a maximum efficiency of only 10%. Pb2+ and Sb(OH)6 co-adsorptions were efficient for Sb(OH)6 adsorption, reaching efficiency levels above 95%. At prolonged reaction times, the adsorption efficiency elevated by more than 20%. Only 10% wt. addition of biochar or sludgechar enhanced not only the water regime of soils but also their adsorption capacity for ionic contaminants.

1. Introduction

Biochar is formed as a product of pyrolysis, which represents one of the oldest methods of biomass thermal treatment [1]. During the process, the plant mass changes into a highly porous and stable material with unique physicochemical properties. Although specific biochar characterisation is related to many aspects, such as the feedstock and pyrolysis conditions [2,3], various types of biochar are constantly finding new applications, not only in agriculture but also in industrial and environmental technologies. Due to the different requirements for the properties and price of biochar, production is still targeted at optimising conditions according to the customer’s needs. Numerous papers have presented the characterisation of biochar with respect to different feedstocks [4,5,6], pyrolysis temperatures [2,7,8], heating rates and atmosphere [2,9], and/or reactor configurations [10]. The comparison of biochar characterisations in the above-mentioned aspects allows to deduce its potential application considering its specific properties [3].
Despite the ever-expanding study of new biochar applications, its utilisation as a soil conditioner and as an amendment to container substrate in agriculture is one of its most important and beneficial uses. Adding biochar to soil usually modifies its physical and chemical properties by increasing the cation exchange capacity (CEC), surface area, pH value, water-holding capacity, and plant productivity [11,12,13]. Among others, biochar generally improves soil water retention due to its high porosity, specific surface area, and water absorption capacity, particularly in sandy soils. Enhanced water retention leads to a less surface runoff and soil erosion, and it also increases the amount of water accessible to plants, potentially reducing irrigation needs. However, the impact on soil water dynamics varies based on the biochar type, soil properties, and environmental conditions [14].
In addition to its widespread soil applications, increased attention has been recently paid to biochar’s possible utilisation in water treatment. Numerous studies have focused on the treatment of agricultural wastewater, mostly in relation to pesticides [15,16] and nitrates [17]. Recently, biochar and its modified forms were effectively used in the adsorption of organic dyes [18] and heavy metals [19,20]. The mechanism of heavy metals removal usually involves surface adsorption, ion exchange, precipitation, and complexation [21]. A broad application prospect for heavy metals removal consists of the negatively charged biochar surface providing effective adsorption sites for the prevailing cationic forms of heavy metals in water [22].
Currently, the environmental challenge is focused on finding novel and sustainable ways to utilise sewage sludge and preserve its carbon and nutrient content [23]. While biochar primarily has a natural origin without any contamination load, sludgechar is the product of sewage sludge processing and contains a number of harmful substances [24,25]. Pyrolysis, as a thermal treatment, has become the most favourable method of wastewater sludge processing due to its unambiguous benefits, particularly the exploration of waste resources [26], the substantial decrease in their toxicity, and the reduction of waste volume and transportation costs [27]. Unlike the well-known and frequently cited biochar approach, the optimal conditions for wastewater sludge treatment [28,29], as well as new applications for sludgechar in environmental technologies [30] or energy recovery [31], are still being developed.
The aim of this work was to evaluate the general effect of biochar/sludgechar (10% wt.) on the water regime and adsorption properties of soils. For the preparation of biochar/sludgechar–soil composites, two different standard soils were selected. The changes in water retention of the soil composites compared to the pure soils were studied in a three-cycle process. The adsorption selectivity of the soils and soil composites to cations and anions in the soil solution was then tested on lead (Pb), as Pb2+, and antimony (Sb), as Sb(OH)6, which are among the most hazardous contaminants not only in traffic heavy and shooting range areas but also in regions suffering from conflict.

2. Materials and Methods

2.1. Standard Soils

For the preparation of the soil composites, two standard soils (LUFA Spreyer, Speyer, Germany) with different physicochemical and structural properties were selected. The ‘2.1’ is a coarse-grained loamy sand soil, while the ‘6S’ represents the clay soil type, containing more than 40% clay. The key characteristics of the standard soils are provided in Table 1.

2.2. Soil Additives

As soil additives, the commercial biochar ‘nature carbon’ (B), produced by the gasification of woody biomass of the chips from single-use pallets in a multi-stage twin-fire reactor at the combined heat and power and biochar production plant in Zlatá Olešnice (the Czech Republic), and the sewage sludge-derived biochar (SL), produced by the pyrolysis of dried sewage sludge at 600–650 °C in a Pyreg GmbH PX500 reactor in operation at the wastewater treatment plant in Bohuslavice-Trutnov (the Czech Republic), were used. Both materials were homogenised and finally sieved to 0.850 mm. The main chemical and surface characteristics of B and SL are summarised in Table 2.

2.3. Preparation of Soil Composites

The mixtures of the standard soil (2.1 or 6S) and appropriate additive (B or SL) were prepared as dry mixtures of 2.1 with B or 2.1 with SL, and 6S with B or 6S with SL, respectively. The additive-to-soil ratio was maintained at 10:90 wt%. This ratio was chosen to simulate surface incorporation of the additive to the soil profile, which could be feasible in practice. Each mixture was then suspended in distilled water to achieve a better homogeneity, agitated in a batch manner at 20 °C for 24 h, filtered with a 0.45 µm membrane cellulose filter, dried at 60 °C, and homogenised mechanically in the mortar [32,33]. The prepared soil composites were labelled as 2.1-B; 2.1-SL, 6S-B, and 6S-SL. An illustrative photo of the selected composite adsorbents is shown in Figure 1, and their surface properties are summarised in Table 3.

2.4. Water Regime of Soil Composites

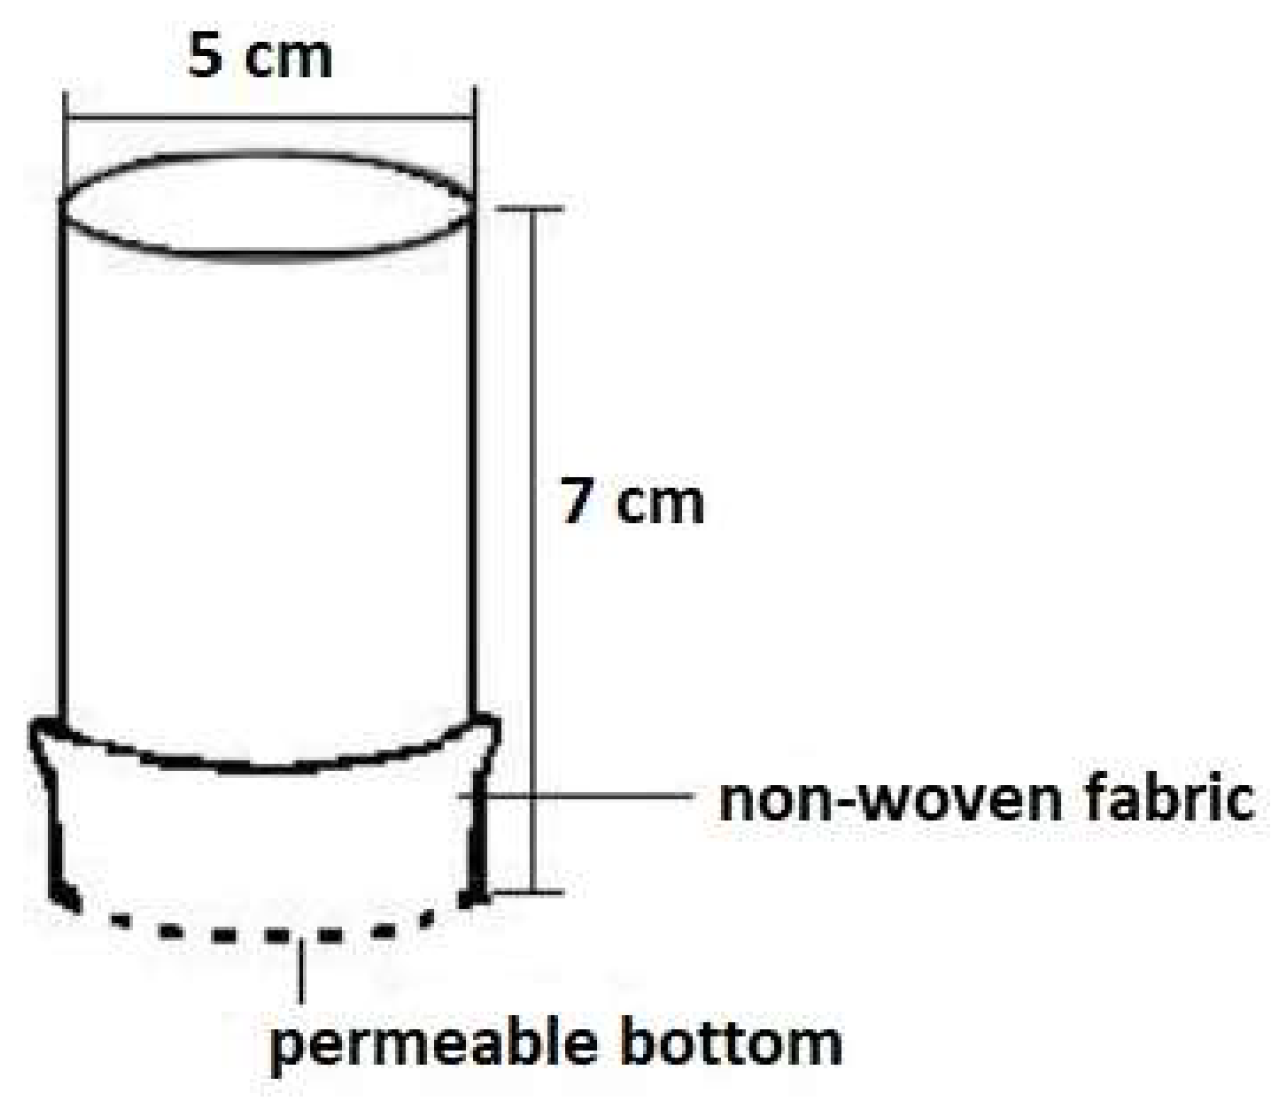
Defined amounts of standard soil (20–40 g) or similar amounts of its mixture with the appropriate additive (B or SL, 10% wt.) were placed into plastic cylindrical containers with a permeable bottom made from non-woven fabric (UHELON 130 T, Silk & Progress Company, Brněnec, Czech Republic) with a mesh size of 42 μm (Figure 2). Then, the containers were submerged in tap water (20 °C) to a depth of 1–2 mm and weighed differentially after 2 and 24 h. The water level was kept constant throughout the whole experiment. The initial (2 h) and equilibrium (24 h) relative water-holding capacities (Cin, Ceq in g·kg−1) were calculated as follows:
C i n   C e q = m i n m e q m v m · 1000
where min/meq is the mass of the container with the solid sample after 2 h/24 h water saturation (g), mv is the mass of the container with the dry solid sample before water saturation, and m is the initial mass of the dry solid sample (g).
The samples saturated with water (after 24 h) were used for the follow-up study of water retention. The saturated soil columns were subjected to water evaporation in air at laboratory temperature (20 °C) to a constant weight. The relative daily water loss from the saturated soils and soil composites (Ri in g·kg−1.day−1) was expressed via breakthrough curves, where Δmwi is the loss of water between the i − 1 and i measurements (g), Δti is the corresponding time between the i − 1 and i measurements (h), and m is the initial mass of the dry solid sample (g):
R i = Δ m w i m · 24 t i · 1000
The water saturation of containers with dry adsorbent, leading to the determination of initial (2 h) and equilibrium (24 h) relative water-holding capacities, and their subsequent evaporation to a constant weight was repeated identically three times in the above-described manner to verify the changes in water regime during the “three-cycle” process.

2.5. Model Solutions

Model solutions of the tested toxic ions (Pb2+ and Sb(OH)6) were prepared from analytical-grade inorganic salts (Pb(NO3)2 and NaSb(OH)6 4H2O, respectively) in distilled water at a concentration of 0.5 mmol L−1 and their natural pH values (≈4.5 for Pb2+ and ≈6.0 for Sb(OH)6). The concentration was selected as appropriate for simulating a heavily contaminated water system [32,33].
The model solution for the co-adsorption of oppositely charged ions (Pb2+ and Sb(OH)6) was prepared in the same regime, with a total concentration of 0.5 mmol L−1—that is, ≈0.25 mmol L−1 for Pb2+ and 0.25 mmol L−1 for Sb(OH)6, to maintain the same contamination load of the simulated water system. The reason for using the same concentration for both ions was to compare their behaviour in the presence of the same sorbent under identical conditions.

2.6. Adsorption Experiments

In the adsorption experiments, the Pb2+ and Sb(OH)6 were adsorbed from the model solutions on the standard soils (2.1 or 6S) and on the soil composites (2.1-B, 2.1-SL, 6S-B, and 6S-SL).
A suspension of model solution (25 mL) and a defined adsorbent dose (5 g L−1 for Pb2+ adsorption and 20 g L−1 for Sb(OH)6 adsorption) were agitated in a batch manner at laboratory temperature (20 °C) for 24 h and 72 h. The optimal adsorbent dosage and reaction time were determined according to preliminary experiments [32,33]. Finally, the product was filtered off with a 0.45 µm membrane cellulose filter, and the filtrate was analysed for residual Pb or Sb content.
The co-adsorption of studied ions on the standard soils (2.1 or 6S) and the soil composites (2.1-B, 2.1-SL, 6S-B and 6S-SL) was made in the same mode as the single ion adsorption.
As the parameters calculated from the linearised Langmuir isotherm showed that the adsorption did not follow the Langmuir model, only experimental data were used for the calculations. The equilibrium amount of adsorbate caught in the solid phase (q) was calculated using Equation (3), where V0 is the volume of the solution (L), c0 is the initial concentration of the adsorbate in the solution (mol·L−1), c is the equilibrium concentration of the adsorbate in the solution (mol·L−1), and m is the mass of the solid phase (g):
q = V 0 ( c 0 c ) m
The adsorption efficiency was then calculated using Equation (4), where ε is the adsorption yield (%):
ε = 100 c × 100 c 0
All adsorption and co-adsorption experiments were performed twice, and the q and ε values calculated from experimentally obtained Pb/Sb concentrations were taken as the average of two measurements.

2.7. Analytical Methods

X-ray fluorescence analyses (XRF) of the solid phase were performed using an ARL 9400 XP+ spectrometer (ARL, Ecublens, Switzerland) at a voltage of 20–60 kV and a probe current of 40–80 mA, with an effective area of 490.6 mm2. UniQuant 4 software was used to evaluate the data (Thermo ARL, Ecublens, Switzerland).
The specific surface area (SBET) was measured on a Micromeritics ASAP 2020 (accelerated surface area and porosimetry) analyser (Micromeritics, Norcross, GA, USA) using gas sorption. The ASAP 2020 device assesses single- and multipoint BET surface areas and the Langmuir surface area, performs Temkin and Freundlich isotherm analyses, and determines pore volume and pore area distributions in the micro- and macropore ranges. Macro- and micropore samples were analysed using the Horvath–Kavazoe method and Barret–Joyner–Halenda method (BJH), respectively. In the BHJ method, N2 was used as the analysis adsorbent, and the analysis bath temperature was −195.8 °C. The samples were degassed at 313 K for 1000 min.
The point of zero charge (pHZPC) was determined using the zeta potential analyser Stabino, version 2.0 (Particle Metrix GmbH, Meerbusch, Germany), equipped with a cylindrical polytetrafluoroethylene measuring beaker and piston. The pHZPC was measured using the pH titration method to assess stable pH regions and determine the isoelectric point (IEP) with an extremely high resolution (0.1 pH). Three suspensions of the same solid sample in a KCl solution with an identical solid-to-liquid ratio (1:100) but different ionic strengths of KCl (0.1 M, 0.01 M, and 0.001 M) were titrated to the IEP by 0.01 M HCl or NaOH in a dynamic regime. The pHZPC was calculated as the average of three pH values corresponding to the zero potential with a standard deviation range of 0.05–0.7 pH units.
The concentration of Pb in liquid samples was measured by performing atomic absorption spectrometry (AAS) using a SpectrAA-880 VGA 77 unit (Varian, Palo Alto, CA, USA) in flame mode. The accuracy of the AAS analyses was guaranteed by the Laboratory of Atomic Absorption Spectrometry of University of Chemistry and Technology Prague, Czech Republic, with a detection limit of 0.5 µg L−1 and a standard deviation ranging from 5% to 10% of the mean.
The concentration of total Sb as SbO43− in liquid samples was measured by performing hydride generation atomic fluorescence spectrometry (HG-AFS) using a PSA 10.055 Millennium Excalibur system (PS Analytical, Kent, UK). The samples were pretreated with a solution of HCl (36% w/v) and KI (50%) with ascorbic acid (10%). The measurement was performed in milligram per litre and microgram per litre modes using HCl (12%) with a KI + ascorbic acid solution as a reagent blank and 7% NaBH4 in 0.1 mol L−1 NaOH as a reductant. The detection limit was 5 µg L−1, and the standard deviation was experimentally determined to be 2.5%.

3. Results and Discussion

3.1. Water Regime of Standard Soils and Soil Composites

The ability of the soils and soil composites to absorb and retain water was verified by a three-cycle experiment (Section 2.4). The comparison of the initial (2 h) and equilibrium (24 h) water capacities of the standard soils and their relevant composites (Figure 3) indicated an apparent increase in the composite water capacities compared to individual soils.
The graph for the initial (2 h, dashed lines) and equilibrium (24 h, solid lines) water absorption capacities illustrated quite rapid water saturation in all monitored systems. The difference between initial and equilibrium capacity values did not exceed 5%.
As also evident from the graphs in Figure 3a,b, the relative water-holding capacities of 6S, 6S-SL, and 6S-B illustrated values up to twice as high compared to 2.1, 2.1-SL, and 2.1-B, respectively. This trend corresponded well to the different characteristics of both standard soils. The prevailing portion of clay fraction, an order of magnitude higher specific surface area (SBET), and cation exchange capacity (CEC) values predicted better absorption and surface properties of 6S compared to 2.1 [34].
While the individual soils (2.1 and 6S) showed a slight loss of capacity cycle by cycle, the composites tended to keep the absorbed water at the same or even higher levels. The B additive (green lines) contributed to water absorption much more intensively than SL (red lines). This phenomenon resulted from the different parameters of both materials, especially the Corg content and SBET value (Table 2) [23,34].
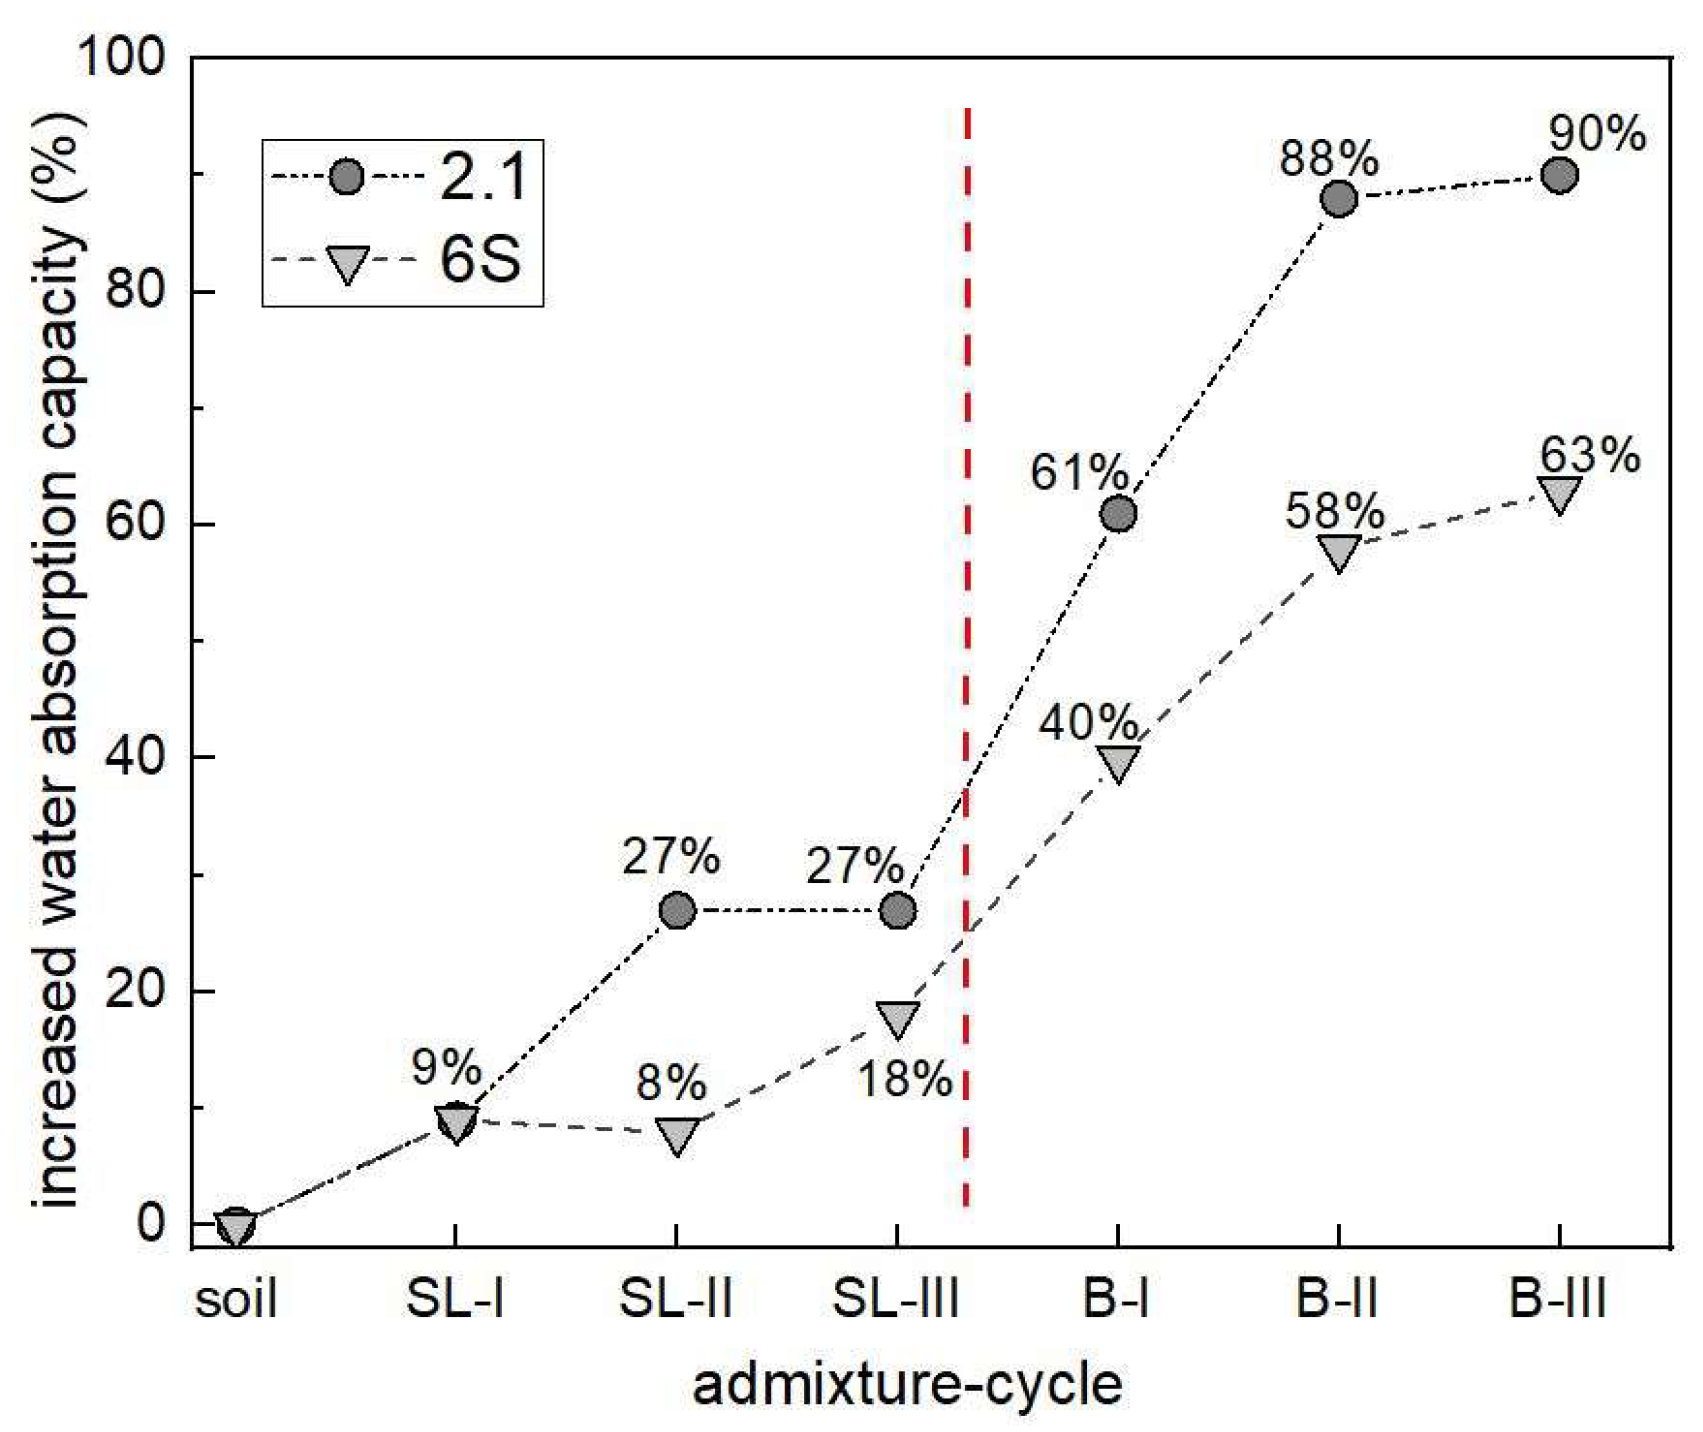
Regardless of the amount of SL/B addition to the soil, the relative increase in water absorption capacity was high. As can be seen from the graph in Figure 4, the 2.1 capacity increased by 30% with the addition of SL and by up to 90% with the addition of B. In the case of 6S, the water retention capacity increased by 18% with SL and by more than 60% with B. A higher percentage increase in water retention capacities of sandy soil (2.1) composites can be explained by the difference in the capacities of individual soils (2.1 and 6S), from which the relative increase was derived. In sandy soil (2.1) with less than half the capacity compared to clay soil (6S), the relative increase due to the addition of SL or B was significantly more pronounced.
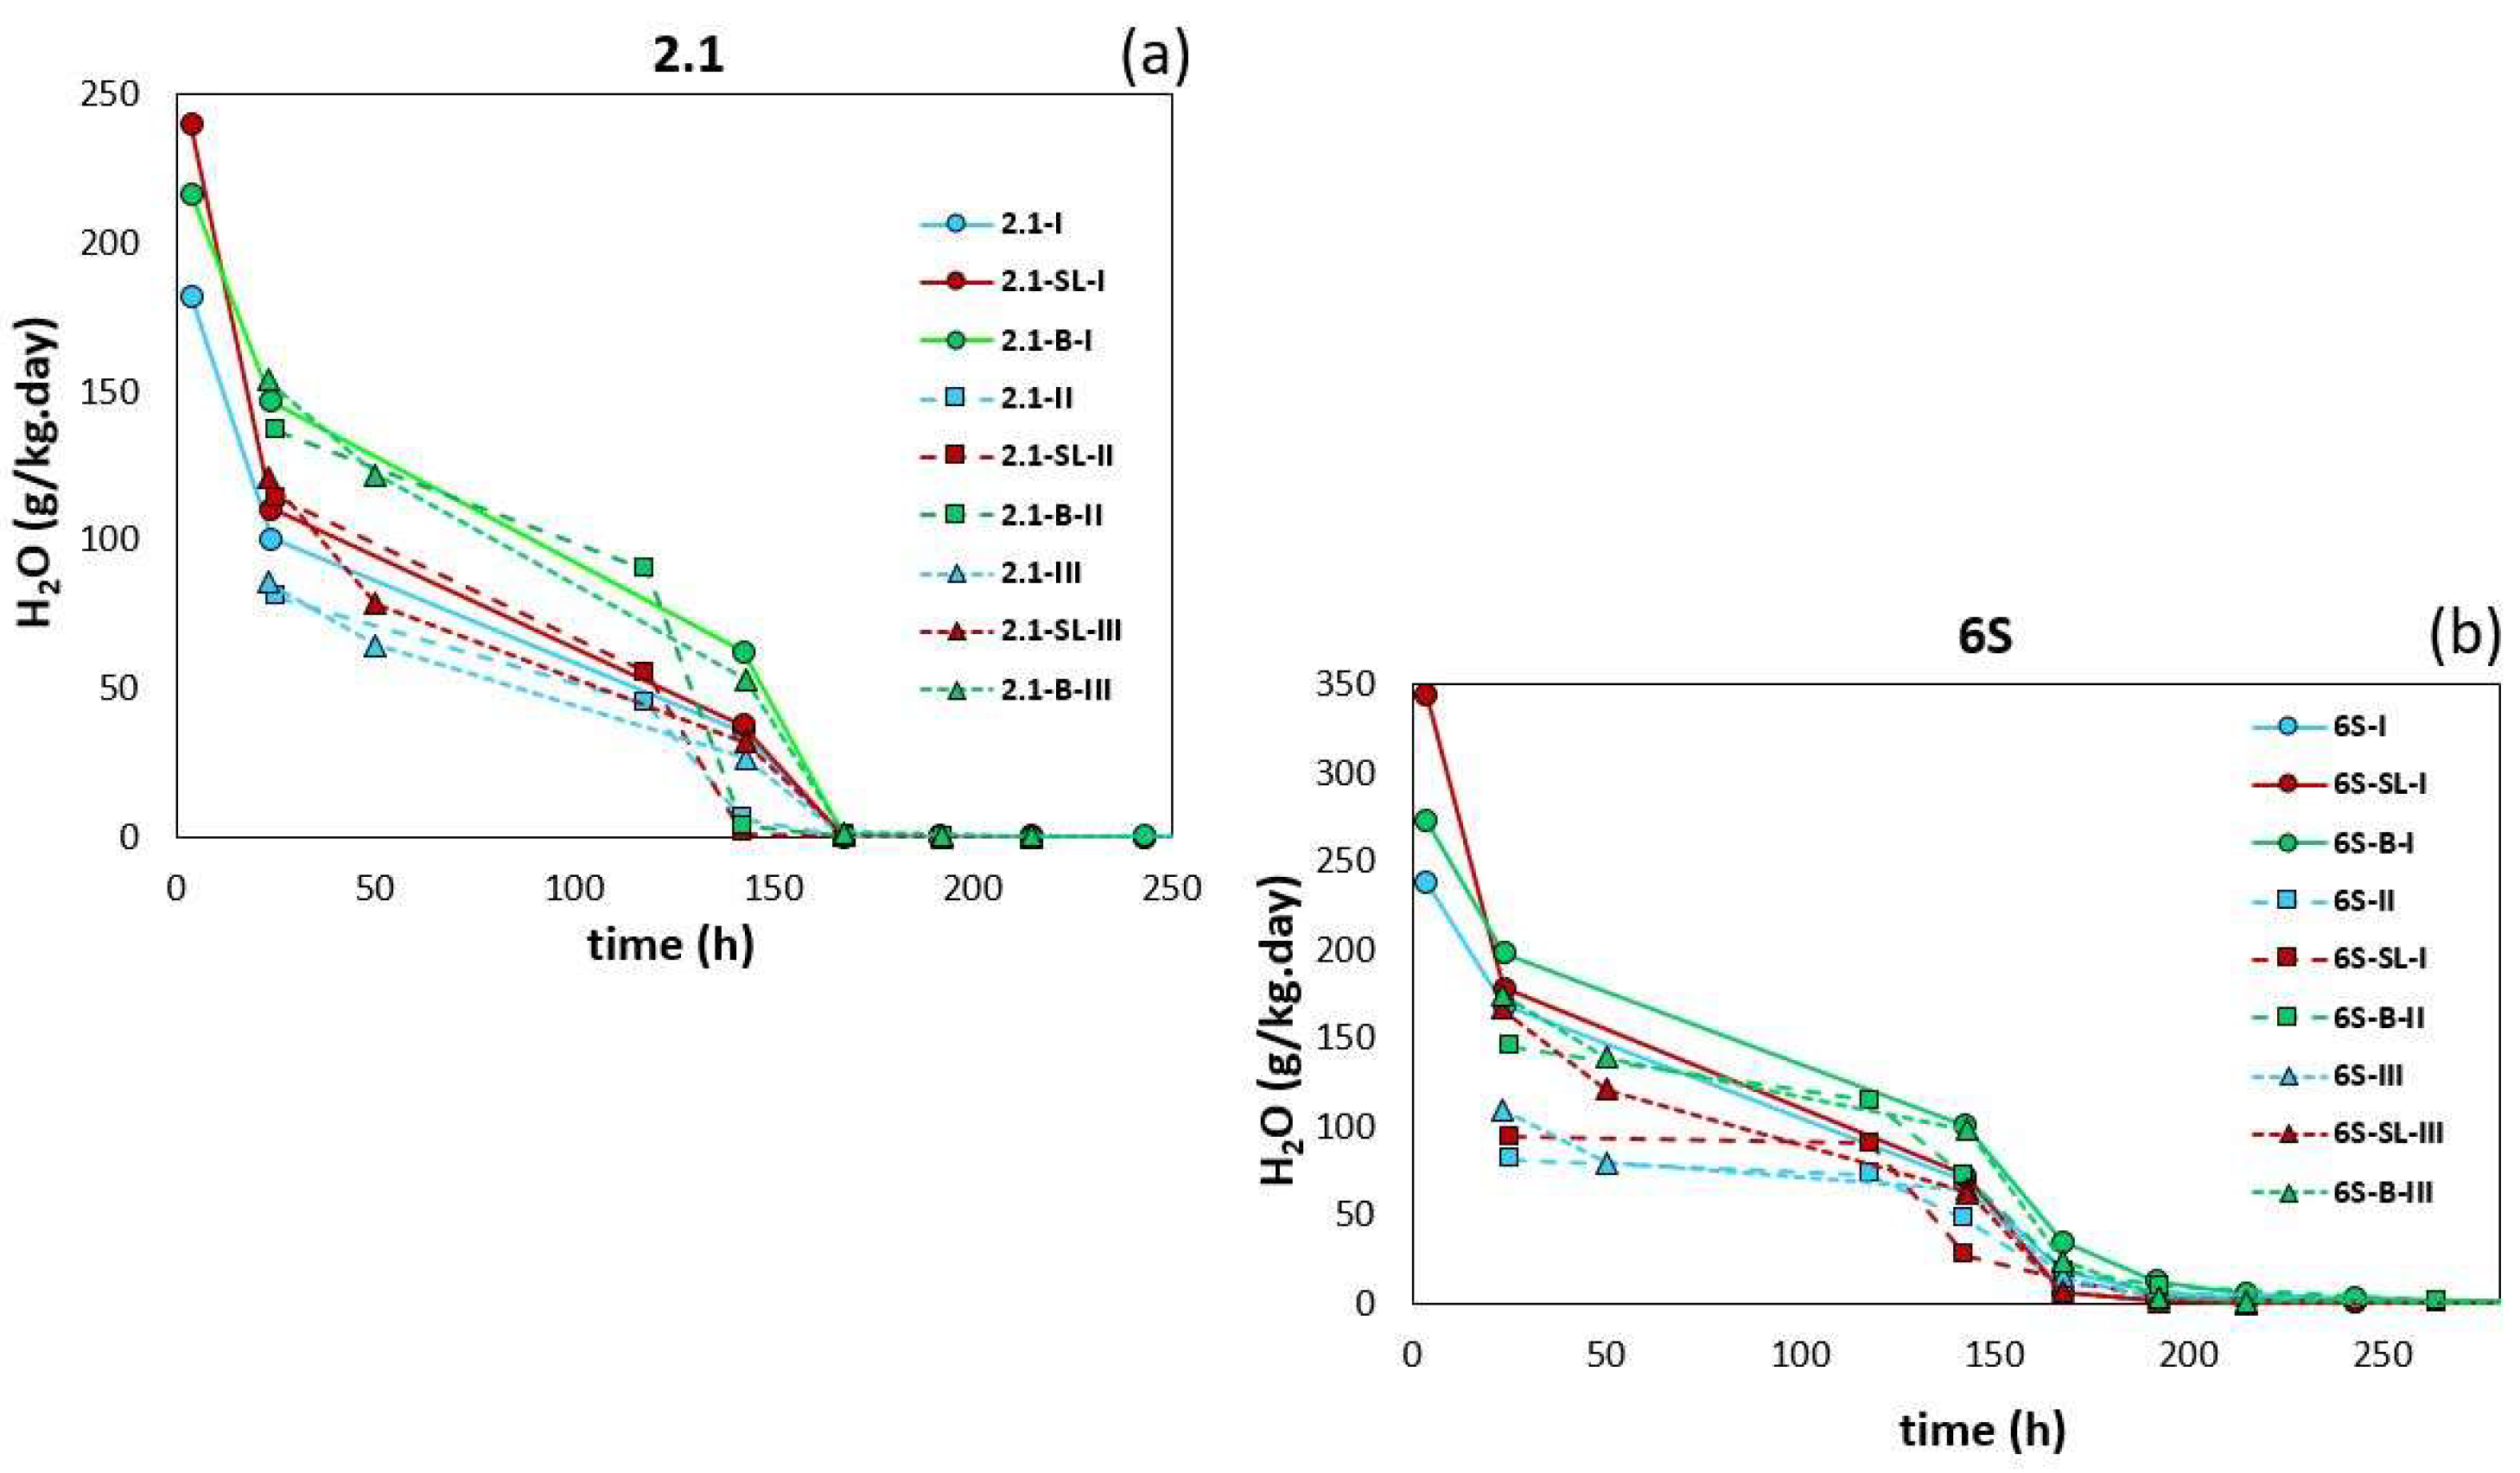
The subsequent water loss from the saturated soils and soil composites is illustrated in the breakthrough curves in Figure 5.
As is evident from the curves in Figure 5, the 6S and its composites retained water for, on average, two days longer than 2.1, which is related to the already-mentioned different structures and surface properties of both soils [34]. Relative water evaporation ran similarly during all three cycles, though decreasing average daily evaporation by 10–30 g/kg for 2.1 systems and 20–50 g/kg for 6S systems was recorded for the second and third cycles (dashed and dotted lines).
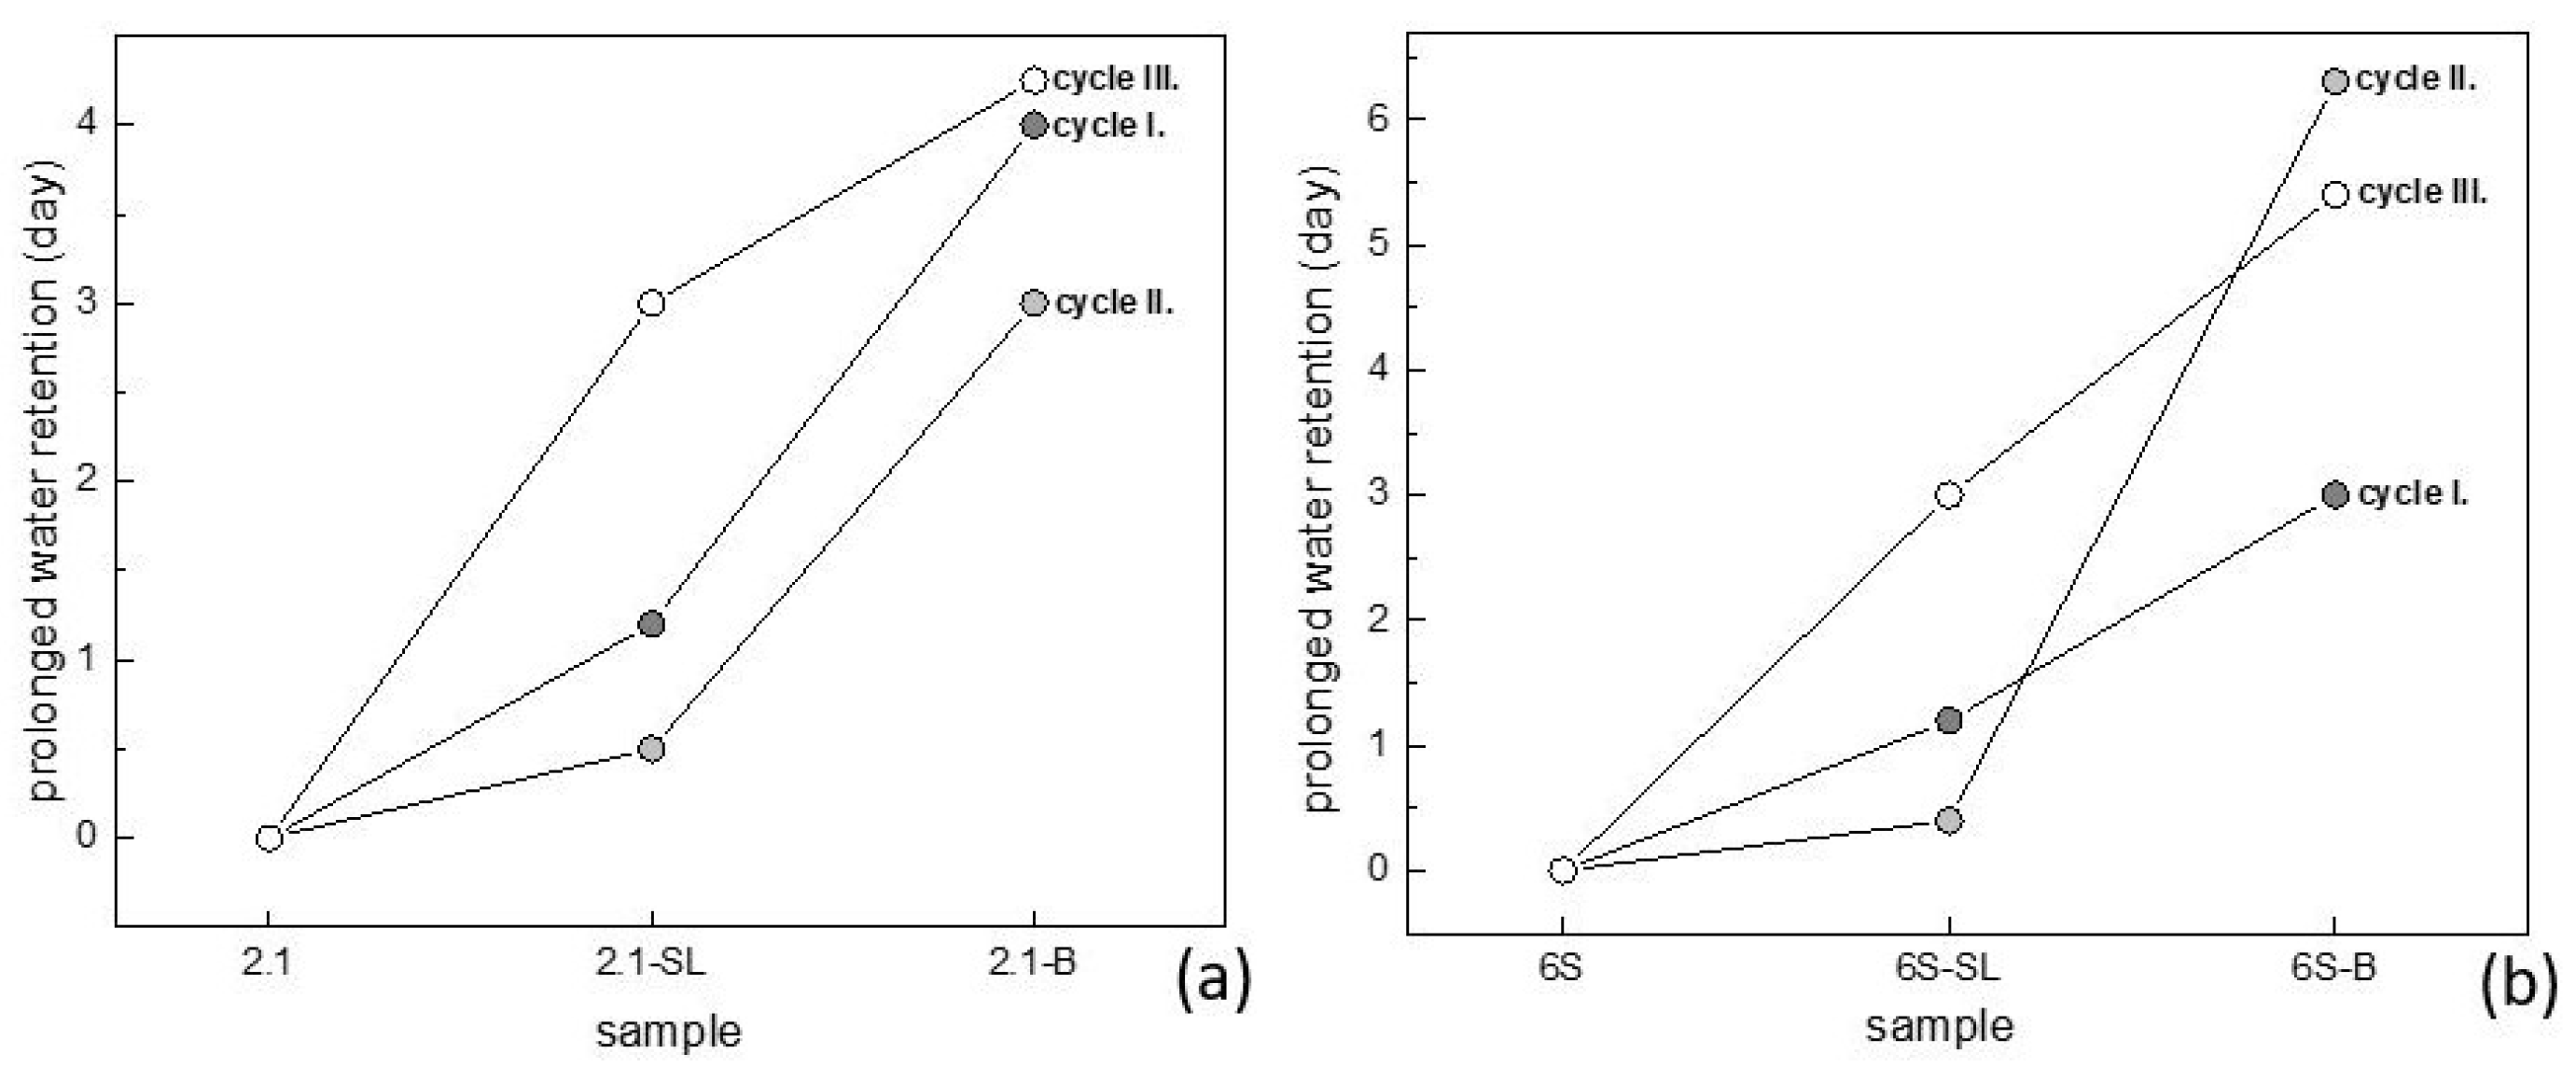
Similar to the increased water-holding capacity of the composites compared to the individual soils, the composites consistently demonstrated longer water retention than the pure soils (Figure 6). The addition of SL extended the evaporation time from one-half to three days, while the addition of B extended the evaporation time from two to more than six days.
In terms of improving soil water regime, B has always outperformed SL. Although there are several differences between B and SL, such as the source material, chemical composition, thermal stability, and potential use [35], the physical properties played a key role in water absorption and retention. The SBET and WAC values of B were an order of magnitude higher than those of SL (Table 2).

3.2. Adsorption of Pb2+ and Sb(OH)6 on Individual Soils and Soil Composites

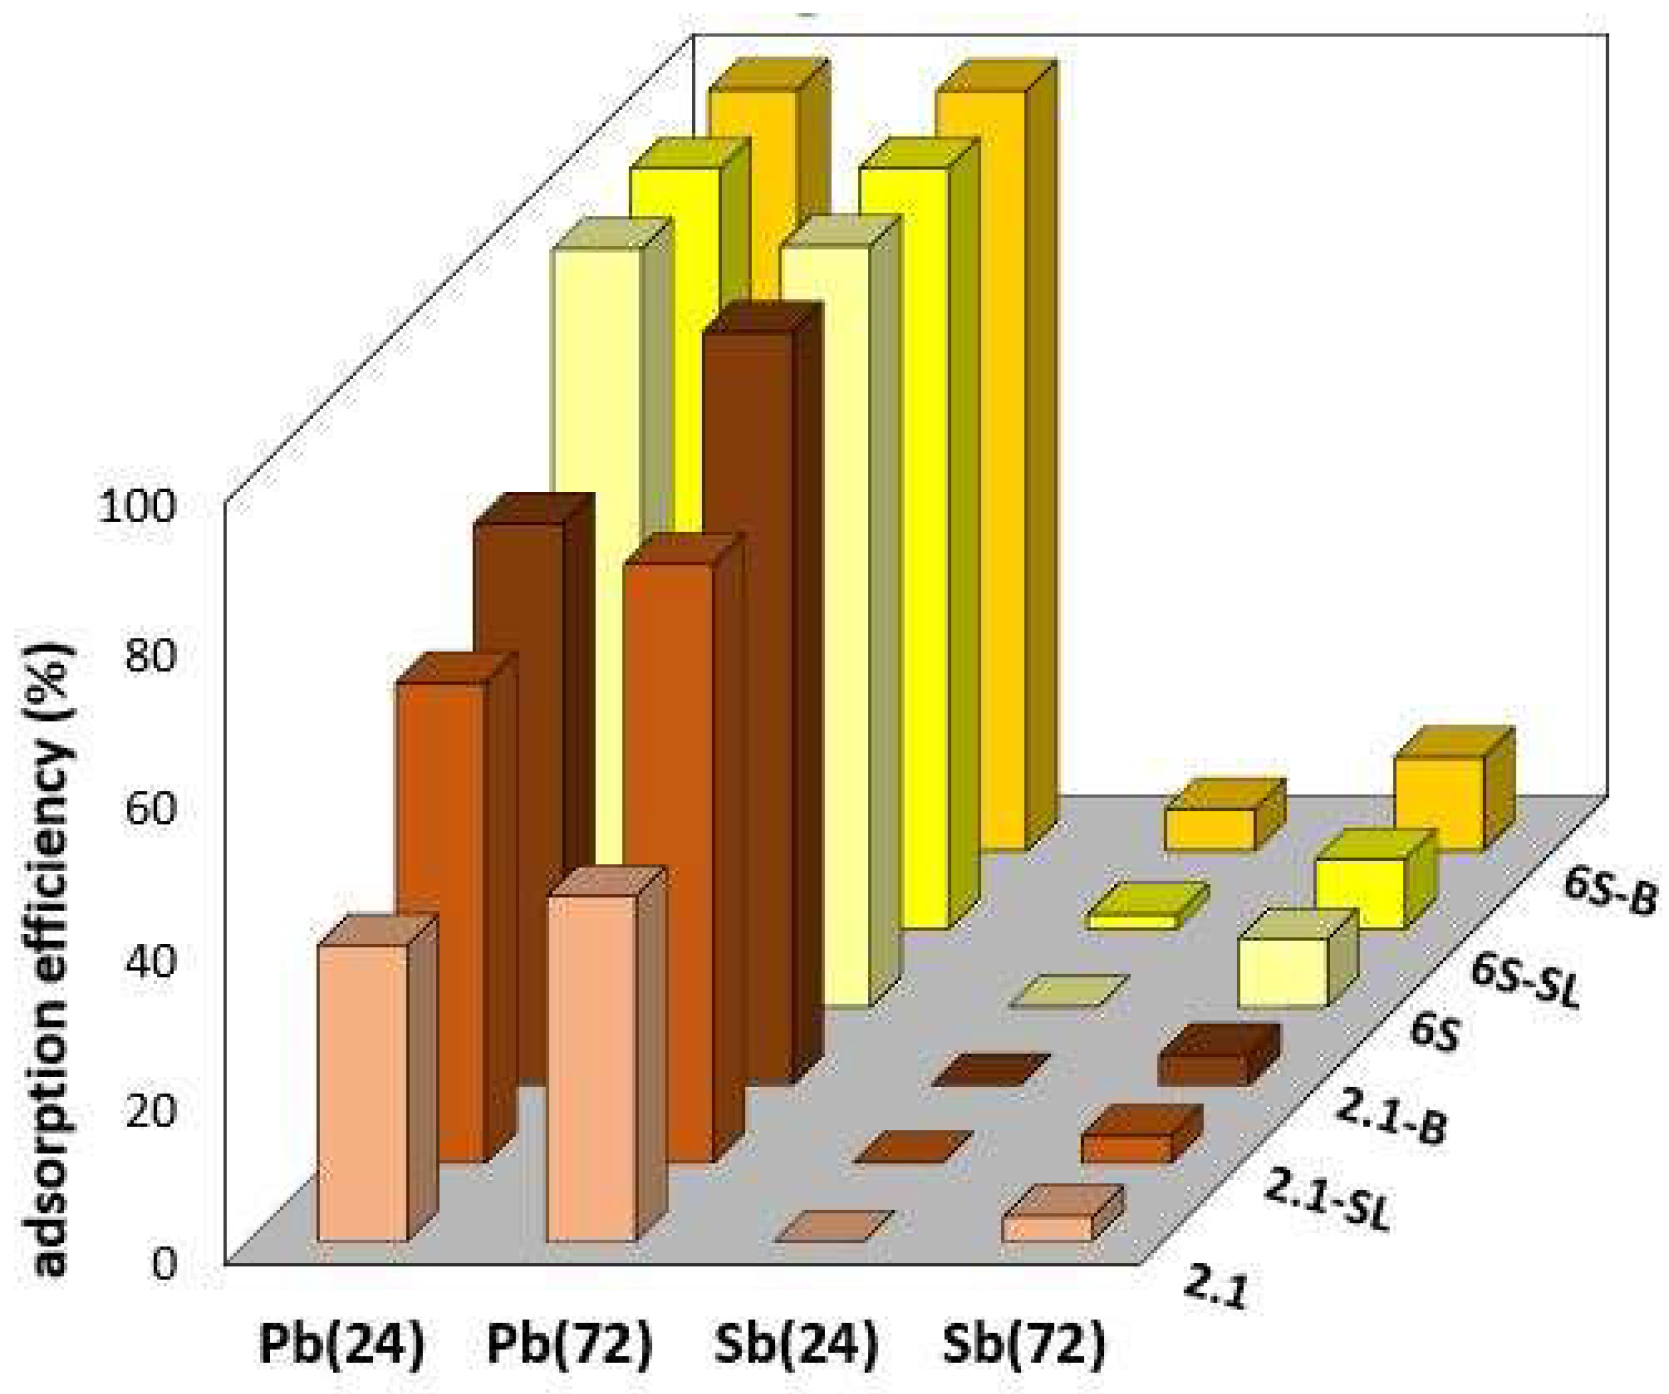
The adsorption of single ions (Pb2+ or Sb(OH)6) on individual soils and their composites was performed from model solutions according to Section 2.6. The efficiency of Pb2+/Sb(OH)6 adsorption on all materials in two time modes (24 and 72 h) (Figure 7) showed clearly higher Pb2+ affinity for all tested adsorbents. The selective adsorption of Pb2+ on various adsorbents, which has been discussed in many papers (e.g., [18,21]), related to the ability of hydrated Pb2+ ions to significantly enhance the adsorption yield by forming poorly soluble polynuclear complexes or surface precipitates at pH ≥ 6.5 [36].
The pHZPC value generally makes it possible to estimate preferential adsorption targeting in aqueous systems [37]. Except for 2.1, pHZPC values were close to 5 for all tested adsorbents (Table 1, Table 2 and Table 3), indicating a negligible effect on the selectivity towards ions in the model solutions at pH ≈ 4.5–6.0.
According to the obtained results, the 6S systems (yellow columns) generally demonstrated better selectivity to both tested ions compared to the equivalent 2.1 systems (brown columns), namely by 2–60% for Pb2+ and 2–10% for Sb(OH)6.
As evident from the graph in Figure 7, the addition of SL or B to the soil enhanced adsorption in all cases, regardless of the actual adsorption yield. The adsorption efficiency demonstrated from 10 to more than 30% growth in Pb2+ adsorption and about 6% growth in the case of the generally poorer Sb(OH)6 adsorption. This finding corresponded well with previously studied adsorption properties of composites compared to pure sorbents [38] and should be taken into account, particularly for a potential application in remediation technologies.
Similar to the water regime, the addition of B enhanced the adsorption properties of soils more than that of SL, particularly due to the high SBET value.
Among other aspects, a prolonged reaction time proved to be crucial for the adsorption process. The results of the 72 h experiment indicated the necessity of a longer time to reach equilibrium, particularly with Sb(OH)6 adsorption. It should be emphasised that soil is a very heterogeneous material consisting mainly of organic matter, clays, metal (hydr)oxides, silicates, and other substances with a number of functional groups, which potentially create differently charged active adsorption sites [39]. Therefore, the equilibrium in soil adsorption–desorption processes usually takes longer than in processes with single-component adsorbents [40]. In any case, the prolonged reaction time increased the adsorption efficiency by more than 20% for both tested ions.
The equilibrium adsorption capacities for all single-ion adsorptions (Table 4) confirmed the above-discussed trends. The adsorption on 6S was more robust compared to 2.1 in all cases, with up to four times higher capacity values. The extended reaction time was crucial, particularly for Sb(OH)6, when an order of magnitude higher adsorption capacity was achieved. In contrast, in the case of Pb2+ adsorption, a 24 h reaction time was enough to reach equilibrium. According to the adsorption capacities, the studied adsorbents could be ordered in decreasing adsorption selectivity as:
6S-B > 6S-SL ≈ 6S > 2.1-B > 2.1-SL >> 2.1

3.3. Co-Adsorption of Pb2+ and Sb(OH)6 on Pure Soils and Soil Composites

The following part of the adsorption experiments was focused on the co-adsorption of both tested ions (Pb2+ and Sb(OH)6) on individual soils and composites from one model solution. The arrangement of this experiment (Section 2.5 and Section 2.6) resulted from the assumption that in true water systems, various differently charged contaminants, which could equally participate in the adsorption processes, can be present.
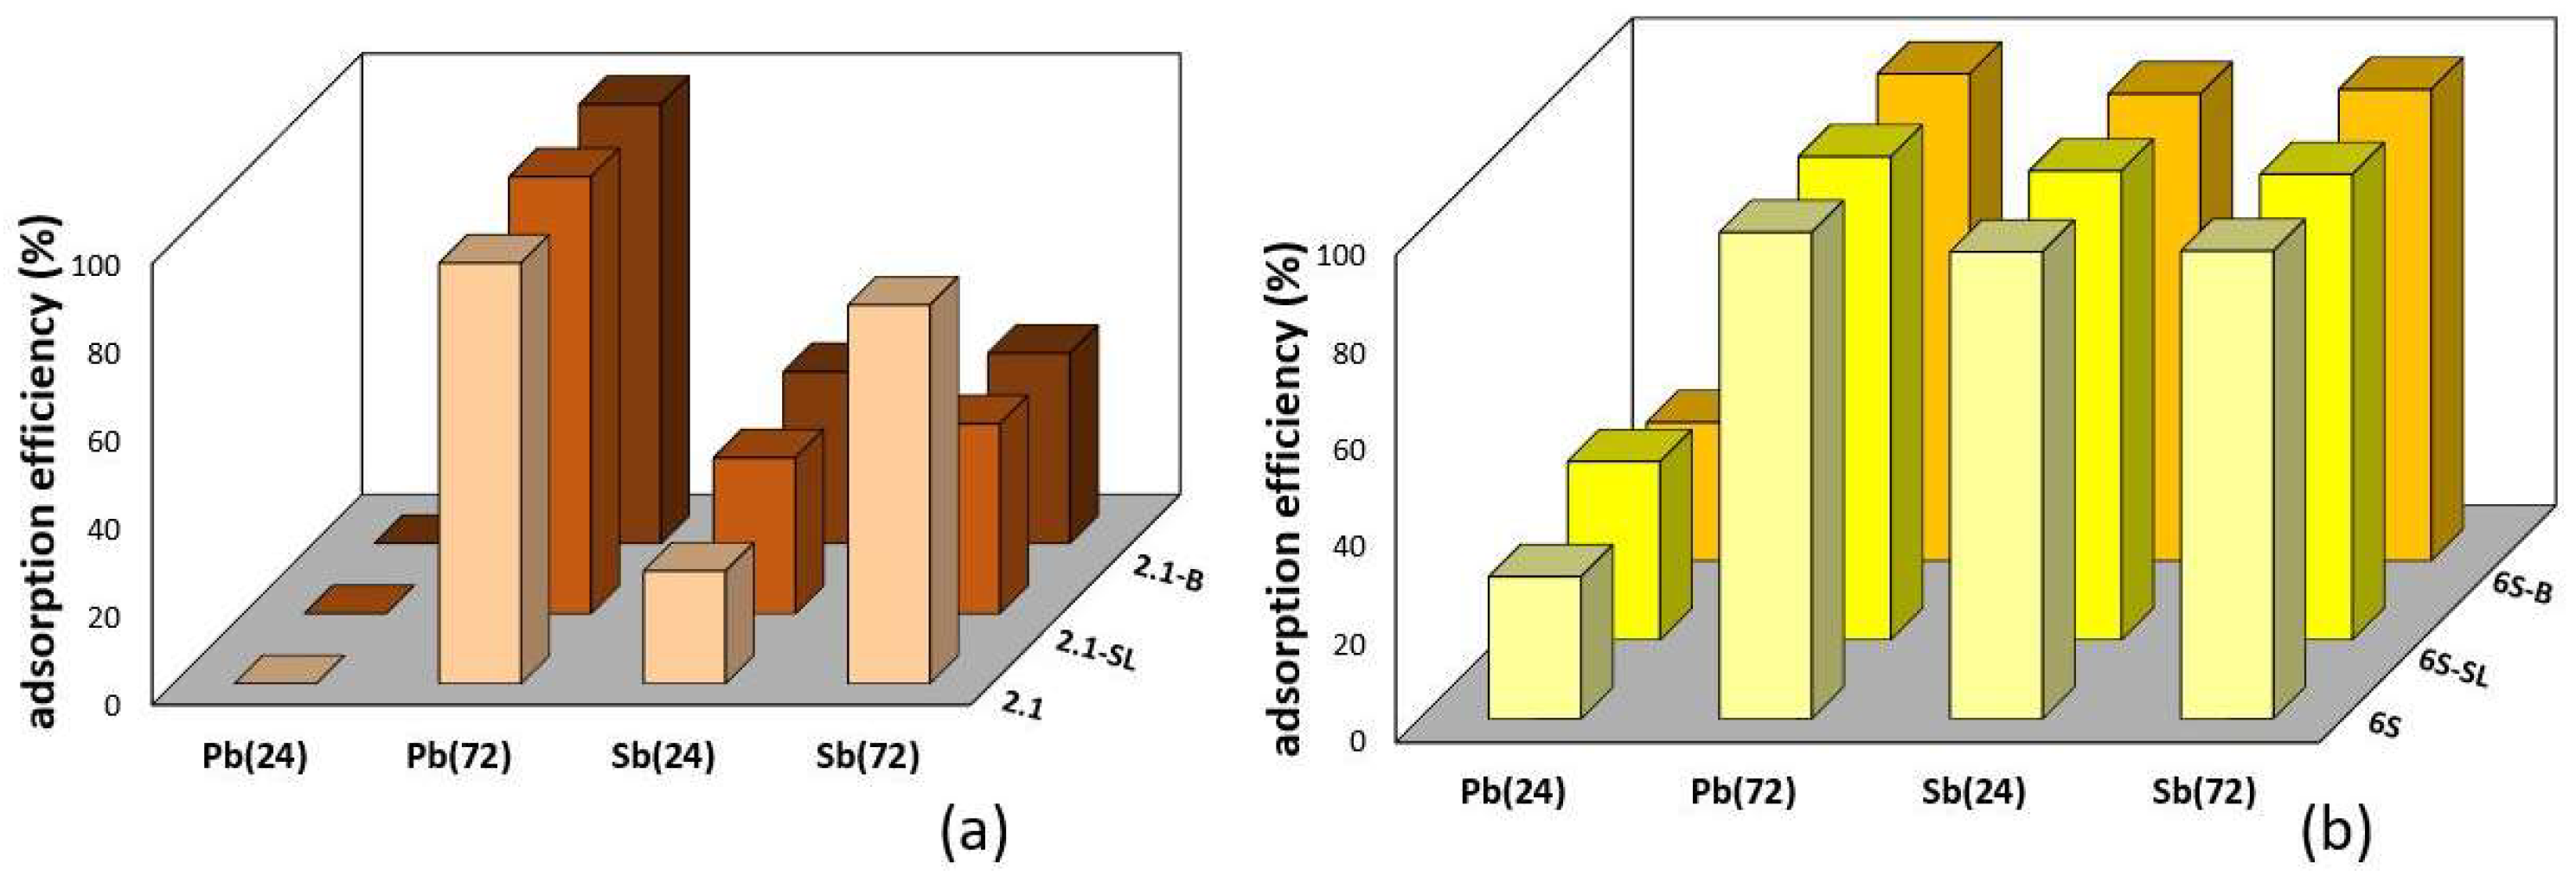
The results of Pb2+ and Sb(OH)6 co-adsorption on the soils and composites (Figure 8) confirmed previously published findings [38] that the co-adsorption of multiple ions significantly enhances the sorbability of at least one ion.
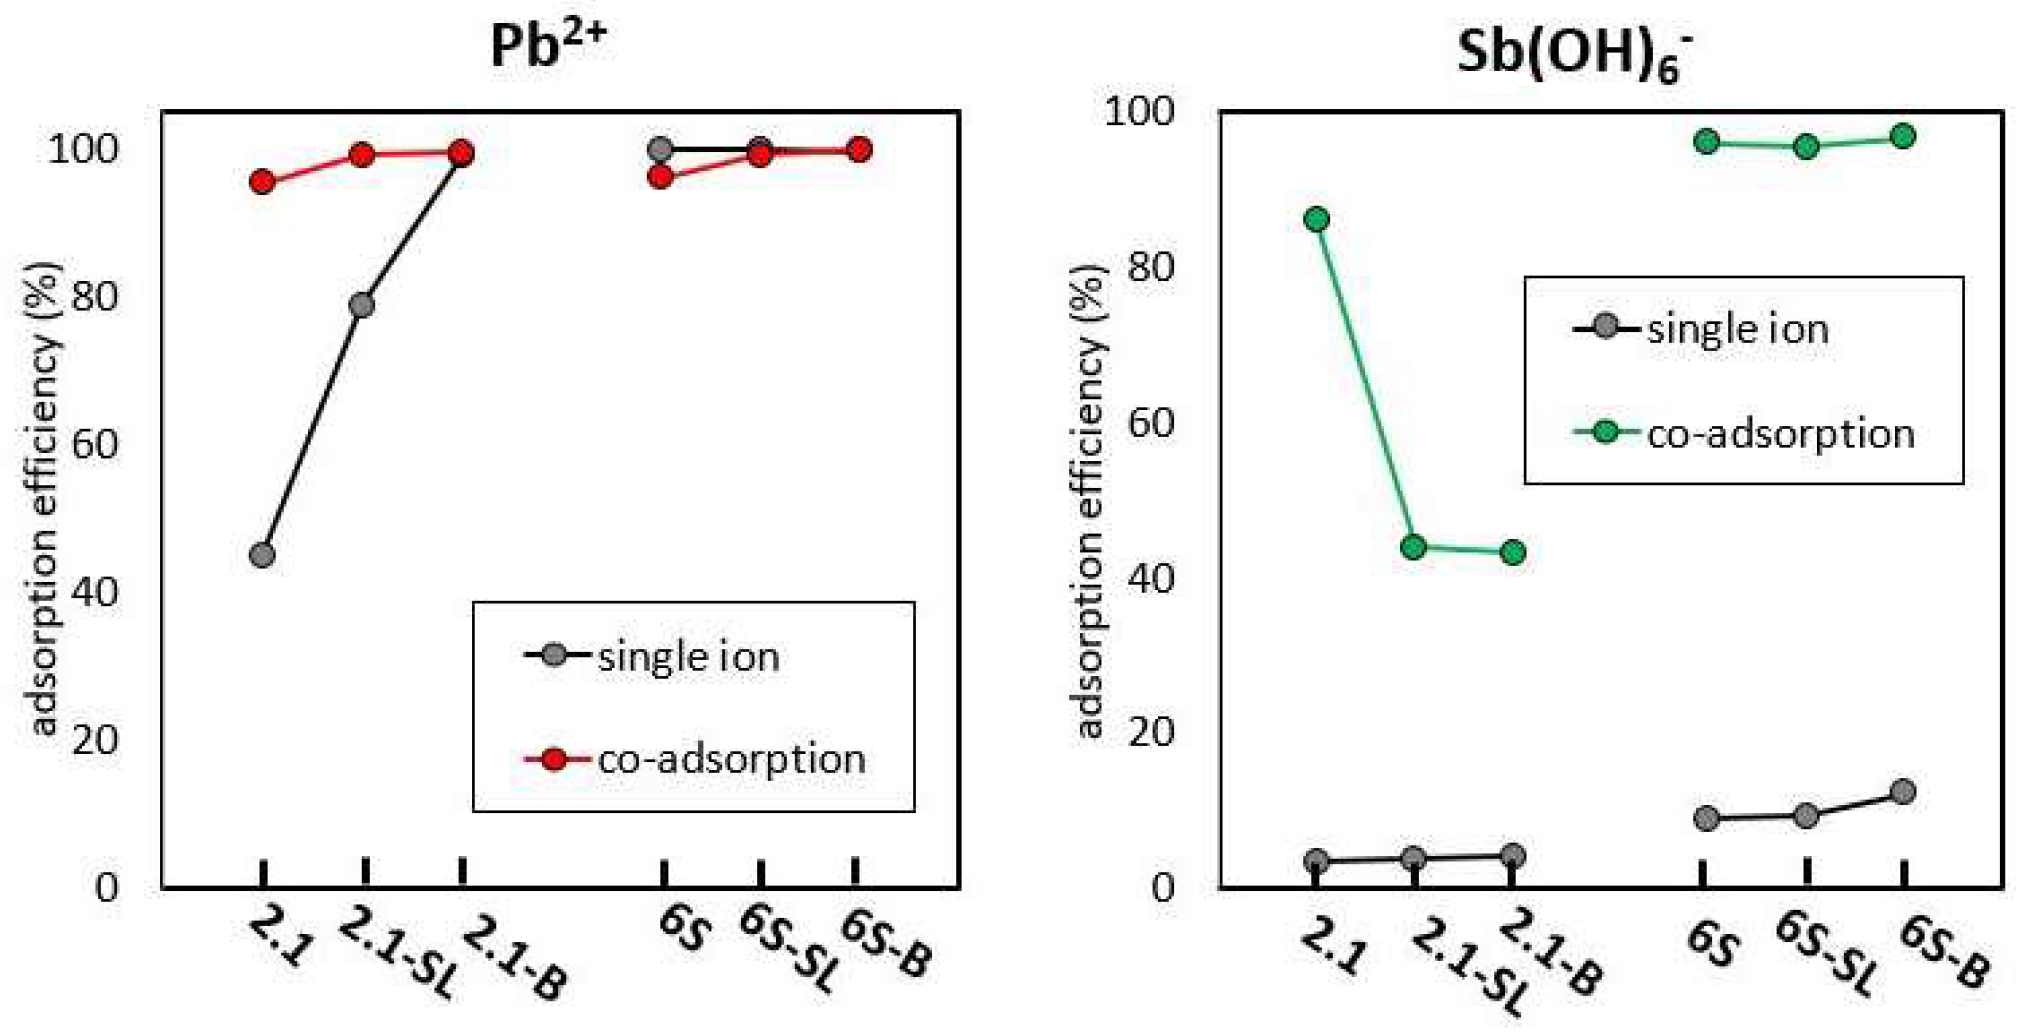
With the exception of the Pb2+/24 h adsorption systems, the efficiency of co-adsorption was higher in all systems than those for single-ion adsorption (Figure 7), by more than 30%, on average, for Pb2+ and by more than 90% for Sb(OH)6. A significant promoting of adsorption of an oppositely charged ion from a water system could be combined with the mutual effect of ions in the solution, where charged particles partially interacted with the sorbent surface, forming new active sites for oppositely charged particles’ adsorption [41,42]. The specific reaction mechanism depended primarily on the adsorption kinetics of individual ions, their reactivity to each other, and finally, on their surface complexation ability.
In the case of Pb2+ and Sb(OH)6 co-adsorption, the benefit of the oppositely charged ion was crucial in Sb(OH)6 adsorption, where almost quantitative removal (>95%) from the mixed solution was achieved compared to quite ineffective adsorption (3–12%) of the single Sb(OH)6. For determining the preferential ion in a co-adsorption system, the adsorption kinetics plays a key role and must be studied for each adsorption system.
An expressible growth in the efficiency of co-adsorption compared to single adsorption for the 72 h experiments (Figure 9) illustrated a relatively low contribution of Sb(OH)6 presence to Pb2+ adsorbability and, conversely, an essential increase in the adsorption yield of Sb(OH)6 in the presence of Pb2+.
Similar to the single-ion adsorption, the equilibrium capacities for the co-adsorption of both ions are shown in Table 5. It is obvious that the equilibrium adsorption capacities for Pb2+ were reduced by about one half, which corresponded to the ion distribution in the mixed model solution. This finding also confirmed the above-described result that co-adsorption did not significantly affect Pb2+ removal from the mixed solution. On the other hand, the significant enhancement of Sb(OH)6 yield during co-adsorption was reflected in the capacity values, which remained the same as in the single-ion adsorption, in which a solution with twice the concentration was used (Table 4).

4. Conclusions

The present study focused on the preparation of composites of two standard soils with 10% wt. of biochar or sludgechar to observe possible changes in their water regime and adsorption properties compared to the individual soils.
The addition of 10% wt. of biochar/sludgechar to the soil consistently resulted in an increase in water absorption capacity, by up to 90% in the case of sandy soil and up to 60% in the case of clay soil. In any event, biochar contributed to water absorption much more intensively than sludgechar. The actual water-holding capacity value depended mostly on the structures and surface properties of the respective soils, especially on the particle size, clay proportion, and specific surface area. The difference between the initial (2 h) and equilibrium (24 h) water-holding capacities did not exceed 5%.
In terms of water retention, the clay soil and its composites retained water longer than the sandy soil with equivalent composites. The soil composites always demonstrated an extended water retention time compared with the individual soils—up to three days with the sludgechar addition and up to six days with the biochar addition. During repeated cycles of water saturation and evaporation, average daily evaporation slightly decreased for both the sandy soils and their composites.
The adsorption of cations (Pb2+) and anions (Sb(OH)6) on the individual soils and soil composites illustrated a significantly higher affinity of Pb2+ to all tested adsorbents, while Sb(OH)6 adsorption was almost ineffective. The clay soil and its composites were more selective adsorbents of both ions.
The addition of biochar or sludgechar always enhanced the adsorption yield for Pb2+ and Sb(OH)6. An extended reaction time of 72 h was crucial to reaching adsorption equilibrium in the soil systems. In all events, the prolonged reaction time increased the adsorption efficiency for both tested ions by more than 20%.
Pb2+ and Sb(OH)6 co-adsorption from the mixed solution was mainly beneficial in Sb(OH)6 adsorption, where >95% efficiency was achieved. The Pb2+ and Sb(OH)6 co-adsorption on the tested composites enabled almost quantitative Sb(OH)6 removal, proving to be a promising method for the treatment of real contaminated systems in which the presence of oppositely charged ions can be assumed. Not only biochar but also sludgechar open up new possibilities as forward additives to various types of soils, which, with a 10% wt. addition, substantially improved the water regime of soils and their adsorption selectivity towards toxic ions.

Author Contributions

Conceptualization, B.D.; adsorption experiments and pHZPC analysis, B.D., E.B., and K.M.; methodology, B.D., M.L., M.P., and J.M.; SBET measurement and evaluation, M.L.; XRF measurement, D.K.; material preparation and characterization, L.P., J.M., and M.P.; writing—original draft preparation, B.D.; writing—review and editing, B.D. All authors have read and agreed to the published version of the manuscript.

Funding

This work was funded by the project No. TN02000025 (NCE II)—“A comprehensive strategy for modern, low-carbon and sustainable energy” of the Technology Agency of the Czech Republic.

Conflicts of Interest

The authors declare no conflicts of interest.

References

  1. Tomczyk, A.; Sokołowska, Z.; Boguta, P. Biochar physicochemical properties: Pyrolysis temperature and feedstock kind effects. Rev. Environ. Sci. Biotechnol. 2020, 19, 191–215. [Google Scholar] [CrossRef]
  2. Angin, D. Effect of pyrolysis temperature and heating rate on biochar obtained from pyrolysis of safflower seed press cake. Bioresour. Technol. 2013, 128, 593–597. [Google Scholar] [CrossRef]
  3. Gholizadeh, M.; Meca, S.; Zhang, S.; Clarens, F.; Hu, X. Understanding the dependence of biochar properties on different types of biomass. Waste Manag. 2024, 182, 142–163. [Google Scholar] [CrossRef]
  4. Jiang, Y.-H.; Li, A.-Y.; Deng, H.; Ye, C.-H.; Wu, Y.-Q.; Linmu, Y.-D.; Hang, H.-L. Characteristics of nitrogen and phosphorus adsorption by Mg-loaded biochar from different feedstocks. Bioresour. Technol. 2019, 276, 183–189. [Google Scholar] [CrossRef]
  5. Lei, O.; Zhang, R. Effects of biochars derived from different feedstocks and pyrolysis temperatures on soil physical and hydraulic properties. J. Soils Sediments 2013, 13, 1561–1572. [Google Scholar] [CrossRef]
  6. Matos, T.T.S.; Fornari, M.R.; Mangrich, A.S.; Schultz, J.; Batista, E.M.C.; Ribeiro, R.O.; Romão, L.P.; Yamamoto, C.I.; Grasel, F.S.; Bayer, C.; et al. Low temperature production of biochars from different biomasses: Effect of static and rotary lab reactors and application as soil conditioners. J. Environ. Chem. Eng. 2021, 9, 105472. [Google Scholar] [CrossRef]
  7. Li, S.; Harris, S.; Anandhi, A.; Chen, G. Predicting biochar properties and functions based on feedstock and pyrolysis temperature: A review and data syntheses. J. Clean. Prod. 2019, 215, 890–902. [Google Scholar] [CrossRef]
  8. Pariyar, P.; Kumari, K.; Jain, M.K.; Jadhao, P.S. Evaluation of change in biochar properties derived from different feedstock and pyrolysis temperature for environmental and agricultural application. Sci. Total Environ. 2020, 713, 136433. [Google Scholar] [CrossRef]
  9. Tan, Z.; Zou, J.; Zhang, L.; Huang, Q. Morphology, pore size distribution, and nutrient characteristics in biochars under different pyrolysis temperatures and atmospheres. J. Mater. Cycles Waste Manag. 2018, 20, 1036–1049. [Google Scholar] [CrossRef]
  10. Das, O.; Mensah, R.A.; George, G.; Jiang, L.; Xu, Q.; Neisiany, R.E.; Umeki, K.; Jose E, T.; Phounglamcheik, A.; Hedenqvist, M.S.; et al. Flammability and mechanical properties of biochars made in different pyrolysis reactors. Biomass Bioenergy 2021, 152, 106197. [Google Scholar] [CrossRef]
  11. Zhou, M.; Ying, S.; Chen, J.; Jiang, P.; Teng, Y. Effects of Biochar-Based Fertilizer on Nitrogen Use Efficiency and Nitrogen Losses via Leaching and Ammonia Volatilization from an Open Vegetable Field. Environ. Sci. Pollut. Res. Int. 2021, 28, 65188–65199. [Google Scholar] [CrossRef]
  12. Maziarka, P.; Wurzer, C.; Arauzo, P.J.; Dieguez-Alonso, A.; Mašek, O. Do you BET on routine? The reliability of N2 physisorption for the quantitative assessment of biochar’s surface area. Chem. Eng. J. 2021, 418, 129234. [Google Scholar] [CrossRef]
  13. Shubh, P.S.Y.; Bhandari, S.; Bhatta, D.; Poudel, A.; Bhattarai, S.; Yadav, P.; Ghimire, N.; Paudel, P.; Shrestha, J.; Oli, B. Biochar application: A sustainable approach to improve soil health. J. Agric. Food Res. 2023, 11, 100498. [Google Scholar] [CrossRef]
  14. Acharya, B.S.; Dodla, S.; Wang, J.J.; Pavuluri, K.; Darapuneni, M.; Dattamudi, S.; Maharjan, B.; Kharel, G. Biochar impacts on soil water dynamics: Knowns, unknowns, and research directions. Biochar 2024, 6, 34. [Google Scholar] [CrossRef]
  15. Xu, D.; Yue, C.; Zhou, T.; Sun, M.; Meng, D.; Yi, X.; Gao, T.; Wang, M.; Duan, J. Mechanisms of adsorption and functionalization of biochar for pesticides: A review. Ecotoxicol. Env. Saf. 2024, 272, 116019. [Google Scholar] [CrossRef]
  16. Bose, S.; Kumar, P.S.; Rangasamy, G.; Prasannamedha, G.; Kanmani, S. A review on the applicability of adsorption techniques for remediation of recalcitrant pesticides. Chemosphere 2023, 313, 137481. [Google Scholar] [CrossRef]
  17. Parisa, M.; Elham, G.A.; Rohollah, F.; Allah, S.H.; Jalil, K. Nitrate removal from agricultural efuent using sugarcane bagasse active nanosorbent. J. Appl. Water Eng. Res. 2021, 10, 238–249. [Google Scholar] [CrossRef]
  18. Yapicioglu, P.; Yesilnacar, M.I. Grey water footprint assessment of groundwater resources in southeastern Turkey: Effect of recharge. Water Supply 2022, 22, 615–627. [Google Scholar] [CrossRef]
  19. Qiu, B.; Tao, X.; Wang, H.; Li, W.; Ding, X.; Chu, H. Biochar as a low-cost adsorbent for aqueous heavy metal removal: A review. J. Anal. Appl. Pyrolysis 2021, 155, 105081. [Google Scholar] [CrossRef]
  20. Hui, H.; Jiayuan, Z.; Tian, W.; Pei, W. Adsorption of toxic metal ion in agricultural wastewater by torrefaction biochar from bamboo shoot shell. J. Clean. Prod. 2022, 338, 130558. [Google Scholar] [CrossRef]
  21. Ambaye, T.G.; Vaccari, M.; van Hullebusch, E.D.; Amrane, A.; Rtimi, S. Mechanisms and adsorption capacities of biochar for the removal of organic and inorganic pollutants from industrial wastewater. Int. J. Environ. Sci. Technol. 2021, 18, 3273–3294. [Google Scholar] [CrossRef]
  22. Zhang, J.; Shao, J.; Jin, Q.; Li, Z.; Zhang, X.; Chen, Y.; Zhang, S.; Chen, H. Sludge-based biochar activation to enhance Pb(II) adsorption. Fuel 2019, 252, 101–108. [Google Scholar] [CrossRef]
  23. Turunen, M.; Hyväluoma, J.; Keskinen, R.; Kaseva, J.; Nikama, J.; Reunamo, A.; Rasa, K. Pore structure of wastewater sludge chars and their water retention impacts in different soils. Biosyst. Eng. 2021, 206, 6–18. [Google Scholar] [CrossRef]
  24. He, Y.D.; Zhai, Y.B.; Li, C.T.; Yang, F.; Chen, L.; Fan, X.P.; Peng, W.F.; Fu, Z.M. The fate of Cu, Zn, Pb and Cd during the pyrolysis of sewage sludge at different temperatures. Environ. Technol. 2010, 31, 567–574. [Google Scholar] [CrossRef] [PubMed]
  25. Liu, Z.; Singer, S.; Tong, Y.; Kimbell, L.; Anderson, E.; Hughes, M.; Zitomer, D.; McNamara, P. Characteristics and applications of biochars derived from wastewater solids. Renew. Sustain. Energy Rev. 2018, 90, 650–664. [Google Scholar] [CrossRef]
  26. Kroiss, H. What is the potential for utilizing the resources in sludge? Water Sci. Technol. 2004, 49, 1–10. [Google Scholar] [CrossRef]
  27. Mendez, A.; Gomez, A.; Paz-Ferreiro, J.; Gasco, G. Effects of sewage sludge biochar on plant metal availability after application to a Mediterranean soil. Chemosphere 2012, 89, 1354–1359. [Google Scholar] [CrossRef]
  28. Razzaghi, F.; Obour, P.B.; Arthur, E. Does biochar improve soil water retention? A systematic review and metaanalysis. Geoderma 2020, 361, 114055. [Google Scholar] [CrossRef]
  29. Moško, J.; Jeremiáš, M.; Skoblia, S.; Beňo, Z.; Sikarwar, V.S.; Hušek, M.; Wang, H.; Pohořelý, M. Residual moisture in the sewage sludge feed significantly affects the pyrolysis process: Simulation of continuous process in a batch reactor. J. Anal. Appl. Pyrolysis 2022, 161, 105387. [Google Scholar] [CrossRef]
  30. Mitzia, A.; Hudcová, B.B.; Vítková, M.; Kunteová, B.; Hernandez, D.C.; Moško, J.; Pohořelý, M.; Grasserová, A.; Cajthaml, T.; Komárek, M. Pyrolysed sewage sludge for metal(loid) removal and immobilisation in contrasting soils: Exploring variety of risk elements across contamination levels. Sci. Total Environ. 2024, 918, 170572. [Google Scholar] [CrossRef]
  31. Zaharioiu, A.M.; Bucura, F.; Ionete, R.E.; Marin, F.; Constantinescu, M.; Oancea, S. Opportunities regarding the use of technologies of energy recovery from sewage sludge. SN Appl. Sci. 2021, 3, 775. [Google Scholar] [CrossRef]
  32. Doušová, B.; Koloušek, D.; Lhotka, M.; Keppert, M.; Urbanová, M.; Kobera, L.; Brus, J. Waste Brick Dust as Potential Sorbent of Lead and Cesium from Contaminated Water. Materials 2019, 12, 1647–1660. [Google Scholar] [CrossRef]
  33. Doušová, B.; Bedrnová, E.; Reiterman, P.; Keppert, M.; Koloušek, D.; Lhotka, M.; Mastný, L. Adsorption Properties of Waste Building Sludge for Environmental Protection. Minerals 2021, 11, 309. [Google Scholar] [CrossRef]
  34. Doušová, B.; Buzek, F.; Machovič, V.; Lhotka, M.; Vojtíšek-Lom, M. Effect of “black carbon” on antimony accumulation in traffic-loaded topsoil. Sci. Total Environ. 2024, 933, 173132. [Google Scholar] [CrossRef]
  35. Cognigni, P.; Leonelli, C.; Berrettoni, M. A bibliographic study of biochar and hydrochar: Differences and similarities. J. Anal. Appl. Pyrolysis 2025, 187, 106985. [Google Scholar] [CrossRef]
  36. Niu, Z.; Zhang, S.; Ma, M.; Wang, Z.; Zhao, H.; Wang, Y. Synthesis of novel waste batteries-sawdust-based adsorbent via a two-stage activation method for Pb2+ removal. Environ. Sci. Pollut. Res. 2019, 26, 4730–4745. [Google Scholar] [CrossRef] [PubMed]
  37. Guilhen, S.N.; Watanabe, T.; Tieko Silva, T.; Rovani, S.; Marumo, J.T.; Tenório, J.A.S.; Mašek, O.; de Araujo, L.G. Role of Point of Zero Charge in the Adsorption of Cationic Textile Dye on Standard Biochars from Aqueous Solutions: Selection Criteria and Performance Assessment. Recent Prog. Mater. 2022, 4, 010. [Google Scholar] [CrossRef]
  38. Doušová, B.; Pilař, L.; Koloušek, D.; Bedrnová, E.; Lhotka, M.; Maxová, K. Adsorption properties of fly ash–clay composites from Central European localities: Case study. Appl. Clay Sci. 2024, 225, 107395. [Google Scholar] [CrossRef]
  39. Das, B.; Mondal, N.K.; Bhaumik, R.; Roy, P. Insight into adsorption equilibrium, kinetics and thermodynamics of lead onto alluvial soil. Int. J. Environ. Sci. Technol. 2014, 11, 1101–1114. [Google Scholar] [CrossRef]
  40. Dousova, B.; Buzek, F.; Herzogova, L.; Machovic, V.; Lhotka, M. Effect of organic matter on arsenic(V) and antimony(V) adsorption in soils. Eur. J. Soil Sci. 2015, 66, 74–82. [Google Scholar] [CrossRef]
  41. Doušová, B.; Bedrnová, E.; Maxová, K.; Koloušek, D.; Lhotka, M.; Pilař, L.; Angelis, M. Kaolin-fly ash composite for Pb2+ and AsO43− adsorption from aqueous system. Appl. Sci. 2024, 14, 5358. [Google Scholar] [CrossRef]
  42. Han, H.; Rafiq, M.K.; Zhou, T.; Xu, R.; Mašek, O.; Li, X. A critical review of clay-based composites with enhanced adsorption performance for metal and organic pollutants. J. Hazard. Mater. 2019, 369, 780–796. [Google Scholar] [CrossRef] [PubMed]
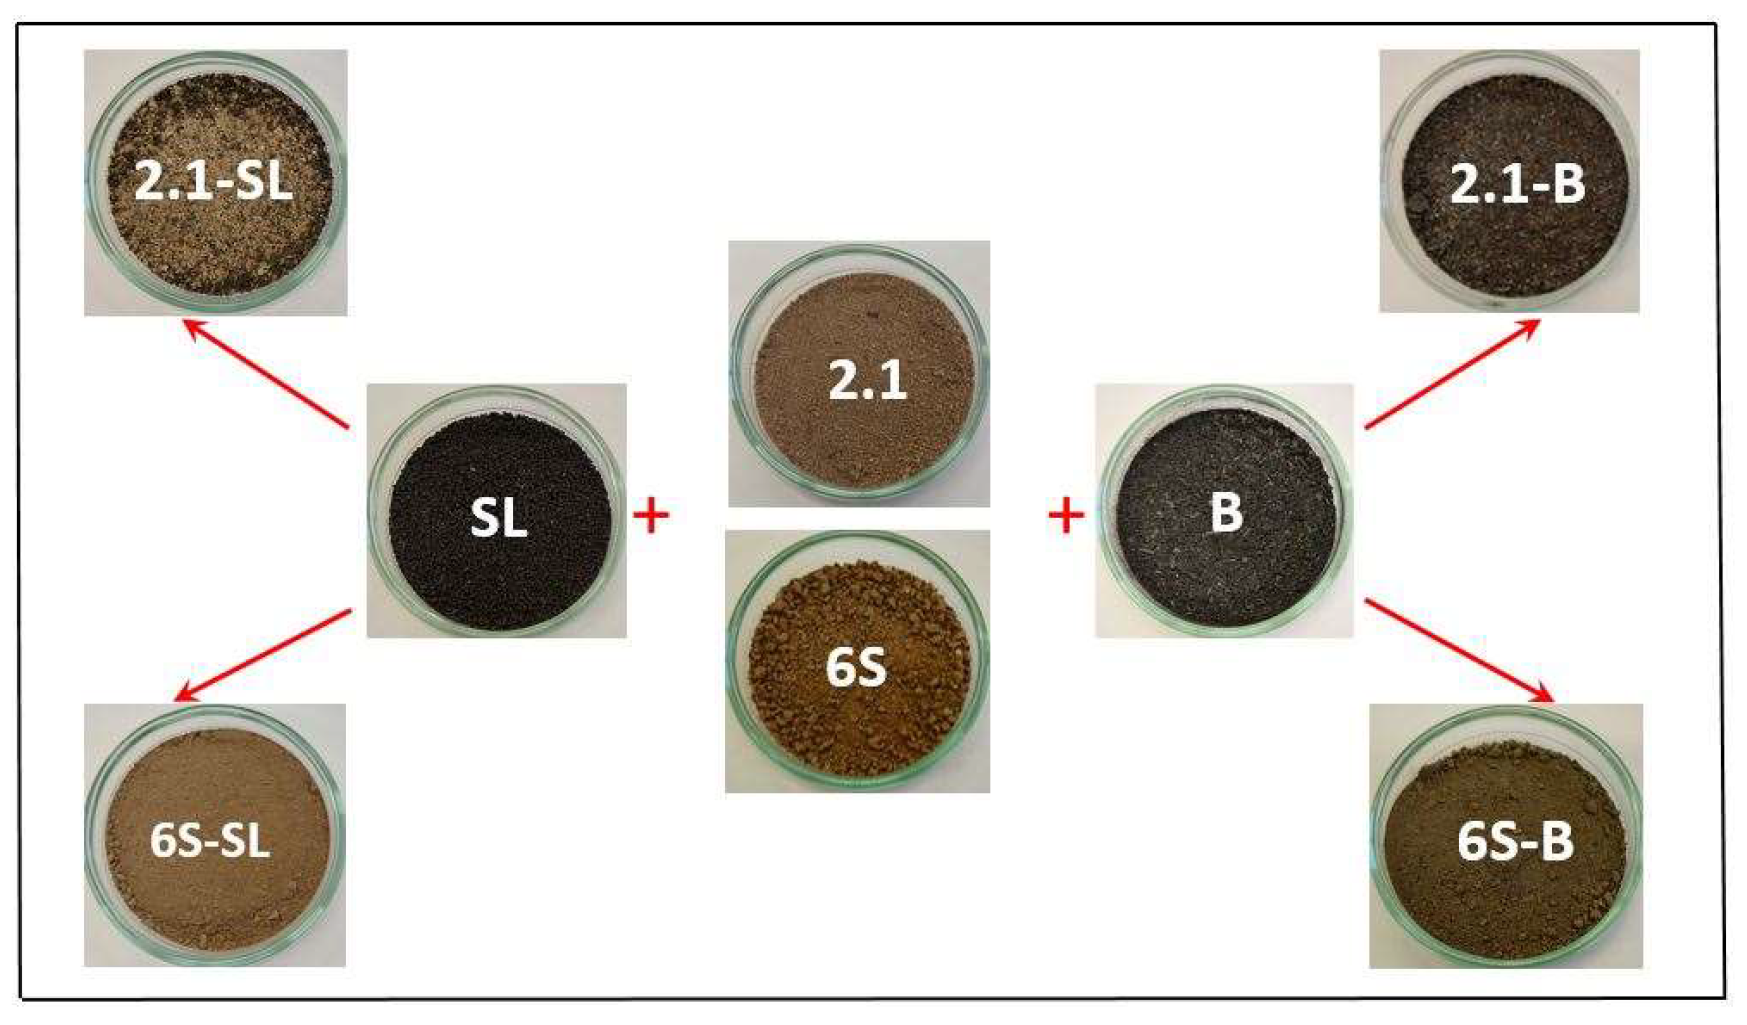
Figure 1. Illustrative photo of soil composites.
Applsci 15 09392 g001
Figure 2. Plastic cylinder with a permeable bottom.
Applsci 15 09392 g002
Figure 3. Initial and equilibrium relative water capacities of individual standard soils and their composites. (a) 2.1; (b) 6S. Solid lines indicate the equilibrium capacities; dashed lines the initial capacities.
Applsci 15 09392 g003
Figure 4. Relative increase of water absorption capacity during the three-cycle process. The cycles are indicated by Roman numerals (I–III). The capacity for pure soils was considered zero. Red dashed line separates the SL and B composites.
Applsci 15 09392 g004
Figure 5. Relative daily water loss (g/kg) from saturated soil and composites. (a) 2.1; (b) 6S. Roman numerals (I-III) indicate the experimental cycle.
Applsci 15 09392 g005
Figure 6. Prolonged water retention in composites compared to individual soils: (a) 2.1; (b) 6S. The total water retention time for individual soils was taken to be zero.
Applsci 15 09392 g006
Figure 7. Efficiency of single-ion adsorption of Pb2+ and Sb(OH)6 on individual soils and soil composites. The number in brackets indicates the relevant reaction time.
Applsci 15 09392 g007
Figure 8. Efficiency of co-adsorption of Pb2+ and Sb(OH)6 on individual soils and soil composites: (a) 2.1; (b) 6S. The number in brackets indicates the relevant reaction time.
Applsci 15 09392 g008
Figure 9. Relative differences in co-adsorption and single adsorption efficiencies for 72 h adsorption arrangements.
Applsci 15 09392 g009
Table 1. Chemistry, texture, and surface properties of the standard soils.
Item/Soil2.16S
Chem.composition
Ntot (mg·g−1)0.52
Corg (mg·g−1)6.516.4
Fe (mg·g−1)11.3106
Sb (µg·g−1)2.13.2
SBET (m2·g−1)1.942.5
pH *5.17.1
pHZPC3.76.5
CEC (meq/100 g) *4.327.2
Hydraulic capacity (g/100 g) *31.140.5
Particle size distribution (mm)
according to USDA) (%) *
<0.002<0.05<2.00<0.002<0.05<2.00
4.19.386.641.235.523.3
* values declared by the LUFA Speyer.
Table 2. Chemical and surface properties of B and SL.
SampleChemical Composition (wt%)Chemical Composition
(mg·g−1)
SBET
(m2·g−1)
pHZPC24 h-WAC * (kg·kg−1)
CorgHNFeAlCaAsPb
B88.80.71.02.61.48.000.01446.36.22.45
SL25.11.02.456.215.146.90.010.0611.05.40.96
* Water absorption capacity.
Table 3. Surface properties of soil composites.
2.12.1-SL2.1-B6S6S-SL6S-B
SBET (m2·g−1)1.92.023.342.532.257.5
pHZPC3.74.35.06.55.85.5
Table 4. Equilibrium capacity of Pb2+ and Sb(OH)6 adsorption from the model solutions.
Sampleqeq (mmol·g−1)
Pb2+Sb(OH)6
24 h72 h24 h72 h
2.10.0130.015-0.001
2.1-SL0.0210.027-0.002
2.1-B0.0240.028-0.004
6S0.0900.022-0.008
6S-SL0.0850.0230.0020.008
6S-B0.0920.0350.0010.010
Table 5. Equilibrium capacity of Pb2+ and Sb(OH)6 co-adsorption from the model solution.
Sampleqeq (mmol·g−1)
Pb2+Sb(OH)6
24 h72 h24 h72 h
2.1-0.0100.0010.007
2.1-SL-0.0110.0020.004
2.1-B-0.0110.0020.002
6S0.0030.0110.0080.008
6S-SL0.0040.0120.0090.009
6S-B0.0030.0120.0080.009
Disclaimer/Publisher’s Note: The statements, opinions and data contained in all publications are solely those of the individual author(s) and contributor(s) and not of MDPI and/or the editor(s). MDPI and/or the editor(s) disclaim responsibility for any injury to people or property resulting from any ideas, methods, instructions or products referred to in the content.