Article

Seismic Channel Characterization Based on 3D DS-TransUnet

Department of Petroleum, China University of Petroleum-Beijing at Karamay, Karamay 834000, China
*
Author to whom correspondence should be addressed.
Appl. Sci. 2025, 15(17), 9387; https://doi.org/10.3390/app15179387
Submission received: 24 July 2025 / Revised: 17 August 2025 / Accepted: 21 August 2025 / Published: 27 August 2025
(This article belongs to the Section Earth Sciences)

Abstract

The structure and geomorphology of channel systems play a critical role in interpreting sedimentary processes and characterizing subsurface reservoir capacity. This study presents an innovative 3D DS-TransUnet model for seismic channel interpretation. The model incorporates a multi-scale Swin Transformer architecture capable of processing 3D data in both the encoder and decoder, and integrates a feature fusion module into the skip connections to effectively combine shallow detail features with deep semantic features, thereby enhancing the detectability of weak reflection signals. This design not only enables the network to capture global dependencies but also preserves fine-grained local details, allowing for more robust feature learning under complex geological conditions. In addition, a complete synthetic data generation workflow is proposed, through which 300 pairs of high-quality synthetic data were constructed for model training. During training, the proposed model achieved a significantly faster convergence speed compared with other selected models. Experimental results on both synthetic and field seismic datasets demonstrate that the proposed method yields substantial improvements in channel boundary delineation accuracy and interference suppression, providing an efficient and reliable approach for intelligent channel recognition.

1. Introduction

Channels, as key components of geological sedimentary environments, play a crucial role in the transportation and deposition of sediments, profoundly influencing the spatial distribution and structural characteristics of subsurface reservoirs [1]. Accurately identifying and characterizing the location and morphology of channels not only significantly improves the accuracy of oil and gas reservoir prediction and development, but also provides essential geological support for well placement in oil and gas exploration [2]. Traditional channel interpretation methods typically rely on manually extracting seismic attributes such as curvature [3], coherence [4], attenuation attributes [5], time–frequency analysis [6,7], and principal component analysis [8]. However, these methods often require substantial human effort and are highly susceptible to the quality of seismic data and the subjective judgment of interpreters. In particular, in regions with poor seismic data quality or complex geological structures, traditional seismic attributes may not effectively capture channel characteristics.
With the continuous advancement of deep learning technologies, particularly the successful application of convolutional neural networks (CNNs), such as U-Net [9], in fields like medical image segmentation, related research has gradually introduced these methods into seismic image processing tasks. CNNs are now widely used in seismic structural interpretation, including fault detection [10,11,12,13], horizon picking [14], paleokarsts [15,16], and salt boundary detection [17,18]. Seismic channel recognition, as a complex 3D semantic segmentation problem, benefits from the advantages of deep learning in spatial perception and multi-scale feature extraction. However, the application of deep learning models in seismic interpretation still faces several challenges, including the scarcity of training samples, high model complexity, and limited generalization ability on field seismic datasets.
To address the issue of insufficient labeled samples, Wang et al. proposed a method that combines geological channel simulation with geophysical forward modeling [19], constructing a large-scale labeled 3D synthetic seismic channel dataset that effectively supports the training of deep learning models. Gao et al. introduced CNNs and trained the model with synthetic data generated from geological numerical simulations, successfully achieving channel recognition in field seismic volumes [20]. Li et al. proposed a channel recognition method based on an end-to-end 3D CNN and successfully achieved efficient and accurate separation of river channel features in complex seismic structures [21]. Zhong et al. combined Frangi filtering with Attention R2U-Net, significantly improving the accuracy of channel linear structure recognition and multi-scale feature expression [22]. Despite these advances, recognizing natural channels remains challenging due to their complex and highly variable morphology, making accurate and stable identification difficult with current methods.
CNNs have advantages in feature extraction. However, their performance in certain complex tasks is limited due to their restricted receptive field, inability to model long-range dependencies, sensitivity to transformations, susceptibility to overfitting, and lack of global contextual information [23]. In contrast, models incorporating the Transformer structure demonstrate greater advantages in global feature extraction. In recent years, many researchers have explored various Transformer model variants and achieved significant results [24,25]. Lin et al. proposed a novel 2D deep medical image segmentation framework [26], which aims to incorporate the hierarchical Swin Transformer into both the encoder and the decoder of the standard U-shaped architecture. Meanwhile, a well-designed transformer interactive fusion (TIF) module is introduced to effectively perform multi-scale information fusion through the self-attention mechanism.
In this study, to accommodate the processing requirements of 3D seismic data, we modified the DS-TransUnet model by adjusting the sliding window configuration of the Swin Transformer to operate in three-dimensional space and replacing all 2D convolution operations in the encoder with 3D convolutions and applied the enhanced model to channel recognition in 3D seismic images. The optimization approach proposed in this study demonstrates significant advantages in channel identification and boundary delineation, while also achieving effective suppression of interference from similar features. This paper is structured as follows: The process of constructing the synthetic dataset is described in detail in Section 2. In Section 3, we present the theoretical foundation of the 3D DS-TransUnet model, highlighting its strengths in the field of image segmentation. Section 4 describes the training process of the proposed model on this dataset and compares the performances between traditional U-Net and TransUnet. Subsequently, we conducted an in-depth analysis of the proposed model’s performance in handling complex seismic data in Section 5 and further validated its accuracy and robustness using two-field seismic data. Section 6 provides a systematic summary of the methodologies adopted in this study, highlighting the core advantages of the model while objectively analyzing its current limitations and areas for improvement.

2. Generating Synthetic Datasets

The dataset used for training the network model comes from a workflow that can randomly generate numerous synthetic data, with dimensions of 256 × 256 × 256.

2.1. Channel Migration

The key to creating a realistic and meandering channel is simulating its migration process. By incorporating the migration rate formula [27,28], the actual migration process can be accurately simulated. The calculation of the migration rate is enhanced by considering the geometry of the upstream channel. This method can yield an adjusted migration rate. The migration rate formula is as follows:
R 1 ( s ) =     Ω R 0 ( s ) + Γ 0 G ( ξ ) d ξ 1 0 R 0 ( s - ξ ) G ( ξ ) d ξ ,
where ξ is the distance upstream from s , Ω and Γ are the weighting factors, G ( ξ ) is a weighting factors defined as e α ξ , and R 0 is nominal migration rate calculated as follows:
R 0 = k 1 W R ,
where W is the channel width, R is the bend radius of each node, and k 1 is a constant migration rate.
The process begins with a relatively straight channel exhibiting slight perturbations, which introduce initial curvature to drive channel migration. Over time, the channel gradually shifts, and meanders begin to form in the upstream region. As the migration progresses, the curvature of the meanders increases, eventually leading to channel convergence and cutoff. The migration process concludes when the maximum number of iterations is reached.

2.2. Simulating Stratigraphic Structure

To realistically simulate true stratigraphic structure, we introduce stratigraphic dip and fold structures into the initially flat layers. From a geological perspective, stratigraphic dip represents the inclination of sedimentary layers caused by tectonic tilting or differential compaction, while stratigraphic folds capture structural deformations produced by compressional tectonics or differential sediment loading. The formula for the stratigraphic dip is as follows:
Δ Z = a x + b y + c 0 ,
where a and b represent dip coefficients along the x and y directions within the range [0.02, 0.04], respectively, and c 0 denotes the constant term ensuring zero change at the center, calculated as follows:
c 0 = a x c b y c ,
where ( x c , y c ) refers to the coordinates of the center point. The formula for the adjusted elevation is as follows:
Z new = Z old Δ Z .
We use the Gaussian function to simulate the stratigraphic fold structure:
f gaussian = A exp ( x μ x ) 2 + ( y μ y ) 2 2 σ 2 .
The amplitude A defines the peak height of the fold, randomly sampled from [0.02, 0.04], indicating its vertical intensity. The coordinates μ x and μ y specify the spatial center of the fold along the x and y directions, respectively, while the standard deviation σ controls the spatial spread or width of the fold—larger values produce broader folds, within [0.10,0.15] of the model’s horizontal extent. The overall folding effect is obtained by the superposition of all Gaussian functions:
G sum = i = 1 N A i exp ( x μ x , i ) 2 + ( y μ y , i ) 2 2 σ i 2 .
In geological terms, these Gaussian-based folds mimic anticlinal and synclinal geometries, with amplitudes and wavelengths chosen to match observed ranges in seismic-scale folds.
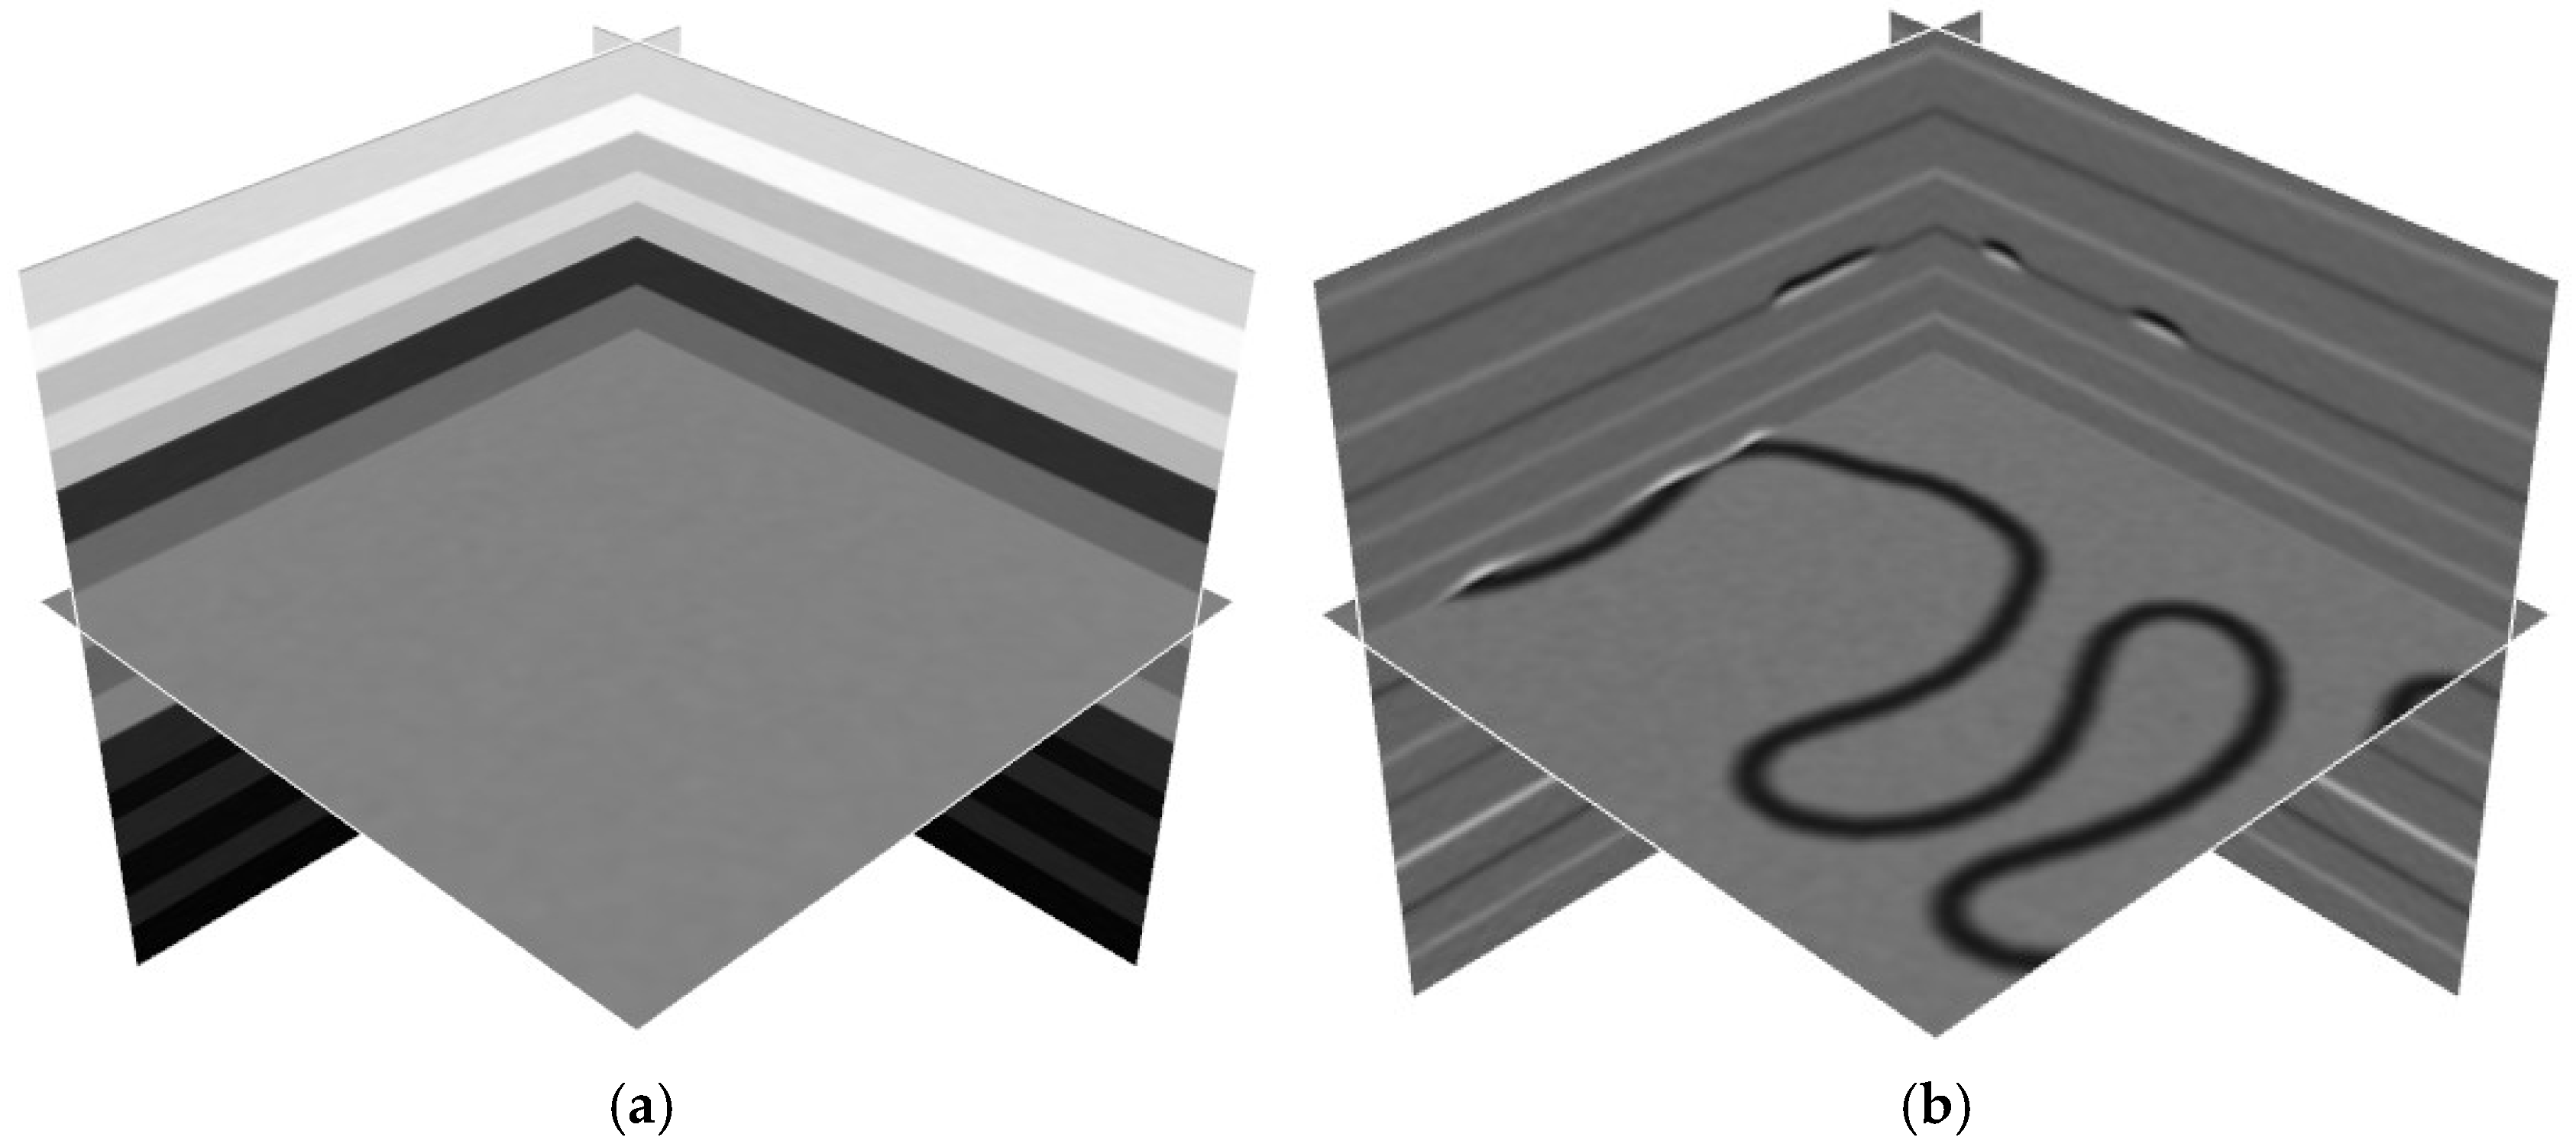
After generating various meandering channel patterns, they are integrated into the initial reflectivity model. Stratigraphic dip and folding structures are then superimposed onto the originally flat reflectivity layers to enhance geological realism. The reflectivity model is subsequently convolved with a Ricker wavelet to produce synthetic seismic volumes that reflect realistic subsurface responses. From a numerical standpoint, all parameters are constrained to physically realistic ranges based on field observations and seismic interpretation practices. This ensures that the generated synthetic data are geologically plausible while maintaining numerical stability. Since the parameters involved can be randomly defined within specified ranges, this workflow ensures the diversity of the generated synthetic data in terms of both geometry and structural variation. The overall workflow is illustrated in Figure 1.

3. Network Structure

3.1. Three-Dimensional TransUnet Architecture

TransUnet adopts a hybrid CNN–Transformer architecture that integrates the fine-grained spatial representation capability of convolutional neural networks with the global contextual modeling strength of Transformers [24]. This design improves both the precision of feature localization and the fidelity of structural characterization. Nonetheless, the architecture also inherits certain limitations intrinsic to CNNs. In particular, the downsampling process, while beneficial for capturing high-level semantic features, inevitably reduces feature map resolution, leading to the loss of important local details such as texture and boundary information. Furthermore, upsampling operations are insufficient to fully reconstruct these details, often resulting in boundary blurring and the introduction of artifacts [29]. Moreover, the skip connection strategy employed fails to adequately differentiate between hierarchical feature levels, potentially causing important information to be overlooked and irrelevant features to be overemphasized.

3.2. Swin Transformer Architecture

In existing Transformer-based models, tokens are fixed in scale, making them unsuitable for visual applications. The pixel resolution in images is much higher than in text, and many visual tasks require detailed predictions at the pixel level, which makes applying Transformers to high-resolution images computationally intractable. Current patch division methods often overlook pixel-level structural information and local topological features within each patch, leading to the loss of local continuity between patches.
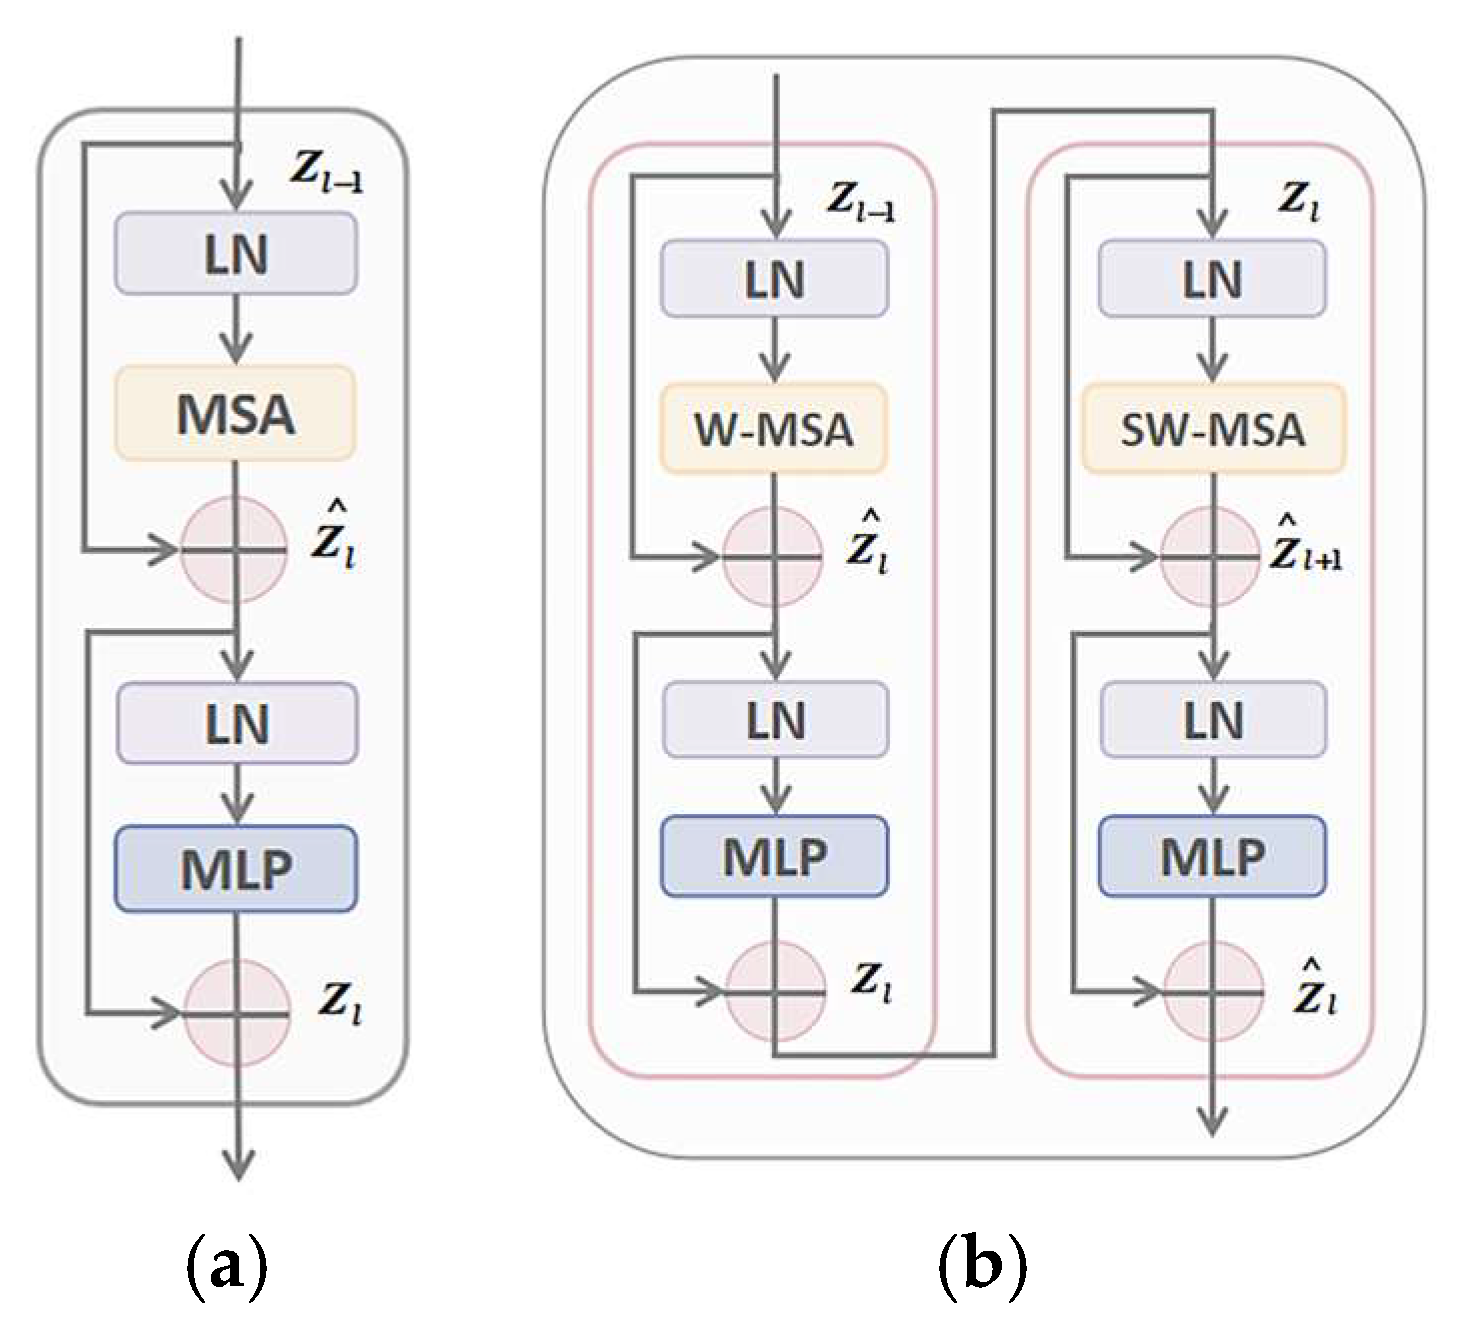
To address these challenges, Swin Transformer structures have been proposed, which build hierarchical feature maps and ensure linear computational complexity relative to image size [30], as illustrated in Figure 2.

3.3. Three-Dimensional DS-TransUnet Architecture

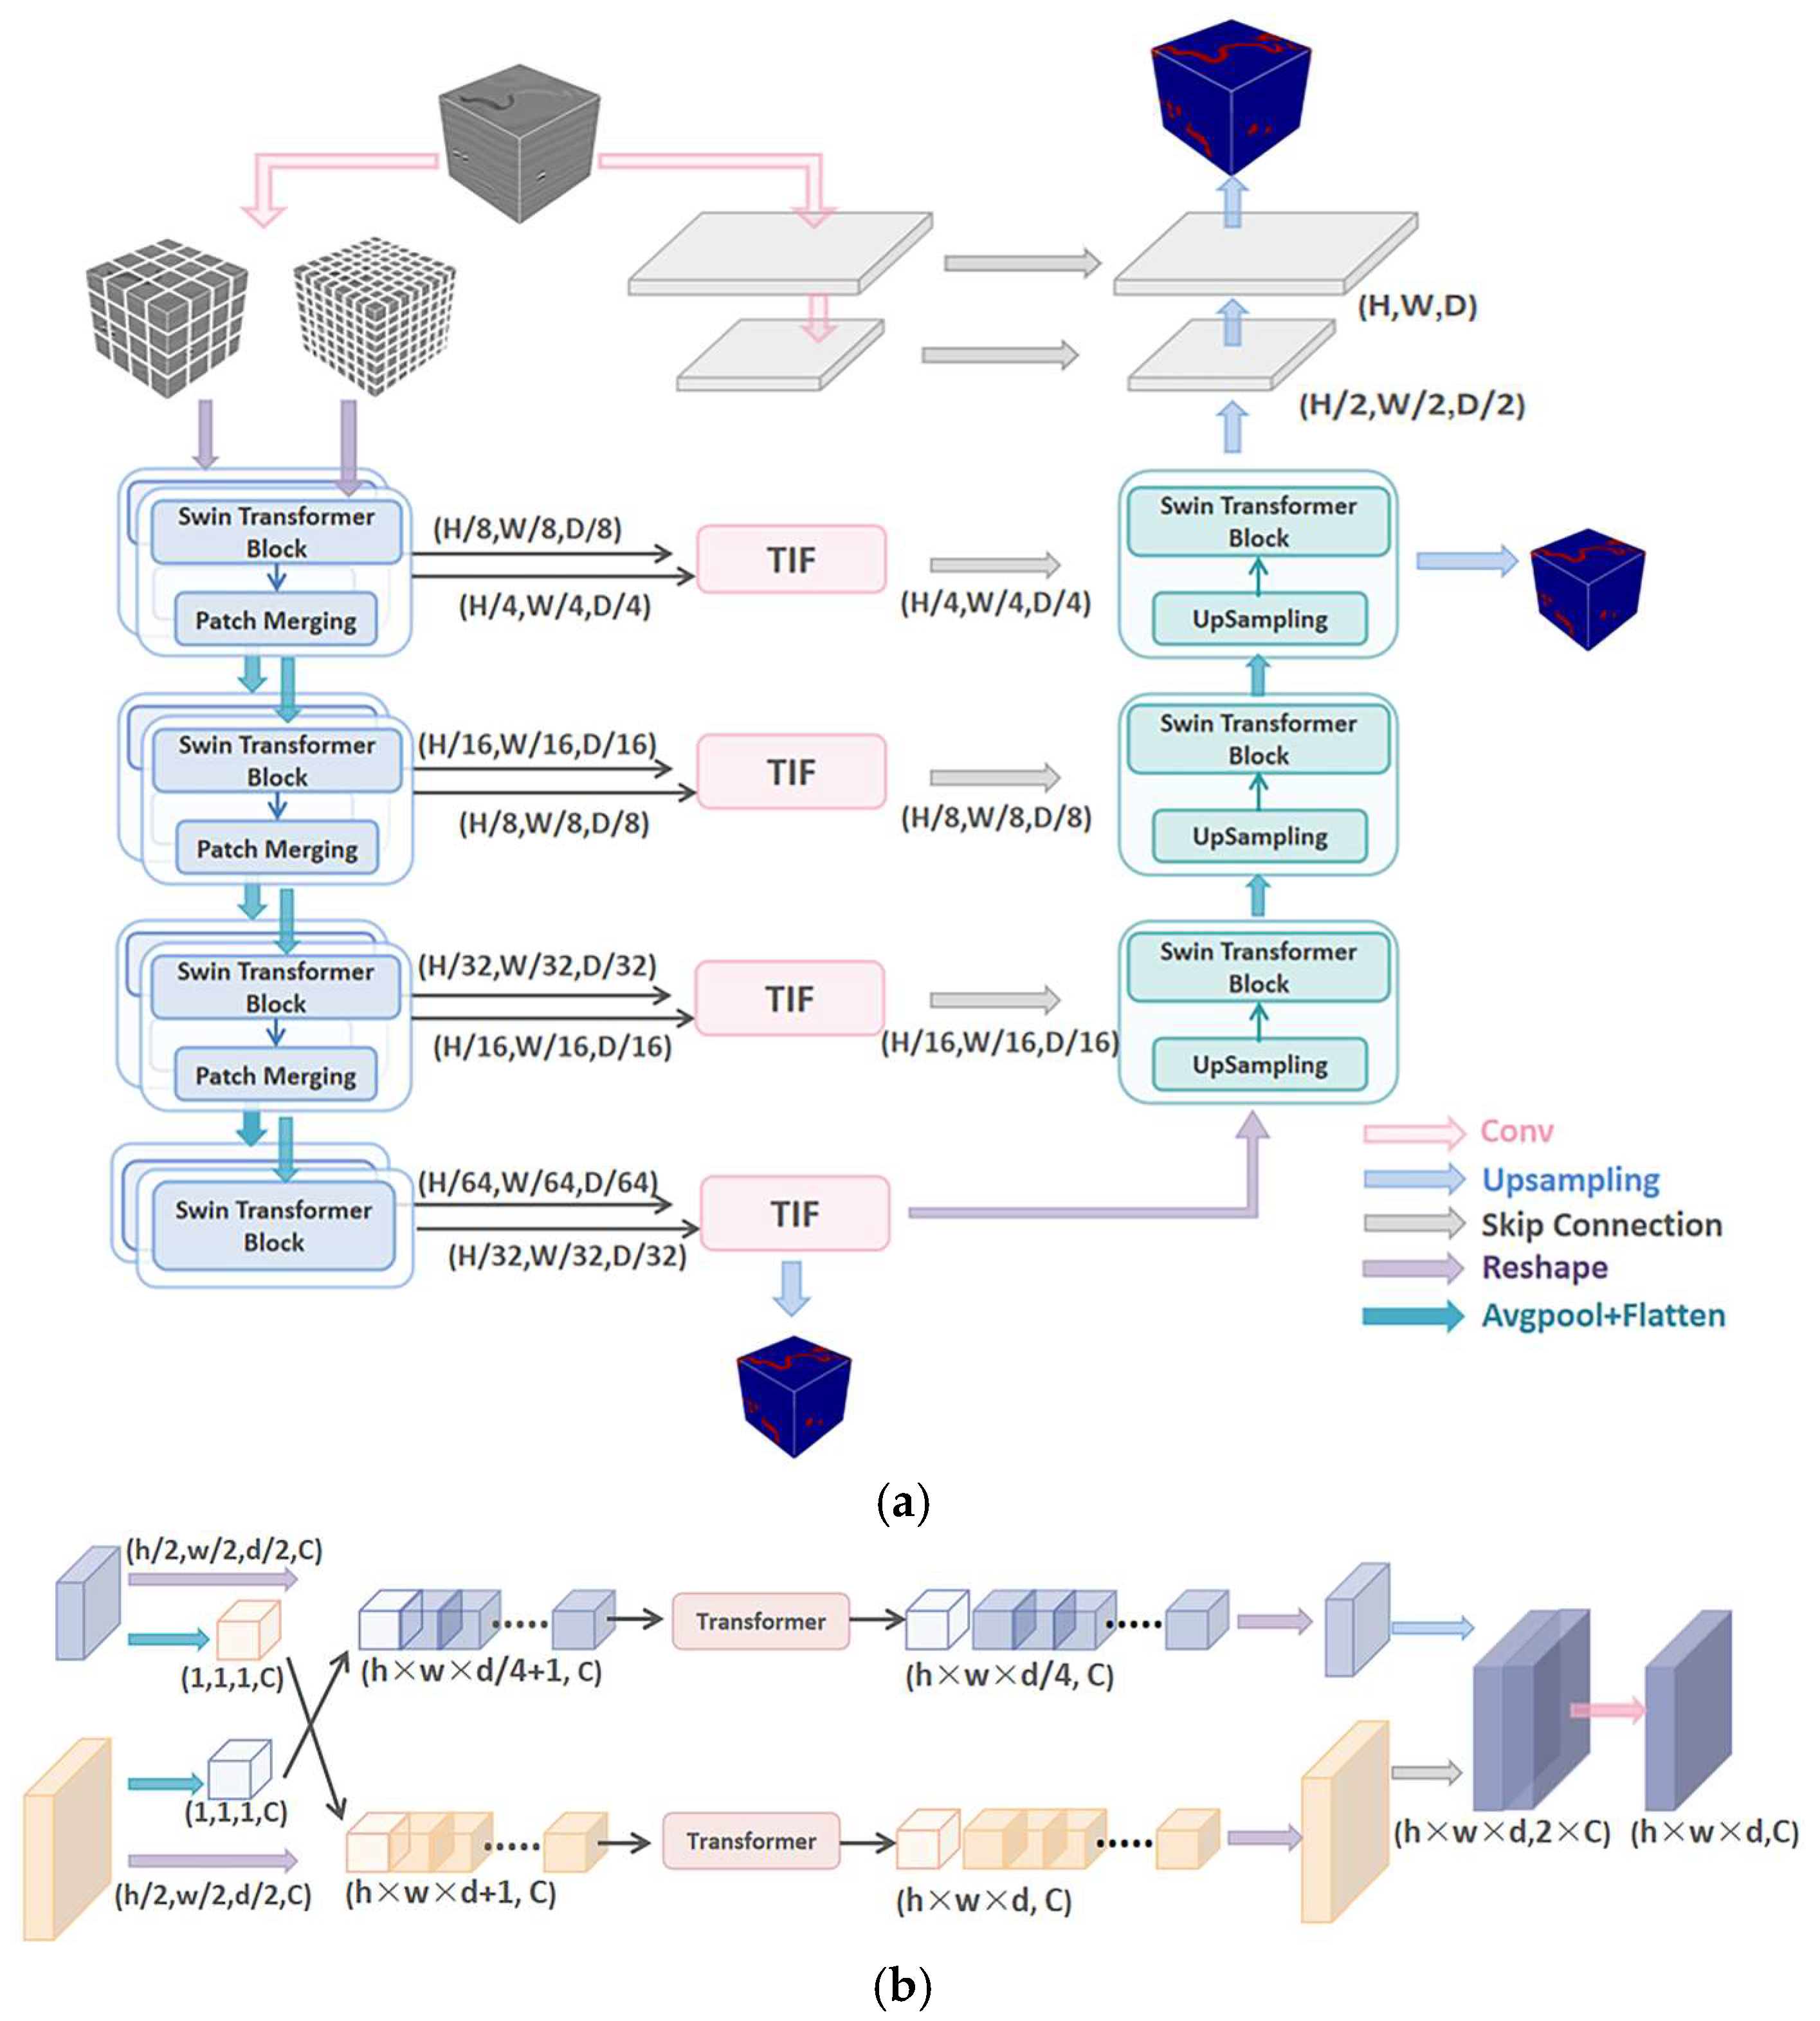
The 3D DS-TransUnet model introduces a novel dual-scale encoding mechanism to replace the traditional encoder, enabling the learning of multi-scale features, as shown in Figure 3. To accommodate 3D seismic image inputs, we innovatively replace 2D convolutions with 3D convolutions, where each seismic block is divided into non-overlapping patches at both large and small scales. By using these two different scales of patches as inputs, the proposed dual-scale encoder subnet effectively extracts both coarse-grained and fine-grained feature representations at different semantic levels. The TIF module, embedded within the skip connections, integrates these features, and its Transformer structure bridges the semantic gap. Furthermore, the introduction of a Swin Transformer block in the decoder further explores long-range contextual information, significantly enhancing the decoding capability.

4. Training and Model Evaluation

4.1. Training and Validation

Based on the workflow established in Section 2, which defines the simulation procedure, we generated 300 pairs of synthetic data for training the network model. We selected 150 pairs of synthetic images (labeled 0–149) as the training set and 40 pairs (labeled 200–239) as the validation set. The development platform is based on PyTorch 2.8.0, utilizing the Adam optimizer and the binary cross-entropy loss function. The batch size was set to 1, with an initial learning rate of 0.0001. Training was performed over 50 epochs on an Intel® Xeon® Platinum 8352V CPU (Intel Corporation, Santa Clara, CA, USA) with 120 GB of memory, and the optimal model was obtained at epoch 43.
To increase both the quantity and diversity of the training data, various data augmentation techniques were applied to the 150 pairs of synthetic images during training. The first augmentation method involved rotating the images by 0°, 90°, 180°, and 270° around the vertical axis. The second method involved randomly cropping smaller sub-volumes from the original images. To match the input size required by the model, these cropped volumes were resized to 128 × 128 × 128. We also applied Mean-Std normalization to the data using the following formula:
  x = x μ σ ,
where x denotes the original value, and μ represent the mean and standard deviation of the data, and σ is the normalized value.

4.2. Evaluation Metrics

In this paper, the performance metrics used are Intersection over Union (IoU), Precision, Recall, and F1 score. These metrics offer a comprehensive evaluation of the model’s performance in segmentation tasks. The formula of these metrics is specified as follows:
IoU = T P T P + F P + F N ,
Precision = T P T P + F P ,
Recall = TP TP + FN ,
F 1 = 2 × Precision × Recall Precision + Recall ,
where TP represents the number of correctly identified fault samples, FP refers to the number of non-fault samples incorrectly predicted as faults, and FN indicates the number of fault samples that were incorrectly classified.

4.3. Contrast Experiments for Training and Validation

The training and validation results of U-Net, TransUnet, and 3D DS-TransUnet are evaluated using loss and precision as metrics on the aforementioned synthetic data. Figure 4 depicts the comparisons of accuracy and loss curves for these models.
It can be seen that the 3D DS-TransUnet model converges faster than the other two models, with both the training and validation sets achieving a loss of 0.02. The Transformer structure’s core lies in the self-attention mechanism, while the feedforward neural network effectively facilitates gradient propagation and focuses on global context information. This allows the model to swiftly identify key features in the data. The global perspective enables the model to find the optimal solution faster, reduce instability, and accelerate convergence.
The Swin Transformer blocks in 3D DS-TransUnet contribute to reducing redundant computations and enhancing feature information transfer between layers through parameter sharing and cross-layer information fusion. Additionally, this structure gradually expands the receptive field, enabling the network to capture long-range dependencies while preserving local feature details. This strong global perception capability enables the model to adapt more quickly to different tasks, reduces the number of training iterations required, and enhances the model’s stability and convergence speed.
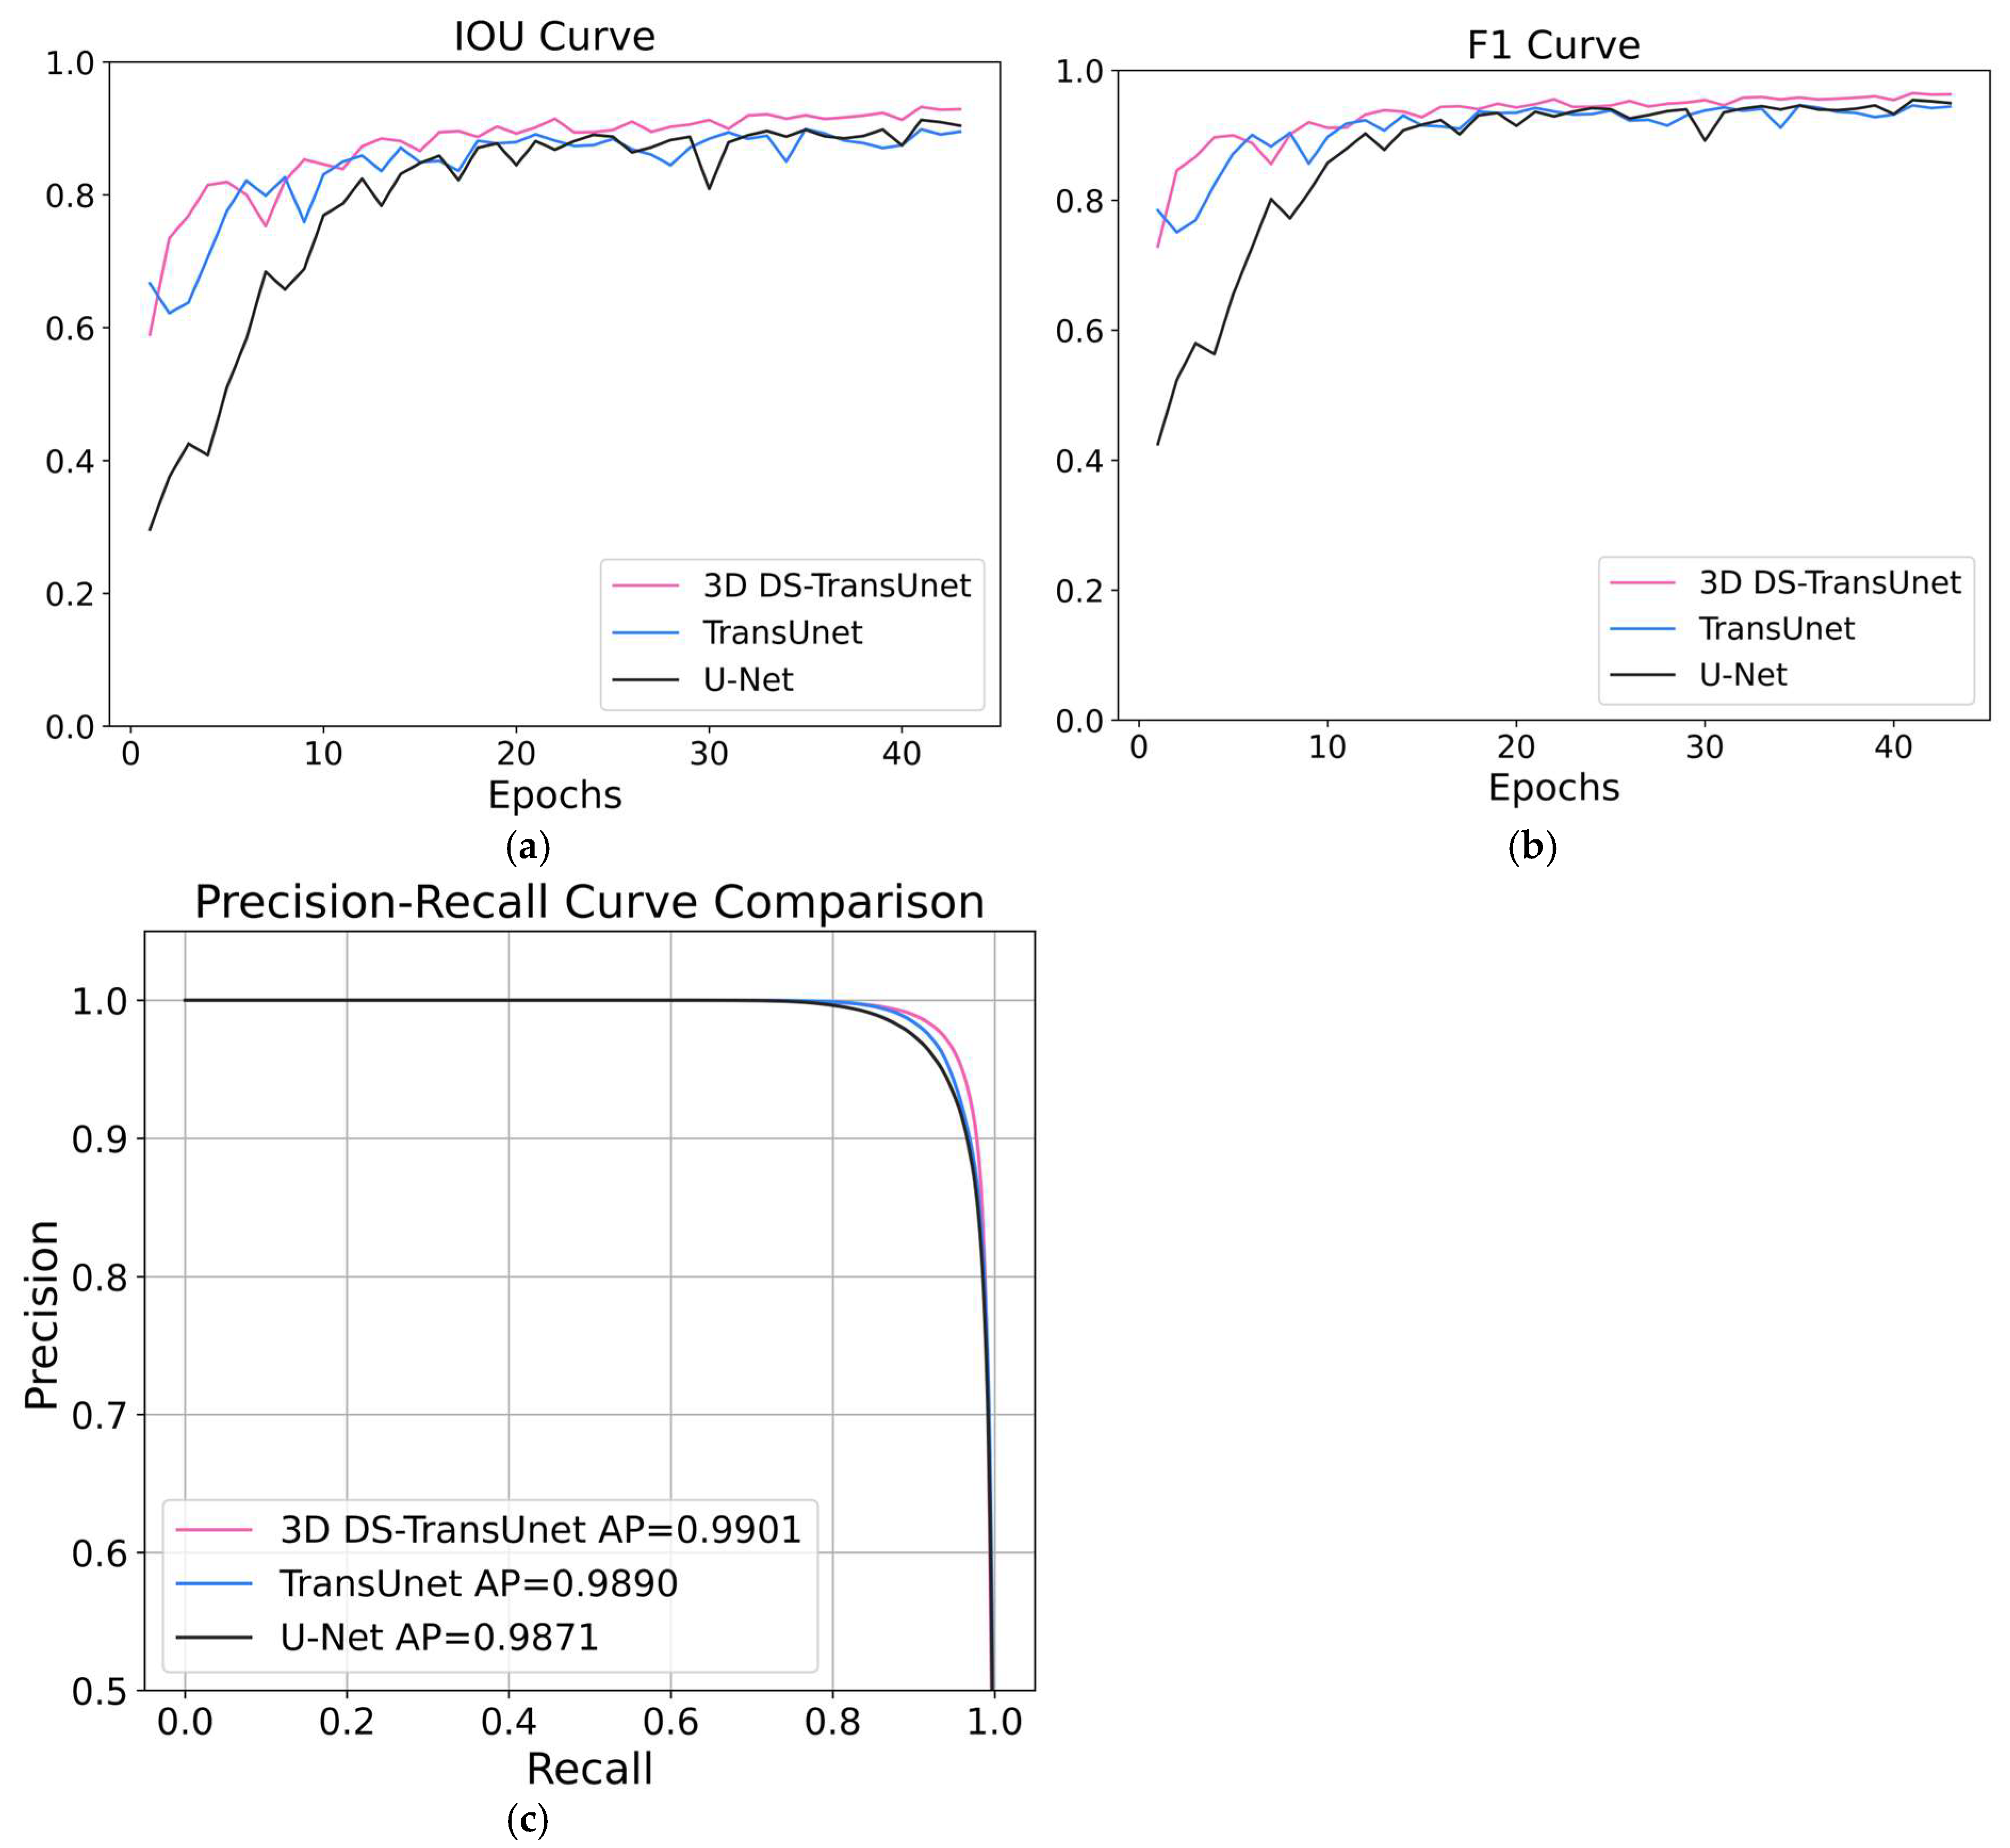
Figure 5 compares the performances of U-Net, TransUnet, and 3D DS-TransUnet on various evaluation metrics, including IoU, F1 score, precision–recall (PR) curve (with a threshold range of 0–1), as the number of iterations increases. The PR curve illustrates the relationship between precision and recall, making it particularly suitable for class-imbalanced tasks. The average precision (AP) value, defined as the area under the PR curve, quantifies the model’s overall trade-off between precision and recall across all thresholds. A higher AP indicates that the model maintains more stable performance under varying decision thresholds.
The results clearly show that the 3D DS-TransUnet model outperforms the others in all metrics. This superiority is primarily attributed to the incorporation of the Dual-Scale Swin Transformer structure in the encoder, which enables the extraction of higher-quality features in the model’s shallow layers. As a result, the 3D DS-TransUnet model achieves high performance early in the training process. Furthermore, by introducing the TIF block at the skip connections, multi-scale feature representations are effectively fused, bridging the semantic gap caused by differences in the hierarchical levels of intermediate features.
To provide a more reliable reference, we conducted additional testing on ten extra pairs of synthetic data (outside the training and validation sets). The metrics include precision, IoU, and F1 score. Table 1 compares the performance of three models when the optimal iterations are selected for testing: U-Net, TransUnet, and Ours (3D DS-TransUnet). As shown in Table 1, 3D DS-TransUnet achieves superior performance over the original TransUnet in synthetic data recognition.

5. Application

To test the recognition ability and generalization of the optimal iterative model, we applied it to a pair of synthetic data (labeled 251) and field seismic data. To mitigate the effects of clipping and boundary artifacts, overlapping regions are introduced between adjacent blocks, and trilinear interpolation is applied to the predictions. This approach smooths the transition areas, thus reducing the impact of clipping and boundary effects, and significantly enhances the accuracy and consistency of the final predictions. In fact, when performing trilinear interpolation, we only selected four traces near the boundary, far fewer than the total number of traces, so it did not affect the overall performance. Although the overlapping block strategy may increase computational overhead, we optimized memory management to minimize computational redundancy while ensuring the stability and performance of the model.

5.1. Comparisons on the Synthetic Datasets

This section applies the three trained models to synthetic seismic datasets, with a dimension of 256 × 256 × 256. Figure 6a shows the label of the synthetic data, which serves as the most standard reference for comparison. Figure 6b–d present the vertical slice at 194, showing the predicted results of U-Net, TransUnet, and 3D DS-TransUnet, respectively.
The comparison clearly demonstrates that the model proposed in this study, 3D DS-TransUnet, improves the accuracy of feature identification. As indicated by the yellow arrows, the model provides more reliable results: Arrow 1 marks a boundary that is delineated with higher precision, while Arrows 2 and 3 highlight a discontinuity that is more clearly recognized by the model. Overall, these results show that 3D DS-TransUnet delivers the most accurate and consistent recognition performance among the compared models.
This improvement underscores the model’s effectiveness in preserving the integrity of features throughout the seismic data. The self-attention mechanism in the Transformer structure strengthens long-range dependencies between patches. However, by treating the image as a sequence of non-overlapping patches, it overlooks the pixel-level intrinsic structural features within each patch, which can result in the loss of shallow features such as edges and lines.
In contrast, the Dual-Scale Swin Transformer, used in 3D DS-TransUnet, performs feature extraction by dividing the image into patches of different scales during encoding, allowing the patches to complement each other. This approach preserves local continuity during feature extraction, thereby enhancing the model’s robustness and improving segmentation performance.

5.2. Evaluations on Field Seismic Data from Tarim Oilfield

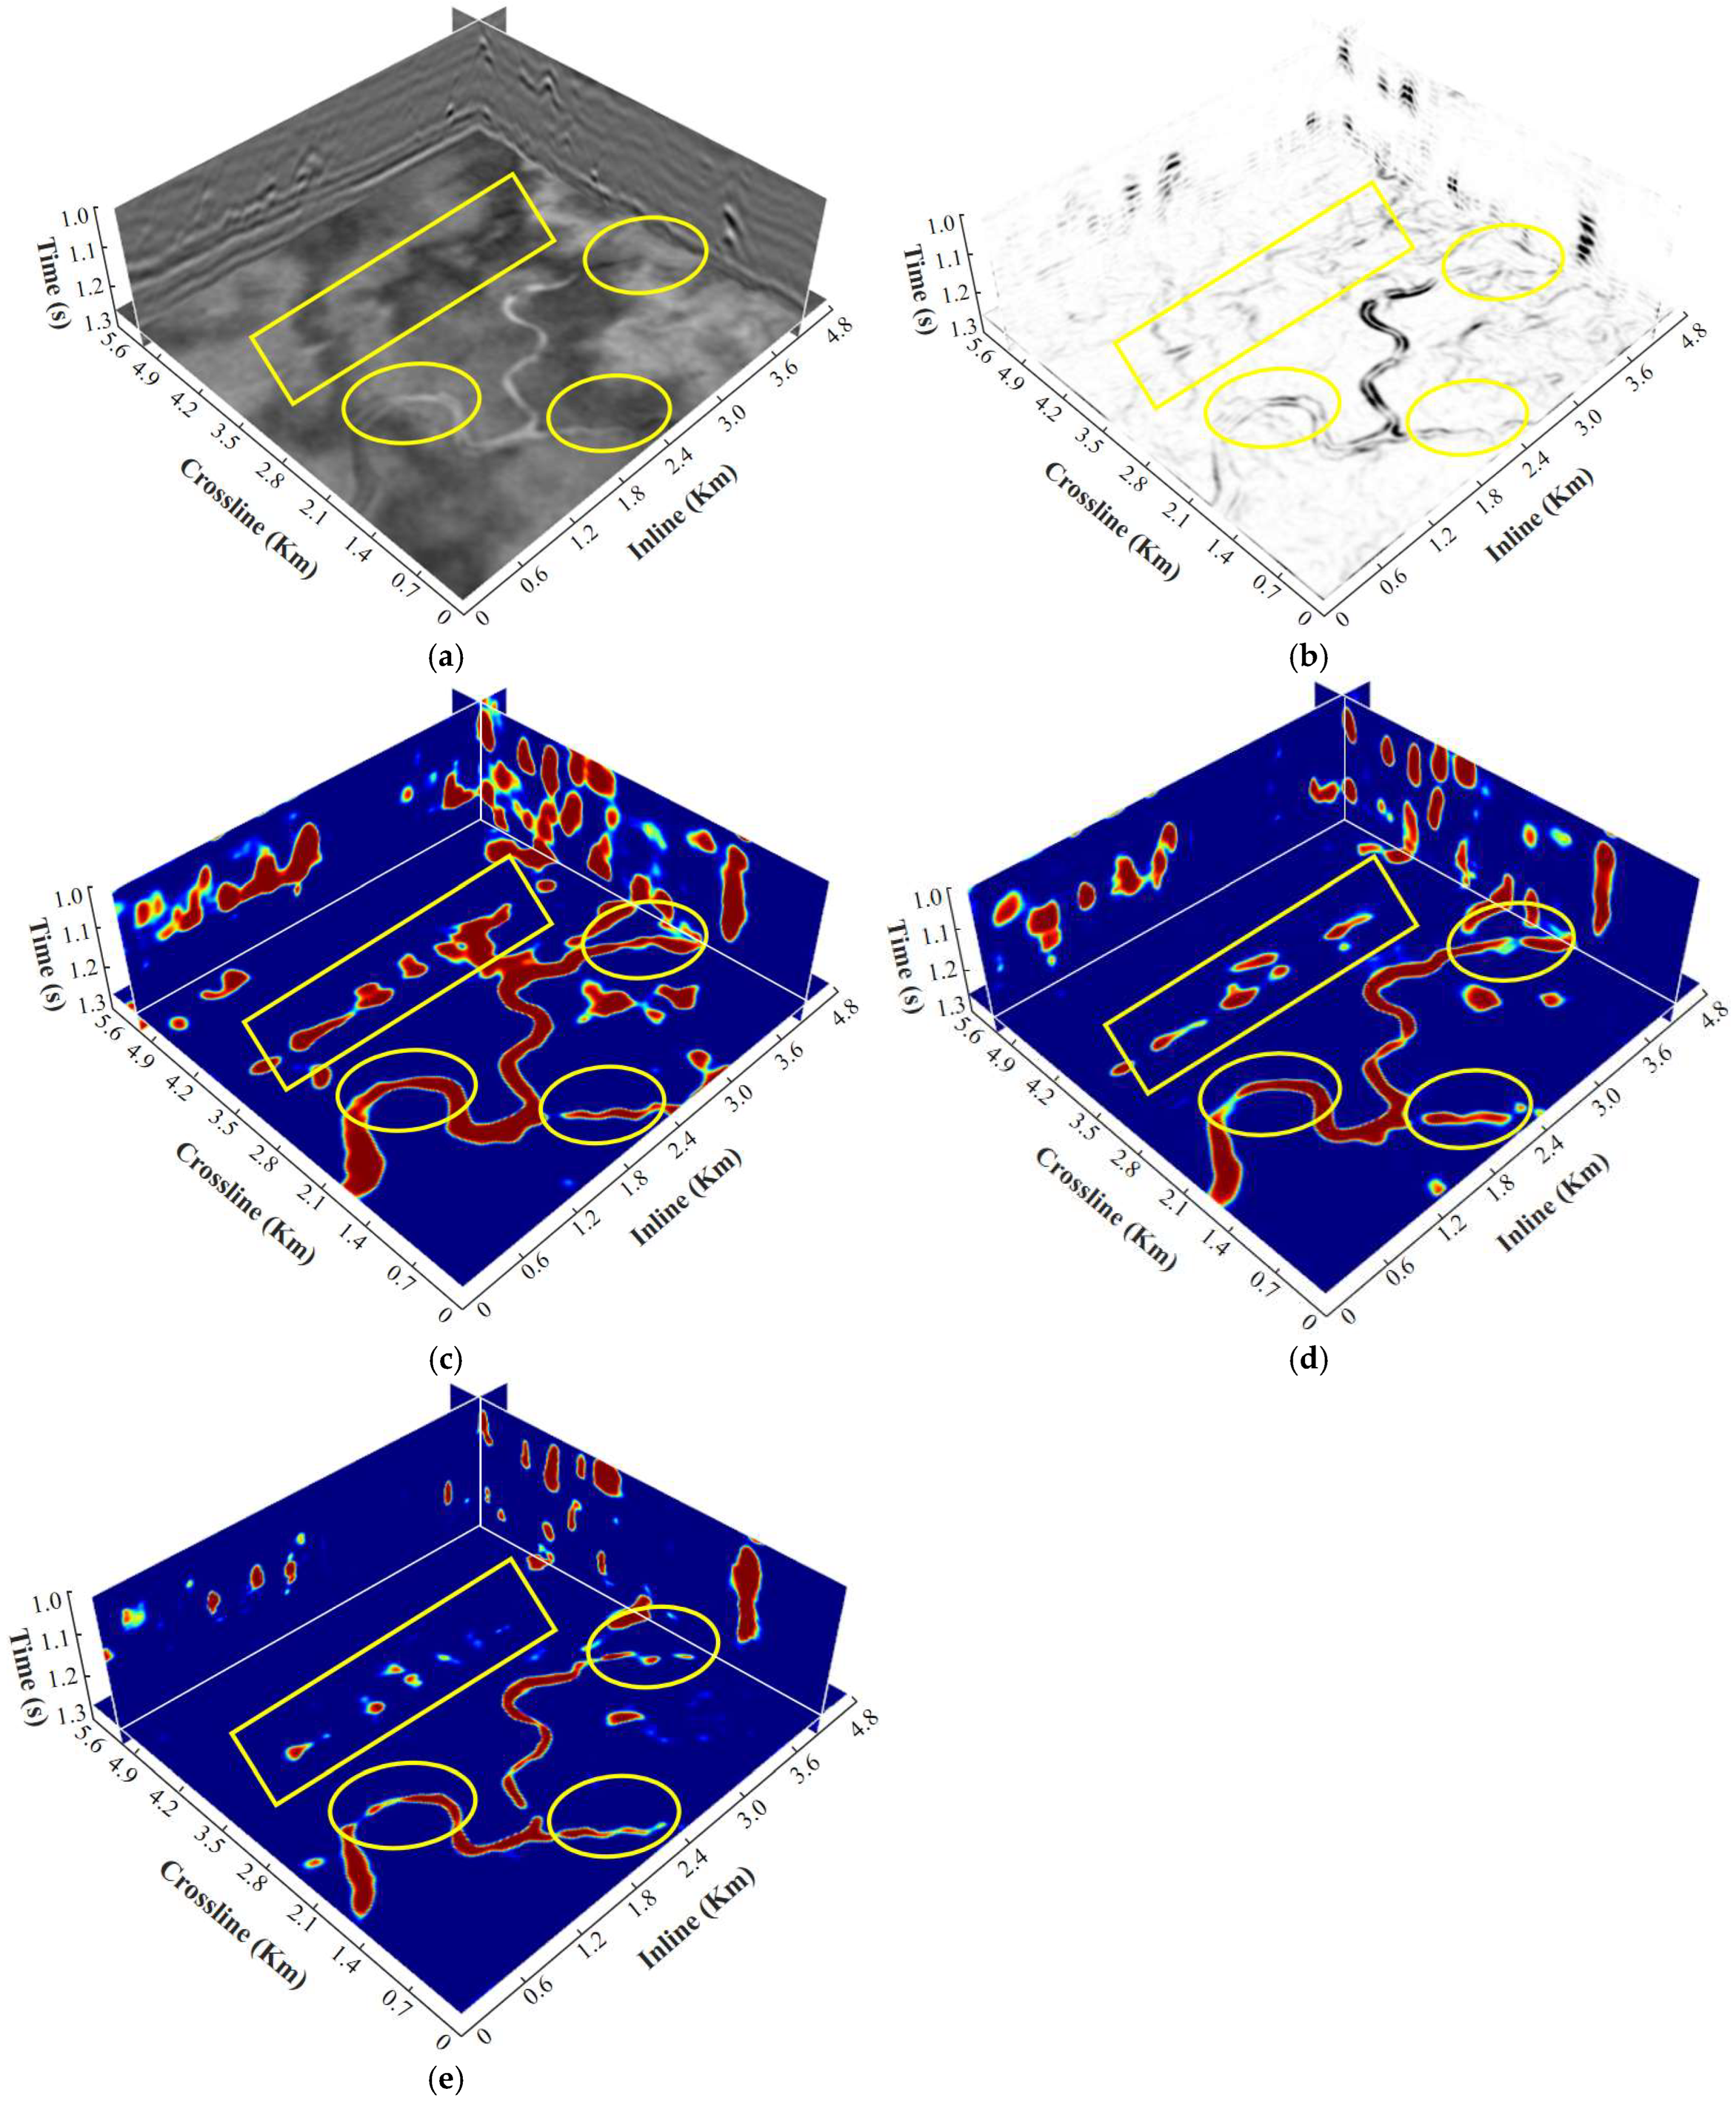
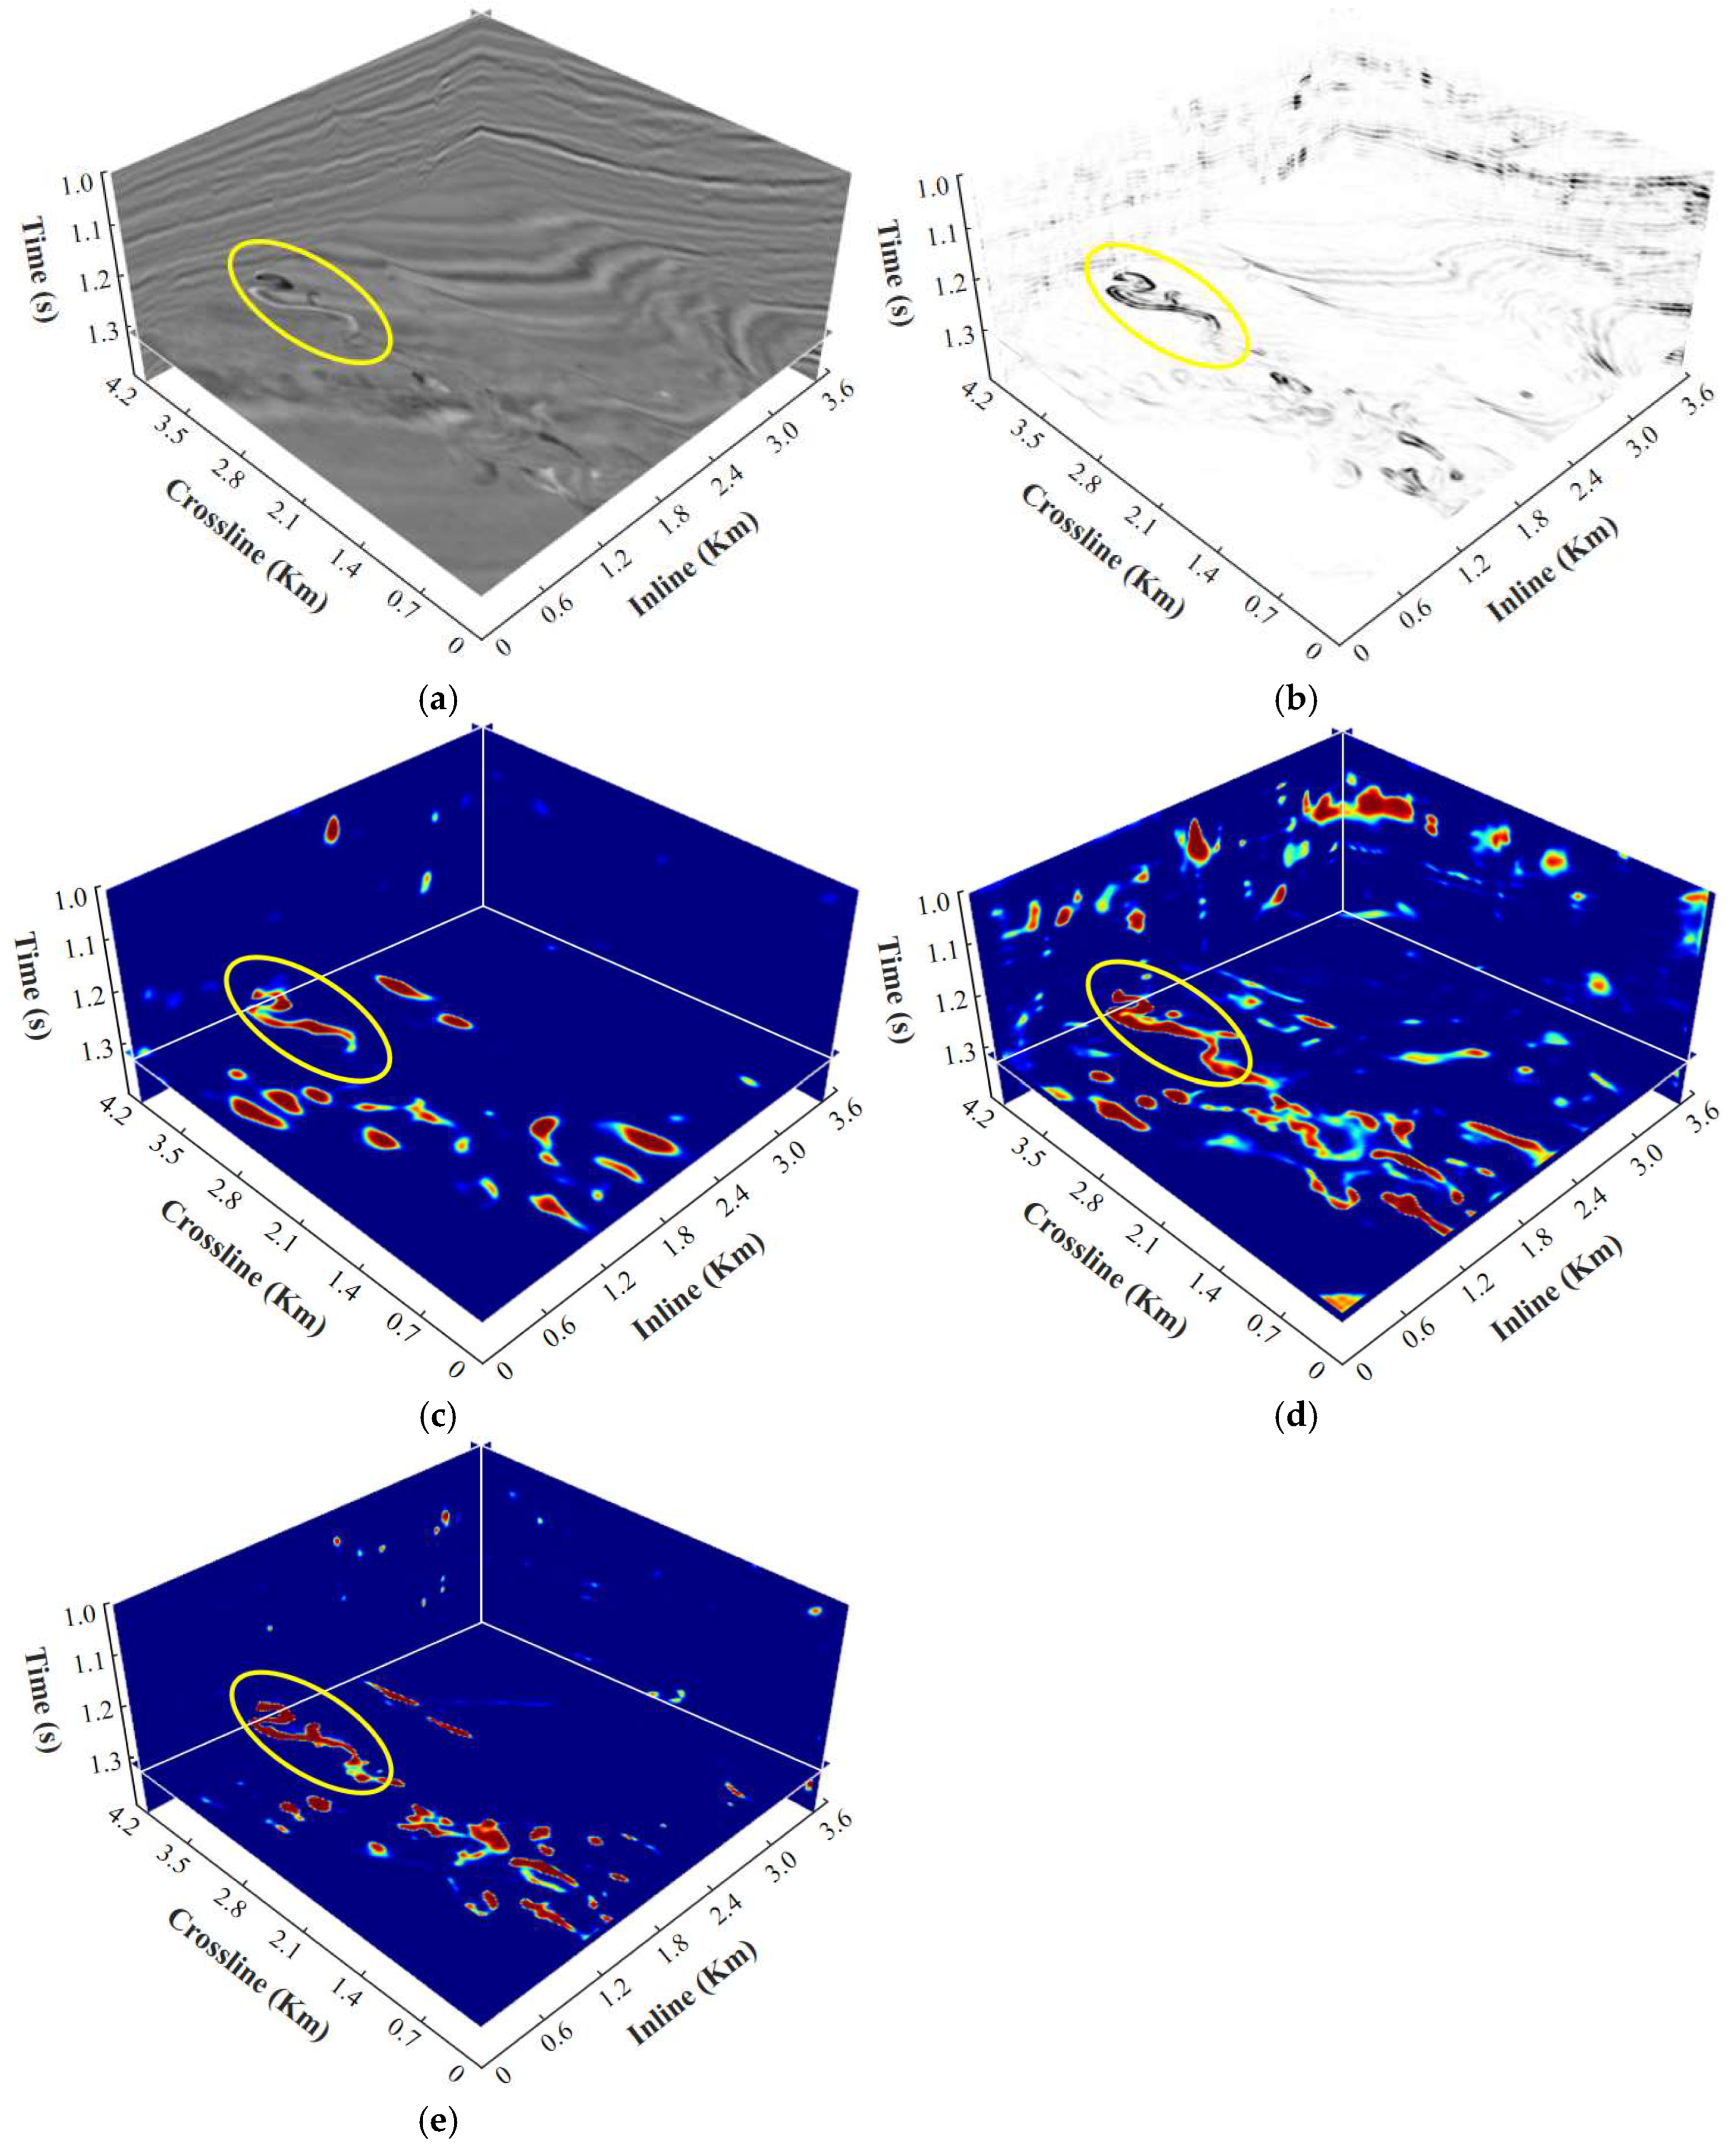
To better evaluate the generalization capability of the model, a small 3D field seismic dataset from the Tarim oilfield in northwest China is used for testing in this study. The dimensions of seismic data are 86 [vertical] × 241 [inline] × 256 [crossline], with a time sampling interval of 2 ms. Figure 7 compares the time slices of the recognition results obtained by the different models.
Figure 7a shows the original amplitude image of the seismic data, with a time slice at 1.27 s. Figure 7b displays the channel boundary delineation obtained using the coherence attribute, which serves as a baseline derived from traditional seismic attribute analysis. Figure 7c–e present the predicted results identified by the U-Net, TransUnet, and 3D DS-TransUnet, respectively. Compared with other models, the results of DS-TransUnet show closer agreement with the coherence attribute, further validating its effectiveness and reliability. In summary, the proposed DS-TransUnet model demonstrates outstanding performance in channel boundary delineation and exhibits stronger suppression of interference.
Compared to U-Net in Figure 7c, TransUnet in Figure 7d achieves higher accuracy in boundary recognition, primarily due to its ability to process features from multiple layers and locations simultaneously. This capability enhances the model’s ability to capture global information and handle complex image structures, enabling the extraction of more detailed and abstract features. However, the 3D DS-TransUnet model demonstrates even greater advantages in feature localization and fine feature recognition, as indicated by the yellow ovals. This improvement is primarily attributed to the Dual-Scale Swin Transformer used in the encoder stage. The Swin Transformer employs a cross-window information exchange mechanism through shifted windows, allowing information sharing between different windows. This design helps overcome the information isolation issue that can arise from relying solely on local window-based self-attention. The window shifting facilitates connections between different regions, effectively capturing long-range dependencies.
Additionally, the Swin Transformer effectively addresses the computational and memory bottlenecks of traditional global self-attention mechanisms, while preserving strong capabilities for modeling local features. By reducing computation and memory usage, it significantly enhances the model’s efficiency.
As evidenced by the yellow rectangles in Figure 7c–e, 3D DS-TransUnet demonstrates robust anti-interference capabilities. In fact, as indicated in Figure 7b, the coherence attribute results reveal that this region does not display the typical meandering morphology of channels.

5.3. Evaluations on Field Seismic Data from Parihaka3D

To further evaluate the generalization capability of the proposed model and verify the effectiveness of our method, we conducted experiments using the publicly available Parihaka3D seismic dataset, containing a series of meandering channels. The dataset has an original sampling interval of 3ms. It was partitioned into multiple sub-volumes with dimensions of 128 [vertical] × 256 [inline] × 256 [crossline], consistent with the model input size, to ensure spatial continuity in the segmentation results.
Figure 8a shows the original seismic amplitude, while Figure 8b presents the identification result using the coherence attribute, which serves as the interpretation reference. In the time slice, a small meandering channel is clearly visible, accompanied by a minor distributary branch. Observation of the seismic profile indicates that there is no strong seismic response above the selected slice. Figure 8c–e display the prediction outputs of the U-Net, TransUnet, and 3D DS-TransUnet models, respectively.
It is evident that Figure 8e demonstrates a significant advantage in channel boundary delineation, as highlighted by the yellow-marked regions. Compared with the coherence attribute result in Figure 8b, this region exhibits the typical meandering morphology of channels as well as small distributary branches. In comparison with U-Net and TransUnet, 3D DS-TransUnet provides more accurate delineation of channel boundaries and better preservation of fine details. Moreover, the model exhibits superior suppression of interference, particularly in the seismic profile dimension.
This advantage is primarily attributed to the introduction of the TIF block in the skip connections. The module effectively fuses the output features from the dual-scale encoder, allowing information from different scales to interact and merge. This overcomes the semantic gap between scales that is common in traditional methods, while preserving the integrity of global information and preventing the loss or confusion of local features. Moreover, the introduction of the Swin Transformer in the decoder enhances the model’s ability to capture long-range dependencies and significantly improves decoding accuracy during the upsampling process, resulting in more precise final outputs. Especially under complex interference conditions, the model demonstrates stable recognition of target features. These factors collectively contribute to 3D DS-TransUnet’s excellent performance in the identification and segmentation of complex geological features, showcasing its strong robustness and outstanding decoding capabilities.

6. Conclusions

In this study, we introduce the DS-TransUnet model to the field of intelligent seismic interpretation, with the goal of improving the accuracy and robustness of feature recognition in 3D seismic images. To accommodate the input of 3D seismic data, we innovatively modify the convolutional module to use 3D convolution operations. Experimental results demonstrate that, in tests on both synthetic data and field seismic profiles, 3D DS-TransUnet not only significantly enhances the accuracy of channel recognition under complex geological conditions, but also effectively suppresses interference, while exhibiting outstanding robustness and stability. However, due to the high similarity of seismic profiles, the model faces challenges in distinguishing between channel features and karst cave features, especially in the case of continuous karst cave structures. Relying solely on a deep learning framework still makes it difficult to accurately differentiate these similar features in seismic images. Meanwhile, there remains room for improvement in the continuity recognition of channels. To address these limitations, future research will explore two directions:
  • By incorporating geological background knowledge and conventional seismic attributes, this will provide the model with explicit prior constraints and enhance its understanding of complex geological structures. Expert-driven geological knowledge graphs are expected to guide the model in more accurately distinguishing between channels and similarly responding features such as karst caves, thereby compensating for the semantic limitations of conventional deep learning.
  • To further enhance model robustness and generalization, future work will focus on constructing more diverse and representative training and testing datasets that encompass a broader range of geological settings and noise patterns, thereby improving the model’s adaptability, stability, and reliability in field seismic interpretation tasks.
Author Contributions

Conceptualization, B.Y.; methodology, J.Z.; software, R.P.; validation, J.Z.; formal analysis, J.Z. and B.Y.; resources, B.Y.; data curation, M.L.; writing—original draft preparation, J.Z.; writing—review and editing, B.Y.; visualization, M.L. All authors have read and agreed to the published version of the manuscript.

Funding

This research was funded by the National Natural Science Foundation of China, grant number 42204113, and the Karamay Science and Technology Plan Project, grant number 2024hjcxrc0090.

Data Availability Statement

The project code is available at https://github.com/zhaojiaqi0701/Channel-Indentification, accessed on 8 June 2025. The open-source seismic data used for testing the model comes from https://wiki.seg.org/wiki/Open_data#Parihaka-3D, accessed on 5 May 2025.

Acknowledgments

We are grateful to Wang et al., Wu et al., and Gao et al. for providing the methods of generating synthetic datasets, which is of great help to this study and is of great significance to the intelligent interpretation of seismic data.

Conflicts of Interest

The authors declare no conflicts of interest.

References

  1. Pu, R.; Zhu, L.; Zhong, H. 3-D Seismic Identification and Characterization of Ancient Channel Morphology. J. Earth Sci. 2009, 20, 858–867. [Google Scholar] [CrossRef]
  2. Liu, Z.; Shang, Y.; Zhao, R.; Liu, F.; Xue, X.; Liu, Y. Formation Mechanism and Sedimentary Pattern of Abandoned Channels. Acta Geol. Sin. (Eng. Ed.) 2020, 94, 545–555. [Google Scholar] [CrossRef]
  3. Zhang, J.Y.; Fan, T.E.; Wang, H.F.; Zhang, X.W.; Du, X. Application of Curvature Attributes to Fluvial Reservoirs Discontinuity Detection. Geophys. Geochem. Explor. 2021, 45, 450–457. [Google Scholar]
  4. Wu, X. Directional Structure-Tensor-Based Coherence to Detect Seismic Faults and Channels. Geophysics 2017, 82, A13–A17. [Google Scholar] [CrossRef]
  5. Zhou, P.; Cao, J.; Liu, J.; Chen, S.; Wang, J. Concealed Channel Sand Body Identification Method Based on the Combination of Far Minus near Attenuation Attributes and Bi-LSTM Neural Network. Prog. Geophys. 2022, 37, 2129–2137. [Google Scholar]
  6. Application of the Synchrosqueezing Generalized S-Transform with the Lucy-Richardson Algorithm in the Characterization of Subtle and Complicated River Channels. Available online: https://www.geophysics.cn/EN/10.12431/issn.1000-1441.2024.63.06.012 (accessed on 22 July 2025).
  7. Liu, N.; Zhang, B.; Gao, J.; Zhang, Y.; Jiang, X. Channel Detection Using the Self-Adaptive Generalized S-Transform. In Proceedings of the SEG International Exposition and Annual Meeting, Anaheim, CA, USA, 14–19 October 2018; SEG: Tulsa, OK, USA, 2018; p. SEG-2018. [Google Scholar]
  8. Bian, B. Application of Seismic Attribute Clustering Method Based on PCA-SOM in Identification of Paleochannels. In Proceedings of the Journal of Physics: Conference Series, Beijing, China, 27 March 2024; IOP Publishing: Bristol, UK, 2024; Volume 2834, p. 012059. [Google Scholar]
  9. Ronneberger, O.; Fischer, P.; Brox, T. U-Net: Convolutional Networks for Biomedical Image Segmentation. In Lecture Notes in Computer Science; Springer International Publishing: Cham, Switzerland, 2015; pp. 234–241. ISBN 978-3-319-24573-7. [Google Scholar]
  10. Wu, X.; Liang, L.; Shi, Y.; Fomel, S. FaultSeg3D: Using Synthetic Data Sets to Train an End-to-End Convolutional Neural Network for 3D Seismic Fault Segmentation. Geophysics 2019, 84, IM35–IM45. [Google Scholar] [CrossRef]
  11. Zhang, G.; Lin, C.; Ren, L.; Li, S.; Cui, S.; Wang, K.; Sun, Y. Seismic Characterization of Deeply Buried Paleocaves Based on Bayesian Deep Learning. J. Nat. Gas Sci. Eng. 2022, 97, 104340. [Google Scholar] [CrossRef]
  12. Yan, B.; Qian, L.; Zhao, J.; Li, M.; Pan, R. Fault Identification Based on W-Net in 3-D Seismic Images. IEEE Geosci. Remote Sens. Lett. 2024, 21, 1–5. [Google Scholar] [CrossRef]
  13. Tang, Z.; Wu, B.; Wu, W.; Ma, D. Fault Detection via 2.5 d Transformer u-Net with Seismic Data Pre-Processing. Remote Sens. 2023, 15, 1039. [Google Scholar] [CrossRef]
  14. Wu, H.; Zhang, B.; Lin, T.; Cao, D.; Lou, Y. Semiautomated Seismic Horizon Interpretation Using the Encoder-Decoder Convolutional Neural Network. Geophysics 2019, 84, B403–B417. [Google Scholar] [CrossRef]
  15. Wu, X.; Yan, S.; Qi, J.; Zeng, H. Deep Learning for Characterizing Paleokarst Collapse Features in 3-D Seismic Images. JGR Solid Earth 2020, 125, e2020JB019685. [Google Scholar] [CrossRef]
  16. Yan, B.; Zhao, J.; Peng, K.; Qian, L.; Li, M.; Pan, R. 3D Karst Cave Recognition Using TransUnet with Dual Attention Mechanisms in Seismic Images. Geophysics 2025, 90, 1–63. [Google Scholar] [CrossRef]
  17. Farrokhnia, F.; Kahoo, A.R.; Soleimani, M. Automatic Salt Dome Detection in Seismic Data by Combination of Attribute Analysis on CRS Images and IGU Map Delineation. J. Appl. Geophys. 2018, 159, 395–407. [Google Scholar] [CrossRef]
  18. Di, H.; AlRegib, G. A Comparison of Seismic Saltbody Interpretation via Neural Networks at Sample and Pattern Levels. Geophys. Prospect. 2020, 68, 521–535. [Google Scholar] [CrossRef]
  19. Wang, G.; Wu, X.; Zhang, W. cigChannel: A Massive-Scale 3D Seismic Dataset with Labeled Paleochannels for Advancing Deep Learning in Seismic Interpretation. Earth Syst. Sci. Data Discuss. 2024, 2024, 3447–3471. [Google Scholar]
  20. Gao, H.; Wu, X.; Liu, G. ChannelSeg3D: Channel Simulation and Deep Learning for Channel Interpretation in 3D Seismic Images. Geophysics 2021, 86, IM73–IM83. [Google Scholar] [CrossRef]
  21. Li, H.; Yang, W.; Zhang, X.; Wei, X.; Xu, X. A ResNet-Based Method for Complex Channel Interpretation in Seismic Volumes. IEEE Geosci. Remote Sens. Lett. 2022, 19, 1–5. [Google Scholar] [CrossRef]
  22. Zhong, D.; Wang, J.; Guo, Y.; Liu, Y.; Chen, J.; Xu, T. A Frangi Filter Aided Deep Learning Approach for Palaeochannel Recognition. Geophys. J. Int. 2024, 236, 1526–1544. [Google Scholar] [CrossRef]
  23. Chen, J.; Lu, Y.; Yu, Q.; Luo, X.; Adeli, E.; Wang, Y.; Lu, L.; Yuille, A.L.; Zhou, Y. TransUNet: Transformers Make Strong Encoders for Medical Image Segmentation. arXiv 2021, arXiv:2102.04306. [Google Scholar] [CrossRef]
  24. Chen, L.; Wan, L. CTUNet: Automatic Pancreas Segmentation Using a Channel-Wise Transformer and 3D U-Net. Vis. Comput. 2023, 39, 5229–5243. [Google Scholar] [CrossRef]
  25. Chen, J.; Mei, J.; Li, X.; Lu, Y.; Yu, Q.; Wei, Q.; Luo, X.; Xie, Y.; Adeli, E.; Wang, Y.; et al. 3D TransUNet: Advancing Medical Image Segmentation through Vision Transformers. arXiv 2023, arXiv:2310.07781. [Google Scholar] [CrossRef]
  26. Lin, A.; Chen, B.; Xu, J.; Zhang, Z.; Lu, G.; Zhang, D. Ds-Transunet: Dual Swin Transformer u-Net for Medical Image Segmentation. IEEE Trans. Instrum. Meas. 2022, 71, 1–15. [Google Scholar] [CrossRef]
  27. Howard, A.D.; Knutson, T.R. Sufficient Conditions for River Meandering: A Simulation Approach. Water Resour. Res. 1984, 20, 1659–1667. [Google Scholar] [CrossRef]
  28. Sylvester, Z.; Durkin, P.; Covault, J.A. High Curvatures Drive River Meandering. Geology 2019, 47, 263–266. [Google Scholar] [CrossRef]
  29. Odena, A.; Dumoulin, V.; Olah, C. Deconvolution and Checkerboard Artifacts. Distill 2016, 1, e3. [Google Scholar] [CrossRef]
  30. Liu, Z.; Lin, Y.; Cao, Y.; Hu, H.; Wei, Y.; Zhang, Z.; Lin, S.; Guo, B. Swin Transformer: Hierarchical Vision Transformer Using Shifted Windows. In Proceedings of the IEEE/CVF International Conference on Computer Vision, Seattle, WA, USA, 13–19 June 2020; pp. 10012–10022. [Google Scholar]
Figure 1. The workflow for generating the synthetic training dataset. It begins with the construction of a flat reflectivity model (a), serving as the base geological structure. Simulated channel geometries are then embedded into this model (b) to introduce target features. Subsequently, realistic geological deformations, such as folding and stratigraphic dip, are added to enhance geological plausibility (c). The resulting reflectivity model is convolved with a Ricker wavelet to produce the corresponding 3D synthetic seismic data (d). Since the geometry of the channels is explicitly defined during the modeling process, a binary semantic label image (e) can be automatically generated, where the channel region is marked in red with a value of 1, and the non-channel region is marked in blue with a value of 0.
Applsci 15 09387 g001aApplsci 15 09387 g001b
Figure 2. (a) The architecture of the signal layer Transformer. (b) Schematic of a Swin Transformer block.
Applsci 15 09387 g002
Figure 3. The architecture of 3D DS-TransUnet network (a) and TIF block (b).
Applsci 15 09387 g003
Figure 4. Evaluation metrics of the model during training and validation. (a) Accuracy curve; (b) loss curve. The convergence speed of 3D DS-TransUnet is faster than that of TransUnet and U-Net, and the loss curve tends to stabilize more quickly.
Applsci 15 09387 g004
Figure 5. Evaluation metrics for U-Net, TransUnet, and 3D DS-TransUnet. (a) IoU. (b) F1 score. (c) PR curve.
Applsci 15 09387 g005
Figure 6. Comparisons of predicted results on synthetic seismic images. (a) Label, (b) U-Net, (c) TransUnet, and (d) 3D DS-TransUnet.
Applsci 15 09387 g006
Figure 7. Comparisons of predicted results on field seismic images. (a) Seismic amplitude; (b) coherence; (c) U-Net identification result; (d) TransUnet identification result; (e) 3D DS-TransUnet identification result.
Applsci 15 09387 g007
Figure 8. Comparison of field seismic data from Parihaka3D. (a) Seismic amplitude; (b) coherence; (c) U-Net identification result; (d) TransUnet identification result; (e) 3D DS-TransUnet identification result.
Applsci 15 09387 g008
Table 1. Metric comparisons of U-Net, TransUnet, and Our Model (3D DS-TransUnet). The black bold font represents the best value.
ModelMetrics251252253254255256257258259260
U-NetPrecision (%)93.8094.5489.4693.4894.6393.8896.0194.6190.5390.16
IoU (%)90.8392.2089.2991.7492.2991.4492.1593.1189.6589.40
F1 score (%)95.1995.9494.3495.6995.9995.5395.9296.4394.5494.40
TransUnetPrecision (%)97.3190.5090.1996.5585.7192.9097.8097.4489.8390.82
IoU (%)87.6483.1988.7287.5077.0582.1482.9389.4486.7188.80
F1 score (%)93.3790.1494.0093.3081.8690.1690.5594.4292.8494.02
Our ModelPrecision (%)96.8598.0595.8297.7497.9894.0296.0497.5596.5695.03
IoU (%)93.0391.9592.8693.1693.4490.5892.6393.2790.4791.64
F1 score (%)96.3895.6796.3096.4596.6095.0496.1696.5194.9895.62
Disclaimer/Publisher’s Note: The statements, opinions and data contained in all publications are solely those of the individual author(s) and contributor(s) and not of MDPI and/or the editor(s). MDPI and/or the editor(s) disclaim responsibility for any injury to people or property resulting from any ideas, methods, instructions or products referred to in the content.