Abstract
Oak wood is a popular construction material in Europe. In the course of its service life, this wood is subject to structural changes resulting from the environmental conditions to which it is exposed, in addition to the effects of aging. Samples of naturally occurring historic European oak (Quercus robur L.) were obtained from foundation piles that were utilized to reinforce the riverbanks in Poland, the Vistula River basin, dating to the 2nd century, as well as from a 14th-century settlement on the river in Slupsk. Reference wood was also obtained from contemporary harvesting operations in the vicinity of Slupsk, Poland. The presence of structural changes resulting from partial wood degradation was confirmed through the utilization of FTIR spectroscopy analysis, SEM with BSD microscopy, and chromatic parameters. The differences in the color of historic and reference wood were significant (based on Kruskal–Wallis test = 46.38, where p < 0.001). The results of chemical analysis showed an increase in the proportion of lignin and a decrease in carbohydrate components for the old wood. A higher degree of change in lignin content was observed in historic wood (32–38%) compared to the fresh wood sample (25%). Our study showed that the collected data can be applied to the preparation database of heritage wood materials.
1. Introduction
Wood, as a natural polymer, is subject to biodegradation, structural changes, and aging during its use. Under various conditions of wood use, especially in an aquatic environment or soil, atmospheric factors can have a negligible effect, while the natural process of degradation and aging becomes the dominant factor leading to changes in the material [1]. In structural timber, oak heartwood is important. Storage and protection of non-renewable archaeological finds are very important for the preservation of the cultural heritage of mankind. The UNESCO Convention recommends storing archaeological remains in the natural environment, which requires knowledge in reducing and/or mitigating the impact and risks caused by burial conditions. Researchers have found that it undergoes chemical changes and develops internal stresses and altered hygroscopicity after long-term use [2]. Due to the hygroscopic nature of the material and its changing moisture content, as well as the elasticity of the wood, internal stresses also occur during use [1]. The natural processes of wood degradation and aging are relatively poorly studied and are usually interpreted as a slow process of thermal oxidation over a range of natural temperature fluctuations [3]. In this process, oxygen is dissolved in water in the air or infiltrates the soil, causing hydrolysis due to the water content of acids and compounds in the wood [4,5]. Under humid conditions, some organic acids, such as 4-methylglucuronic acid and galacturonic acid, can form in wood at very low concentrations [1,2].
Natural aging of wood most often shows changes in hemicelluloses, which are the least stable components [6,7,8]. FTIR spectroscopy and chemical analysis confirm a decrease in the proportion of free hydroxyl groups, which in turn leads to a decrease in hygroscopicity and thus greater dimensional stability of wood [9,10]. Wood aging can also influence an increase in the degree of crystallinity of cellulose [11], as a result of the greater susceptibility to degradation of amorphous regions compared to crystalline regions. The oak wood tested contained a heartwood zone. Researchers confirm that a significant proportion of tannins slows down the process of biotic degradation. However, in the case of wood raw material, such decomposition should be taken into account as a factor degrading the wood structure. The role of bacteria in the degradation of archaeological wood remains insufficiently studied in terms of the changing structure of wood and the conditions of natural use of this raw material. Part of the decomposition of wood under storage conditions has been studied. Most of the existing knowledge is extrapolated from soil microbiology, where such organisms are thought to be capable of degrading lignocellulosic compounds [1,2,3,4,5,6,7,8]. However, relatively little research has been conducted on wood-degrading bacteria [9,10,11]. Biotic agents, particularly fungi and insects, are directly responsible for a wide range of wood degradation under favorable moisture conditions [12]. Even minor degradations caused by microorganisms or insects can cause high-quality wood to degrade [13]. The importance of colorimetry in the field of conservation is considered one of the most important criteria for evaluating conservation materials. Infrared micro-spectroscopy analyses allow for the evaluation of various reaction processes occurring in wood and the structural changes of the main components of wood. The impact of various treatment methods on the conditions of use of a wood sample can be assessed using stereomicroscopy, polarized light microscopy, and scanning electron microscopy in combination with energy dispersive X-ray spectroscopy. The results obtained can be helpful in the proper preservation of historic wood [14]. There are differences in the age assessment results obtained using the indicated techniques. For the conservation of wooden heritage, this may lead to incorrect interpretation of wood preservation methods. In conservation practice, these techniques complement each other, which is important for the cultural well-being of wooden monuments and supports the justification for the conducted research.
The color change that occurs when wood ages naturally is mainly due to a process called slow oxidation [4]. Depending on environmental conditions, wood color changes can be varied. They are caused by differences in the chemical composition of a given wood species, and in particular, the compounds responsible for the color change [6]. This mainly concerns extractive compounds and lignins [6]. It is important to know that the color of wood can change not only depending on the environment, but also due to the type of wood and its unique chemicals [4]. In addition to the factors mentioned above, wood color is also influenced by its density [15]. Denser wood typically contains more lignin and tannins.
Studies show that the natural aging of wood can also affect microstructural changes in wood. These include an increase in the number of cracks in the wood, the separation of layers in the wood, and the appearance of radial (spiral) cracks in the cell walls [16,17]. It is difficult to say for sure that defects in a wood sample are just due to its age if we do not know its history. However, these problems are more likely to occur in areas with a higher content of hemicelluloses, pectins, and lignins [18].
To date, wooden piles from this area of historical wood have not been examined in terms of detailed chemical analysis. This complements archaeological research in these areas. The aim of the research was to assess the progress of degradation of structural objects in order to conduct further research on their conservation. The main objective of this study was to investigate the chemical and physical changes occurring in oak wood over time. These changes occur because the wood has been exposed to certain local environmental conditions over a long period of time. In other words, the study tested the effectiveness of three methods: microscopic analysis, classical chemical analysis, and infrared spectroscopy. Specifically, the study is concerned with evaluating the applicability of microscopic method, classical chemical analysis, and infrared spectroscopy to assess the aging process of engineered wood.
2. Materials and Methods
2.1. Sampling
The wood for the study comes from the part below ground level, from the inner part of the foundation piles. The wood selected for testing exhibited no indications of biological degradation. Since the acquisition of the research material was connected with historical work, access was gained to documents containing information on the location and history of the objects. Samples of European oak wood were obtained from piles provided by the Vistula Region Research Unit and from archaeological surveys in the Slupsk area. Samples of oak wood dated to the 2nd century AD in the Vistula valley, Machów (age 1850 + 35 years). The Tarnobrzeg–Baranów hump, separating the Pra-Vistula trough from the Vistula valley, rises 15–25 m above the bottom of these valleys. It is formed by a dike 14 km long, with a slight width of 2–3 km. The hump is built from the Cracovian clays and Tertiary sands. Glacial sands and clays are present on the surface. The surface of the Hump is truncated at an altitude of 175–180 m above sea level in the SW part—from Baranow to Miechocin—and in the NE part from Miechocin to Tarnobrzeg at an altitude of 160–165 m above sea level. Similar differences in elevation are also observed in the subquaternary surface [19,20].
Samples of the second wood of historic European oak (Quercus robur L.) were obtained from the research plot in Słupsk (N 54°28′04″ E 17°01′56″) [21]. Excavated piles reinforcing the walls were secured, and test samples were taken from a depth of 250 cm with the exact location of the collection site in Poland (Figure 1). The research included verification of wood from the retrieved piles with cross-sections of structural elements from a diameter of 16 cm to 25 cm. The piles came from repeated archaeological investigations in the Slupia River area, having to do with a tower or defensive wall built on the river bank. The origins of the city of Slupsk date back to the 8th–9th century, where a small defensive stronghold was built. At the turn of the 10th and 14th centuries, Slupsk came under the sovereignty of the Piasts. The excavated area was dominated by rusty soils associated with river sands and gley soils developed from aeolian sands. Organic, gleyic, and mucky soils were also locally present. The age of the parent materials of the rust soils was estimated by the TL method at 9.0–9.8 ka BP, and the gley soils at 4.2–5.1 ka BP. The studied soils were rich in organic carbon, and the nitrogen and phosphorus contents varied. The rusty soils were characterized by well-developed horizons with an intense, rusty color [22].
The samples were taken from piles dug out of the ground, which had been used to support wooden buildings in the past. Human settlements were naturally located near rivers (Table 1). The conditions of use of the oak piles marked as B and C were similar in terms of contact with the soil and possible groundwater involvement. All of the raw material obtained was wood from the heartwood. The environmental conditions for oak wood B and C were similar due to contact with the ground. The reference to reference wood A is intended to show the changes that can be confirmed in comparison with fresh wood (not used for installation in the ground).
At the same time, we collected wood samples from oak trees felled in 2022 in nearby oak stands of the Baltic Natural Forest Region (I) in Poland from the forest plot (N 54°20′11.8″ E 17°04′17.5″) [19]. These samples of modern oak wood were used for comparison with historical wood. As for habitats and soils, Pleistocene geological formations prevail—mainly glacial till, sands, and gravels of the glacial till of the North Polar glaciation—partly in terminal moraines, and less numerous, occurring in small patches—sands and silts of the kemes. Sandstone sands and gravels are quite common, while clays, silts, and stagnant sands are found mainly near Slawno. Holocene sands, gravels, fluvial muds, peats, and silts fill the river valleys [23,24,25,26,27].
For the analysis, we used cuttings of pile structure elements (n = 10) and, in the case of reference wood, from the breast height (1.3 m above ground) of felled trees (n = 10).

Table 1.
Geographic location of reference (A), 14th-century archaeological (B), and 2nd-century (C) timber sampling and study site on map and part of old timber lot (historic timber) [15,16,19].
Table 1.
Geographic location of reference (A), 14th-century archaeological (B), and 2nd-century (C) timber sampling and study site on map and part of old timber lot (historic timber) [15,16,19].
| Sample | Locational | Data Location | Age of Wood |
|---|---|---|---|
| (A) | N 54°20′11.8″ E 17°04′17.5″ | Regional Directorate of Forests Szczecinek Stary Dwór Forest District Mielno Forest | Age 100 years old References wood |
| (B) | N 54°28′04″ E 17°01′56″ | Francesco Nullo Square, Slupsk | Age 700 years old 14th-century archaeological wood [19] |
| (C) | N 50°33′32.9″ E 21°38′56.1″ | Vistula River waterfront, Tarnobrzeg | Age 1800 years old 2nd-century archaeological [15,16] |


Figure 1.
Geographic location of reference sample (A), 14th-century historical sample (B), and 2nd-century sample (C) timber sampling and study site on map and part of old timber lot (historic timber) with sampling locations marked (“*”—location of the research site) [24,25,26,27] (Figure adapted from Ref. [28]).
2.2. Samples Basic Preparation
Samples of antique wood were divided into samples of 20 × 20 mm in cross-section and 300 mm in length, and into separated slices of 20 × 20 mm in cross-section and 5 mm in length, which, after being sanded with a belt grinder of 240 grit, were prepared for microscopic measurements. Organic materials examined in SEM must first be dry. If they are naturally water-free (e.g., wood), direct imaging is possible.
Samples for light microscopy were prepared at three locations on the cross-section of the pile, from the core to the perimeter (core, middle, and perimeter). Thin sections (5 mm) were cut from blocks (120 × 20 mm) in the transverse plane and submitted for imaging [29,30].
2.3. Microscopic Analysis
A Phenom Pro G6 desktop scanning electron microscope (PIK Instruments Ltd., Thermo Fisher Scientific, Waltham, MA, USA) was used for detailed structural analysis. This SEM system is equipped with a color optical camera for quick navigation and was also used for imaging. The wood samples were tested under the vacuum conditions created.
To avoid using a conductive coating, the studies were performed in low-vacuum mode. For basic elemental composition studies, a backscattered electron detector (PIK Instruments Ltd., Waltham, MA, USA) (BSD) was used [31,32,33,34]. Details of the measurement conditions are presented in Table 2. The images and composition analysis were performed using dedicated software (Maps 3 Software, Thermo Fischer, Waltham, MA, USA).
Table 2.
Conditions for the determination of the structure and composition of oak wood.
Based on the BSD measurements, the C/O ratio was obtained as an assessment of the approximate levels of the tested elements in scanned parts of wood samples.
2.4. Color Analysis
The color of the samples was analyzed using a PCE-XXM 30 colorimeter (PCE Instruments, PCE Deutschland GmbH, Meschede, Germany). The color changes were presented in the L*a*b* scale. For the statistical evaluation, the average values of 10 measurements were presented. The results were statistically analyzed using the Kruskal–Wallis test of factors. The level of statistical significance was assumed as α = 0.01.
2.5. Chemical Composition Analysis
The chemical analysis of the samples of oak wood was performed according to the standard methods. This analysis was conducted to quantitative assessment changes of basic wood components (cellulose, lignin, holocellulose, and hemicellulose). The wood samples were then ground and dried (to an approximate moisture content of 8%). The fraction of 0.1–0.4 mm of wood was used for analysis. At first the sample of oak wood was subjected to extraction in a Soxhlet apparatus using ethanol for 6 h. After extraction, the wood material was dried to constant weight at 102 ± 3 °C.
The cellulose content was determined according to the Seifert method [34]. The reaction mixture consisted of 1 g of the wood sample, acetylacetone (6 mL), dioxane (2 mL), and concentrated hydrochloric acid (1.5 mL). The reaction mixture was heated in a boiling water bath under reflux for 30 min. Methanol (40 mL) was then added to the flask containing the mixture, transferred to a G2 glass funnel filter, and filtered using a vacuum pump, rinsing with methanol (60 mL). The precipitate was washed successively with dioxane, hot water, and methanol. The crucible with the precipitate (cellulose) was dried at 102 ± 3 °C until a constant weight was obtained.
The percentage content of lignin was determined according to standard TAPPI [28]. The detailed procedure is described as follows: 15 mL of 72% sulfuric acid (at 10 °C) was added to 1 g of the sample. The wood material was macerated for 2 h. Next the water was added at 3% solution. The solution was boiled for 4 h under a reflux condenser. After heating, the solution was left for 4 h and filtered (decanted) through a previously weighed glass funnel filter (G3). The lignin precipitate was dried to constant weight at 102 ± 3 °C.
The holocellulose was obtained by the TAPPI standard [30,35]. A total of 5 g of the extracted sample, then 150 mL of distilled water at 75 °C, 1.5 g of sodium chlorite, and 10 drops of glacial acetic acid were added. The mixture was heated in a water bath (under a reflux condenser) at 75 °C for 1 h with gentle stirring. The chlorite and acetic acid additions were repeated four times. The mixture was then cooled to 10 °C and filtered on a G1 porosity glass funnel filter. The precipitate was washed with deionized water, followed by 50 mL of acetone. The mixture was dried at 50 °C until constant weight.
Hemicellulose content was calculated by subtracting the cellulose content from the holocellulose content. All chemical analyses were repeated in triplicate for each sample set. The dry mass was used as the basis for the calculation of the percentage content of the main components of wood.
2.6. Analysis of Infrared Spectroscopy (FTIR-ATR)
Fourier transform infrared spectroscopy with attenuated total reflectance (FTIR-ATR) was used as a non-destructive and precise method for historical wood analysis. This method has been applied to assess the structural changes of the cellulose, hemicelluloses, and lignin.
The samples were analyzed using a Nicolet iS5 FTIR spectrometer (Thermo Fisher Scientific, Waltham, MA, USA) with the iD7-ATR attachment.
A fraction of oak wood powder with a particle size of 0.1 mm was used for infrared spectroscopy analysis.
The samples before analysis were air-dried and dried in a desiccator over P2O5.
First, a background spectrum was obtained, followed by a sample spectrum. To ensure reproducibility, the samples were pressed against a diamond crystal using a suitable applicator integrated with the attachment. The obtained spectra were averages of three replicates.
A total of 32 scans were carried out with a 4 cm−1 resolution in the range between 4000 and 400 cm−1.
The analysis of the obtained spectra was performed using Omnic 9 software (Thermo Scientific, Waltham, MA, USA). The spectra were standardized using the baseline correction.
The infrared spectra after corrected of baseline were used for the calculation of the total crystallinity index (TCI, A1372/H2900) [30], hydrogen bond intensity (HBI, A 3400/A 1320) [36], and lateral order index (LOI, A 1429/A 897) [37], where A denotes the intensity of the absorption band.
2.7. Software and Statistics Analysis
The survey results were statistically analyzed for groups using the Kruskal–Wallis test. A level of statistical significance of α = 0.01 was assumed. All calculations were performed using Statistica 13 software (StatSoft, Cracow, Poland).
3. Results and Discussion
3.1. Visual and Microscopic Analysis
During the preparation of the samples for microscopic analysis, we observed that recently cut wood looked lighter in color compared to old wood, which looked darker. We found that the references to oak wood and the historical foundation piles oak wood looked different. Recent wood samples were consistently lighter than old wood samples. Both types of wood showed localized darker areas, particularly near the core in tree rings. There was a gradual shift from earlywood to latewood, and in areas where there was a high proportion of latewood. This darker, denser wood is typical of compression wood, which often develops in oak and other deciduous trees when they are damaged in some way [38,39].
Our findings were confirmed by a color analysis test (see Table 3). This color difference suggests that as wood ages, the amount of lignin in it goes up relative to the amount of hemicellulose and cellulose.
Table 3.
L*, a*, and b* color analysis results.
Research on the coloration of antique oak wood yielded a raw database organized by the wood’s age. After statistical analysis, where the chromaticity parameters were found not to have a normal distribution and thus underwent non-parametric processing, several key findings emerged. The experimental distribution of brightness (L)* displayed a bi-modular character. Maximum values were observed in ranges of 59 to 63 (sample A), 44 to 50 (sample B), and 27 to 31, respectively. This suggests a significant segregation of color brightness based on age.
The experimental distribution of redness (a)* showed an extreme modular character, with maximum values at 8.5 to 9.7, 3.8 to 4.5, and 0.4 to 0.7, respectively. This implies a distinct layering of color as a function of changes in wood structure.
Furthermore, changes in the degree of discoloration were highly characteristic of the wood samples. The distribution of discoloration exhibited a strong asymmetry to the left. This indicates a tendency for the color to migrate through more consistent yellow shades (b)*, ranging from 21 to 23 (sample A) to 15 to 17 (sample C). These ranges are characteristic of high-quality heritage oak wood.
Resch et al. [40,41], who studied oaks from various locations in Germany, Austria, and France, found similar CIELLab values for modern (A) oak veneers: L* = 63.9, a* = 7.6, and b* = 23.7. The color variables L* and a* for the oak samples were bimodal for a distribution of values that were not stratified at the first evaluation, suggesting an effect of heartwood age on sample color. A Kruskal–Wallis test was performed on the results of the three groups (Samples A, B, and C). The differences were significant: H (2, n = 73) = 46.38, p < 0.001.
Color parameters, such as degree of brightness and degree of yellowing, are homogeneously distributed in the community of measurements taken. The coefficient of variation presented lower values than 30%. The variable b* is the only one that shows a high level of variability. Such a finding suggests that the color of oak samples is segregated only by the degree of yellowing. Changes in the degree of yellowing with the age of the sample occurred in the outer sectors. Differences between samples in chromatic parameters were significant. The color was relatively homogeneous within the sample, confirming the change in quality of historic wood.
Detailed studies of the morphology and structure of wood samples were conducted by SEM and are presented in Figure 2. The increase in the proportion of lignin with wood age, compared to cellulose, probably occurs at the expense of the degradation of the amorphous areas of this polysaccharide. Less intense degradation was observed in young wood (juvenile wood), which has a lower cellulose content [6], lower crystallinity [36], and higher microfiber angle [37] than in mature wood. The results show the maturity of the raw material used for historic wood piles. On the images obtained by SEM, a higher proportion of degradation was observed in the cell walls and especially in the central cells of historic wood than in recently cut wood (Figure 2). Changes in the lignin content may influence the color change, which was observed in the tested samples, at it was mentioned before [40]. It should be noted that the images with a cross mark were taken using an inner SEM optical camera (no scale bar added). That helped us to find a region for detailed structural and composition studies. What is more, as presented here, the fast scanning table SEM can be satisfactorily applied for heritage wood analysis without additional processing, such as a coating process for wood materials. This aspect is especially important where heritage samples are studied, and non-destructive analysis techniques should be applied.

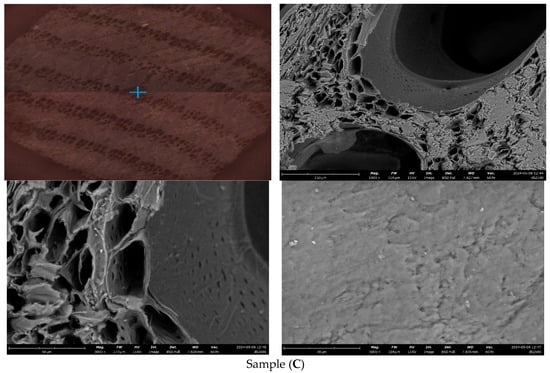
Figure 2.
Microscopic images of fresh reference oak (A), 14th-century (B), and 2nd-century (C) oak wood (“+” measuring point).
For oak piles of historic and modern oak wood samples, (B) and (C) were taken as felling dates, indicating that the piles were deposited during the construction or securing of settlements, which is usually observed at archaeological sites.
Features of oak wood harvested from mixed stands of uneven age showed chemical features indicating the absence of degradation for lignin and cellulose structure. The figure shows the cell walls of debarked wood vessels and the filling of wood fibers.
Working in low-vacuum mode, we conducted a basic C/O analysis based on the backscattered electron detection technique. BSD analysis (presented in Figure 3) showed that oak (A) from the reference wood indicated a higher ratio of weight concentration of carbon to oxygen, 50.600 to 49.400. For historical oak wood (B) from trees felled in the 14th century, BSD indicated a higher ratio of carbon to oxygen weight concentration, 51.600 to 48.400 in scanned areas (Figure 4). The structural wood of oak from trees felled in the second century is shown in Figure 5. Here, the ratio of the weight concentration of carbon and oxygen, 48.400 to 51.600, is indicated. Based on these findings, we performed detailed chemical composition studies.
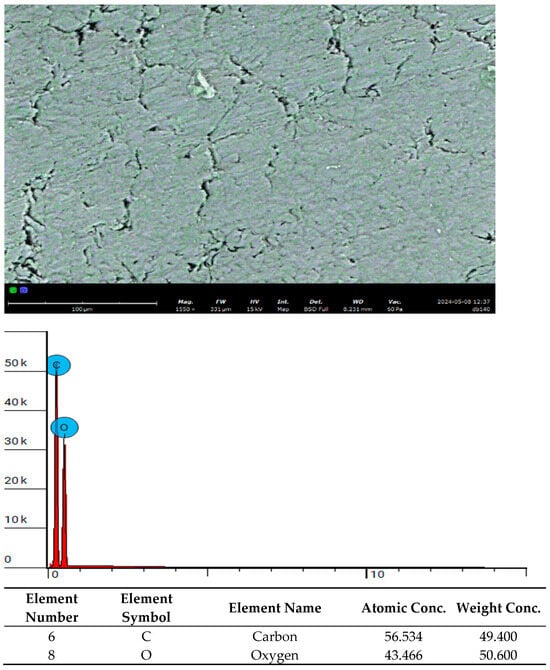
Figure 3.
Image of the cell wall of wood (A): FW: 331 μm; mode: 15 kV-Map; detector: BSD Full; time: 8 May 2024 12:37 p.m.; 668,863 counts in 0:00:31 (21,442 c/s); disabled elements: Pu, Cm. The atomic numbers of carbon C-6 and oxygen O-8 are provided.

Figure 4.
Image of the cell wall of wood (B): FW: 173 μm; mode: 15 kV-Map; detector: BSD Full; time: 8 May 2024 1:01 p.m.; 1,563,707 counts in 0:01:12 (21,565 c/s); disabled elements: Pu, Cm. The atomic numbers of carbon C-6 and oxygen O-8 are provided.
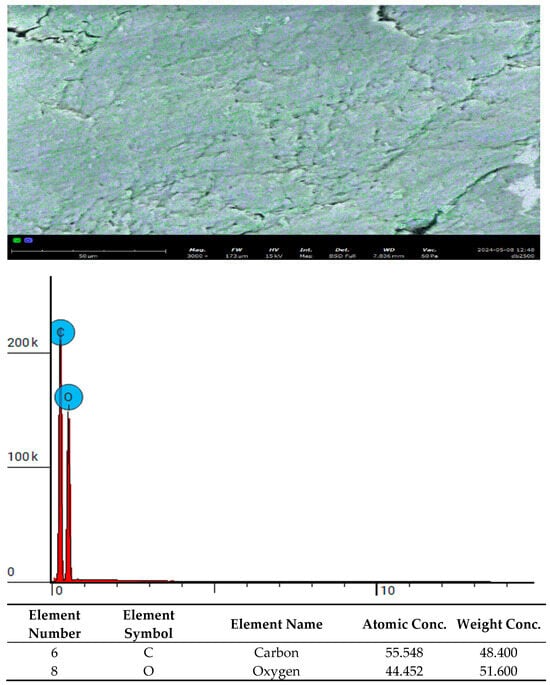
Figure 5.
Image of the cell wall of wood (C): FW: 173 μm; mode: 15 kV-Map; detector: BSD Full; time: 8 May 2024 12:48 p.m.; 2,905,298 counts in 0:02:03 (23,446 c/s); disabled elements: Pu, Cm. The atomic numbers of carbon C-6 and oxygen O-8 are provided.
3.2. Chemical Analysis of Wood Samples
Classical chemical analysis was used to quantify the changes, the main components of wood for both fresh oak samples (A) and wood samples of historic 14th-century (B) structural wood and 2nd-century oak (C). The results obtained are presented in Table 4. Wood used for chemical analyses was not exposed to photodegradation during its useful life. The wood used for these analyses came from the interior of the pile.
Table 4.
Chemical analysis and ratio of holocellulose content to lignin (Ho/L), cellulose to lignin (C/L), and cellulose to hemicellulose (C/H) in reference oak (A), 14th-century oak (B), and 2nd-century oak (C) wood.
The methods used are commonly used analytical methods in forestry. Differences in the total content of the main wood components, compared to others, may result from the use of different methods for both marking and calculating the share of components [8,13,42,43] and the greater susceptibility of archaeological wood compared to contemporary wood.
Based on the results, significant changes were found, especially for holocellulose and hemicellulose. The content of holocellulose in the fresh oak wood (A) was 80%, while for 14th-century archaeological wood (B) it was 70%. In turn a significant decrease in holocellulose to 55.35% was found for a sample of 2nd-century oak (C). The obtained results and decrease in holocellulose content trends for historical wood correlate with the results of other authors. According to Rowell [44], the holocellulose content in historic oak wood is 59–71%. According to Baar [45], the amount of holocellulose in historic wood is about 69–71.5%, and according to the research of Ghavidel et al., historic wood is about 60.75% [46].
High susceptibility to aging was also found for hemicelluloses. A significant decrease of as much as 44% was found in the content of hemicelluloses in archaeological wood (C) compared to the reference sample of oak wood (A). A reduction in hemicellulose content of up to 28.2% was also shown for sample (B). The decrease in the content of hemicelluloses in archaeological wood compared with contemporary wood is also confirmed by studies of other authors [46,47,48]. The high sensitivity of hemicelluloses is also confirmed by other studies on subfossil wood [45].
The results indicate that during the aging of oak wood, cellulose is also subjected to decomposition, but more slowly than hemicelluloses or hollocellulose. The content of cellulose in the historical oak wood (C) decreased by about 18% compared to the reference sample (A).
The changes in carbohydrate components, especially in hemicelluloses, translate into a relatively higher share of lignin in archaeological wood (31.93–38.28%) compared to the fresh wood sample (25.36%). The results of other authors confirm the increase in the content of lignin in historical wood [46,49]. It has been pointed out that the relative increase in lignin content in oak wood from archaeological excavations observed in the study is the result of the degradation of polysaccharide compounds (a decrease in the content of these components). This is due, among other things, to biotic degradation, which, depending on oxygen availability, may be the result of bacterial or fungal action. The action of microorganisms, particularly bacteria, including erosive bacteria, on wood primarily causes the degradation of acetal bonds in polysaccharides, especially hemicelluloses. This results in a reduced proportion of hemicelluloses. These carbohydrates are more susceptible to degradation compared to the lignin polymer.
The observed changes in the content of polysaccharides and lignins depend, among others, on conditions (biotic and abiotic factors, oxygen access) as well as on the aging time [16,47,49,50]. These changes are well illustrated by the calculated ratios between the various components of the wood. They concern the ratio between holocellulose and lignin (Ho/L), cellulose and lignin (C/L), as well as cellulose and hemicellulose (C/H) (Table 3). There was a significant reduction in the H/L and C/L ratios from 3.15 to 1.73, respectively, and for C/L from 1.69 to 1.06. Studies by other authors have also shown a decrease in C/L for archaeological oak wood [11]. The observed changes confirm the decomposition of polysaccharide compounds as a result of wood aging. Significant changes indicated the ratio of cellulose to hemicellulose (C/H). In oak wood samples, this ratio increased with age from 1.16 to 1.66 (Table 3). The obtained results of the increase in the index correlate with others and confirm the lower stability of hemicelluloses in relation to cellulose [13,51,52].
3.3. Infrared Spectroscopy (FTIR) Analysis
An important complement to the quantitative analysis of the chemical composition of wood was the use of infrared spectroscopy (FTIR). This non-destructive method was used to assess changes in the chemical structure, about functional groups of the main components of archaeological wood, compared with reference samples.
FTIR spectra, especially in the “finger print region”, indicated a number of significant changes in the absorbance of bands, originating from individual wood components (cellulose, lignin, or hemicelluloses). The results of the analysis are presented in Figure 6.
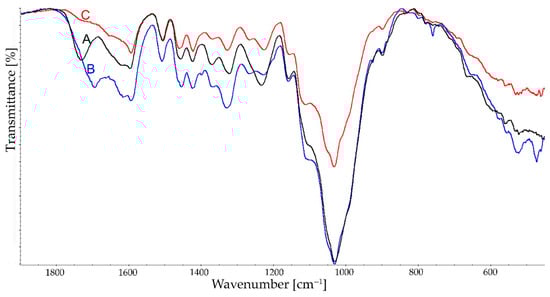
Figure 6.
FTIR spectra in the fingerprint range for fresh reference oak (A), 14th-century oak (B), and 2nd-century oak (C) wood.
Figure 6 shows significant differences in the intensity of the band at 1735 cm−1, which is responsible for the stretching vibrations of carbonyl and acetyl groups (C=O) [53,54,55,56,57].
Changes in this band may indicate hydrolysis of acetyl groups. On the reference spectrum of fresh wood, this band is intense. On the other hand, for sample wood (B), we observe a shift towards lower values and a significant reduction in intensity. On the other hand, for the spectrum of sample C, this band has completely disappeared, which may be related to the degradation of glucuronoxylanes connected to the splitting of the acetyl groups and 4-O-methylglucuronic acid side units [58].
Changes in the wood, such as deformation and vibrations in the C-H and O-H groups at 1370 cm−1, indicate susceptibility to degradation of carbohydrate compounds (cellulose and hemicellulose) [59].
The band at 1424 cm−1, attributed to C-H deformation in lignin and a crystalline region in cellulose [54], increases for samples (B) and (C). This translates partly into changes within the band at 898 cm−1, responsible in part for the C-H deformation vibrations of polysaccharides in amorphous regions and β-1,4-glycosidic bond [35,60]. The slight reduction in intensity for (B) and (C), among other things, may indicate changes in the amorphous areas of cellulose.
Wood samples 14th and 2nd centuries also show a reduction in the intensity of the band at 1158 cm−1, mainly attributed to C-O-C vibrations in cellulose and hemicellulose [61,62,63]. These changes can be attributed to the degradation of the glycosidic bond as a result of wood aging or the action of biotic agents.
A number of changes observed in the comparative spectra of fresh wood (A) and historical woods (B) and (C) are also related to vibrations occurring in aromatic systems.
Visible are changes in the 1590 cm−1 band indicative of aromatic skeletal vibration, typical of syringyl (S) units and carbonyl C=O stretch groups [53,63]. The spectra for sample (C) showed a significant increase in the intensity of this band. Changes for syringyl systems were also evident for the band around 1233 cm−1. And also for the band 1269 cm−1 concerning the vibration of the guaiacyl ring on lignin, C-O linkage in guaiacyl aromatic methoxyl groups [63]. The observed changes in intensity, a shift or absence of the band, confirm the influence of wood aging, and also indicate structural changes in the various systems present in lignin.
In contrast, the intensity of the 1503 cm−1 band responsible for aromatic skeletal vibration [56,64], a typical band found in lignin compared to the reference sample (A), increases.
The changes in the bands presented in the spectra (Figure 6) complement and confirm the results of the quantitative analysis of the chemical composition (Table 3).
For a more complete description of the structural changes, the total crystallinity index (TCI), lateral order index (LOI), and hydrogen bond intensity (HBI) were determined. These indices refer successively to the TCI of the ratio of the band H1372 cm−1 to H2900 cm−1, the LOI of the ratio of the band A1430 cm−1 to A 898 cm−1, and also the HBI determining the ratio A 3400 cm−1 to A 1320 cm−1. The results obtained are presented in Figure 7.

Figure 7.
Infrared crystallinity ratios (LOI and TCI) and hydrogen bond intensity (HBI) of the samples A—reference oak wood, B—14th-century oak wood, and C—2nd-century oak wood. The calculated ratios were averaged across three replicates. The standard deviation for the obtained values of LOI, HBI, and TCI index was below 0.05.
Changes within the crystalline areas of cellulose can affect the tensile properties of the material. In turn, amorphous cellulose, together with hemicelluloses and lignin, influences the viscoelastic properties and determines its compression and hardness.
In our research, an increase in the LOI index and a slight increase in TCI may indicate changes mainly in the amorphous areas of polysaccharides, which are more susceptible to biotic factors. Therefore, this may potentially affect viscoelastic properties. However, the conclusion requires further analysis in the area of the mechanical properties of archaeological material.
In consideration of the results obtained, it is evident that there has been an increase in LOI in comparison with the reference sample. The increase in the LOI index, which is responsible for the degree of order in cellulose, indicates greater availability for the degradation of amorphous regions in cellulose. This hypothesis is confirmed by the TCI index, indicating a slight increase in crystallinity. The HBI (hydrogen bond intensity) index has been shown to decrease, indicating that there have been intramolecular changes in the structures of wood components. The findings from FTIR analysis serve to both complement and corroborate the alterations in chemical composition and microscopic analyses of both contemporary and historic wood as determined in the present study.
The use of infrared spectroscopy (FTIR), classical chemical analyses, and microscopic methods allows for a comprehensive assessment of the level of degradation in archaeological wood. These methods complement each other.
The comprehensive analyses carried out may provide valuable information in the development of conservation methods for the protection of national heritage.
Wooden structures are one of the oldest and most fascinating elements of prehistoric architecture. From the very beginnings of human civilization, wood was a material that not only provided shelter but also enabled the creation of more complex structures. Early human settlements, such as those discovered near Lake Baikal, indicate that wood was already in use 15,000 years ago [65].
Wood, as a building material, was particularly valued in regions where access to stone was limited. An example is Scandinavia, where wooden houses were built from planks and roof decorations emphasized local traditions. Discoveries in Røros reveal that wooden structures were not only functional but also aesthetic, decorated with carvings and painted motifs [66]. Wood and logs were used, which allowed for the creation of coherent and stable structures. In Poland, the oldest known wooden structures date back to earlier periods, and their remains can be found throughout the country [67]. Archaeological fragments documenting the use of wood for building huts have been found there. Moreover, during the Neolithic period, wood began to be combined with other materials, which led to the development of more complex structures. Archaeologists rarely discover artifacts made of wood because, like other organic materials, it tends to decompose quickly. The consistently high water level in the Kalambo Falls contributed to the preservation of the wood. That is why the oldest wooden structure has survived for so long. Similarly, the 2700-year-old Lusatian settlement in Biskupin, located on a lake, has survived to this day. All these examples prove that wood is the oldest building material capable of surviving for thousands of years. However, the greatest threat it cannot resist is biological decay and fire. Wood that has not been treated often gains resistance over time.
Wood as a construction material is our common heritage that must be protected, as stated in the 1964 “Venice Charter” [68]. Where wood is a legacy of the past, the historic works of nations are a testimony to tradition. It is therefore essential that the conservation and restoration of monuments ensure the preservation of culture and native traditions [69].
Choosing the right preservative requires knowledge of both the changes in degraded wood and the phenomena that cause these changes.
Based on the results obtained, we can assume that the degradation of wood could have been caused by biotic and abiotic factors.
According to the authors, the biodegradation of logs in contact with soil occurred largely in anaerobic conditions with the participation of bacteria or in almost anaerobic conditions as a result of the action of soft-rot fungi.
However, when planning excavations and renovations, the effect of oxygen should also be taken into account, and then the choice of method would require adjustment to inhibit the action of fungi, e.g., white rot.
Based on the available literature, it seems that it would be most beneficial to develop multi-component systems to protect artifacts. The particularly sensitive components of wood must be taken into account. The conclusion that hemicelluloses are the most sensitive polysaccharide fraction to degradation in archaeological wood was confirmed [70,71].
However, this requires further research into the use of agents that are chemically stable, weather-resistant, biocompatible with the wood structure, and preferably environmentally friendly.
4. Conclusions
The process of wood aging and degradation, involving oxidation and tannin reactions, has resulted in a reduction in the brightness of the color in the inner part of the 14th-century structural oak wood. This color change is particularly pronounced in the historic wood, dating to the 2nd century. The color differences were significant: H test Kruskal–Wallis = 46.38 (p < 0.001).
Microscopic analysis and chemical analysis of the historical oak wood confirmed an increase in lignin content relative to hemicelluloses and cellulose in juvenile wood. The findings of both chemical composition analysis and FTIR analysis of oak historical wood indicated the occurrence of polysaccharide degradation, a process that may have been initiated by microbial degradation. The alterations in carbohydrate components, particularly in hemicelluloses, result in an elevated proportion of lignin in historical wood (31.93–38.28%) in comparison to the fresh wood sample (25.36%).
We would like to indicate the need for further research into the chemical changes of wood with the period of use under varying conditions. These can affect the physical properties, strength, and biological resistance of historic woods. It should be noted that the limitation of the analysis is that the results of the tests may be subject to errors caused by differences in soil chemical composition and the influence of groundwater on the leaching or introduction of elements into the structure of the oak wood from which the historical construction piles were made.
Author Contributions
Conceptualization, A.J. and M.W.; methodology, M.W. and K.S.; software, M.J.; validation, M.J. and M.W.; formal analysis, M.W.; investigation, A.J. and K.S.; resources, A.J.; data curation, writing—original draft preparation, A.J. and K.S.; writing—review and editing, M.W.; visualization, M.J.; supervision, M.J. and M.W.; project administration, M.W.; funding acquisition, K.S. All authors have read and agreed to the published version of the manuscript.
Funding
The publication of this study was financed by the Polish Minister of Science and Higher Education as part of the Strategy of the Poznan University of Life Sciences for 2024–2026 in the field of improving scientific research and development work in priority research areas.
Institutional Review Board Statement
Not applicable.
Informed Consent Statement
Not applicable.
Data Availability Statement
All data were included in the article.
Acknowledgments
Thanks for cooperation to the Provincial Office for Historic Preservation in Gdansk; and the Provincial Office for Historic Preservation Delegation in Slupsk, Head of Delegation: KRYSTYNA MAZURKIEWICZ-PALACZ.
Conflicts of Interest
The authors declare no conflicts of interest.
References
- Kránitz, K.; Sonderegger, W.; Bues, C.T.; Niemz, P. Effects of aging on wood: A literature review. Wood Sci. Technol. 2016, 50, 7–22. [Google Scholar] [CrossRef]
- Froidevaux, J.; Volkmer, T.; Ganne-Chédeville, C.; Gril, J.; Navi, P. Viscoelastic behaviour of aged and non-aged spruce wood in the radial direction. Wood Mater. Sci. Eng. 2012, 7, 1–12. [Google Scholar] [CrossRef]
- Singh, A.P.; Kim, Y.S.; Chavan, R.R. Advances in Understanding Microbial Deterioration of Buried and Waterlogged Archaeological Woods: A Review. Forests 2022, 13, 394. [Google Scholar] [CrossRef]
- Matsuo, M.; Yokoyama, M.; Umemura, K.; Sugiyama, J.; Kawai, S.; Gril, J.; Kubodera, S.; Mitsutani, T.; Ozaki, H.; Sakamoto, M.; et al. Aging of wood: Analysis of color changes during natural aging and heat treatment. Holzforschung 2011, 65, 361–368. [Google Scholar] [CrossRef]
- Sundqvist, B.; Karlsson, O.; Westermark, U. Determination of formic-acid and acetic acid concentrations formed during hydrothermal treatment of birch wood and its relation to colour, strength and hardness. Wood Sci. Technol. 2006, 40, 549–561. [Google Scholar] [CrossRef]
- Fengel, D.; Wegener, G. Wood Chemistry Ultrastructure Reactions; Walter de Gruyter: Berlin, Germany, 1989. [Google Scholar]
- Kranitz, K. Effect of Natural Aging on Wood. Ph.D. Thesis, ETH Zurich, Zürich, Switzerland, 2014. [Google Scholar]
- Tamburini, D.; Lucejko, J.J.; Pizzzo, B.; Mohammed, M.Y.; Sloggett, R.; Colombini, M.P. A critical evaluation of the degradation state of dry arcgeological wood from Egypt by SEM, ATR-FTIR, wet chemical analysis and Py(HMDS)-GC-MS. Polym. Degrad. Stab. 2017, 146, 140–154. [Google Scholar] [CrossRef]
- Ganne-Chédeville, C.; Jääskeläinen, A.S.; Froidevaux, J.; Hughes, M.; Navi, P. Natural and artificial ageing of spruce wood as observed by FTIR-ATR and UVRR spectroscopy. Holzforschung 2012, 66, 163–170. [Google Scholar] [CrossRef]
- Hudson-McAulay, K.J. The Structural and Mechanical Integrity of Historic Wood. Ph.D. Thesis, University of Glasgow, Glasgow, UK, 2016. Available online: http://theses.gla.ac.uk/7529/ (accessed on 2 May 2025).
- Inagaki, T.; Yonenobu, H.; Tsuchikawa, S. Near-Infrared Spectroscopic Monitoring of the Water Adsorption/Desorption Process in Modern and Archaeological Wood. Appl. Spectrosc. 2009, 62, 860–865. Available online: https://opg.optica.org/as/abstract.cfm?URI=as-62-8-860 (accessed on 2 May 2025). [CrossRef]
- Gawron, J.; Szczesna, M.; Zielenkiewicz, T.; Gołofit, T. Cellulose crystallinity index examination in oak wood originated from antique woodwork. Drewno 2012, 188, 109–114. Available online: https://yadda.icm.edu.pl/baztech/element/bwmeta1.element.baztech-article-BATA-0019-0009/c/Gawron_vol_55_nr_188_2012.pdf (accessed on 2 May 2025).
- Kacík, F.; Šmíra, P.; Kacíková, D.; Reinprecht, L.; Nasswettrová, A. Chemical Changes in Fir Wood from Old Buildings due to Ageing. Cellul. Chem. Technol. 2014, 48, 79–88. Available online: https://www.academia.edu/download/41720437/Chemical_Changes_In_Fir_Wood_From_Old_Bu20160129-5463-mu6j62.pdf (accessed on 20 July 2025).
- Canevari, C.; Delorenzi, M.; Invernizzi, C. Chemical characterization of wood samples colored with iron inks: Insights into the ancient techniques of wood coloring. Wood Sci. Technol. 2016, 50, 1057–1070. [Google Scholar] [CrossRef]
- Bessa, F.; Sousa, V.; Quilhó, T.; Pereira, H. Diversity of wood colour in tropical timber species and its relationship with wood density and anatomical features. IAWA J. 2023, 45, 335–357. [Google Scholar] [CrossRef]
- Straže, A.; Dremelj, M.; Žveplan, E.; Čufar, K. Spremembe fizikalnih lastnosti hrastovega lesa iz zgodovinskih konstrukcij vživljenjski dobi: Changes in physical properties of oak wood from historical constructions during service life. Les/Wood 2018, 67, 5–14. [Google Scholar] [CrossRef]
- Kojiro, K.; Furuta, Y.; Ohkoshi, M.; Ishimaru, Y.; Yokoyama, M.; Sugiyama, J.; Kawai, S.; Mitsutani, T.; Ozaki, H.; Sakamoto, M.; et al. Changes in micropores in dry wood with elapsed time in the environment. J. Wood Sci. 2008, 54, 515–519. [Google Scholar] [CrossRef]
- Borgin, K.; Faix, O.; Schweers, W. The effect of aging on lignins of wood. Wood Sci. Technol. 1975, 9, 207–211. [Google Scholar] [CrossRef]
- Buraczynski, J.; Wojtanowicz, J. Development of the Vistula and San valleys in the Quaternary in the northern part of the Sandomierz Plain. Ann. Univ. M Curie-Skłodowskiej Sectio R 1966, 21, 143–177. [Google Scholar]
- Mycielska-Dowgiałło, E. Development of the middle Vistula valley in the Holocene in the light of studies of the Tarnobrzeg area. Przegl. Geograficzny 1972, 44, 1. [Google Scholar]
- Jonczak, J.; Olszak, I.; Lazarczyk, A.; Jonczak, J.; Florek, W. Genesis, evolution and properties of soils of the lower Slupia floodplain terraces in the southern part of Slupsk. In Soil-Forming Environment and Soils of River Valleys; Bogucki Scientific Publishing House: Poznań, Poland; Słupsk, Poland, 2013; pp. 33–40. [Google Scholar]
- Cufar, K.; Bizjak, M.; Kuzman, M.K.; Merela, M.; Grabner, M.; Brus, R. Castle Pišece, Slovenia—Building history and wood economy revealed by dendrochronology, dendroprovenancing and historical sources. Dendrochronologia 2014, 32, 357–363. [Google Scholar] [CrossRef]
- Borkowski, J.; Krzysiak, A. Aarchaeological rescue research in the nature of supervision of the demolition of buildings and construction of water supply connections, and excavation—probing research in advance of the investment of the area entered in the register of monuments of Pomorskie voivodeship in Slupsk, 3 and 4 Francesco Nullo Street, parcels No. 724/4 and 724/12, area 6 Slupsk. Report with the development, Voivodeship Office for the Protection of Monuments, Słupsk branch, Lębork, Poland, 2020.
- Zielony, R.; Kliczkowska, A. Regionalizacja Przyrodniczo-Leśna Polski 2010; CILP: Warsaw, Poland, 2012. [Google Scholar]
- Kondracki, J. Geografia Regionalna Polski; Wydawnictwo Naukowe PWN: Warsaw, Poland, 2001. [Google Scholar]
- Kliczkowska, A.; Zielony, R.; Czepińska_kamińska, D.; Kowalkowski, A.; Sikorska, E.; Krzyżanowski, A.; Cieśla, A.; Czerepko, J. (Eds.) Habitat basics of silviculture. In Appendix to the Principles of Silviculture; ORW LP in Bedonie: Warsaw, Poland, 2004. [Google Scholar]
- Marks, L.; Ber, A.; Gogołek, W.; Piotrowska, K. (Eds.) Mapa Geologiczna Polski 1:500 000; Min. Środ., PIG: Warsaw, Poland, 2006. [Google Scholar]
- Mapa Polski Rzeki. 2008. Available online: http://www.rzekipolski.info/mapa-polski-rzeki.html (accessed on 20 August 2025).
- TAPPI T222 om-06; Acid-Insoluble Lignin in Wood and Pulp. Standards Technical Association of the Pulp and Paper Industry (TAPPI): Atlanta, GA, USA, 2006.
- TAPPI T9 wd-75; Holocellulose in Wood. Standards Technical Association of the Pulp and Paper Industry (TAPPI): Atlanta, GA, USA, 2006.
- Čufar, K.; Eržen, T.D.; Krže, L.; Merela, M. Dendrochronological study of painted chests from the collection of the Gorenjska museum in Kran. Les/Wood 2020, 69, 33–45. [Google Scholar] [CrossRef]
- Čufar, K.; Demšar, B.; Beuting, M.; Balzano, A.; Škrk, N.; Krže, L.; Merela, M. Dendrochronological Dating and Provenancing of String Instruments. J. Vis. Exp. 2022, 188, e64591. [Google Scholar] [CrossRef]
- Longo, S.; Egizi, F.; Stagno, V.; Di Trani, M.G.; Marchelletta, G.; Gili, T.; Fazio, E.; Favero, G.; Capuani, S. A Multi-Parametric Investigation on Waterlogged Wood Using a Magnetic Resonance Imaging Clinical Scanner. Forests 2023, 14, 276. [Google Scholar] [CrossRef]
- Seifert, K. Zur Frage der Cellulose-Schnellbestimmung nach der Acetylaceton-Methode. Das. Pap. 1960, 14, 104–106. [Google Scholar]
- Nelson, M.L.; O’Connor, R.T. Relation of certain infrared bands to cellulose crystallinity and crystal lattice type. Part I. Spectra of types I, II, III and amorphous cellulose. J. Appl. Polym. Sci. 1964, 8, 1311–1324. [Google Scholar] [CrossRef]
- Oh, S.Y.; Yoo, D.; Shin, Y.; Seo, G. FTIR analysis of cellulose treated with sodium hydroxide and carbon dioxide. Carbohydr. Res. 2005, 340, 417–428. [Google Scholar] [CrossRef]
- Carrillo, F.; Colom, X.; Sunñoll, J.J.; Saurina, J. Structural FTIR analysis and the thermal characterization of lyocell and viscose-type fibers. Eur. Polym. J. 2004, 40, 2229–2234. [Google Scholar] [CrossRef]
- Musat, E.C.; Salca, E.A.; Dinulica, F.; Ciobanu VDl Dumitrascu, A.E. Evaluation of color variability of oak veneers for sorting. BioResources 2016, 11, 573–584. [Google Scholar] [CrossRef]
- Resch, H.; Hansmann, C.; Pokorny, M. The color of wood from white oak. Forschung-Entwicklung 2000, 1, 13–15. [Google Scholar]
- Kùdela, J.; Ihrackỳ, P.; Kačik, F. Discoloration and Surface Changes in Spruce Wood after Accelerated Aging. Polymers 2024, 16, 1191. [Google Scholar] [CrossRef] [PubMed]
- Sandoval-Torres, S. Colour alteration and chemistry changes in oak wood (Quercus pedunculata Ehrh) during plain vacuum drying. Wood Sci. Technol. 2010, 46, 177–191. [Google Scholar] [CrossRef]
- Xu, L.; Yang, W.; Liu, M.; Wang, Z.; Liu, X. Wood Species Identification and Property Evaluation of Archaeological Wood Excavated from J1 at Shenduntou Site, Fanchang, Anhui, China. Forests 2025, 16, 1173. [Google Scholar] [CrossRef]
- Ghavidel, A.; Gelbrich, J.; Kuqo, A.; Vasilache, V.; Sandu, I. Investigation of Archeological European White Elm (Ulmus Laevis) for Identifying and Characterizing the Kind of Biological Degradation. Heritage 2020, 3, 1083–1093. [Google Scholar] [CrossRef]
- Rowell, R.M. Handbook of Wood Chemistry and Wood Composites; CRS Press: Boca Raton, FL, USA, 2012. [Google Scholar]
- Baar, J.; Paschová, Z.; Hofmann, T.; Kolář, T.; Koch, G.; Saake, B. Rademacher P Natural durability of subfossil oak: Wood chemical composition changes through the ages. Holzforschung 2020, 74, 47–59. [Google Scholar] [CrossRef]
- Ghavidel, A.; Hofmann, T.; Bak, M.; Sandu, I.; Vasilache, V. Comparative archaeometric characterization of recent and historical oak (Quercus spp.) wood. Wood Sci. Technol. 2020, 54, 1121–1137. [Google Scholar] [CrossRef]
- Zhao, C.; Zhang, X.; Liu, Y.; Zheng, W.; Song, P. Probing chemical changes in holocellulose and lignin of Timbers in Ancient Buildigs. Polymers 2019, 11, 809. [Google Scholar] [CrossRef]
- Babiński, L.; Fabisiak, E.; Zborowska, M.; Michalska, D.; Prądzyński, W. Changes in oak wood buried in waterlogged peat: Shrinkage as a complementary indicator of the wood degradation rate. Eur. J. Wood Wood Prod. 2019, 77, 691–703. [Google Scholar] [CrossRef]
- Ghavidel, A.; Hosseinpourpia, R.; Gelbrich, J.; Bak, M.; Sandu, I. Microstructural and Chemical Characteristics of Archaeological White Elm (Ulmus laevis P.) and Poplar (Populus spp.). Appl. Sci. 2021, 11, 10271. [Google Scholar] [CrossRef]
- Waliszewska, B.; Zborowska, M.; Prądzyński, W.; Babiński, L.; Kudela, J. Characterization of 2700-year old wood from Biskupin. Wood Res. 2007, 52, 11–22. Available online: https://www.woodresearch.sk/wr/200702/02.pdf (accessed on 20 July 2025).
- Zachar, M.; Čabalova, I.; Kačiková, D.; Jurczyková, T. Effect of Natural Aging on Oak Wood Fire resistance. Polymers 2021, 13, 2059. [Google Scholar] [CrossRef]
- Chen, C.; Ferrari, M.; Angiuli, J.; Yao, C.; Raspi, E.; Bramanti, E. Qualitative and quantitrative analysis of wood samples by Fourier transform infrared spectroscopy and multivariate analysis. Carbohydr. Polym. 2010, 82, 772–778. [Google Scholar] [CrossRef]
- Pandey, K.K.; Pitman, A.J. FTIR studies of the changes in wood chemistry following decay by brown-rot and white-rot fungi. Int. Biodeterior. Biodegrad. 2003, 52, 151–160. [Google Scholar] [CrossRef]
- Yang, Y.; Sun, H.; Li, B.; Wang, A.; Zhao, R.; Wang, W.; He, Y.; Yang, S.; Han, Y.; Sun, W. Fourier-Transform Infrared Spectroscopy Analysis of the Changes in Chemical Composition of Wooden Components in the Ancient Building of Xichuan Guild Hall. For. Prod. J. 2020, 70, 448–452. [Google Scholar] [CrossRef]
- Pandey, K.K.; Nagveni, H.C. Rapid characterization of brown and white rot degraded chir pine and rubber wood by FTIR soectroscopy. Eur. J. Wood Wood Prod. 2007, 65, 477–481. [Google Scholar] [CrossRef]
- Han, L.; Tian, X.; Keplinger, T.; Zhou, H.; Li, R.; Svedstrӧm, K.; Burgert, I.; Yin, Y.; Guo, J. Even Visually Intact Cell Walls in Waterlogged Archaeological Wood are Chemically Deteriorated and Mechanically Fragile: A Case of a 170 Year-Old Shipwrek. Molecules 2020, 25, 1113. [Google Scholar] [CrossRef]
- Solár, R.; Kurjatko, M.; Manon, B.; Košiková, E.; Neuschlová, E.; Výbohová; Hudec, J. Selected properties of beech wood degraded by brown-rot fungus Coniophora puteana. Drv. Ind. 2007, 58, 3–11. [Google Scholar]
- Ghavidel, A.; Bak, M.; Hofmann, T.; Vasilache, V.; Sandu, I. Evaluation of some wood-water relations and chemometric characteristics of recent oak and archaeological oak wood (Quercus robur) with archaeometric value. J. Cult. Herit. 2021, 51, 21–28. [Google Scholar] [CrossRef]
- Poletto, M.; Zattera, A.J.; Santana, R.M.C. Structural Differences between Wood Species: Evidence from Chemical Composition FTIR Spectroscopy and Thermogravimetric Analysis. J. Appl. Polym. Sci. 2012, 126, 337–344. [Google Scholar] [CrossRef]
- Popescu, M.; Zattera, A.J.; Santana, R.M.C. Degradation of lime wood painting supports II. Cellul. Chem. Technol. 2006, 40, 649–658. [Google Scholar]
- Gupta, B.S.; Jelle, B.P.; Gao, T. Wood façade materials ageing analysis by FTIR spectroscopy. Constr. Mater. 2015, 168, 219–231. [Google Scholar] [CrossRef]
- Faix, O. Clasification of lignins from different botanical origins by FTIR Spectroscopy. Holzforschung 1991, 45, 21–78. [Google Scholar] [CrossRef]
- Pandey, K.K. A Study of Chemical Structure of Soft and Hardwood and wood polymers by FTIR spectroscopy. J. Appl. Polym. Sci. 1999, 71, 1969–1975. [Google Scholar] [CrossRef]
- Traoré, M.; Kaal, J.; Cortizas, A.M. Application of FTIR spectroscopy to the characterization of archeological wood. Spectrochim. Acta Part A Mol. Biomol. Spectrosc. 2016, 153, 63–70. [Google Scholar] [CrossRef]
- Krivonogov, S.K.; Takahara, H.; Kuzmin, Y.V.; A Orlova, L.; Jull, A.J.T.; Nakamura, T.; Miyoshi, N.; Kawamuro, K.; Bezrukova, E.V. Radiocarbon chronology of the Late Pleistocene–Holocene paleogeographic events in Lake Baikal region (Siberia). Radiocarbon 2004, 46, 745–754. Available online: https://journals.uair.arizona.edu/index.php/radiocarbon/article/viewFile/4207/3632 (accessed on 20 July 2025). [CrossRef][Green Version]
- Kuśnierz-Krupa, D.; Kuśnierz, K. Cultural landscape of Røros–inscribed in the UNESCO World Heritage List. Teka Kom. Urban. I Archit. Oddziału Pol. Akad. Nauk. W Krakowie 2018, 46, 649–660. Available online: https://journals.pan.pl/Content/130385/PDF/Teka-2018-43.pdf (accessed on 20 July 2025).[Green Version]
- Plit, J.; Pawlicki, R.W. An outline of climate changes from the early Middle Ages until today. In Forest Cover Changes And Landscape Sustainability–A Retrospective Study In Cultural Borderland; IGiPZ PAN: Warsaw, Poland, 2020; p. 246. [Google Scholar] [CrossRef]
- Cefai, S. Venice Charter and the Development of Authenticity. Ochrona Dziedzictwa Kulturowego 2024, 2, 77–101. [Google Scholar] [CrossRef]
- UNESCO. Convention on the protection of the underwater cultural heritage. In Proceedings of the General Conference of the United Nations Educational, Proceedings of the Scientific and Cultural Organisation 31st Session, Paris, France, 5 October–3 November 2001.
- Broda, M.; Hill, C.A.S. Conservation of Waterlogged Wood—Past, Present and Future Perspectives. Forests 2021, 12, 1193. [Google Scholar] [CrossRef]
- Lucejko, J.J.; Tamburini, D.; Zborowska, M.; Babiński, L.; Modugno, F.; Colombini, M.P. Oak wood degradation processes induced by the burial environment in the archaeological site of Biskupin (Poland). Herit. Sci. 2020, 8, 44. [Google Scholar] [CrossRef]
Disclaimer/Publisher’s Note: The statements, opinions and data contained in all publications are solely those of the individual author(s) and contributor(s) and not of MDPI and/or the editor(s). MDPI and/or the editor(s) disclaim responsibility for any injury to people or property resulting from any ideas, methods, instructions or products referred to in the content. |
© 2025 by the authors. Licensee MDPI, Basel, Switzerland. This article is an open access article distributed under the terms and conditions of the Creative Commons Attribution (CC BY) license (https://creativecommons.org/licenses/by/4.0/).