Article

Analysis of the Impact of Multi-Angle Polarization Bidirectional Reflectance Distribution Function Angle Errors on Polarimetric Parameter Fusion

1
College of Physics, Changchun University of Science and Technology, Changchun 130022, China
2
School of Computer, Guangdong University of Science and Technology, Dongguan 523668, China
*
Authors to whom correspondence should be addressed.
Appl. Sci. 2025, 15(17), 9313; https://doi.org/10.3390/app15179313
Submission received: 11 July 2025 / Revised: 22 August 2025 / Accepted: 22 August 2025 / Published: 25 August 2025

Abstract

This study developed an inertial measurement unit (IMU)-enhanced bidirectional reflectance distribution function (BRDF) imaging system to address angular errors in multi-angle polarimetric measurements. The system integrates IMU-based closed-loop feedback, motorized motion, and image calibration, achieving zenith angle error reduction of up to 1.2° and angular control precision of approximately 0.05°. With a modular and lightweight structure, it supports rapid deployment in field scenarios, while the 2000 mm rail span enables detection of large-scale targets and three-dimensional reconstruction beyond the capability of conventional tabletop devices. Experimental evaluations on six representative materials show that compared with mark-based reference angles, IMU feedback consistently improves polarimetric accuracy. Specifically, the degree of linear polarization (DoLP) mean deviations are reduced by about 5–12%, while standard deviation fluctuations are suppressed by 20–40%, enhancing measurement repeatability. For the angle of polarization (AoP), IMU feedback decreases mean errors by 10–45% and lowers standard deviations by 10–37%, ensuring greater spatial phase continuity even under high-reflection conditions. These results confirm that the proposed system not only eliminates systematic angular errors but also achieves robust stability in global measurements, providing a reliable technical foundation for material characterization, machine vision, and volumetric reconstruction.

1. Introduction

The bidirectional reflectance distribution function (BRDF) quantitatively describes the directional reflectance properties of opaque surfaces. Since most natural surfaces are neither perfectly smooth nor fully rough, their reflection behavior cannot be accurately modeled by purely specular or diffuse reflection. To address this, Nicodemus (1965) proposed the BRDF concept, integrating both components to fully characterize the angular scattering of surfaces [1]. By establishing a complete mapping between incident and reflected directions, the BRDF provides a theoretical foundation for analyzing optical anisotropy, surface microstructure, and scattering characteristics [2], and has been widely applied in remote sensing [3,4], computer vision [5,6], material optics [7,8], and biomedical imaging [9,10].
Advances in BRDF instrumentation have focused on improving angular resolution and radiometric accuracy. Existing systems are generally categorized into (1) traditional mechanical scanning devices and (2) fast measurement systems employing specially shaped mirrors to replace mechanical scanning. Both can be configured with various light sources and detectors to achieve quantitative characterization of surface scattering.
Early representative work includes traditional mechanical scanning devices, such as the static single-point BRDF measurement system proposed by Torrance, K. E., and Sparrow, E. M. [11]. This setup consists of a light source, a sample, two concave mirrors, a polarizer, a monochromator, and a fixed detector. By controlling the single-axis planar rotation of the light source and sample via rotation mechanisms, it can measure two-dimensional polarized BRDF data over a range of incident and reflection zenith angles, which is used to investigate the effects of incident direction and surface roughness on the scattering properties of ceramics and frosted glass. Subsequently, Miettinen, J., et al. [12] employed a He–Ne laser as the light source and combined a chopper with a lock-in amplifier to suppress ambient light, using a silicon detector to receive scattered signals, while a rotation stage enabled angular scanning.
With the increasing demand for higher accuracy and multidimensional measurements, traditional mechanical BRDF systems were further explored. Höpe, A., [13] constructed a BRDF system based on a five-axis robotic arm using a tungsten lamp with a wavelength range of 250–1700 nm. The robotic arm enabled two-dimensional sample rotation, the light source could move along a guide rail, and the system was equipped with a photometric camera and a linear CCD spectrometer, allowing three-dimensional BRDF measurements in both spectral and imaging domains. In recent years, traditional mechanical BRDF systems have been further developed and widely applied. For example, Doctor et al. [14] designed a large-scale GOPHER system deployable in beach environments for studying the spectral reflectance properties of sandy materials. Huang et al. [15], based on a gonioreflectometer, combined a xenon lamp source with a mechanical rotation system to perform reflectance measurements over the hemispherical space. Margall, F., et al. [16] proposed a motorized hyperspectral BRDF platform using a supercontinuum laser to enable in-plane and out-of-plane measurements in the visible–near-infrared range. Li et al. [17], targeting high-precision near-infrared measurements, constructed a coordinate system using a PbS detector and a six-axis robotic arm, and proposed a single-shot absolute measurement scheme, effectively improving both system accuracy and measurement efficiency.
Compared to the long-developed traditional BRDF measurement systems, fast measurement systems emerged relatively late, but have achieved significant progress in recent years. In 2001, Dana, K. J. [18] designed a BRDF measurement system based on a concave parabolic mirror, mainly composed of a beam splitter, the concave parabolic mirror, and a CCD camera. By controlling the light source and observation directions with the beam splitter, the hemispherical illumination scanning problem was simplified into a two-dimensional translation, enabling rapid measurement of the spatially varying BRDF. Ren et al. [19] also proposed a fast BRDF measurement device based on a hemi-parabolic mirror. This approach maps the angular distribution of surface reflectance in 3D space onto a 2D planar image captured by a CCD camera, followed by coordinate transformation, which not only improves measurement efficiency but also avoids the complexity of rotational mechanisms. Ben-Ezra, M., et al. [20] constructed a BRDF measurement device based on a hemispherical metal shell, using light-emitting diodes (LEDs) simultaneously as light sources and detectors. The shell surface is evenly perforated with multiple small holes, each containing an LED. In the experiment, only one LED is lit as the light source at a time, while the others receive reflected light, and this process is repeated until all LEDs are traversed. Although the detection angles of this device are limited by fixed hole positions, its measurement efficiency is extremely high. To meet the demands of field-based remote sensing, researchers have also developed various BRDF measurement approaches suitable for outdoor environments. Unlike laboratory systems, which benefit from fixed structures and controlled conditions, field measurements must contend with complex and variable lighting, unpredictable weather, and large-scale, heterogeneous terrains. To overcome these challenges, Cao, Kim M., and D. Latini proposed rapid BRDF measurement methods based on unmanned aerial vehicle (UAV) platforms [21,22,23]. These approaches leverage the high maneuverability and flexible attitude control of UAVs to precisely adjust the vehicle’s heading, flight altitude, and the pitch angle of the detector, enabling multi-angular reflectance acquisition of diverse targets such as vegetation, bare soil, and buildings.
Beyond remote sensing, BRDF has also demonstrated significant potential in microscopic imaging combined with polarization optics. Because BRDF can precisely characterize light–matter interactions under different incident and reflection angles, integrating it into polarized microscopy provides new insights for analyzing optical anisotropy at the submicron scale. For example, Nirmal Mazumder et al. [24], Tikhon Reztsov et al. [25], and Anastasia Bozhok et al. [26] exploited the combination of polarization control and multi-angular data acquisition in Second Harmonic (SH) Microscopy, Polarization-Sensitive Digital Holographic Imaging (PS-DHI), Fourier Ptychographic Microscopy, and Mueller Matrix Microscopy, respectively. These approaches not only significantly enhance spatial resolution but also improve the quantitative characterization of polarization state variations.
Despite advances in system architecture and optical detection, existing BRDF measurement devices still face limitations in structural deployment, angular control accuracy, and imaging consistency.
Bulky structures and difficult deployment: Large-scale and multi-degree-of-freedom mechanical platforms are typically heavy and voluminous, making field deployment challenging. Examples include the GOPHER system for sandy environments [14], five-axis robotic arm platforms [13], and hyperspectral motorized measurement stages [16]. Conventional gonioreflectometers and benchtop systems are usually confined to laboratory settings, requiring stringent site and alignment conditions, which limits their rapid deployment and mobility [11,12,15,17].
Angular control accuracy depends on mechanical structures: Systems relying on rotation stages or robotic arms are directly affected by geometric precision and backlash compensation, and they are prone to cumulative mechanical errors and axis eccentricities [11,12,15,17]. Robotic arm-based systems also require precise kinematic calibration and synchronized control; otherwise, angular errors can be significantly amplified [13].
Difficulty in maintaining imaging consistency: During multi-angle scanning, the optical axis, focal length, spot overlap, and illumination stability in rapid measurement setups are prone to fluctuation with changes in detector pose, resulting in decreased image brightness and geometric consistency [12,14,15]. Curved-mirror fast-scanning approaches are highly sensitive to optical calibration and coordinate inversion; calibration drift and assembly errors can limit angular precision and intensity consistency [18,19]. Although LED-based hemispherical arrays achieve high acquisition speed, angular sampling is fixed and density is constrained by the array structure [20].
These limitations directly affect the modeling and accurate measurement of complex material spatial reflectance, significantly restricting the generality and scalability of BRDF measurement technologies in studying complex surface scattering.
To address the aforementioned limitations, this study develops a rotational measurement system suitable for large-scale samples based on the design principles of traditional BRDF systems. We propose an imaging-based BRDF measurement method with the following core design:
Firstly, the BRDF device adopts a modular and detachable design, facilitating transportation and on-site deployment, thus overcoming the need for additional trailers required by large-scale BRDF systems (e.g., [15]). Secondly, compared with conventional mechanically driven BRDF measurement setups, the proposed system significantly simplifies the mechanical structure, eliminating the need for robotic arms (e.g., [13,17]) and minimizing the use of gears and bearings, which substantially reduces system complexity and overall weight. To compensate for potential precision loss due to this structural simplification and lightweight design, this study introduces an inertial measurement unit (IMU) sensor into the BRDF measurement system for the first time. By acquiring the spatial position of the camera from IMU data, the exact position of the BRDF device can be derived, guiding the system to the designated measurement points. Importantly, IMU measurements are independent of the mechanical accuracy of the BRDF device, effectively mitigating errors caused by its simplified and lightweight design.
Overall, the system demonstrates clear advantages in deployability, mechanical simplification, lightweight design, and precision assurance, and exhibits the following innovative features:
Modular and lightweight structural design: The BRDF system features a detachable rail structure that allows flexible indoor and outdoor deployment. The simplified, lightweight design reduces mechanical complexity while maintaining a high-precision measurement capability.
IMU-based closed-loop control: A three-axis inertial measurement unit (IMU) provides real-time feedback on the detector’s azimuth and zenith angles, compensating for errors caused by the simplified mechanical structure and ensuring precise positioning.
Imaging-based geometric correction: A checkerboard calibration method is employed to correct camera pose and image distortions, enhancing imaging consistency and overall measurement accuracy.
The remaining structure of this paper is as follows: Section 2 discusses the principles of BRDF measurement and the polarization BRDF model based on microfacet theory. Section 3 presents the BRDF imaging detection system with IMU-based attitude feedback control. Section 4 systematically conducts imaging accuracy experiments, including the evaluation of IMU performance in reducing detector angular errors and the application of checkerboard calibration for image correction. Section 5 reports polarization imaging experiments, assessing the spatial distributions of the degree of linear polarization (DoLP) and angle of polarization (AoP) for several materials under different spatial detection angles. The results demonstrate that the BRDF measurement system developed in this study can achieve high measurement accuracy, while maintaining the advantages of easy mobility and deployment and a relatively simplified mechanical structure, through the integration of IMU sensors and image calibration methods.

2. BRDF Measurement Principle

2.1. Definition of BRDF

The bidirectional reflectance distribution function (BRDF) represents the fundamental optical property of surface reflection, describing the distribution of reflected energy in the upper hemisphere when an incident light wave from a specific direction interacts with a surface. Equation (1) quantifies the BRDF by defining the radiance scattered from an arbitrary point on the surface in all directions within the hemispherical space under a given incident illumination [27]:
f r θ i , θ r , φ i , φ r = d L r θ r , φ r d E i θ i , φ i
Here, fr denotes the BRDF value in units of sr−1, Lr represents the reflected radiance of light scattered from the surface in units of W/(m2·sr), and Ei is the incident irradiance in units of W/m2. Due to the anisotropic nature of light scattering by surfaces, the bidirectional reflectance distribution function is defined as a function of the incident zenith angle θi, observation zenith angle θr, incident azimuthal angle φi, and observation azimuthal angle φr. The BRDF comprehensively characterizes the reflection behavior of material surfaces under varying illumination and viewing directions, serving as the fundamental basis for applications such as lighting computation, material simulation, and surface recognition. The schematic representation of the BRDF is illustrated in Figure 1a.

2.2. BRDF Model

Researchers have conducted extensive studies to accurately characterize the spatial scattering properties of target objects, proposing various models to describe BRDF scattering characteristics. Based on their modeling principles, these models can be classified into geometric–optical models, physical models, empirical models, and semi-empirical models. Representative classical models include the Torrance–Sparrow model [28], Cook–Torrance model [29], Davies model [30], Beckmann model [31], Phong model [32], Beard–Maxwell model [33], Three-component model [34], Minnaert model [35], and multi-parameter models [36]. In practical applications, model selection or adaptation should be based on prior knowledge of target properties and surface characteristics (e.g., metallic/non-metallic, rough/smooth) to enhance fitting accuracy and physical consistency.
This study employs the classical Torrance–Sparrow (T-S) geometric–optical model as the foundation for BRDF modeling. The T-S model postulates that material surfaces consist of microscopic mirror-like facets, as depicted in Figure 1b. Each microfacet possesses a distinct surface normal, denoted as n . Figure 1c illustrates that macroscopic observations of the same material at varying viewing azimuth angles typically yield different results.
f r θ i , θ r , φ i , φ r = D h F θ i G θ i , θ r 4 cos θ i cos θ r
Here, D(h) denotes the microfacet normal distribution function, F(θi) represents the Fresnel reflection coefficient, and G(θi,θr) is the geometric attenuation factor accounting for mutual shadowing and masking effects between microfacets.
When extending the T-S model to incorporate polarization characteristics, the reflection properties of a target must consider both parallel (p) and perpendicular (s) polarization components. The corresponding Fresnel reflection coefficients are given by the following equations:
R s θ = n i cos θ n t 1 n i n t sin θ 2 n i cos θ + n t 1 n i n t sin θ 2 2
R p θ = n t cos θ n i 1 n i n t sin θ 2 n t cos θ + n i 1 n i n t sin θ 2 2
Here, ni and nt denote the refractive indices of the incident and transmitting media, respectively. By incorporating polarization information into the T-S model, we formulate the BRDF in terms of polarization components:
f r p = D h R p θ h G 4 cos θ i cos θ r
f r s = D h R s θ h G 4 cos θ i cos θ r
Consequently, the degree of polarization (DoP) of reflected light can be derived as
D o P = f r p f r s f r p + f r s
Stokes introduced a four-element column vector to characterize the intensity and polarization state of light waves, referred to as the Stokes vector [37]. Each parameter in the Stokes vector represents a time-averaged degree of light intensity and is experimentally measurable.
S = S 0 S 1 S 2 S 3 = I 0 , 0 + I 90 , 0 I 0 , 0 I 90 , 0 I 45 , 0 I 135 , 0 I 45 , π / 2 I 135 , π / 2
The first parameter, S0, represents the total intensity of the light field. The second parameter, S1, denotes the difference in intensity between the horizontal and vertical linear polarization components. When S1 is positive, the horizontal component dominates; conversely, the vertical component prevails. The third parameter, S2, quantifies the intensity difference between the +45° and 135° linear polarization components in the plane perpendicular to the propagation direction. The fourth parameter, S3, indicates the intensity difference between left-handed and right-handed circular polarization. In this study, a linear polarimeter serves as the detector, rendering the circular polarization component S3 undetectable. Consequently, S3 is disregarded, restricting our analysis exclusively to linear polarization scattering characteristics.
The Stokes vector characterizes not only fully polarized light but also partially polarized and unpolarized light. To quantitatively describe the degree of polarization in a light field, the degree of linear polarization (DoLP) and angle of polarization (AoP) are defined as follows:
D o L P = S 1 2 + S 2 2 S 0
A o P = 1 2 arctan S 2 S 1 π 2   ,   π 2
The range and meaning of DoLP are as follows:
D o L P 0   ,   1 D o L P = 0 D o L P = 1 0 < D o L P < 1 indicates   unpolarized   light corresponds   to   fully   polarized   light represents   partially   polarized   light  
The range of AoP is
A o P π 2 , π 2   radians

3. BRDF Imaging Detection Device Based on IMU Attitude

For a large-format imaging BRDF measurement system performing multi-angle, high-resolution reflectance characterization, the apparatus comprises two primary assemblies, the azimuth module and the zenith module, as depicted in Figure 2a. The azimuth module, implemented as a ground-mounted circular rail, enables rotation along the azimuthal direction. The zenith module, configured as an overhead arcuate rail spanning the azimuth assembly, controls motion in the zenithal direction. Through coordinated operation, these subsystems facilitate multi-angle reflectance data acquisition.

3.1. Azimuth Module Design

To achieve high-precision and stable adjustable control of the imaging system in the horizontal (azimuthal) plane, this study designs an azimuthal rotation unit based on a concentric dual-rail structure. The assembly comprises inner and outer circular rails with diameters of 3300 mm and 4600 mm, respectively, and a rail spacing of 650 mm. Fabricated from stainless steel tubing, the rails undergo precision arc-forming using an industrial pipe bender to ensure circularity and concentricity, enhancing operational accuracy and structural stability. For improved field deployability and transportability, a modular design divides the rails into four 90° segments (Figure 2c), connected via dowel pins and high-strength bolts to maintain geometric integrity post-assembly.
Two motorized slide carriages are uniformly distributed along the rails in an axisymmetric configuration (Figure 2e), supporting the upper zenith structure while synchronously controlling its rotation. Each carriage integrates four inward-grooved U-groove rollers at its base, engaging the dual-rail structure for optimal guidance and load bearing. Driven by high-resolution stepper motors with microstepping drive technology and position feedback, the system enables continuous, stable, and repeatable rotational control over 0–360° azimuth.

3.2. Zenith Module Design

The zenith angle adjustment unit comprises a dual-arched rail structure with a radius of 2000 mm, spanning between two motorized slide carriages on the azimuth rail (Figure 2d). Fabricated from stainless steel tubing via high-precision bending, the rail ensures structural symmetry and trajectory smoothness. For rapid field deployment, the rail is divided into two modular segments, connected via embedded dowel pins and high-strength screws to maintain structural integrity post-assembly.
A mobile carriage mounted on the inner side of the arcuate rail carries the polarized imaging equipment (Figure 2b). Equipped with an embedded U-groove roller assembly at its base, the carriage achieves smooth motion along the zenithal direction. Driven by a high-torque stepper motor via a fixed-pulley system and steel cable transmission, the carriage enables continuous zenith angle adjustment over 0–75°. This mechanism facilitates high-precision attitude scanning in the vertical plane, while coordinated motion with the azimuth module enables spherical imaging trajectories for polarized reflectance characterization in 2D angular space.

3.3. Attitude Monitoring and Error Control

Due to the large-scale structure of the BRDF measurement system and its modular detachable design for portability, structural connection errors and minor mechanical deformations may occur during assembly and operation, compromising angular control accuracy. Additionally, the gravitational load from the imaging equipment exacerbates deflection in the zenithal arcuate rail. Particularly under the substantial span of the zenith module, continuous positional changes in the detection device induce time-varying structural deflections, posing potential disturbances to attitude stability and measurement consistency. As illustrated in Figure 2f, when the BRDF equipment is mounted on the carriage, the zenithal arcuate rail deforms, invalidating pre-calibrated angle references inscribed on the rail. This necessitates implementing an advanced angular positioning methodology to mitigate inaccuracies.
To enhance angular control precision and attitude stability, an IMU sensor is integrated with the imaging detector for real-time monitoring and feedback of spatial attitude information. Before each measurement, the system resets to its initial state (θr = 0°, θr = 0°) for IMU initialization calibration, ensuring alignment between its triaxial output and the system coordinate frame. During operation, the X-axis (pitch) and Y-axis (yaw) data of the IMU (Figure 2g) are primarily utilized, where the X-axis outputs the detector’s pitch angle and the Y-axis outputs its yaw angle. These measurements are converted to derive the observation zenith angle θr and azimuth angle θr at the detector’s position [38].
To ensure measurement accuracy, the control program acquires IMU attitude data in real time and compares it with stepper motor target angles, establishing a closed-loop feedback mechanism that dynamically corrects angular errors. This strategy effectively suppresses attitude deviations caused by structural assembly tolerances, sliding friction, and motor step accumulation errors, thereby improving angular positioning accuracy and repeatability during multi-angle motion while guaranteeing geometric consistency and stability of the measurement data.

3.4. Control System Design and Integration

To enhance operational efficiency and automation while reducing human-induced angular errors, an integrated control system was developed on the LabVIEW platform (version 2018, 32-bit). This system incorporates functional modules for motor driving, attitude acquisition, angular feedback, task scheduling, and data management, enabling automated and precise spatial angular control of the imaging platform. A closed-loop feedback control scheme was implemented, where real-time angular data from the IMU sensor are fed back to the LabVIEW controller. The controller performs PID regulation, adjusting motor speed and acceleration to ensure accurate and smooth positioning of the stepper motor.
As shown in Figure 2h, the system core comprises a host computer running BRDF control software (version 2025-V1.0) that communicates via USB with drive controllers. These controllers, respectively, operate stepper motors in the azimuth and zenith modules for positional control. The logic supports multi-angle path planning, autonomously generating 2D angular sequences (θr: 0–75°; φr: 0–360°) based on predefined scanning strategies. A graphical interface provides real-time angle monitoring and system status visualization.
For high-precision angular adjustment, IMU sensors acquire the detector’s spatial attitude. After each movement, the system automatically compares measured attitudes with target values. If errors exceed thresholds (e.g., >0.1°), a compensation mechanism triggers micro-adjustments to correct deviations, establishing a closed control loop. Additionally, limit sensors at critical mechanical nodes prevent structural damage from over-travel or misuse, serving as fail-safe protection during IMU outages. This feedback architecture significantly improves angular accuracy and repeatability, particularly for prolonged continuous multi-angle acquisition tasks.

4. Experimental Procedure for Imaging Accuracy Measurement

To analyze structural errors in the zenithal arcuate rail during system operation and evaluate their impact on angular accuracy and imaging stability, this study addresses minor deformations arising from prolonged use and assembly. Traditional manual positioning via rail markings fails to ensure consistent attitude control; thus, IMU sensors provide real-time spatial angle feedback as the primary reference for system control.

4.1. Rail Deformation Error Analysis and IMU Comparison

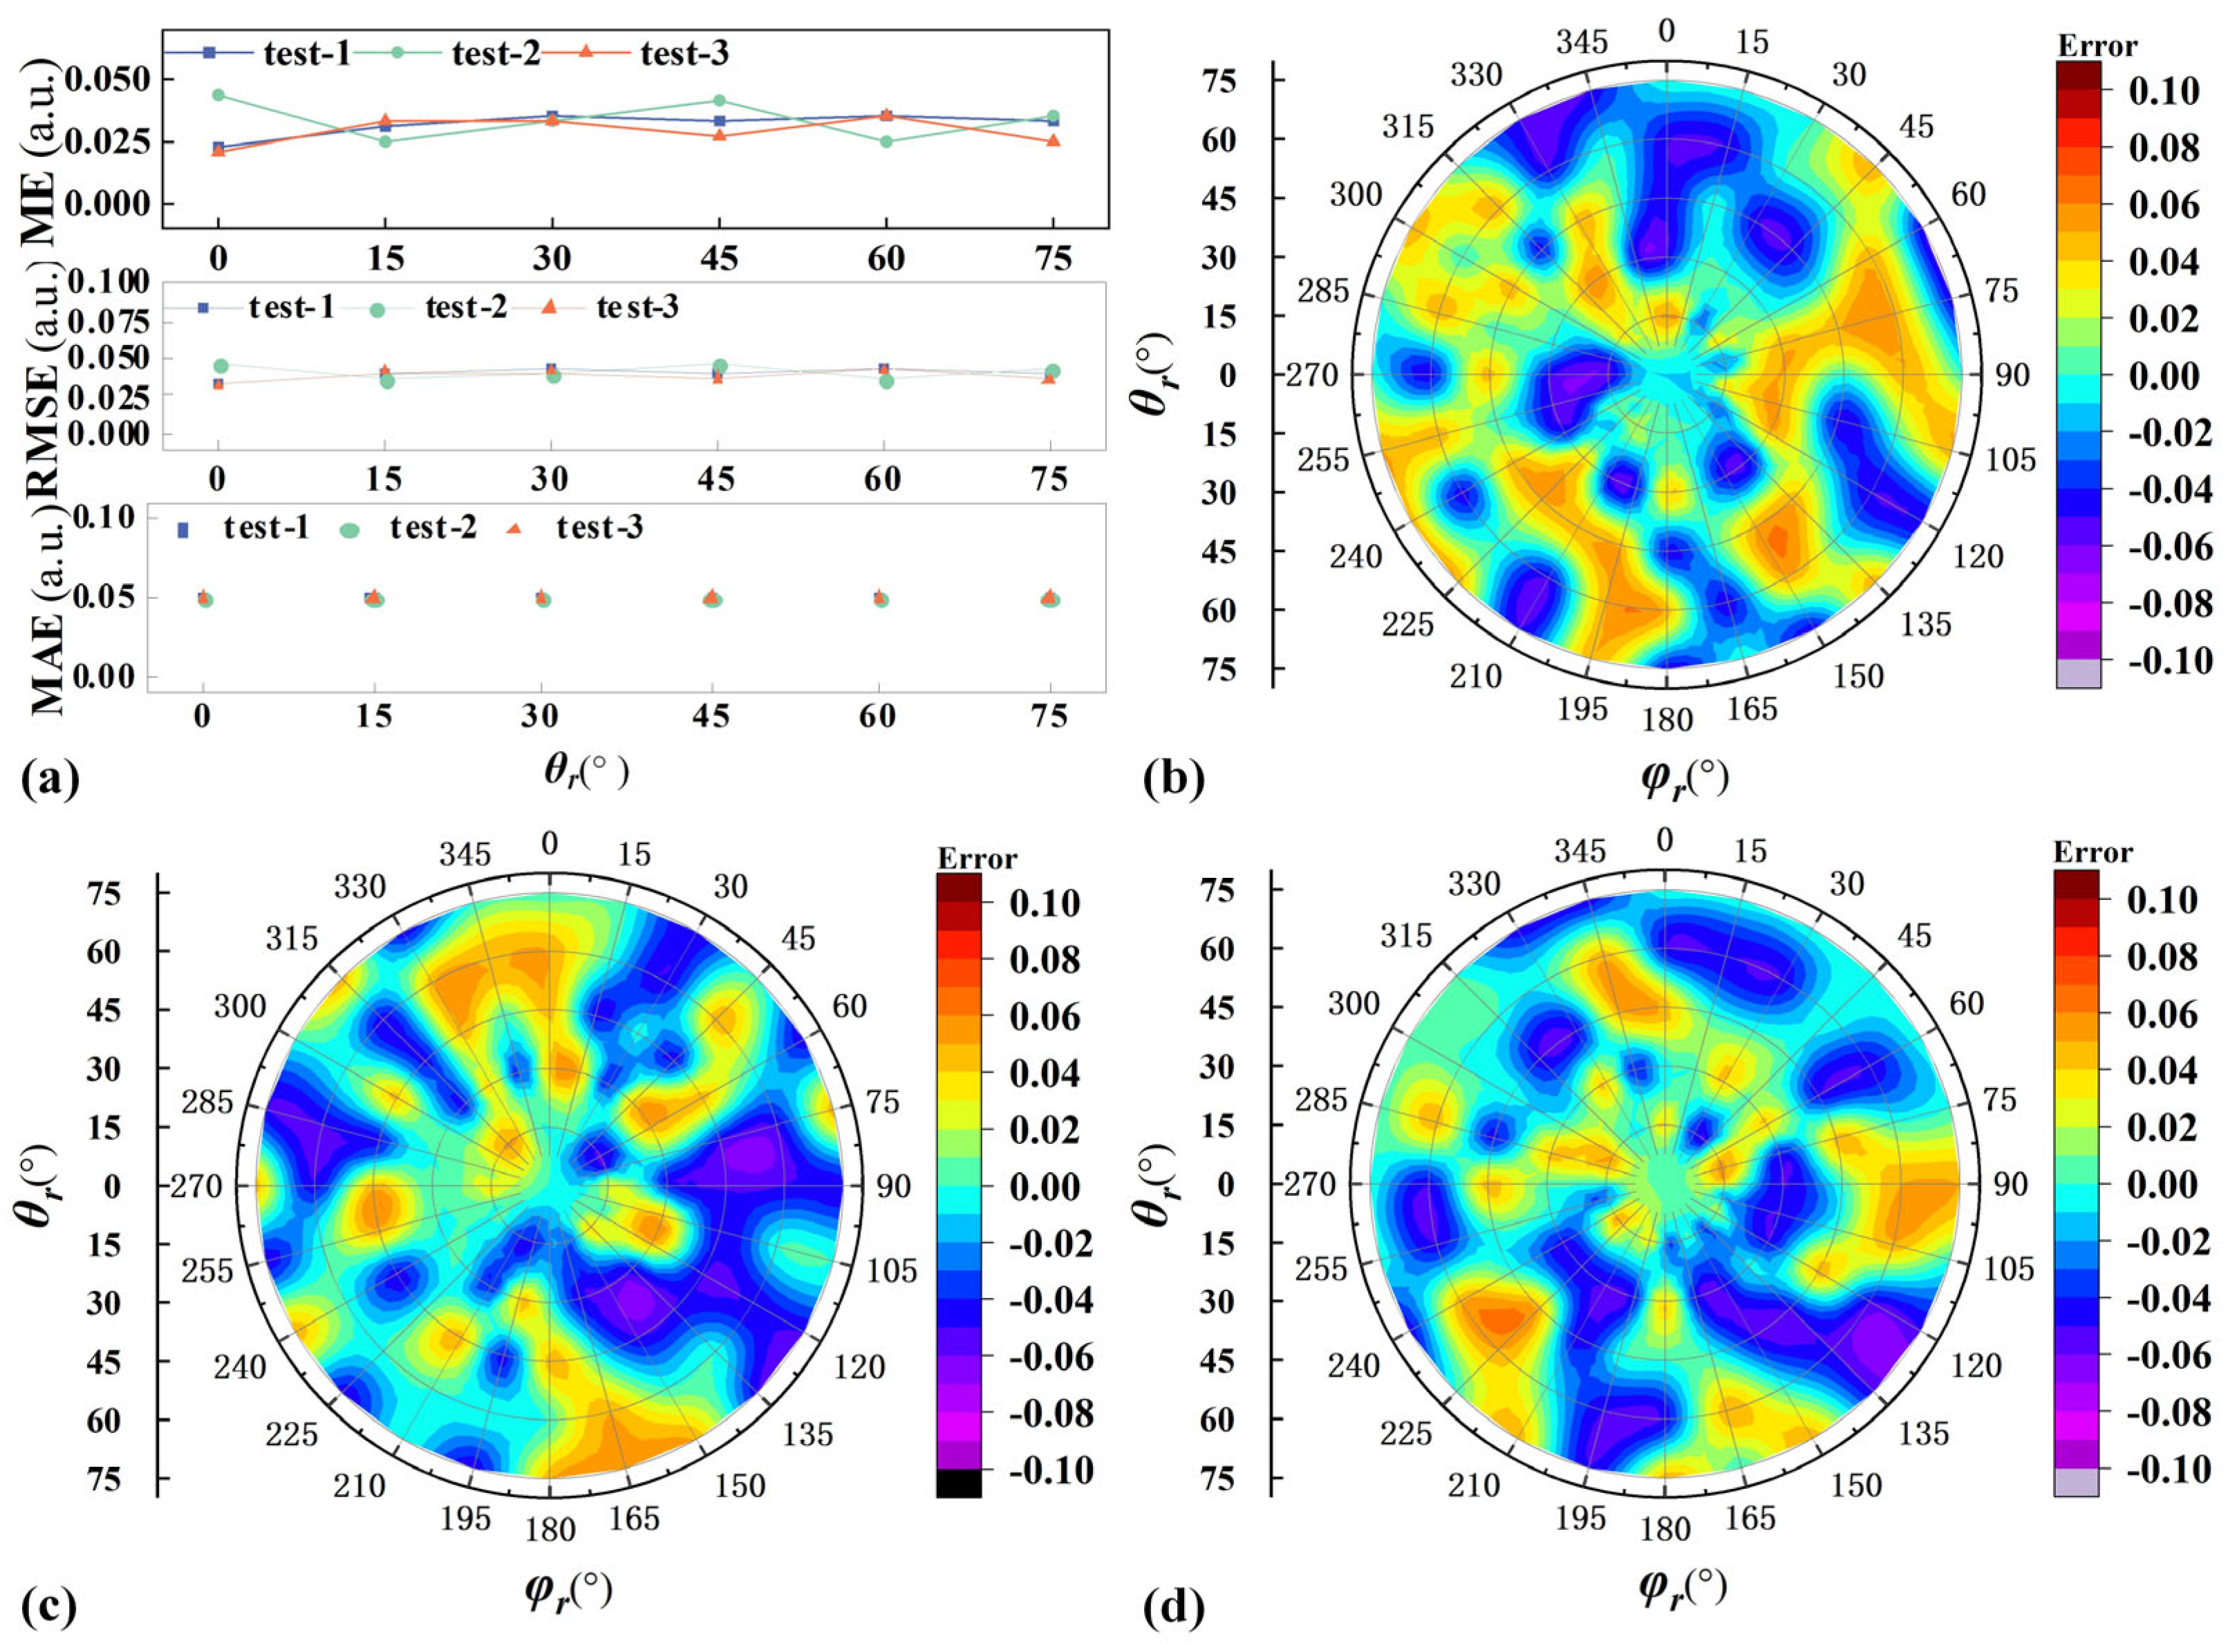
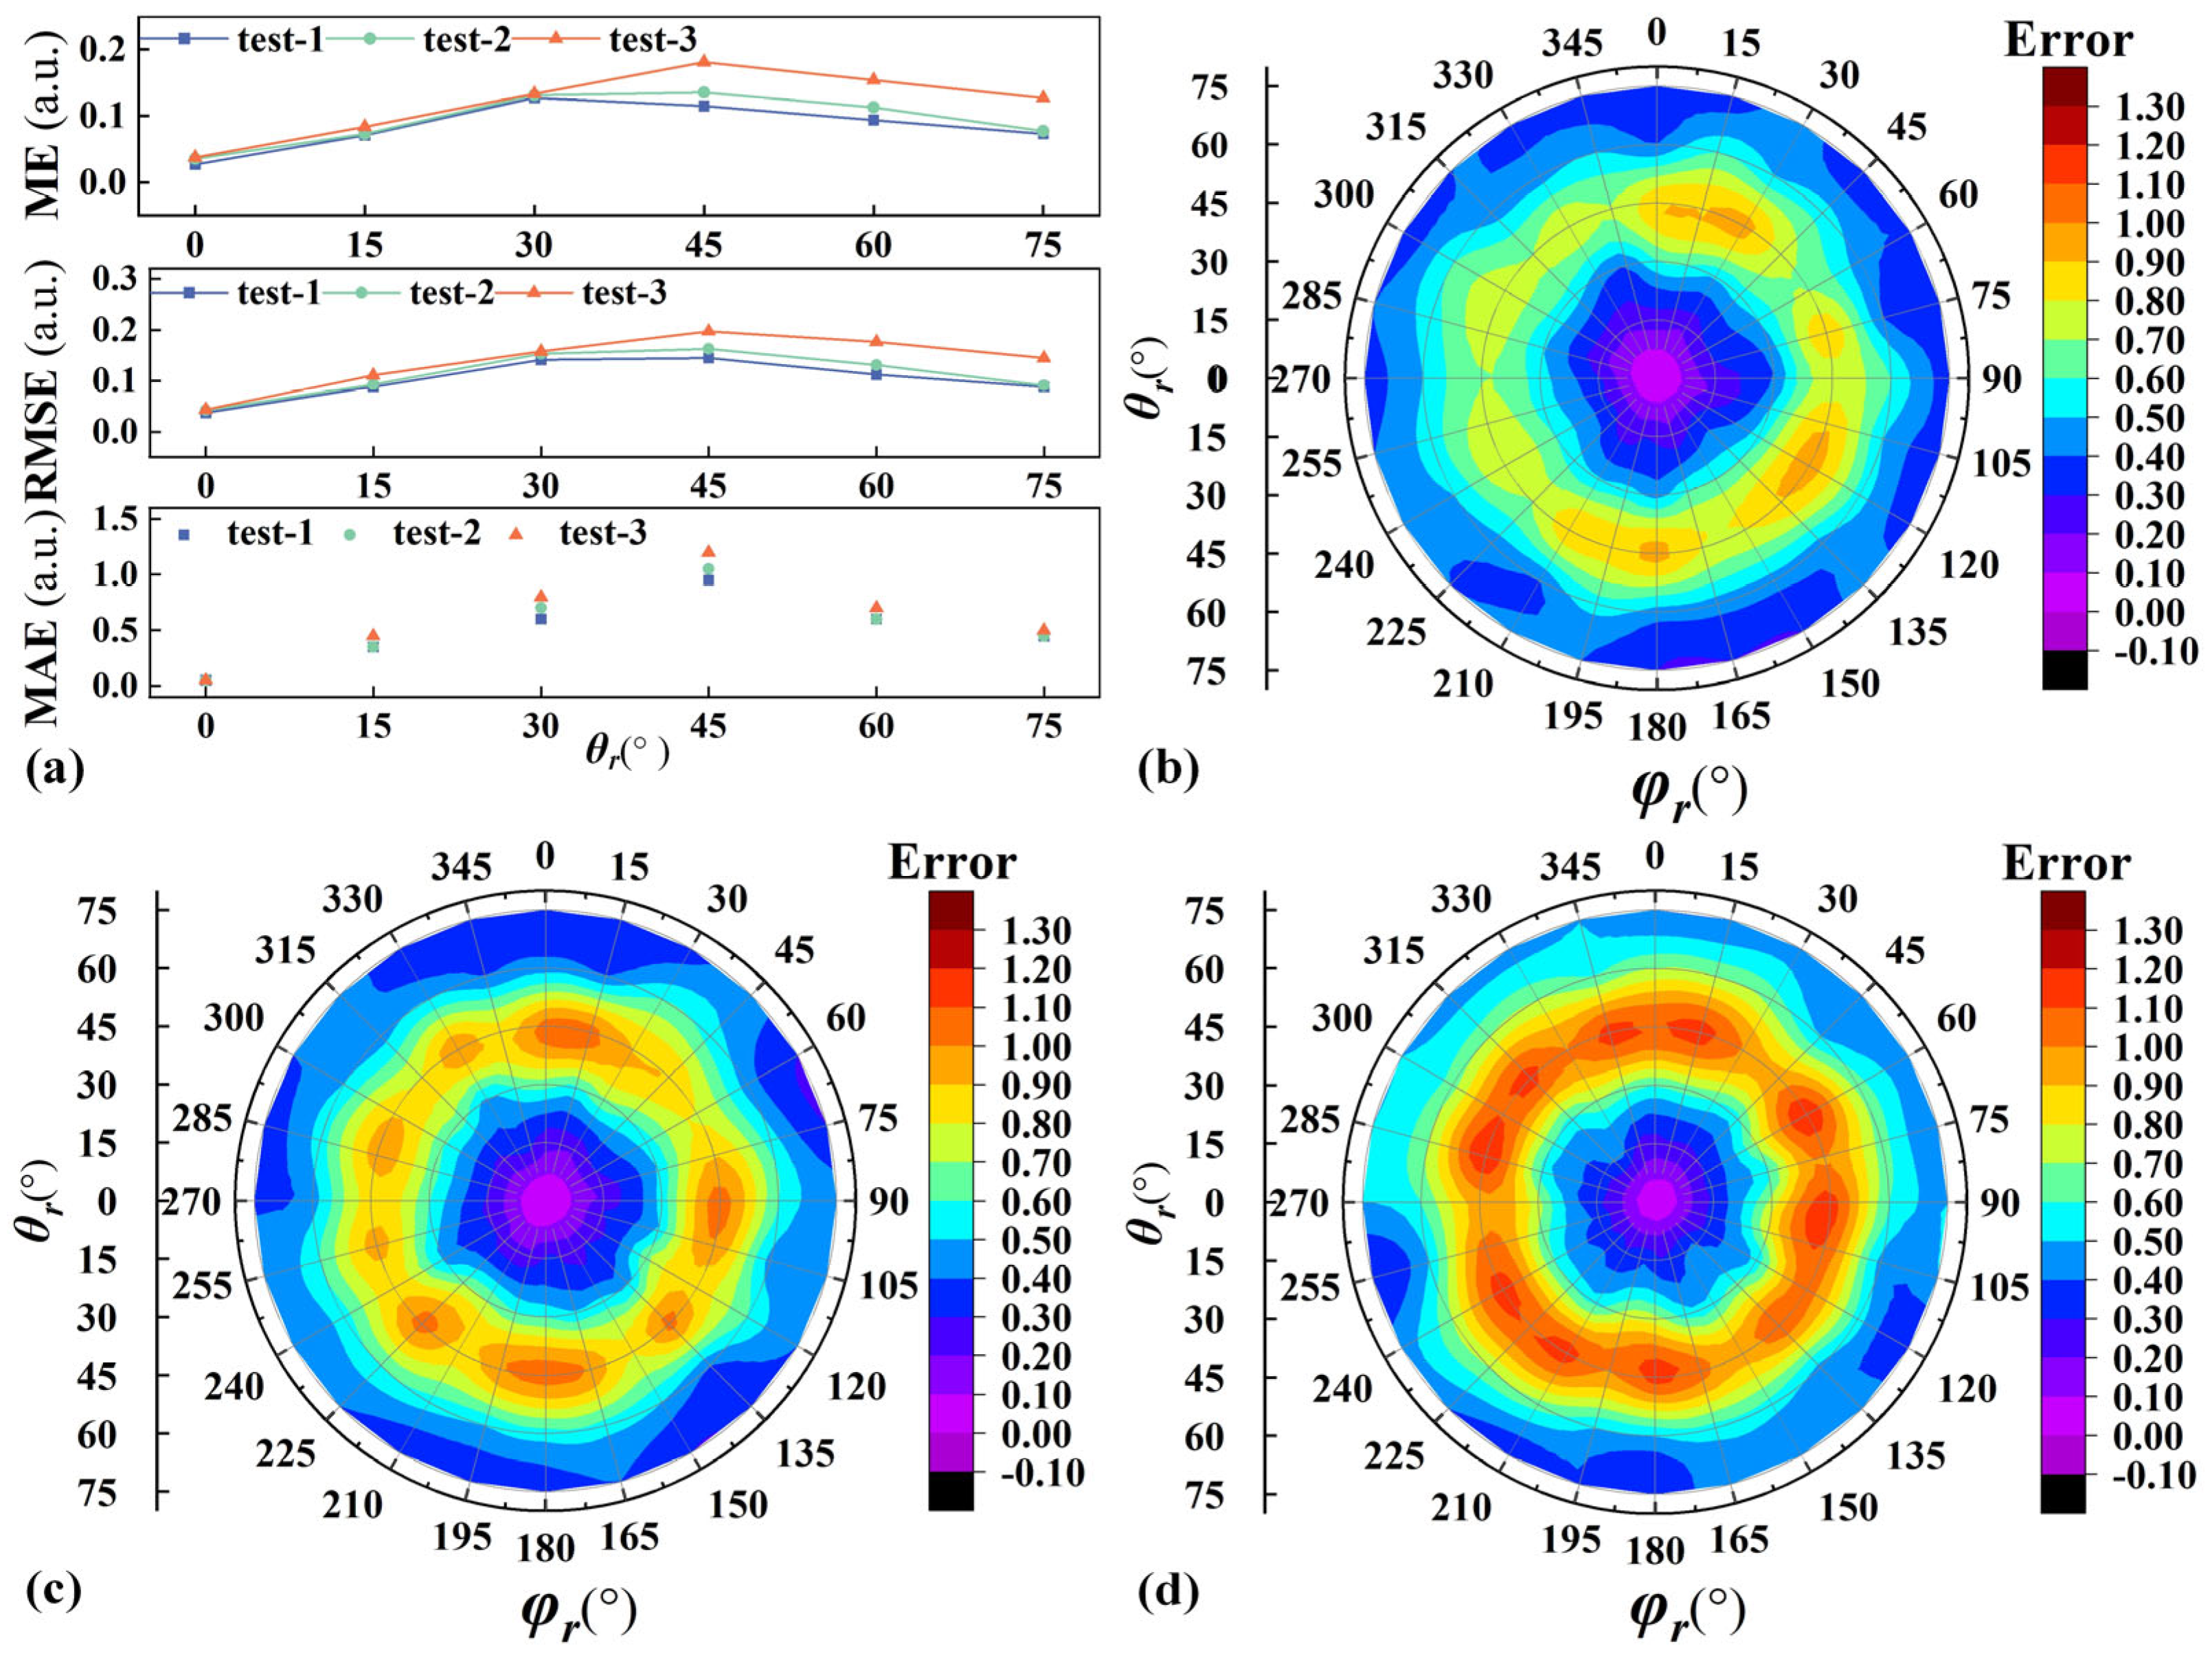
To evaluate the structural stability of the BRDF measurement system across varying zenith angles, this section compares discrepancies in zenith angle measurements between mechanically marked positions and IMU attitude feedback at multiple angular points. For uniform spatial coverage, zenith angles θr were incremented from 0° to 75° at 15° intervals (6 positions), while azimuth angles φr spanned 0° to 345° at 15° intervals (24 positions), yielding 144 angular configurations (6 × 24). During three consecutive measurement trials (test 1–3), detectors were manually aligned with rail markings at each position and stabilized for imaging. The IMU-output true zenith θ r I M U and azimuth φ r I M U angles were then recorded and compared against nominal marked angles ( θ r m a r k , φ r m a r k ). Figure 3 shows the error distribution and analysis of the detection azimuth angle Δφr, while Figure 4 presents the error distribution and analysis of the detection zenith angle Δθr.
Figure 3 presents the error analysis of the detector azimuth angle based on the IMU. To quantitatively evaluate the measurement accuracy, three statistical error metrics were employed: mean error (ME), Root Mean Square Error (RMSE), and Maximum Absolute Error (MAE). The results indicate that across all measurement points, the azimuth angle error remains within ±0.05°, which corresponds exactly to the minimum resolution of the employed IMU. Based on the geometry of the azimuthal circular track shown in Figure 2, the inner circumference of the track is approximately 10,367 mm (3300 mm × π = 10,367 mm). As shown in Figure 3, the azimuth errors at all angles are also within ±0.05°, meaning that a ±0.05° azimuth error corresponds to only about 1.44 mm of linear displacement, which can be reasonably regarded as negligible in the system. Combined with the results from three separate tests, it can be further confirmed that the system exhibits a minimal azimuthal error, meeting the requirements for high-precision BRDF measurements.
Unlike Figure 3, systematic discrepancies are observed between the IMU-measured zenith angles θ r I M U and the nominal rail-marked values φ r m a r k . At low zenith angles (θr ≤ 15°), these deviations remain small, but they gradually increase with elevation, peaking at θr = 45° before gradually decreasing. Importantly, the IMU-reported zenith angles are consistently higher than the nominal values across all measurement points, indicating a downward tilt of the detector relative to the calibrated position. This tilt can be attributed to the gravitational deflection of the rail, which depends on its mass distribution and structural stiffness. By approximating the rail as a simply supported beam under self-weight, the expected deflection was estimated to be within the same order of magnitude as the zenith deviations measured by the IMU. This agreement confirms that gravity-induced deformation of the rail is the primary source of the systematic tilt observed at high zenith angles. These results validate IMU sensors as effective references for mitigating systematic errors in high-angle regimes without reliance on mechanical rail markings.
To accurately quantify the discrepancies between the nominal zenith angle θ r m a r k and the IMU-derived true zenith angle θ r I M U in the BRDF system, the same three statistical error metrics were employed: mean error (ME), Root Mean Square Error (RMSE), and Maximum Absolute Error (MAE). Figure 4b–d present the statistical analyses of three experimental datasets (Test 1, Test 2, and Test 3) using these metrics. The minimal differences among these measurement sets confirm the BRDF system’s excellent repeatability and operational stability. All error metrics peaked at θr = 45°, indicating larger angular deviations at high zenith angles due to rail deformation and pose drift, consistent with the observations described in Figure 4a. Notably, errors gradually increased across consecutive tests: Test 1 exhibits the smallest errors, while Test 3 shows the largest, suggesting cumulative deviations during extended operation. Regular recalibration is recommended to maintain pose accuracy over long-term measurements.

4.2. Experimental Conditions and Image Acquisition Protocol

To validate the geometric consistency of BRDF imaging under varying attitudes, experiments were conducted in a standardized optical darkroom (Figure 5) to eliminate ambient light interference. The system was installed on a leveled floor with precise alignment of azimuth and zenith rails ensuring initial geometric accuracy. A solar simulator provided stable illumination with high collimation (divergence ≤ 2°) and uniformity (≥95%), covering a 350 mm diameter area to maintain consistent lighting across angles.
The imaging device comprised a MER2-502-79U3M POL polarization camera (Daheng Imaging) with a 2448 × 2048 resolution, 25 mm lens, and quad-channel polarization filter array (0°/45°/90°/135°), simultaneously outputting DoLP, AoP, and intensity images [39]. An 11 × 8 checkerboard calibration target (15 mm square cells) was positioned at 1500 mm from the detector center. Aperture and exposure settings were optimized for robust corner detection.
Angular scanning followed Section 4.1’s protocol: zenith angles θr from 0° to 75° (15° steps, 6 positions), and azimuth angles φr from 0° to 345° (15° steps, 24 positions). While 144 configurations were theoretically possible, physical occlusion occurred at φr = 0° and 180°, where the detector’s line-of-sight aligned with the light path. After excluding these, 141 valid datasets were successfully acquired.

4.3. Image Distortion Correction Based on IMU Attitude

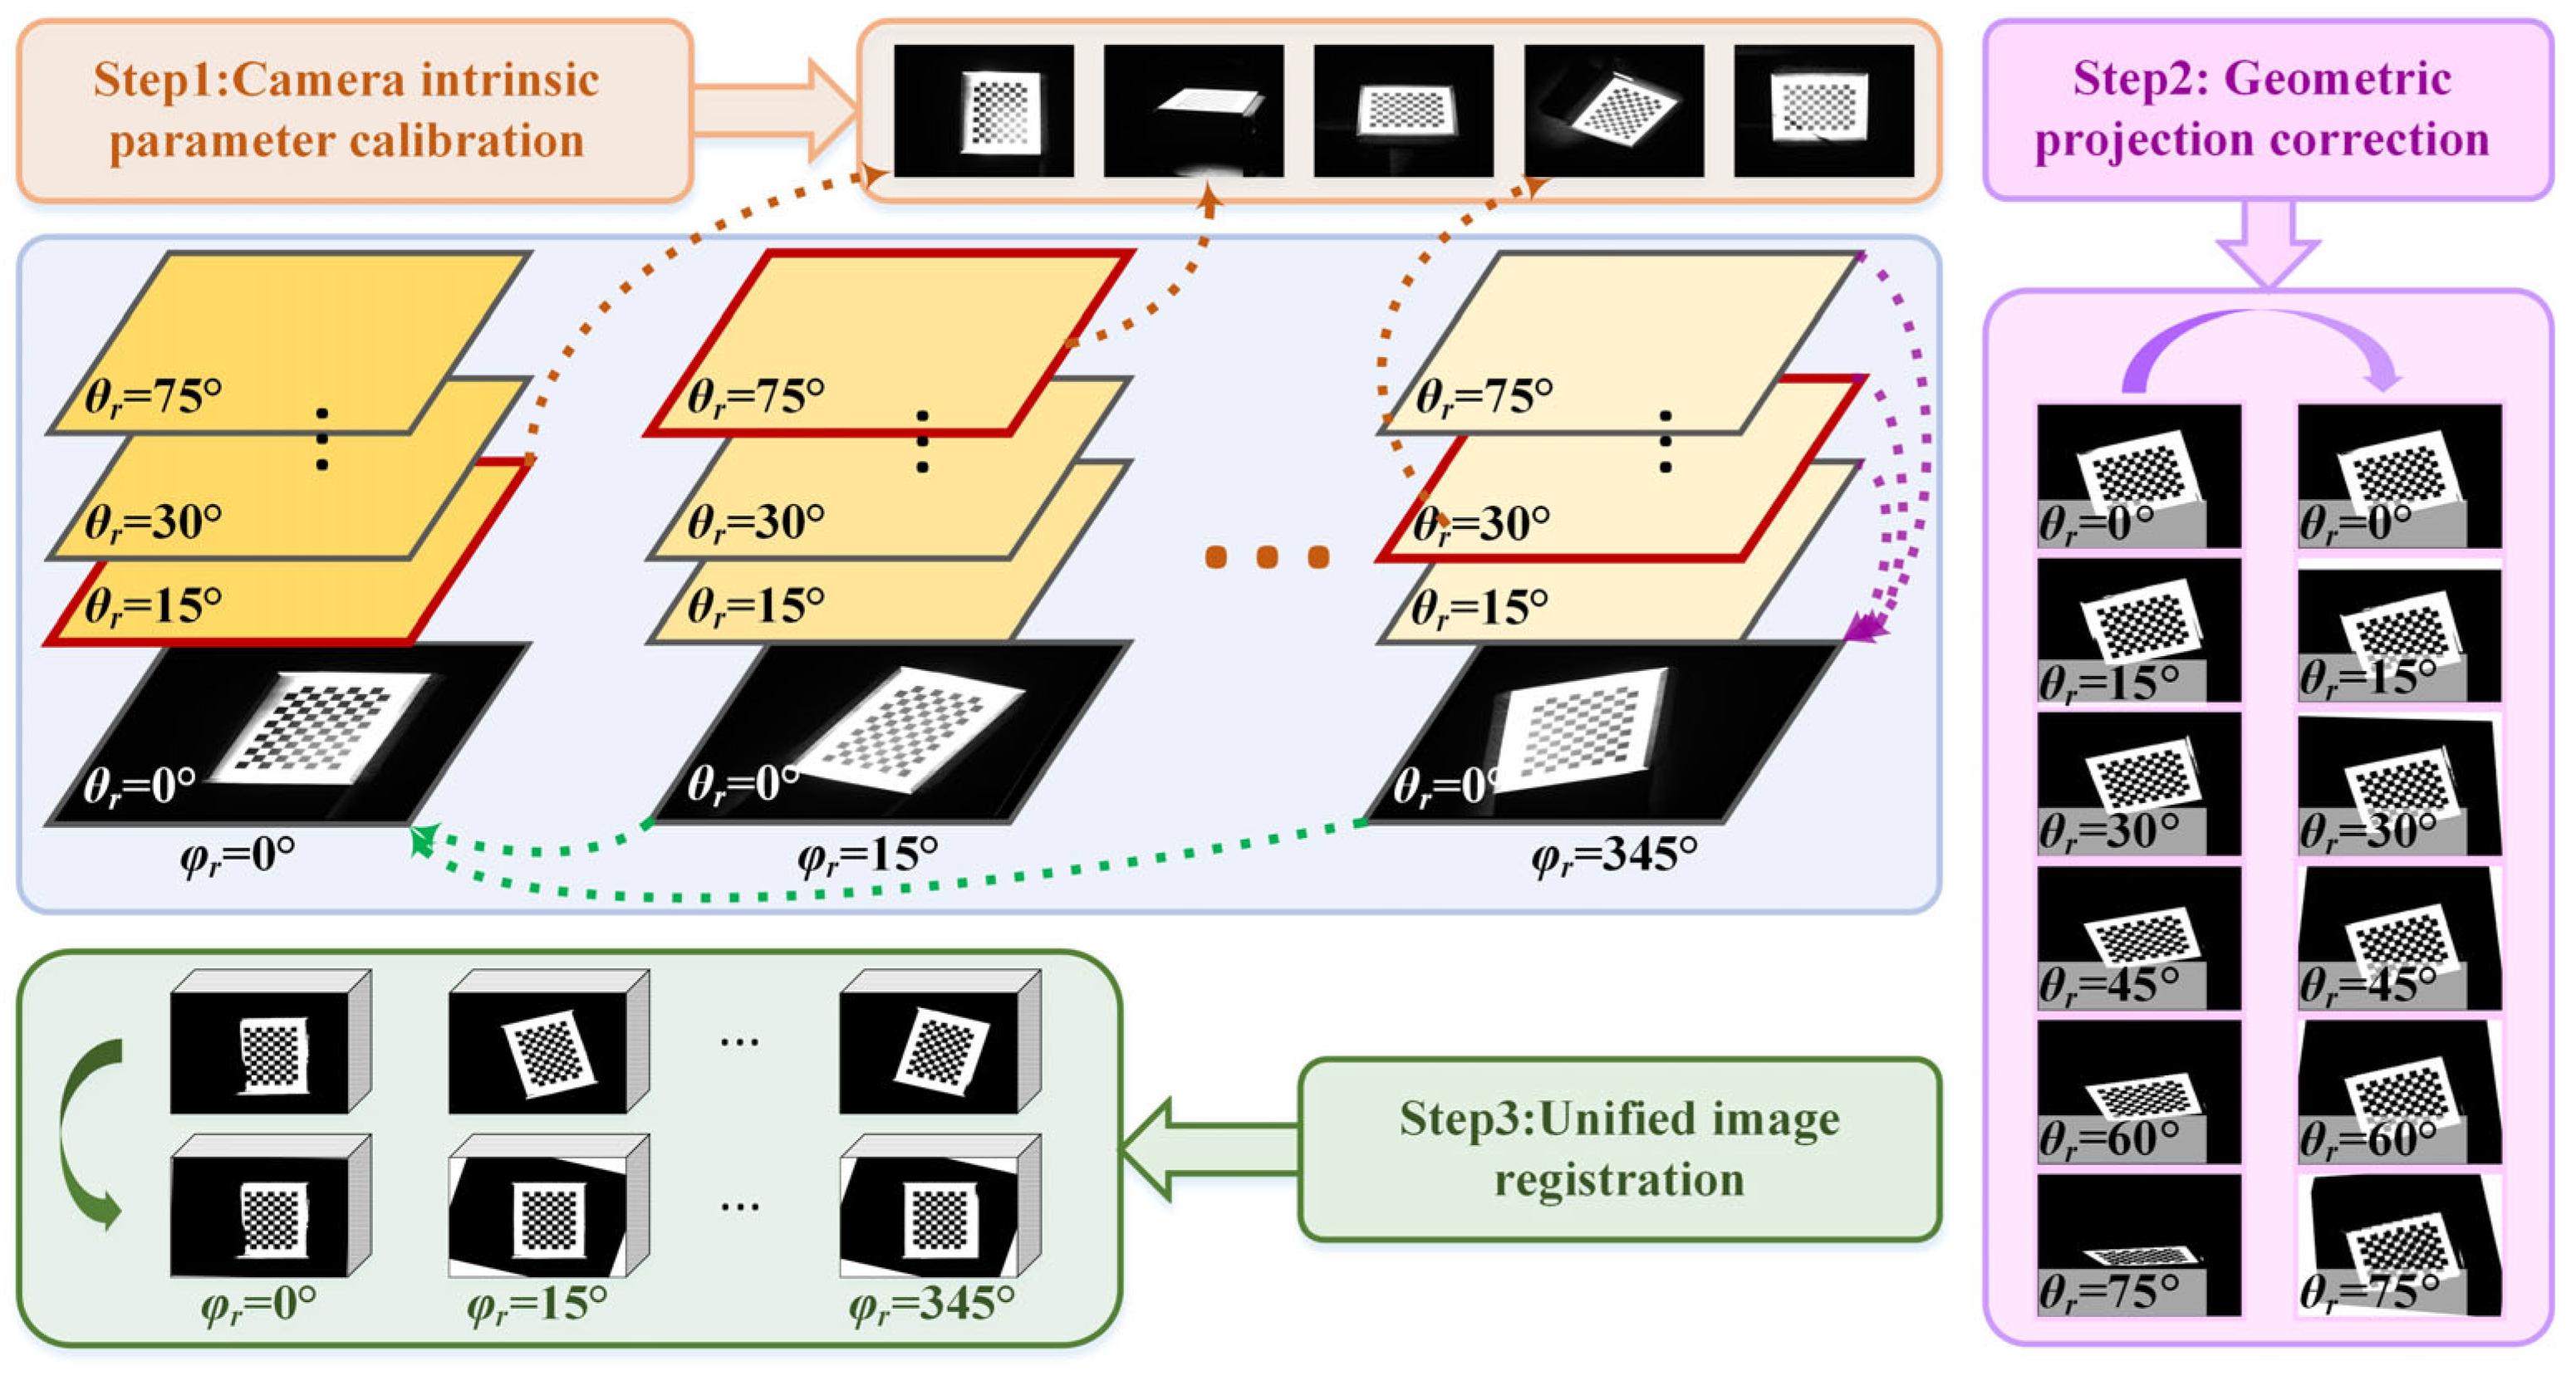
To enhance geometric consistency in multi-angle BRDF imaging, a distortion correction scheme was proposed that jointly constrains camera intrinsics and IMU attitude data. This approach comprises three stages: (1) camera intrinsic calibration, (2) IMU-based geometric projection correction, and (3) unified image registration to a reference pose (θr = 0°; φr = 0°).
Step 1: Camera Intrinsic Calibration
Although the translation vector is not explicitly included in Equation (13), Zhang’s planar checkerboard calibration method [40] implicitly accounts for the relative translation between the camera and the checkerboard during multi-angle image acquisition. By fitting the reprojection errors of rotation and translation for each calibration image, small translation deviations are implicitly compensated, mitigating the absence of an explicit translation vector in the model. In our study, the target to be measured was positioned nearly at the center of the BRDF sphere and secured using a dedicated fixture, further minimizing any potential translation effects.
K = f x 0 c x 0 f y c y 0 0 1
Here, fx and fy represent the focal lengths of the image in the horizontal and vertical directions, respectively, while cx and cy denote the coordinates of the image’s principal point. To correct the nonlinear distortion caused by the lens and simultaneously estimate the radial distortion coefficients k1, k2 and the tangential distortion coefficients p1, p2, the following distortion correction model is employed:
x u n d i s t = x 1 + k 1 r 2 + k 2 r 4 + 2 p 1 x y + p 2 r 2 + 2 x 2 y u n d i s t = y 1 + k 1 r 2 + k 2 r 4 + 2 p 2 x y + p 1 r 2 + 2 y 2
with (x, y) as normalized coordinates and r2 = x2 + y2. Implemented via OpenCV’s Zhang model, this ensures stability and generalizability for subsequent geometric rectification.
Step 2: IMU Attitude Geometric Projection
Leveraging the IMU-measured pose (θr, φr), a 3D rotation matrix R was constructed. Combined with K, spatial points Pworld project onto the image plane, describing imaging geometry across poses:
P i m g = K R P w o r l d
The homography matrix H then transforms arbitrary-view images Ii to the reference view I0:
I 0 = H I i ,   H = K R i R 0 1 K 1
Step 3: Unified Image Registration
To achieve spatial consistency and comparative analysis across multi-angle imaging results, images captured at the reference pose (θr = 0°, φr = 0°) serve as the unified coordinate system. Following distortion correction and attitude compensation, all images undergo homography transformation to align geometrically with the reference image in the image space. This process eliminates perspective-induced deformations and ensures consistent spatial correspondence of identical physical regions across viewing angles, thereby facilitating reliable extraction of polarization parameters and angular error analysis.

5. Polarization Imaging Experiments and Impact Analysis of Angular Errors on Polarized Information

5.1. Polarization Imaging Experiments

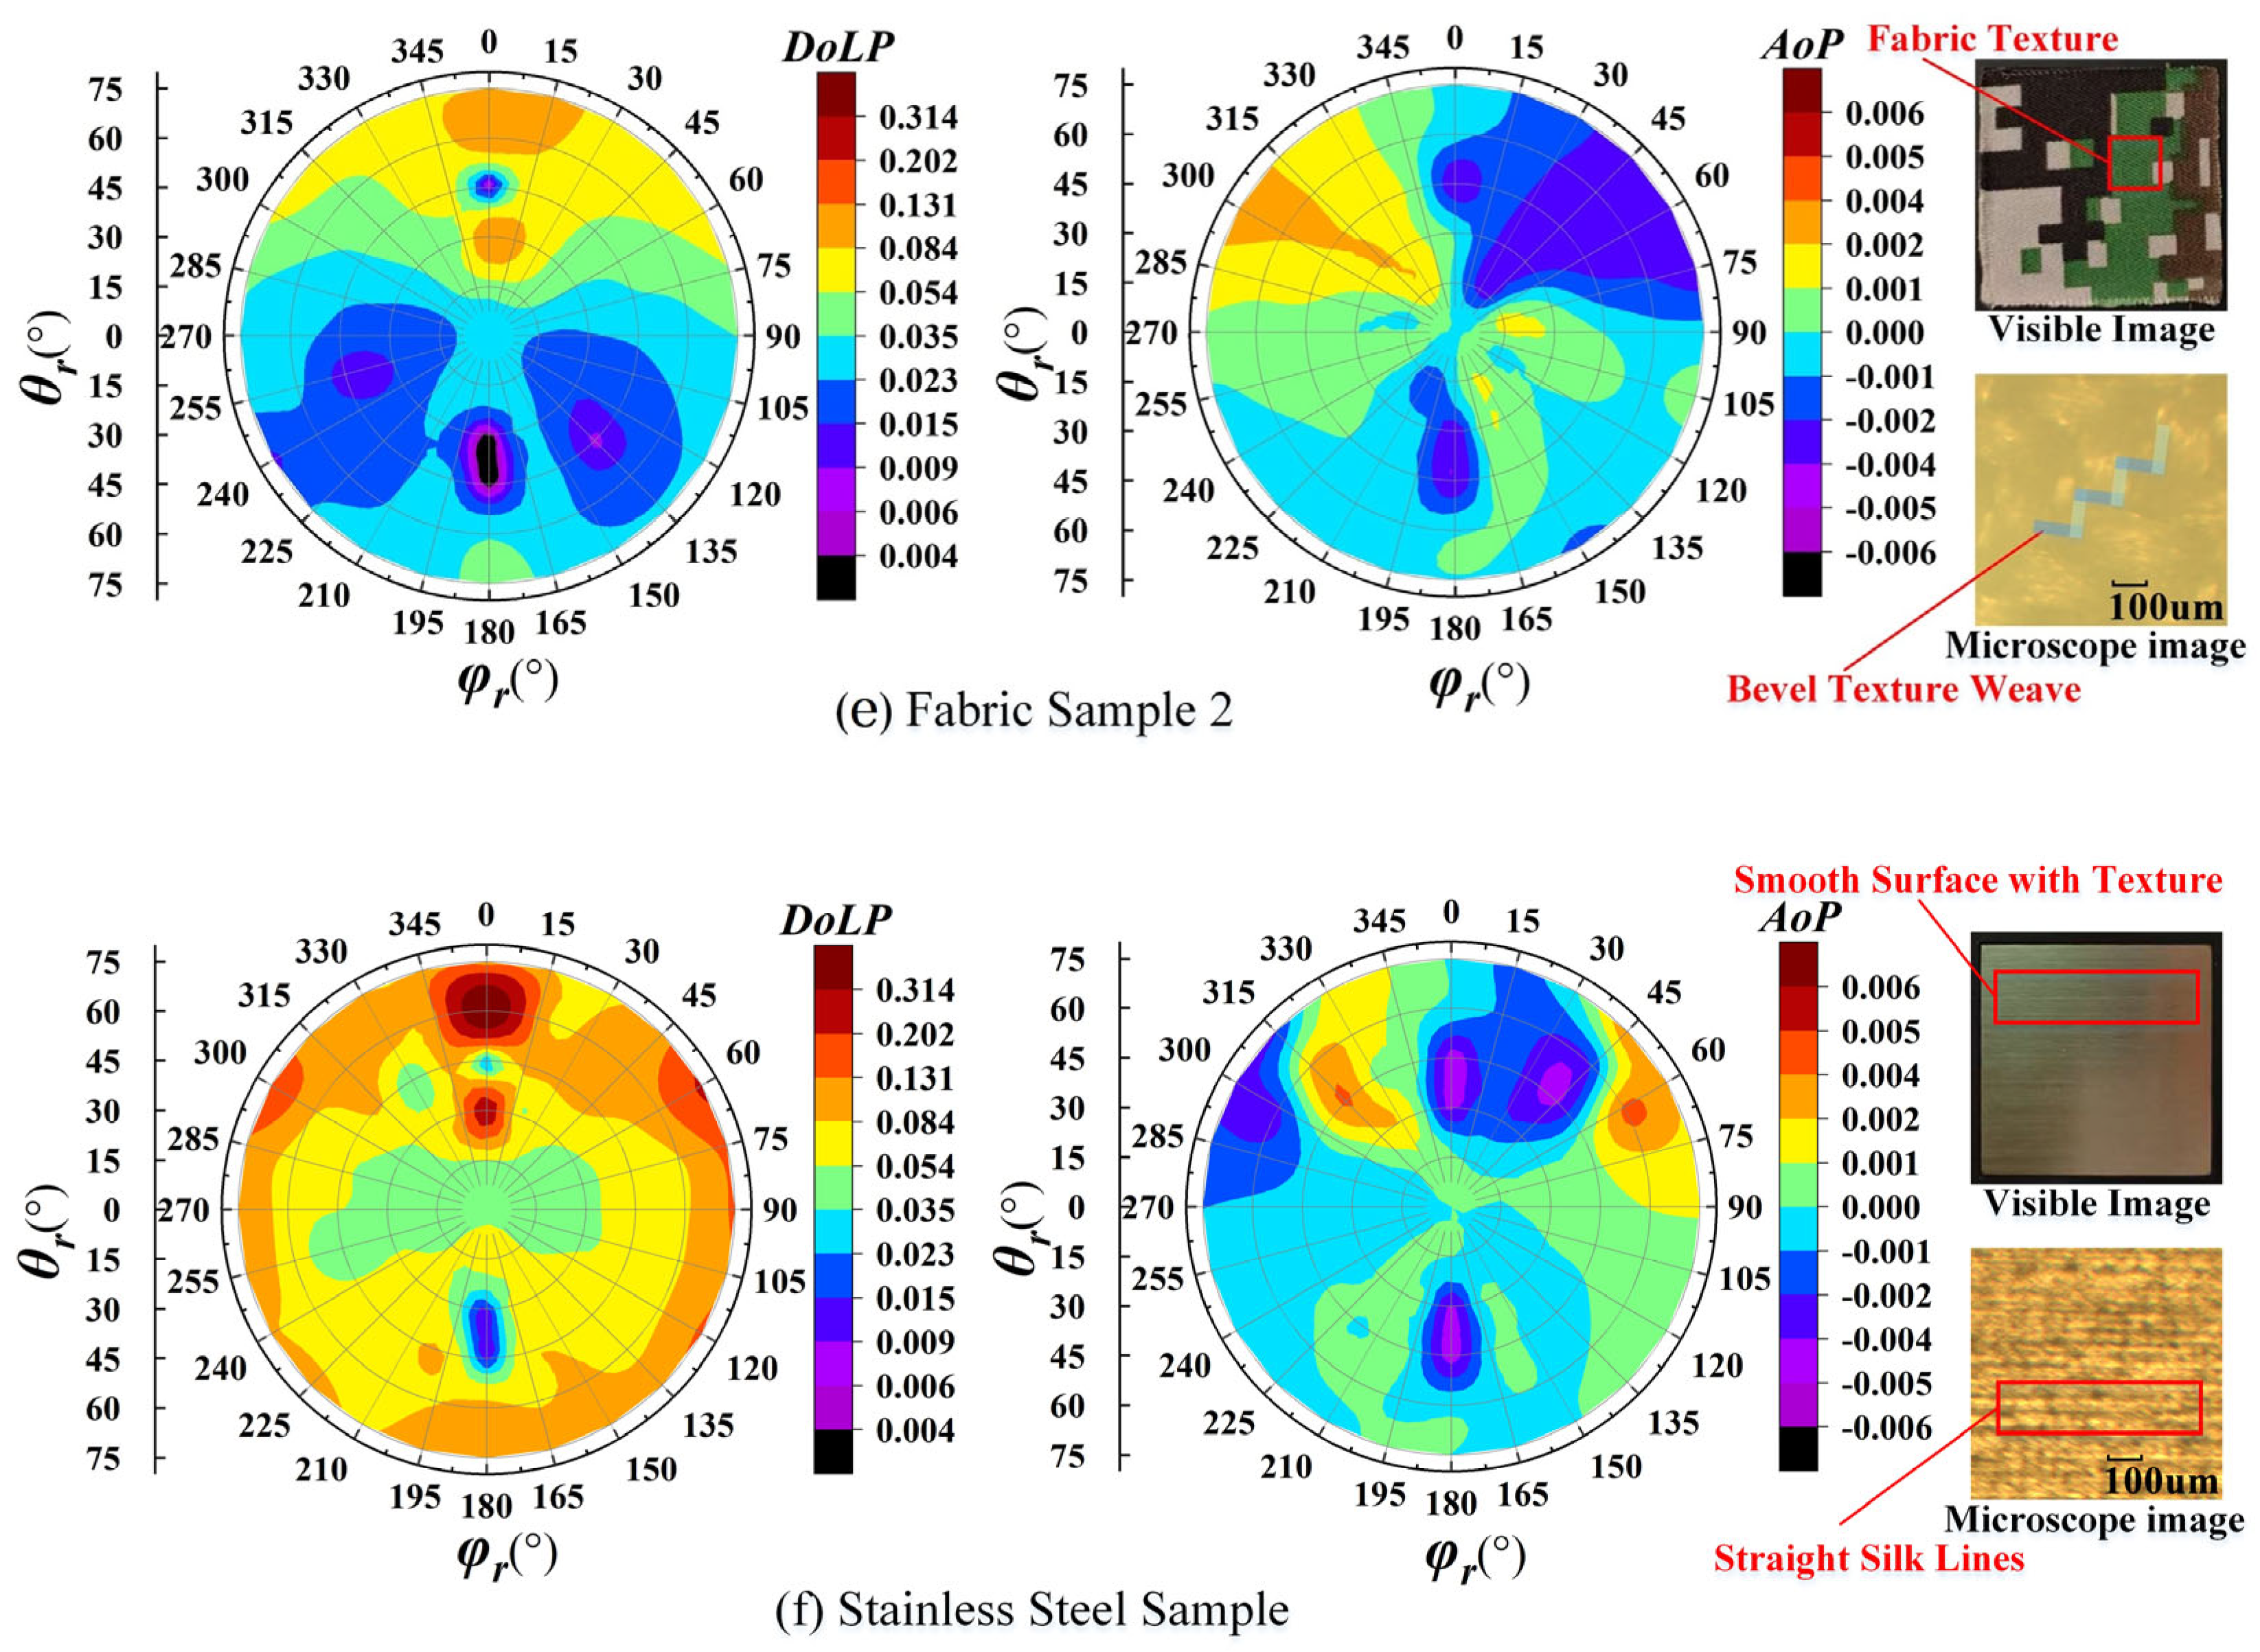
To validate the BRDF system’s applicability in characterizing polarized reflection from diverse materials, polarization BRDF measurements were conducted on six samples across three categories. With illumination fixed at θi = 45° and φi = 180°, the polarization camera simultaneously acquired four raw-intensity images (I0, I45, I90, I135). Stokes parameter images (S0, S1, S2) were computed via Equation (8), followed by per-pixel DoLP and AoP extraction using Equations (9) and (10). All images underwent camera calibration, geometric registration, and distortion correction (Figure 6 workflow) to ensure spatial consistency, enabling accurate polarization analysis. Figure 7 displays the DoLP and AoP spatial distributions for six material samples under multi-angle polarization imaging.
Data at three positions—(θr = 45°; φr = 0°), (θr = 45°; φr = 180°), and (θr = 60°; φr = 180°)—were excluded due to occlusion. Notably, the AoP exhibits 180° periodicity, causing ambiguity at the 0°/180° azimuth boundary. This manifests as symmetric yet opposite values near φr = 0° and φr = 180°, reflecting mathematical discontinuity rather than actual polarization direction reversal.
(a)
Coated Sample 1
The DoLP distribution reveals pronounced polarization in the primary reflection zone (θr = 30–60°, φr = 345–15°), with a maximum DoLP > 0.30 indicating strong specular reflection. The AoP exhibits high spatial gradient symmetry, consistent with specular-reflective materials. Visible-light imaging shows a rough yet glossy surface, while microscopy reveals ≈50 μm coating particles surrounded by smooth areas, explaining its hybrid specular–diffuse polarization behavior.
(b)
Coated Sample 2
Demonstrates similar reflection zones and polarization structure to Sample 1, but its reduced maximum DoLP (0.18) suggests weaker polarized reflection. Its AoP maintains symmetry. Microscopy shows slightly blurred particle edges (≈40 μm diameter) and a more uniform distribution, yielding a smoother surface. These microstructural differences cause diminished polarization performance.
(c)
Coated Sample 3
Demonstrates the strongest specular polarization, with reflection concentrated near φr = 0° and extending to θr = 75° (max DoLP > 0.30). Its low DoLP (<0.001) and uniform AoP in non-primary zones indicate minimal polarization fluctuations. The ultra-smooth surface with sub-5 μm particles exhibits near-ideal specular characteristics.
(d)
Fabric Sample 1
Displays fan-shaped high-polarization zones at high zenith angles (θr = 45–75°; φr = 300–60°) and a secondary zone at (θr = 30–75°; φr = 150–210°). The AoP shows distinct polar striations, reflecting fiber alignment. Microscopy confirms its tight plain weave texture as the origin of directional polarization.
(e)
Fabric Sample 2
A lower overall DoLP with no dominant reflection zone. Weakened AoP striations persist. The twill weave microstructure induces greater surface roughness and scattered light diffusion, reducing spatial polarization directionality.
(f)
Stainless Steel Sample
Exhibits the strongest polarization response (max DoLP > 0.30), intensifying at θr > 60° across all azimuths. AoP symmetry includes localized peaks at (θr = 60°; φr = 60°/300°). Uniform filament textures in microscopy confirm directional reflectivity as the polarization source.
Collective Analysis
Polarized reflection correlates strongly with microstructure, roughness, and macroscale texture. The specular materials (Samples 1–3 and Steel) show a high DoLP and smooth AoP, while the fabrics exhibit a low DoLP with texture-driven AoP variations. AoP striations effectively reveal fabric weave patterns, validating the system’s high-resolution directional discrimination capability.

5.2. Impact Analysis of Angular Errors on Polarization Information

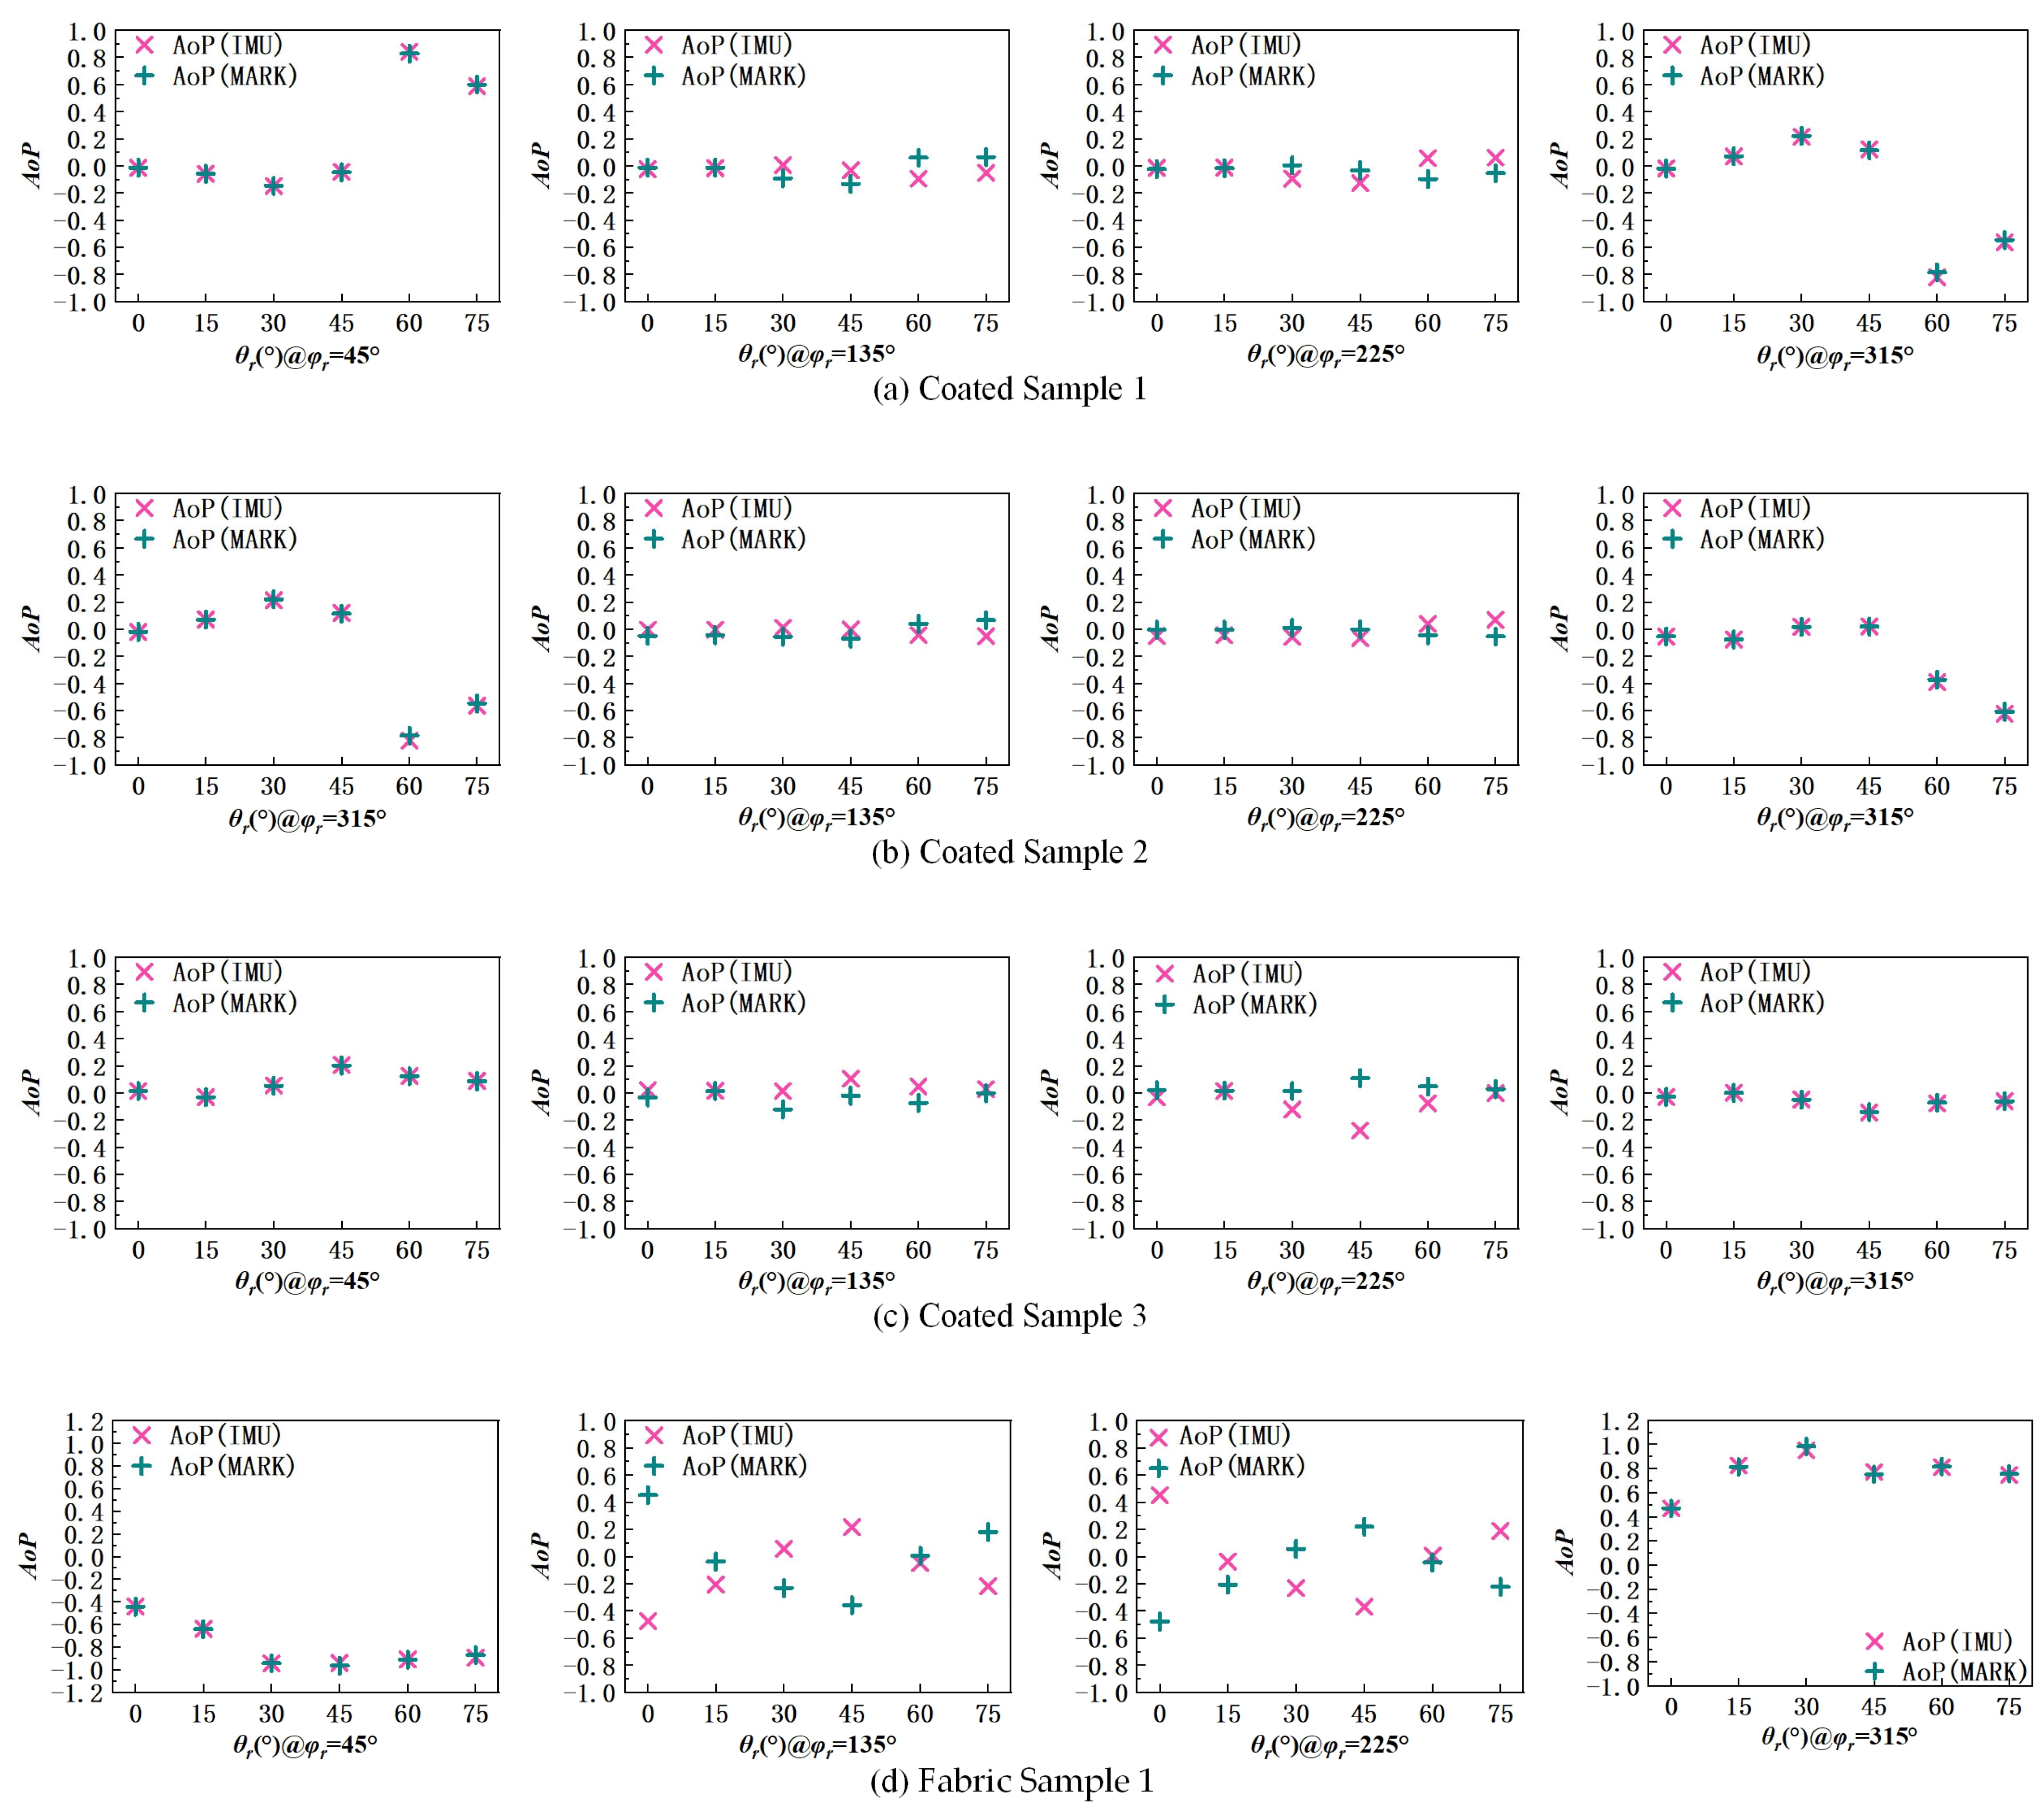
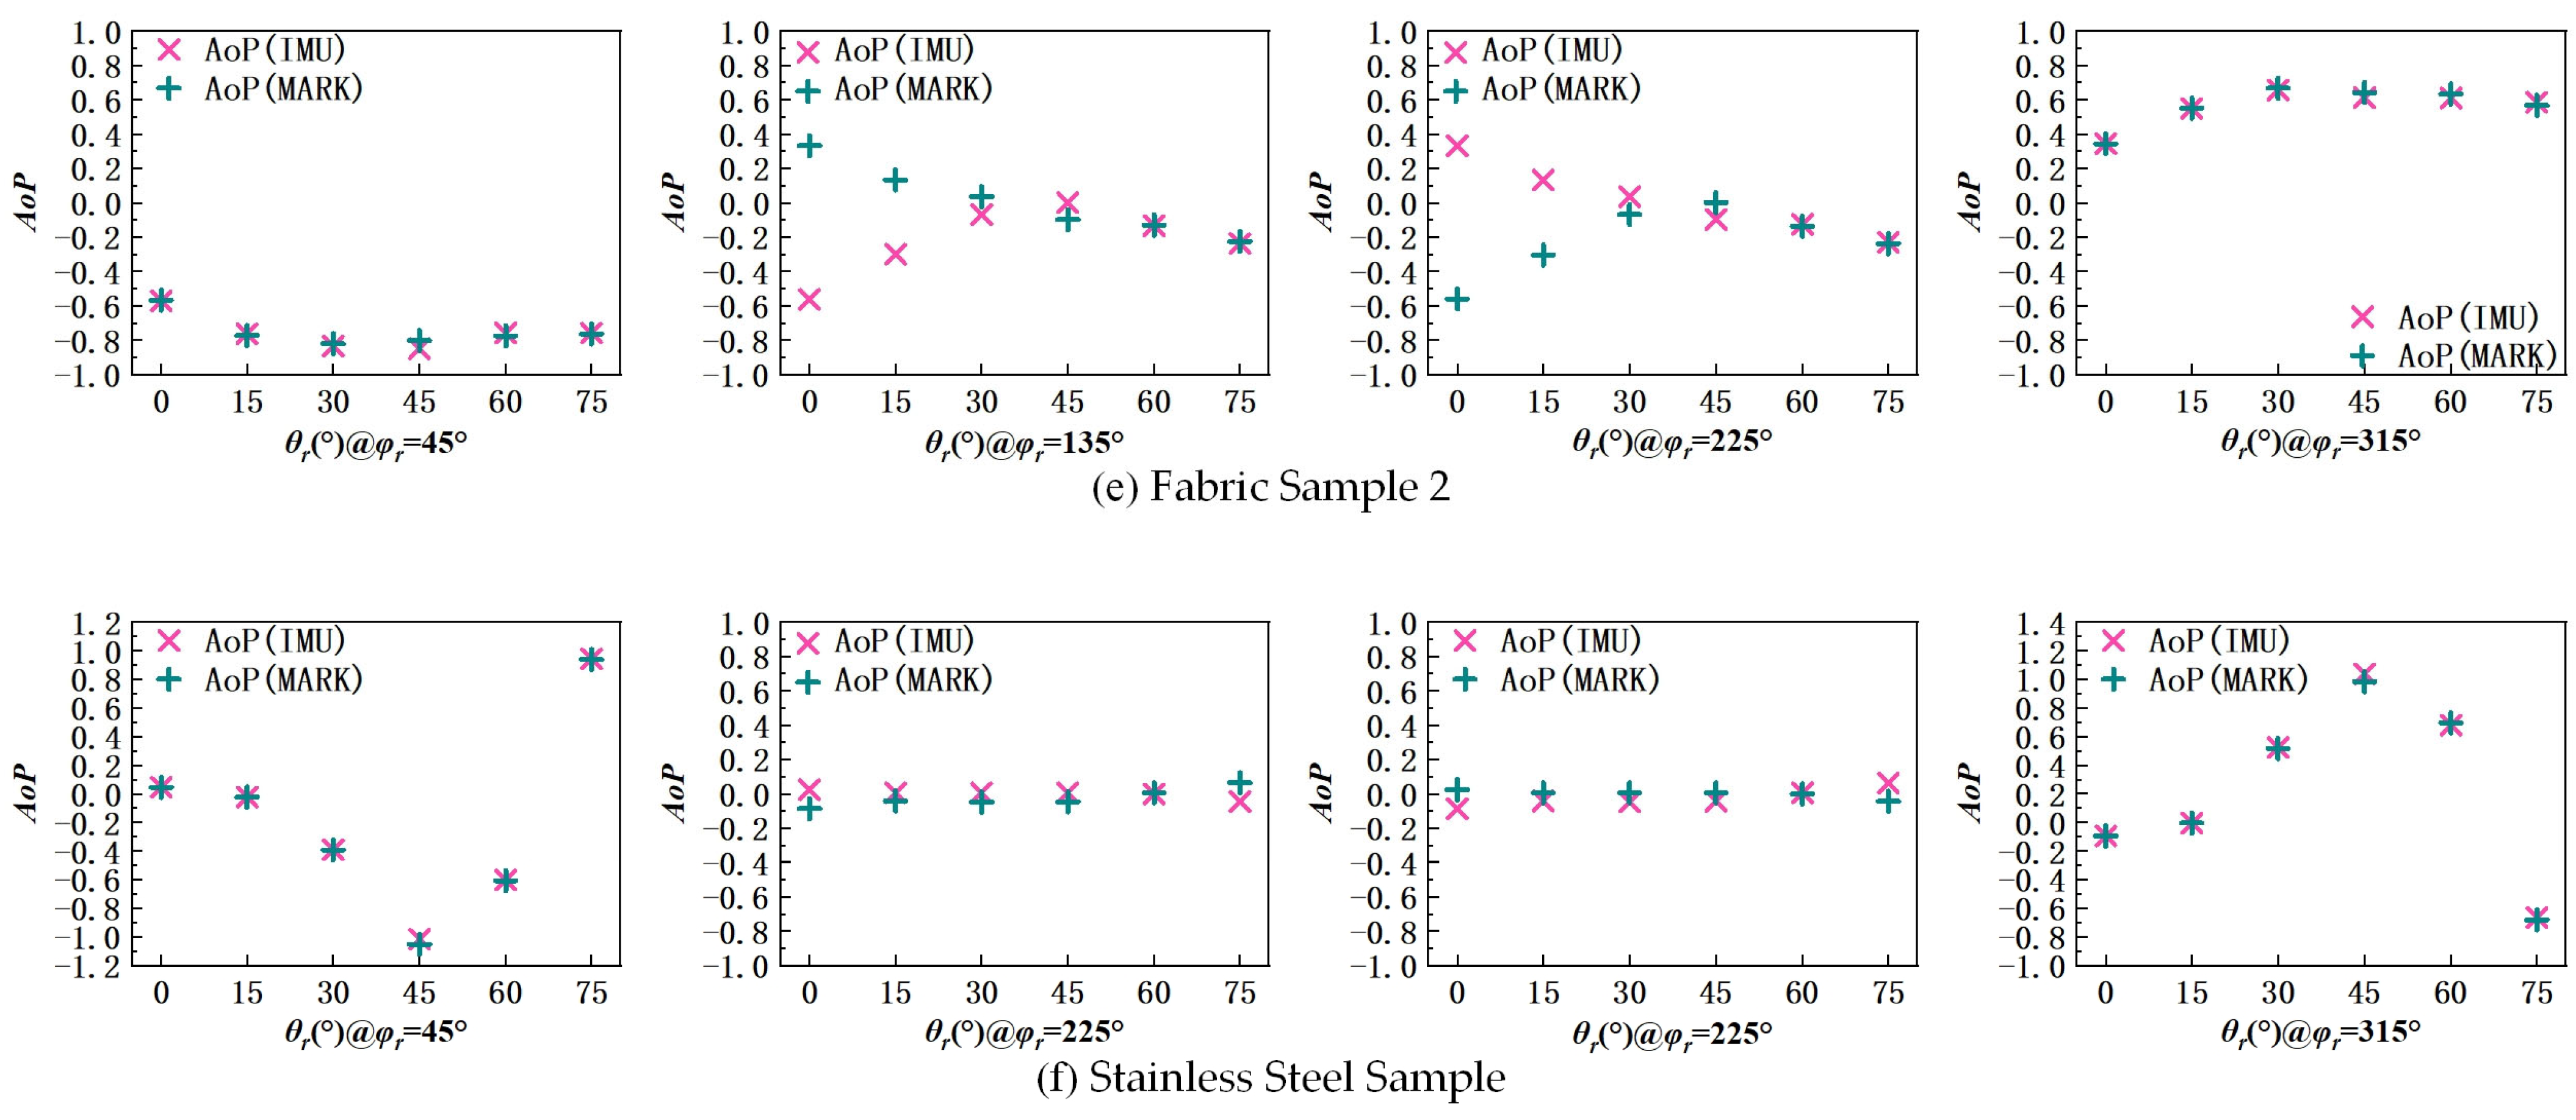
To further evaluate the impact of angular errors on polarization imaging, this study compares DoLP and AoP distributions generated from two angular inputs: nominal marked angles θ r m a r k and IMU-derived angles θ r I M U . To mitigate interference from occlusion, specular highlights, and source artifacts, two representative cross-axial directions (φr = 45° and 225°; φr = 135° and 315°) were selected as analysis regions, avoiding high-reflection zones while ensuring spatial stability and comparability of polarization data. Under each azimuthal condition, six material samples were imaged with identical zenith angle settings. The polarization results from inputs θ r m a r k and θ r I M U were extracted to quantify DoLP/AoP discrepancies, revealing angular error effects on polarization parameters. Figure 8 and Figure 9 visualize the DoLP and AoP difference distributions under both angle sources.
As evident from the DoLP comparison results presented in Figure 8, the overall DoLP values measured for all six samples under the condition using IMU feedback angles were generally higher than those obtained using the device-calibrated angles. This enhancement becomes more pronounced with increasing detection zenith angle. This trend aligns with the DoLP spatial distribution results shown in Figure 7, further indicating that the IMU angles provide a closer approximation to the true pose of the imaging system, thereby enabling more accurate capture of the reflection peak regions on material surfaces at specific angles.
Specifically, the coated samples and metal mirror samples (Coated Samples 1–3 and Stainless Steel Sample) exhibit distinct directionality and specular reflection characteristics. Consequently, their DoLP measurements are more sensitive to errors in the detection angle. Minor deviations in the input angle can lead to a shift in the reflection peak, significantly impacting the accurate extraction of DoLP. In contrast, the fabric samples (Fabric Sample 1 and Fabric Sample 2), characterized by highly anisotropic scattering, demonstrate a relatively uniform distribution of reflected energy across angular space, lacking a concentrated main reflection region. Therefore, the variation in the measured DoLP values between the two angle input conditions is less significant for these samples. This indicates that the DoLP in highly scattering, diffuse reflection materials is less sensitive to angle errors.
Figure 9 demonstrates that the AoP is significantly more sensitive to detection angle errors compared to DoLP, particularly exhibiting pronounced differences in the forward-scattering and backward-scattering directions. In the backward-scattering direction (φr = 45° and φr = 315°), the AoP distributions of all six materials show minimal variation, with limited changes across different zenith angles. This indicates that detection pose errors have a weaker impact on AoP in this orientation, suggesting good measurement stability of the system.
However, in the forward-scattering direction (φr = 135° and φr = 225°), the AoP values of the materials exhibit significant differences across zenith angles and display a characteristic AoP ambiguity. Specifically, symmetric but oppositely oriented distribution patterns emerge near the symmetry axes of φr = 0° and φr = 180°. This phenomenon is further amplified under large zenith angles. For the specular samples (Coated Samples 1–3 and Stainless Steel Sample), the AoP values are generally low and exhibit symmetric distributions. At a small θr, AoP approaches near-zero values but shows a slight increase and enhanced ambiguity tendency as θr increases. This indicates that angle errors near the high reflectance direction amplify directional disturbances in AoP.
In contrast, the fabric samples (Fabric Sample 1 and Fabric Sample 2), due to their anisotropic texture and strong scattering properties, exhibit pronounced fluctuations in AoP with varying detection angles. Fabric Sample 1 shows clear polar angle banding patterns and ambiguous distributions under multiple angles. Fabric Sample 2 displays significant ambiguity at small zenith angles (θr ≤ 45°), indicating greater susceptibility to pose errors during low-angle imaging. However, at large zenith angles (θr ≥ 60°), its AoP stabilizes, yielding consistent measurement results under both angle input conditions.
The above analysis reveals that AoP possesses higher sensitivity to angle errors. This sensitivity is particularly amplified in materials exhibiting distinct directional reflection characteristics or complex textural structures, manifesting as discontinuities in AoP distribution and the characteristic ambiguity phenomenon. In contrast, while DoLP demonstrates stronger overall robustness against interference, its peak localization also becomes dependent on pose accuracy at large zenith angles (θr), with errors demonstrating an increasing trend. These comparisons further validate the effectiveness of the proposed IMU-based closed-loop feedback mechanism in enhancing the accuracy of polarization imaging. They also underscore the necessity of image distortion correction and geometric error compensation within the polarization BRDF measurement system. Modeling and compensating for angle error sources not only improves parameter stability under high-angle imaging conditions but also provides more reliable precision support for multi-angle, full-space polarization characteristic analysis.

5.3. System Stability and Global Error Analysis

Based on the above detection experiments, two additional trials were conducted under identical conditions and with the same targets with the aim of evaluating the stability of the proposed system. The DoLP and AoP of six material samples were analyzed under θ r m a r k and sensor feedback θ r I M U , focusing on their mean and standard deviation (SD) to assess the effectiveness of this approach.
From the four plotted figures in Figure 10, the following trends can be observed:
DoLP measurement results:
The DoLP mean values obtained under IMU angles are overall close to those under MARK angles, but consistently exhibit slightly lower deviations across all sample–angle combinations, indicating that IMU feedback effectively corrects angular errors in the system.
The DoLP standard deviation (SD) under IMU angles is significantly lower than under MARK, particularly for samples with larger error fluctuations, where IMU reduces variability by approximately 20–40%. This highlights the advantage of IMU in suppressing measurement noise and improving repeatability.
AoP measurement results:
The AoP mean values obtained with IMU are closer to the ground truth than those with MARK, with more pronounced improvements in high-reflection regions, where the average error is reduced by about 10–45%, ensuring spatial phase continuity.The AoP standard deviation under IMU is also noticeably reduced, in most cases by 10–37%, demonstrating the improved measurement stability of the system.
In summary, analysis of the four figures confirms that IMU feedback not only reduces systematic errors in single-point measurements but also significantly enhances global measurement stability and repeatability. Improvements in the mean and standard deviation of DoLP and AoP validate the reliability of the proposed BRDF imaging measurement system in continuous multi-angle detection, providing a solid data foundation for subsequent material optical property analyses and 3D reconstruction.

6. Discussion

The IMU-assisted BRDF measurement system developed in this study enables high-precision measurement of azimuth, zenith angles, and polarization parameters. With the incorporation of IMU sensors, the system achieves closed-loop feedback control, allowing more precise angular positioning and reducing the maximum zenith angle error by approximately 1.2°, effectively enhancing overall measurement accuracy. For target polarization measurements, errors in AoP and DoLP were reduced by approximately 5% and 7%, respectively. Compared with existing systems, the device in [14] is large (≥5 m) and requires a trailer for field deployment, whereas the present BRDF system can be disassembled into several modules for transport and quickly deployed to the measurement location. Moreover, with a span of 2000 mm, the system can detect large-scale targets and even perform 3D reconstruction of samples with volumetric features, which is not achievable by the systems in [13,15]. Although its measurement accuracy cannot match high-precision robotic arms or rapid measurement devices, the system allows arbitrary-angle measurements within a hemispherical space and achieves rapid high-precision acquisition with errors below 0.05° through motorized motion and IMU feedback. Importantly, the system can be integrated with other instruments, freely select light sources, support point sources such as lasers for imaging tests, and impose minimal optical system requirements—capabilities that devices like [20] cannot provide.

7. Conclusions

This study establishes an inertial measurement unit (IMU)-enhanced bidirectional reflectance distribution function (BRDF) imaging system to address angular errors in multi-angle polarimetric measurements. With IMU-based closed-loop feedback, the system reduces zenith angle errors by up to ~1.2°. A comparative analysis across six material samples demonstrates that IMU feedback not only improves DoLP peak localization and enhances AoP spatial phase continuity but also significantly lowers measurement fluctuations: the standard deviation of DoLP decreases by ~20–40% and AoP by ~10–37% compared with marker-based angles. These results confirm that the system provides both local accuracy and global stability in polarization measurements.
Beyond error reduction, the system adopts a modular lightweight architecture with a 2000 mm rail span, supporting rapid deployment, large-scale material characterization, and even three-dimensional reconstruction of volumetric targets—capabilities that surpass conventional tabletop devices. Motorized motion combined with real-time IMU feedback achieves an angular precision of ~0.05°, while flexibly integrating diverse light sources.
In summary, the proposed IMU-assisted BRDF imaging system demonstrates high angular precision, enhanced measurement stability, and strong scalability. By ensuring reliable and repeatable acquisition of DoLP and AoP parameters, it provides a robust platform for material optical analysis, machine vision, and 3D reconstruction. Future research will focus on further automating the measurement process to reduce manual intervention and enhance efficiency. Additionally, integrating spectral cameras could expand the system’s capabilities to capture wavelength-dependent reflectance, enabling more comprehensive material characterization and extending applications in remote sensing and multispectral imaging.

Author Contributions

Writing—original draft, Z.L.; writing—review and editing, Y.T. and J.Z. (Jianwei Zhou); investigation, Z.L., Z.Q. (Zheng Qiu), H.W. and Z.Q. (Zhicheng Qin); data curation, Z.Q. (Zheng Qiu); conceptualization, Y.Z.; formal analysis, H.S., Y.Z. and J.W.; funding acquisition, Y.Z.; methodology, Z.L. and J.W.; project administration, Y.T.; resources, J.Z. (Jianwei Zhou); software, H.S., F.C. and Z.W.; supervision, Y.T.; validation, J.Z. (Jingran Zhong); visualization, Z.Q. (Zheng Qiu). All authors have read and agreed to the published version of the manuscript.

Funding

This research was funded by the Jilin Province Science and Technology Development Project (20240402068GH).

Institutional Review Board Statement

Not applicable.

Informed Consent Statement

Not applicable.

Data Availability Statement

The data underlying the results presented in this paper are not publicly available at this time but may be obtained from the authors upon reasonable request.

Conflicts of Interest

The authors declare no conflicts of interest.

References

  1. Nicodemus, F.E. Directional reflectance and emissivity of an opaque surface. Appl. Opt. 1965, 4, 767–775. [Google Scholar] [CrossRef]
  2. Guo, F.; Zhu, J.; Huang, L.; Li, H.; Deng, J.; Zhang, X.; Wang, K.; Liu, H.; Hou, X. A modified BRDF model based on Cauchy-Lorentz distribution theory for metal and coating materials. Photonics 2023, 10, 773. [Google Scholar] [CrossRef]
  3. Fankhauser, F.; Tyson, J.A.; Askari, J. Satellite optical brightness. Astron. J. 2023, 166, 59. [Google Scholar] [CrossRef]
  4. Gatebe, C.K.; King, M.D. Airborne spectral BRDF of various surface types (ocean, vegetation, snow, desert, wetlands, cloud decks, smoke layers) for remote sensing applications. Remote Sens. Environ. 2016, 179, 131–148. [Google Scholar] [CrossRef]
  5. Zhou, Y. An overview of BRDF models in computer graphics. Theor. Nat. Sci. 2023, 19, 205–210. [Google Scholar] [CrossRef]
  6. Kumar, H.; Ramkumar, J.; Venkatesh, K.S. Surface texture evaluation using 3D reconstruction from images by parametric anisotropic BRDF. Measurement 2018, 125, 612–633. [Google Scholar] [CrossRef]
  7. Yang, Z.; Zhang, S.; Li, Y.; Xu, Q.; Wang, L.; Gong, L. Study on the BRDF for the surfaces of typical metal materials. Coatings 2025, 15, 344. [Google Scholar] [CrossRef]
  8. Lu, M.; Zhang, S.; Wang, Z. Establishment and verification of diffraction BRDF model for scratched material surface. Opt. Laser Eng. 2021, 142, 106597. [Google Scholar] [CrossRef]
  9. Taglione, C.; Mateo, C.; Stolz, C. Polarimetric imaging for robot perception: A review. Sensors 2024, 24, 4440. [Google Scholar] [CrossRef] [PubMed]
  10. Abbasi Habashi, S.; Koyuncu, M.; Alizadehsani, R. A survey of COVID-19 diagnosis using routine blood tests with the aid of artificial intelligence techniques. Diagnostics 2023, 13, 1749. [Google Scholar] [CrossRef]
  11. Torrance, K.E.; Sparrow, E.M. Theory for off-specular reflection from roughened surfaces. J. Opt. Soc. Am. 1967, 57, 1105–1114. [Google Scholar] [CrossRef]
  12. Miettinen, J.; Harkonen, A.K.; Piironen, T.H. Optical scattering measurement instrument for the design of machine vision illumination. In Optics, Illumination, and Image Sensing for Machine Vision VI; SPIE: Bellingham, WA, USA, 1992; Volume 1614, pp. 45–56. [Google Scholar] [CrossRef]
  13. Höpe, A.; Atamas, T.; Hünerhoff, D.; Schröder, S.; Schäfer, S. ARGon3: “3D Appearance Robot-Based Gonioreflectometer” at PTB. Rev. Sci. Instrum. 2012, 83, 045102. [Google Scholar] [CrossRef]
  14. Doctor, K.Z.; Bachmann, C.M.; Gray, D.J.; Montes, M.J.; Fusina, R.A. Wavelength dependence of the bidirectional reflectance distribution function (BRDF) of beach sands. Appl. Opt. 2015, 54, F243–F255. [Google Scholar] [CrossRef]
  15. Huang, B.; Peng, B.; Ren, Q.; Liao, S. Modeling and analysis of spectral polarization BRDF based on microfacet theory. J. Quant. Spectrosc. Radiat. Transfer 2024, 313, 108830. [Google Scholar] [CrossRef]
  16. Margall, F.; Lemineur, G.; Pacanowski, R.; Mavromatis, S.; Coiro, E.; Le Goff, A.; Ceolato, R. Supercontinuum laser-based gonio-scatterometer for in and out-of-plane spectral BRDF measurements. Opt. Express 2024, 32, 25581–25597. [Google Scholar] [CrossRef] [PubMed]
  17. Li, Z.; Li, Y.; Liu, Z. High-precision BRDF measurement system in near infrared band. Acta Opt. Sin. 2022, 42, 1212002. [Google Scholar] [CrossRef]
  18. Dana, K.J. BRDF/BTF measurement device. In Proceedings of the Eighth IEEE International Conference on Computer Vision (ICCV 2001), Vancouver, BC, Canada, 7–14 July 2001; IEEE: Los Alamitos, CA, USA, 2001; Volume 2, pp. 460–466. [Google Scholar] [CrossRef]
  19. Ren, J.; Zhao, J. Measurement of a bidirectional reflectance distribution and system achievement based on a hemi-parabolic mirror. Opt. Lett. 2010, 35, 1458–1460. [Google Scholar] [CrossRef]
  20. Ben-Ezra, M.; Wang, J.; Wilburn, B.; Nayar, S.K. An LED-only BRDF measurement device. In Proceedings of the 2008 IEEE Conference on Computer Vision and Pattern Recognition (CVPR), Anchorage, AK, USA, 23–28 June 2008; IEEE: New York, NY, USA, 2008; pp. 1–8. [Google Scholar] [CrossRef]
  21. Cao, H.; You, D.; Ji, D.; Gu, X.; Wen, J.; Wu, J.; Li, Y.; Cao, Y.; Cui, T.; Zhang, H. The method of multi-angle remote sensing observation based on unmanned aerial vehicles and the validation of BRDF. Remote Sens. 2023, 15, 5000. [Google Scholar] [CrossRef]
  22. Kim, M.; Jin, C.; Lee, S.; Kim, K.-M.; Lim, J.; Choi, C. Calibration of BRDF based on the field goniometer system using a UAV multispectral camera. Sensors 2022, 22, 7476. [Google Scholar] [CrossRef] [PubMed]
  23. Latini, D.; Petracca, I.; Schiavon, G.; Cisbani, A.; Loizzo, R.; d’Andrimont, R. UAV-based observations for surface BRDF characterization. In Proceedings of the 2021 IEEE International Geoscience and Remote Sensing Symposium (IGARSS), Brussels, Belgium, 11–16 July 2021; IEEE: New York, NY, USA, 2021; pp. 8193–8196. [Google Scholar] [CrossRef]
  24. Mazumder, N.; Deka, G.; Wu, W.W.; Kao, F.J.; Chiou, A. Polarization resolved second harmonic microscopy. Methods 2017, 128, 105–118. [Google Scholar] [CrossRef] [PubMed]
  25. Reztsov, T.V.; Chernykh, A.V.; Orlova, T.; Petrov, N.V. A dynamic analysis of toron formation in chiral nematic liquid crystals using a polarization holographic microscope. Polymers 2025, 17, 1849. [Google Scholar] [CrossRef]
  26. Bozhok, A.; Dellinger, J.; Takakura, Y.; Laude-Boulesteix, B.; Torcal-Milla, F.J.; Depeursinge, C. Fourier ptychographic microscopy and Mueller matrix microscopy: Differences and complementarity. In Proceedings of the Unconventional Optical Imaging II, Online Only, 20–23 April 2020; SPIE: Bellingham, WA, USA, 2020; Volume 11351, pp. 224–232. [Google Scholar] [CrossRef]
  27. Fu, Q.; Liu, X.; Yang, D.; Zhan, J.; Liu, Q.; Zhang, S.; Wang, F.; Duan, J.; Li, Y.; Jiang, H. Improvement of pBRDF model for target surface based on diffraction and transmission effects. Remote Sens. 2023, 15, 3481. [Google Scholar] [CrossRef]
  28. Chen, F.; Chen, G.; Zhang, Y. Analysis of scattering characteristics of coating materials through coupling of BRDF spectral polarization imaging with Torrance–Sparrow model. Optoelectron. Lett. 2025, 21, 271–277. [Google Scholar] [CrossRef]
  29. Butler, S.D.; Marciniak, A.M.A. Utilization and efficient computation of polarization factor Q for fast, accurate BRDF modeling. Opt. Express 2022, 30, 5803–5816. [Google Scholar] [CrossRef]
  30. Sui, C.; Tan, Y.; Zhang, Y. Fiber evidence identification based on spectral bidirectional reflectance distribution function. Acta Opt. Sin. 2021, 41, 0930001. [Google Scholar] [CrossRef]
  31. d’Eon, E.; Weidlich, A. VMF Diffuse: A unified rough diffuse BRDF. Comput. Graph. Forum 2024, 43, 15149. [Google Scholar] [CrossRef]
  32. Yang, S.; Su, H. Fast geometric sampling for Phong-like reflection. In Advances in Computer Graphics. CGI 2023, Lecture Notes in Computer Science; Sheng, B., Bi, L., Kim, J., Magnenat-Thalmann, N., Thalmann, D., Eds.; Springer: Cham, Switzerland, 2023; Volume 14496, pp. 211–222. [Google Scholar] [CrossRef]
  33. Badura, G.P.; Valenta, C.R.; Gunter, B. Convolutional neural networks for inference of space object attitude status. J. Astronaut. Sci. 2022, 69, 593–626. [Google Scholar] [CrossRef]
  34. Zhang, Z.; Yang, Z.; Li, G.; Chen, D.; Wang, X. Degree of polarization model based on a modified three-component pBRDF. Appl. Opt. 2023, 62, 4777–4785. [Google Scholar] [CrossRef] [PubMed]
  35. Zhao, Y.; Tian, Y.; Lei, S.; Li, Y.; Hua, X.; Guo, D.; Ji, C. A comprehensive correction method for radiation distortion of multi-strip airborne hyperspectral images. Remote Sens. 2023, 15, 1828. [Google Scholar] [CrossRef]
  36. Cao, Y.; Cao, Y.; Wu, Z.; Yang, K. A calculation method for the hyperspectral imaging of targets utilizing a ray-tracing algorithm. Remote Sens. 2024, 16, 1779. [Google Scholar] [CrossRef]
  37. Ye, Y.; Tan, Y.; Jin, G. Accurate measurement for damage evolution of ceramics caused by nanosecond laser pulses with polarization spectrum imaging. Opt. Express 2019, 27, 16360–16376. [Google Scholar] [CrossRef] [PubMed]
  38. Cristóbal, J.; Graham, P.; Prakash, A.; Buchhorn, M.; Gens, R.; Guldager, N.; Bertram, M. Airborne hyperspectral data acquisition and processing in the Arctic: A pilot study using the Hyspex imaging spectrometer for wetland mapping. Remote Sens. 2021, 13, 1178. [Google Scholar] [CrossRef]
  39. Wang, Y.; Su, Y.; Sun, X.; Hao, X.; Liu, Y.; Zhao, X.; Li, H.; Zhang, X.; Xu, J.; Tian, J. Principle and implementation of Stokes vector polarization imaging technology. Appl. Sci. 2022, 12, 6613. [Google Scholar] [CrossRef]
  40. Zhang, Z. Camera Calibration. In Computer Vision: A Reference Guide; Springer International Publishing: Cham, Switzerland, 2021; pp. 130–131. [Google Scholar] [CrossRef]
Figure 1. Geometric representation of BRDF based on microfacet theory. (a) BRDF geometric configuration: Based on the BRDF principle, the incident and reflected angles are defined and decomposed into the incident zenith angle θi and azimuth angle φi, as well as the reflected zenith angle θr and azimuth angle φr, in the spatial coordinate system. Azimuth angles φi and φr are referenced to the x-axis and measured counterclockwise from 0° to 360°; zenith angles θi and θr are defined relative to the z-axis with a range of 0° to 90°. (b) Surface normal direction distribution based on the microfacet theory: From a microscopic perspective, different surfaces are assigned distinct colors, and each microfacet possesses its own unique normal direction. The size of the microfacets does not have a fixed value but is generally in the range of 10–100 nm or within the sub-wavelength scale. (c) Different detection angles yield different imaging results: The red arrow represents the incident light, and the yellow arrow indicates the reflected light. From a macroscopic perspective, the detection performance is greatly affected by the angle, primarily because variations in the overall orientation distribution of microfacets lead to differences in the detected results.
Applsci 15 09313 g001
Figure 2. BRDF measurement apparatus. (a) Integrated bidirectional reflectance distribution function (BRDF) measurement system, showing the combined configuration of the horizontal circular rail and the zenithal arcuate rail; (b) mobile slide carriage equipped with an imaging detector, secured to the outer side of the zenithal arcuate rail via grooved pulleys; (c) horizontal circular rail, installed on the ground to adjust the azimuth angle φr and support the zenithal arcuate rail, designed in detachable modular sections for ease of transport and relocation; (d) zenithal arcuate rail, used for adjusting the zenith angle θr, also designed with detachable modular sections; (e) stepper motor arrangement, with two motors driving the motion of the zenithal arcuate rail and a third motor pulling the mobile slide carriage along the rail via a steel cable; (f) schematic of rail deformation (Δh) caused by the self-weight of the zenithal arcuate rail and the detector weight (G), leading to structural flattening; (g) IMU sensor attitude control schematic, where the sensor is mounted on the detector within aluminum housing to enhance rigidity and electromagnetic shielding, with its three axes precisely aligned to the camera’s orientation for real-time spatial attitude acquisition; (h) control logic diagram of the BRDF measurement system, in which the operator sets the desired detection angles in the host controller, the controller drives the stepper motors to the target positions, the IMU sensor provides continuous angular feedback for closed-loop control, and the camera is triggered for image capture once the target position is reached.
Applsci 15 09313 g002
Figure 3. Distribution and analysis of discrepancies between measured azimuth angle φ r m a r k and nominal azimuth angle φ r I M U . (a) Analysis of azimuth angle errors from three measurements. (b) First test azimuth error. (c) Second test azimuth error. (d) Third test azimuth error.
Applsci 15 09313 g003
Figure 4. Distribution and analysis of discrepancies between the measured zenith angle θ r I M U and the nominal zenith angle θ r m a r k . (a) Error analysis of zenith angles from three measurements. (b) Zenith angle error in the first test. (c) Zenith angle error in the second test. (d) Zenith angle error in the third test.
Applsci 15 09313 g004
Figure 5. Calibration imaging experiment.
Applsci 15 09313 g005
Figure 6. Image calibration process and comparison of images before and after calibration.
Applsci 15 09313 g006
Figure 7. Polarization scattering distribution of the specimens in space. (a) Coated Sample 1; (b) Coated Sample 2; (c) Coated Sample 3; (d) Fabric Sample 1; (e) Fabric Sample 2; (f) Stainless Steel Sample.
Applsci 15 09313 g007aApplsci 15 09313 g007b
Figure 8. The differences in DoLP detection observed when the six samples were detected under the device’s nominal zenith angle θ r I M U and the IMU’s feedback zenith angle θ r m a r k .
Applsci 15 09313 g008aApplsci 15 09313 g008b
Figure 9. The differences in AoP detection observed when the six samples were detected under the device’s nominal zenith angle θ r I M U and the IMU’s feedback zenith angle θ r m a r k .
Applsci 15 09313 g009aApplsci 15 09313 g009b
Figure 10. Comparison of mean values and standard deviations of the DoLP and AoP for six samples under mark-based angles ( θ r m a r k ) and sensor-feedback angles ( θ r I M U ).
Applsci 15 09313 g010
Disclaimer/Publisher’s Note: The statements, opinions and data contained in all publications are solely those of the individual author(s) and contributor(s) and not of MDPI and/or the editor(s). MDPI and/or the editor(s) disclaim responsibility for any injury to people or property resulting from any ideas, methods, instructions or products referred to in the content.