Article

Synergistic Valorization of Refuse-Derived Fuel and Animal Fat Waste Through Dry and Hydrothermal Co-Carbonization

1
VALORIZA—Research Center for Endogenous Resource Valorization, Portalegre Polytechnic University, Campus Politécnico 10, 7300-555 Portalegre, Portugal
2
MEtRICs—Mechanical Engineering and Resource Sustainability Center, NOVA School of Science and Technology (FCT NOVA), NOVA University of Lisbon, Campus Caparica, 2829-516 Caparica, Portugal
*
Authors to whom correspondence should be addressed.
Appl. Sci. 2025, 15(17), 9315; https://doi.org/10.3390/app15179315
Submission received: 4 August 2025 / Revised: 17 August 2025 / Accepted: 22 August 2025 / Published: 25 August 2025
(This article belongs to the Special Issue Advances in Bioenergy from Biomass and Waste)

Abstract

The demand for clean energy to improve waste valorization and enhance resource utilization efficiency has been increasingly recognized in the last few years. In this context, the co-carbonization of different waste streams, aiming at solid fuel production, appears as a potential strategy to address the challenges of the energy transition and divert waste from landfills. In this work, refuse-derived fuel (RDF) samples were subjected to the co-carbonization process with low-quality animal fat waste in different proportions to assess the synergistic effect of the mixture on producing chars with enhanced fuel properties. Dry (DC) and hydrothermal carbonization (HTC) tests were conducted at 425 °C and 300 °C, respectively, with a residence time of 30 min. The RDF sample and produced chars with different animal fat incorporation were analyzed for their physical, chemical, and fuel properties. The results demonstrated that increasing the fat proportion in the samples leads to an increase in mass yield and apparent density of the produced chars. Furthermore, char samples with higher fat addition presented a proportional increase in high heating value (HHV). The highest values for the HHV corresponded to the char samples produced with 30% fat incorporation for both carbonization techniques (27.9 MJ/kg and 32.9 MJ/kg for dry and hydrothermal carbonization, respectively). Fat addition also reduced ash content, improved hydrophobicity in hydrochars, and lowered ignition temperature, although additional washing was necessary to reduce chlorine to acceptable levels. Furthermore, fat incorporation reduced concentrations of elements linked to slagging and fouling. Overall, the results demonstrate that incorporating 30% fat into RDF during DC or HTC is the most effective condition for producing chars with improved physical, chemical, and fuel properties, enhancing their potential as alternative solid fuels.

1. Introduction

Energy recovery from waste has proven to be a promising strategy for better resource utilization, as it contributes to the partial replacement of fossil fuels and the diversion of fractions with a significant high heating value (HHV) from landfill disposal. However, one of the major challenges in converting municipal solid waste (MSW) into energy is its low energy density, high moisture content, and the heterogeneity of its different fractions [1]. Some studies suggested that mixing different waste streams can lead to a synergistic effect, meaning that the combined processing of these materials results in improvements in energy conversion efficiency greater than the sum of their separate effects [2]. This synergistic interaction can arise from complementary chemical compositions, enhanced reaction pathways, or improved physicochemical properties of the resulting chars. However, it is important to recognize that such synergistic effects may come with some uncertainty or variability in results due to feedstock heterogeneity and process conditions, which may be reflected in factors such as experimental precision and potential hazards related to emissions or product stability [3,4,5].
The refuse-derived fuel (RDF) production approach plays a significant role in diverting the combustible fraction of municipal solid waste (MSW) from landfills that it is not feasible to recycle. A typical RDF sample from MSW produced after mechanical-biological treatment consists of varying proportions of plastics, paper, textiles, wood, and other fractions, such as glass and metals, in lower concentrations [6]. Since RDF itself is a highly diverse waste with challenges in using it as an alternative fuel due to the high ash and chlorine contents, and low HHV [7], integrating other waste streams emerges as an alternative to enhance fuel properties and simultaneously improve the physical characteristics of the biochars.
Carbonization as a pre-treatment for the production of homogeneous chars is widely described in the valorization of biomass waste [8,9,10,11] and, recently, has been applied to other waste streams such as RDF [7,12,13,14]. However, due to the high variation in the composition of this waste, it is essential to assess the most suitable conditions to ensure complete carbonization of all waste components and minimize particle aggregation caused by the melting of the plastics fraction. Another way to mitigate these issues is to blend different residues to assess the synergistic effect of multiple waste streams on upgrading biochar production. In this context, the co-carbonization of mixed wastes appears as a promising pre-treatment to produce chars with enhanced fuel properties [15,16].
On the other hand, the energy recovery of mixed waste streams has been gaining greater notoriety in the hydrothermal carbonization (HTC) process, mainly with the use of sewage sludge [17,18,19], food waste [20,21,22], agro-industrial residues [23,24,25], and animal husbandry waste [26,27,28], and in the dechlorination of plastic waste with high chlorine content [29,30,31,32]. The advantage of this process is that it allows moist residues without the need for a pre-drying step, and it requires lower energy demand by applying milder temperatures. Additionally, the dissolution of chlorine-soluble species and other inorganics in the process water during hydrothermal carbonization reduces these components in the biochars, thereby improving their caloric value and minimizing gas-chlorine release during combustion [33]. Recently, co-hydrothermal carbonization has been described in several works as an efficient method to produce high-quality biochars, whether for energetic purposes [2,34] or for soil conditioner [35,36] and low-cost adsorbents [37], among other applications. Yas et al. [38] reported the co-HTC of high-lipid duck manure and biomass waste to produce hydrochars with high carbon and energy content for energetic valorization purposes.
Usually, fat residues that cannot be used as by-products in the food and pharmaceutical industries or the production of animal feed are valued in the production of liquid biofuels from esterification [39,40,41] and transesterification [42,43,44] processes. Low-quality fats, characterized by a high rate of degradation and originating from sick animals (category 1), although intended for biodiesel production, have a low conversion rate and, consequently, reduce the process efficiency [45]. Therefore, finding alternative forms of recovery for this waste fraction can be a solution to maximize energy recovery and enhance the valorization of livestock wastes.
This work investigates the effects of incorporating low-quality animal fat waste into RDF in proportions of 0%, 10%, 20%, and 30% by mass on the performance of DC at 425 °C and HTC at 300 °C for 30 min. This study evaluates how fat addition influences key fuel characteristics, including mass yield, apparent density, proximate and ultimate composition, and higher heating value, as well as its effect on undesirable components such as chlorine and ash-forming elements and their implications for slagging and fouling. Thermal degradation behavior, surface functional groups, and the chemical composition of process effluents are also examined. The ultimate aim is to determine the fat incorporation level that most effectively enhances the physical, chemical, and combustion properties of the resulting chars and hydrochars for energy recovery applications.

2. Materials and Methods Introduction

2.1. Feedstock

The RDF sample used in this work was produced from MSW and treated at a mechanical-biological treatment (MBT) station. It was supplied by Braval S.A., a Portuguese waste management company. The waste is composed of a mixture of plastic (26.3 ± 2.7%), textiles (22.8 ± 3.9%), paper (15.1 ± 3.7%), wood (2.6 ± 0.4%), aluminum (2.4 ± 0.3%) and debris (30.8 ± 2.6%) and had an initial moisture content of 5.9%. The debris corresponds to a mixture of other small particle-sized fractions, mainly composed of mineral and inert materials such as sand, small rock fragments, and soil particles, which are embedded within the waste matrix and therefore difficult to separate using conventional mechanical sorting methods. The aluminum fraction was removed from the samples prior to conducting the carbonization tests. The low-quality fat (category 1) was provided by ETSA (animal by-product treatment company), a Portuguese company focused on the energetic and material valorization of animal processing by-products. The percentages of RDF and fat selected (0%, 10%, 20%, and 30%) were chosen to represent a progressive incorporation of fat while maintaining the RDF fraction as the main component, in order to preserve the structural characteristics and handling properties of the feedstock. Higher fat ratios, such as 40% or 50% were not tested because preliminary trials indicated that excessive fat content compromised sample homogeneity and handling during preparation and reactor loading [46,47,48]. Figure 1 shows the raw waste samples used in the carbonization experiments.

2.2. Carbonization Tests

Before carbonization, the samples were prepared by incorporating different percentages of fat wastes into the RDF and mixing them to ensure a homogeneous distribution. Four samples were prepared with 0%, 10%, 20%, and 30% fat incorporation and submitted to dry (DC) and hydrothermal carbonization (HTC) experiments, as summarized in Table 1.
The DC tests were performed in a L3/1106 muffle furnace (Nabertherm®, Lilienthal, Germany). Each sample was submitted to a temperature of 425 °C for 30 min in five tests to assess an average mass yield and support the washing process and char characterization. Carbonization was carried out in 250 mL capacity covered porcelain crucibles with approximately 40 g of sample. The DC temperature was selected based on common operational ranges for producing chars with good fuel properties from RDF, while minimizing excessive devolatilization. In contrast, HTC was conducted at 300 °C because this temperature is within the optimal range for hydrothermal reactions in saturated water, promoting carbonization without causing excessive pressure build-up in the reactor [49,50,51].
The HTC tests were conducted in a 1 L capacity reactor (Parr Instruments, Moline, IL, USA) with a solid-liquid ratio (S/L) of 1:4 (wt.) under saturated pressure. The tests were conducted at 300 °C for 30 min. After each test, the hydrochars were filtered and placed in an oven at 105 °C for 24 h. Only the liquid effluents from the 70RDF30F mixtures and the corresponding 100RDF were analyzed, as these two cases represent the extreme compositions in this study, allowing assessment of the maximum expected variation in effluent characteristics due to fat incorporation, while reducing the analytical workload without compromising the interpretation of results [49].
The liquid effluents from the process were collected in glass bottles and stored for further analysis. In both processes, the chars were allowed to cool in a desiccator and then weighed to determine the mass yield. Subsequently, they were stored in glass vials for further analysis.

2.3. Chars, Hydrochars, and Effluent Characterization

The chars and hydrochars produced in the DC and HTC tests were characterized by their physical, chemical, and fuel properties. Moreover, the char-washing wastewater and the HTC liquid effluent were analyzed in samples of solely RDF pellets and those with 30% fat incorporation, which are summarized in Table 2.
M a s s   y i e l d   % ,   d b = m c h a r m r a w × 100
A p p a r e n t   d e n s i t y   ( g / c m 3 ) = m c h a r   ( g ) v c h a r   ( c m 3 )
where mchar and vchar are the mass and volume of the chars, respectively; mraw is the mass of raw RDF samples.
Ignition temperature (Ti) and burnout temperature (Tb) were calculated according to the intersection method described by Liu et al. [57]. The fouling and slagging index of the ashes was calculated in accordance with Ovčačíková et al. [58].

2.4. Char Washing for Chlorine Removal

Char washing with hot water was performed to assess the reduction in chlorine content. The char samples were mixed with distilled water in open glass beakers in a solid-to-liquid (S/L) ratio of 1:5 (wt.) and subsequently heated to the boiling point. The samples were then allowed to cool to room temperature and filtered. The washed chars underwent a drying process in an oven (Memmert, Büchenbach, Germany) at 105 ± 2 °C for 24 h. Subsequently, the chlorine content and HHV were measured in the chars post-washing, utilizing the same methodology as before the washing process.

3. Results

3.1. Dry and Hydrothermal Carbonization Tests

DC and HTC of RDF with varying percentages of fat incorporation yielded chars and hydrochars with a dark and homogeneous appearance, indicating the complete conversion of the various components in the samples. The solid fraction produced after the carbonization processes (mainly hydrochars) showed a tendency for particles to agglomerate with increased fat incorporation. However, it is worth noting that this aggregation is not comparable to that observed after the carbonization of RDF at low temperatures, where the incomplete conversion of plastics results in agglomerates that are difficult to crush. For samples with fat incorporation, larger particles are more brittle and, consequently, are more easily reduced to smaller particle sizes after grinding.
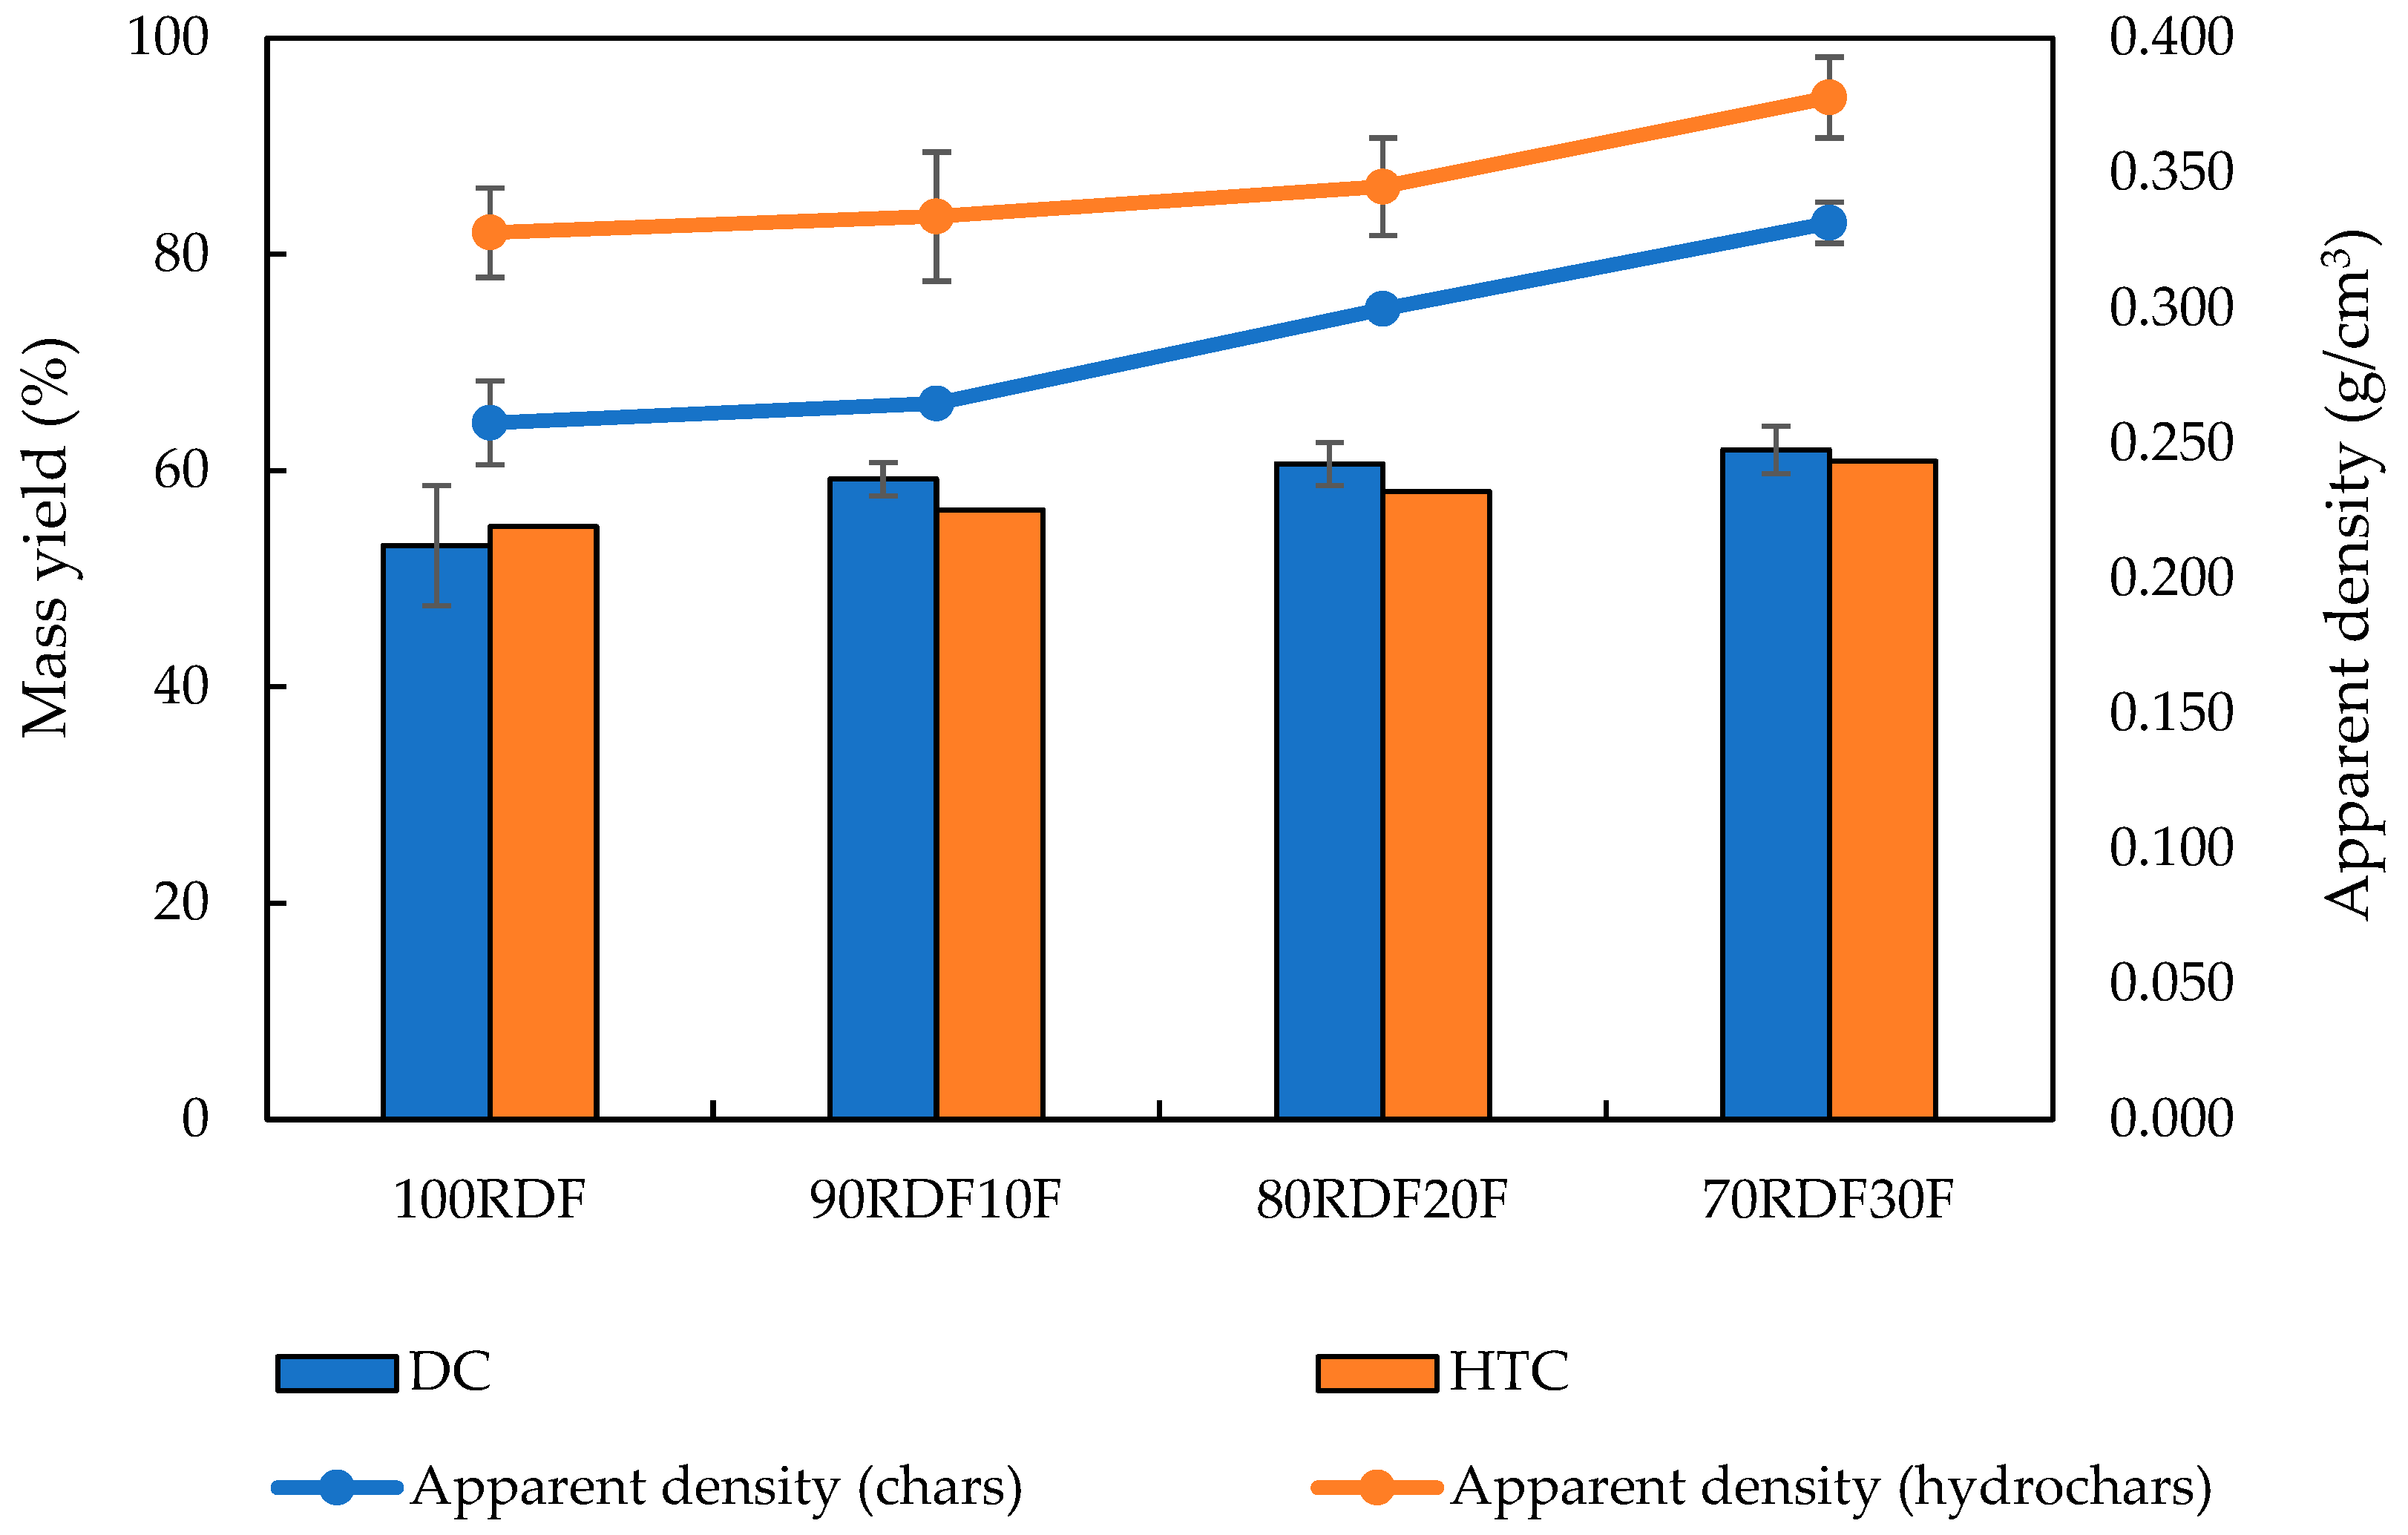
The mass yield of the chars produced from RDF with fat incorporation is represented in Figure 2. As can be seen, the carbonization yield increases slightly as more fat is incorporated into the sample. In the sample composed exclusively of RDF, the mass yield at 400 °C for 30 min was 53.1%, and adding 10% fat (by mass) increased the yield to 59.2%. The sample composed of 80% RDF and 20% fat presented a mass yield of 60.6%, while the sample with the highest fat incorporation (30%) presented a mass yield of 61.9%. This indicates that the fat components, primarily triglycerides and fatty acids, were retained in the solid products and did not undergo extensive decomposition, resulting in the formation of gases or polar organic products that could be dissolved in the condensates or process water. These results agree with other studies, which have shown that the addition of lipid-rich feedstock components increases char yield and retention of organic compounds in the solid fraction. For example, previous work on co-carbonization of plastic and organic fractions found similar trends in material conversion and product distribution, suggesting comparable mechanisms during thermochemical processing [59,60,61,62].
Increased fat incorporation has also been shown to influence the apparent density of chars. The highest value for this parameter (0.332 g/cm3) was obtained for the sample with the highest fat incorporation, representing an increase of 28.8% compared to the sample without added fat (0.258 g/cm3). Chars produced with 10% and 20% fat incorporation had intermediate apparent density values of 0.265 g/cm3 and 0.300 g/cm3, respectively. This suggests that, apart from converting raw materials into a carbonaceous structure, some carbonization products, particularly organic products of low to medium molecular weight, were retained in the pores of the carbonaceous structures formed, contributing to the increase in yield and apparent density of the produced chars [34]. The trend of increasing apparent density with fat incorporation aligns with reports on hydrochar production from organic-rich municipal waste, where denser carbonaceous products were observed with rising lipid content. This is thought to arise from the filling of pores by retained organic compounds and rearranging the carbon matrix during fat decomposition at moderate temperatures [63,64,65].
Similarly, hydrochars showed a higher mass yield with increased fat incorporation into the samples. While this value was 54.8% in the sample composed exclusively of RDF, the mass yield reached 60.9% when the incorporation of fat represented 30% of the sample. Intermediate values were obtained in samples with 10% and 20% fat incorporation, 56.4% and 58.1%, respectively. A higher mass yield is a crucial parameter for enhancing the efficiency of the carbonization process. Regarding apparent density, the same pattern was observed in hydrochars. Although the greater incorporation of fat led to an increase in apparent density, this increase was more subtle compared to the chars, with the sample with 30% fat having an increase in this value of 15.2% (0.378 g/cm3) compared to the sample produced from 100% RDF (0.328 g/cm3). The hydrochar samples produced with lower incorporation rates obtained intermediate values, 0.334 g/cm3 with 10% and 0.345 g/cm3 with 20% fat incorporation in the RDF. It is important to note that, despite the more subtle increase in apparent density in hydrochars compared to chars, these values were consistently higher across all tested conditions. The presence of an aqueous phase in the HTC reactor may lead to the dissolution of polar products, resulting in a slight reduction in yield compared to dry carbonization. However, it can also promote a higher retention of hydrophobic components in the solid product (hydrochar), resulting in higher apparent density [66]. Increasing apparent density is crucial for reducing transport costs and streamlining storage logistics, and it is a decisive factor in determining the economic viability of using an alternative fuel [67]. The observed increase in hydrochar yield with higher fat levels concurs with research showing hydrophobic co-substrates (e.g., oil cakes, microalgae, and food waste) assist in material retention during hydrothermal processing, leading to more efficient carbon recovery and potentially improving fuel characteristics [68,69,70].

3.2. Feedstock and Char Characterization

The proximate and ultimate composition of the chars produced at 425 °C and the hydrochars produced at 300 °C for 30 min, with different fat incorporations, is represented in Table 3. Statistical analysis was performed using a two-way ANOVA followed by post hoc Tukey tests to determine significant differences (p < 0.05) in proximate and ultimate analysis values among samples from the different applied technologies.
The moisture content of the chars increased with the incorporation of fat up to 20% (4.8%) but decreased to 2.8% when the incorporation of animal fat reached 30%. This initial increase can be attributed to changes in the char’s physical structure and porosity caused by fat decomposition intermediates that retain moisture. However, at higher fat content (30%), the chars become more hydrophobic due to increased aromaticity and lipid carbonization, which reduces moisture adsorption and results in lower moisture content. In the case of HTC, the incorporation of fat always resulted in more hydrophobic hydrochars, reaching a moisture content of 1.1% in the sample with 30% fat incorporation, representing a 58.3% reduction compared to the sample composed solely of RDF. Reducing the moisture content is crucial for increasing the efficiency of transportation costs, reducing the likelihood of contamination by microorganisms, and improving the performance of chars as fuel [71]. Tukey’s post-hoc test further revealed that all HTC samples formed distinct significance groups from their DC counterparts, with the lowest values (70RDF30F from HTC) being statistically different from all other treatments, confirming that high fat incorporation in HTC has a uniquely strong moisture-reducing effect. This supports the observation that increased fat incorporation produces more hydrophobic hydrochars.
The addition of fat in the RDF sample increased the volatile matter in the chars. This increase was gradual and directly proportional to the percentage of fat added, reaching its peak in samples with a 30% fat content. In these samples, the volatile matter was 74.6% in chars and 81.1% in hydrochars. These findings align with the observed increase in the apparent density of chars and hydrochars, attributed to the trapping of carbonization by-products within the pores of the char structure. The differences in volatile matter content were also statistically significant (p < 0.05). The Tukey test showed that the highest fat incorporation levels in HTC (80RDF20F and 70RDF30F belonged to the top significance group “A”, clearly separated from lower-fat DC treatments, highlighting the strong effect of fat addition and process type.
When fat was added, the ash content of the chars decreased. With 30% fat incorporation, there was a 43.0% reduction in ash content for chars and a 34.2% reduction for hydrochars compared to chars made from samples consisting only of RDF. This decrease in ash content was expected because fat is mainly ash-free, except for some unintentional contamination. The ash content was consistently lower for hydrochars than chars, a common characteristic in hydrothermal carbonization, as some mineral components can dissolve in the aqueous phase [49]. Statistical analysis confirmed these differences (p < 0.05), with RDF (DC) samples grouping alone with the highest ash content and all fat-enriched HTC samples forming distinct low-ash groups, reinforcing the conclusion that both fat addition and HTC processing reduce inorganic residue content.
The increase in volatile matter associated with reducing the ash content of chars and hydrochars is an important parameter that positively influences their fuel characteristics [72]. The fixed carbon content did not show significant variation or a pattern related to fat incorporation in the RDF samples. The constancy in fixed carbon values is due to the compensation of the increase in volatile matter by reducing the ash content of the chars. The ANOVA for fixed carbon still detected significant differences between some treatments (p < 0.05), mainly due to variability in DC samples with high fat and in pure RDF–HTC, as reflected in Tukey grouping; however, no consistent trend across fat incorporation levels was observed, supporting the interpretation that changes in fixed carbon were largely due to balancing effects between volatile and ash fractions rather than direct influence of fat content. The high standard deviation in pure RDF hydrochar reflects the variation in the volatile matter values obtained for these samples.
The ultimate composition of chars and hydrochars indicates that the concentrations of carbon and hydrogen in chars are slightly higher than those found in hydrochars, except for the sample of 80% RDF, which presented a somewhat lower carbon concentration. The increase in fat in the samples also demonstrated a direct relationship with the rise in the concentration of these elements in the chars. ANOVA confirmed that carbon content varied significantly between treatments (p < 0.05), with Tukey’s test grouping 100RDF and 90RDF10F (from HTC) in a lower-carbon category, while high-fat HTC samples (80RDF20F and 70RDF30F) were statistically indistinguishable from the DC samples, suggesting that fat addition mitigates carbon loss during HTC.
The highest concentrations of carbon and hydrogen were observed in samples with 30% fat in chars and in hydrochars. This result highlights the contribution of fat as a source of oxidizable elements recovered in char and hydrochar. Hydrogen content also showed highly significant differences (p < 0.05), with the 70RDF30F (HTC) sample forming a distinct top group in Tukey’s test, confirming the strong enrichment effect of fat on hydrogen concentration, a factor that is directly linked to improved HHV. In the opposite direction, the nitrogen concentration showed a slight reduction with the increase in fat incorporation in both chars and hydrochars. Furthermore, hydrochars presented higher values than chars in all samples. The decrease in nitrogen concentration is a relevant factor in using an alternative fuel, as it reduces the possibility of NOx emissions into the atmosphere during char combustion [73]. Statistical analysis supported these trends, with nitrogen being significantly high in 100RDF (HTC) and 90RDF10F (HTC), while most fat-enriched DC samples grouped in lower-nitrogen categories. This direct relationship between feedstock lipid content and product carbon/hydrogen recovery has been reported in comparative biochar studies.
The presence of sulfur was not detected in any char sample composed only of RDF. However, in hydrochars produced with fat incorporation, the sulfur content reached the maximum value in the sample with a 30% addition (1.1%). The presence of sulfur in samples is a negative factor for fuel use due to the potential for sulfur compound emissions (SOx) [74]. This effect was also clearly significant (p < 0.05), with 70RDF30F (HTC) forming a separate high-sulfur group in Tukey’s results, indicating that sulfur enrichment is linked to both process type (HTC) and fat content.
Although the oxygen content was higher in hydrochars, a direct relationship between this value and fat incorporation was not observed. Consistently, Tukey’s groupings placed samples, particularly 70RDF30F (DC) and 100RDF (HTC), into the lowest oxygen-content categories. This pattern suggests that the reduced oxygen levels are mainly influenced by the carbonization process rather than by the fat content alone.
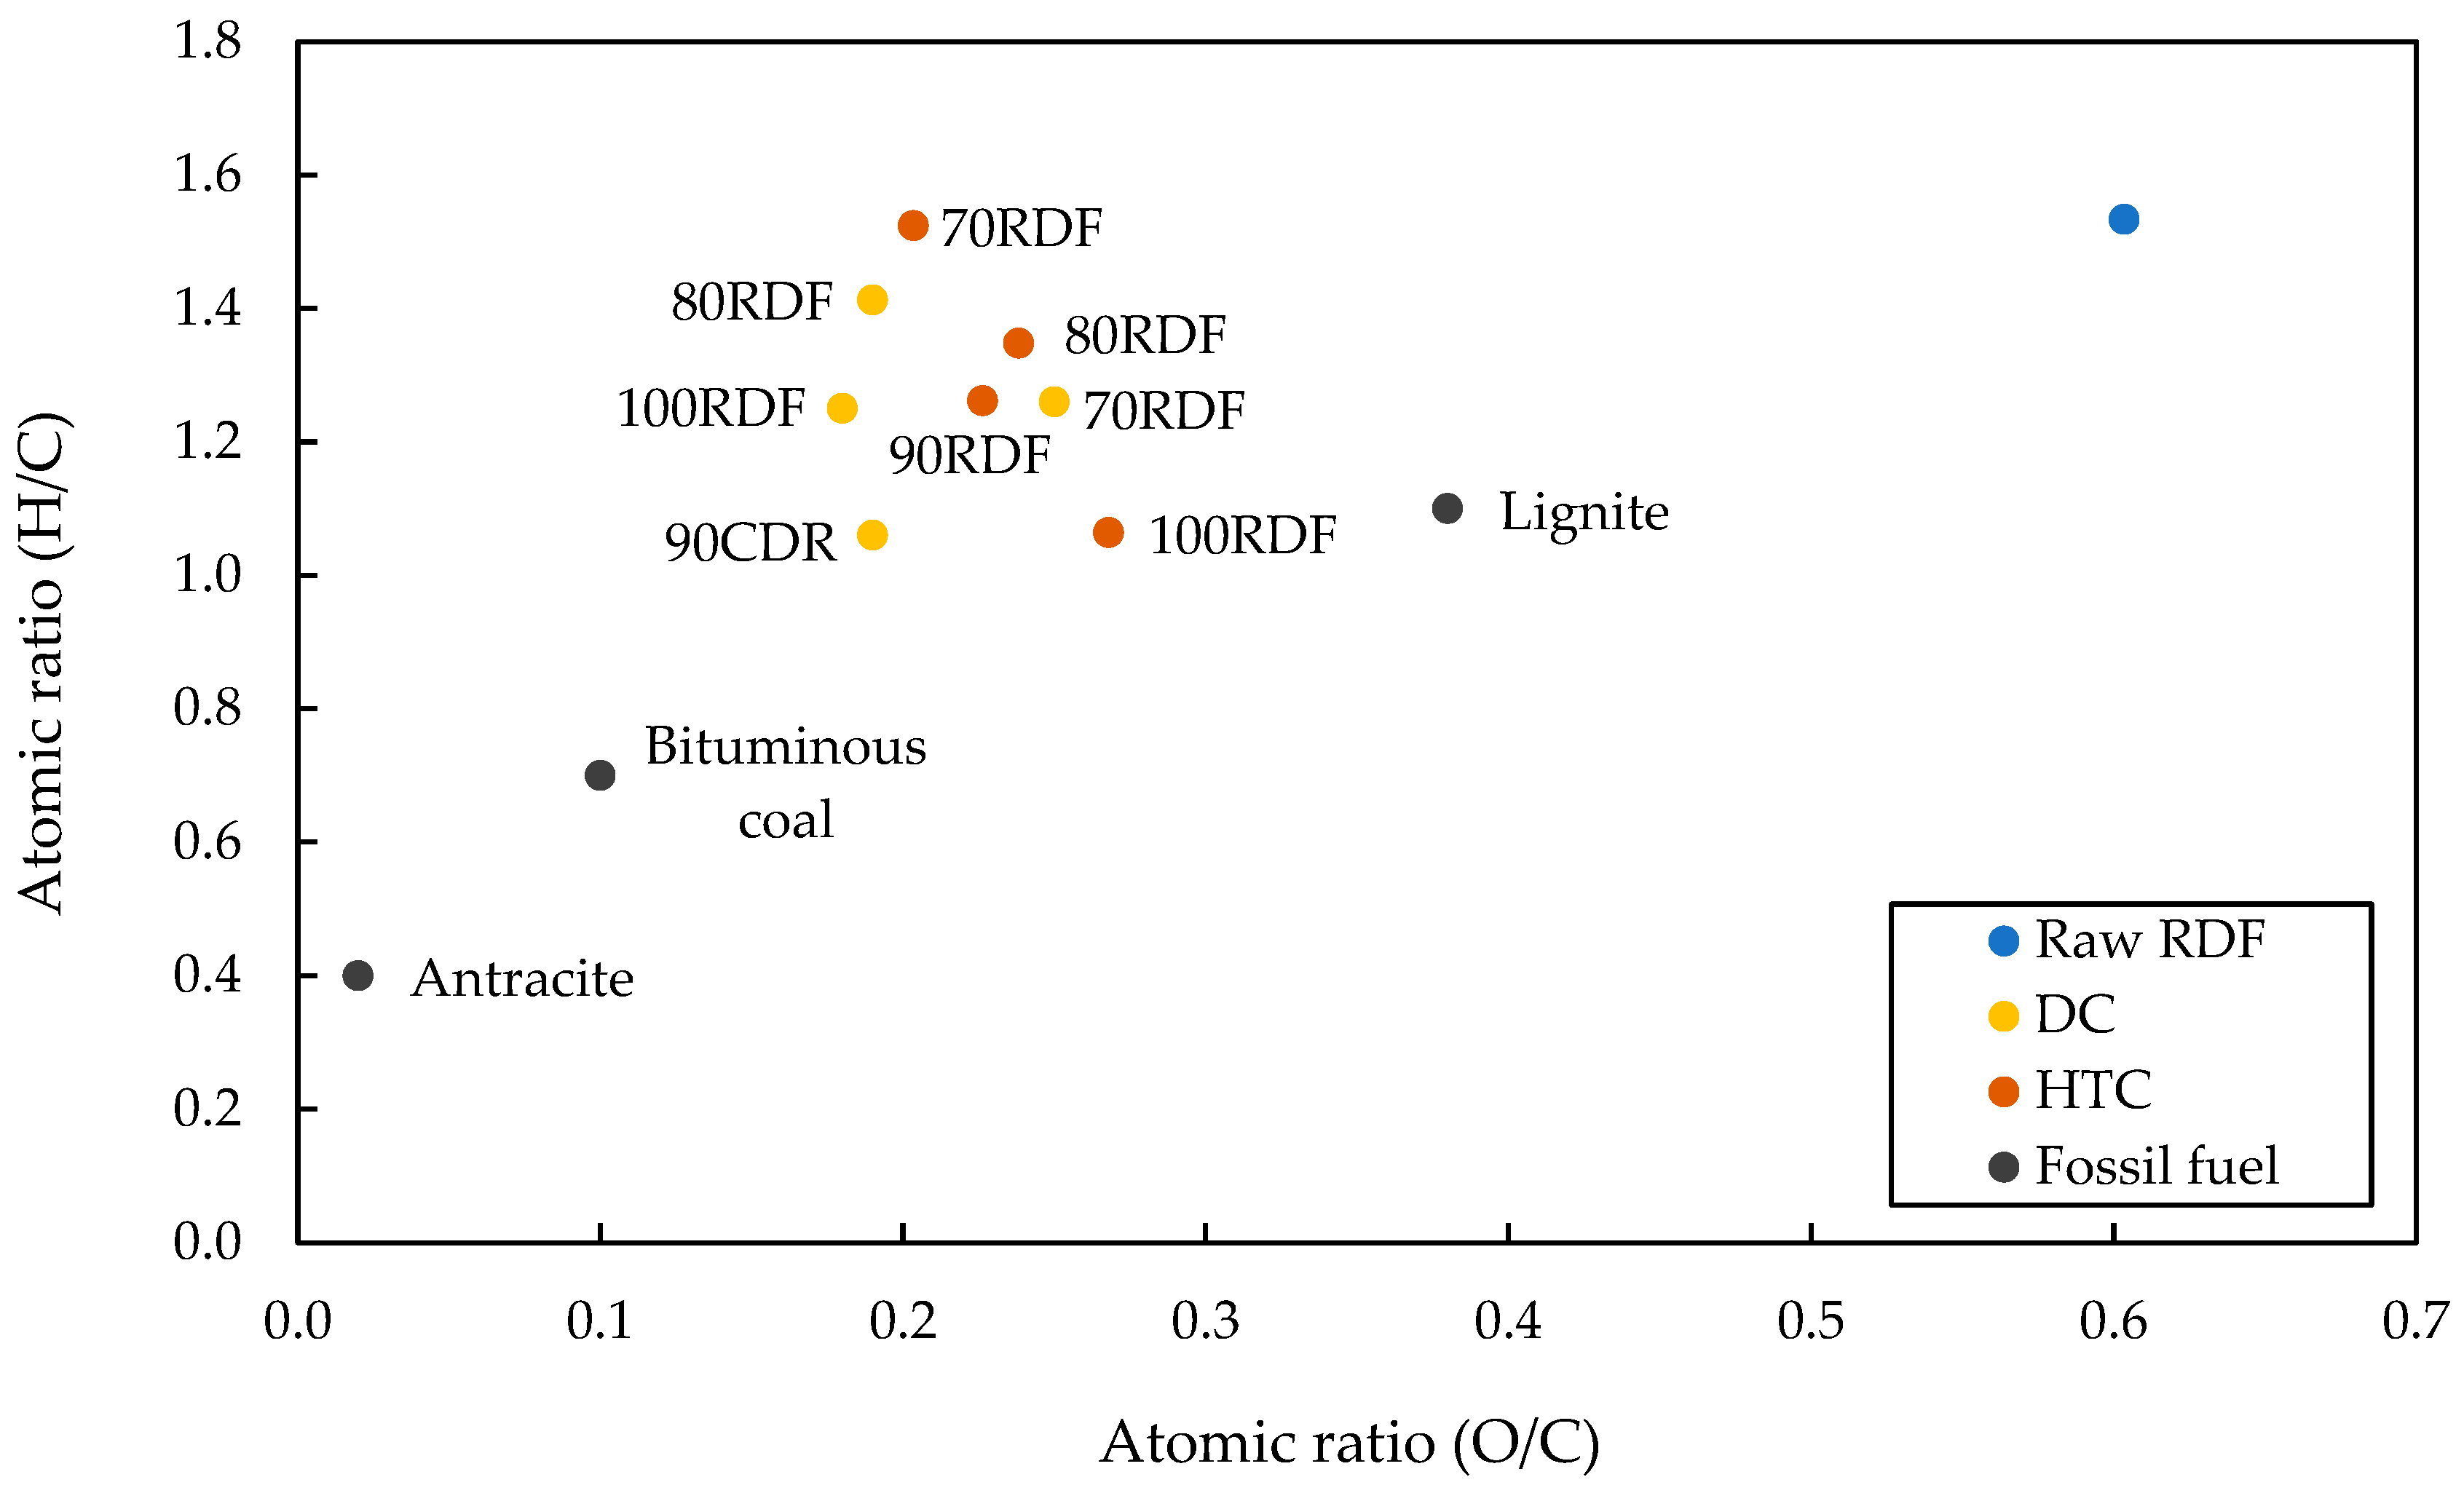
Reduced oxygen levels positively influence the combustible properties of the chars, as they decrease the O/C ratio and, consequently, increase the HHV. The increase in fat incorporation into the chars resulted in a slight rise in the O/C ratio. A clear pattern was not observed regarding the addition of fat in relation to the H/C ratio. However, the deoxygenation effect of the raw material is evident, as the O/C ratio is reduced from 0.6 in the raw RDF to values between 0.18 and 0.25 in the chars. Hydrochars exhibited a smaller reduction in the O/C ratio, with values ranging from 0.20 to 0.27, which is consistent with the aqueous phase in HTC limiting oxygen removal via dehydration reactions. The addition of fat favored the elimination of oxygen, producing hydrochars with a lower O/C ratio (0.20 to 0.24) than that produced from 100% RDF (O/C = 0.27). In the case of the H/C ratio of hydrochars, an increase in this parameter was observed with the incorporation of fat in the initial mixture, peaking with sample 70RDF30F (HTC) (1.52). These observations confirm the effect of fat as a promoter of the hydrophobic character of chars and as a source of carbon and hydrogen. Since carbon is the element with the highest energy content, the increase in carbon concentration with fat addition directly contributes to the higher HHV values observed in this study. Both carbon and hydrogen contribute to the HHV of any fuel. The reduction in H/C and O/C ratios thus indicates an improvement in the combustible properties of the chars [75,76]. Moreover, the thermochemical method also seems to influence the O/C reduction, being more pronounced in the dry carbonization experiments. Figure 3 presents a Van Krevelen diagram of the RDF, the produced chars, and hydrochars, compared to conventional fossil fuels.
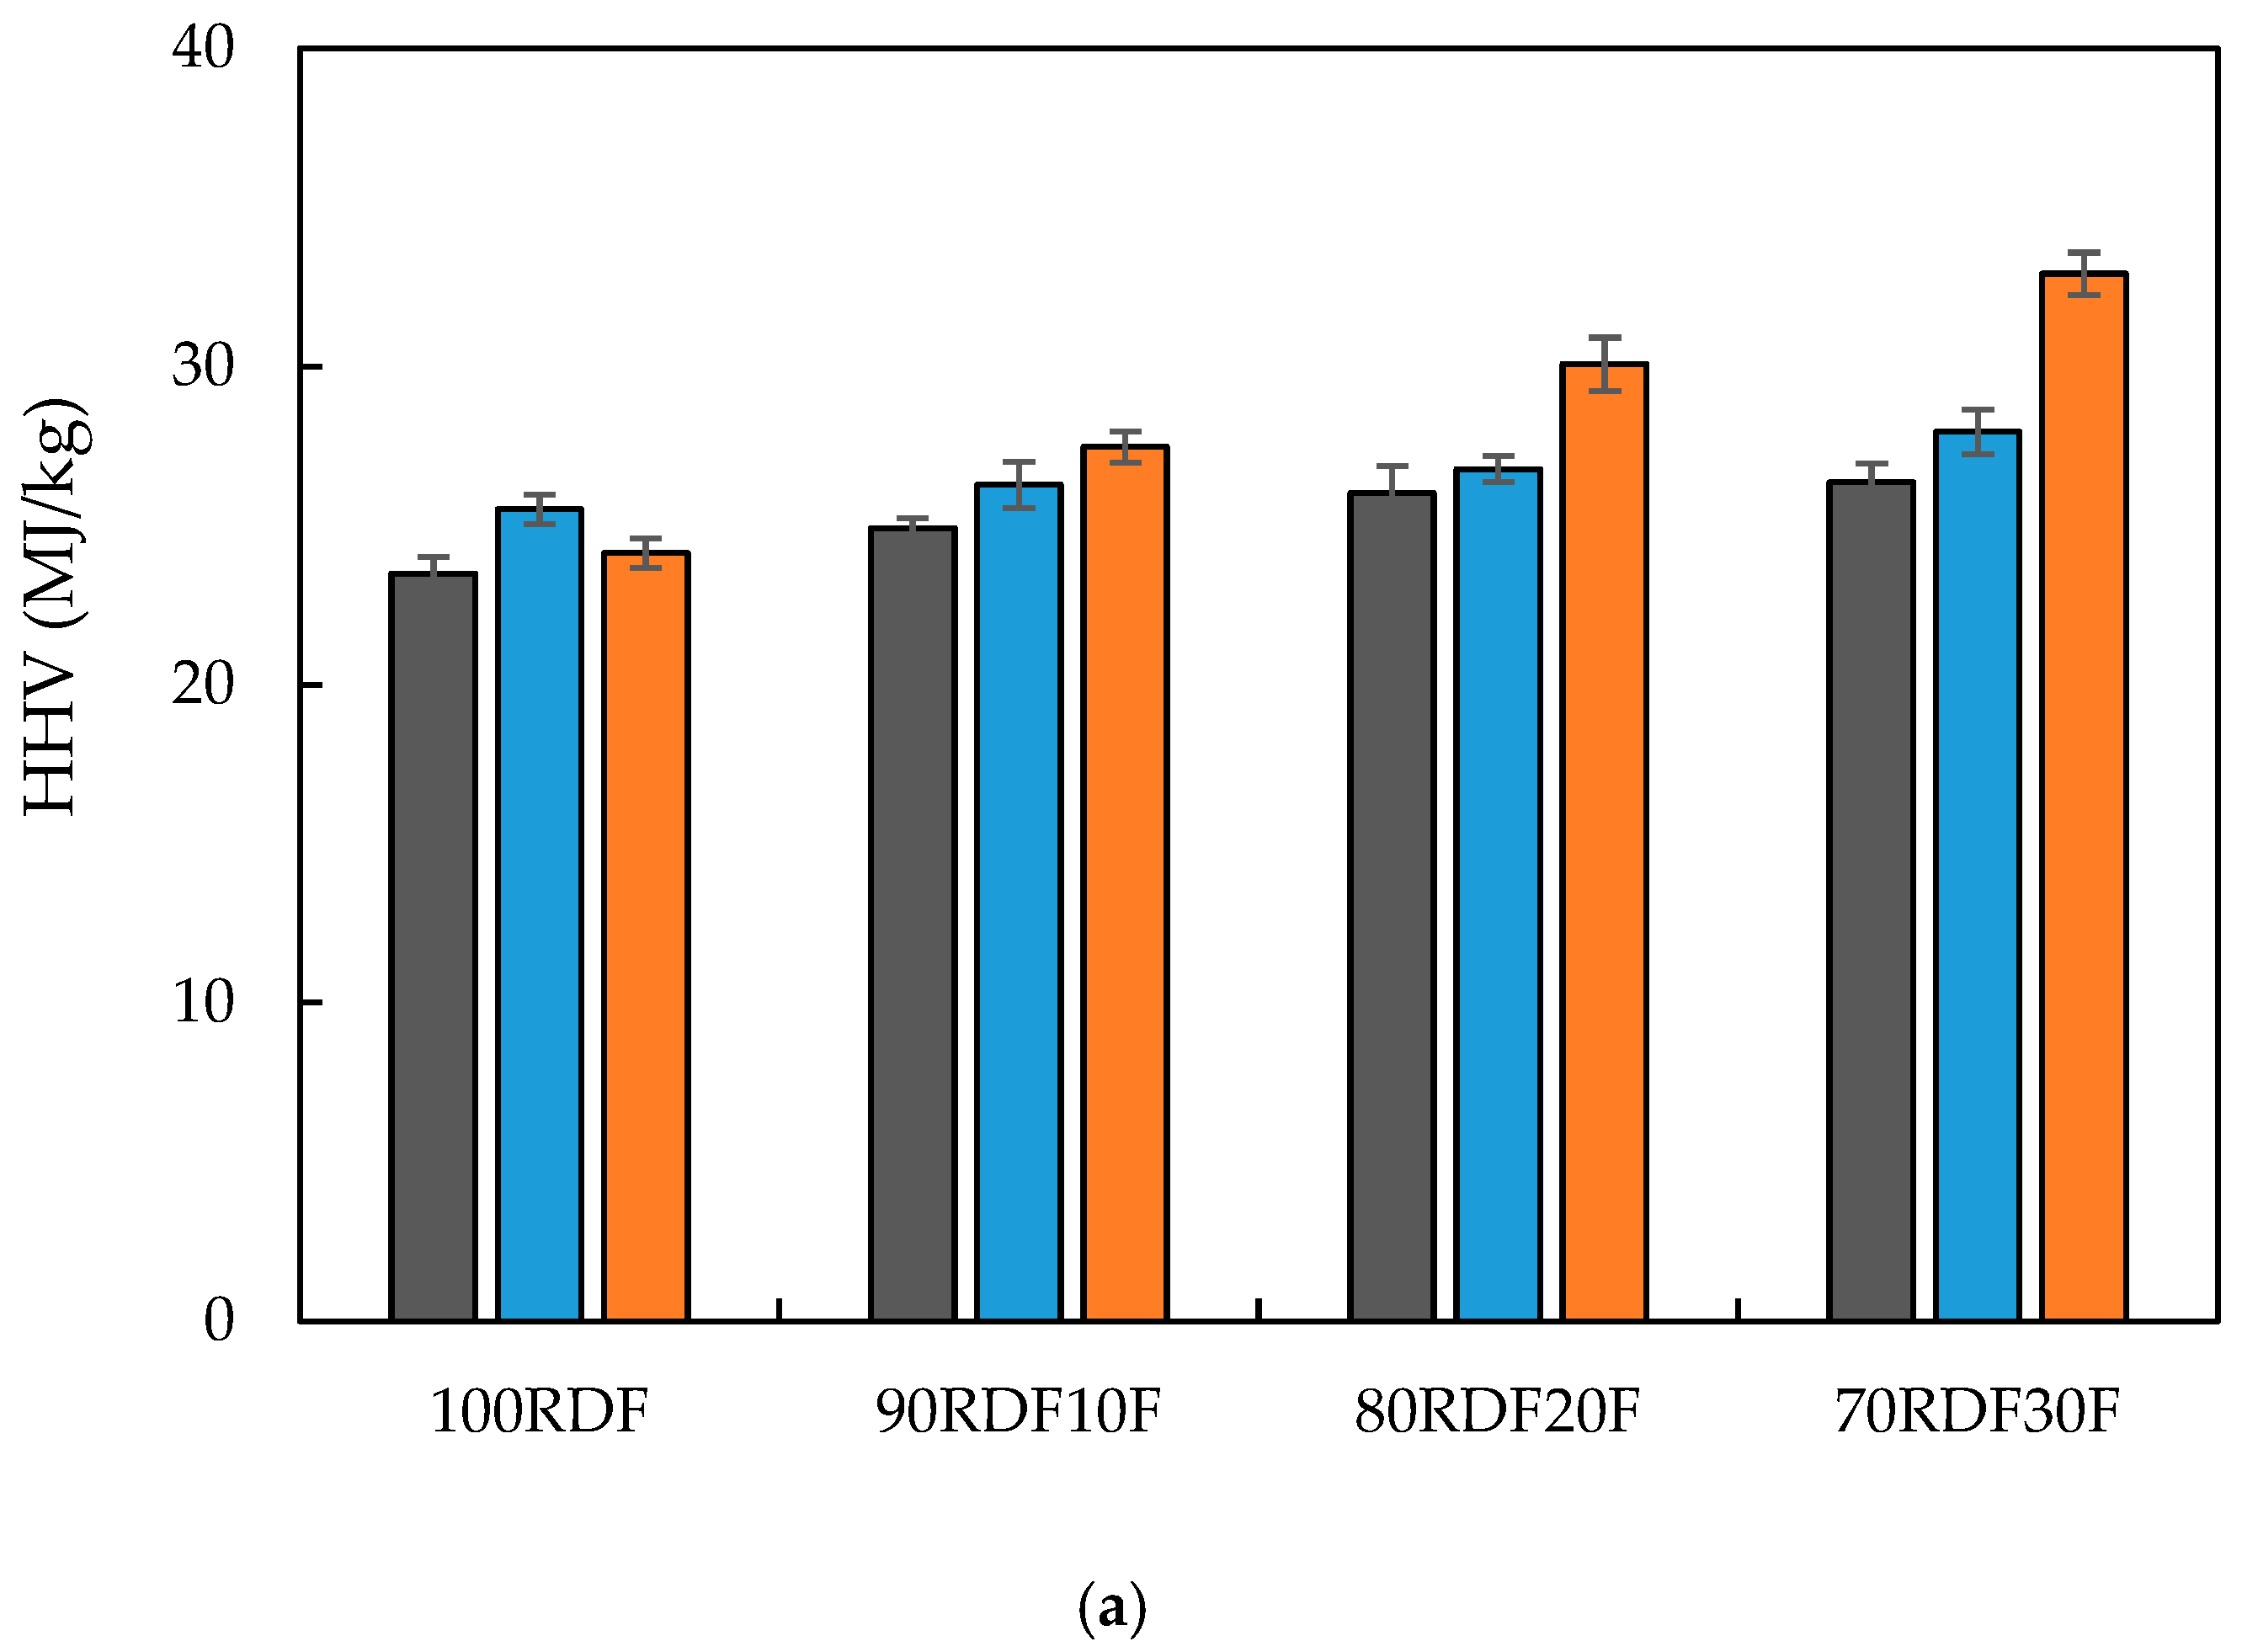
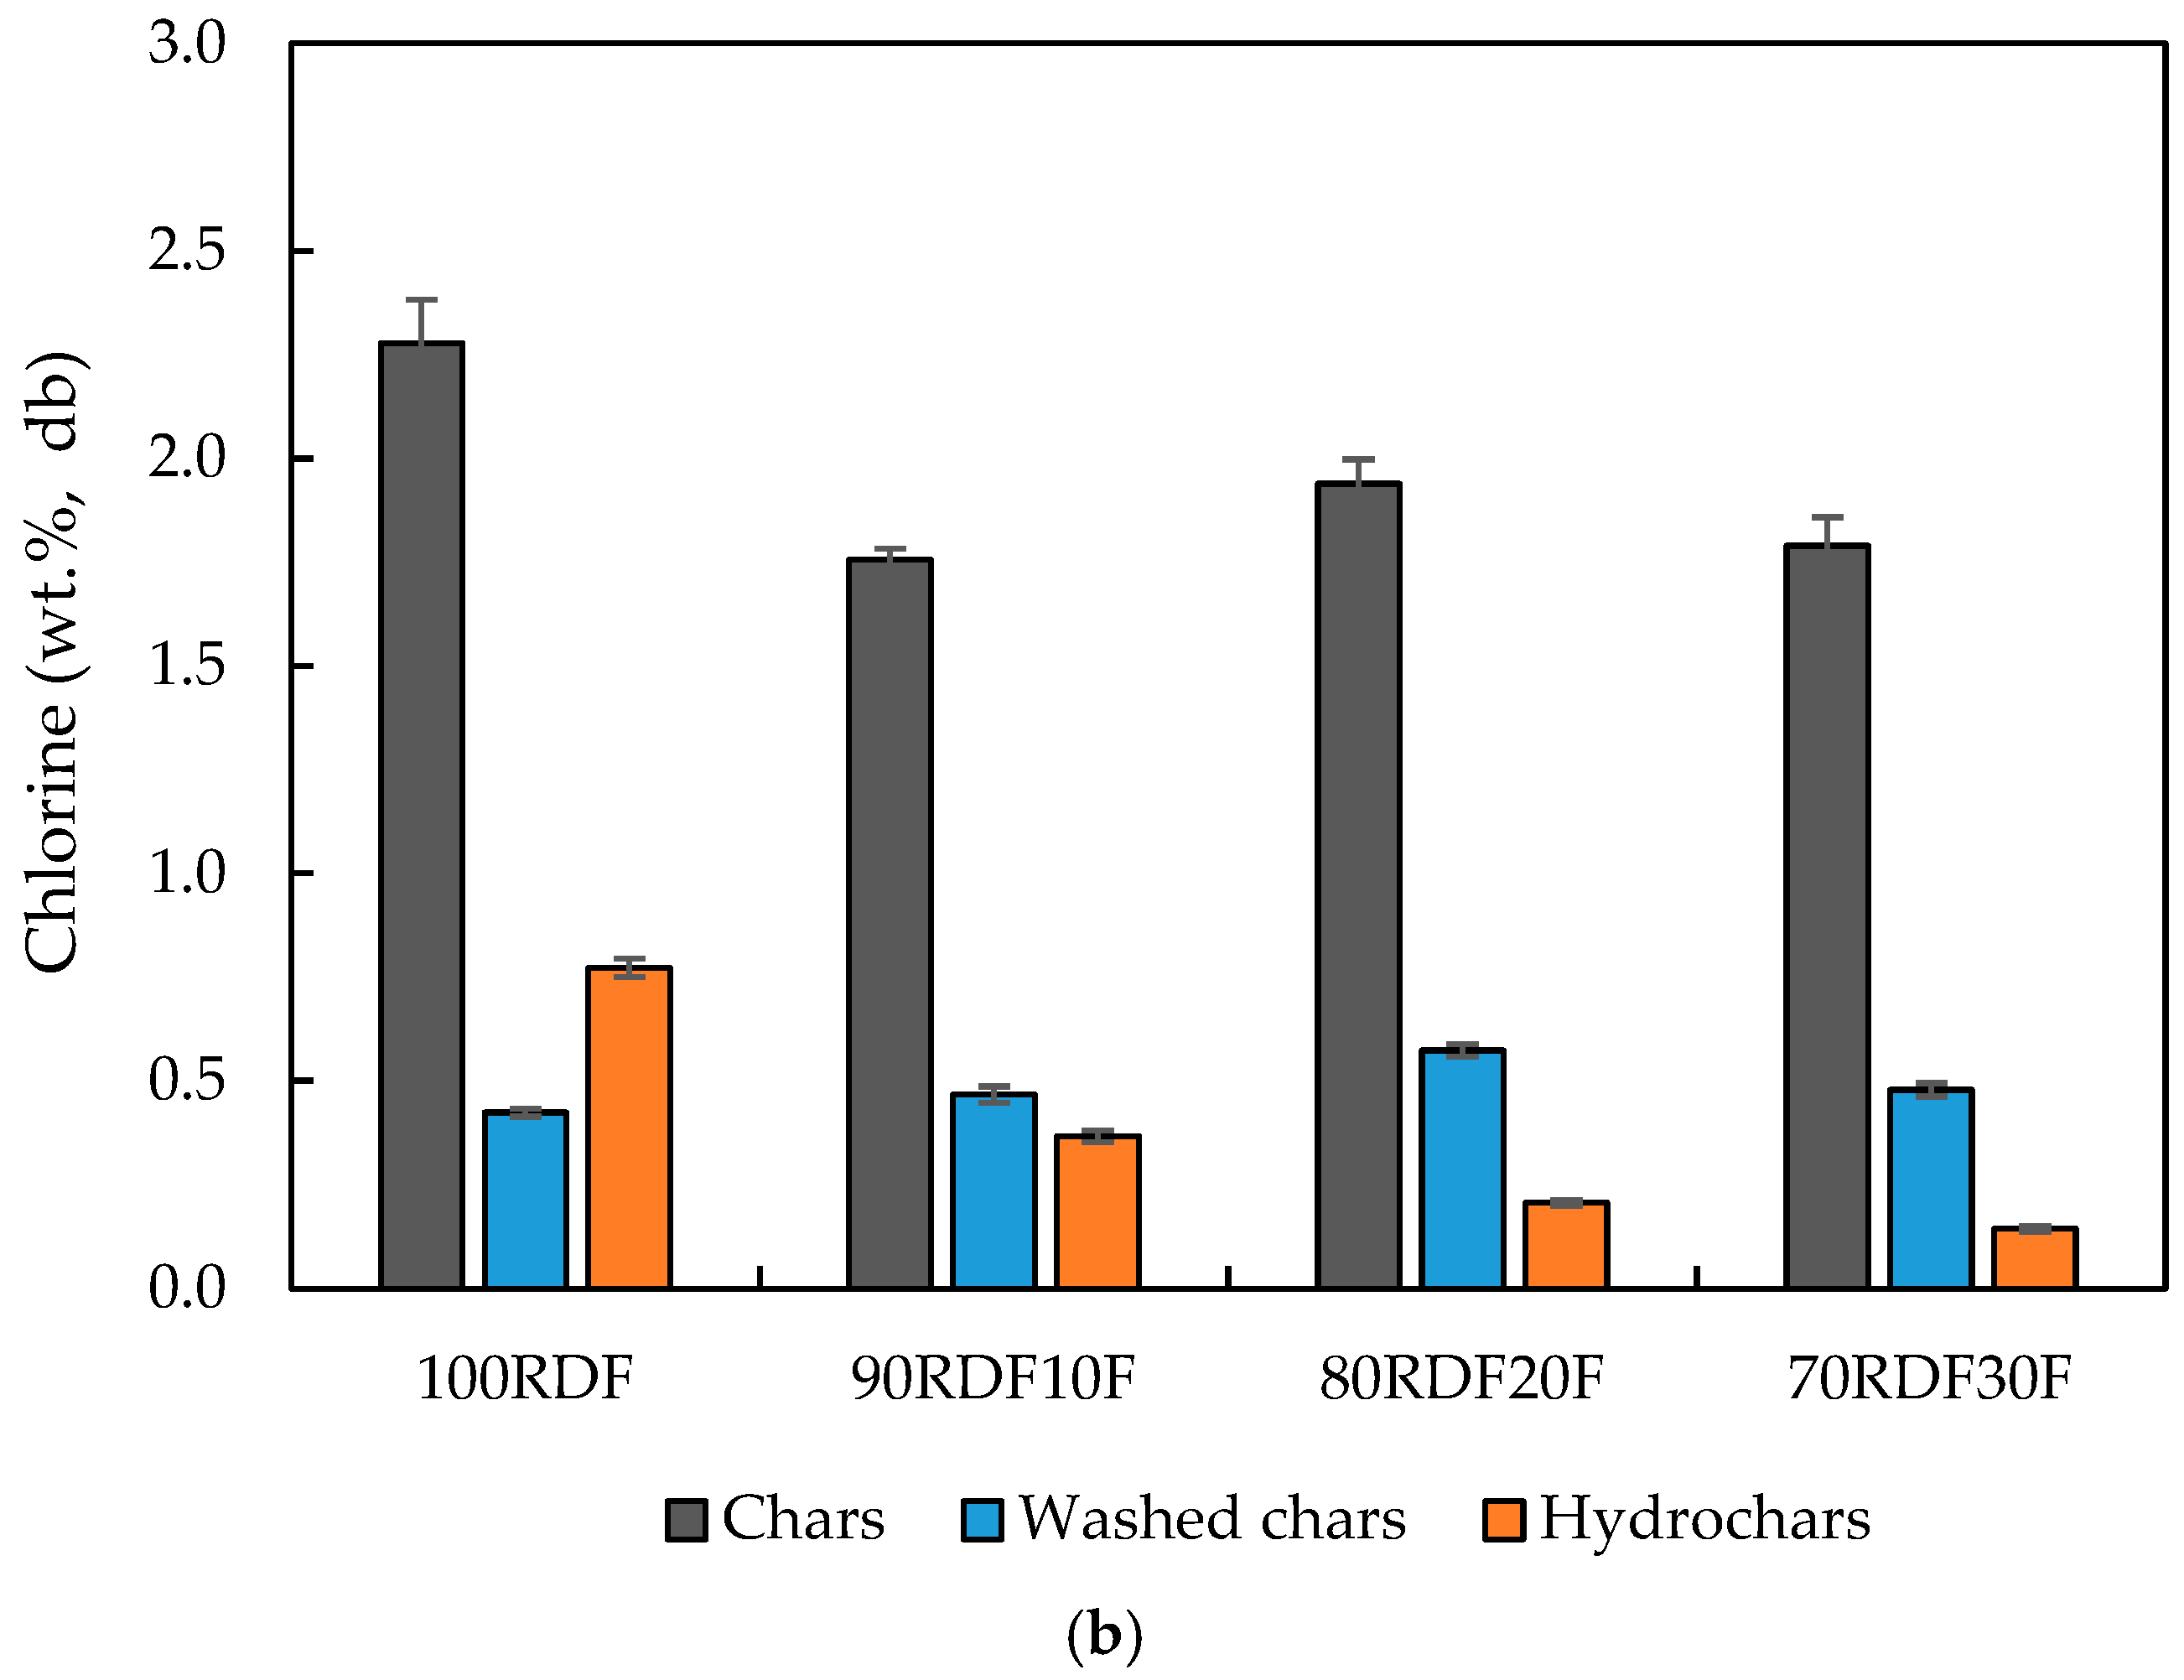
Regarding fuel properties, Figure 4a shows the HHV of chars (before and after washing) and hydrochars, and Figure 4b shows the effects of washing on the chlorine concentration of chars.
The char-washing process led to an increase in HHV that ranged from 3.1% to 8.5% compared to the chars before washing. In all cases, the increase in fat incorporation resulted in a gradual rise in HHV, with values of 9.4% in washed chars and 36.5% in hydrochars. The HHV value for the chars produced from the sample composed solely of RDF was 25.5 MJ/kg for the chars and 24.1 MJ/kg for the hydrochars, being the only condition where the HHV of the char was higher than the hydrochar. In all other samples, the increase in fat incorporation demonstrated a more significant effect on hydrochars, reaching the maximum value (32.9 MJ/kg) in the sample with 30% fat. In comparison, chars presented an HHV of 27.9 MJ/kg in the same condition. In samples with a 10% fat concentration, the HHV values were 26.3 MJ/kg and 27.5 MJ/kg, while increasing the concentration to 20% increased these values to 26.8 MJ/kg and 30.1 MJ/kg for chars and hydrochars, respectively.
The results demonstrate that the incorporation of fat contributed to an increase in HHV, both in chars and hydrochars, which is more pronounced in the hydrochars. This improvement is not only related to increased carbon content but also to the concurrent reduction in ash concentration, which removes inert material and allows a higher proportion of combustible matter per unit mass. This result is consistent with the lower ash content and higher volatile matter content of hydrochars compared to chars. The lower ash content also explains the higher HHV obtained for washed chars compared to unwashed ones. It is also worth emphasizing that animal fats have inherently elevated HHV and excellent combustion characteristics. Their incorporation into RDF acts as a high-energy additive, significantly boosting the energy density of the resulting chars and hydrochars.
As previously mentioned, one of the most significant constraints on using RDF as an alternative fuel is related to the high chlorine content in the raw residue. Furthermore, after DC, it is expected to observe a concentration of chlorine in the chars, which can lead to restrictions on their use for energy applications [77,78]. Therefore, the char washing process appears as an alternative to reduce the chlorine content to levels acceptable under alternative fuel legislation.
As shown in Figure 4b, the addition of fat to the RDF has not been directly related to the reduction of chlorine content in the chars. Although the incorporation of fat appeared to reduce this value compared to the sample composed only of RDF, the increase in fat incorporation did not demonstrate any effect on reducing the chlorine content of the chars. In fact, a significant reduction in chlorine content occurred after the washing process, resulting in values below 1%. The chlorine content of the washed chars varied from 0.42% in the sample without fat incorporation to 0.58% in the sample with 20% incorporation. Intermediate values were found for the other samples.
For hydrochars, since the HTC process occurs in the presence of water, the washing process is unnecessary, as the ionic chlorine has already dissolved in the aqueous phase, resulting in hydrochars with chlorine concentrations of less than 1%. Furthermore, the increase in fat incorporation led to a gradual reduction in the chlorine content in the hydrochars, with the highest value observed in the sample composed solely of RDF (0.7%) and the lowest in the sample with maximum fat incorporation (0.1%). This effect may result from the increased hydrophobicity of the char surface, leading to reduced retention of chlorine ions in its pores.
Ash mineral composition is another critical parameter for using RDF as an alternative fuel. Table 4 presents the values obtained for char and hydrochar samples without fat incorporation and with 30% incorporation.
The results demonstrate that the incorporation of fat in chars caused a reduction in all analyzed elements except for Na2O and SiO2, which showed an increase in their concentrations. In the case of hydrochars, an increase in Al2O3, CaO, and Fe2O3 concentrations, along with a decrease in other elements, was observed. These results had little impact on the slag and foul formation rates, which remained unchanged in terms of their probability of occurrence. The chlorine content was less than 1% in all samples, with the lowest value found in the hydrochar sample with fat incorporation (0.1%). As previously described, the ash content is reduced by incorporating fat.
The presence of alkaline earth metals such as Ca and Mg is responsible for the deposition of ash in boilers [79]. The deposition potential can be measured by the base/acid ratio (B/A), which demonstrated a slight decrease with the addition of fat in chars and an even more discreet increase in the case of hydrochars. The CaO concentration was considerably higher in the chars, with an evident reduction in the sample with fat incorporation. The MgO concentration demonstrated little relationship with fat incorporation and was similar in the char and hydrochar samples. In the case of alkali metals (Na and K), the concentration of these components is a determining factor for the assessment of scale and clogging risks, being directly related to the calculations of basicity (B/A), fouling (Fu), and formation of ash layers (TA) [58]. The addition of fat was not shown to significantly affect the K2O concentration, whereas the incorporation of fat increased the Na2O concentration in the chars from 0.2% to 1%.
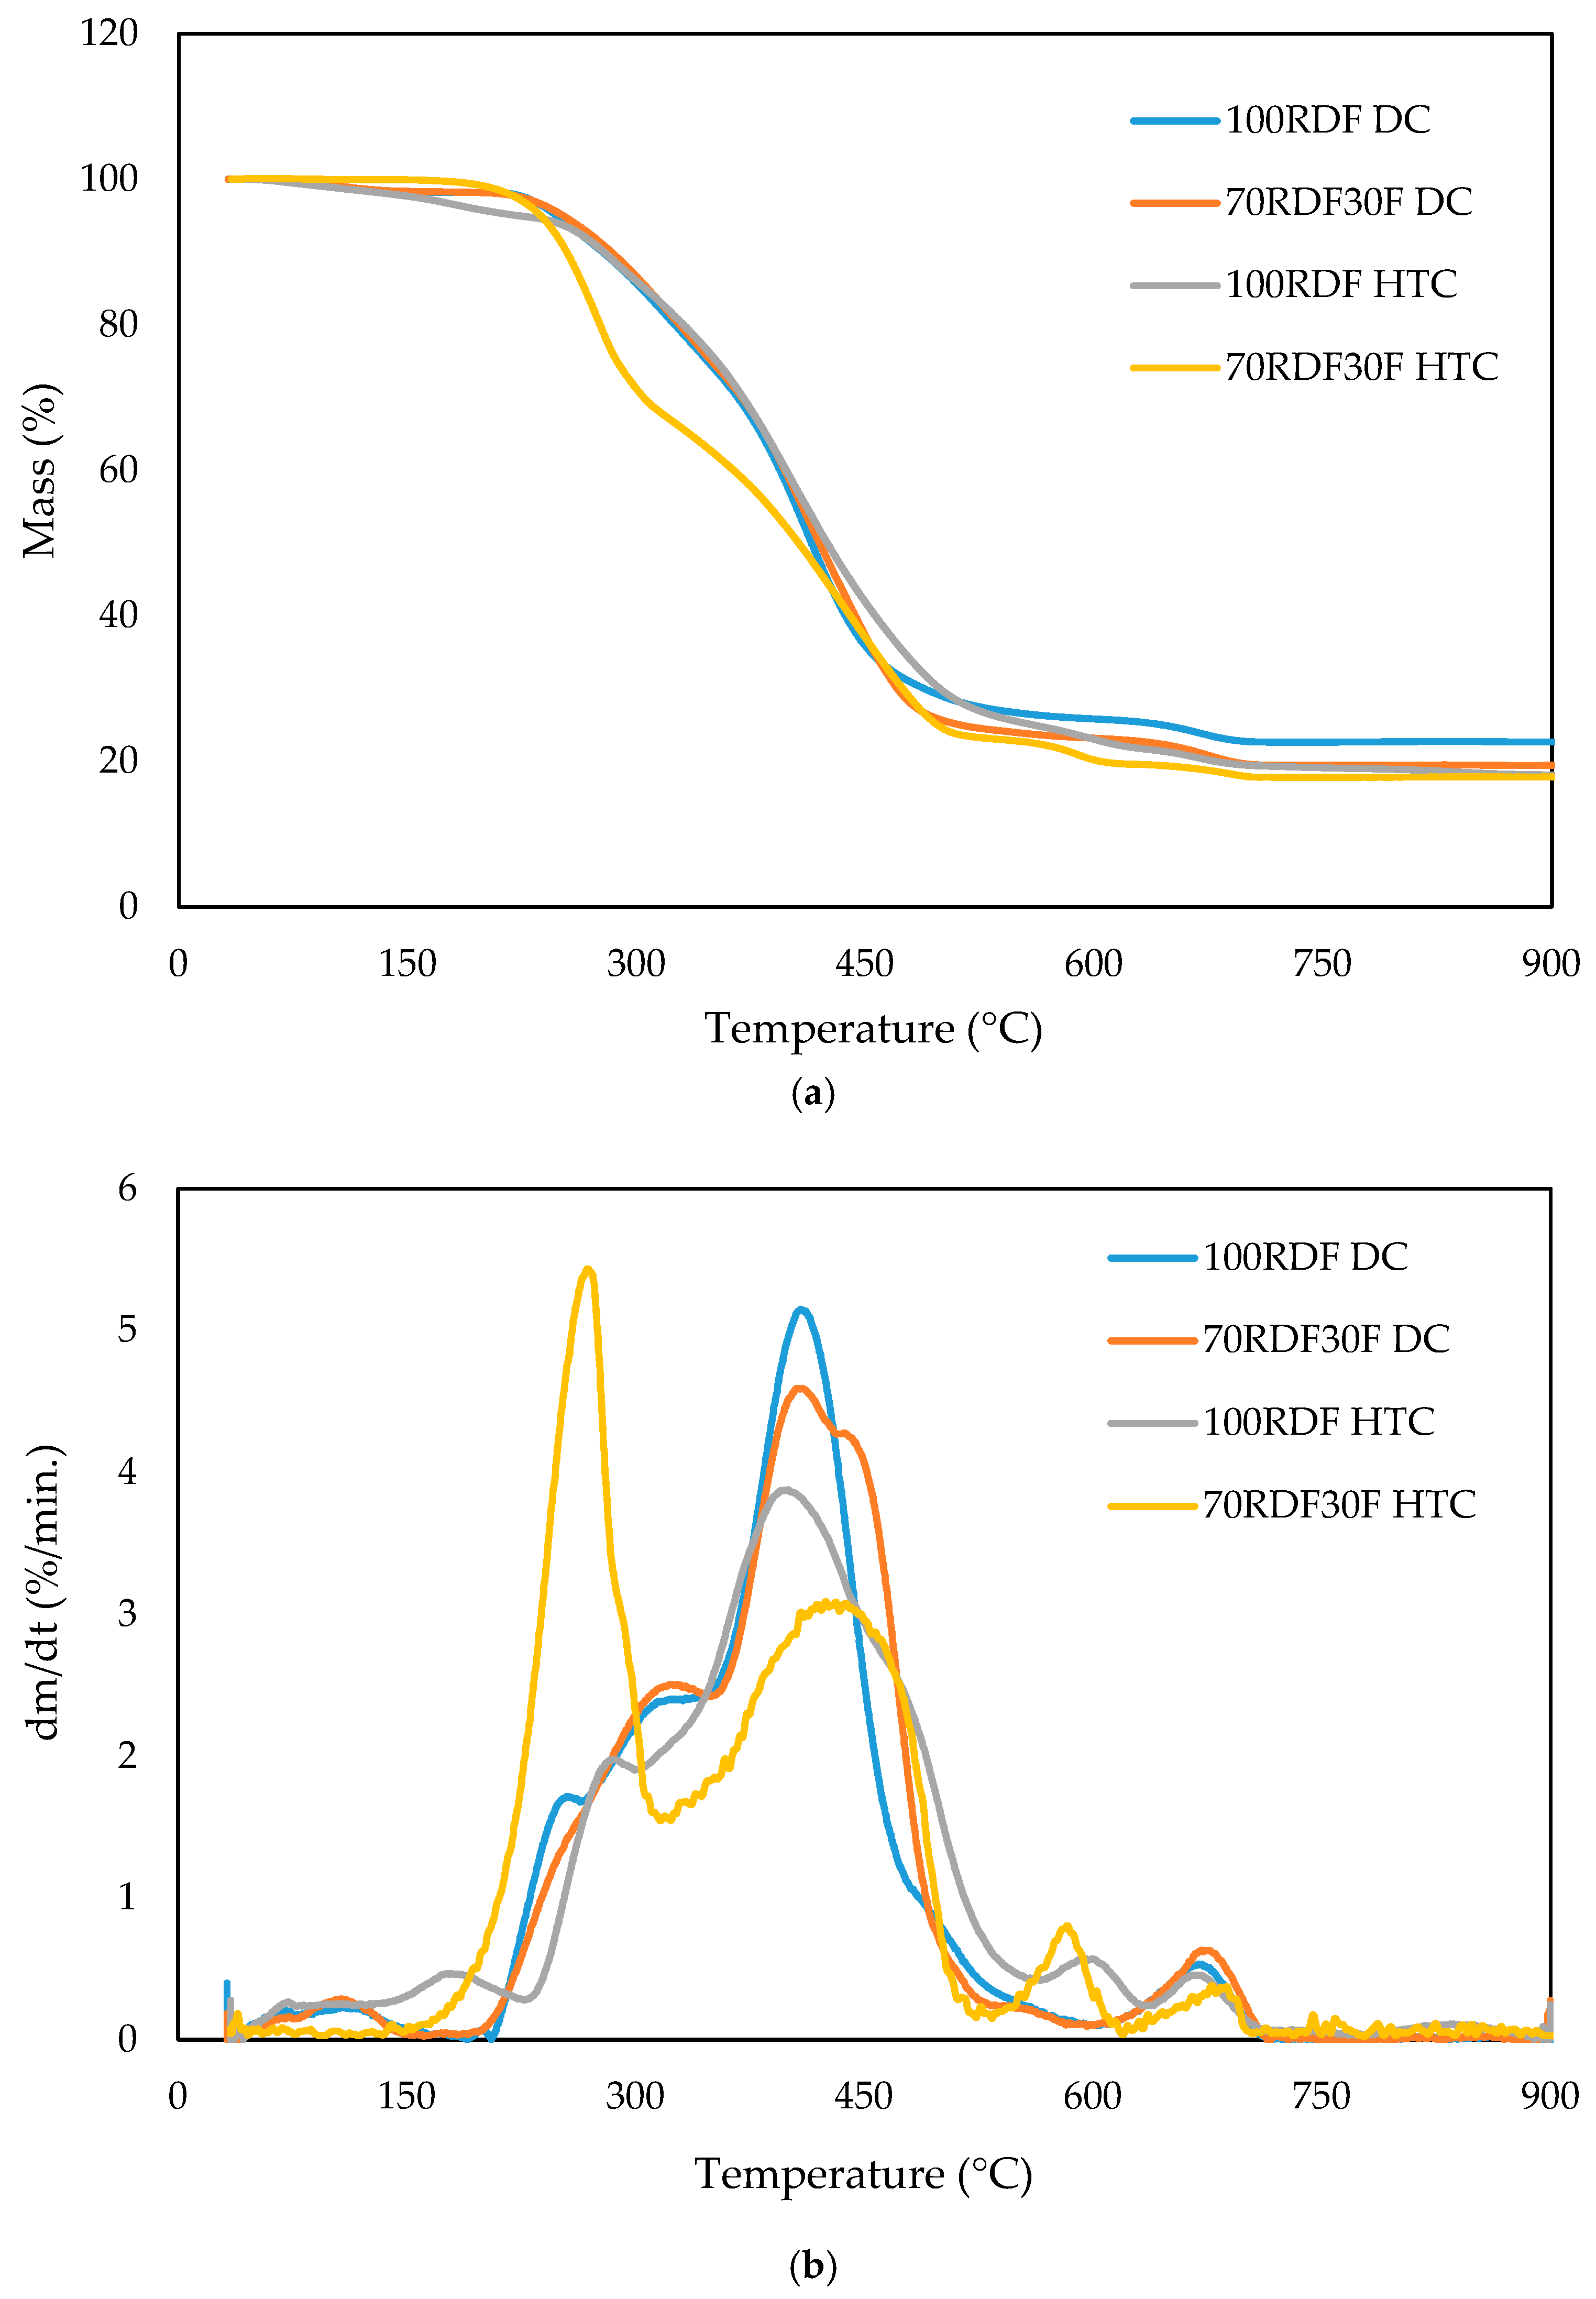
The thermogravimetric analysis (TGA) and the thermogravimetric differential analysis (DTG) of the chars and hydrochars produced from samples composed only of RDF and with 30% fat incorporation are shown in Figure 5.
For all samples, a small initial peak from ambient temperature up to 150 °C is related to moisture loss through water evaporation [80]. The chars showed a mass loss from 200 °C, reaching a certain stability at 300 °C in both samples. From then on, a gradual mass loss occurred, reaching a maximum peak around 400 °C, which was more pronounced in the sample without added fat but lasted longer in the sample with 30% incorporation, extending until 450 °C. From this temperature onwards, there was a stabilization in the mass loss of the samples, which again demonstrated another peak of mass reduction at approximately 670 °C, where at 700 °C, the entire sample appeared to have been decomposed.
For hydrochars, the addition of fat has been shown to reduce the maximum degradation temperature significantly. In the sample without fat incorporation, the thermal degradation behavior was similar to that observed in char samples, with an initial peak occurring at 150 °C and a maximum mass loss around 400 °C, but with lower intensity. Before the peak at 700 °C, another peak was also observed at a temperature close to 600 °C. In the case of hydrochar produced from the incorporation of fat, a significantly different pattern was observed than in the other samples. The mass degradation peak occurred at approximately 275 °C, with a second, lesser-intensity peak at around 430 °C. Similar to the observation for hydrochar without fat incorporation, two peaks of lower intensity were observed at around 600 and 700 °C.
The ignition (Ti) and burnout (Tb) temperatures, as well as the maximum degradation temperatures and the degradation rate per second for the samples composed solely of RDF and with 30% fat addition, are shown in Table 5. Incorporating fat in RDF has been shown to reduce the Ti of chars in both carbonization processes. In the case of DC, the reduction was discreet, and the other parameters presented values with slight variation. A significant decrease was observed in hydrochars with 30% fat incorporation, where Ti reduced from 289 °C to 235 °C. The reduction in Ti for chars compared to the raw samples is beneficial from an energetic valorization perspective, as it requires less energy for combustion initiation. However, lower Ti for solid fuel may bring issues related to self-ignition during storage and transportation [81].
Regarding Tb, the temperature varied little from the sample without fat incorporation (678 °C) to the sample with added fat (684 °C). On the other hand, while the hydrochar sample with fat incorporation presented values similar to those of the chars, the almost total degradation of the sample (99%) of the fat-free hydrochar occurred at a much higher temperature when compared to the other chars (786 °C). The rapid degradation of hydrochar with the addition of fat is evident from the temperatures of maximum mass reduction in the two main peaks (275 and 589 °C), which are significantly lower than those of the other samples analyzed.
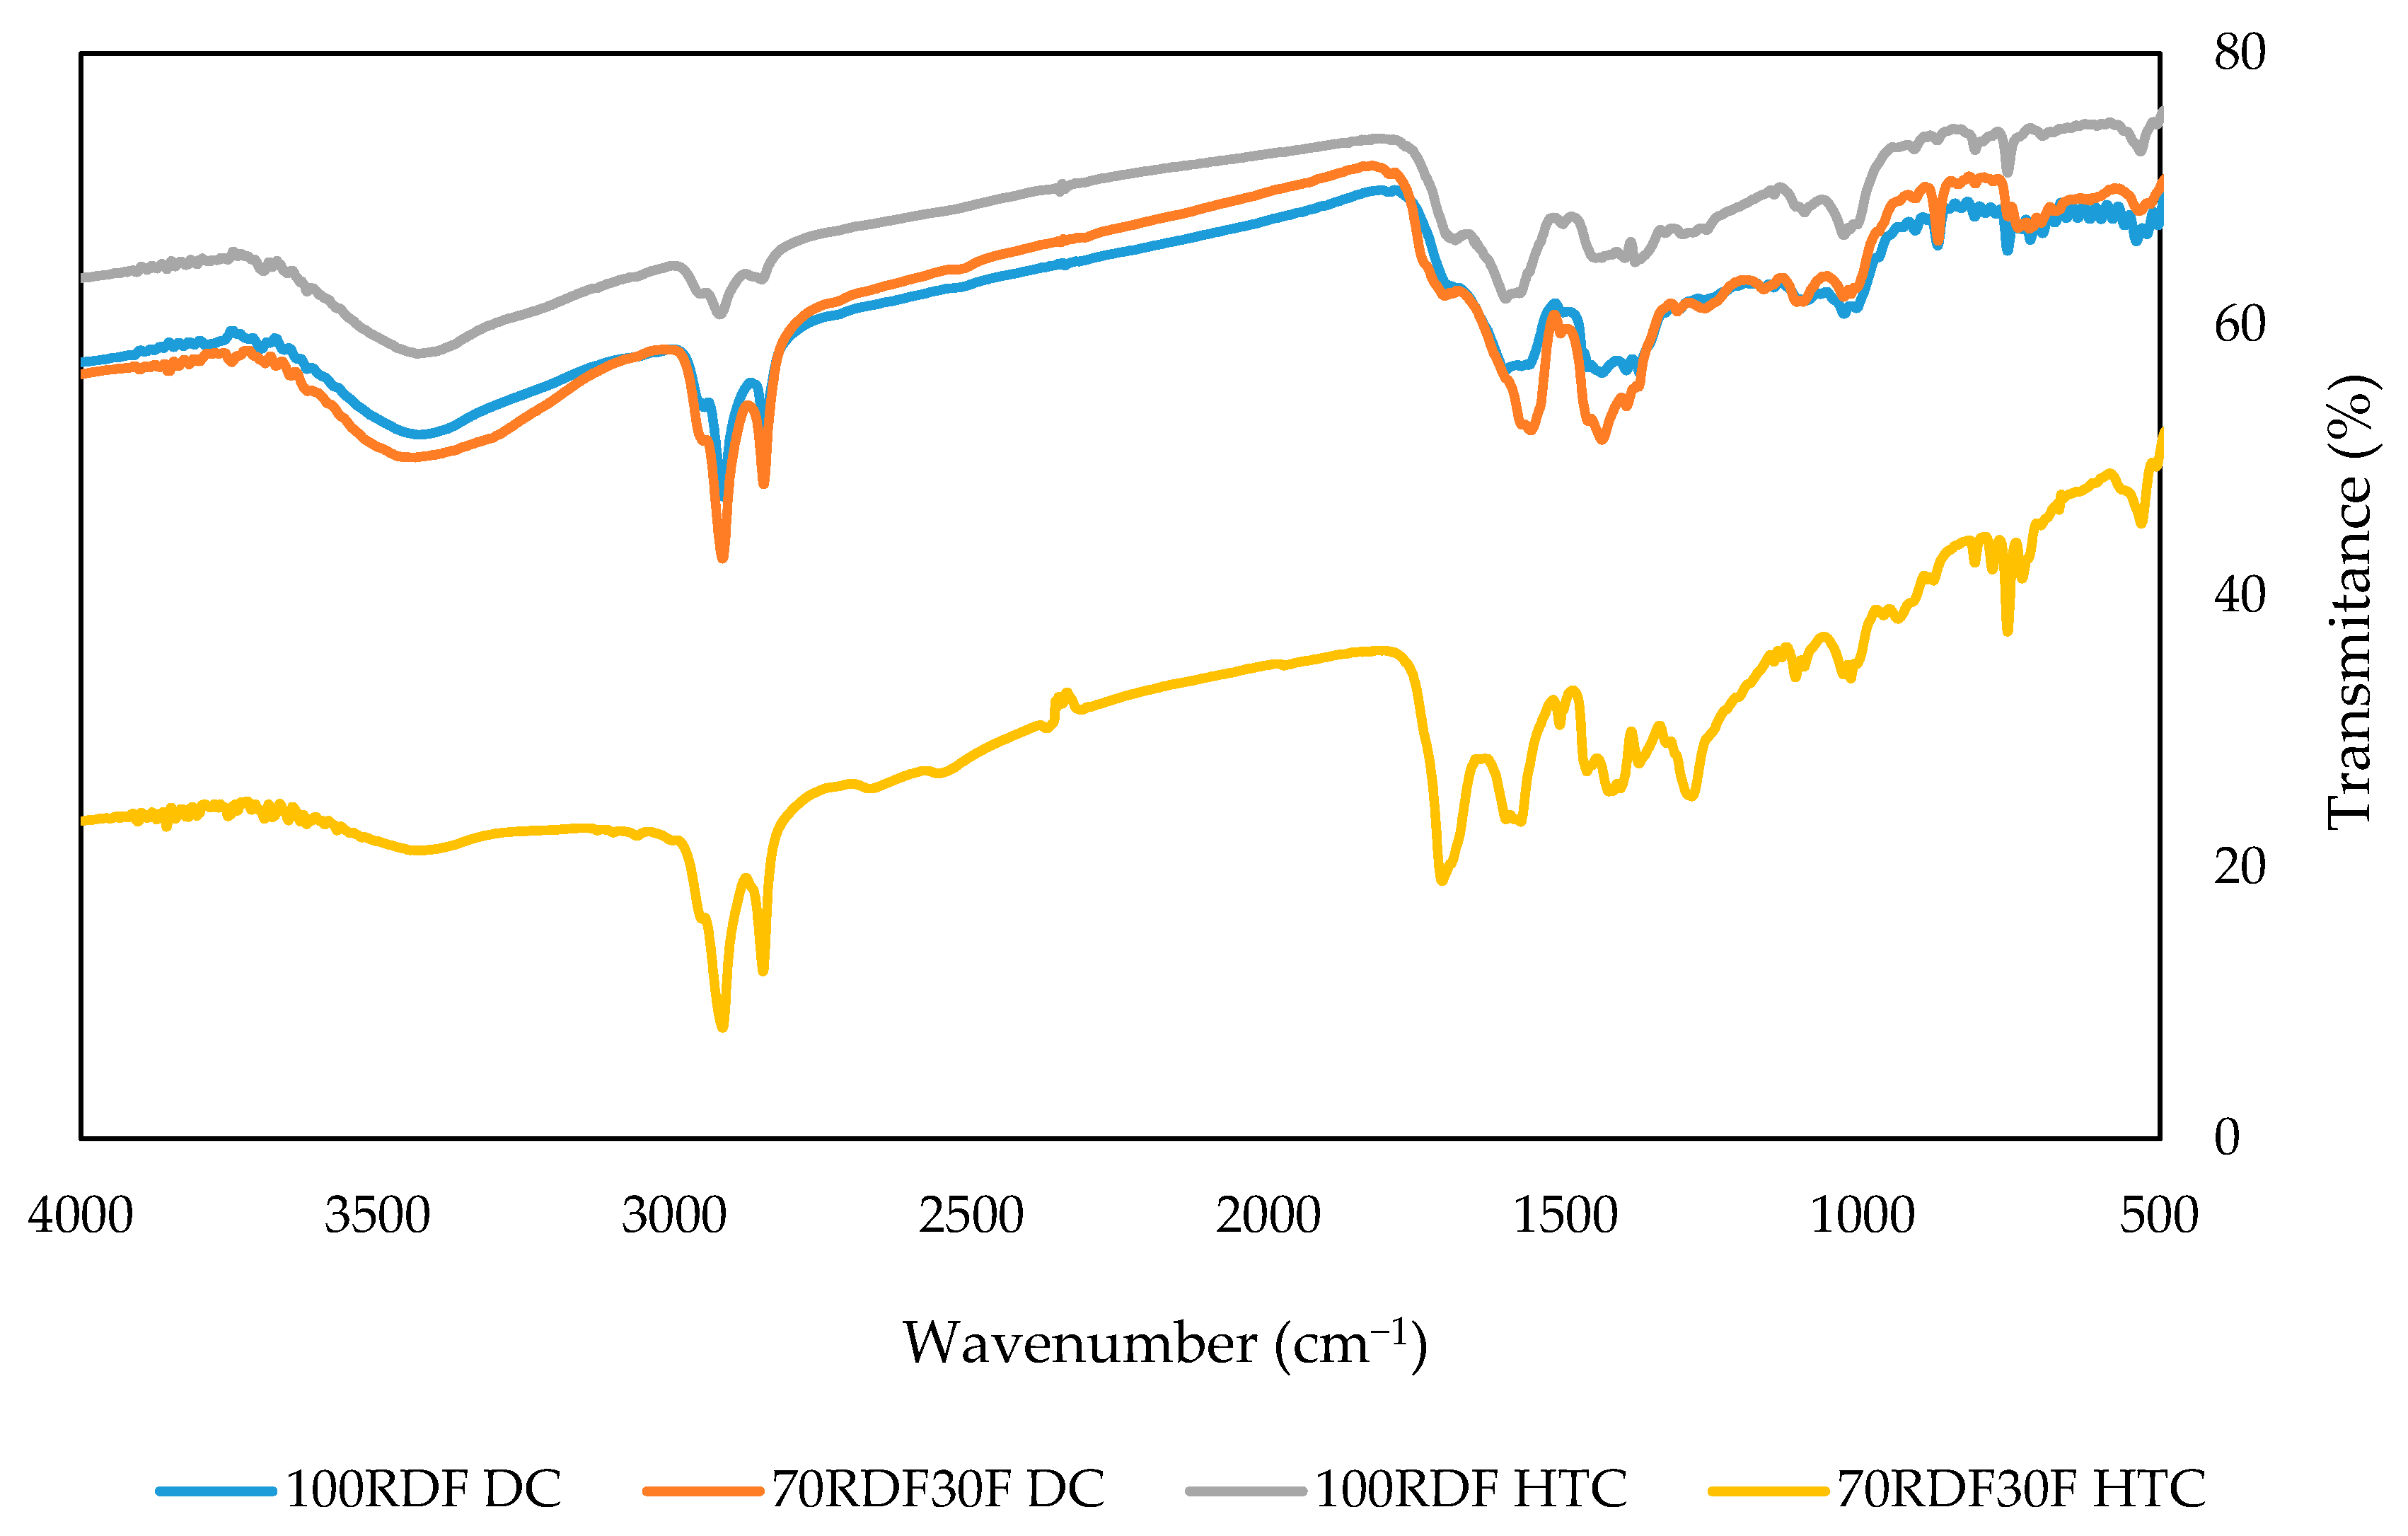
The surface functional groups of chars and hydrochars in the samples produced from solely RDF and with maximum fat incorporation (30%) are presented in the FT-IR spectrum represented in Figure 6.
The band between 3430 and 3437 cm−1, which corresponds to the stretching of the O–H bonds, was observed in all samples apart from the hydrochar sample produced with fat incorporation. The spectrum exhibited a similar behavior among the char samples, with a greater intensity observed in the bands between 1602 and 1559 cm−1 and 1463 and 1377 cm−1, corresponding to the stretching of the C=C bonds of the aromatic compound rings and the bending of the C–H bonds, respectively. The band between 2924 and 2920 cm−1 refers to the stretching of the C–H bonds of alkyl groups [82] and was much less evident in the hydrochar sample without fat incorporation. Furthermore, the hydrochar with fat incorporation exhibited a prominent band at 1708 cm−1 and 1285 cm−1, indicating greater aromaticity in its structure [83]. This is also evident from the highest band at 756 cm−1, compared to the other samples.

3.3. Effluent Characterization

The wastewater from char washing had a light-yellow color, appearing slightly darker and opaque in the sample with 30% fat incorporation. A similar behavior was observed in the HTC liquid effluent from these samples, which showed a brown color and was slightly darker in the sample with the addition of fat. Table 6 shows the characterization results for the DC char-washing wastewater and for the process water from HTC.
The incorporation of fat resulted in an increase in the pH of the char-washing wastewater, ranging from 6.1 in the RDF sample to 7.6 in the sample with 30% fat. The pH variation was not observed in the HTC effluents, as both samples exhibited an acidic character (pH 4.6) with no differences in relation to the fat addition.
Although COD was much higher in HTC effluents (47.9–49.6 g/L) compared to char washing water (4.5–7.0 g/L), the incorporation of fat was responsible for a more evident increase in these last samples, representing 3.5% for the HTC effluent and 55.6% for the char washing effluents.
The addition of fat reduced the chloride content in the effluents, as observed for the chlorine content in chars. Moreover, the fat addition also demonstrated a reduction in the amount of total solids in the effluent samples.
Regarding the mineral composition of the ashes, the addition of fat increased the concentration of all analyzed elements, both in the char-washing wastewater and in the HTC effluent, except for Ti, which obtained values close to zero in all samples.

4. Conclusions

DC and HTC of RDF with low-quality fat have proven to be efficient pre-treatments for producing chars with improved physical and fuel characteristics. In this work, this synergy was demonstrated by the simultaneous improvements in mass yield, key fuel properties (such as HHV and apparent density), and reductions in problematic elements (e.g., ash and chlorine), which exceeded expectations based on simple additive effects, reinforcing the synergistic effect of the positive interaction between RDF and fat.
In DC, the addition of fat resulted in a gradual increase in mass yield (11.5–16.6%) and apparent density (28.7%), accompanied by a rise in volatile matter content (11.5%) and a decrease in ash concentration (−43%). Furthermore, the increase in fat incorporation led to a gradual increase in HHV, with the highest value observed with the maximum percentage of fat (27.9 MJ/kg). A reduction of between 16.3% and 19.7% in chlorine content was observed with the addition of fat; however, washing the chars was necessary, and the washed samples presented values between 0.4% and 0.6%. Incorporating fat also reduced the concentration of elements that tend to form slag and fouling, potentially leading to increased recovery efficiency and reduced equipment maintenance costs.
For hydrochars, a gradual increase in hydrophobicity was observed, with the lowest moisture value in the sample with 30% fat (1.1%), in addition to an increase in volatile matter content (11.5%) and a reduction in ash content (−34.5%). In the sample with the greatest fat incorporation, there was an increase of 36.5% in HHV (32.9 MJ/kg) and 15.2% in apparent density (0.378 g/cm3), together with a reduction of 82.0% in chlorine content (0.4%) compared to hydrochar without added fat.
The addition of fat led to a reduction in the Ti of the chars in both processes (−4.0–18.7%), while Tb did not show a characteristic pattern, increasing slightly in the chars (0.1%) and decreasing in hydrochars (13.7%). Thus, the incorporation of 30% fat proved to be the condition with the greatest potential for producing char with improved fuel properties.

Author Contributions

Conceptualization, A.L. and M.G.; Formal analysis, A.L. and C.N.; Resources, M.G. and P.B.; Data curation, A.L.; Validation: A.L.; Writing—original draft preparation, A.L.; Writing—review and editing, A.L., C.N., P.B. and M.G.; Supervision, M.G. and P.B. All authors have read and agreed to the published version of the manuscript.

Funding

This work was co-funded by: Compete 2020, Portugal 2020, and the European Union through the European Regional Development Fund—FEDER within the scope of the project AmbWTE: Biomass & Waste to Energy System project (POCI-01-0247-FEDER-039838); Fundação para a Ciência e Tecnologia, I.P. (Portuguese Foundation for Science and Technology), under projects UIDB/05064/2020 (VALORIZA—Research Centre for Endogenous Resource Valorization), UIDB/04077/2020-2023 and UIDP/04077/2020-2023 (MEtRICs—Mechanical Engineering and Resource Sustainability Center); Alentejo2020 (Regional Operational Program of Alentejo), grant no. ALT20-05-3559-FSE-000035.

Data Availability Statement

Data will be made available on request.

Conflicts of Interest

The authors declare no conflicts of interest.

References

  1. Lin, C.; Zuo, W.; Yuan, S.; Zhao, P.; Zhou, H. EEffect of Moisture on Gasification of Hydrochar Derived from Real-MSW. Biomass Bioenergy 2023, 178, 106976. [Google Scholar] [CrossRef]
  2. Bardhan, M.; Novera, T.M.; Tabassum, M.; Islam, M.A.; Islam, M.A.; Hameed, B.H. Co-Hydrothermal Carbonization of Different Feedstocks to Hydrochar as Potential Energy for the Future World: A Review. J. Clean. Prod. 2021, 298, 126734. [Google Scholar] [CrossRef]
  3. Niu, M.; Sun, R.; Ding, K.; Gu, H.; Cui, X.; Wang, L.; Hu, J. Synergistic Effect on Thermal Behavior and Product Characteristics during Co-Pyrolysis of Biomass and Waste Tire: Influence of Biomass Species and Waste Blending Ratios. Energy 2021, 240, 122808. [Google Scholar] [CrossRef]
  4. Tauseef, M.; Ansari, A.; Khoja, A.; Naqvi, S.R.; Liaquat, R.; Nimmo, W.; Daood, S. Thermokinetics Synergistic Effects on Co-Pyrolysis of Coal and Rice Husk Blends for Bioenergy Production. Fuel 2022, 318, 123685. [Google Scholar] [CrossRef]
  5. Mishra, R.; Sahoo, A.; Mohanty, K. Pyrolysis Kinetics and Synergistic Effect in Co-Pyrolysis of Samanea Saman Seeds and Polyethylene Terephthalate Using Thermogravimetric Analyser. Bioresour. Technol. 2019, 289, 121608. [Google Scholar] [CrossRef]
  6. Infiesta, L.R.; Ferreira, C.R.N.; Trovó, A.G.; Borges, V.L.; Carvalho, S.R. Design of an Industrial Solid Waste Processing Line to Produce Refuse-Derived Fuel. J. Environ. Manag. 2019, 236, 715–719. [Google Scholar] [CrossRef]
  7. Nobre, C.; Vilarinho, C.; Alves, O.; Mendes, B.; Gonçalves, M. Upgrading of Refuse Derived Fuel through Torrefaction and Carbonization: Evaluation of RDF Char Fuel Properties. Energy 2019, 181, 66–76. [Google Scholar] [CrossRef]
  8. Verhoeff, F.; Adell, A.; Boersma, A.A.R.; Pels, J.R.; Lensselink, J.; Kiel, J.H.A.; Schukken, H. TorTech Torrefaction Technology for the Production of Solid Bioenergy Carriers from Biomass and Waste; ECN: Petten, The Neherlands, 2011. [Google Scholar]
  9. Barskov, S.; Zappi, M.; Buchireddy, P.; Dufreche, S.; Guillory, J.; Gang, D.; Hernandez, R.; Bajpai, R.; Baudier, J.; Cooper, R.; et al. Torrefaction of Biomass: A Review of Production Methods for Biocoal from Cultured and Waste Lignocellulosic Feedstocks. Renew. Energy 2019, 142, 624–642. [Google Scholar] [CrossRef]
  10. Zhang, Y.; Geng, P.; Liu, R. Synergistic Combination of Biomass Torrefaction and Co-Gasification: 1. Reactivity Studies. Bioresour. Technol. 2017, 245, 225–233. [Google Scholar] [CrossRef]
  11. Cahyanti, M.N.; Doddapaneni, T.R.K.C.; Kikas, T. Biomass Torrefaction: An Overview on Process Parameters, Economic and Environmental Aspects and Recent Advancements. Bioresour. Technol. 2020, 301, 122737. [Google Scholar] [CrossRef] [PubMed]
  12. Han, J.; Huang, Z.; Qin, L.; Chen, W.; Zhao, B.; Xing, F. Refused Derived Fuel from Municipal Solid Waste Used as an Alternative Fuel during the Iron Ore Sinter Process. J. Clean. Prod. 2021, 278, 123594. [Google Scholar] [CrossRef]
  13. Manyà, J.J.; García-Ceballos, F.; Azuara, M.; Latorre, N.; Royo, C. Pyrolysis and Char Reactivity of a Poor-Quality Refuse-Derived Fuel (RDF) from Municipal Solid Waste. Fuel Process. Technol. 2015, 140, 276–284. [Google Scholar] [CrossRef]
  14. Nobre, C.; Alves, O.; Longo, A.; Vilarinho, C.; Gonçalves, M. Torrefaction and Carbonization of Refuse Derived Fuel: Char Characterization and Evaluation of Gaseous and Liquid Emissions. Bioresour. Technol. 2019, 285, 121325. [Google Scholar] [CrossRef]
  15. Rago, Y.P.; Collard, F.X.; Görgens, J.F.; Surroop, D.; Mohee, R. Torrefaction of Biomass and Plastic from Municipal Solid Waste Streams and Their Blends: Evaluation of Interactive Effects. Fuel 2020, 277, 118089. [Google Scholar] [CrossRef]
  16. Dong, X.; Wang, Z.; Zhang, J.; Zhan, W.; Gao, L.; He, Z. Synthesis and Characteristics of Carbon-Based Synfuel from Biomass and Coal Powder by Synergistic Co-Carbonization Technology. Renew. Energy 2024, 227, 120458. [Google Scholar] [CrossRef]
  17. Wei, Y.; Fakudze, S.; Zhang, Y.; Ma, R.; Shang, Q.; Chen, J.; Liu, C.; Chu, Q. Co-Hydrothermal Carbonization of Pomelo Peel and PVC for Production of Hydrochar Pellets with Enhanced Fuel Properties and Dechlorination. Energy 2022, 239, 122350. [Google Scholar] [CrossRef]
  18. Mahata, S.; Periyavaram, S.R.; Akkupalli, N.K.; Srivastava, S.; Matli, C. A Review on Co-Hydrothermal Carbonization of Sludge: Effect of Process Parameters, Reaction Pathway, and Pollutant Transport. J. Energy Inst. 2023, 110, 101340. [Google Scholar] [CrossRef]
  19. Piboonudomkarn, S.; Khemthong, P.; Youngjan, S.; Wantala, K. Co-Hydrothermally Carbonized Sewage Sludge and Lignocellulosic Biomass: An Efficiently Renewable Solid Fuel. Arab. J. Chem. 2023, 16, 105315. [Google Scholar] [CrossRef]
  20. Sharma, H.B.; Dubey, B.K. Co-Hydrothermal Carbonization of Food Waste with Yard Waste for Solid Biofuel Production: Hydrochar Characterization and Its Pelletization. Waste Manag. 2020, 118, 521–533. [Google Scholar] [CrossRef]
  21. Wang, T.; Si, B.; Gong, Z.; Zhai, Y.; Cao, M.; Peng, C. Co-Hydrothermal Carbonization of Food Waste-Woody Sawdust Blend: Interaction Effects on the Hydrochar Properties and Nutrients Characteristics. Bioresour. Technol. 2020, 316, 123900. [Google Scholar] [CrossRef]
  22. Ul Saqib, N.; Sarmah, A.K.; Baroutian, S. Effect of Temperature on the Fuel Properties of Food Waste and Coal Blend Treated under Co-Hydrothermal Carbonization. Waste Manag. 2019, 89, 236–246. [Google Scholar] [CrossRef]
  23. He, C.; Zhang, Z.; Ge, C.; Liu, W.; Tang, Y.; Zhuang, X.; Qiu, R. Synergistic Effect of Hydrothermal Co-Carbonization of Sewage Sludge with Fruit and Agricultural Wastes on Hydrochar Fuel Quality and Combustion Behavior. Waste Manag. 2019, 100, 171–181. [Google Scholar] [CrossRef]
  24. González-Arias, J.; Carnicero, A.; Sánchez, M.E.; Martínez, E.J.; López, R.; Cara-Jiménez, J. Management of Off-Specification Compost by Using Co-Hydrothermal Carbonization with Olive Tree Pruning. Assessing Energy Potential of Hydrochar. Waste Manag. 2021, 124, 224–234. [Google Scholar] [CrossRef]
  25. Zhang, C.; Zheng, C.; Ma, X.; Zhou, Y.; Wu, J. Co-Hydrothermal Carbonization of Sewage Sludge and Banana Stalk: Fuel Properties of Hydrochar and Environmental Risks of Heavy Metals. J. Environ. Chem. Eng. 2021, 9, 106051. [Google Scholar] [CrossRef]
  26. Li, Q.; Zhang, S.; Gholizadeh, M.; Hu, X.; Yuan, X.; Sarkar, B.; Vithanage, M.; Mašek, O.; Ok, Y.S. Co-Hydrothermal Carbonization of Swine and Chicken Manure: Influence of Cross-Interaction on Hydrochar and Liquid Characteristics. Sci. Total Environ. 2021, 786, 147381. [Google Scholar] [CrossRef]
  27. Li, Q.; Lin, H.; Zhang, S.; Yuan, X.; Gholizadeh, M.; Wang, Y.; Xiang, J.; Hu, S.; Hu, X. Co-Hydrothermal Carbonization of Swine Manure and Cellulose: Influence of Mutual Interaction of Intermediates on Properties of the Products. Sci. Total Environ. 2021, 791, 148134. [Google Scholar] [CrossRef]
  28. Belete, Y.Z.; Mau, V.; Yahav Spitzer, R.; Posmanik, R.; Jassby, D.; Iddya, A.; Kassem, N.; Tester, J.W.; Gross, A. Hydrothermal Carbonization of Anaerobic Digestate and Manure from a Dairy Farm on Energy Recovery and the Fate of Nutrients. Bioresour. Technol. 2021, 333, 125164. [Google Scholar] [CrossRef]
  29. Xu, Z.; Qi, R.; Zhang, D.; Gao, Y.; Xiong, M.; Chen, W. Co-Hydrothermal Carbonization of Cotton Textile Waste and Polyvinyl Chloride Waste for the Production of Solid Fuel: Interaction Mechanisms and Combustion Behaviors. J. Clean. Prod. 2021, 316, 128306. [Google Scholar] [CrossRef]
  30. Zhang, X.; Zhang, L.; Li, A. Co-Hydrothermal Carbonization of Lignocellulosic Biomass and Waste Polyvinyl Chloride for High-Quality Solid Fuel Production: Hydrochar Properties and Its Combustion and Pyrolysis Behaviors. Bioresour. Technol. 2019, 294, 122113. [Google Scholar] [CrossRef]
  31. Lin, C.; Zhao, P.; Ding, Y.; Cui, X.; Liu, F.; Wang, C.; Guo, Q. Hydrogen-Rich Gas Production from Hydrochar Derived from Hydrothermal Carbonization of PVC and Alkali Coal. Fuel Process. Technol. 2021, 222, 106959. [Google Scholar] [CrossRef]
  32. Huang, N.; Zhao, P.; Ghosh, S.; Fedyukhin, A. Co-Hydrothermal Carbonization of Polyvinyl Chloride and Moist Biomass to Remove Chlorine and Inorganics for Clean Fuel Production. Appl. Energy 2019, 240, 882–892. [Google Scholar] [CrossRef]
  33. Shen, Y. A Review on Hydrothermal Carbonization of Biomass and Plastic Wastes to Energy Products. Biomass Bioenergy 2020, 134, 105479. [Google Scholar] [CrossRef]
  34. Kossińska, N.; Grosser, A.; Kwapińska, M.; Kwapiński, W.; Ghazal, H.; Jouhara, H.; Krzyżyńska, R. Co-Hydrothermal Carbonization as a Potential Method of Utilising Digested Sludge and Screenings from Wastewater Treatment Plants towards Energy Application. Energy 2024, 299, 131456. [Google Scholar] [CrossRef]
  35. Petrovič, A.; Predikaka, T.C.; Škodič, L.; Vohl, S.; Čuček, L. Hydrothermal Co-Carbonization of Sewage Sludge and Whey: Enhancement of Product Properties and Potential Application in Agriculture. Fuel 2023, 350, 128807. [Google Scholar] [CrossRef]
  36. Li, C.S.; Cai, R.R.; Hasan, A.; Lu, X.L.; Yang, X.X.; Zhang, Y.G. Fertility Assessment and Nutrient Conversion of Hydrochars Derived from Co-Hydrothermal Carbonization between Livestock Manure and Corn Cob. J. Environ. Chem. Eng. 2023, 11, 109166. [Google Scholar] [CrossRef]
  37. Ebrahim Malool, M.; Keshavarz Moraveji, M.; Shayegan, J. Co-Hydrothermal Carbonization of Digested Sewage Sludge and Sugarcane Bagasse: Integrated Approach for Waste Management, Optimized Production, Characterization and Pb(II) Adsorption. Alex. Eng. J. 2023, 74, 79–105. [Google Scholar] [CrossRef]
  38. Yan, T.; Zhang, T.; Wang, S.; Andrea, K.; Peng, H.; Yuan, H.; Zhu, Z. Multivariate and Multi-Interface Insights into Carbon and Energy Recovery and Conversion Characteristics of Hydrothermal Carbonization of Biomass Waste from Duck Farm. Waste Manag. 2023, 170, 154–165. [Google Scholar] [CrossRef]
  39. Yatish, K.V.; Ningaraju, C.; Lalithamba, H.S.; Sakar, M.; Geetha Balakrishna, R. Demonstrating Photocatalytic Esterification as a Potential Strategy to Improve the Properties of Feedstock Oil Derived from Dairy Waste Scum for Biodiesel Production. Energy Convers. Manag. 2024, 309, 118463. [Google Scholar] [CrossRef]
  40. Valizadeh, S.; Valizadeh, B.; Khani, Y.; Jae, J.; Hyun Ko, C.; Park, Y.K. Production of Biodiesel via Esterification of Coffee Waste-Derived Bio-Oil Using Sulfonated Catalysts. Bioresour. Technol. 2024, 404, 130908. [Google Scholar] [CrossRef]
  41. Paula Soares Dias, A.; Saraiva, N.; Rijo, B.; Francisco Costa Pereira, M.; Santos, L.F.; Galhano, R.; Paulo, I. Sugar Derived Hydrochar Catalysts for Enhanced Biodiesel Production via Esterification. Fuel 2024, 374, 132459. [Google Scholar] [CrossRef]
  42. Shah, M.; Poudel, J.; Kwak, H.; Oh, S.C. Kinetic Analysis of Transesterification of Waste Pig Fat in Supercritical Alcohols. Process Saf. Environ. Prot. 2015, 98, 239–244. [Google Scholar] [CrossRef]
  43. Hariprasath, P.; Vijayakumar, V.; Selvamani, S.T.; Vigneshwar, M.; Palanikumar, K. Some Studies on Waste Animal Tallow Biodiesel Produced by Modified Transesterification Method Using Heterogeneous Catalyst. Mater. Today Proc. 2019, 16, 1271–1278. [Google Scholar] [CrossRef]
  44. Andreo-Martínez, P.; Ortiz-Martínez, V.M.; Salar-García, M.J.; Veiga-del-Baño, J.M.; Chica, A.; Quesada-Medina, J. Waste Animal Fats as Feedstock for Biodiesel Production Using Non-Catalytic Supercritical Alcohol Transesterification: A Perspective by the PRISMA Methodology. Energy Sustain. Dev. 2022, 69, 150–163. [Google Scholar] [CrossRef]
  45. Encinar, J.M.; Nogales-Delgado, S.; Sánchez, N. Pre-Esterification of High Acidity Animal Fats to Produce Biodiesel: A Kinetic Study. Arab. J. Chem. 2021, 14, 103048. [Google Scholar] [CrossRef]
  46. Magdziarz, A.; Jerzak, W.; Wądrzyk, M.; Sieradzka, M. Benefits from Co-Pyrolysis of Biomass and Refuse Derived Fuel for Biofuels Production: Experimental Investigations. Renew. Energy 2024, 230, 120808. [Google Scholar] [CrossRef]
  47. Zaini, I.; Wen, Y.; Mousa, E.; Jönsson, P.; Yang, W. Primary Fragmentation Behavior of Refuse Derived Fuel Pellets during Rapid Pyrolysis. Fuel Process. Technol. 2021, 216, 106796. [Google Scholar] [CrossRef]
  48. Bhatt, M.; Wagh, S.; Chakinala, A.; Pant, K.; Sharma, T.; Joshi, J.; Shah, K.; Sharma, A. Conversion of Refuse Derived Fuel from Municipal Solid Waste into Valuable Chemicals Using Advanced Thermo-Chemical Process. J. Clean. Prod. 2021, 329, 129653. [Google Scholar] [CrossRef]
  49. Nobre, C.; Alves, O.; Durão, L.; Şen, A.; Vilarinho, C.; Gonçalves, M. Characterization of Hydrochar and Process Water from the Hydrothermal Carbonization of Refuse Derived Fuel. Waste Manag. 2020, 120, 303–313. [Google Scholar] [CrossRef]
  50. Longo, A.; Alves, O.; Șen, A.U.; Nobre, C.; Brito, P.; Gonçalves, M. Dry and Hydrothermal Co-Carbonization of Mixed Refuse-Derived Fuel (RDF) for Solid Fuel Production. Reactions 2024, 5, 77–97. [Google Scholar] [CrossRef]
  51. Longo, A.; Pacheco, N.; Panizio, R.; Vilarinho, C.; Brito, P.; Gonçalves, M. Carbonization of Refuse-Derived Fuel Pellets with Biomass Incorporation to Solid Fuel Production. Fuels 2024, 5, 746–761. [Google Scholar] [CrossRef]
  52. CEN/TS 15414-1; Solid Recoverd Fuels–Determination of Moisture Content Usign the Oven Dry Method–Part 1: Determinations of Total Moisture by a Reference Method. European Committee for Standarization (CEN): Brussels, Belgium, 2010; Volume 1.
  53. EN 15402:2011; Solid Recovered Fuels–Determination of the Content of Volatile Matter. European Committee for Standarization (CEN): Brussels, Belgium, 2010.
  54. EN 15403; Solid Recoverd Fuels–Determination of Ash Content. European Committee for Standarization (CEN): Brussels, Belgium, 2011.
  55. Standard Methods for the Examination of Water and Wastewater, 23rd ed.; Baird, R.B., Eaton, A.D., Rice, E., Eds.; American Public Health Association: Washington, DC, USA, 2017. [Google Scholar]
  56. EPA-SW-9253; Clhoride (Titrimetric, Silver Nitrate). United States Environmental Protection Agency (EPA): Washington, DC, USA, 1994; Volume 16.
  57. Liu, X.; Tan, H.; Wang, X.; Wang, Z.; Xiong, X. Oxidation Reactivity and Kinetic Analysis of Bituminous Coal Char from High-Temperature Pyrolysis: Effect of Heating Rate and Pyrolysis Temperature. Thermochim. Acta 2020, 690, 178660. [Google Scholar] [CrossRef]
  58. Ovčačíková, H.; Velička, M.; Vlček, J.; Topinková, M.; Klárová, M.; Burda, J. Corrosive Effect of Wood Ash Produced by Biomass Combustion on Refractory Materials in a Binary Al–Si System. Materials 2022, 15, 5796. [Google Scholar] [CrossRef]
  59. Benavente, V.; Lage, S.; Gentili, F.; Jansson, S. Influence of Lipid Extraction and Processing Conditions on Hydrothermal Conversion of Microalgae Feedstocks – Effect on Hydrochar Composition, Secondary Char Formation and Phytotoxicity. Chem. Eng. J. 2021, 428, 129559. [Google Scholar] [CrossRef]
  60. Adeniyi, A.; Iwuozor, K.; Emenike, E.; Ajala, O.; Ogunniyi, S.; Muritala, K. Thermochemical Co-Conversion of Biomass-Plastic Waste to Biochar: A Review. Green Chem. Eng. 2023, 5, 31–49. [Google Scholar] [CrossRef]
  61. Ajorloo, M.; Ghodrat, M.; Scott, J.; Strezov, V. Experimental Analysis of the Effects of Feedstock Composition on the Plastic and Biomass Co-Gasification Process. Renew. Energy 2024, 231, 120960. [Google Scholar] [CrossRef]
  62. Guo, S.; Wang, Z.; Chen, G.; Zhang, M.; Sun, T.; Wang, Q.; Du, Z.; Chen, Y.; Wu, M.; Li, Z.; et al. Co-Pyrolysis Characteristics of Forestry and Agricultural Residues and Waste Plastics: Thermal Decomposition and Products Distribution. Process Saf. Environ. Prot. 2023, 177, 380–390. [Google Scholar] [CrossRef]
  63. Pecchi, M.; Baratieri, M.; Goldfarb, J.; Maag, A. Effect of Solvent and Feedstock Selection on Primary and Secondary Chars Produced via Hydrothermal Carbonization of Food Wastes. Bioresour. Technol. 2022, 348, 126799. [Google Scholar] [CrossRef]
  64. Broch, A.; Jena, U.; Hoekman, S.; Langford, J. Analysis of Solid and Aqueous Phase Products from Hydrothermal Carbonization of Whole and Lipid-Extracted Algae. Energies 2013, 7, 62–79. [Google Scholar] [CrossRef]
  65. Li, Y.; Liu, H.; Xiao, K.; Liu, X.; Hu, H.; Li, X.; Yao, H. Correlations between the Physicochemical Properties of Hydrochar and Specific Components of Waste Lettuce: Influence of Moisture, Carbohydrates, Proteins and Lipids. Bioresour. Technol. 2019, 272, 482–488. [Google Scholar] [CrossRef]
  66. Aliyu, M.; Iwabuchi, K.; Itoh, T. Upgrading the Fuel Properties of Hydrochar by Co-Hydrothermal Carbonisation of Dairy Manure and Japanese Larch (Larix Kaempferi): Product Characterisation, Thermal Behaviour, Kinetics and Thermodynamic Properties. Biomass Convers. Biorefinery 2023, 13, 11917–11932. [Google Scholar] [CrossRef]
  67. Figueiró, C.G.; Vital, B.R.; de Carneiro, A.C.O.; da Silva, C.M.S.; Magalhães, M.A.; de Fialho, L.F. Energy Valorization of Woody Biomass by Torrefaction Treatment: A Brazilian Experimental Study. Maderas Cienc. Tecnol. 2019, 21, 297–304. [Google Scholar] [CrossRef]
  68. Liu, X.; Peng, L.; Deng, P.; Xu, Y.; Wang, P.; Tan, Q.; Zhang, C.; Dai, X. Co-Hydrothermal Carbonization of Sewage Sludge and Rice Straw to Improve Hydrochar Quality: Effects of Mixing Ratio and Hydrothermal Temperature. Bioresour. Technol. 2024, 415, 131665. [Google Scholar] [CrossRef]
  69. Petrovič, A.; Predikaka, T.C.; Vuković, J.P.; Jednačak, T.; Hribernik, S.; Vohl, S.; Urbancl, D.; Tišma, M.; Čuček, L. Sustainable Hydrothermal Co-Carbonization of Residues from the Vegetable Oil Industry and Sewage Sludge: Hydrochar Production and Liquid Fraction Valorisation. Energy 2024, 307, 132760. [Google Scholar] [CrossRef]
  70. Shen, Q.; Zhu, X.; Peng, Y.; Xu, M.-M.; Huang, Y.; Xia, A.; Zhu, X.; Liao, Q. Structure Evolution Characteristic of Hydrochar and Nitrogen Transformation Mechanism during Co-Hydrothermal Carbonization Process of Microalgae and Biomass. Energy 2024, 295, 131028. [Google Scholar] [CrossRef]
  71. Tumuluru, J.S.; Ghiasi, B.; Soelberg, N.R.; Sokhansanj, S. Biomass Torrefaction Process, Product Properties, Reactor Types, and Moving Bed Reactor Design Concepts. Front. Energy Res. 2021, 9, 1–20. [Google Scholar] [CrossRef]
  72. ÖzyuǧUran, A.; Yaman, S. Prediction of Calorific Value of Biomass from Proximate Analysis. Energy Procedia 2017, 107, 130–136. [Google Scholar] [CrossRef]
  73. Zhang, P.; Shao, Y.; Niu, J.; Zeng, X.; Zheng, X.; Wu, C. Effect of Low-Nitrogen Combustion System with Flue Gas Circulation Technology on the Performance of NOx Emission in Waste-to-Energy Power Plant. Chem. Eng. Process. - Process Intensif. 2022, 175, 108910. [Google Scholar] [CrossRef]
  74. Papadopoulos, C.; Kourtelesis, M.; Moschovi, A.M.; Sakkas, K.M.; Yakoumis, I. Selected Techniques for Cutting SOx Emissions in Maritime Industry. Technologies 2022, 10, 99. [Google Scholar] [CrossRef]
  75. Chen, W.H.; Lu, K.M.; Tsai, C.M. An Experimental Analysis on Property and Structure Variations of Agricultural Wastes Undergoing Torrefaction. Appl. Energy 2012, 100, 318–325. [Google Scholar] [CrossRef]
  76. Nhuchhen, D.R.; Afzal, M.T. HHV Predicting Correlations for Torrefied Biomass Using Proximate and Ultimate Analyses. Bioengineering 2017, 4, 7. [Google Scholar] [CrossRef]
  77. Wang, Y.; Hu, S.; Li, W.; Gu, J.; Yuan, H.; Ling, X.; Chen, Y. Chlorine Migration Mechanisms during Torrefaction of Fermentation Residue from Food Waste. Bioresour. Technol. 2019, 271, 9–15. [Google Scholar] [CrossRef]
  78. Mota-Panizio, R.; Hermoso-Orzáez, M.J.; Carmo-Calado, L.; Calado, H.; Goncalves, M.M.; Brito, P. Co-Carbonization of a Mixture of Waste Insulation Electric Cables (WIEC) and Lignocellulosic Waste, for the Removal of Chlorine: Biochar Properties and Their Behaviors. Fuel 2022, 320, 123932. [Google Scholar] [CrossRef]
  79. Teixeira, P.; Lopes, H.; Gulyurtlu, I.; Lapa, N.; Abelha, P. Evaluation of Slagging and Fouling Tendency during Biomass Co-Firing with Coal in a Fluidized Bed. Biomass Bioenergy 2012, 39, 192–203. [Google Scholar] [CrossRef]
  80. Porshnov, D.; Ozols, V.; Ansone-Bertina, L.; Burlakovs, J.; Klavins, M. Thermal Decomposition Study of Major Refuse Derived Fuel Components. Energy Procedia 2018, 147, 48–53. [Google Scholar] [CrossRef]
  81. Lu, J.J.; Chen, W.H. Investigation on the Ignition and Burnout Temperatures of Bamboo and Sugarcane Bagasse by Thermogravimetric Analysis. Appl. Energy 2015, 160, 49–57. [Google Scholar] [CrossRef]
  82. Çepelioğullar; Haykiri-Açma, H.; Yaman, S. Kinetic Modelling of RDF Pyrolysis: Model-Fitting and Model-Free Approaches. Waste Manag. 2016, 48, 275–284. [Google Scholar] [CrossRef]
  83. Yao, Z.; Ma, X. Characteristics of Co-Hydrothermal Carbonization on Polyvinyl Chloride Wastes with Bamboo. Bioresour. Technol. 2018, 247, 302–309. [Google Scholar] [CrossRef] [PubMed]
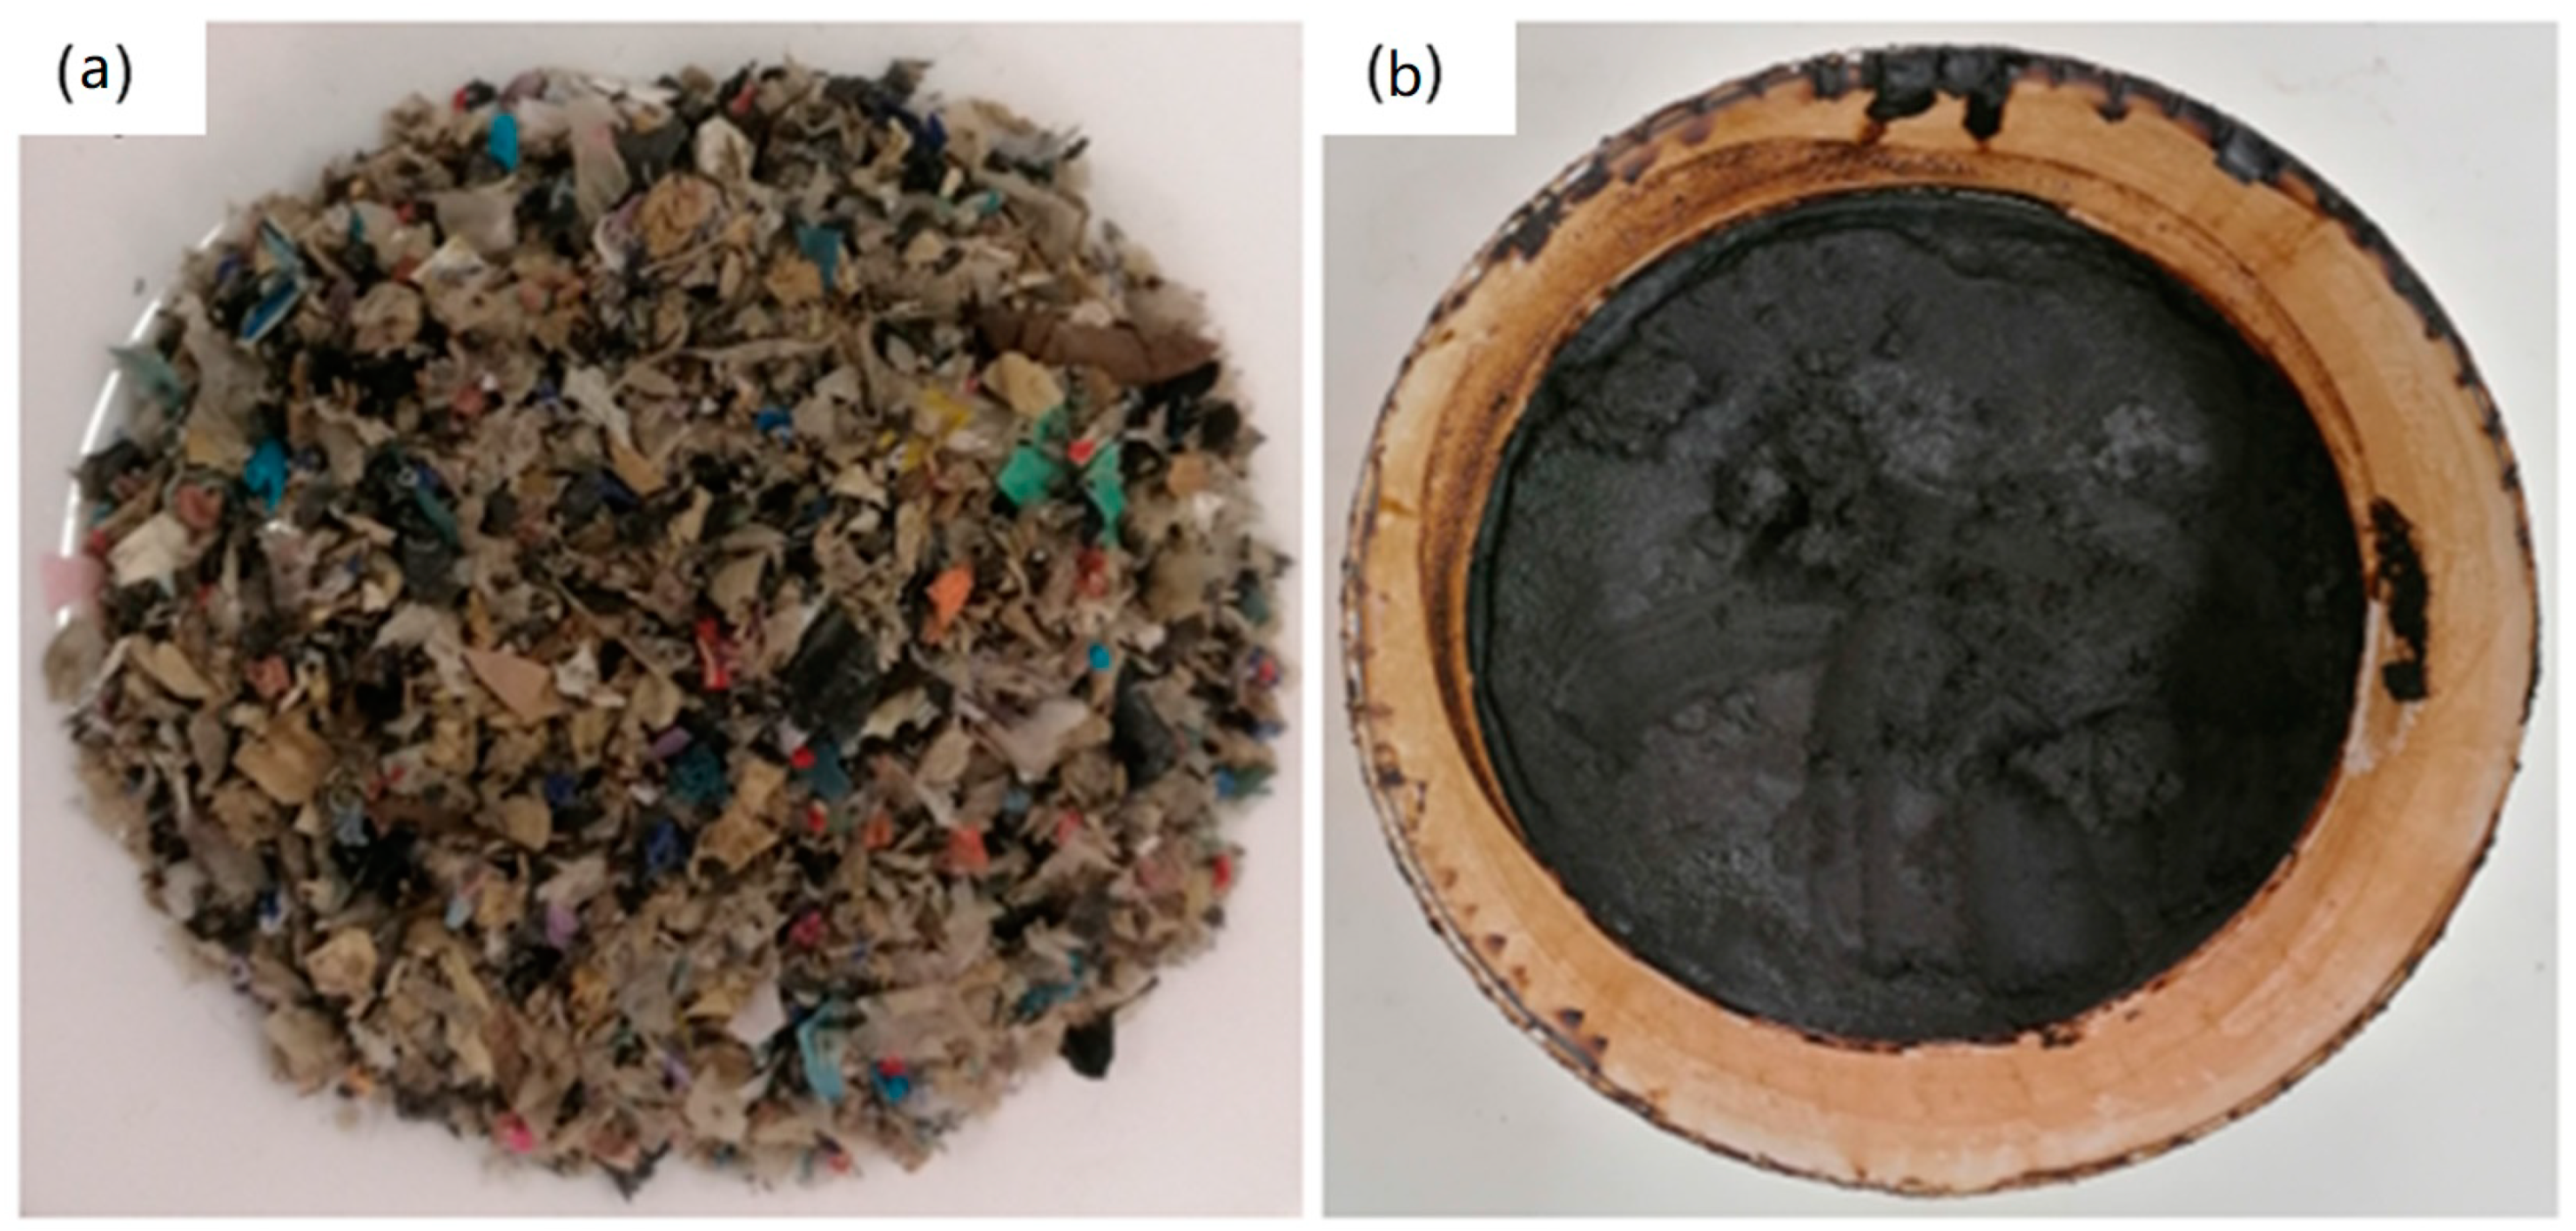
Figure 1. (a) RDF sample and (b) fat waste sample.
Applsci 15 09315 g001
Figure 2. Mass yield and apparent density of chars and hydrochars.
Applsci 15 09315 g002
Figure 3. Van Krevelen diagram for the raw RDF, chars, and hydrochars.
Applsci 15 09315 g003
Figure 4. (a) HHV of the chars (before and after washing) and hydrochars; (b) chlorine content of the chars (before and after washing) and hydrochars.
Applsci 15 09315 g004aApplsci 15 09315 g004b
Figure 5. (a) TGA and (b) DTG of chars and hydrochars.
Applsci 15 09315 g005
Figure 6. The FT-IR spectrum of the chars and hydrochars with 0% and 30% fat incorporation.
Applsci 15 09315 g006
Table 1. Sample composition and carbonization conditions.
Thermochemical MethodSampleComposition (wt.%)T (°C)t (min)
RDFFat
Dry carbonization
(DC)
100RDF100042530
90RDF10F9010
80RDF20F8020
70RDF30F7030
Hydrothermal
carbonization
(HTC)
100RDF1000300
90RDF10F9010
80RDF20F8020
70RDF30F7030
Table 2. Characterization of chars, hydrochars, and effluents.
AnalysisEquipment/MethodologyConditions
Mass yieldEquation (1)Calculated as the mass of the product divided by the initial biomass feedstock mass, expressed as a percentage.
Apparent densityEquation (2)Determined by dividing the dry mass of the sample by its geometric volume.
Proximate compositionCEN/TS 15414-3:2010 [52], EN 15402:2011 [53], EN 15403:2011 [54]Moisture by drying at 105 °C. Volatile matter by heating at ~900 °C under inert atmosphere. Ash by combustion at 550 °C. Fixed carbon was determined by difference.
Elemental compositionThermo Finnigan Flash EA 112 CHNS analyzer (Waltham, MA, USA) Sample combusted at high temperature (~1000 °C) in oxygen-rich environment. Combustion gases (CO2, H2O, N2, SO2) measured via thermal conductivity and infrared detectors. Oxygen content calculated by difference from total.
Ash mineral compositionHoriba Jobin-Yvon, Ultima Model ICP (Inductively Coupled Plasma) (Lyon, France)Ash sample digested in acid mixture (e.g., HNO3/HCl). Solution analyzed by ICP to quantify mineral elements (Ca, Mg, K, Na, Fe, etc.)
Chlorine contentThermoFisher Scientific Niton XL3t XRF Analyzer (Waltham, MA, USA)Non-destructive X-ray fluorescence on solid samples, quantifying chlorine via characteristic X-ray emission.
HHV (Higher Heating Value)IKA® C200 calorimeter (Staufen, Germany)Bomb calorimeter combusts sample in oxygen at constant volume. Temperature rise used to calculate energy content (MJ/kg)
FT-IRThermoFisher Scientific Nicolet 174 iS10 FT-IR Spectrophotometer (Waltham, MA, USA)Samples analyzed in mid-infrared range (4000–400 cm−1) to identify functional groups. Measurements performed using ATR.
Thermogravimetric analysisWaters Company, TA Instruments Q50 TG analyzer (New Castle, DE, USA)Samples heated from room temperature to 900 °C at 20 °C/min in air. Weight loss monitored to assess thermal stability and composition changes
pHCrison MicropH 2001 pH meter (Barcelona, Spain)Measured at ambient temperature in aqueous suspensions or extracts, using calibrated glass electrode.
COD (Chemical Oxygen Demand)Standard Methods 5220B [55]Organic matter oxidized by potassium dichromate (K2Cr2O7) in acidic solution under reflux. Remaining dichromate titrated with ferrous ammonium sulfate to quantify oxygen demand.
ChloridesTitration EPA-SW-948 (Test method 9253) [56]Volumetric titration of chloride ions with silver nitrate (AgNO3) using chromate indicator (Mohr method).
Total solidsStandard Methods 2540B [55]Drying sample at 105 °C until constant weight to quantify total solids content.
Ash composition (aqueous samples)Horiba Jobin-Yvon, Ultima Model ICP (Inductively Coupled Plasma) (Lyon, France)Ash sample digested in acid mixture (HNO3). Solution analyzed by ICP to quantify mineral elements (Ca, Mg, K, Na, Fe, etc.)
Table 3. Proximate and ultimate analysis of the chars (DC) and hydrochars (HTC) samples. Results are presented as average value ± standard deviation.(Different letters indicate significant differences among treatments, Tukey’s HSD, p < 0.05).
Analysis100RDF90RDF10F80RDF20F70RDF30F
DCHTCDCHTCDCHTCDCHTC
Proximate Analysis (wt.%, db)
Moisture *4.1 ± 0.1 BC2.6 ± 0.5 DE4.7 ± 0.3 AB2.4 ± 0.3 E4.8 ± 0.6 A1.8 ± 0.1 F2.8 ± 0.6 D1.1 ± 0.0 G
Volatile matter66.9 ± 1.3 F77.2 ± 4.5 B68.3 ± 1.0 E72.7 ± 1.2 D71.7 ± 0.4 CD80.1 ± 1.4 A74.6 ± 2.7 C81.1 ± 2.9 A
Ash20.0 ± 0.7 A14.5 ± 0.6 D17.1 ± 1.7 B15.3 ± 0.7 D14.8 ± 1.7 C10.5 ± 0.6 E11.4 ± 2.3 F9.5 ± 0.5 E
Fixed carbon13.1 ± 0.6 C8.3 ± 3.4 E14.6 ± 1.3 B12.0 ± 0.7 D13.4 ± 2.0 BC9.3 ± 1.0 F14.0 ± 4.8 A9.3 ± 1.1 F
Ultimate analysis (wt.%, daf)
C60.7 ± 3.0 A57.6 ± 2.2 B60.6 ± 2.0 A58.8 ± 3.0 B61.7 ± 2.8 A61.3 ± 2.7 A60.6 ± 2.6 A63.0 ± 2.6 A
H5.4 ± 0.5 D5.1 ± 0.3 E5.4 ± 0.3 D6.2 ± 0.5 C6.4 ± 0.5 C6.9 ± 0.4 B6.4 ± 0.5 C8.0 ± 0.5 A
N1.2 ± 0.3 E2.2 ± 0.3 A1.6 ± 0.2 D1.9 ± 0.4 C1.2 ± 0.2 E1.7 ± 0.3 C1.2 ± 0.2 E1.3 ± 0.2 D
S0.0 ± 0.0 B0.0 ± 0.0 B0.2 ± 0.0 A0.2 ± 0.1 A0.1 ± 0.0 A0.2 ± 0.1 A0.1 ± 0.0 A1.1 ± 0.4 A
O12.6 ± 2.5 C20.6 ± 2.7 A15.1 ± 1.8 B17.7 ± 3.2 B15.7 ± 3.3 B19.5 ± 3.1 B20.3 ± 2.1 A17.1 ± 2.5 B
O/C0.180.270.190.220.190.240.250.20
H/C1.251.061.061.261.411.351.261.52
* as received.
Table 4. Ash mineral composition and fouling and slagging indexes of the chars and hydrochars produced with 0% and 30% of fat waste incorporation.
Ash CompositionChar Sample
DCHTC
100RDF70RDF30F100RDF70RDF30F
Oxides
(wt.%, db)
Al2O313.49.17.510.1
CaO51.542.523.629.4
Fe2O312.13.22.13.3
K2O2.12.01.10.9
MgO4.44.34.83.7
Na2O0.21.00.50.3
SiO23.05.42.10.6
TiO20.90.20.30.1
Fouling and slagging indexB/A4.1 high3.6 high3.2 high3.4 high
BAI5.4 low1.0 low1.3 low2.7 low
Fu9.1 high10.8 high5.3 high4.2 high
Sr0.2 low0.6 low0.3 low0.1 low
TA2.2 high3.0 high1.6 high1.2 high
Chlorine (wt.%, db)0.40.40.50.8
Ash content (wt.%, db)20.117.311.414.5
Table 5. Thermal behavior of chars and hydrochars (heating rate of 20 °C/min.).
SampleTi
(°C)
Tb
(°C)
T1
(°C)
T2
(°C)
DTG1
(%/s)
DTG2 (%/s)
100RDF DC2976784076715.10.5
70RDF30F DC 2856844086764.60.6
100RDF HTC2897864016703.90.6
70RDF30F HTC2356782755895.40.8
Table 6. Characterization of char-washing wastewater and process water of HTC.
AnalysisSamples
DCHTC
100RDF70RDF30F100RDF70RDF30F
pH6.17.64.64.6
COD (g/L)4.57.047.949.6
Chlorides (g/L)3.32.01.71.3
Total solids (g/L)7.95.425.823.0
Volatile solids (g/L)3.73.419.519.4
Fixed solids (g/L)4.21.96.43.6
Ash mineral composition (wt.%, db)Al2O30.43.40.52.5
CaO7.927.629.458.9
Fe2O30.10.30.20.9
K2O1.716.46.77.2
MgO0.77.85.814.9
Na2O0.413.74.46.7
SiO21.35.00.47.6
TiO20.00.00.00.0
Disclaimer/Publisher’s Note: The statements, opinions and data contained in all publications are solely those of the individual author(s) and contributor(s) and not of MDPI and/or the editor(s). MDPI and/or the editor(s) disclaim responsibility for any injury to people or property resulting from any ideas, methods, instructions or products referred to in the content.