Systematic Review

A Systematic Review of Research on Urban Streets and Parks Based on Eye-Tracking Technology

Department of Architecture, School of Architecture and Art, North China University of Technology, Beijing 100144, China
*
Author to whom correspondence should be addressed.
Appl. Sci. 2025, 15(17), 9305; https://doi.org/10.3390/app15179305
Submission received: 1 July 2025 / Revised: 16 August 2025 / Accepted: 21 August 2025 / Published: 24 August 2025

Abstract

In recent years, the application of eye-tracking technology in urban studies has garnered increasing attention from researchers across various disciplines. This study aims to provide a comprehensive review of the current applications of eye-tracking technology in these urban environments through a systematic literature analysis. Our findings indicate that eye-tracking technology has played a significant role in exploring visual preferences and the restorative effects of urban streets, as well as the visual preferences and restorative potential of urban landscapes. Certain visual elements in streets and parks, such as artificial and natural elements, can elicit different psychological and visual responses from people. This is of great reference value for understanding how urban street and park design can better meet people’s visual preferences and exert the therapeutic effects of urban streets and parks. Moreover, characterised by its portability and reliability, eye-tracking technology has significant advantages in capturing real-time visual behaviour and cognitive responses in natural urban settings and can become a powerful tool for future research. Furthermore, eye-tracking technology holds great potential for extending its applications to other urban public spaces, such as plazas, waterfront areas, and urban greenways. This expansion can provide deeper insights into how people interact with and perceive various urban environments, ultimately contributing to more effective urban planning and design strategies.

1. Introduction

Urban outdoor public spaces are key venues for social interaction that provide residents with opportunities for leisure, recreation, and sports activities, thus helping to strengthen community ties and enhance neighbourhood exchanges, which in turn contribute to the overall harmony and stability of society [1]. Furthermore as key components of urban outdoor spaces, urban streets and parks are vitally important for people’s daily activities. In terms of streets, as Jane Jacobs once said: “When we think of a city, the first thing that comes to mind is its streets” [1]. Moreover, as streets are the most common type of public space in high-density cities, good street environments are believed to provide a healing experience for pedestrians in which they may help alleviate negative emotions and restore attentiveness and cognition lost to the stresses of daily work and life [2]. Therefore, streets play an important role in cities.
Additionally, with respect to parks, in the Park Design Code parks are defined as a kind of public green space, whose main function is to provide the public with space for visiting, viewing, and resting, as well as to provide a place to carry out scientific, cultural, and physical activities. All of these are beneficial in enhancing the diversity of people’s lives. Parks are also usually well equipped with facilities and public green spaces that provide ample amounts of greenery. From the point of view of urban planning and ecology, parks also serve multiple additional functions such as improving the urban ecological environment, fire prevention, and providing emergency shelters.
Eye-tracking technology has a wide range of applications in medicine [3], education [4], psychology [5], and architecture [6]. Because vision is the most important way of acquiring information in the human cognitive process [7], eye-tracking technology provides researchers with new ways to gain insight into observers’ attention allocation and cognitive activity during visual information processing [8]. In recent years, eye-tracking technology has made considerable progress in urban research specifically as a data acquisition tool. For example, some scholars have used eye-tracking technology to study the landscape quality assessment of waterfront parks [9] and others have used eye-tracking counting techniques to explore the visual perceptual characteristics of people with low vision while walking on roads and sidewalks [10]. Therefore, utilising eye-tracking technology to study urban street and park spaces can help to quantify people’s visual responses to both of these environmental elements and thus provide data support for urban planning and design.
Based on the above background information, this review was carried out by means of the Web of Science platform, and 48 related works were screened for analysis from 2015 to 2024. The joint methods of keyword co-occurrence and topic classification were used to explore the research direction and research hotspots. After systematically compiling the research progress of eye-tracking technology in urban parks and streets we explored the research veins with an eye toward enhancing the efficiency of future academic undertakings in the field. The cross integration of eye-tracking technology and urban spatial research may also promote multidisciplinary cross-fertilisation, facilitate the understanding of people’s visual preferences and behavioural characteristics in the environment, and play a synergistic role in creating the optimally designed urban environments of the future.

2. Methods

2.1. Literature Search Methodology

The literature search methodology adopted for this review is shown in Figure 1, and consisted of five steps.
Step 1: Defining the scope of the study. At this stage, the researcher identified the specific area and objectives of his/her research. This included identifying the topic of the study and relevant keywords for effective literature search in subsequent steps.
Step 2: Determining the search platform. In this paper, Web of Science was used as the search platform.
Step 3: Performing topic searches. After entering the relevant keywords in the Web of Science search platform, 91 articles of “Eye-tracking and Streets” and 48 articles of “Eye-tracking and Parks” were obtained.
In this paper, the search expression TS = (“Eye-tracking and Parks*”) OR TS = (“Eye-tracking and Streets*”) is used in Web of Science to retrieve relevant literature.
The search query (TS = (“Eye-tracking and Parks*”) OR TS = (“Eye-tracking and Streets*”)) has the following characteristics:
1. High recall rate: The truncation symbol * captures all spellings, singular and plural forms, and derivatives of terms such as park/parks/parking, street/streets/streetscape, etc., including differences between British and American English, without the need for additional OR listings.
2. High precision rate: Quotation marks lock “Eye Tracking and …” as a continuous phrase, preventing free combinations of words within the field, significantly reducing irrelevant records.
3. High reproducibility: The search query is concise with few Boolean layers, making it easy to copy, modify, and share within a team, and facilitating the direct addition of time, subject, or document type restrictions in historical searches.
4. Low system load: The use of phrases and truncation replaces multiple OR combinations, shortening the length of the search query and reducing the risk of truncation due to the hierarchical limitations of WoS search syntax.
Step 4: Refining the search results. The search results were qualified by “Title” and “Abstract”. Further filtering was performed using the options of “Document Types” and “Publication Years” to ensure the relevance and timeliness of the results. After this step there were 57 articles for “Eye-tracking and Streets” and 29 articles for “Eye-tracking and Parks”.
Step 5: Manual screening. Articles were filtered by looking at the “Title” and “Abstract” in order to obtain the most relevant literature. We thus finally obtained 32 articles for “Eye-tracking and Streets” and 17 articles for “Eye-tracking and Parks”.
After comparing the two search topics and eliminating the duplicates, the final number of documents was 48.

2.2. Literature Analysis Methodology

  • Keyword co-occurrence;
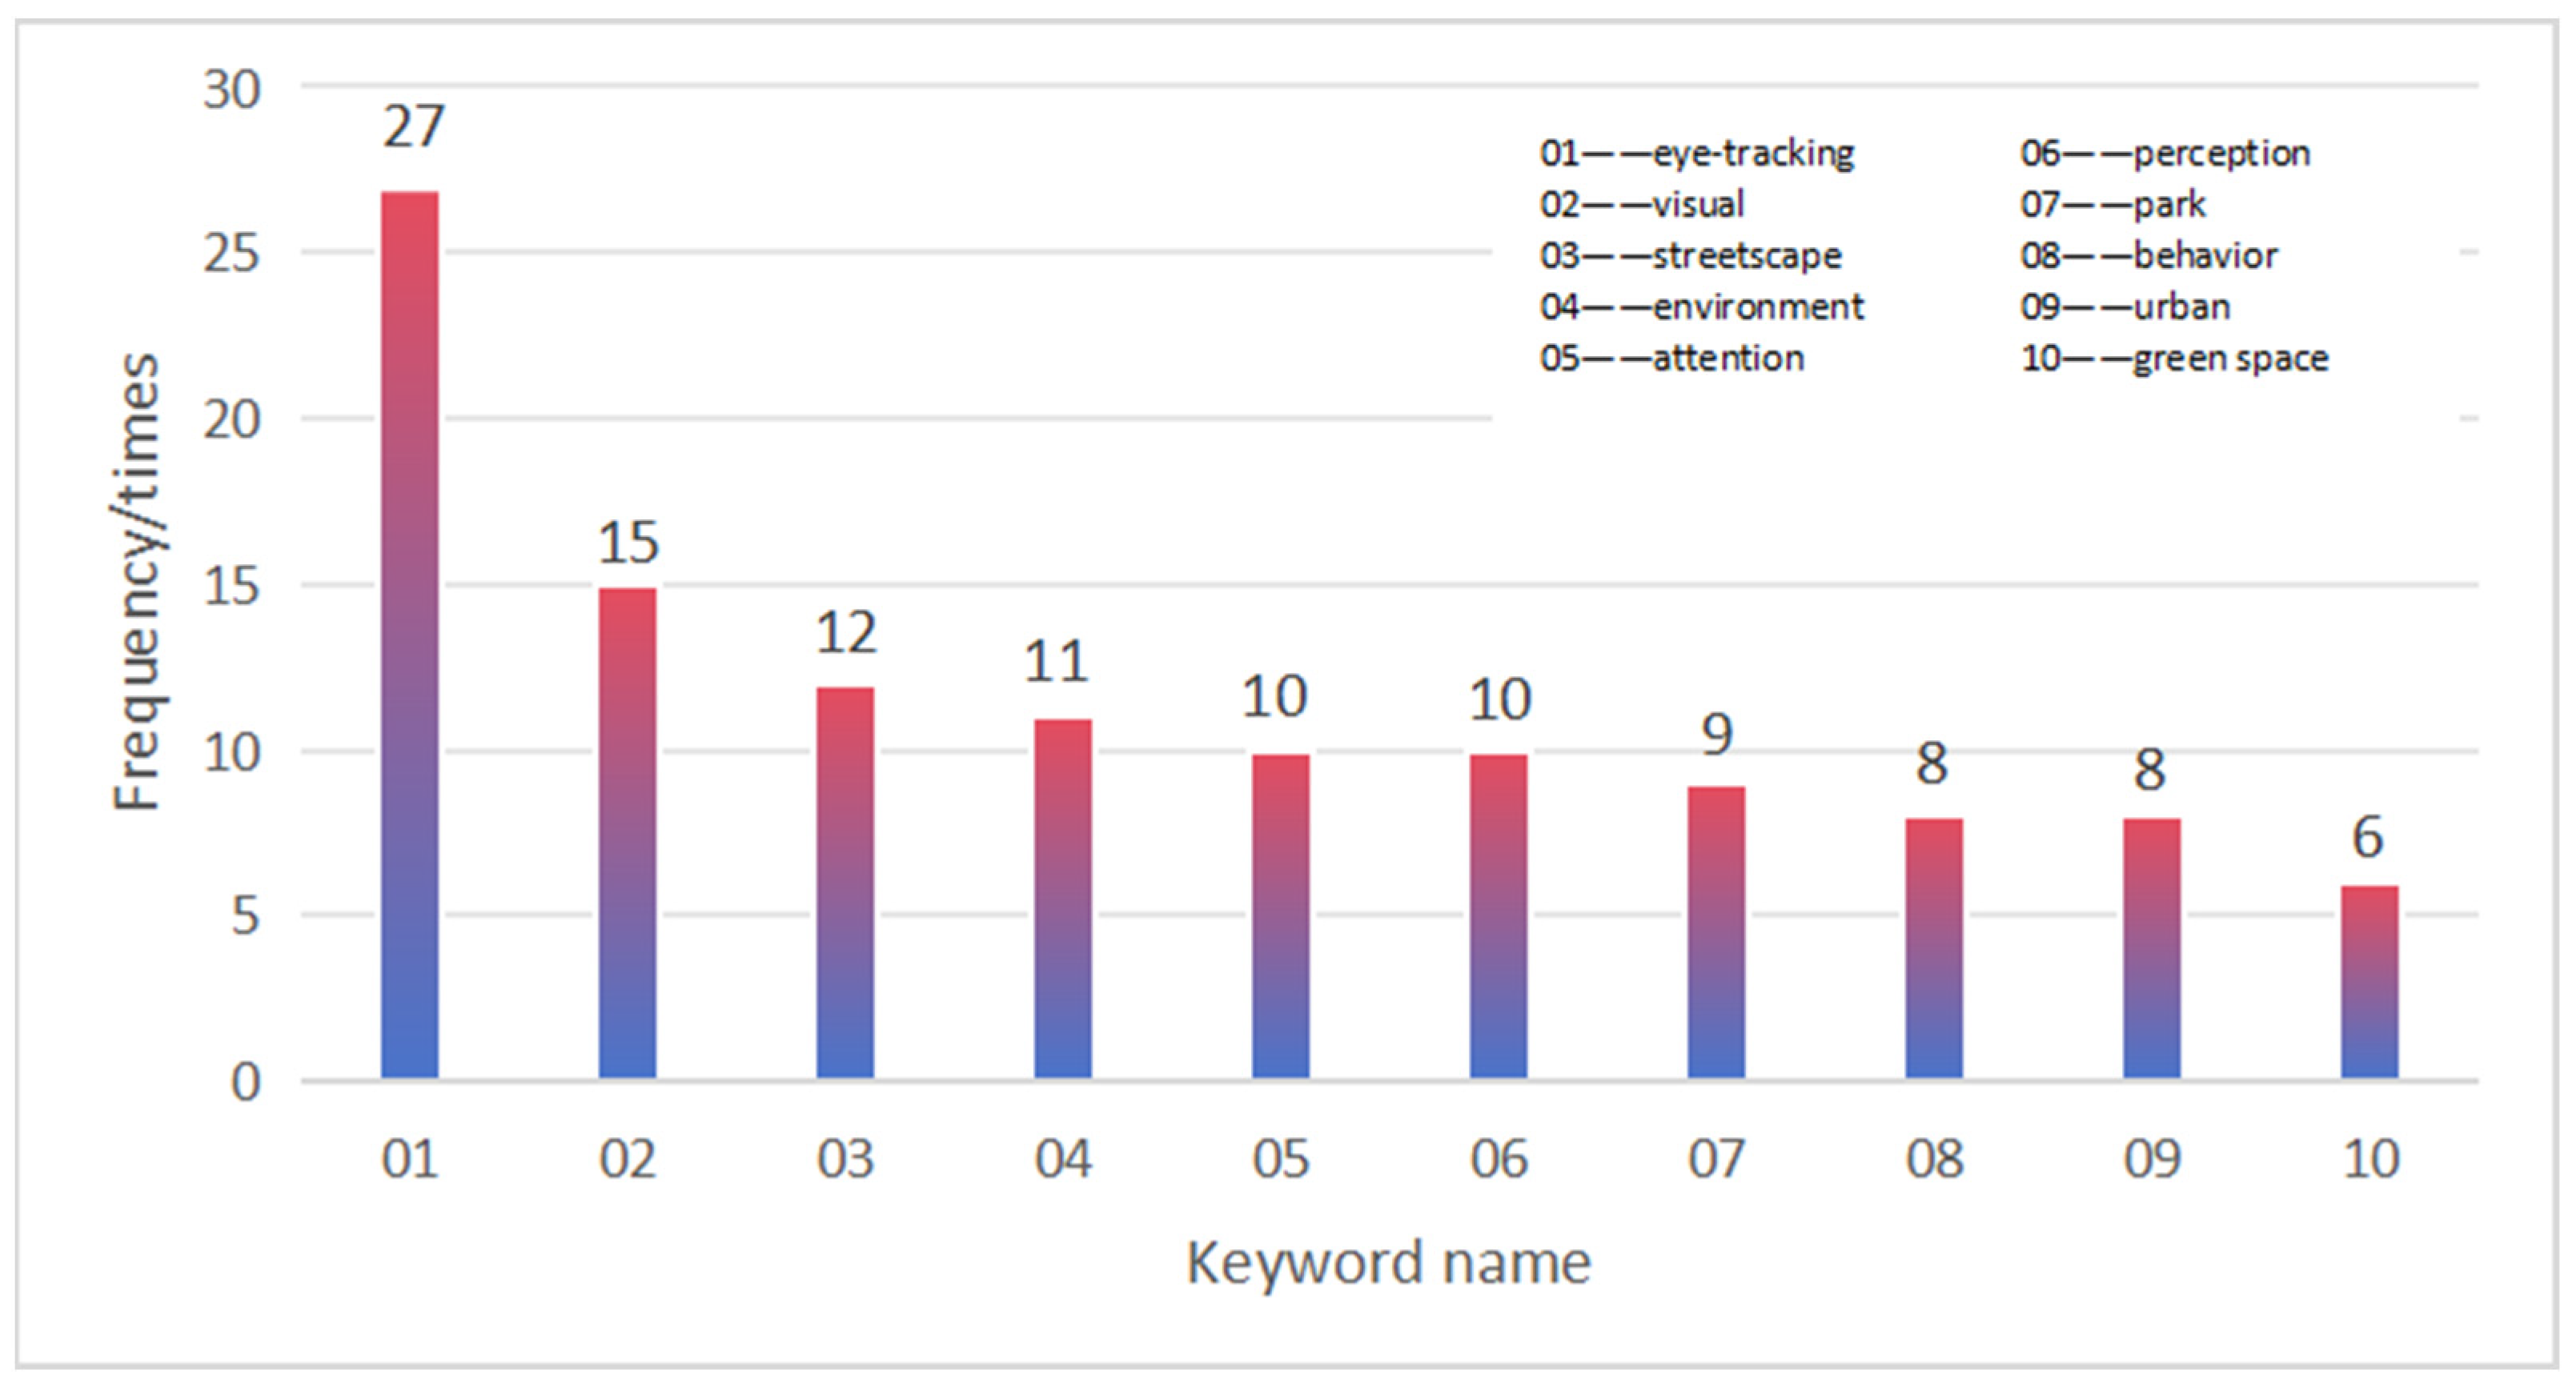
The method of keyword co-occurrence was adopted to extract the keywords of each document, analyse the frequency of keywords co-occurring in the documents, and screen out 10 keywords with high frequency of occurrence (Figure 2).
  • Thematic classification;
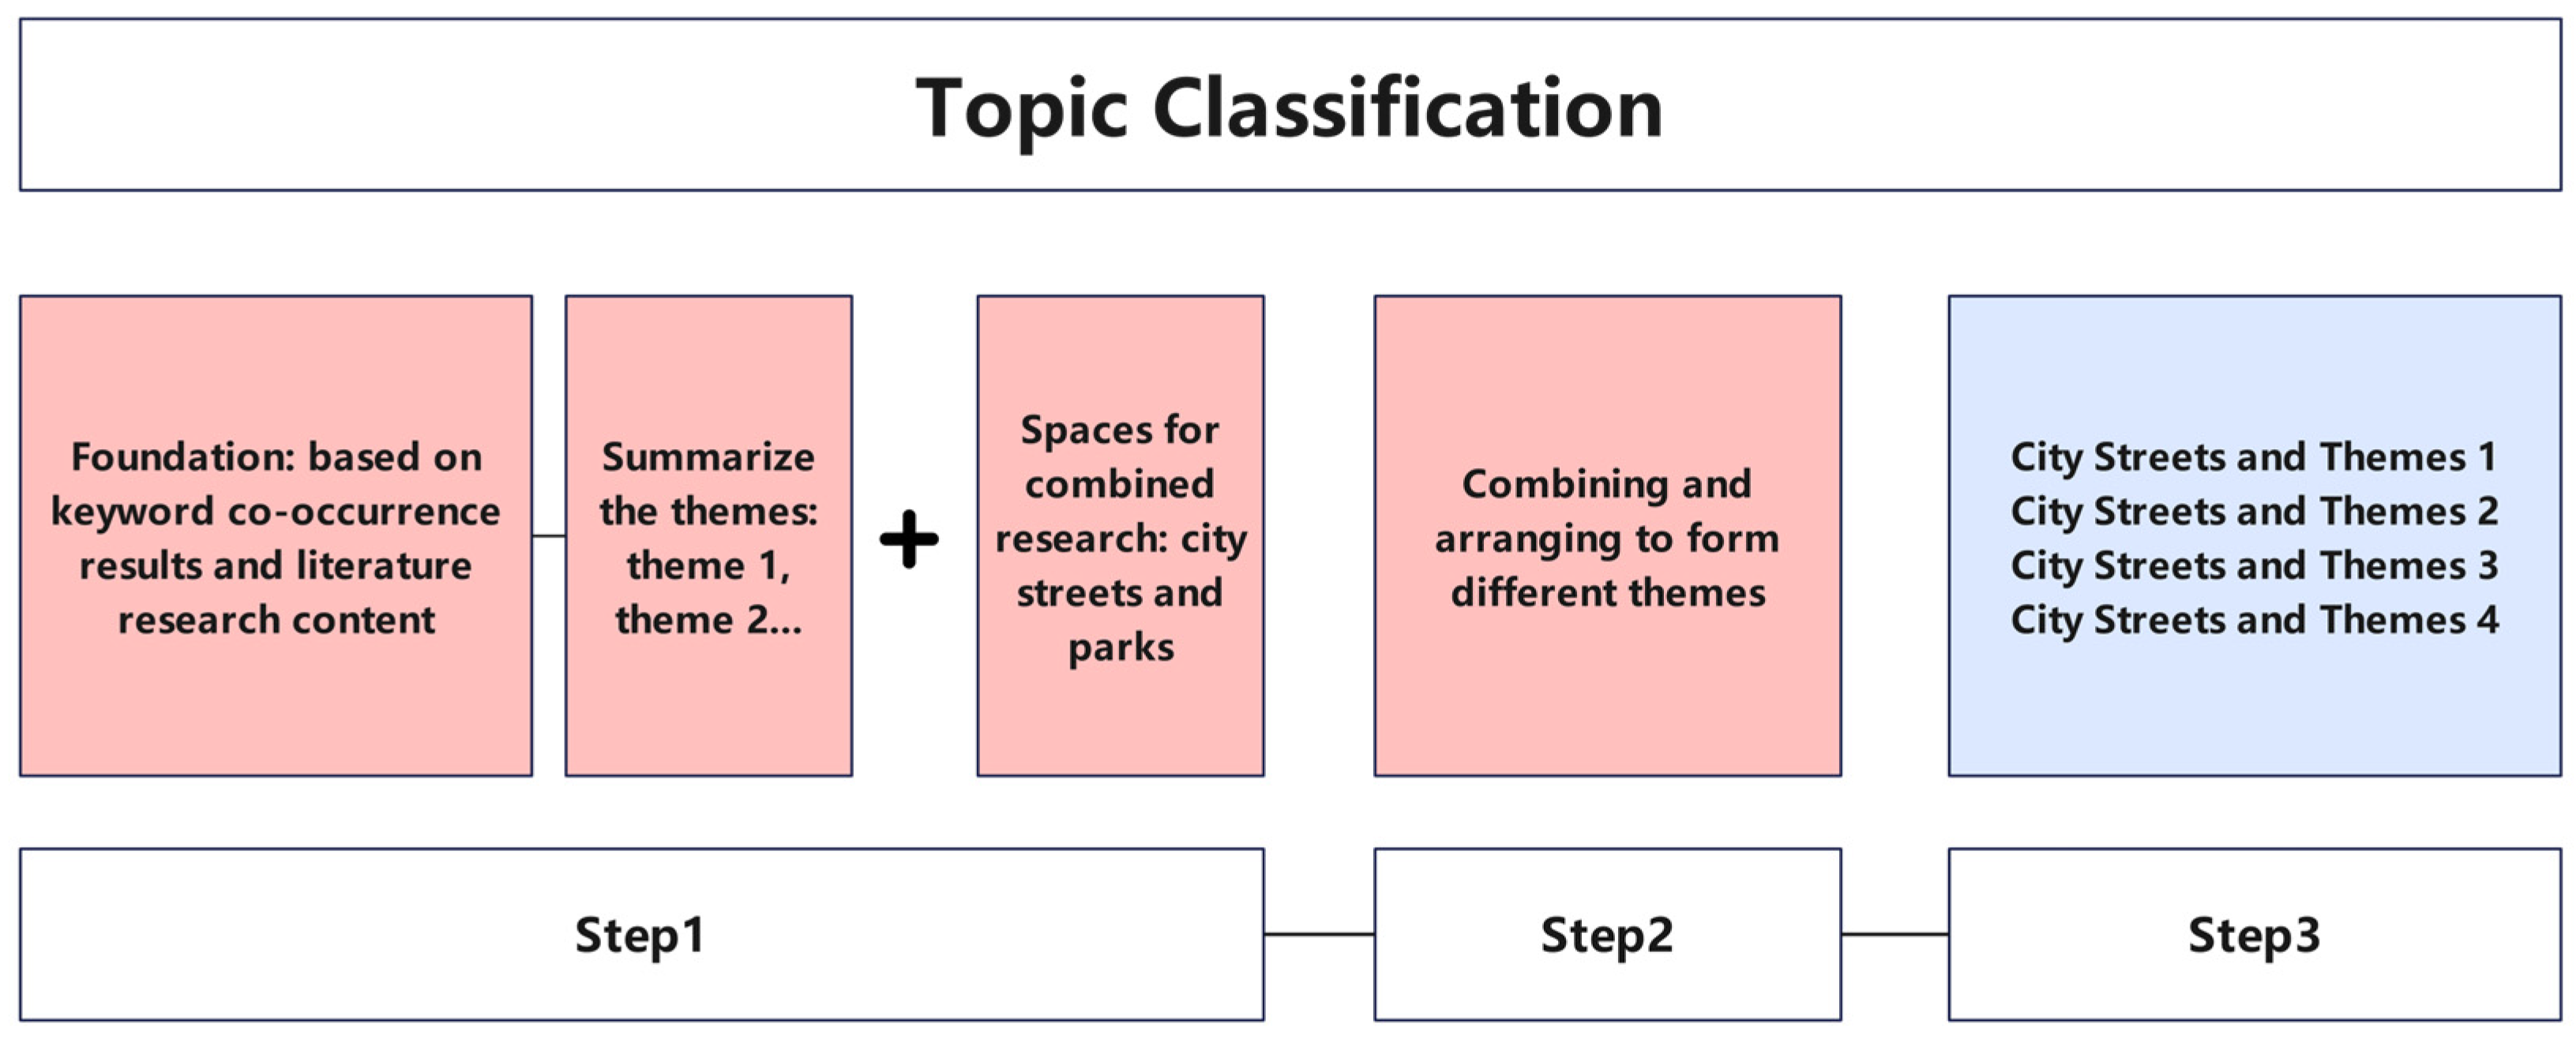
Based on the relevance of the screened keywords to the content of the literature, we categorised the screened literature according to themes. Then, combined with the difference between the two major spaces of urban streets and parks, the final obtained theme words were formed (Figure 3).

3. Results

3.1. Keyword Co-Occurrence Results

We obtained the following results after counting and analysing the co-occurrence frequency of the keywords in the literature: “eye-tracking” appeared 27 times; “visual” appeared 15 times; “streetscape” occurred 12 times; “environment” occurred 11 times; “attention” occurred 10 times; “ perception” appeared 10 times; “park” appeared 9 times; “behavior” appeared 8 times; “urban” appeared 8 times; and “green space” appeared 6 times. The overall distribution of keyword co-occurrence results is illustrated in Figure 4.

3.2. Topic Classification Results

We used a thematic classification to categorise the retrieved literature according to its thematic features, focusing on the thematic content of the literature, and revealing the semantic relationships of the literature by means of identifiers such as subject terms and keywords. Themes were categorised into four areas: urban streets and visual preferences, urban streets and healing, urban parks and visual preferences, and urban parks and healing. The detailed categorization results of the literature corresponding to each theme are shown in Table 1.
Regarding the indicators mentioned above (such as TFD/FF/SF/APD), our research findings are as follows: The Total Fixation Duration (TFD), a measure of sustained attention to specific environmental features, indicates that in urban settings, artificial elements like billboards are more captivating than natural ones such as greenery [11]. Fixation Frequency (FF) quantifies the intensity of visual engagement, showing that natural water features are more appealing than paved areas in park environments [34]. Saccadic Frequency (SF) measures the activity of visual exploration, with higher values observed in dynamic street scenes [14], indicating frequent shifts in attention among various elements. The Average Pupil Diameter (APD), an indirect marker of cognitive load and emotional arousal, increases in poorly lit areas at night, suggesting a physiological response to perceived insecurity [32]. Overall, these indicators provide a robust framework for interpreting visual attention and cognitive processes across various environmental contexts.
Our research reviewed literature on diverse eye-tracking devices, categorising them into four types: head-mounted, desktop, VR/AR integrated, and remote contactless. Each type suits different research contexts. Head-mounted devices are mobile and flexible, desktop ones offer precision in controlled settings, VR/AR devices enhance immersion, and remote contactless devices enable non-intrusive tracking. We also summarised specific models, providing a resource for researchers to choose suitable technology (Table 2).
Table 2 categorises the types of eye-tracking devices (head-mounted, desktop, VR/AR, remote non-contact) not merely as a technical listing, but based on the following two research needs:
1. Methodological mapping: By analysing the types of devices used in 48 studies, the correlation between different research contexts (streets/parks, wilderness/laboratory) and device selection is verified (e.g., head-mounted devices account for 67% of street studies, reflecting their adaptability to dynamic environments).
2. Replicability guideline: Providing a basis for device selection in future studies. For example, the significant proportion of VR/AR devices in the “visual preference” theme (Table 2) suggests their suitability for research designs requiring immersion.

3.3. Citation Analysis Results

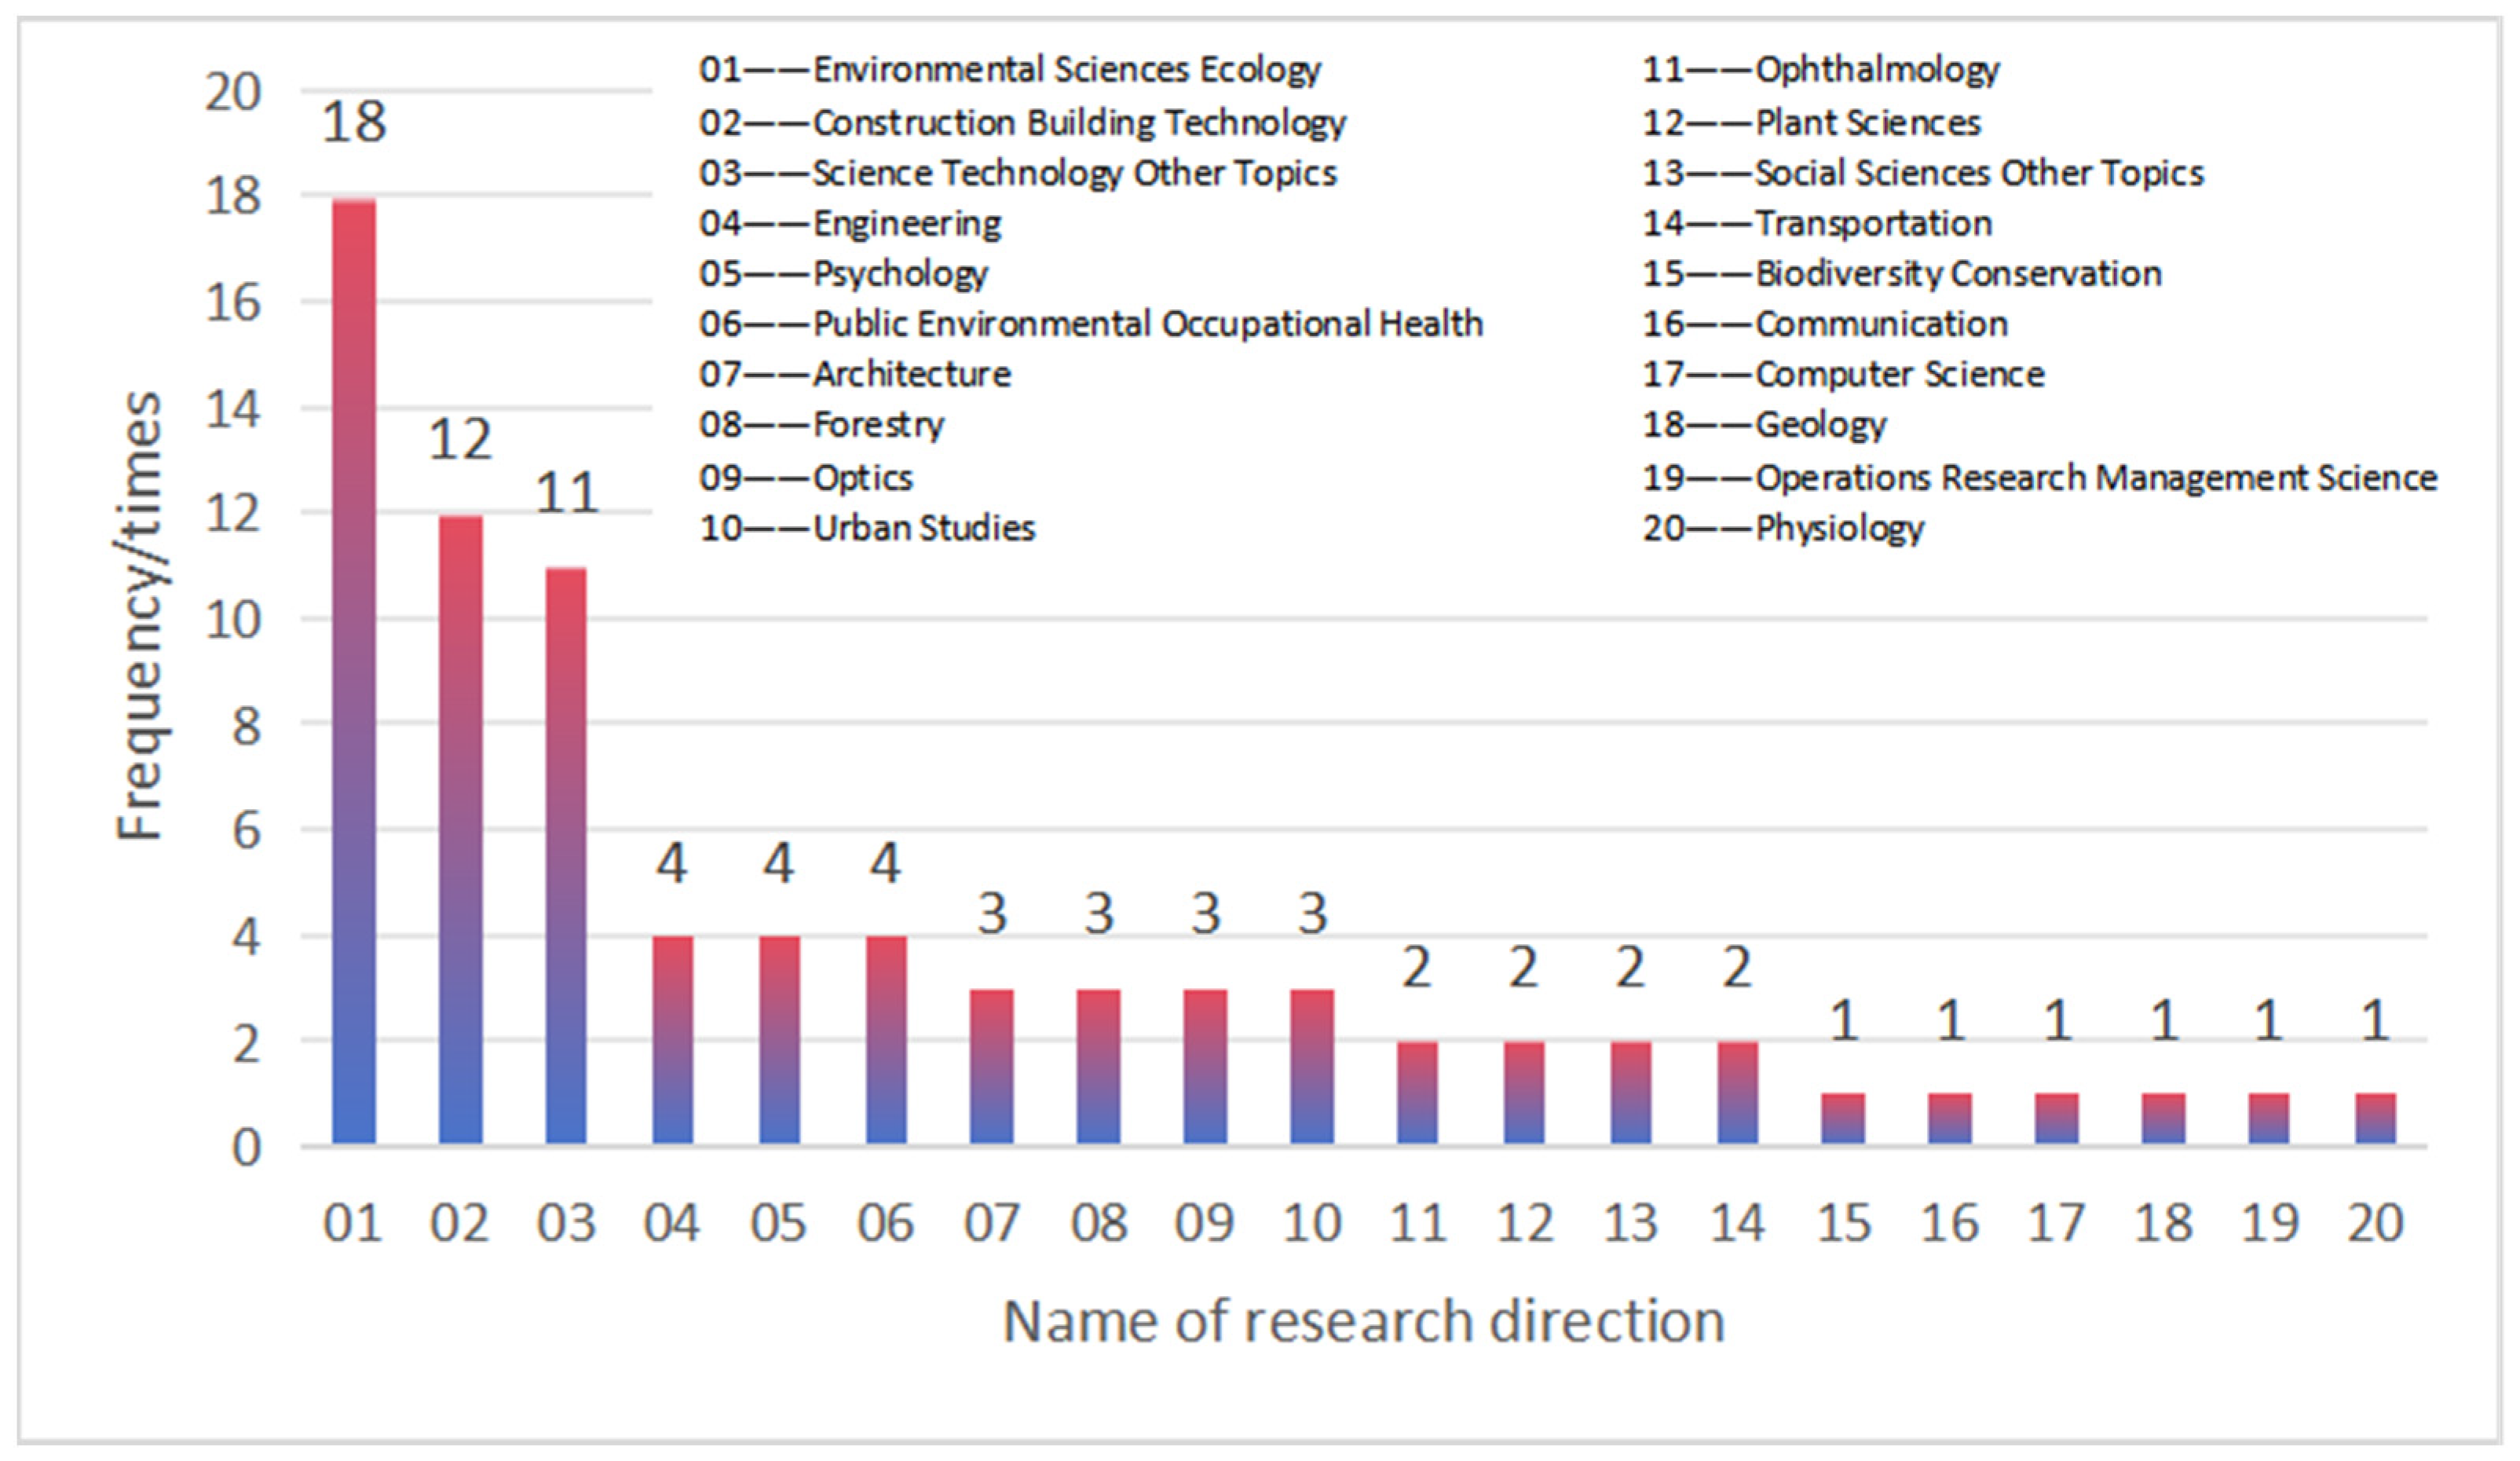
In accordance with the comprehensive keyword co-occurrence and subject classification results mentioned in the previous section, our citation analysis focused primarily on the 48 retrieved documents for the analysis of research direction, research field, citation frequency, and publication distribution in three aspects, the detailed results of which are shown in Figure 5.
As shown in Figure 5, there were many diverse research areas. Among them, environmental science and building technology were the most dominant research foci. Other fields such as psychology, public health, and ophthalmology were also represented, showing a trend towards interdisciplinary research.
The data in Figure 6 indicate that biomedicine and science and technology were the most dominant fields of study, accounting for the majority of research records. Social sciences and technology also accounted for a significant portion of the research, and arts and humanities were relatively under-represented.
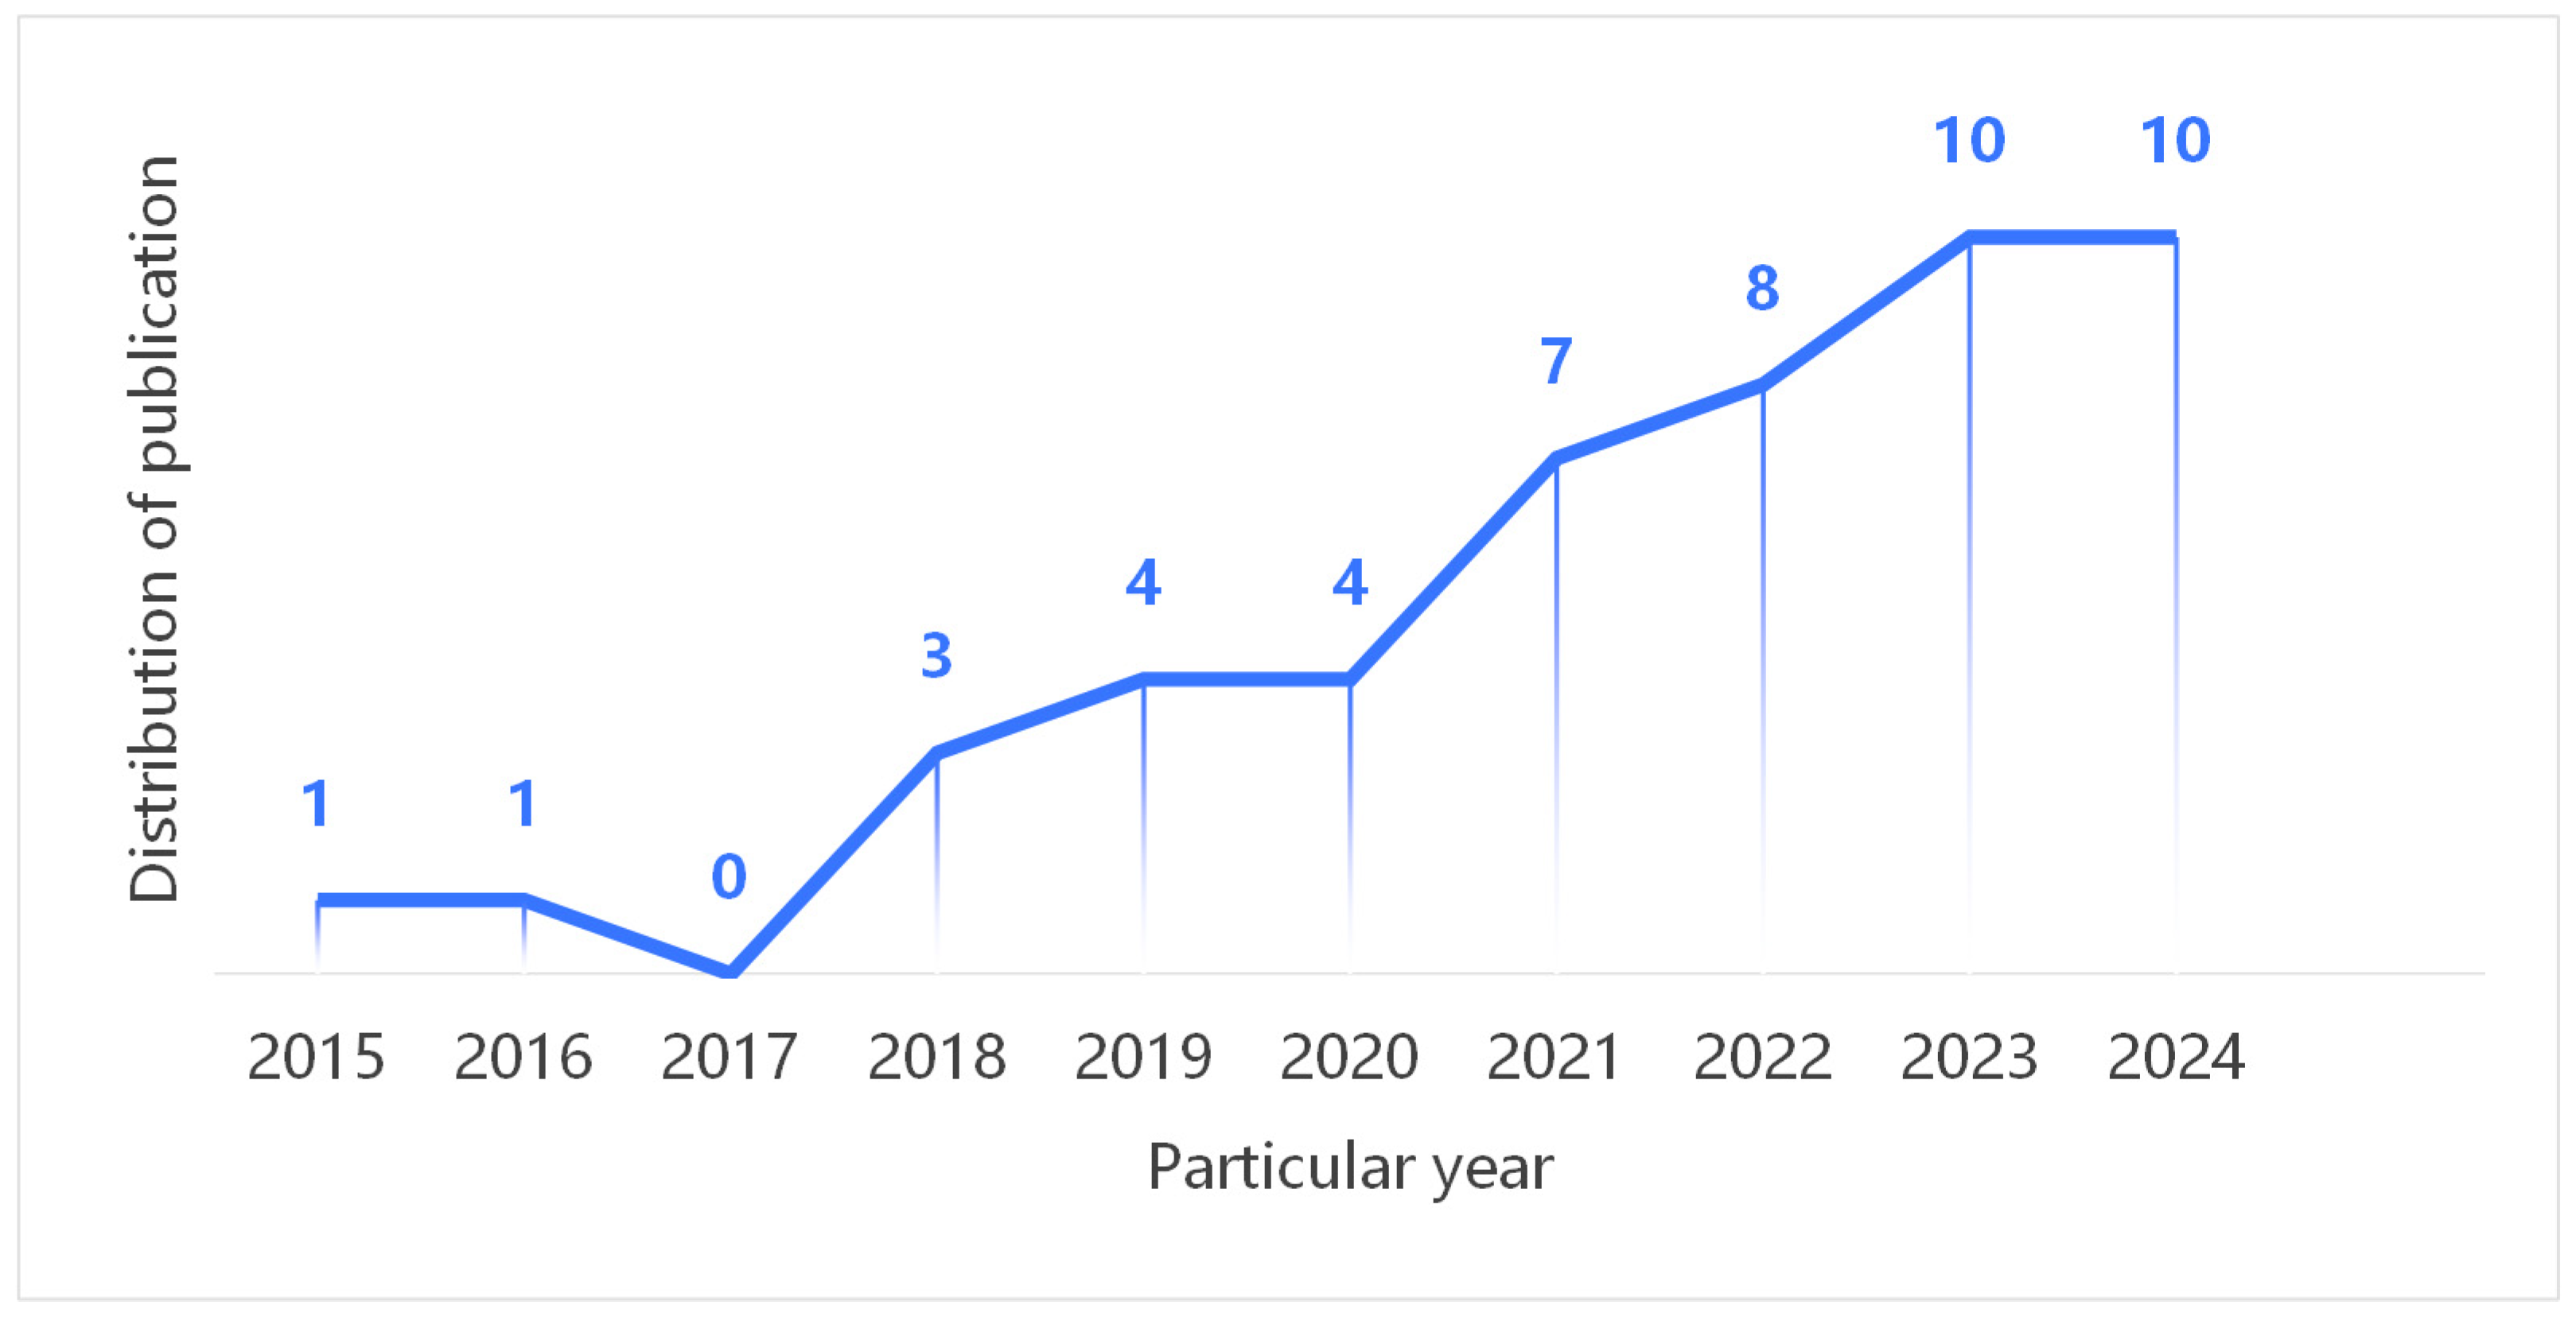
Figure 7 and Figure 8 show the trends in the number of publications and citation frequency between 2015 and 2024, respectively. The number of publications increased from 2015 to 2024, reaching a peak in 2023 and 2024. This phenomenon indicates that the research activities in the related fields were very active during this period of time, and the output of research results was high. Not only that, the citation frequency also shows an upward trend year by year, which is roughly in line with the increase in the number of publications. This suggests that as research output increased, these results were also more widely recognised and cited by the academic community.

4. Discussion

4.1. Eye-Tracking-Based Research on Urban Streets

In recent years, the use of eye-tracking technology in studies of landscape and street preference, as well as visual attractiveness in urban environments, has increased. For instance, some scholars have employed this technology to analyse people’s visual behaviours in urban pedestrian environments and Civil War battlefield sites. The aim is to further reveal the link between landscape features and visual preferences. One study found that people’s preferences for urban landscapes are closely related to natural elements (e.g., vegetation) and artificial elements (e.g., buildings and signs) [11].
The visual impact of signboards and street vitality are also research concerns in commercial pedestrian streets. Some scholars have recorded participants’ visual behaviour while walking on a pedestrian street and collected corresponding eye movement indicators using eye-tracking technology. They found that environmental elements with high information density (e.g., external store signs) significantly affect the perceived preference of urban streetscapes [23]. However, the visual appeal of store signs depends not only on the density of information, but also on many other factors, such as size and number. In terms of quantity, more is not necessarily better. For instance, some researchers have discovered that larger signboards attract more visual attention from pedestrians, but too many signboards can diminish the aesthetic quality of a streetscape [52]. In addition, improvements in streetscapes can come directly from the aesthetic quality of shop signs. As some scholars have discovered through the use of mobile eye-tracking technology to observe pedestrians’ gaze behaviour when looking at different text elements during natural walking, texts that are considered to be more aesthetically pleasing are more likely to be remembered [22]. Furthermore, some researchers have used eye-movement experiments and virtual reality technology to study guide signs on underground shopping streets. They found that signs with higher visual prominence attract more attention [16]. Moreover, some researchers have analysed differences in attention to neighbourhood elements and how these change over time and space among participants with different levels of knowledge, using mobile eye-tracking technology. They found that participants with an architectural background pay more attention to architectural details, while those without architectural knowledge pay more attention to commercial elements [14].
Furthermore, due to the variability of street elements (e.g., roads, buildings and greenery), different types of street element have different effects on how attractive pedestrians find them. Researchers have found that the configuration of the street interface (e.g., ground floor usage and pavement width) can significantly affect pedestrians’ visual preferences [18]. For example, pedestrians’ visual engagement with street edges is concentrated at ground level. There are also differences in visual engagement between pedestrian and non-pedestrian streets [21]. This suggests that street type (e.g., pedestrian versus non-pedestrian streets) and street interface configuration (e.g., ground floor design) significantly affect pedestrians’ visual preferences. For example, some scholars have found significant differences in the effects of various landscape elements (e.g., water features, planted landscapes, hard landscapes and composite landscapes) on visual behaviour, and that the proportion and combination of these elements significantly affects public preferences [44]. This suggests that different street elements (e.g., landscape features) have different levels of visual appeal, which is consistent with the idea that combinations of these elements influence visual preferences.
In addition to all of the above the healing nature of city streets is reflected in four ways:
(1) The visual elements of the urban street environment play an obvious role in pedestrians’ psychological recovery. For instance, some researchers have employed eye-tracking technology to demonstrate that features such as railings, gutters and tactile paving can have a positive impact on how pedestrians perceive walking. However, elements such as trees and lampposts may have a negative effect [26]. The above studies show that visual elements in urban street design impact not only pedestrians’ walking experiences, but also their psychological recovery through indirect effects on visual behaviour.
(2) The physical characteristics and spatial configuration of urban streets significantly impact pedestrians’ visual behaviour and healing experiences. Researchers have found that permeable/accessible street interfaces attract more attention from pedestrians by analysing the morphological characteristics of street interfaces. This can enhance the vitality and therapeutic properties of streets [18]. In addition, scholarly studies further highlight that pedestrian street design can balance visual engagement with the street edges on both sides, enhancing the street’s attractiveness and experiential nature, thus promoting psychological recovery [21].
(3) The combination of natural and artificial elements in urban street environments can have different effects on the healing process. While larger signboards attract more visual attention, an excessive number of them can negatively affect the aesthetic quality of the streetscape, thereby affecting pedestrians’ psychological recovery [19]. Therefore, the design of streets needs to strike a balance between visual appeal and aesthetic requirements.
(4) The lighting design of urban streets clearly impacts the visual behaviour and experience of pedestrians. Through eye-tracking experiments, some scholars have formed illumination standards for pedestrians detecting obstacles on the road at night, while others have emphasised the importance of lighting design in improving street safety and aesthetics [32].

4.2. Eye-Tracking-Based Research on Urban Parks

Research on the application of eye-tracking technology to visual preferences in park environments has primarily focused on the visual appeal of man-made and natural landscape elements, the relationship between landscape design intensity and visual appeal, and how gender differences affect visual preferences.
Some scholars believe that artificial landscape elements are more visually attractive than natural ones. For instance, some researchers have highlighted the role of street lamps and benches in capturing participants’ attention more effectively than trees and shrubs [34,35]. Other scholars have argued that artificial features such as paths, stairs and park furniture dominate our visual perception [37]. In addition, scholars have found that artificial features, such as pavilions and facilities, tend to attract more attention than natural features, such as water and plants [44]. Some scholars have found a significant positive correlation between landscape design intensity and visual attractiveness, landscape preference, and restoration. The higher the design intensity, the more visually appealing the landscape [36]. Finally, in terms of the influence of gender differences on visual preferences, some scholars have found significant differences in eye movement patterns between males and females. In terms of both gaze duration and degree of concentration, males are more dispersed, while females tend to gaze at specific landscape elements for longer. In terms of preference for different elements, women pay more attention to man-made features (e.g., park facilities and buildings) than men do, while men pay more attention to trees [38].
Eye-tracking technology has also been widely used in park therapy to reveal how different landscape features affect visual attention and psychological recovery. For instance, researchers have demonstrated that natural landscape features (e.g., trees and bodies of water) have a greater impact on promoting psychological and physiological recovery than artificial features (e.g., buildings and paving) [42,47]. Their studies found a significant positive correlation between landscape design intensity (LDI) and landscape preference and restoration. Participants’ visual preferences were more pronounced, and their restoration ratings were higher, as design intensity increased [36].
Some studies in the field of visual behaviour have revealed the extent to which different landscape elements attract visual attention. For instance, artificial landscape features (e.g., street lamps and benches) attracted the most attention from participants compared to natural features [34,35]. This suggests that, although natural elements offer significant psychological benefits, artificial elements still dominate in terms of visual appeal.
Other scholars have investigated the effects of multisensory interactions on spatial perception and restorability, finding that interactions between vision, hearing and smell can significantly improve spatial perception and restorative potential [46]. For example, aromatic scents such as marigold, boxwood and camphor are effective in promoting physical and psychological relaxation. Specific auditory and olfactory stimuli can also direct visual focus and enhance the healing properties of a space [46].

4.3. Identified Research Characteristics and Future Research Trends

4.3.1. Increasing Multidisciplinarity

Research in urban street design using eye-tracking technology has shown a tendency to be multidisciplinary. For instance, when combined with the Perceived Restorative Scale, eye-tracking technology can be used to evaluate the restorative environmental benefits of community parks [48]. For example, when combined with virtual reality, eye-tracking technology can be used to verify the impact of logo design on visual saliency [16]. Similarly, other scholars have investigated the effect of vegetation permeability on visual perception [39]. Furthermore, eye-tracking technology has been investigated in conjunction with physiological measurements to assess the healing aspects of urban parks. For instance, eye-tracking technology has been employed to evaluate the restorative advantages of national forest parks using physiological metrics such as skin conductance response and heart rate variability [42]. In addition, eye-tracking techniques have been studied in the field of visual preferences when combined with semantic analysis. For example, the SD method, which is a type of semantic analysis, has been used in conjunction with eye-tracking techniques to analyse the public’s visual preferences for different landscape types [43]. In terms of discipline distribution, there are differences in the disciplines that typically correspond to questionnaire survey techniques, virtual reality, physiological measurement and semantic analysis. Some scholars believe that the questionnaire survey method is particularly important for social science research [53]. Some scholars believe that the current application of virtual reality in education is the most important [54].

4.3.2. A Focus on Landscape Research

By comparing the research priorities of the retrieved literature, we found that landscapes play an important role in urban streets and parks. Different landscape factors are given different levels of attention. For example, green spaces, as part of the urban landscape, are one aspect that attracts people’s attention. Some scholars have studied this and found that people have different preferences for different types of green space [55]. This observation illustrates the variability of people’s preferences well. In addition to city streets and parks, scholars have used eye-tracking technology to study landscapes in other outdoor public spaces. For instance, some researchers have used this technology to study how tourists observe the landscape of the North Building on the Nanjing University campus, in order to explore their eye movement patterns when viewing tourist areas [56]. For example, scholars studying outdoor rest spaces in hospitals have found that increasing the proportion of landscaped areas and optimising their location can significantly improve indicators of eye movement and staff members’ self-assessed recovery [57].

4.3.3. Enhanced Multisensory Interactions

Although vision dominates perception, preferences and healing assessments, human perception relies on multiple senses working together. A single visual effect assessment cannot provide comprehensive information on visual preferences or healing evaluations. In recent years, some scholars have investigated the relationship between soundscapes and the natural environment, and a substantial body of literature supports this contention [58]. Although multi-sensory assessment can provide a more comprehensive analysis process, existing simulated reality technologies have not yet evolved to the extent that they can fully replicate people’s perceptual experience of the real environment. Additionally, it remains challenging to accurately judge and analyse information acquired through different senses separately [59].

4.3.4. The Shaping of Research Paradigms by Device Technology

Based on the data in Table 2:
Table 2 shows a clear pattern in device usage across themes: head-mounted devices account for 67% (20/30) of the studies on urban streets, where participants typically walk naturally; desktop or remote devices account for 73% (11/15) of the studies on urban parks, most of which evaluate static scenes in laboratory settings; and VR/AR devices are employed in 38% (6/16) of the papers addressing visual preference. Although these proportions suggest an association between device choice and research context (dynamic behaviour vs. static preference), we did not perform a formal statistical test of this relationship. Therefore, the observed pattern should be interpreted as a descriptive trend rather than a statistically confirmed correlation.
In addition to outdoor urban environments, recent studies have also applied eye-tracking technology to semi-enclosed or indoor settings, such as underground commercial streets [16], historic streets with arcade-like structures [14], and enclosed park segments [38], indicating that visual preference and attention patterns are also significantly affected by spatial enclosure and configuration. These findings suggest that the theoretical framework and insights from our review may be extended to atrium-like environments with appropriate contextual adaptation.

4.4. Limiations

This review has several limitations. Firstly, although the Web of Science contains a large amount of high-quality academic literature, we only used this platform for our search. Therefore, there may be relevant studies in other databases that have been missed. This may mean that our analysis is not comprehensive enough. Furthermore, the selection of search keywords may not have covered all relevant research areas. When manually screening the literature, screening by ‘Title’ and ‘Abstract’ may have introduced subjective judgement bias, causing us to miss literature with relevant content but seemingly irrelevant titles.
Although ‘Document Types’ and ‘Publication Years’ were used as screening criteria to ensure the timeliness of the literature, some relevant literature of research value may still have been omitted. In terms of research methodology, keyword co-occurrence analysis can reveal research hotspots; however, this method is dependent on the keywords chosen by the authors. Furthermore, keyword co-occurrence analysis cannot reveal causal or logical connections between keywords.
Despite the implementation of screening criteria, including “Document Types” and “Publication Years” to ensure the timeliness of the literature, it is possible that some relevant literature with research value may have been omitted. With regard to the methodology of research, although the analysis of keyword co-occurrence can reveal areas of research that are currently in vogue, this method is dependent on the keywords selected by the authors of the research in question. Furthermore, it should be noted that the application of keyword co-occurrence analysis is unable to reveal causal or logical connections between keywords.

5. Conclusions

This review revealed the current status and research trends in the application of eye-tracking technology in urban street and park research by synthesising and analysing 48 pieces of related literature over the period of 2015 to 2024. Our research revealed that, in the context of urban street research, the predominant focus of eye-tracking technology has been on visual preference and healing.
In the context of urban street spaces, major studies have demonstrated that streetscape preference is influenced by both natural (e.g., vegetation) and artificial (e.g., buildings and signs) elements. Furthermore, in the context of commercial pedestrian streets, the capacity of commercial elements, such as store signage, to attract attention is also of significance. Furthermore, the configuration of the street interface (e.g., ground floor uses and sidewalk width) exerts a significant influence on the visual preferences of pedestrians. In terms of the healing process, the visual environment of urban streets has been shown to have a significant effect on the psychological recovery of pedestrians. The combination of natural and artificial elements has been demonstrated to have a different effect on healing, and the lighting conditions of the street also have a significant effect on the visual behaviour and healing experience of pedestrians.
In the context of urban park spaces, the implementation of eye-tracking technology has been primarily focused on two key areas: visual preference and the therapeutic properties of these environments. From a visual preference perspective, artificial landscape elements (e.g., streetlights and benches) attract participants’ attention more than natural landscape elements (e.g., trees and shrubs).However, from a healing perspective, natural landscape elements have been shown to significantly facilitate psychological recovery. In addition to this, a significant positive correlation has been identified between landscape design intensity and landscape preference and restorativeness. This suggests that as design intensity increases, the landscape becomes more visually attractive.
The present study elucidates visual preference and healing as the two core research directions in the fields analysed. This study identifies four major themes of the narrative through the utilisation of keyword co-occurrence and theme classification analysis methods, namely, urban streets and visual preference, urban streets and healing, urban parks and visual preference, and urban parks and healing. Furthermore, this approach unveils the prevailing hotspots and emergent trends in the present research, thereby providing a clear directional guide for subsequent research endeavours. Examples include the breadth of multidisciplinary cross-studies, the importance of landscape elements in visual preference and healing, and the intensification of multisensory interactions. These findings offer novel insights that will inform future research in this field. Furthermore, this review provides an in-depth analysis of the limitations of the research methodology and research content, highlighting the shortcomings of the current research in terms of literature search, screening, and analysis methodology, and proposing directions for improvement in subsequent research. This review underscores the immense potential of eye-tracking technology in the study of urban public spaces. It particularly highlights the promising applications of this technology in other outdoor public spaces, such as university and hospital outdoor areas. By offering significant theoretical underpinnings and practical guidance, the review significantly contributes to the field of urban planning and design.
From a practical value perspective, for urban planners and designers, this review systematically maps eye-tracking metrics (such as TFD, FF, APD, etc.) to the design elements of streets and parks, providing designers with quantifiable evidence for visual preferences. For instance, the significant increase in TFD on large billboards suggests the need to balance commercial information density with aesthetic experience. For policymakers, by revealing the significant reduction in APD (pupil diameter) due to street greening, this review supports the physiological basis for “green view rate” policies and provides data support for ecological compensation strategies in urban renewal. For eye-tracking device manufacturers, Table 2 shows the proportion of head-mounted devices in dynamic scenarios (such as streets) and the higher proportion of VR/AR devices in the “visual preference” theme, providing directions for device development.

Author Contributions

Conceptualization, L.Y. and Z.Y.; methodology, L.Y. and Z.Y.; software, C.B. and Z.Y.; validation, C.B., L.Y. and Z.Y.; formal analysis, C.B., F.W. and Z.Y.; investigation, C.B., F.W. and Z.Y.; resources, X.W.; data curation, X.W.; writing—original draft preparation, L.Y., F.W. and Z.Y.; writing—review and editing, L.Y., F.W. and Z.Y.; visualisation, X.W.; supervision, F.W.; project administration, F.W.; funding acquisition, F.W. All authors have read and agreed to the published version of the manuscript.

Funding

The Youth Project of Humanities and Social Sciences Fund of the Ministry of Education (Grant No. 21YJCZH174); Yuxiu Innovation Project of NCUT (Grant No. 2024NCUTYXCX214); 2024 Construction of an Integrated Practice Platform at School of Architecture and Art in North China University of Technology (Grant No. 108051360024XN052).

Data Availability Statement

The original contributions of this study are included in the article. For further inquiries, please contact the corresponding author directly.

Acknowledgments

The comments provided by the anonymous reviewer are greatly appreciated, as they have contributed to enhancing the quality of the manuscript.

Conflicts of Interest

The authors declare no conflicts of interest.

References

  1. Nie, W.; Fan, L.; Wei, Y.; Hu, R.; Zhao, C.; Zhu, Z. Quantitative research on street space based on visual perception—Taking the streets within the first ring of Hefei city as an example. Urban Constr. 2021, 18, 176–180. (In Chinese) [Google Scholar] [CrossRef]
  2. Yin, Y.; Kevin, S.; Shao, Y.; Sun, Z. Research on the Balance of the Healing Efficacy and Functional Value of Street Environment—Taking University Road and Guokang Road in Yangpu District of Shanghai as Examples. New Archit. 2021, 4, 55–60. (In Chinese) [Google Scholar]
  3. Al Tuwirqi, A.A. Eye-Tracking Technology in Dentistry: A Review of Literature. Cureus 2024, 16, e55105. [Google Scholar] [CrossRef]
  4. Zheng, Y.; Wang, Y.; Cui, L. The Application of Eye-tracking Technology in Multimedia Learning: A Review of Related Studies from 2005 to 2015. Res. Electro.-Educ. 2016, 37, 68–76, 91. (In Chinese) [Google Scholar] [CrossRef]
  5. Chen, Q.; Zhou, X.; Han, J.; An, J. Eye-tracking: Patterns, Technologies, and Applications. Lab. Res. Explor. 2012, 31, 10–15. (In Chinese) [Google Scholar]
  6. Zhang, L.; Zhao, W.; Qiu, Y.; Xu, W. Research on the Dissemination Model of Architectural Cultural Heritage Based on Natural Interaction—Taking Jinlian Bridge as an Example. Packag. Eng. 2021, 42, 20–25. (In Chinese) [Google Scholar] [CrossRef]
  7. Kang, L. Misunderstandings and Prospects of Eye-tracking Experiments in Design Research—A Review Based on the Current Research Status in China. Decoration 2017, 8, 122–123. (In Chinese) [Google Scholar] [CrossRef]
  8. Bao, Y.; Sun, M.; Zhang, J.; Lu, Y. Research Progress on the Application of Eye-tracking Technology in Landscape Architecture. Landsc. Archit. 2024, 31, 79–86. (In Chinese) [Google Scholar] [CrossRef]
  9. Sun, L.; Shao, H.; Li, S.; Huang, X.; Yang, W. Integrated Application of Eye Movement Analysis and Beauty Estimation in the Visual Landscape Quality Estimation of Urban Waterfront Park. Int. J. Pattern Recognit. Artif. Intell. 2018, 32, 1856010. [Google Scholar] [CrossRef]
  10. Matsuda, Y.; Kawauchi, A.; Motooka, N. Gazing Behavior Exhibited by People with Low Vision While Navigating Streets. J. Asian Archit. Build. Eng. 2021, 20, 414–427. [Google Scholar] [CrossRef]
  11. Miller, P.A. Eye-Tracking and Visual Preference: Maybe Beauty Is in the Eye of the Beholder? Land 2024, 13, 598. [Google Scholar] [CrossRef]
  12. Lee, S.; Byun, G.; Ha, M. Exploring the Association between Environmental Factors and Fear of Crime in Residential Streets: An Eye-Tracking and Questionnaire Study. J. Asian Archit. Build. Eng. 2024, 23, 1518–1535. [Google Scholar] [CrossRef]
  13. Jiang, X.; Li, J.; Yang, B. Luminance and Saliency Have Impact on Pedestrians’ Fixation Distribution during Natural Walking: Evidence from Mobile Eye-Tracker. Light. Res. Technol. 2021, 53, 359–372. [Google Scholar] [CrossRef]
  14. Zheng, S.; Zhang, J.; Zu, R.; Li, Y. Visual Perception Differences and Spatiotemporal Analysis in Commercialized Historic Streets Based on Mobile Eye-tracking: A Case Study in Nanchang Wanshou Palace, China. Buildings 2024, 14, 1899. [Google Scholar] [CrossRef]
  15. Fu, H.; Wang, P.; Zhou, J.; Zhang, S.; Li, Y. Investigating Influence of Visual Elements of Arcade Buildings and Streetscapes on Place Identity Using Eye-Tracking and Semantic Differential Methods. Buildings 2023, 13, 1580. [Google Scholar] [CrossRef]
  16. Sun, L.; Xu, Y.; Teng, S.; Wang, B.; Li, M.; Ding, S. Research into the Visual Saliency of Guide Signs in an Underground Commercial Street Based on an Eye-Movement Experiment. Sustainability 2022, 14, 16062. [Google Scholar] [CrossRef]
  17. Crosby, F.; Hermens, F. Does It Look Safe? An Eye-tracking Study into the Visual Aspects of Fear of Crime. Q. J. Exp. Psychol. 2019, 72, 599–615. [Google Scholar] [CrossRef]
  18. Al Mushayt, N.S.; Dal Cin, F.; Barreiros Proença, S. New Lens to Reveal the Street Interface. A Morphological-Visual Perception Methodological Contribution for Decoding the Public/Private Edge of Arterial Streets. Sustainability 2021, 13, 11442. [Google Scholar] [CrossRef]
  19. Kim, B.; Park, J. The Visual Effect of Signboards on the Vitality of the Streetscapes Using Eye-Tracking. Sustainability 2020, 13, 30. [Google Scholar] [CrossRef]
  20. Fotios, S.; Yang, B.; Uttley, J. Observing Other Pedestrians: Investigating the Typical Distance and Duration of Fixation. Light. Res. Technol. 2015, 47, 548–564. [Google Scholar] [CrossRef]
  21. Simpson, J.; Thwaites, K.; Freeth, M. Understanding Visual Engagement with Urban Street Edges along Non-Pedestrianised and Pedestrianised Streets Using Mobile Eye-Tracking. Sustainability 2019, 11, 4251. [Google Scholar] [CrossRef]
  22. Chana, K.; Mikuni, J.; Schnebel, A.; Leder, H. Reading in the City: Mobile Eye-Tracking and Evaluation of Text in an Everyday Setting. Front. Psychol. 2023, 14, 1205913. [Google Scholar] [CrossRef]
  23. Chen, Y.; Chen, Z.; Du, M. Designing Attention—Research on Landscape Experience Through Eye-tracking in Nanjing Road Pedestrian Mall (Street) in Shanghai. Landsc. Archit. Front. 2022, 10, 52. [Google Scholar] [CrossRef]
  24. Gong, C.; Yu, P.; Wu, H.; Lan, T. Usability Evaluation of Road Map Schematic Representation. Surv. Mapp. Bull. 2021, 224, 81–85. (In Chinese) [Google Scholar] [CrossRef]
  25. Ding, Y.; Ma, J.; Pan, Y. Eye Movement Characteristics of Pedestrians Crossing the Street with and without Signal Control. J. Traffic Transp. Eng. 2019, 37, 40–47. (In Chinese) [Google Scholar]
  26. Fang, C.; Homma, R.; Qiu, T.; Zhong, Q. The Mediating Role of Visual Behavior in Perceived Walkability Evaluation. J. Asian Archit. Build. Eng. 2024, 03, 1–15. [Google Scholar] [CrossRef]
  27. Dietze, P.; Knowles, E.D. Social Class and the Motivational Relevance of Other Human Beings: Evidence From Visual Attention. Psychol. Sci. 2016, 27, 1517–1527. [Google Scholar] [CrossRef] [PubMed]
  28. Dehove, M.; Mikuni, J.; Podolin, N.; Moser, M.K.; Resch, B.; Doerrzapf, L.; Boehm, P.M.; Prager, K.; Leder, H.; Oberzaucher, E. Exploring the Influence of Urban Art Interventions on Attraction and Wellbeing: An Empirical Field Experiment. Front. Psychol. 2024, 15, 1409086. [Google Scholar] [CrossRef] [PubMed]
  29. Yue, Z.; Zhong, Y.; Cui, Z. Respondent Dynamic Attention to Streetscape Composition in Nanjing, China. Sustainability 2022, 14, 15209. [Google Scholar] [CrossRef]
  30. Li, Y.; Huang, J.; Liang, J.; Zhang, Y.; Chen, Y. Research on the Visual Attractiveness and Its Perception Influencing Factors of Commercial Street Space in Cultural Heritage Sites—Taking Kulangsu Longtou Road as an Example. J. Hum. Settl. West China 2022, 37, 114–121. (In Chinese) [Google Scholar] [CrossRef]
  31. Tomoda, M.; Uno, H.; Hashimoto, S.; Yoshiki, S.; Ujihara, T. Analysis on the Impact of Traffic Safety Measures on Children’s Gaze Behavior and Their Safety Awareness at Residential Road Intersections in Japan. Saf. Sci. 2022, 150, 105706. [Google Scholar] [CrossRef]
  32. Fotios, S.; Uttley, J. Illuminance Required to Detect a Pavement Obstacle of Critical Size. Light. Res. Technol. 2018, 50, 390–404. [Google Scholar] [CrossRef]
  33. Wu, Y.; Dong, W.; Zhang, W. Research on the Influencing Factors of Perception of the Built Environment in Neighborhoods—Evidence from Behavioral Experiments. Urban Plan. 2022, 46, 99–109. (In Chinese) [Google Scholar]
  34. Amati, M.; McCarthy, C.; Parmehr, E.G.; Sita, J. Combining Eye-Tracking Data with an Analysis of Video Content from Free-Viewing a Video of a Walk in an Urban Park Environment. J. Vis. Exp. 2019, 147, e58459. [Google Scholar] [CrossRef]
  35. Amati, M.; Ghanbari Parmehr, E.; McCarthy, C.; Sita, J. How Eye-Catching Are Natural Features When Walking through a Park? Eye-Tracking Responses to Videos of Walks. Urban For. Urban Green. 2018, 31, 67–78. [Google Scholar] [CrossRef]
  36. Wu, Y.; Zhuo, Z.; Liu, Q.; Yu, K.; Huang, Q.; Liu, J. The Relationships between Perceived Design Intensity, Preference, Restorativeness and Eye Movements in Designed Urban Green Space. Int. J. Environ. Res. Public Health 2021, 18, 10944. [Google Scholar] [CrossRef]
  37. Gholami, Y.; Taghvaei, S.H.; Norouzian-Maleki, S.; Mansouri Sepehr, R. Identifying the Stimulus of Visual Perception Based on Eye-Tracking in Urban Parks: Case Study of Mellat Park in Tehran. J. For. Res. 2021, 26, 91–100. [Google Scholar] [CrossRef]
  38. Ma, R.; Luo, Y.; Furuya, K. Gender Differences and Optimizing Women’s Experiences: An Exploratory Study of Visual Behavior While Viewing Urban Park Landscapes in Tokyo, Japan. Sustainability 2023, 15, 3957. [Google Scholar] [CrossRef]
  39. Li, C.; Du, C.; Ge, S.; Tong, T. An Eye-Tracking Study on Visual Perception of Vegetation Permeability in Virtual Reality Forest Exposure. Front. Public Health 2023, 11, 1089423. [Google Scholar] [CrossRef]
  40. Ma, R.; Luo, Y.; Furuya, K. Classifying Visually Appealing Elements in Parks Using Social Media Data-Assisted Eye-Tracking: Case Study of Shinsui Parks in Tokyo, Japan. J. Outdoor Recreat. Tour. 2023, 44, 100672. [Google Scholar] [CrossRef]
  41. Li, C.; Huang, X. Differences in Visual Attraction between Historical Garden and Urban Park Walking Scenes. Land 2022, 11, 1766. [Google Scholar] [CrossRef]
  42. Sun, Y.; Ding, Y.; Lei, M.; Mao, L. Restoration Evaluation of National Forest Park in Greater Khingan Mountains Region, China. Sustainability 2024, 16, 11022. [Google Scholar] [CrossRef]
  43. Wang, P.; Yang, W.; Wang, D.; He, Y. Insights into Public Visual Behaviors through Eye-Tracking Tests: A Study Based on National Park System Pilot Area Landscapes. Land 2021, 10, 497. [Google Scholar] [CrossRef]
  44. Zhou, X.; Cen, Q.; Qiu, H. Effects of Urban Waterfront Park Landscape Elements on Visual Behavior and Public Preference: Evidence from Eye-Tracking Experiments. Urban For. Urban Green. 2023, 82, 127889. [Google Scholar] [CrossRef]
  45. Zhu, X.; Zhang, Y.; Zhao, W. Differences in Environmental Information Acquisition from Urban Green—A Case Study of Qunli National Wetland Park in Harbin, China. Sustainability 2020, 12, 8128. [Google Scholar] [CrossRef]
  46. Zheng, H.; Luo, M.; Wang, Y.; Wei, Y. Multi-Sensory Interaction and Spatial Perception in Urban Microgreen Spaces: A Focus on Vision, Auditory, and Olfaction. Sustainability 2024, 16, 8809. [Google Scholar] [CrossRef]
  47. Liu, L.; Qu, H.; Ma, Y.; Wang, K.; Qu, H. Restorative Benefits of Urban Green Space: Physiological, Psychological Restoration and Eye Movement Analysis. J. Environ. Manag. 2022, 301, 113930. [Google Scholar] [CrossRef]
  48. Fu, E.; Wang, Y.; Zhou, J.; Li, X. A Preliminary Exploration of Using Eye-tracking Analysis for Evaluating the Restorative Environment of Community Parks. South Archit. 2022, 06, 93–99. (In Chinese) [Google Scholar]
  49. Wang, X.; Deng, W. Research on Cognitive Differences of Product Image Sketches Based on Eye-tracking Technology. J. Comput.-Aided Des. Comput. Graph. 2019, 31, 287–294. (In Chinese) [Google Scholar]
  50. Zhang, Q.; Huang, Z.; Pu, Q. Can Eye Movements Represent the Construction of Scientific Knowledge?—Multidimensional Data Analysis from the Perspective of Argumentation. Mod. Educ. Technol. 2025, 35, 62–70. (In Chinese) [Google Scholar]
  51. Zhu, Q.C.; Wu, F.W.; Bai, H.; Li, Y.H. The Impact of Visual Stimuli from the Linear Space Layout Forms of the Central Reservation of Urban Expressways on Driving Behavior. China J. Highw. Transp. 2022, 35, 239–251. (In Chinese) [Google Scholar] [CrossRef]
  52. Hollander, J.B.; Sussman, A.; Lowitt, P.; Angus, N.; Situ, M. Analyzing Walkability Through Biometrics: Insights Into Sustainable Transportation Through the Use of Eye-Tracking Emulation Software. J. Phys. Act. Health 2020, 17, 1153–1161. [Google Scholar] [CrossRef]
  53. Chen, X. On Several Important Factors Affecting the Effectiveness of Questionnaire Survey Research Methods in Sports Social Sciences. Zhejiang Sports Sci. 2008, 122, 115–117. (In Chinese) [Google Scholar]
  54. Zhao, Y.; Hao, J.; Wang, H.; Qiao, X. Visualization Analysis of the Evolution of Research on the Educational Application of Virtual Reality Technology. Res. Electro-Educ. 2016, 37, 26–33. (In Chinese) [Google Scholar] [CrossRef]
  55. Harris, V.; Kendal, D.; Hahs, A.K.; Threlfall, C.G. Green Space Context and Vegetation Complexity Shape People’s Preferences for Urban Public Parks and Residential Gardens. Landsc. Res. 2018, 43, 150–162. [Google Scholar] [CrossRef]
  56. Li, X.; Zhao, N.; Wang, C.; Wang, M.; Huang, H. A Preliminary Exploration of the Application of Eye-tracking Technology in Campus Tourism Landmark Landscapes—Taking the Peking University Building in Nanjing University as an Example. Acta Agric. Jiangxi 2011, 23, 148–151. (In Chinese) [Google Scholar] [CrossRef]
  57. Cui, W.; Li, Z.; Xuan, X.; Li, Q.; Shi, L.; Sun, X.; Zhu, K.; Shi, Y. Influence of Hospital Outdoor Rest Space on the Eye Movement Measures and Self-Rating Restoration of Staff. Front. Public Health 2022, 10, 855857. [Google Scholar] [CrossRef]
  58. Liu, Y.; Hu, M.; Zhao, B. Interactions between Forest Landscape Elements and Eye Movement Behavior under Audio-Visual Integrated Conditions. J. For. Res. 2020, 25, 21–30. [Google Scholar] [CrossRef]
  59. Liu, L.; Wu, M.; Ma, Y.; Qu, H. A Review of the Application of Eye-tracking Technology in the Field of Landscape. J. Hum. Settl. West China 2021, 36, 125–133. (In Chinese) [Google Scholar] [CrossRef]
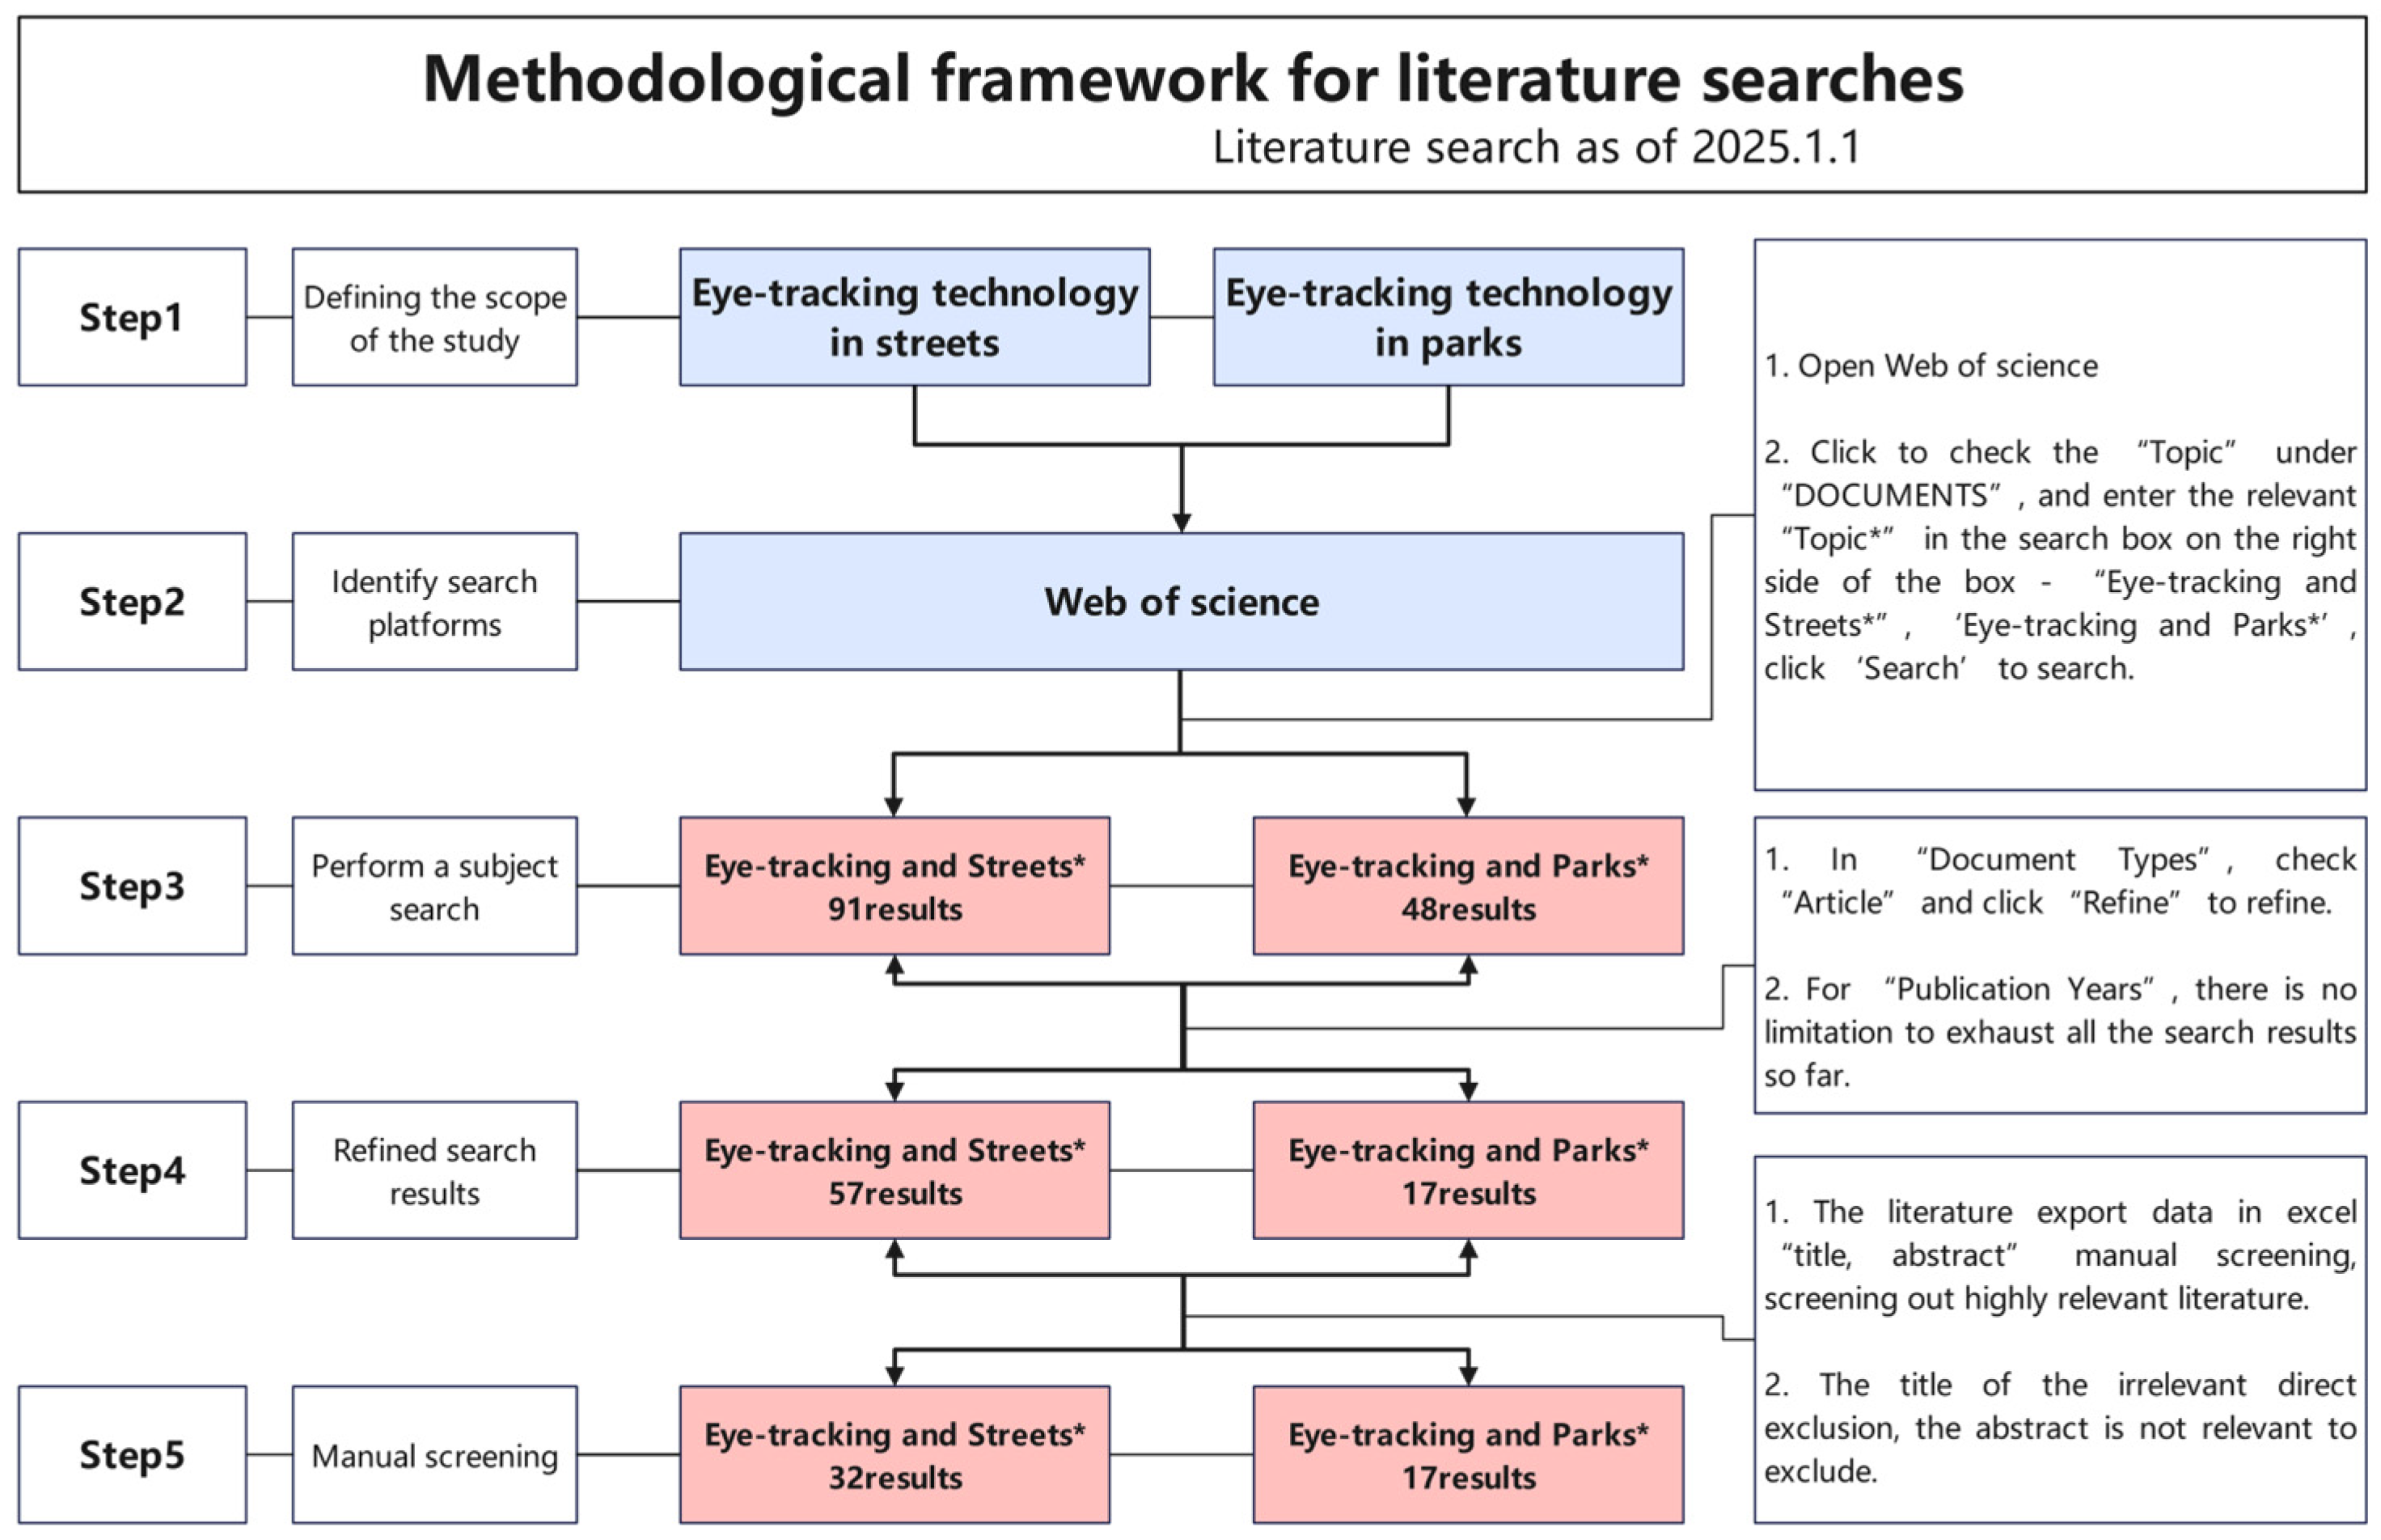
Figure 1. Literature search methodology diagram. Marginal notes: The truncation symbol * represents all spelling variations, singular and plural forms, and derivatives of the adjacent terms, including differences between British and American English.
Applsci 15 09305 g001
Figure 2. Keyword co-occurrence diagram.
Applsci 15 09305 g002
Figure 3. Thematic classification diagram.
Applsci 15 09305 g003
Figure 4. Keyword co-occurrence.
Applsci 15 09305 g004
Figure 5. Research direction diagram.
Applsci 15 09305 g005
Figure 6. Map of Research Areas.
Applsci 15 09305 g006
Figure 7. Map of publications by year.
Applsci 15 09305 g007
Figure 8. Citation frequency map by year.
Applsci 15 09305 g008
Table 1. Thematic categorization results and eye movement indicators.
Theme NameYearAuthorEye Movement Indicators
TFDFFAFDPFDSFASAFSDAPDElse
(1) Urban Streets and Visual Preferences2024Miller. [11]
2024Lee et al. [12]
2021Jiang et al. [13]
2024Zheng et al. [14]
2023Fu et al. [15]
2022Sun et al. [16]
2019Crosby & Hermens. [17]
2021Al Mushayt et al. [18]
2021Kim & Park. [19]
2015Fotios et al. [20]
2019Simpson et al. [21]
2023Chana et al. [22]
2022Yiyan et al. [23]
2021Matsuda et al. [10]
2021Gong et al. [24]
2019Ding et al. [25]
2024Fang et al. [26]
2016Dietze & Knowles, n.d. [27]
2024Dehove et al. [28]
2022Yue et al. [29]
2022Li et al. [30]
2022Tomoda et al. [31]
(2) Urban Streets and Healing2021Al Mushayt et al. [18]
2021Kim & Park. [19]
2019Simpson et al. [21]
2018Fotios & Uttley. [32]
2022Wu et al. [33]
2024Fang et al. [26]
(3) Urban Parks and Visual Preferences2019Amati et al. [34]
2018Amati et al. [35]
2021Wu et al. [36]
2021Gholami et al. [37]
2018Sun et al. [9]
2023Ma et al. [38]
2023Li et al. [39]
2023Ma et al. [40]
2022Li & Huang. [41]
2024Sun et al. [42]
2021Wang et al. [43]
2023Zhou et al. [44]
2020Zhu et al. [45]
2024Zheng et al. [46]
(4) Urban Parks and Healing2019Amati et al. [34]
2018Amati et al. [35]
2021Wu et al. [36]
2018Sun et al. [9]
2023Li et al. [39]
2024Sun et al. [42]
2022Liu et al. [47]
2022Fu et al. [48]
2023Zhou et al. [44]
2024Zheng et al. [46]
Marginal notes: 1. TFD: Total Fixation Duration (M ± SD: 3.61 ± 0.79 s [49]); 2. FF: Fixation Frequency (M ± SD: 223 ± 74 ms [50,51]); 3. AFD: Average Fixation Duration (M ± SD: 278 ± 97 ms [50,51]); 4. PFD: Proportion of Fixation Duration (M ± SD: 512 ± 186 ms [50,51]); 5. SF: Saccade Frequency (M ± SD: 104.7 ± 7.34 times/min [49,50,51]); 6. ASA: Average Saccade Amplitude (M ± SD: 6.8 ± 2.1° [50]); 7. FSD: First Saccade Duration (M ± SD: 1.42 ± 0.36° [50]); 8. APD: Average Pupil Diameter (M ± SD: 3.2 ± 0.4 mm [49,50,51]). √ indicates that this content is included.
Table 2. Topic Categories and Eye Movement Device Models.
Theme NameYearAuthorHead-MountedDesktopVR/AR IntegratedRemote ContactlessEye Movement Device Model
(1) Urban Streets and Visual Preferences2024Miller. [11] Laboratory Eye-tracking System (Not mentioned)
2024Lee et al. [12] Gazepoint GP3 (Gazepoint, Toronto, Canada)
2021Jiang et al. [13] SMI ETG 2w (SMI, Teltow, Germany)
2024Zheng et al. [14] Tobii Glasses 2 (Tobii AB, Stockholm, Sweden)
2023Fu et al. [15] Tobii Pro Spectrum (Tobii AB, Stockholm, Sweden)
2022Sun et al. [16] Tobii VR
Tobii Pro X3-120 (Tobii AB, Stockholm, Sweden)
2019Crosby & Hermens. [17] SR Research Eyelink 1000 (Tobii AB, Stockholm, Sweden)
2021Al Mushayt et al. [18] Pupil Invisible (Pupil Labs, Berlin, Germany)
2021Kim & Park. [19] Gazepoint GP3 HD (Gazepoint, Vancouver, Canada)
2015Fotios et al. [20] iView X HED (SMI, Berlin, Germany)
2019Simpson et al. [21] SensoMotoric Instruments (SMI) Glasses 2.0 (SMI, Berlin, Germany)
2023Chana et al. [22] Pupil Labs Pupil Core (Pupil Labs GmbH, Berlin, Germany)
Tobii Pro Glasses 3 (Tobii AB, Stockholm, Sweden)
2022Yiyan et al. [23] Ergoneers Dikablis (Ergoneers GmbH, Aschheim, Germany)
2021Matsuda et al. [10] NAC Image Technology EMR-9 (NAC Image Technology Inc, Tokyo, Japan)
2021Gong et al. [24] Gazetech mini (Not mentioned)
2019Ding et al. [25] Tobii Glasses (Tobii AB, Stockholm, Sweden)
2024Dehove et al. [28] Tobii Pro Glasses 3 (Tobii AB, Stockholm, Sweden)
Pupil Invisible Glasses (Pupil Labs, Berlin, Germany)
2022Yue et al. [29] Tobii Pro (Tobii Pro, Stockholm, Sweden)
2019Crosby & Hermens. [17] SR Research Eyelink 1000 (Tobii AB, Stockholm, Sweden)
2021Al Mushayt et al. [18] Pupil Invisible (Pupil Labs, Berlin, Germany)
2021Kim & Park. [19] Gazepoint GP3 HD (Gazepoint, Vancouver, Canada)
2015Fotios et al. [20] iView X HED (SMI, Berlin, Germany)
2019Simpson et al. [21] SensoMotoric Instruments (SMI) Glasses 2.0 (SMI, Berlin, Germany)
2023Chana et al. [22] Pupil Labs Pupil Core (Pupil Labs GmbH, Berlin, Germany)
Tobii Pro Glasses 3 (Tobii AB, Stockholm, Sweden)
2022Yiyan et al. [23] Ergoneers Dikablis (Ergoneers GmbH, Aschheim, Germany)
2021Matsuda et al. [10] NAC Image Technology EMR-9 (NAC Image Technology Inc, Tokyo, Japan)
2021Gong et al. [24] Gazetech mini (Not mentioned)
2019Ding et al. [25] Tobii Glasses (Tobii AB, Stockholm, Sweden)
2024Fang et al. [26] Pico Neo3 Pro Eye-Tracking (VR-HMD) (Not mentioned)
2016Dietze & Knowles, n.d. [27] Google Glass (Google Mountain View, California, United States),
SR Research EyeLink 1000 (SR Research, Kanata, Ontario, Canada)
2024Dehove et al. [28] Tobii Pro Glasses 3 (Tobii Technology, Stockholm, Sweden)
Pupil Invisible Glasses (Pupil Labs, Berlin, Germany)
2022Yue et al. [29] Tobii Pro (Tobii Pro, Stockholm, Sweden)
2022Li et al. [30] Tobii Glasses 2 ( Tobii, Stockholm, Sweden)
2022Tomoda et al. [31] Ditect QG-Plus (DITEC Co., Ltd., Tokyo, Japan)
(2) Urban Streets and Healing2021Al Mushayt et al. [18] Pupil Invisible (Pupil Labs, Berlin, Germany)
2021Kim & Park. [19] Gazepoint GP3 HD (Gazepoint, Vancouver, Canada)
2019Simpson et al. [21] SensoMotoric Instruments (SMI) Glasses 2.0 (SMI) Glasses 2.0 (SMI, Berlin, Germany)
2018Fotios & Uttley. [32] Head-mounted mobile eye-tracking device (Not mentioned)
2022Wu et al. [33] Tobii Pro Spectrum (Tobii AB, Stockholm, Sweden)
2024Fang et al. [26] Pico Neo3 Pro Eye-Tracking (VR-HMD) (Not mentioned)
(3) Urban Parks and Visual Preferences2019Amati et al. [34] Tobii T60 XL (Tobii AB, Stockholm, Sweden)
2018Amati et al. [35] Tobii x120 (Tobii AB, Stockholm, Sweden)
2021Wu et al. [36] Eye-link 1000 plus (SR Research, Kanata, Canada)
2021Gholami et al. [37] SMI Eye-tracking Glasses 2.0 (SMI, Teltow, Germany
2018Sun et al. [9] Tobii X2-30 (Tobii, Stockholm, Sweden)
2023Ma et al. [38] Tobii Pro Nano
2023Li et al. [39] Ergo VR (Beijing Kingfar Technologies Inc), HTC Vive Pro head-mounted display (HTC Inc.Tai wan, China)
2023Ma et al. [40] Tobii Pro Nano (Tobii, Stockholm, Sweden)
2022Li & Huang. [41] aSee pro (7 Inversum Technology Ltd., Beijing, China)
2024Sun et al. [42] Tobii Pro Glasses 2 (Tobii AB, Stockholm, Sweden)
2021Wang et al. [43] Tobii Pro X3-120 (Tobii AB, Stockholm, Sweden)
2023Zhou et al. [44] SMI Eye-tracking Glasses (SMI, Berlin, Germany)
2020Zhu et al. [45] Tobii Pro Glass 2 (Tobii, Stockholm, Sweden)
2024Zheng et al. [46] Tobii Glasses 2 Pro (Tobii, Stockholm, Sweden)
(4) Urban Parks and Healing2019Amati et al. [34] Tobii T60 XL (Tobii AB, Stockholm, Sweden)
2018Amati et al. [35] Tobii x120 (Tobii AB, Stockholm, Sweden)
2021Wu et al. [36] Eye-link 1000 plus (SR Research, Kanata, Canada)
2018Sun et al. [9] Tobii X2-30 (Tobii, Stockholm, Sweden)
2023Li et al. [39] Ergo VR (Beijing Kingfar Technologies Inc), HTC Vive Pro (HTC Inc.Tai wan, China)
2024Sun et al. [42] Tobii Pro Glasses 2 (Tobii AB, Stockholm, Sweden)
2022Liu et al. [47] Tobii Glasses 2 Pro (Tobii, Stockholm, Sweden)
2022Fu et al. [48] Tobii Pro Glasses 2 (Tobii, Stockholm, Sweden)
2023Zhou et al. [44] SMI Eye-tracking Glasses (SMI, Berlin, Germany)
2024Zheng et al. [46] Tobii Glasses 2 Pro (Tobii, Stockholm, Sweden)
Marginal notes: √ indicates that this content is included.
Disclaimer/Publisher’s Note: The statements, opinions and data contained in all publications are solely those of the individual author(s) and contributor(s) and not of MDPI and/or the editor(s). MDPI and/or the editor(s) disclaim responsibility for any injury to people or property resulting from any ideas, methods, instructions or products referred to in the content.