Article

Wake Turbulence Induced by Local Blade Oscillation in a Linear Cascade

1
Faculty of Mechanical Engineering, University of West Bohemia, Univerzitní 8, 301 00 Pilsen, Czech Republic
2
Research and Testing Institute Pilsen, Tylova 46, 301 00 Pilsen, Czech Republic
3
Institute of Thermomechanics of the Czech Academy of Sciences, Dolejškova 5, 182 00 Prague, Czech Republic
*
Author to whom correspondence should be addressed.
Appl. Sci. 2025, 15(17), 9263; https://doi.org/10.3390/app15179263
Submission received: 31 July 2025 / Revised: 18 August 2025 / Accepted: 19 August 2025 / Published: 22 August 2025

Abstract

This paper investigates the oscillatory effect of a single blade on the turbulence wake downstream of a low-pressure turbine cascade. Experimental investigations were conducted at a chord-based Reynolds number of 2.3 × 10 5 with an excitation frequency of 73 Hz. The experimental campaign encompassed two incidence angles (−3° and +6°) and three blade motion conditions: stationary, bending, and torsional vibrations. Turbulence characteristics were analyzed using hot-wire anemometry. The results indicate that the bending mode notably alters the wake topology, causing a 5% decline in streamwise velocity deficit compared to other modes. Additionally, the bending motion promotes the formation of large-scale coherent vortices within the wake, increasing the integral length scale by 7.5 times. In contrast, Kolmogorov’s microscale stays mostly unaffected by blade oscillations. However, increasing the incidence angle causes the smallest eddies in the inter-blade region to grow three times larger. Moreover, the data indicate that at −3°, bending-mode results in an approximate 13% reduction in the turbulence energy dissipation rate compared to the stationary configuration. Furthermore, the study emphasizes the spectral features of turbulent flow and provides a detailed assessment of the Taylor microscale under different experimental conditions.

1. Introduction

Aeroelastic instability of turbine blades—commonly called blade flutter—remains a major concern in high-power turbomachinery. Caused by unsteady aerodynamic forces, this phenomenon involves self-excited blade vibrations that can ultimately cause catastrophic failure [1,2]. Although its importance is widely recognized, a universally accepted mitigation strategy has not yet been developed. The prevailing engineering practice involves limiting turbine operation to designated “flutter-free” regions [3]. However, defining safe operational limits is especially difficult in steam turbines with low-pressure stages. This complexity mainly stems from the dual nature of elongated blades. While they improve the extraction of residual steam energy, they also raise the risk of flutter, mainly due to complex and transient flow patterns.
In recent decades, research on flutter in turbine blade cascades has grown substantially. Because experimental studies are costly and complex, most research has relied on computational fluid dynamics (CFD) methods. Significant progress has been achieved in developing effective numerical tools for aeromechanical analysis [4]. Nevertheless, numerical methods initially designed for industrial applications often lack the accuracy required to capture the intricate flow phenomena in advanced low-pressure turbines, especially in regions with flow separation. Consequently, high-fidelity modeling approaches have become crucial for accurately understanding the underlying physical mechanisms [5]. In this context, Win Naung et al. [6] used numerical simulations to study how blade oscillations impact vortex shedding and wake dynamics in low-pressure turbines. Their application of a harmonic balance approach demonstrated that multiple harmonics are needed to align with time-domain analyses. The study also showed that vibrations significantly change turbulent wake development downstream. Similarly, Fan et al. [7] examined the role of vortex-induced vibrations in flow around short-span cylinders, using a nonlinear aerodynamic damping model. However, their results indicated that the model is effective only under flow conditions with high Scruton numbers and does not fully capture unsteady flow features caused by vibrations. Wang and Zou [8] evaluated how geometric design parameters affect turbine blade performance. By combining Reynolds Averaged Navier–Stokes simulations with PC-Kriging for uncertainty quantification, they showed that upstream disturbances, such as incoming wakes, strongly influence boundary layer behavior, vortex structures, and total pressure loss in gas turbines.
Generally, numerical simulations confirm that blade flutter considerably alters the flow topology, often leading to the formation of large-scale coherent structures that impact turbine efficiency and stability. However, despite advances in modeling, accurately representing small-scale turbulent features remains difficult because of their sensitivity to transient flow phenomena and limits in numerical resolution. This highlights the continued need for experimental validation.
In response to the limitations of numerical modeling, a number of experimental investigations have employed hot-wire anemometry to enhance the characterization of turbulence in turbomachinery. Early work by Camp [9] provided key measurements of turbulence intensity and integral length scales in a low-speed multistage compressor. Subsequent research by Oro et al. [10] expanded on this by analyzing turbulence behavior in a single-stage axial fan at multiple axial locations, revealing how turbulence evolves spatially across rotor–stator interactions. Building on these efforts, Maunus et al. [11] used experimental data from NASA to investigate turbulence characteristics in a scaled geared turbofan, focusing on kinetic energy, dissipation rates, and length scales, while also comparing their findings with CFD simulations. Although the simulations reasonably captured the main turbulence metrics, notable discrepancies in dissipation rate predictions highlighted inconsistencies in theoretical and numerical interpretations. Odier et al. [12] contributed further by analyzing turbulence intensity and spectral characteristics within the fan stage of a small geared turbofan, providing a more comprehensive understanding of turbulence behavior in contemporary engine architectures. Their findings indicated that, although numerical simulations effectively captured dominant spectral patterns and temporal scales, they consistently overpredicted turbulence intensity downstream of the stator.
Overall, despite meaningful progress in computational modeling of blade flutter, achieving accurate and robust predictions continues to be a significant challenge. A substantial drawback is the lack of high-quality experimental data on the interaction between airflow and turbine blades—data that is essential for validating and improving numerical models. Addressing this experimental gap is crucial for enhancing the predictive power of current methods and reducing the risk of aeroelastic instability. Accordingly, the present study focuses on the experimental investigation of turbulent wake development behind a vibrating blade using hot-wire anemometry.
The paper is organized as follows. Section 2 describes the materials and methods used in the experimental study. This section provides a comprehensive overview of the wind tunnel setup, detailed specifications of the turbine blade cascade geometry, and descriptions of the experimental scenarios. Additionally, it includes the calibration procedure for the hot-wire probe. Section 3 presents the main experimental results obtained using hot-wire anemometry. It focuses on the features of turbulent wake formation downstream of the blade cascade under different experimental conditions, including the distributions of normalized velocity profiles, turbulent kinetic energy, and the behavior of the skewness factor. Furthermore, Section 3 discusses the unique aspects of the evolution of the integral length, Taylor, and Kolmogorov microscales, providing corresponding estimates of turbulent energy dissipation rates across different experimental scenarios. The section also features a detailed spectral analysis of the power density distributions at selected measurement locations. Finally, Section 4 summarizes the main conclusions derived from the study.

2. Materials and Methods

2.1. Experimental Setup

The experimental investigation was conducted in a blow-down wind tunnel designed by the Department of Power Engineering Systems at the University of West Bohemia in (Pilsen, Czech Republic) [13]. Figure 1 illustrates the layout of the test section and the arrangement of the blades within the linear cascade. The cascade consists of eight blades, with only four configured to undergo controlled oscillatory motion. The experimental section included a rectangular inlet channel measuring 80 mm in height and 59.2 mm in width, respectively. The blades employed in the study were scaled-down representations of the tip section from a last-stage steam turbine rotor. Each specimen featured a chord length of c = 50   mm and a span of h = 79.5   mm . The blade pitch t and stagger angle β were 46 mm and −72°, respectively. The blade incident angle varied from θ = 3 ° to θ = + 6 ° . Consequently, the blockage ratio was about 4.3%. Experimental investigation carried out at a chord-based Reynolds number of R e c 2.3 × 10 5 , corresponding to the inlet velocity of U = 70   m · s 1 . The main goal of this study was to evaluate how single-blade oscillations at different angles affect wake turbulence. To focus solely on this effect, only blade 2 was activated, while the other blades remained stationary. This blade was chosen because its central position in the cascade reduces the influence of the inlet tunnel boundary layer. The excitation frequency f was set to 73 Hz, with torsional and bending mode amplitudes of 0.5° and 0.7 mm, respectively. Flow measurements were taken at mid-span, 3 mm, downstream of the trailing edge, across two blade pitches (blades 2 and 3), with a spatial resolution of 1.5 mm. The experiments used a hot-wire anemometer with an X-wire probe (type 55P63) from Dantec Dynamics (Skovlunde, Denmark). Although the probe allows for two-component flow measurements, this study focuses only on the streamwise dominant velocity component u. Signals were sampled at 250 kHz with 10 Hz high-pass and 60 kHz low-pass filters. Each single-point measurement lasted 10 s.

2.2. Hot-Wire Anemometry: Principles, Calibration, and Uncertainty Analysis

The core operating principle of a constant-temperature anemometer involves maintaining the thermal equilibrium of the heated wire by continuously compensating for its heat losses [14,15]. When interacting with the ambient stream, the heated wire transfers energy to the surroundings mainly through convection. This temperature decrease causes a change in the wire’s electrical resistance, which is continuously measured by a Wheatstone bridge circuit. Deviations from the target temperature are corrected by adjusting the electrical power input, thereby restoring thermal balance. As a result, the power needed to maintain this steady state is directly linked to the flow rate measured by the sensor. To understand this relationship and enable precise measurement of the instantaneous flow velocity, the calibration process was carried out using the Collis–Williams correlation [16,17]. Under these conditions, the heat transfer behavior of the wire during convective cooling is described by Equation (1). The term on the left describes the convective heat transfer from the heated wire to the fluid stream, while the right side applies King’s empirical correlation [18], which relates thermal dissipation to flow velocity.
N c = N u T m T M = A + B R e w N ,
where A, B, M, and N denote calibration constants, with A and B governed by the thermal state and geometric characteristics of the wire [19]. The Nusselt number, N u , and Reynolds number based on wire diameter, R e w , are obtained via Bruun’s method [20]. Where the effective temperature T m is defined as:
T m = 1 2 T w + T
where, T refers to the temperature of the surrounding fluid, while T w corresponds to the temperature of the hot-wire (both are given in Kelvin).
Experimental data collected at 45–85 m · s 1 were used to develop R e w N c calibration curves, fitted with King’s law (see Figure 2). The resulting constants A, B, M, and N enable calculation of the Reynolds number (based on the wire diameter) linked to the characteristic Nusselt number derived from the hot-wire signal.
R e w = N c A B 1 N
After that, the instantaneous velocity u can be determined using the equation provided below:
u = R e w ν d w
where d w and ν are wire diameter and kinematic viscosity of air, respectively.
As illustrated in Figure 2, there is a strong agreement between the calibration curves and the experimental results. The accuracy of the velocity calculations was evaluated using traditional methods [21,22]. Data analysis indicates that the overall uncertainty in converting the hot-wire electrical signal into velocity is about ±0.25%.

3. Results and Discussion

3.1. Wake Topology

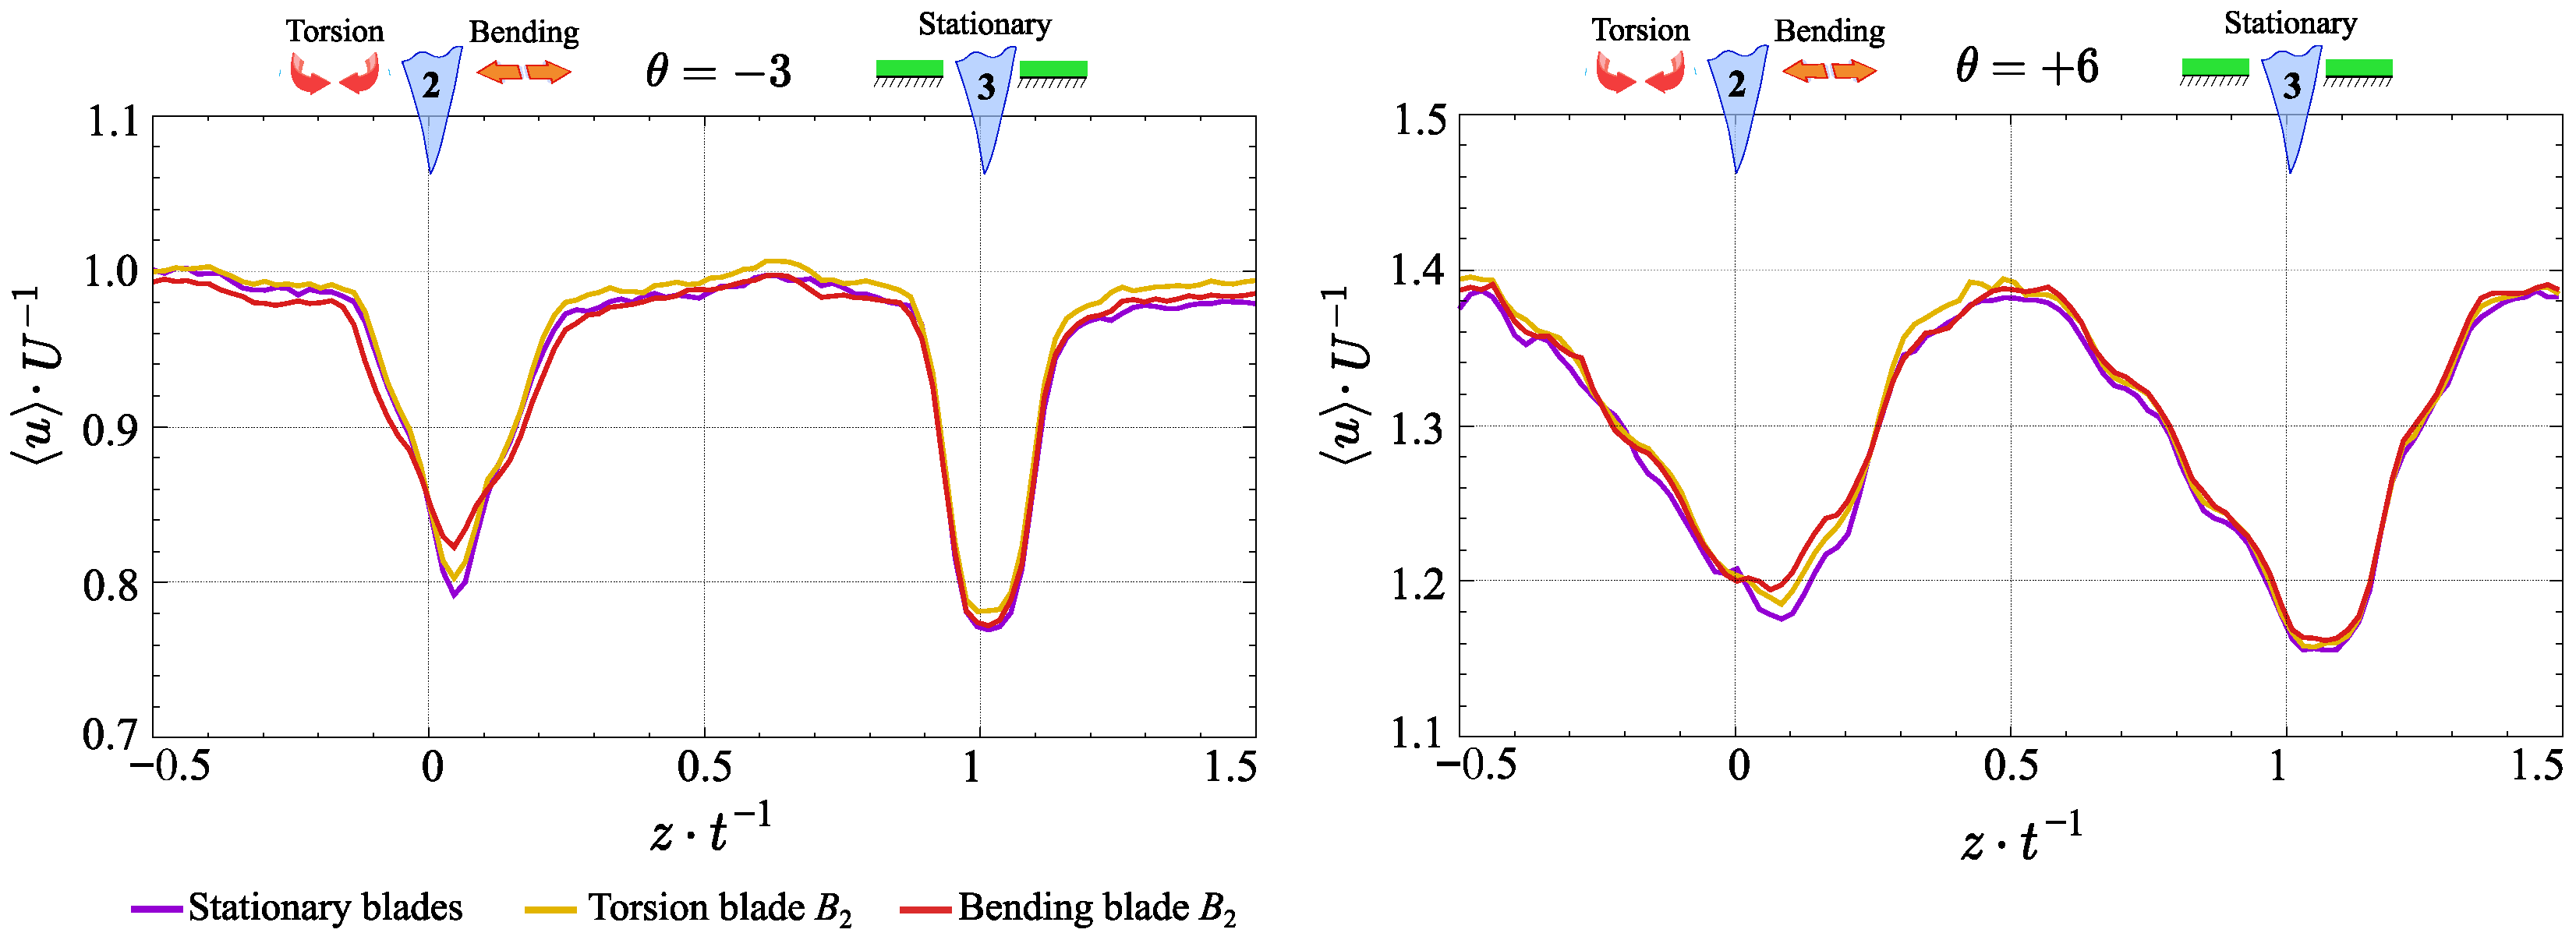
At the start of the study, the effects of various blade oscillation modes and incidence angles on the downstream wake behavior of the blade cascade were examined. Figure 3 illustrates the variation in normalized streamwise velocity distributions across different test conditions. To improve clarity, the measurement locations were normalized by the blade pitch. Consequently, the trailing edges of blades 2 and 3 align with the normalized positions z · t 1 = 0 and z · t 1 = 1 , respectively. The study demonstrates that at θ = 3 , the bending mode blade oscillations notably affect the wake topology, leading to a 5% reduction in velocity deficit compared to other experimental modes. However, this effect diminishes at the θ = + 6 , where a sharp increase in normalized velocity indicates flow acceleration in the inter-blade channel due to flow passage contraction. The data also reveal unexpected variations in wake profiles between individual blades under steady conditions, with blade 3 showing a slightly greater velocity deficit and wider wake than blade 2. These variations are probably due to difficulties in achieving precise dynamic balancing and alignment of the blades within the cascade during the experiment. Overall, the data demonstrate the dominant influence of blade incidence angles on wake formation. Specifically, the negative angle results in an almost symmetrical, narrow wake, while a positive angle twice as large produces a pronounced asymmetry and a broader wake. Additionally, the profiles reveal a gradual shift of the wake center related to the specific characteristics of boundary layer formation under different experimental conditions [23].
The blade’s vibrating motion acts as an additional source of flow perturbation, generating various energy-containing turbulent structures. Therefore, analyzing turbulent kinetic energy provides valuable information into how blade oscillations affect wake turbulence [24]. Since the standard deviation of the flow velocity characterizes the magnitude of velocity fluctuations, the turbulent kinetic energy in the streamwise direction can be defined as one-half of the streamwise velocity variance:
T K E ( u ) = 0.5 · σ u 2
where σ u is the standard deviation of the streamwise velocity component.
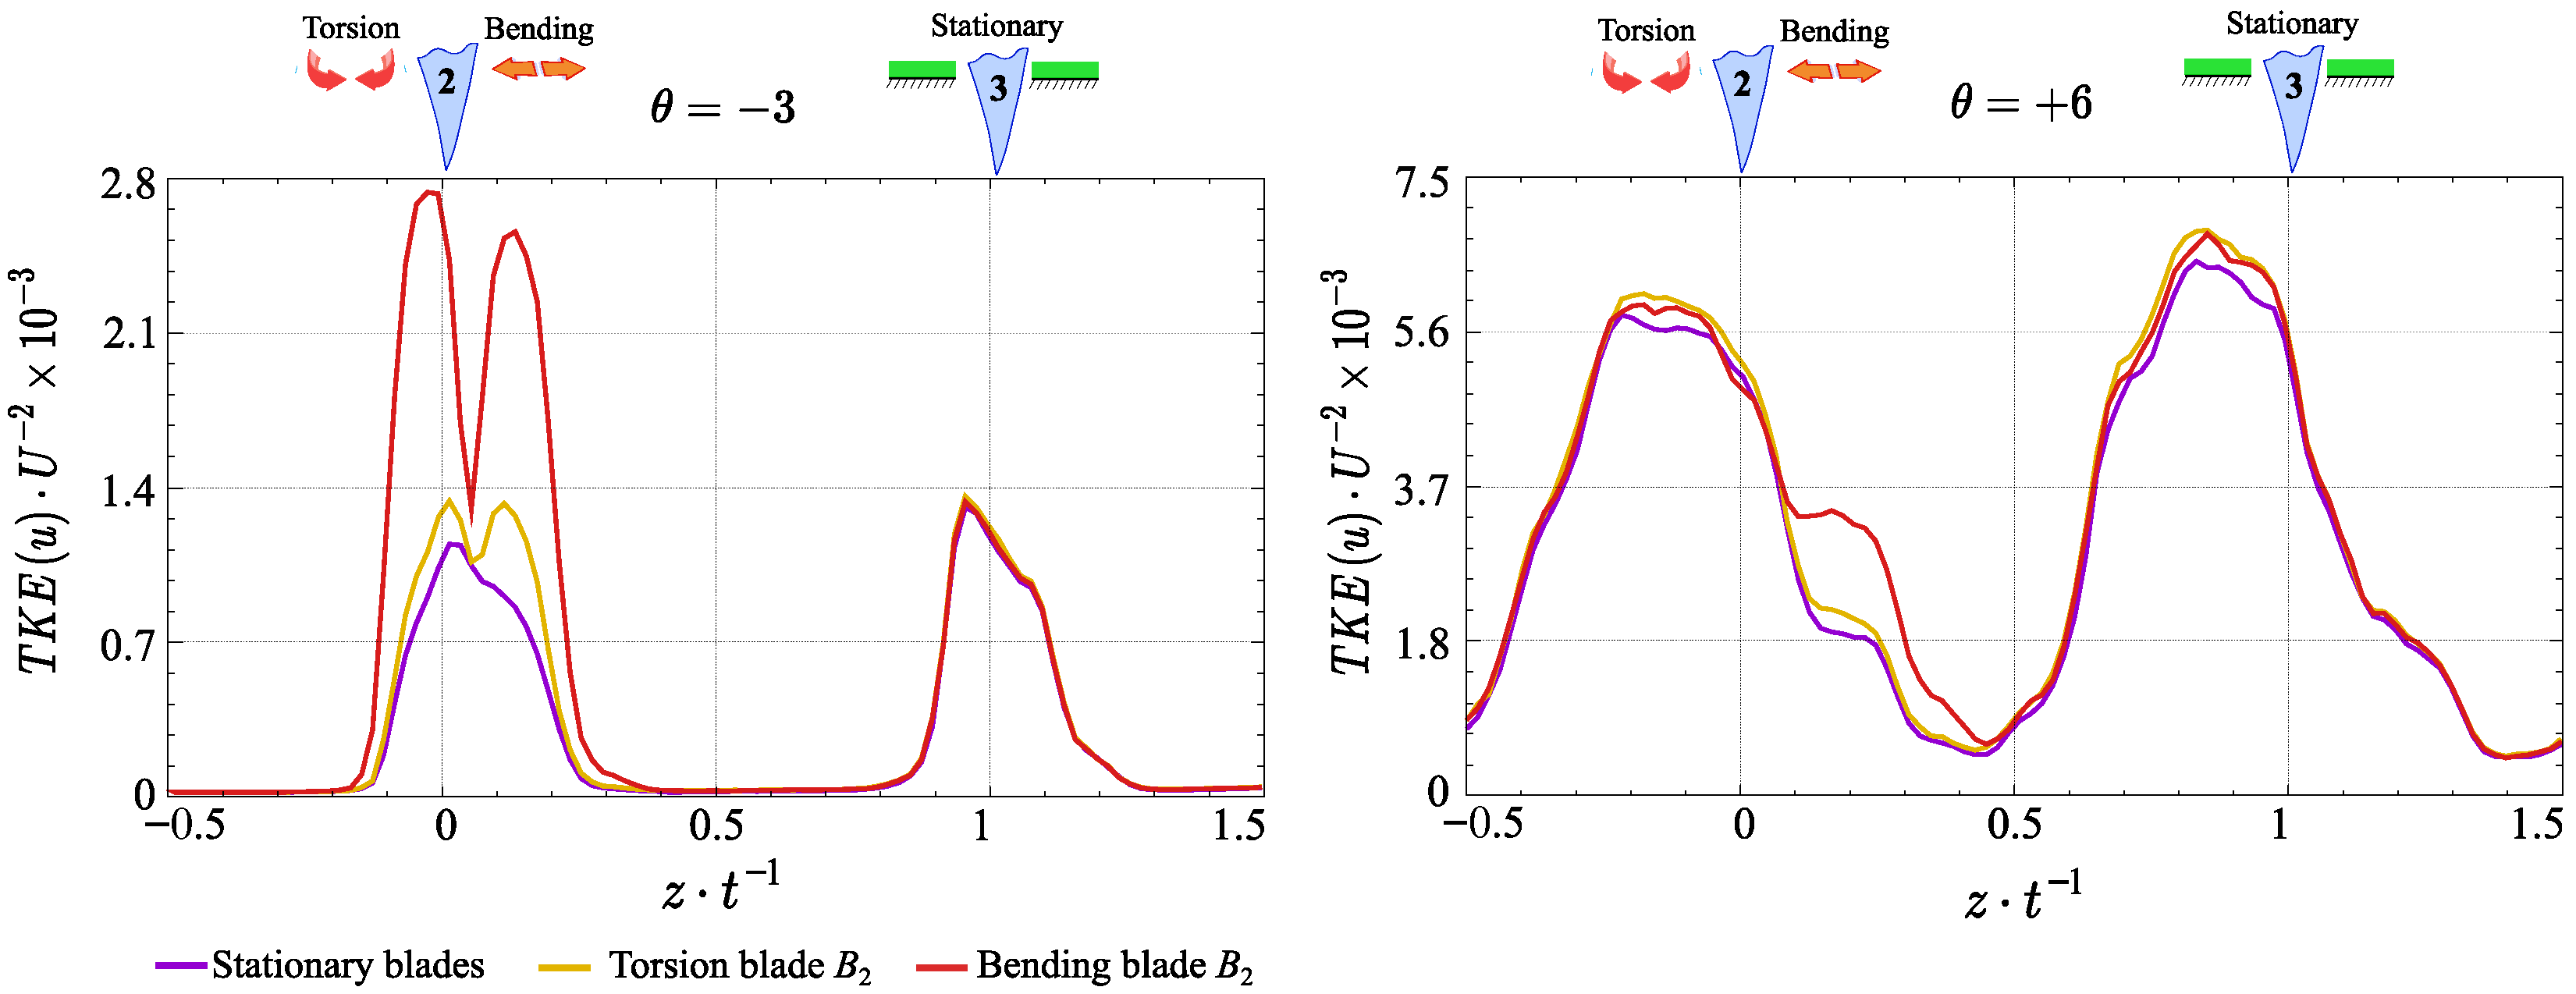
Figure 4 presents the normalized distribution of streamwise turbulent kinetic energy under different experimental conditions. The obtained results reveal a twofold increase in T K E ( u ) at θ = 3 compared to the values observed under steady and torsional oscillation modes. This pattern appears as a clear double peak in the distribution, showing more complex wake dynamics driven by the interaction between flow separation and blade vibrations. Such behavior can be explained by the earlier onset of flow separation, which leads to the active generation and propagation of energetic vortices on both sides of the blade [3,25]. Whereas, at θ = + 6 , the vibration effects decrease and manifest locally in the trailing edge area. Nevertheless, the T K E ( u ) value increases nearly twofold compared to the negative incident angle. This pattern is mainly caused by the strong adverse pressure gradient along the pressure side, resulting in a wider wake filled with large-scale turbulent structures.
The third statistical moment, also known as skewness, is another important parameter for wake estimation [26,27,28]. Physically, it indicates the degree of asymmetry in the probability density function (PDF) of velocity fluctuations and provides further insights into the structure of turbulent flow. In a turbulent environment, a zero value signifies a symmetric distribution of fluctuations, suggesting balanced turbulent activity. Positive skewness indicates the dominance of strong positive velocity perturbations, usually tied to energetic structures that promote wake mixing. Conversely, negative skewness points to regions where large vortices break into smaller ones. For example, in a turbulent boundary layer, negative skewness is often observed in the logarithmic region, where strong vortices—such as hairpin packets—generate smaller structures and cause asymmetric ejection events. A similar occurrence happens at the edge of the shear layer, where the flow intermittently slows down due to mixing with slower turbulent flow. This process, known as intermittency, involves the release of large vortices from the boundary layer into the free stream, where they decay into smaller eddies. Mathematically, skewness can be represented by the classic relation:
S ( u ) = u u 3 σ u 3
where, · denotes the ensemble average, while u and u represent the instantaneous and time-averaged (mean) velocities in the streamwise direction, respectively.
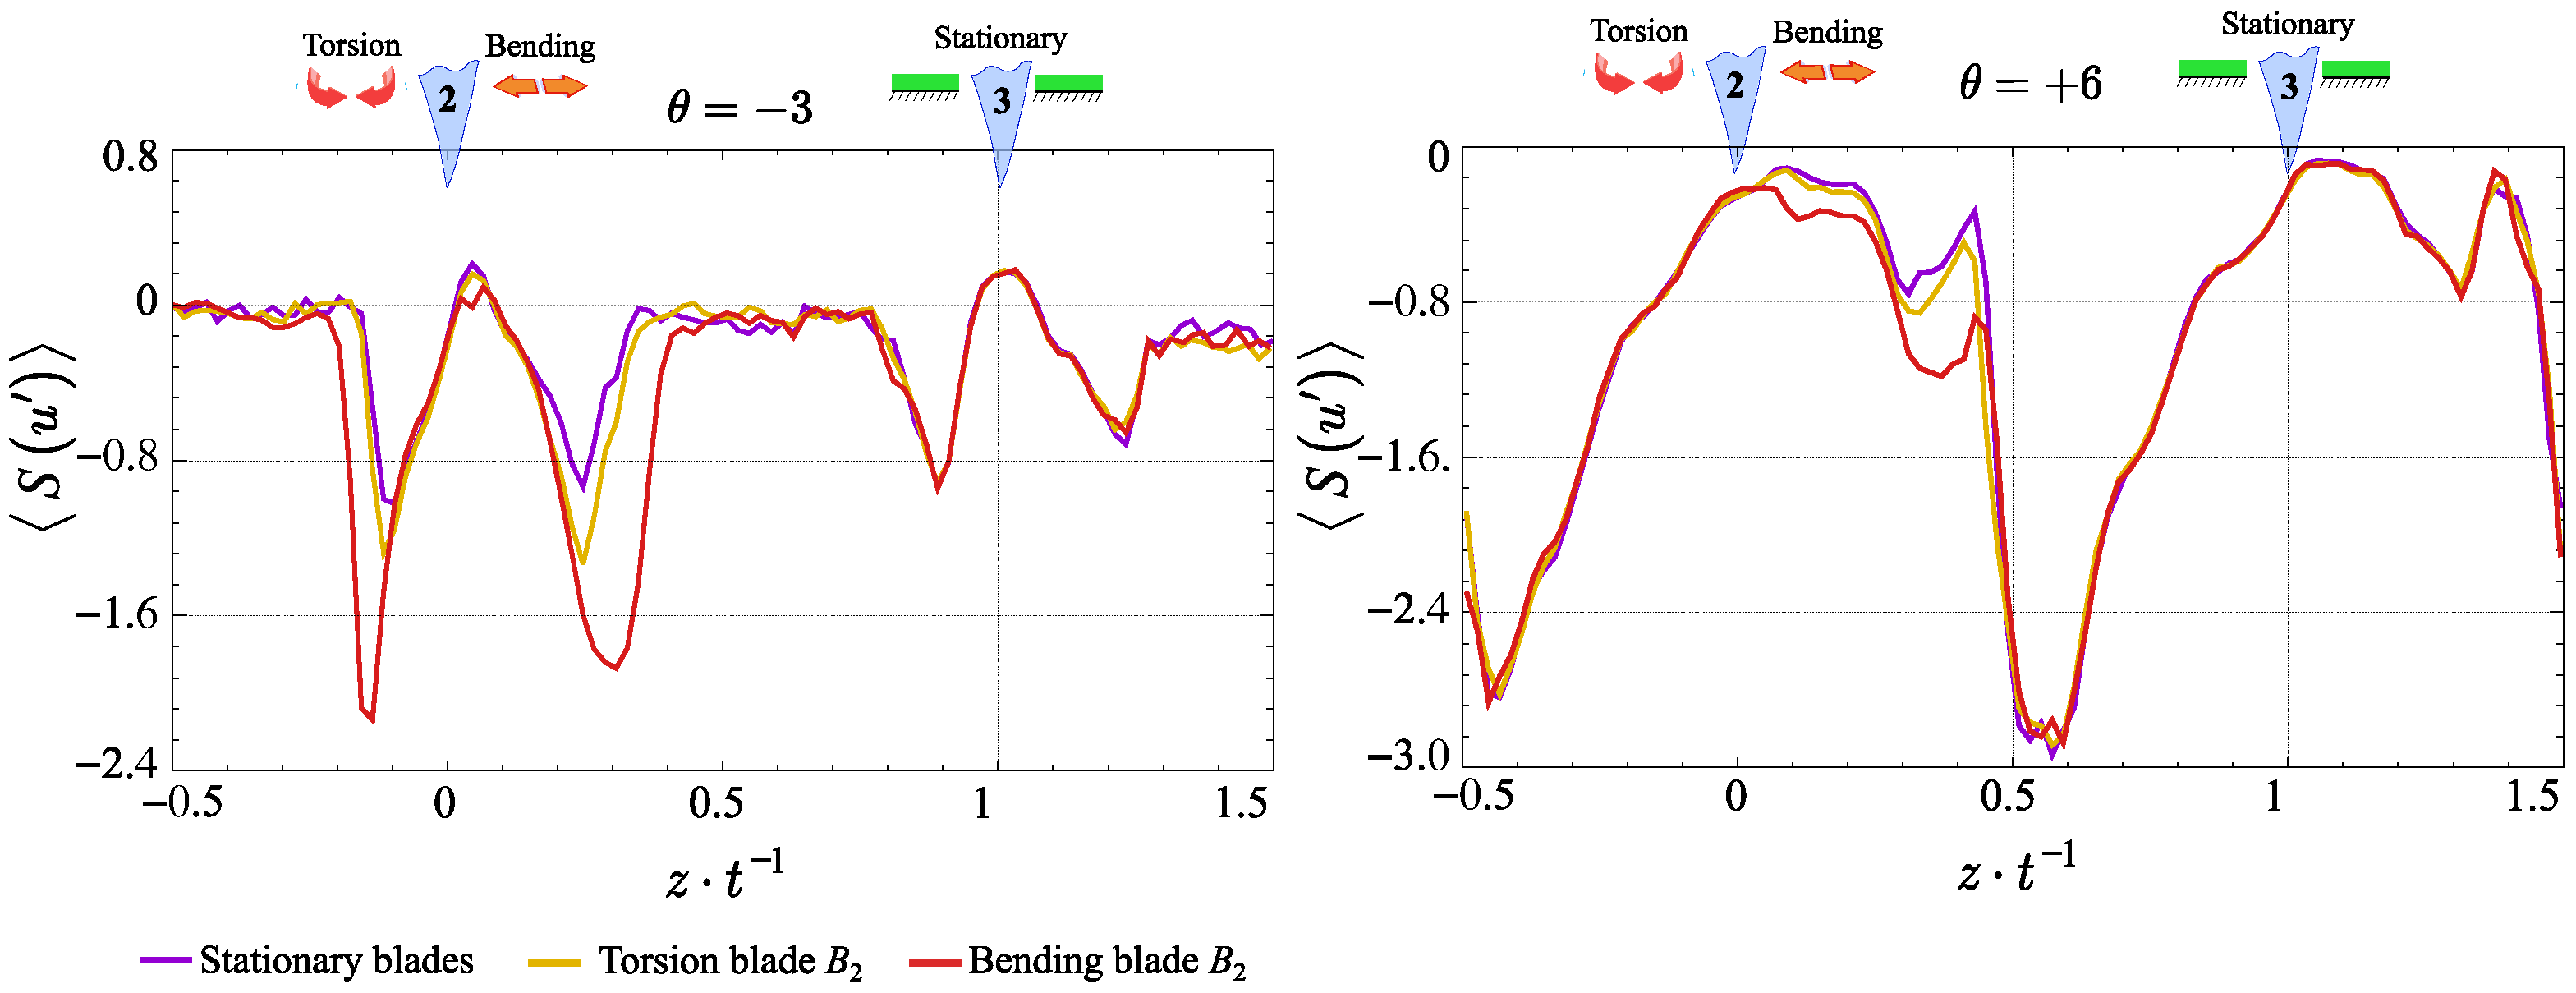
As shown in Figure 5, the skewness distribution, like the kinetic energy characteristics, is highly sensitive to variations in blade incident angle. Namely, at θ = 3 , two separate areas of asymmetry constantly appear on both sides of the blade. Their minimum value increases nearly 2.2 times under bending conditions compared to stationary and torsion modes. Another notable feature is the displacement of skewness peaks from the trailing edge, which varies with the vibration mode. This indicates that both torsion and bending vibrations contribute to increased shear layer thickness on both sides of the blade. However, the shear layer on the pressure side is slightly narrower than on the suction side. This difference is mainly due to delayed flow separation on the pressure side near the trailing edge. In contrast, flow detachment occurs earlier at the separation point on the suction side.
Meanwhile, at θ = + 6 , the skewness distribution exhibits a distinctly different pattern. Although two regions of minimum skewness remain, they differ considerably in nature. An extremely low skewness on the pressure side indicates a strong velocity gradient caused by flow acceleration due to the narrowing of the inter-blade gap. Conversely, the less prominent minimum on the suction side corresponds to the shear layer, where the effects of vibration modes become apparent. Specifically, bending vibrations lead to a 2.3-fold reduction in skewness compared to other modes.

3.2. Turbulence Structure Evaluation

Turbulence is a complex system of active interacting vortices propagating within the flow. The behavior of vortices that are sufficiently separated in space or time generally displays statistical independence [29,30]. As a result, the hot-wire signal can be treated as a stochastic process and examined using statistical analysis techniques.
In turbulent flows, energy transfer mainly occurs through large-scale vortices described by integral scales L. Meanwhile, the Taylor λ and Kolmogorov η microscales characterize energy dissipation at the smallest eddies. Although these microscales are closely related, they correspond to different physical regimes. The Taylor microscale marks the beginning of dissipative processes, whereas the Kolmogorov scale represents the smallest and most intensely dissipative structures within the flow [31,32,33].
The initial step in estimating the blade vibration effect on the turbulent structure involved determining the integral length scale, which describes the average size of the largest vortices [34]. This parameter is typically evaluated using the autocorrelation method [35,36]. However, blade vibration induces pronounced periodicity in the autocorrelation function, which prevents the accurate identification of a threshold value necessary for reliable computation [37,38,39]. Therefore, the Roach method based on energy spectrum distribution was employed to estimate the integral length scale [40].
L R = E 500 · u 4 σ u 2
where E 500 is the mean of the first 500 points in the energy spectrum E ( f ) .
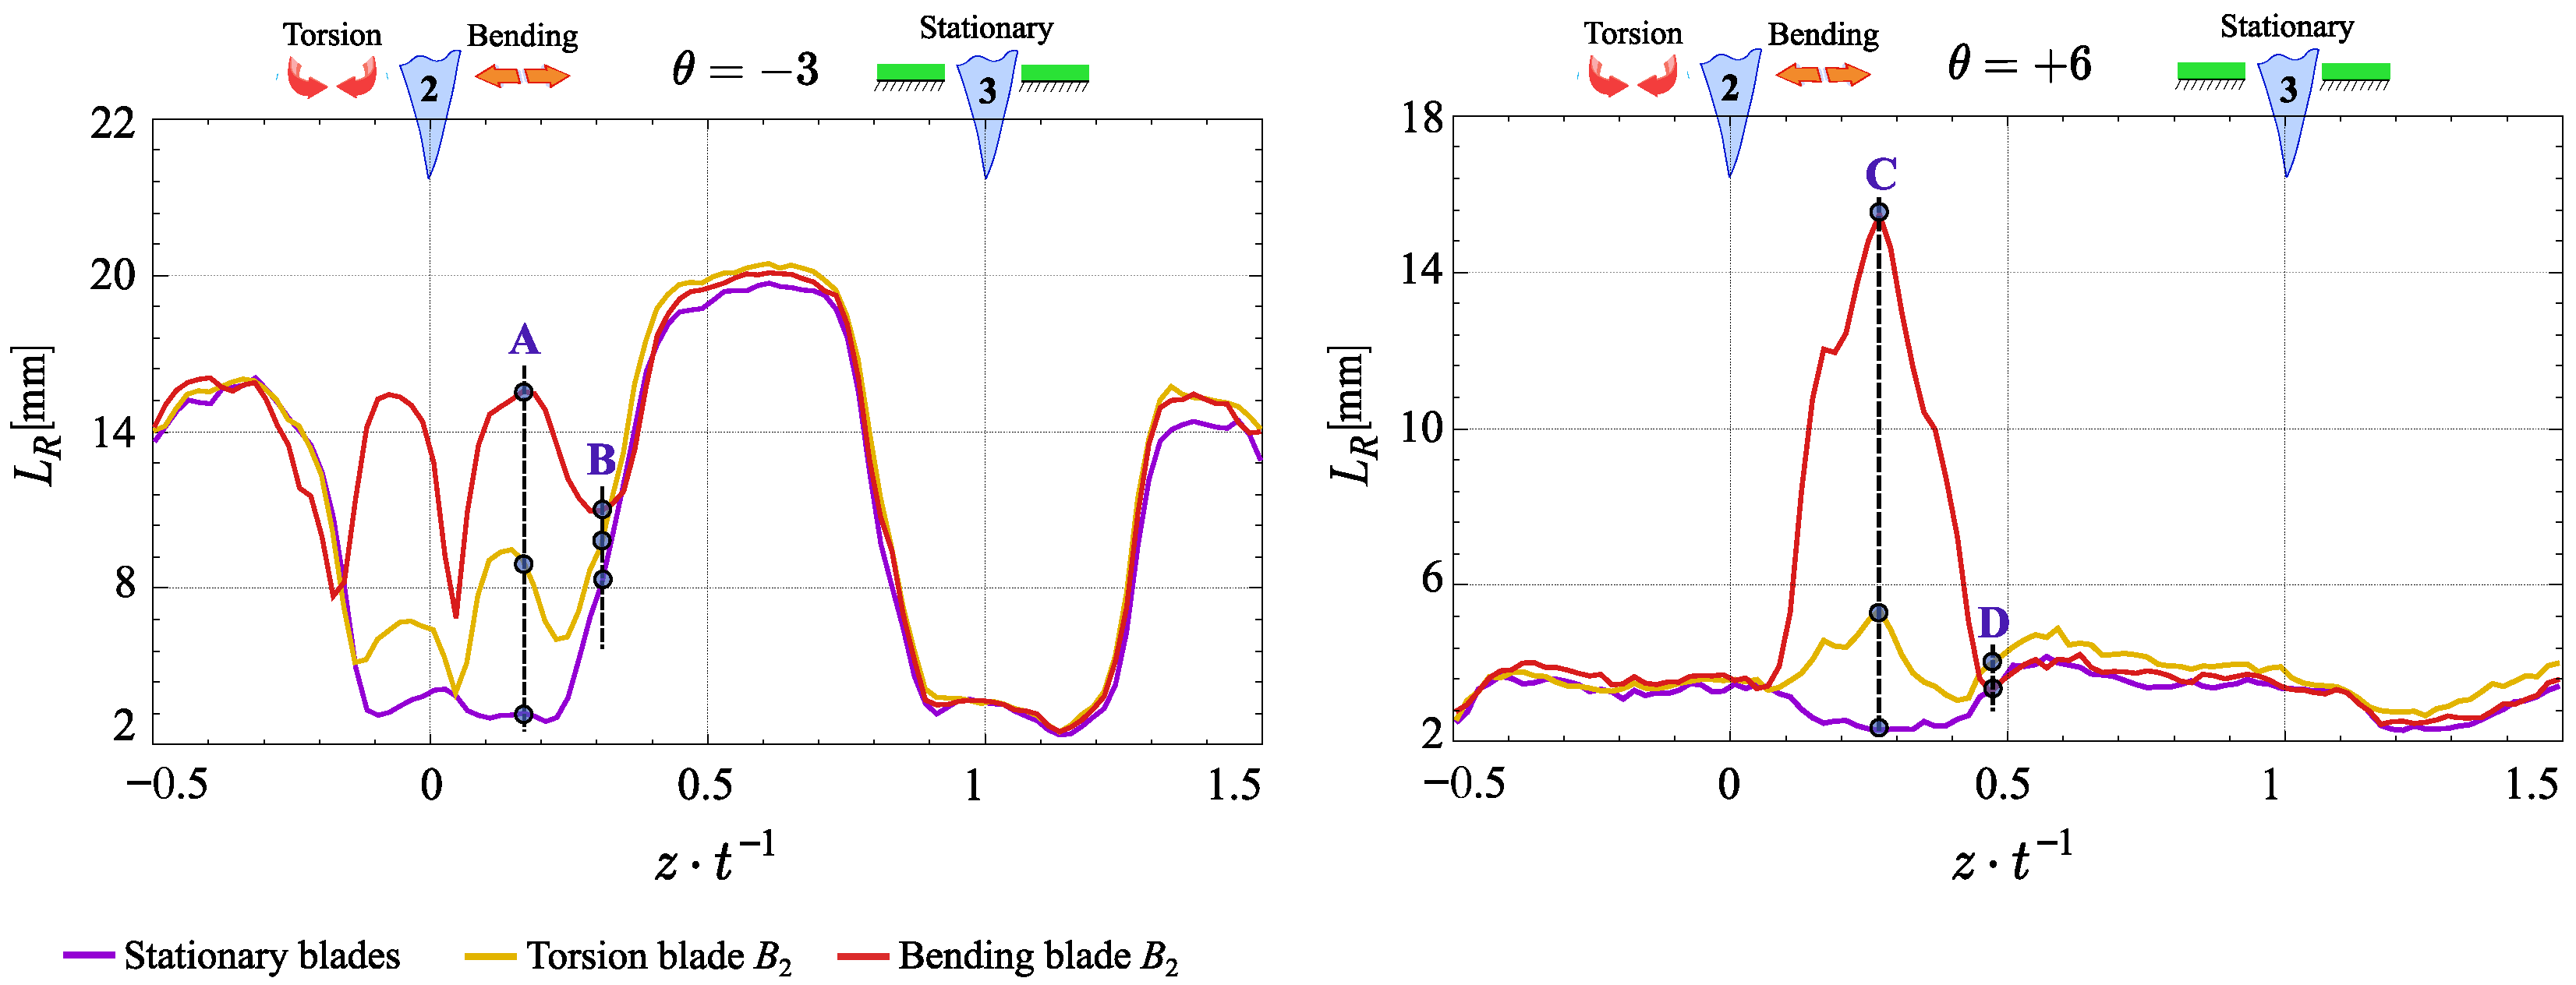
Figure 6 presents the integral length scale distributions obtained across different experimental scenarios. The results indicate a strong sensitivity of scale distributions to the incidence angle, particularly under blade vibration modes. Specifically, at θ = 3 , the distribution of integral length scale exhibits two peaks in the wake region. In contrast, at θ = + 6 , only a single peak is observed on the suction side. Notably, the largest vortices are primarily found within the shear layer regions (see Figure 5). Furthermore, the size of these vortices depends on the vibration modes. Compared to the stationary state, the maximum integral length scale increases nearly 7.5 times during the bending mode and 2.2 times during the torsion mode. This pattern highlights the dominant role of bending vibrations in forming energy-rich turbulent structures.
Further assessment of the small-scale turbulence structures requires evaluating the energy dissipation rate ϵ , which quantifies the conversion of turbulent kinetic energy into heat through viscous effects. Accurate measurement of ϵ is typically difficult to achieve in experimental settings [41]. Nevertheless, assuming the turbulence is statistically homogeneous and isotropic, the time-averaged energy dissipation rate can be estimated using the longitudinal second-order structure function [42,43,44,45].
ϵ = 15 ν D L L ( ρ ) ρ 2
where ν represents the kinematic viscosity, ρ = u · τ is the spatial scale converted from temporal increment τ according to Taylor’s “frozen turbulence” hypothesis and D L L ( ρ ) is longitudinal second-order structure function.
D L L ( ρ ) = u x + ρ u x 2
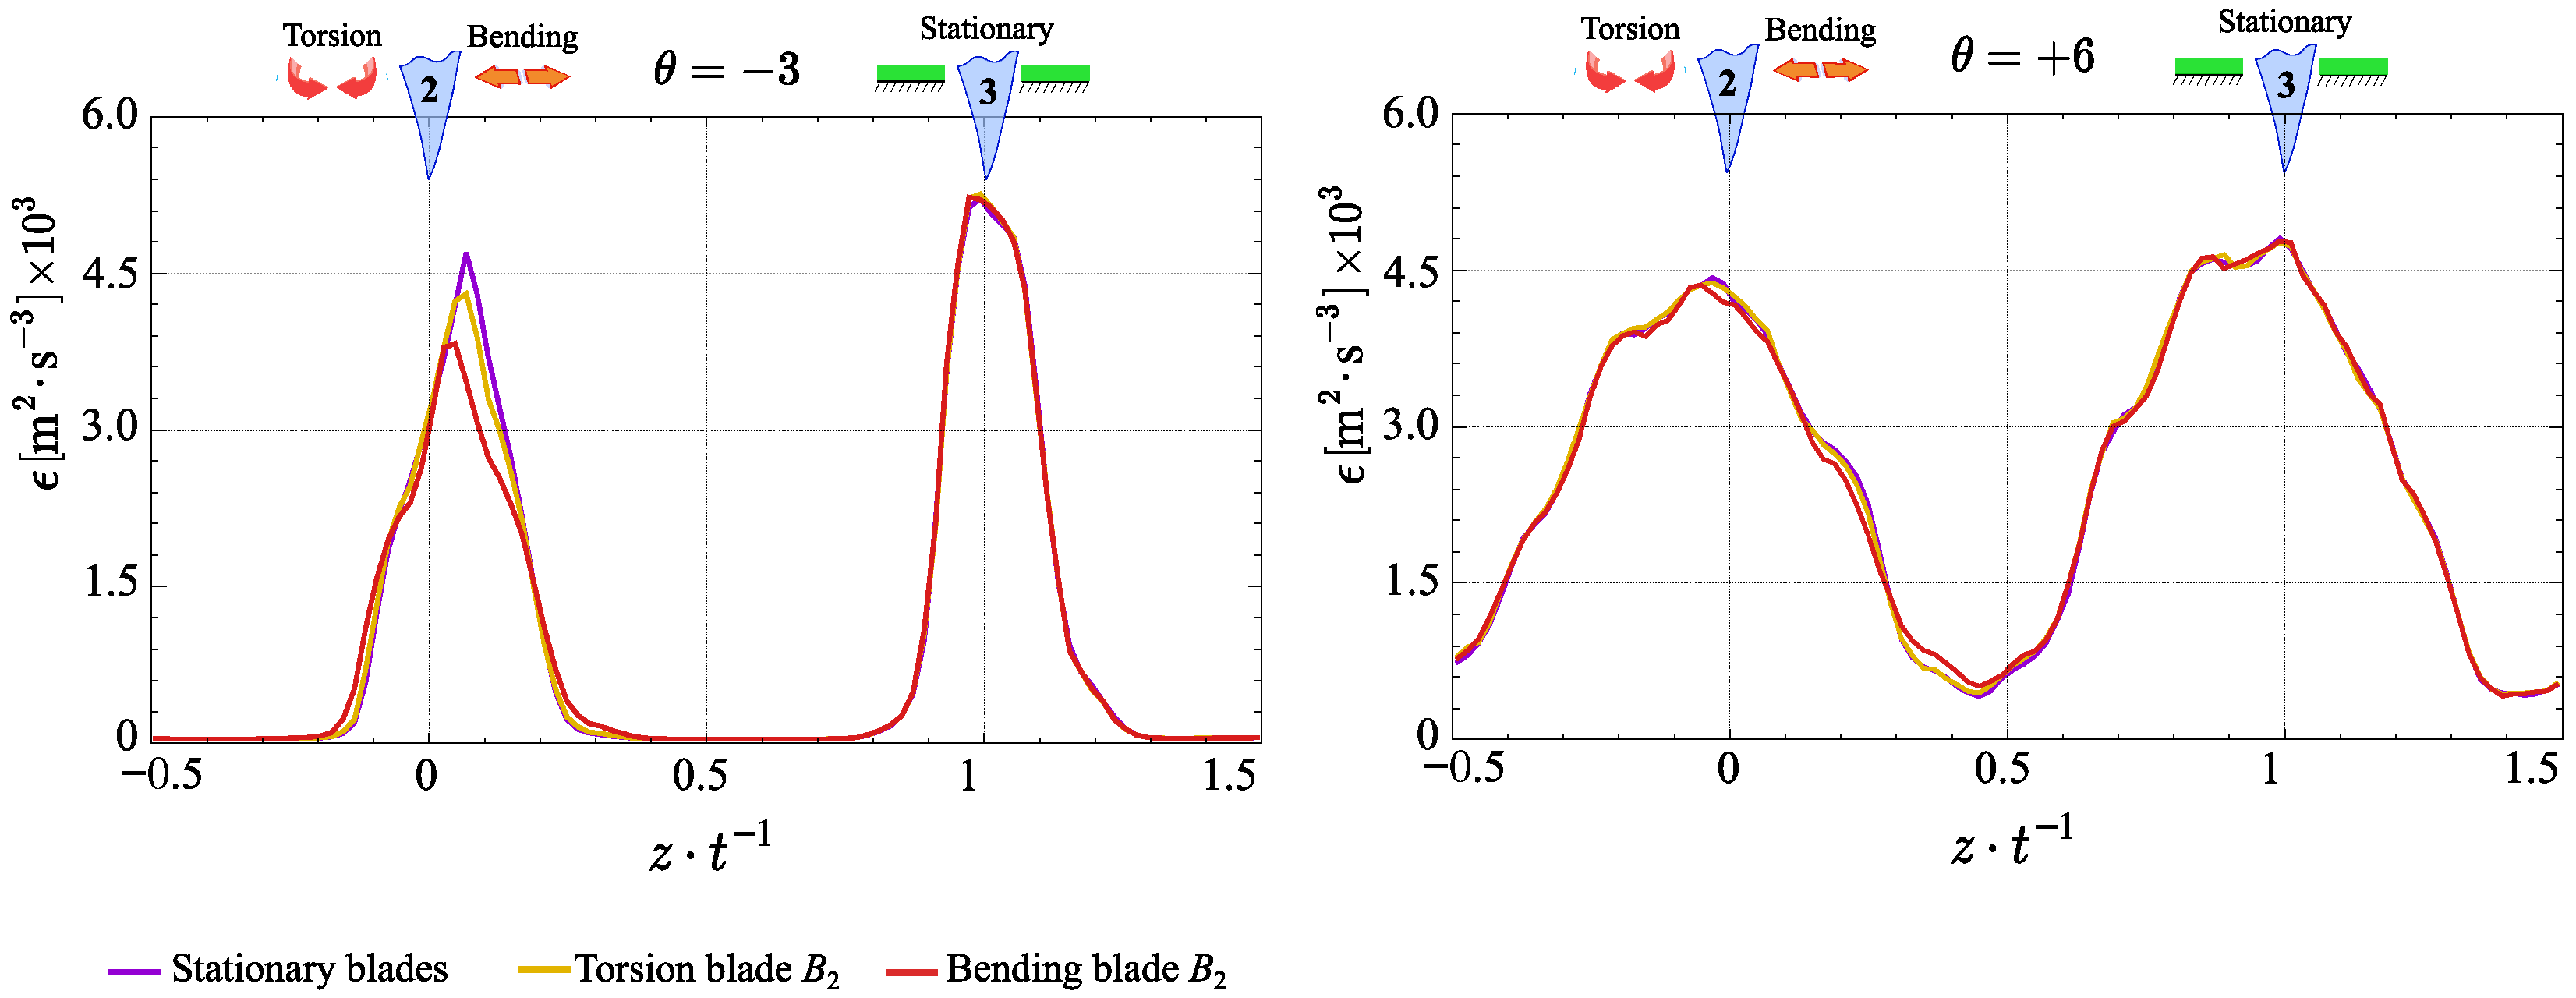
Figure 7 shows a comparative analysis of the energy dissipation rates across various experimental scenarios. According to the experimental results, blade vibrations strongly affect the energy dissipation rate at θ = 3 . Specifically, the bending mode causes a 13% decrease in the maximum dissipation rate compared to the stationary setup, where this parameter can reach up to 4500 m 2 · s 3 . Notably, this pattern shows a clear correlation with the velocity deficit reduction seen in Figure 3, emphasizing the strong impact of turbulence structure on wake formation. In contrast, at θ = + 6 , the ϵ remains consistent across all experimental modes.
If the ϵ is known, then according to classical relations (10), (11), the Taylor λ and the Kolmogorov microscale η can be determined [46]:
λ = σ u 15 ν / ϵ
and
η = ν 3 / ϵ 1 / 4
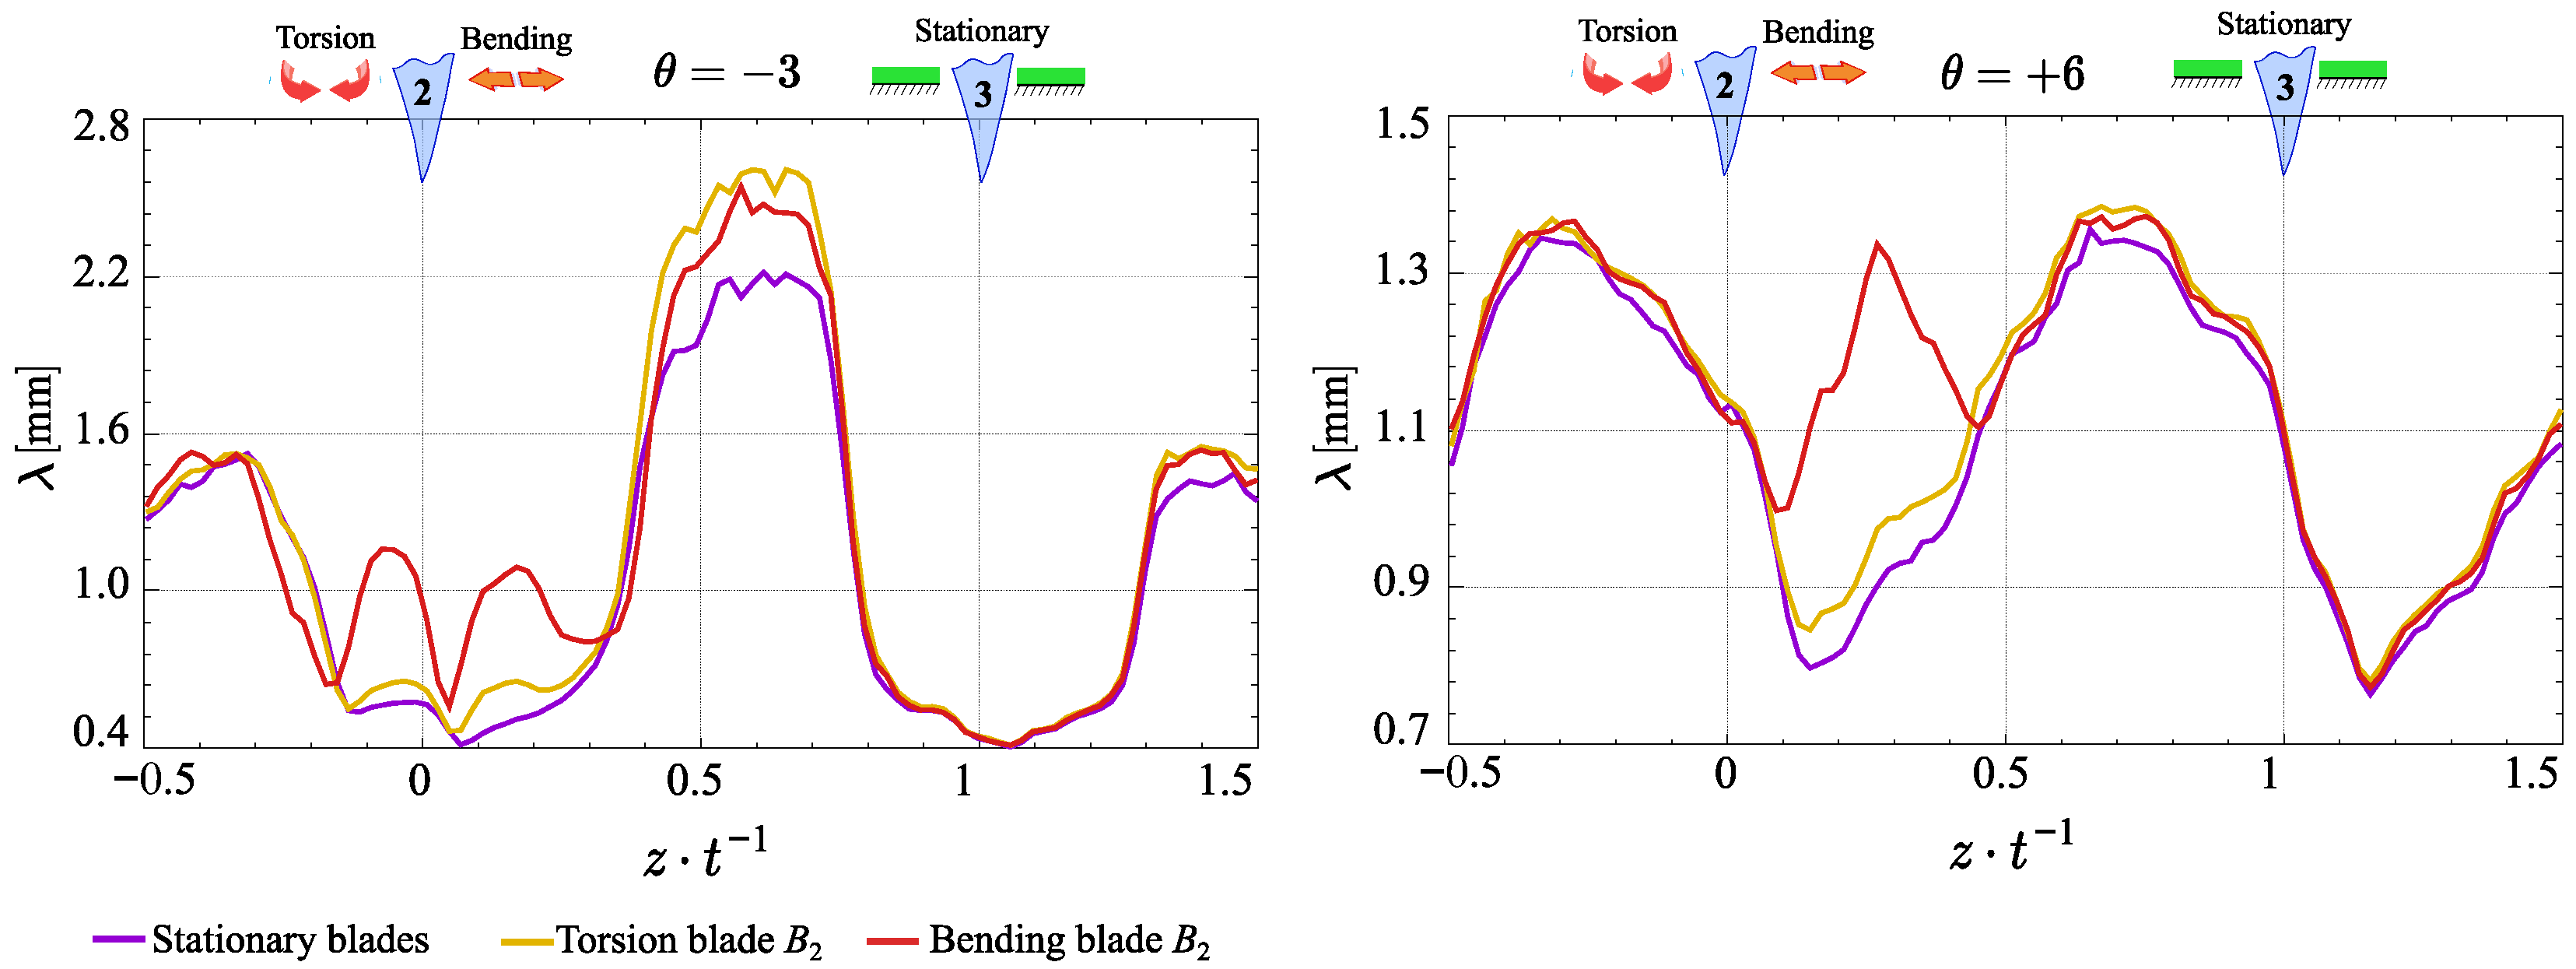
Figure 8 presents the evolution of the Taylor microscale under various experimental conditions. Notably, in the wake region at θ = 3 , the value of λ nearly tripled compared to the stationary and torsional modes. A similar pattern appears at θ = + 6 , where the Taylor microscale nearly doubles. Meanwhile, a clear double peak at negative angles and a single peak at positive angles reemerge, indicating different turbulence structures within the shear layer caused by blade vibrations.
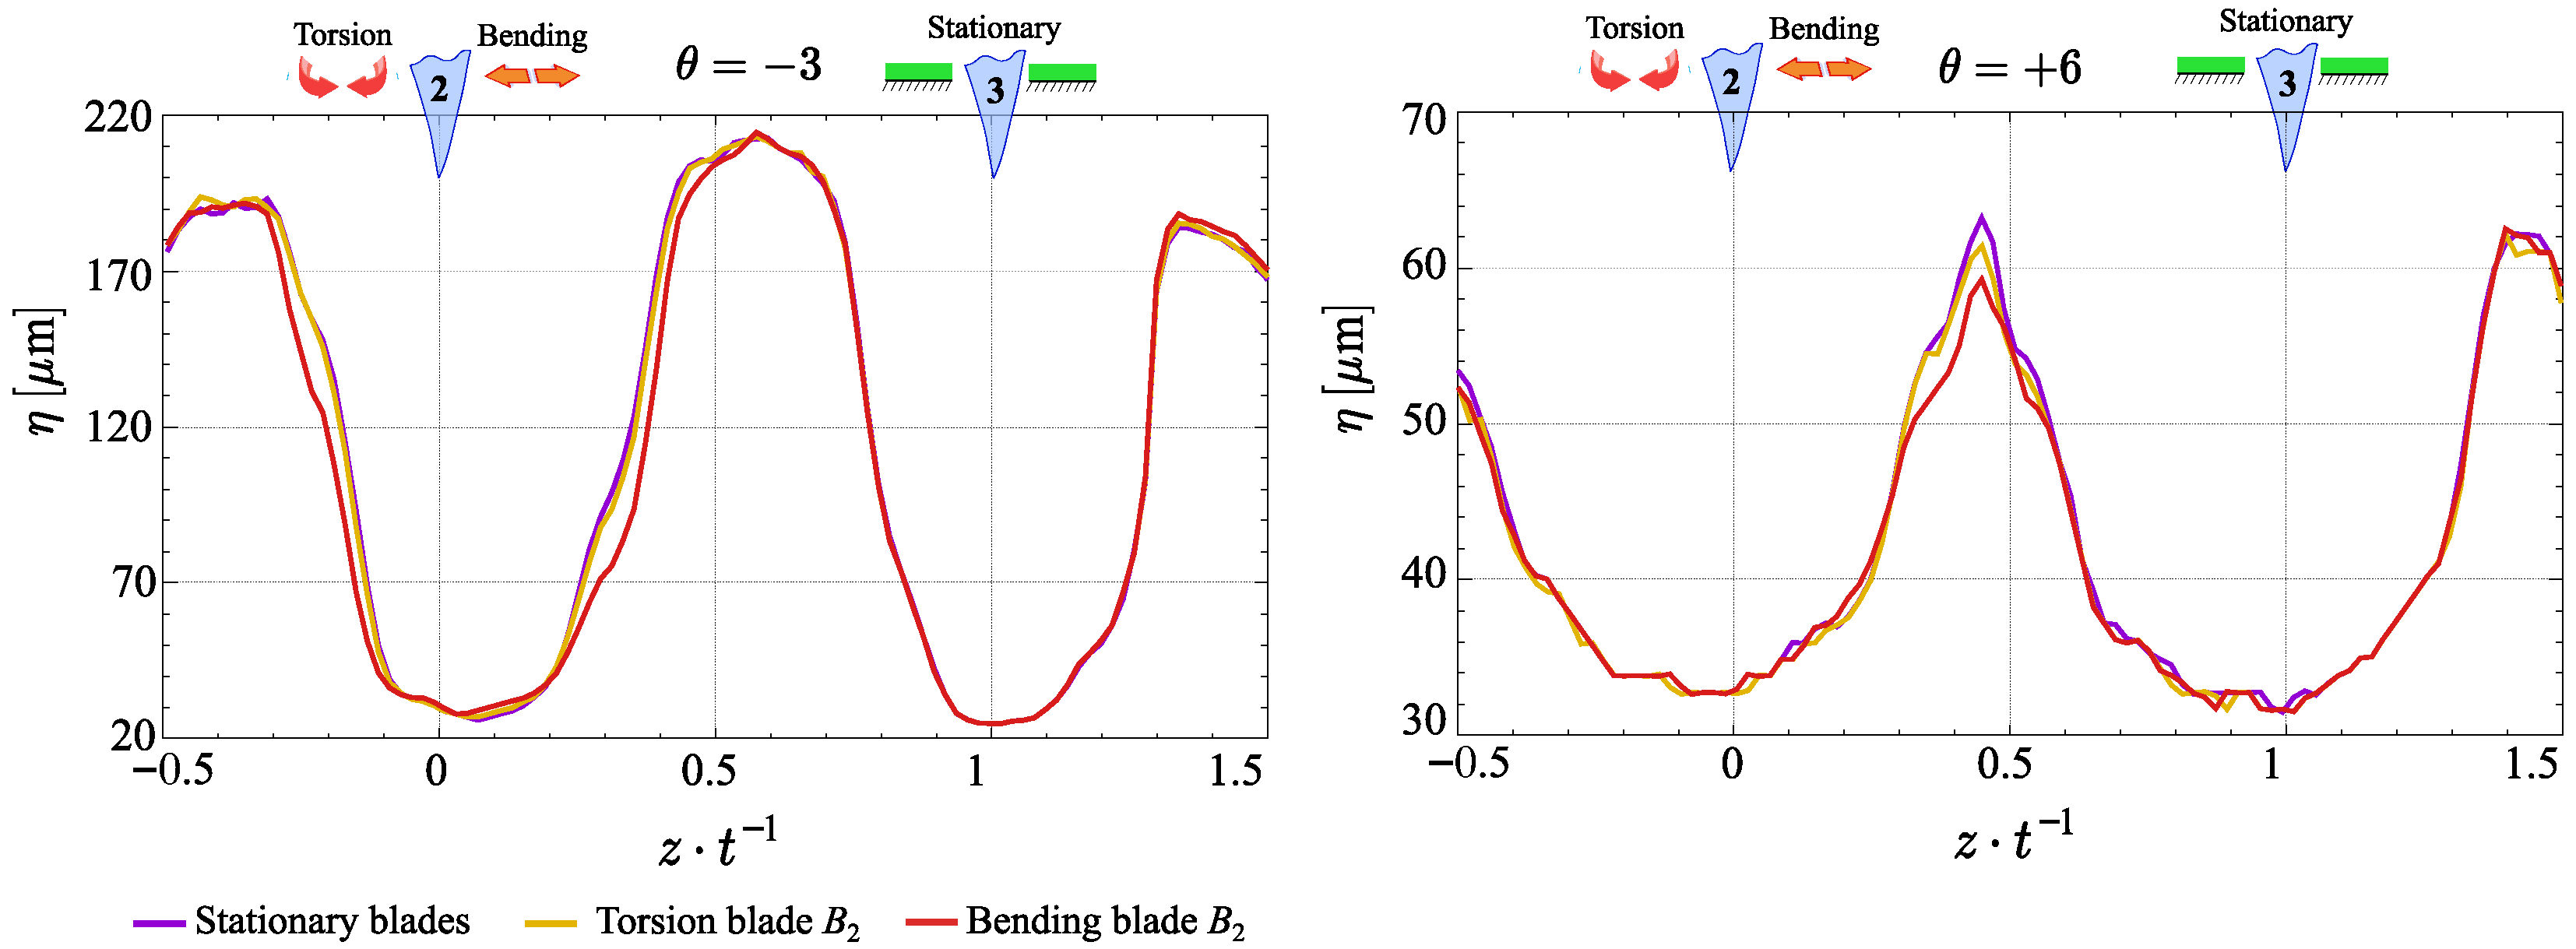
In contrast to the Taylor microscale, the Kolmogorov microscale distributions remain nearly unchanged across experimental configurations. As shown in Figure 9, the smallest eddies in the wake region maintain a consistent size of approximately η 30   μ m across both incidence angles. However, in the inter-blade region, η increases to roughly 200 μ m at θ = 3 , while at θ = + 6 , it reaches only about 65 μ m . This trend is primarily attributed to the reduction in the free-stream area within the inter-blade spacing at higher incident angles. Consequently, the interaction between the boundary layers of neighboring blades promotes the fragmentation of large-scale vortex structures into smaller-scale eddies.

3.3. Spectrum Analyses

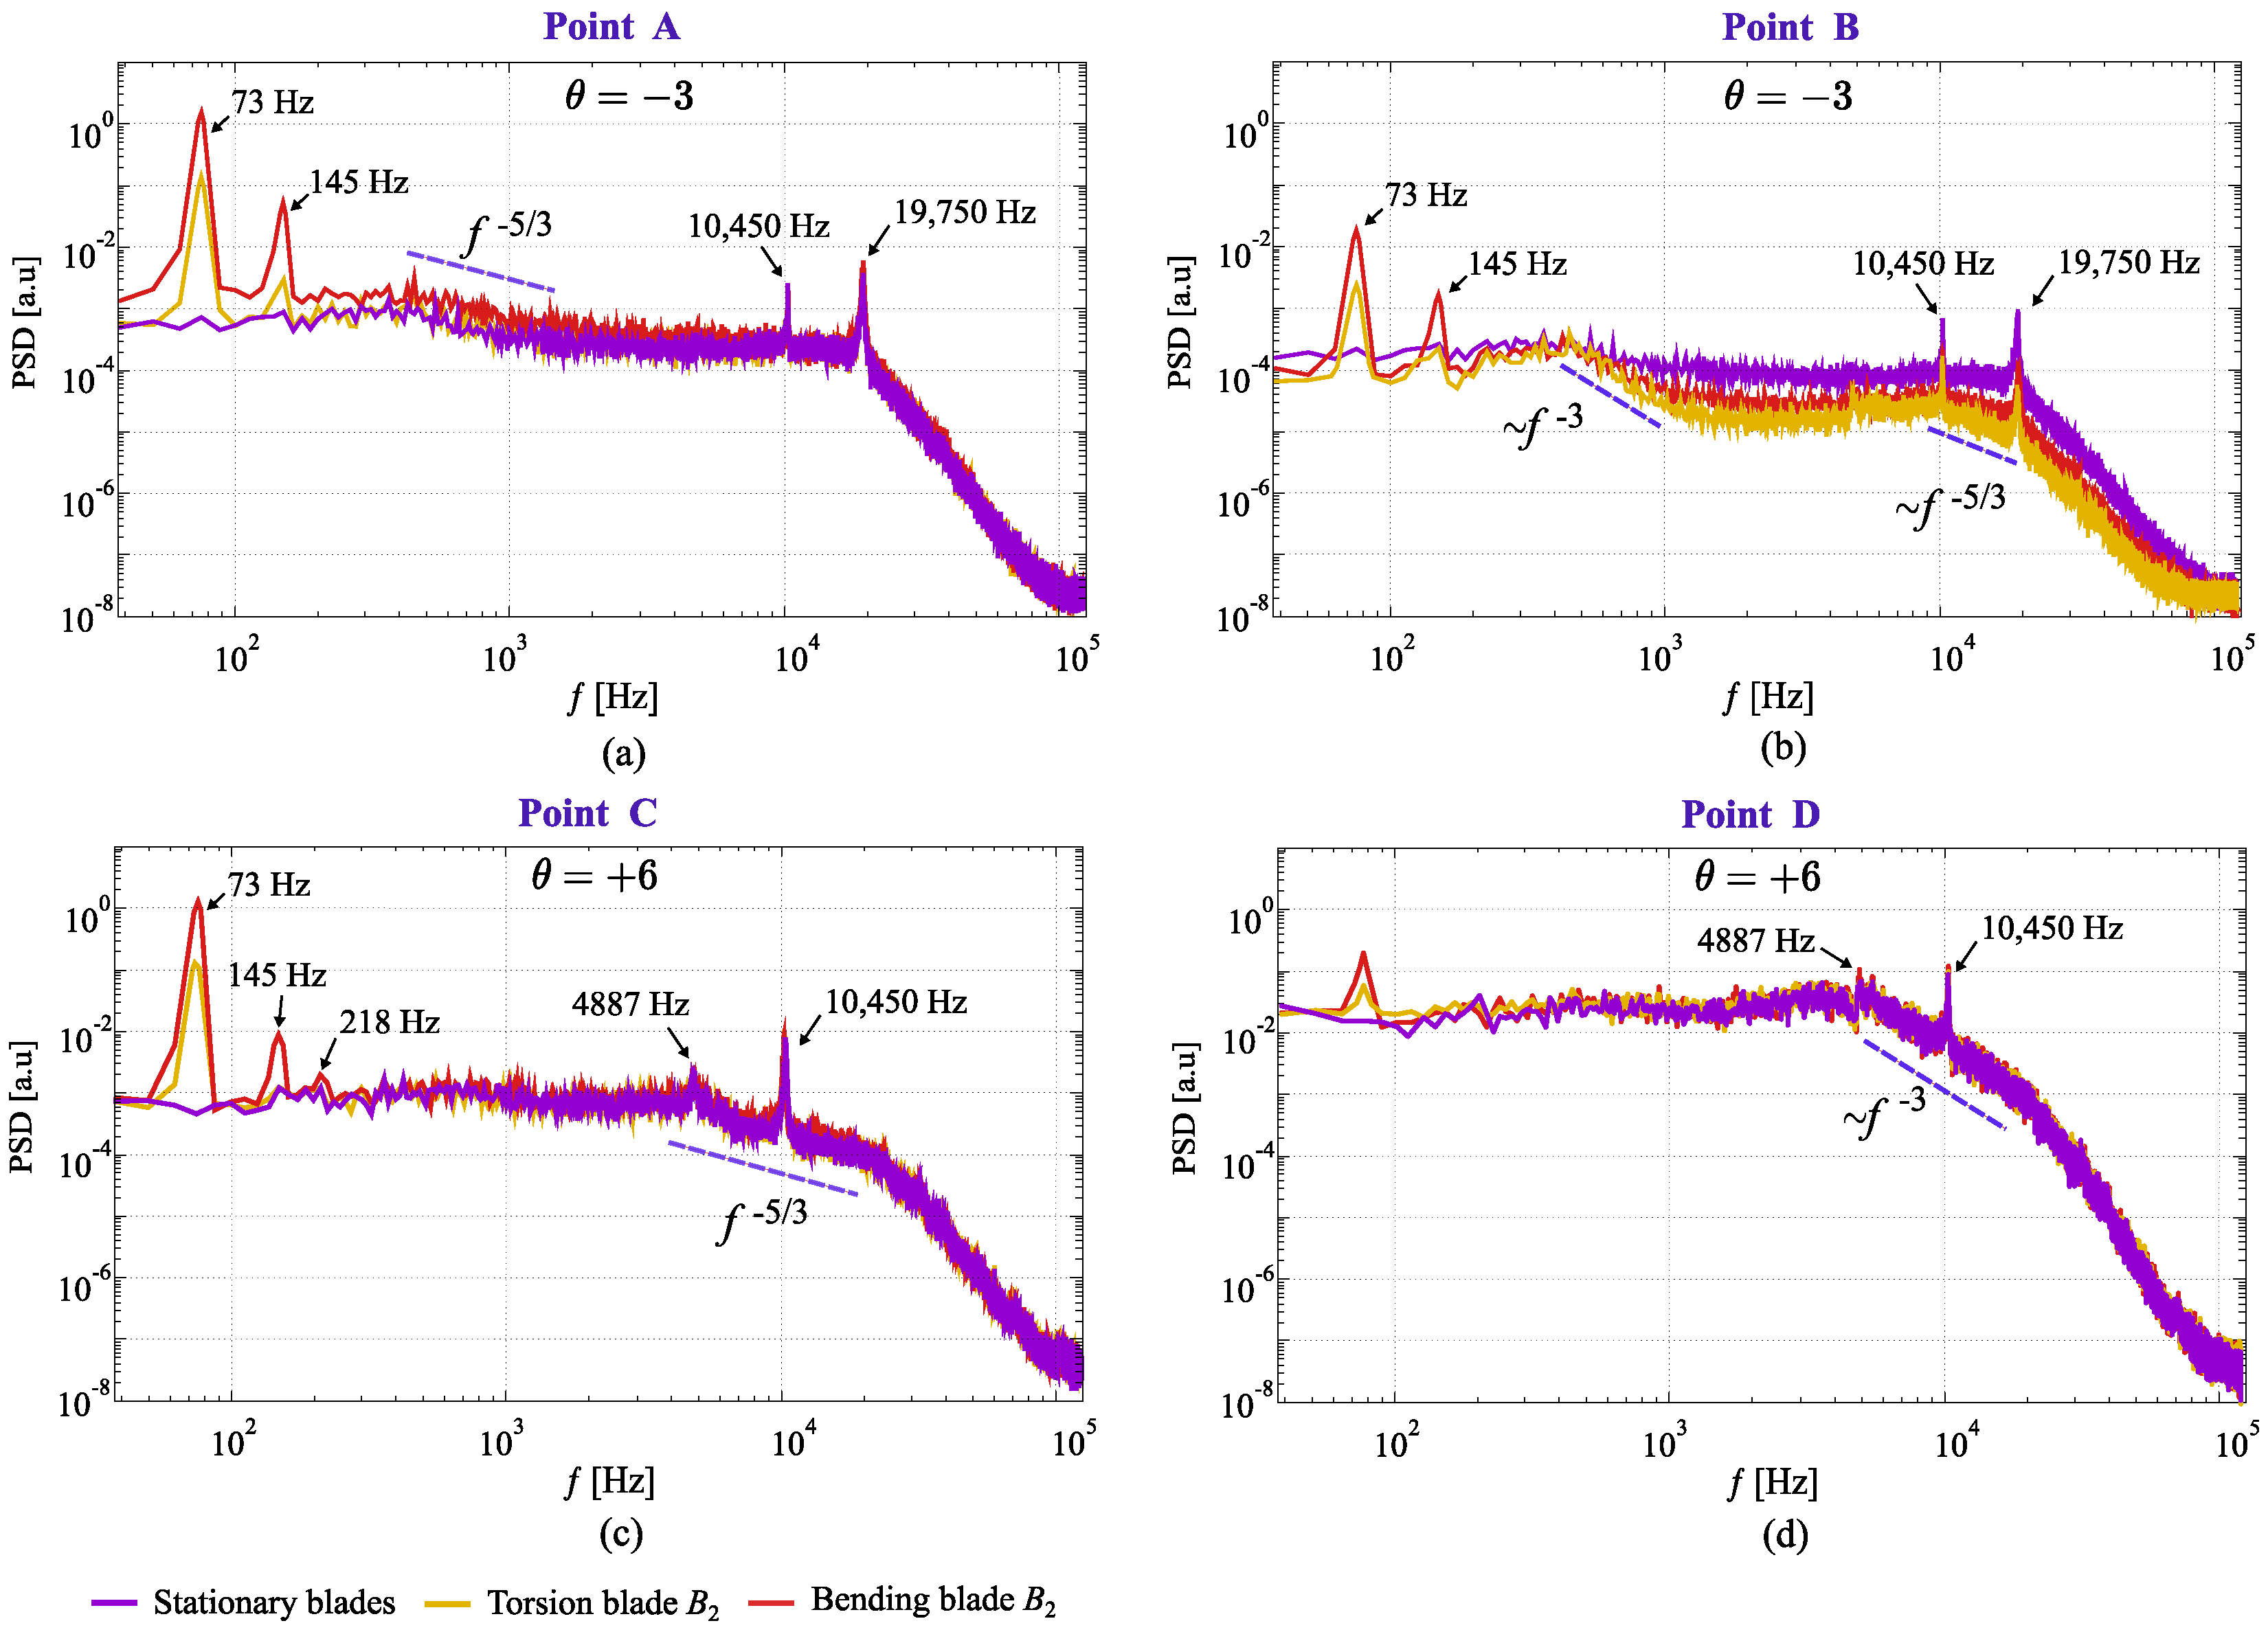
As is well known, turbulence reflects nature’s intrinsic tendency to self-organize into coherent structures across multiple scales [47,48]. To investigate the specific features of energy distribution across these structures under varying experimental conditions, the power spectral density (PSD) method was employed [35,49]. For this analysis, four measurement locations were chosen (see Figure 6). Locations A and C correspond to the largest integral length scale. In contrast, locations B and D are characterized by the lowest skewness in the wake downstream of blade 2 (see Figure 5). Additionally, locations A and B are associated with θ = 3 , while locations C and D correspond to θ = + 6 . The power spectral densities of streamwise velocity fluctuations under various experimental conditions are graphically illustrated in Figure 10. The results reveal distinct peaks in the spectral distributions. From a turbulence perspective, sharply increased signal power across different frequency ranges usually indicates the active movement of energy-containing vortices. Spectral peaks below 300 Hz are mainly related to higher-order harmonics of the blade excitation frequency (73 Hz, 145 Hz, and 218 Hz), showing the active movement of large-scale coherent structures within the wake area. Among the tested modes, bending vibrations produce the most notable power spikes. All three harmonics are present at θ = + 6 , while only two appear at θ = 3 .
Alongside the low-frequency components, the resulting spectra show high-frequency bursts around 10,450 Hz, corresponding to the Kármán vortex shedding frequency. Additionally, a secondary high-frequency peak appears at approximately 19,750 Hz. Although this value does not match exactly with the second harmonic, its proximity ( 1.89 × ) suggests the possible presence of a nonlinear or modulated harmonic component. This phenomenon may result from the asymmetric interaction of vortices shed from both sides of the blade, influenced by its curvature and tilt.
In contrast, at θ = + 6 , the secondary high-frequency peak is missing. Instead, a clear peak appears at 4887 Hz, probably caused by acoustic resonance from the smaller flow passage area due to increased blade inclination. Flow separation mostly happens at this angle on the suction side, disturbing the regular vortex shedding from both sides and reducing high-frequency spectral components.
Besides the localized spectral power peaks, the overall shape of the spectral curve offers important insights into flow characteristics. For example, according to fundamental Kolmogorov K41 theory, a spectral slope of f 5 / 3 indicates 3D, isotropic, homogeneous turbulent flow [50,51,52,53,54]. This behavior is usually seen within the inertial subrange, where kinetic energy is transferred conservatively from large energy-containing vortices to smaller eddies without significant loss due to viscosity. This pattern is observed at location C, where the spectrum displays a characteristic f 5 / 3 slope near the dissipation range. In contrast, at locations A and B, the spectral curve shows notably different behavior and strongly depends on the experimental conditions.
At location A, the spectrum initially follows a slope of f 5 / 3 , then remains nearly flat before transitioning into the dissipation range near 20 kHz. This unusual shape may be connected to the double-slope behavior observed at location B, indicating a scale-dependent change in flow dynamics and energy transfer mechanisms across various frequency ranges. Batchelor–Kraichnan theory for the 2D inverse energy and direct enstrophy transfers offers a possible explanation for this phenomenon [55,56,57,58,59]. In such systems, energy injected at intermediate scales is transferred upscale through an inverse cascade, while enstrophy cascades downscale toward the dissipative range. Consequently, the energy spectrum should exhibit distinct frequency regions, with a characteristic slope of f 5 / 3 representing the inverse energy cascade and a steeper slope of f 3 describing the enstrophy transfer toward smaller scales. However, this pattern is not present at location B. In contrast, location D reveals a well-defined enstrophy distribution [60]. This is mainly due to the increased inclination at θ = + 6 , which promotes strongly rotating vortices forming in the shear layer.
Thus, the most probable explanation for the spectral behavior at location B is a “split” energy cascade [61], which describes a turbulent regime where the injected energy is simultaneously transferred to both larger and smaller scales. Bidirectional energy transfer often happens in flows where symmetry is broken or geometric constraints exist, such as in thin fluid layers, rotating systems, or stratified media. In this context, blade vibrations can act as an additional symmetry-breaking mechanism, encouraging the development of a split energy cascade. These oscillations create unsteady disturbances in the flow, altering large vortices and promoting the formation of small eddies. Consequently, the flow may exhibit quasi-2D turbulent behavior at larger scales, supporting an inverse energy cascade, while at smaller scales, it maintains 3D turbulent features that enable a forward cascade.

4. Conclusions

The study aimed to examine how the vibration of a single blade affects the wake topology and turbulence features behind a low-pressure turbine blade cascade. Experiments were carried out at a flow velocity corresponding to a chord-based Reynolds number of R e c 2.3 × 10 5 . To investigate the flow characteristics, three operational modes—stationary, bending vibration, and torsional vibration—were tested at two incidence angles ( θ = 3 and θ = + 6 ). Flow measurements were performed using hot-wire anemometry equipped with a miniature X-wire probe (type 55P63). The dynamic excitation frequency was fixed at 73 Hz, with vibration amplitudes of 0.7 mm for the bending mode and 0 . 5 for the torsional mode.
The experimental data revealed a pronounced influence of the bending vibration mode on the wake topology at an incidence angle of θ = 3 . Specifically, the velocity deficit was reduced by approximately 5% relative to the stationary and torsional modes, indicating a significant alteration in wake dynamics. In contrast, at θ = + 6 , this effect was considerably less pronounced. Instead, a marked increase in the normalized velocity at the positive incidence angle suggests local flow acceleration caused by the geometric contraction of the inter-blade passage.
The analysis of turbulent kinetic energy confirms that blade vibrations serve as an additional source of flow disturbance, promoting the development of energy-containing turbulent structures. Namely, at θ = 3 , bending vibrations result in a twofold increase in T K E ( u ) , accompanied by a distinct double-peak distribution. This behavior reflects complex wake dynamics governed by the interaction between flow separation and blade motion. In contrast, at θ = + 6 , the influence of vibrations is more localized, primarily affecting the trailing edge region, where T K E ( u ) still increases nearly twofold compared to the negative incident angle. Further analysis of the asymmetry of flow fluctuations showed that the peaks of turbulent kinetic energy are clearly located in the shear layer.
The next stage of the analysis focused on assessing the turbulence structure under different experimental conditions. The results show a strong sensitivity of the integral length scale to the blade vibration modes. Specifically, compared to the stationary case, the integral scale increases by 7.5 times during bending vibrations and by 2.2 times during torsional vibrations, highlighting the key role of bending-induced motion in creating energy-containing turbulent structures. In contrast, the Kolmogorov scale remains nearly unchanged across all cases, with the smallest eddies in the wake maintaining a consistent size of η 30 μ m , independent of vibration mode or incidence angle. Furthermore, experimental findings reveal that at θ = 3 , bending vibrations lead to a 13% reduction in the maximum energy dissipation rate relative to the stationary mode. However, at θ = + 6 , this parameter remains effectively constant across all test conditions, with peak dissipation values reaching up to 4500 m 2 · s 3 in the wake region.
Finally, the Welch power spectral density method was applied to estimate energy flux intensity across spatial scales in turbulent flow. The spectral analysis demonstrated that at a slight blade inclination (at θ = 3 ), the flow exhibits a split energy cascade: quasi-2D turbulence with an inverse cascade at larger scales and 3D turbulence with a forward cascade at smaller scales. In contrast, at θ = + 6 , a spectral slope of f 5 / 3 , consistent with the Kolmogorov K41 theory, indicates fully developed 3D homogeneous turbulence.

Author Contributions

Conceptualization, methodology, V.U. and V.Y.; validation, V.Y., D.D. and V.T.; formal analysis, V.Y.; investigation, V.Y. and V.T.; writing—original draft preparation, writing—review and editing, V.Y. and V.U.; visualization, V.Y. and D.D.; supervision, V.U. All authors have read and agreed to the published version of the manuscript.

Funding

This research is supported by project “Investigation of 3D flow structures and their effects on aeroelastic stability of turbine-blade cascades using experiment and deep learning approach” GACR 24-12144S of the Grant Agency of the Czech Republic.

Institutional Review Board Statement

Not applicable.

Informed Consent Statement

Not applicable.

Data Availability Statement

The data presented in this study are available on request from the corresponding author. The data are not publicly available due to privacy.

Conflicts of Interest

The authors declare no conflict of interest.

References

  1. Eret, P.; Hoznedl, M. Effect of Manufacturing Processes on Blade Throat Size and Position in a Steam Turbine Diaphragm. J. Mach. Eng. 2022, 22, 148–160. [Google Scholar] [CrossRef]
  2. Tucker, P. Computation of unsteady turbomachinery flows: Part 1—Progress and challenges. Prog. Aerosp. Sci. 2011, 47, 522–545. [Google Scholar] [CrossRef]
  3. Fürst, J.; Lasota, M.; Lepicovsky, J.; Musil, J.; Pech, J.; Šidlof, P.; Šimurda, D. Effects of a Single Blade Incidence Angle Offset on Adjacent Blades in a Linear Cascade. Processes 2021, 9, 1974. [Google Scholar] [CrossRef]
  4. Rahmati, M.; He, L.; Wells, R. Interface Treatment for Harmonic Solution in Multi-Row Aeromechanic Analysis. In Proceedings of the ASME Turbo Expo 2010: Power for Land, Sea and Air, Glasgow, UK, 14–18 June 2010; Volume 6, pp. 1253–1261. [Google Scholar] [CrossRef]
  5. Erfanian Nakhchi, M.; Win Naung, S.; Rahmati, M. Direct Numerical Simulations of Turbulent Flow over Low-Pressure Turbine Blades with Aeroelastic Vibrations and Inflow Wakes. Energies 2023, 16, 2803. [Google Scholar] [CrossRef]
  6. Naung, S.W.; Rahmati, M.; Farokhi, H. Direct Numerical Simulation of Interaction between Transient Flow and Blade Structure in a Modern Low-Pressure Turbine. Int. J. Mech. Sci. 2021, 192, 106104. [Google Scholar] [CrossRef]
  7. Fan, X.; Wang, Y.; Tan, W. Aerodynamic wake oscillator for modeling flow-induced vibration of tandem cylinders with short spans. Int. J. Mech. Sci. 2021, 204, 106–548. [Google Scholar] [CrossRef]
  8. Wang, X.; Zou, Z. Uncertainty analysis of impact of geometric variations on turbine blade performance. Energy 2019, 176, 67–80. [Google Scholar] [CrossRef]
  9. Camp, T.R.; Shin, H.W. Turbulence Intensity and Length Scale Measurements in Multistage Compressors. J. Turbomach. 1995, 117, 38–46. [Google Scholar] [CrossRef]
  10. Oro, J.; Argüelles Díaz, K.; Santolaria, C.; Marigorta, E. On the structure of turbulence in a low-speed axial fan with inlet guide vanes. Exp. Therm. Fluid Sci. 2007, 32, 316–331. [Google Scholar] [CrossRef]
  11. Maunus, J.; Grace, S.; Sondak, D.; Yakhot, V. Characteristics of Turbulence in a Turbofan Stage. J. Turbomach. 2012, 135, 021024. [Google Scholar] [CrossRef]
  12. Odier, N.; Duchaine, F.; Gicquel, L.; Staffelbach, G.; Thacker, A.; Rosa, N.; Dufour, G.; Mueller, J.D. Evaluation of Integral Turbulence Scale Through the Fan Stage of a Turbofan Using Hot Wire Anemometry and Large Eddy Simulation. In Proceedings of the ASME Turbo Expo 2018: Turbomachinery Technical Conference and Exposition, Oslo, Norway, 11–15 June 2018; p. V02CT42A021. [Google Scholar] [CrossRef]
  13. Eret, P.; Tsymbalyuk, V. Experimental Subsonic Flutter of a Linear Turbine Blade Cascade with Various Mode Shapes and Chordwise Torsion Axis Locations. J. Turbomach. 2022, 145, 061002. [Google Scholar] [CrossRef]
  14. Bruun, H. Interpretation of a hot wire signal using a universal calibration law. J. Phys. E Sci. Instrum. 1971, 4, 225–231. [Google Scholar] [CrossRef]
  15. Bruun, H. Hot wire data corrections in low and in high turbulence intensity flows. J. Phys. E Sci. Instrum. 1972, 5, 812–818. [Google Scholar] [CrossRef]
  16. Jonás, P. Rotary slanted single wire CTA—A useful tool for 3D flows investigations. EPJ Web Conf. 2013, 45, 01047. [Google Scholar] [CrossRef]
  17. Nix, A.; Smith, A.; Diller, T.; Ng, W.; Thole, K. High Intensity, Large Length-Scale Freestream Turbulence Generation in a Transonic Turbine Cascade. In Proceedings of the ASME Turbo Expo 2002: Power for Land, Sea, and Air, Amsterdam, The Netherlands, 3–6 June 2002; pp. 961–968. [Google Scholar] [CrossRef]
  18. King, L.V.; Barnes, H.T. On the convection of heat from small cylinders in a stream of fluid: Determination of the convection constants of small platinum wires, with applications to hot-wire anemometry. Proc. R. Soc. London. Ser. A Contain. Pap. Math. Phys. Character 1914, 90, 563–570. [Google Scholar] [CrossRef]
  19. Andrews, G.E.; Bradley, D.; Hundy, G. Hot wire anemometer calibration for measurements of small gas velocities. Int. J. Heat Mass Transf. 1972, 15, 1765–1786. [Google Scholar] [CrossRef]
  20. Bruun, H.H. Hot-Wire Anemometry: Principles and Signal Analysis; Oxford University Press: Oxford, UK, 1995; p. 507. [Google Scholar]
  21. Standard PTC 19.1-2018 (R2018); Test Uncertainty. American Society of Mechanical Engineers: New York, NY, USA, 2018.
  22. Finn, E. How to Measure Turbulence with Hot-Wire Anemometers—A Practical Guide; Dantec Dynamics A/S: Nozay France, 2002; p. 54. [Google Scholar]
  23. Duda, D.; Yanovych, V.; Tsymbalyuk, V.; Uruba, V. Effect of Manufacturing Inaccuracies on the Wake Past Asymmetric Airfoil by PIV. Energies 2022, 15, 1227. [Google Scholar] [CrossRef]
  24. Yanovych, V.; Duda, D.; Uruba, V.; Kosiak, P. The structure of turbulent flow behind the NACA 0012 airfoil at high angles of attack and low Reynolds number. MATEC Web Conf. 2021, 345, 00034. [Google Scholar] [CrossRef]
  25. Nakhchi, M.; Naung, S.; Rahmati, M. Influence of blade vibrations on aerodynamic performance of axial compressor in gas turbine: Direct numerical simulation. Energy 2022, 242, 122988. [Google Scholar] [CrossRef]
  26. Dróżdż, A.; Niegodajew, P.; Romańczyk, M.; Elsner, W. Convection velocity in turbulent boundary layers under adverse pressure gradient. Exp. Therm. Fluid Sci. 2023, 145, 110900. [Google Scholar] [CrossRef]
  27. Berni, C.; Suarez, L.; Michallet, H.; Barthélemy, E. Asymmetry and Skewness in the bottom boundary layer: Small scale experiments and numerical model. Coast. Eng. Proc. 2012, 1, waves.25. [Google Scholar] [CrossRef]
  28. Jelly, T.; Nardini, M.; Sandberg, R.; Vitt, P.; Sluyter, G. Effects of Localized Non-Gaussian Roughness on High-Pressure Turbine Aerothermal Performance: Convective Heat Transfer, Skin Friction, and the Reynolds’ Analogy. J. Turbomach. 2024, 147, 051017. [Google Scholar] [CrossRef]
  29. Davies, P. Structure of turbulence. J. Sound Vib. 1973, 28, 513–526. [Google Scholar] [CrossRef]
  30. Tropea, C.; Yarin, A.; Foss, J. Springer Handbook of Experimental Fluid Mechanics; Springer: Berlin/Heidelberg, Germany, 2007. [Google Scholar] [CrossRef]
  31. Pouransari, Z.; Vervisch, L.; Johansson, A. Reynolds Number Effects on Statistics and Structure of an Isothermal Reacting Turbulent Wall-Jet. Flow Turbul. Combust. 2014, 92, 931–945. [Google Scholar] [CrossRef]
  32. Tennekes, H.; Lumley, J. A First Course in Turbulence, 1st ed.; The MIT Press: Cambridge, MA, USA, 1972; p. 300. [Google Scholar]
  33. Corrsin, S. The Structure of Turbulent Shear Flow (A. A. Townsend). SIAM Rev. 1979, 21, 581–583. [Google Scholar] [CrossRef]
  34. Bourgoin, M.; Baudet, C.; Kharche, S.; Mordant, N.; Vandenberghe, T.; Sumbekova, S.; Stelzenmuller, N.; Aliseda, A.; Gibert, M.; Roche, P.E.; et al. Investigation of the small-scale statistics of turbulence in the Modane S1MA wind tunnel. CEAS Aeronaut. J. 2018, 9, 269–281. [Google Scholar] [CrossRef]
  35. Yanovych, V.; Duda, D.; Uruba, V. Structure turbulent flow behind a square cylinder with an angle of incidence. Eur. J. Mech. B/Fluids 2021, 85, 110–123. [Google Scholar] [CrossRef]
  36. Batchelor, G.K. The Theory of Homogeneous Turbulence; Cambridge University Press: New York, NY, USA, 1982; p. 197. [Google Scholar]
  37. Katul, G.G.; Parlange, M.B. Analysis of Land Surface Heat Fluxes Using the Orthonormal Wavelet Approach. Water Resour. Res. 1995, 31, 2743–2749. [Google Scholar] [CrossRef]
  38. Hinze, J. Turbulence: McGraw-Hill Series in Mechanical Engineering; Cambridge University Press: Newcastle, DE, USA, 1975; p. 790. [Google Scholar]
  39. Tritton, D. Physical Fluid Dynamics, 2nd ed.; Clarendon Press: Oxford, UK, 1988; p. 346. [Google Scholar]
  40. Roach, P. The generation of nearly isotropic turbulence by means of grids. Int. J. Heat Fluid Flow 1987, 8, 82–92. [Google Scholar] [CrossRef]
  41. Pearson, B.; Krogstad, P.Å.; Van De Water, W. Measurements of the turbulent energy dissipation rate. Phys. Fluids 2002, 14, 1288–1290. [Google Scholar] [CrossRef]
  42. Siebert, H.; Lehmann, K.; Wendisch, M. Observations of small-scale turbulence and energy dissipation rates in the cloudy boundary layer. J. Atmos. Sci. 2006, 63, 1451–1466. [Google Scholar] [CrossRef]
  43. Muschinski, A.; Frehlich, R.; Balsley, B. Small-scale and large-scale intermittency in the nocturnal boundary layer and the residual layer. J. Fluid Mech. 2004, 515, 319–351. [Google Scholar] [CrossRef]
  44. Sreenivasan, K. An update on the energy dissipation rate in isotropic turbulence. Phys. Fluids 1998, 10, 528–529. [Google Scholar] [CrossRef]
  45. Kolmogorov, A. Dissipation of Energy in Locally Isotropic Turbulence. Proc. R. Soc. London Ser. A Math. Phys. Sci. 1991, 1890, 15–17. [Google Scholar] [CrossRef]
  46. Yanovych, V.; Duda, D.; Uruba, V.; Tomášková, T. Hot-Wire Investigation of Turbulence Topology behind Blades at Different Shape Qualities. Processes 2022, 10, 522. [Google Scholar] [CrossRef]
  47. Pope, S. Turbulent Flows; Cambridge University Press: Cambridge, UK, 2000. [Google Scholar] [CrossRef]
  48. Davidson, P. Turbulence: An Introduction for Scientists and Engineers; Oxford University Press: Oxford, UK, 2015. [Google Scholar]
  49. Yanovych, V.; Duda, D.; Uruba, V.; Antoš, P. Anisotropy of turbulent flow behind an asymmetric airfoil. SN Appl. Sci. 2021, 3, 885. [Google Scholar] [CrossRef]
  50. Kolmogorov, A.N.; Levin, V.; Hunt, J.C.R.; Phillips, O.M.; Williams, D. The local structure of turbulence in incompressible viscous fluid for very large Reynolds numbers. Proc. R. Soc. London Ser. A Math. Phys. Sci. 1991, 434, 9–13. [Google Scholar] [CrossRef]
  51. Sreenivasan, K. On the universality of the Kolmogorov constant. Phys. Fluids 1995, 7, 2778–2784. [Google Scholar] [CrossRef]
  52. Dallas, V.; Fauve, S.; Alexakis, A. Statistical Equilibria of Large Scales in Dissipative Hydrodynamic Turbulence. Phys. Rev. Lett. 2015, 115, 204501. [Google Scholar] [CrossRef]
  53. Cameron, A.; Alexakis, A.; Brachet, M.E. The effect of helicity on the correlation time of large scale turbulent flows. Phys. Rev. Fluids 2017, 2, 114602. [Google Scholar] [CrossRef]
  54. Cichowlas, C.; Bonaïti, P.; Debbasch, F.; Brachet, M.E. Effective Dissipation and Turbulence in Spectrally Truncated Euler Flows. Phys. Rev. Lett. 2006, 95, 264502. [Google Scholar] [CrossRef]
  55. Alexakis, A. Quasi-two-dimensional turbulence. Rev. Mod. Plasma Phys. 2023, 7, 31. [Google Scholar] [CrossRef]
  56. Kraichnan, R.H.; Montgomery, D. Two-dimensional turbulence. Rep. Prog. Phys. 1980, 43, 547. [Google Scholar] [CrossRef]
  57. Kraichnan, R.H. Inertial Ranges in Two-Dimensional Turbulence. Phys. Fluids 1967, 10, 1417–1423. [Google Scholar] [CrossRef]
  58. Leith, C.E. Diffusion Approximation for Two-Dimensional Turbulence. Phys. Fluids 1968, 11, 671–672. [Google Scholar] [CrossRef]
  59. Batchelor, G.K. Computation of the Energy Spectrum in Homogeneous Two-Dimensional Turbulence. Phys. Fluids 1969, 12, 233–239. [Google Scholar] [CrossRef]
  60. Khatri, H.; Griffies, S.; Uchida, T.; Wang, H.; Menemenlis, D. Role of Mixed-Layer Instabilities in the Seasonal Evolution of Eddy Kinetic Energy Spectra in a Global Submesoscale Permitting Simulation. Geophys. Res. Lett. 2021, 48, e2021GL094777. [Google Scholar] [CrossRef]
  61. Alexakis, A.; Biferale, L. Cascades and Transitions in Turbulent Flows. Phys. Rep. 2018, 767–769, 1–101. [Google Scholar] [CrossRef]
Figure 1. Configuration of the test section and the geometry of the linear cascade, with blades numbered 1–4.
Applsci 15 09263 g001
Figure 2. Hot-wire calibration curves relate to the streamwise w 1 and w 2 velocity components. Experimental measurements are shown as green markers, while the blue line depicts the corresponding fitted calibration function.
Applsci 15 09263 g002
Figure 3. Distribution of normalized streamwise velocity across experimental scenarios downstream of blades 2 and 3.
Applsci 15 09263 g003
Figure 4. Normalized streamwise turbulent kinetic energy across experimental scenarios.
Applsci 15 09263 g004
Figure 5. Skewness profiles of the streamwise velocity under various experimental scenarios.
Applsci 15 09263 g005
Figure 6. Integral length scales distribution across experimental scenarios. The black dotted lines A, B, C, and D indicate the locations of the measurement points selected for spectral analysis.
Applsci 15 09263 g006
Figure 7. Dissipation rate distribution across experimental scenarios.
Applsci 15 09263 g007
Figure 8. Taylor microscale distributions across various experimental scenarios.
Applsci 15 09263 g008
Figure 9. Kolmogorov microscale distributions across various experimental scenarios.
Applsci 15 09263 g009
Figure 10. Power spectral distribution of streamwise velocity fluctuations across experimental scenarios. Subfigures (ad) correspond to measurement points A, B, C and D.
Applsci 15 09263 g010
Disclaimer/Publisher’s Note: The statements, opinions and data contained in all publications are solely those of the individual author(s) and contributor(s) and not of MDPI and/or the editor(s). MDPI and/or the editor(s) disclaim responsibility for any injury to people or property resulting from any ideas, methods, instructions or products referred to in the content.