Article

Multimodal Emotion Recognition for Seafarers: A Framework Integrating Improved D-S Theory and Calibration: A Case Study of a Real Navigation Experiment

1
State Key Laboratory of Maritime Technology and Safety, School of Transportation and Logistics Engineering, Wuhan University of Technology, Wuhan 430063, China
2
School of Transportation and Logistics Engineering, Wuhan University of Technology, Wuhan 430063, China
*
Author to whom correspondence should be addressed.
Appl. Sci. 2025, 15(17), 9253; https://doi.org/10.3390/app15179253
Submission received: 9 July 2025 / Revised: 19 August 2025 / Accepted: 20 August 2025 / Published: 22 August 2025
(This article belongs to the Section Marine Science and Engineering)

Abstract

The influence of seafarers’ emotions on work performance can lead to severe marine accidents. However, research on emotion recognition (ER) of seafarers remains insufficient, and existing studies only deploy single models and disregard the model’s uncertainty, which might lead to unreliable recognition. In this paper, a novel fusion framework for seafarer ER is proposed. Firstly, feature-level fusion using Electroencephalogram (EEG) and navigation data collected in a real navigation environment was conducted. Then, calibration is employed to mitigate the uncertainty of the outcomes. Secondly, a weight combination strategy for decision fusion was designed. Finally, we conduct a series of evaluations of the proposed model. The results showed that the average recognition performance across the three emotional dimensions, as measured by accuracy, precision, recall, and F1 score, reaches 85.14%, 84.43%, 86.27%, and 85.33%, respectively. The results demonstrate that the use of physiological and navigation data can effectively identify seafarers’ emotional states. Additionally, the fusion model compensates for the uncertainty of single models and enhances the performance of ER for seafarers, which provides a feasible path for the ER of seafarers. The findings of this study can be used to promptly identify the emotional state of seafarers and develop early warnings for bridge systems for shipping companies and help inform policy-making on human factors to enhance maritime safety.

1. Introduction

Human error has consistently constituted one of the principal causes of maritime accidents [1,2]. Over 80% of maritime accidents are directly related to human error [3]. Additionally, an annual review of shipping and safety showed that human factors were responsible for 75% of ship safety accidents [4]. Therefore, human error is a non-negligible aspect for enhancing maritime safety.
The main human factors in maritime safety typically compose the following aspects: mental load, emotion, attention, stress, and fatigue [5]. Seafarers play a critical role in ensuring the normal operation of ships; therefore, the effects of their emotional states (e.g., cheerfulness, anxiety, anger) on job performance cannot be disregarded. Specifically, negative emotions such as overconfidence, sadness, and anger will be directly reflected in the decision-making process and behavioral patterns of seafarers once they arise [6,7]. Thus, it is imperative to identify the emotional states of seafarers and formulate relevant measures accordingly.
Precious and insightful perspectives on emotion recognition (ER) have been offered [8]; for instance, the well-known Valence-Arousal-Dominance (V-A-D) emotion model [8] and the Self-Assessment Manikin (SAM) scale used for measuring emotion [9,10]. Despite numerous studies that have been conducted on ER for road drivers, studies on cross-subject ER of seafarers on hazardous cargo ships remain insufficient. Considering the demand of shipping companies and the local maritime safety administration (MSA) on ensuring shipping safety, real-time monitoring of seafarers’ physiological states—such as through Electroencephalogram (EEG) analysis—can facilitate the early detection of abnormal emotion and targeted intervention measures, as well as data-driven maritime safety management.
The emotion recognition of seafarers can be inferred via various kinds of data. Currently, most researchers have attempted to measure emotions using various physiological indicators of seafarers, such as EEG, heart rate variability (HRV), electrodermal activity (EDA), and blood volume pulse (BVP) [11,12]. Among them, EEG is capable of directly detecting the brain’s electrical wave signals, thus possessing advantages that other sensors lack. While other physiological signals, such as BVP and HR, which pertain to the peripheral nervous system, are more frequently utilized for auxiliary identification [13]. During real navigation, seafarers must handle a variety of complex marine environments and unexpected situations, which are challenging to fully simulate in a laboratory setting. However, due to the high cost of data acquisition and the safety concerns, such data are relatively scarce. On one hand, physiological data collection in real navigation requires specialized equipment and subsequent rigorous data preprocessing while ensuring minimal disruption to seafarers’ regular duties. On the other hand, privacy issues must be fully respected. Nevertheless, real navigation data can truly reflect the emotional fluctuations and psychological states of seafarers during their work. Furthermore, data in real navigation contains rich feature information, including physiological signals and behavioral indicators of seafarers, as well as ship-related and environmental factors, such as ship heading, visibility, wave height, speed, and wind speed. Whereas existing SER studies rarely consider these factors [14,15,16]. Given the advantages of wearable EEG (portable, wireless, and high resolution), it provides an effective method for non-intrusive emotion measurement. In order to better identify the emotional state of seafarers, in addition to EEG, navigation indicators such as ship speed, wind speed, and wind direction are adopted as another modality.
In terms of methods for seafarer emotion recognition (SER), machine learning serves as an emerging and powerful means [17,18]. Different sensors are used for different monitoring scenarios, and there is no single sensor that can be suitable for all navigation environments. In contrast, multimodal information fusion is capable of enhancing the signal-to-noise ratio. According to the level of fusion, the information can be divided into data, feature, decision, and hybrid fusion [19]. Data fusion faces challenges like handling outliers, inconsistencies, conflicts, and framework design [20], which is normally time-consuming. Feature fusion, instead, extracts valuable information from all single-modal data to form a new feature space with high efficiency.
Generally, the reliability of the results obtained after the analysis of a single model by its internal rules remains unknown to us. Whereas the decision fusion through the combination of multiple models mitigates the uncertainty in the data modeling process and thereby achieves better outcomes. Currently, several frequently used decision fusion rules include voting (hard and soft level) and score mechanisms [21], which are rational from the perspective of weighting variance and bias. However, all these combination methods presuppose that the predictive performance of all models is identical, regardless of the uncertainty of predictions.
Against this background, researchers attempted to use the Dempster-Shafer (D-S) evidence theory [22], a powerful mathematical approach, to integrate evidence for more precise prediction. Despite straightforward and easy implementation, when the evidence offers conflicting judgments, the outcome of fusion is frequently perverse. Classifier calibration [23], in response, offers valuable insight. Through the employment of a preserved validation dataset, the model is enabled to learn a new mapping rule that fits the data while focusing on the data distribution, thereby bringing its output more in line with the true probability distribution in the real world. In this way, the level of conflict during decision fusion by the calibrated machine learning model can be effectively mitigated.
Based on the aforementioned, in this study, EEG data of seafarers and navigation data through a real navigation environment are collected for ER. Based on the dataset, a new emotion recognition framework is proposed, which uses a calibrated machine learning model as the base classifier and then employs the improved D-S evidence theory for decision fusion. By applying the improved D-S evidence theory to weight and fuse the prediction results of the calibrated base classifiers, high-performance emotion recognition will be achieved.
The aim of this study is to recognize the emotions of seafarers by integrating real navigation data with EEG signals. To obtain these data, a real navigation experiment was conducted. Based on this, a novel decision fusion framework is proposed, incorporating classifier calibration and weight fusion strategies to overcome the limitations of single models. Furthermore, cross-subject emotion recognition is implemented to improve the generalization and robustness of the results. A series of evaluations was conducted to validate the effectiveness of the fusion model.
The rest of this paper is organized as follows. Section 2 provides a review of the related previous studies. Section 3 introduces the methodology used. Section 4 introduces the experimental process, equipment, data collection, and processing. Section 5 demonstrates the results of experiments. Section 6 presents necessary discussions. Section 7 concludes this paper.

2. Related Work

2.1. Emotion Recognition of Seafarers

In recent years, machine learning and data analysis technology and human-computer interaction have been developing rapidly, given the maturity of wearable physiological equipment and devices to obtain objective data. Deep learning models generally demonstrate superior recognition performance, which has led to their widespread adoption in road driver emotion recognition. However, this effectiveness is heavily dependent on the availability of large-scale training samples. In maritime applications, where data collection is often constrained by operational and environmental factors, the availability of such extensive samples is typically limited. In contrast, classical machine learning models impose fewer demands on data quantity, and the availability of mature APIs nowadays facilitates faster model deployment. Consequently, the majority of SER studies focused on classical machine learning approaches.
Physiological data has been utilized by researchers to detect the emotional states of seafarers. Cross-session (i.e., the same subject in different sessions or trials) and cross-subject (i.e., different subjects in one trial) are two kinds of perspectives for ER. For the former, Fan et al. [14] employed EEG and the SAM scale to investigate the impact of seafarer’s emotions on performance individually in the ship simulator, with an average accuracy of 77.55% (11 participants) through SVM. The research findings revealed a significant correlation between the emotions of seafarers and job performance. In addition, Fan et al. [24] used neurophysiological data to assess the impact of psychological states on seafarers’ operational behavior. To quantify the emotions of seafarers, Liu et al. [25] systematically contemplated emotion monitoring, mental stress, and workload to identify the emotions of individual seafarers in the simulator by extracting features of EEG data. Wang et al. [26] conducted a study to compare the emotional changes of different subjects in two collision avoidance scenarios.
Given that brain activity patterns vary significantly from one person to another, some researchers have recently turned their focus on developing models capable of generalizing to new users (i.e., cross-subject recognition). Shi et al. [27] employed the S-TAI scale and ECG data to develop a seafarer’s anxiety recognition model, achieving an accuracy of 92.3% on the test set. Lim et al. [28] proposed a novel EEG-based mental workload recognition algorithm using deep learning techniques that was tested on a database with 18 subjects collected in a maritime experiment. It is found that their research method can also be applied far beyond the maritime domain. Nevertheless, insufficient attention has persistently been devoted to cross-subject SER. Furthermore, the utilization of information from a single modality limits the recognition performance.
To achieve better accuracy, the investigations of multimodal fusion based on physiological data have become an emerging field [29,30]. In the maritime field, Ma, Liu, and Yang [31] utilized EEG, ECG, and EDA data to develop a multimodal workload fusion recognition model of seafarers. Albuquerque et al. [32] employed multimodal fusion to assess the mental load of ship operators when undertaking different tasks. Additionally, Yang et al. [33] also integrated three types of physiological data to identify seafarer fatigue.
In summary, despite the abundance of studies on multimodal ER for road drivers, there appears to be a lack of research on similar perspectives in the maritime field. Therefore, the aim of this paper is to fill the research gap mentioned above.

2.2. Multi-Model Information Fusion

From the current research trend, multi-modal information fusion is becoming increasingly popular in a wide range of research fields, such as affective computing [10] and transfer learning [34]. In contrast to relying on a single model, a method that combines multiple models [35] is capable of learning more comprehensively from features, which is precisely the decision fusion (i.e., model fusion).
The most prevalent methodology for model combination resides at the voting level, i.e., hard and soft levels. The former is directly based upon the predictions of individual classifiers, and the decision-making mechanism is exactly majority voting. While rules such as the sum, product, maximum, and minimum fall into the latter category, as they use the posterior probability output by the classifiers [36]. An example of a soft-level classifier combination technique is provided in [37] for face recognition. Based on a majority voting mechanism, Muhlbaier et al. [38] proposed a classification incremental learning method based on dynamic weighted voting, where the voting weights are determined by the relative performance of each classifier on the training set. The advantage of the voting mechanism is that it enables effortless integration of various types of classifier architectures without adhering to a complex training process. However, in certain circumstances, the sensitivity to outliers may exert a significant influence on the outcomes.
The score-based approach represents an ensemble idea that is capable of handling the maximum amount of information while maintaining a high level of robustness [39], which can be attained by fusing the scores of classifiers on labels. The principal representative is the D-S evidence theory [22], which is the generalization of the Bayesian theory based on modeling uncertainty. The key to this theory lies in the basic probability assignment function (BPA) for each model to identify an instance, which significantly enhances the robustness of the system and is thus widely applied in various fields. Han et al. [40] employed the D-S theory to fuse BP and k-NN. The experimental results indicate that the performance of the combined classifier surpasses that of the individual classifier. Shi [41] proposed a novel ensemble learning algorithm based on random forest and D-S evidence theory and presented the classification results in the real IOT environment. The traditional D-S theory is indeed an effective combination rule, but the issue of evidence conflict has not been effectively addressed yet. For this reason, Qiu et al. [42] refined the basic evidence theory, took the precision as the fusion index, and constructed a fusion model for rockburst level identification. Ghosh, Dey, and Kahali [43] improved the D-S combination rule based on type 2 fuzzy mixture, minimized the evidence conflict, and achieved success in the field of face recognition.
In summary, D-S evidence fusion and its variants are flexible and effective multimodal information fusion methods, which have been applied in many fields. However, the traditional paradox of conflicting evidence remains; a weighted fusion approach proposed by this paper instead may solve this problem.

3. Methodology

A decision fusion framework based on the enhanced D-S evidence theory is presented, as depicted in Figure 1. Machine learning models are established in advance as evidence. Based upon the D-S evidence theory, the identification framework exists in each emotional dimension, namely θ 1 = [HV, LV], θ 2 = [HA, LA], and θ 3 = [HD, LD]. To achieve superior results in the fusion stage, those with better performance are selected as candidate models for the D-S fusion stage. Before fusion, the selected models are probabilistically calibrated to obtain more accurate probability outputs, thereby forming the BPA function.
The fusion process consists of five steps as follows:
  • Data acquisition and preprocessing for determining the identification framework of seafarer emotion recognition.
  • Select multiple machine learning models as preliminary evidence. After obtaining the preliminary recognition results, the top 3 performing models are chosen as the candidate evidence for fusion based on accuracy.
  • Probability calibration is implemented on the selected candidate evidence. Specifically, Sigmoid calibration is executed for SVM and RF, and Softmax temperature scaling is conducted on MLP.
  • For each instance to be tested, the calibrated probability output is used to construct the BPA, and the weight coefficient between the evidence is calculated using the evidence distance formula.
  • The weight coefficients are assigned to the preliminary prediction results of the instances to be tested, and the final results are synthesized.

3.1. Construction of Machine Learning Models

First, obtain the corresponding data to establish a multimodal dataset. The power values of the four frequency bands of the preprocessed EEG data, the corresponding differential entropy, and the ship navigation data will be employed as the feature vector X of the machine learning models. The subjective scores of the SAM scale are used as the labels for ER. Given the individual differences of EEG signals, cross-subject ER was implemented in this paper to obtain a more universal recognition. 8 mature machine learning models for SER are established, including artificial neural networks (ELM, RBF, and MLP), ensemble models (XGB, Light GBM, and RF), KNN, and SVM, which have been widely used [44,45,46]. The input features are standardized by Z-score prior to training, as shown in Equation (1). The trained models will be evaluated on the test set.
x s t d = ( x x ¯ ) / σ x
Here, Xstd represents the standardized feature vector, x ¯ and σ x represent the mean and standard deviation of the feature vector, respectively.

3.2. The Training of the Models

For the neural network in this study, the structure (i.e., the number of hidden layers and the hidden state size) and hyperparameters (i.e., the learning rate) are adjusted by grid search, which is commonly used for hyperparameter tuning. Finally, an MLP with two hidden layers was constructed, containing 64 and 128 neurons, respectively. The network takes as input an 11-dimensional feature vector and outputs 2 different emotional states. The ReLU activation function is used on hidden layers. The output layer employs a softmax activation function to generate classification probabilities. The learning rate was set to 0.005.
To avoid overfitting and minimize generalization error, early stopping is adopted during training. The data of the 10 subjects were randomly partitioned into a training set, validation set, and test set at a ratio of 7:1:2. To objectively assess the generalization performance of the model, it was specified that all samples of the test set were instances prior to oversampling. Specifically, the models are trained on the training set, while the validation set is used to monitor the validation loss after each training epoch. The test set is reserved exclusively for the final model evaluation. Model parameters are saved at each epoch, and training is terminated when the validation error ceases to decrease. The final model is selected based on the parameters that yielded the lowest validation error.
In general, the training of a neural network is the process of minimizing the loss function [47]. Given that SER is a multi-class classification task, the cross-entropy loss function is used because of its low computational cost and efficiency with our dataset. Adam, a widely used and effective optimizer, is selected to update the weights of the networks. The batch size was set as 24, and Xavier initialization was used to initialize the weights of the network.
As for other non-neural network models, the optimal model parameters are determined via Bayesian optimization on the validation set. To acquire a more robust model, a 5-fold cross-validation method is employed for training.

3.3. Classifier Calibration

For a test instance to be classified, if the output probability distribution of a K-class classifier is in accordance (approximately) with the actual observed distribution, then the classifier is well-calibrated. For instance, if an instance is predicted as positive with a probability of 0.8, then approximately 80% of such instances are expected to actually belong to the positive class. A multitude of traditional machine learning algorithms exhibit overconfidence in their predictions, which may prove detrimental to users’ decision-making. The aim of calibration is to enhance the quality of the probability predictions produced by the classifier via using a hold-out validation set and to guarantee that the probabilities output by the classifier precisely reflect the confidence of a sample belonging to a specific class. This is essential in applications like medical diagnosis, risk assessment, machine failure prediction, and automatic driving, which also enhances user trust and the interpretability of the model. In this paper, the subsequent decision fusion is carried out based on the probability outputs of the classifiers. Hence, it is highly necessary to conduct prior calibration. Several calibration methods that are widely used today are empirical binning, isotonic calibration, sigmoid calibration, beta calibration, and temperature scaling [48]. Table 1 shows the differences between them. Considering the computational resources and the size of the dataset in this paper, sigmoid calibration and temperature scaling are adopted. The following briefly describes related theories.

3.3.1. Calibration Method

(1) Sigmoid calibration (SC): SC is a parameterized approach, based on Platt’s Sigmoid model [23], which maps the output of a classifier (such as the decision function of SVM) to probability values via a logical function. This approach is typically used for binary classification problems. The logic function is represented as Equation (2).
p ( y i = 1 | f i ) = 1 / ( 1 + exp ( A f i + B ) )
Here, y i is the true label of the sample x i , f i is the output of an uncalibrated classifier for sample x i . Parameters A and B can be estimated by optimizing the log-likelihood on the validation set. Therefore, SC can be regarded as the log-loss optimization in the calibration context, as shown in Equation (3).
L ( A , B ) = 1 N i = 1 N ln ( j = 1 2 I ( y i = j ) p ( y i = 1 | f i ) )
(2) Temperature scaling (TC): For a K-class classification problem (K ≥ 2), the neural network outputs a class prediction y ^ i and prediction probability p i for each input sample x i (with the true label y i ). The log vector output of the neural network is Z i , where  = argmax Z i . By mapping through the softmax function, p i is obtained as an uncalibrated probability output as depicted in Equation (4).
p i = softmax ( Z i ) k = exp ( Z i ( k ) ) / j = 1 K exp ( Z i ( j ) )
As the simplest variant of Platt scaling, TC applies a scalar T (T > 0) to the log vector Z i of the neural network, and the new prediction probability is acquired through Equation (5), which is exactly the calibrated probability. T is denominated the temperature and can be obtained by optimizing the negative log-likelihood on the validation set. The addition of the T value is equivalent to scaling the original softmax function to varying degrees, thereby not altering the prediction accuracy [48]. The calculation of the loss function is as shown in Equation (6).
p n e w = softmax ( Z i / T ) ( k )
L o s s N L L = i = 1 n y i log ( p i ( y i | x i ) )

3.3.2. Metric for Calibration

Similar to the evaluation of classifier performance, to assess the quality of calibration, corresponding quantitative indicators are also necessary. Considering the binary context in this paper, the binary-ECE [23] is employed, as shown in Equation (7). It is well-suited for binary classification problems. Here, M and N are the number of bins and the number of samples, respectively. B m  represents the number of samples in the m-th bin.  and denote the proportion of positive class samples and the average predicted probability in each bin, respectively.
E C E b i n a r y = m = 1 M | B m | N | y _ ( B m ) s _ ( B m ) |

3.4. Improved D-S Weight Fusion Strategy

Deng [22] and Jousselme et al. [49] proposed the concept of evidence distance weight to avoid the evidence conflict paradox. The degree of response among evidence is computed based on the similarity, and ultimately, the weight allocation of each piece of evidence is obtained. Based on the obtained weight vector, the prediction results of the calibrated base classifiers are weighted combined (i.e., decision fusion) to obtain the final prediction result. The physical significance of the variables in the equation is detailed in Appendix A.
The evidence distance formula is presented in Equations (8) and (9):
d ( E 1 , E 2 ) = ( | | E 1 | | 2 + | | E 2 | | 2 2 ( E 1 , E 2 ) ) / 2
| | E i | | 2 = ( E i , E i )
where (E1, E2) is the inner product of the two vectors. Specifically, the vectors referred to here represent the probability distributions over each category generated by the machine learning models for a given classification task. d (E1, E2) represents the distance of two evidences.
After obtaining the confidence distance between the evidence from the above formula, the confidence distance matrix D is shown as Equation (10). Using a matrix format can make calculations faster.
D = 0 d 1 n d n 1 0
Once the evidence distances are obtained, the similarity (denoted as s), as shown in Equation (11), among the evidences is calculated; subsequently, the similarity matrix S among the evidences is acquired by Equation (12), where i and j stand for the evidences.
s = 1 d i j
S = 1 1 d 1 n 1 d n 1 1
Next, calculate the response degree of the ith piece of evidence supported by other evidence as the credibility of the evidence.
R ( E i ) = j = 1 , j i n s ( i , j ) , i = 1 , 2 , n .
Finally, the weight vector of evidence is obtained by normalizing the response of evidence in Equation (14).
w i = R ( E i ) / i = 1 n R ( E i )
The calculated weights will be assigned to the corresponding classifiers, and their prediction results will be combined with weights to obtain the final result. It can be discerned from the aforementioned principles that the higher the degree of response from other evidence to a certain piece of evidence, which indicates greater reliability, the higher the weight it acquires in decision-making. This provides a flexible approach to handling the results of different classifiers.

4. Experimental Setup and Data

4.1. Participants

A total of 10 male seafarers participated in this experiment, including positions such as captain, seaman, and helmsman. The navigating bridge is manned by two seafarers, one is the captain (occupied by the deputy-level crew member, accountable for the overall control of the ship and giving instructions), and the other is the helmsman (responsible for steering the ship and controlling the ship’s speed and course). With the exception of one participant whose physical condition was sub-optimal (yet not affecting daily work), the remainder were all in good health, with an average age of 42.57 years (SD = 12.15) and an average navigation experience of 19.19 years (SD = 15.08).

4.2. Experimental Apparatus and Technique

4.2.1. EEG Equipment

The EEG sensor utilized in this experiment is presented in Figure 2a. To comply with the standards of the ship’s navigation protocol and avoid interfering with the routine work of the seafarers, the NeuroSky Mindwave Mobile 2, a dry medium single-channel EEG headset with a sampling rate of 512 Hz, was employed to measure brain activity. An electrode was placed on the forehead (FP1) of the subjects to monitor the EEG activities of the seafarers during the navigation watch. It has been proven that the prefrontal lobe is one of the most relevant EEG electrode positions for emotion recognition [50].

4.2.2. Participant Self-Assessment

The emotional model utilized in this article (i.e., V/A/D model) [10,29,51] is shown in Figure 3a. It uses three dimensions to describe emotions, each of which can be quantified. Each point in this emotional space represents a corresponding emotional state. To precisely express the emotional states of the seafarers during the entire navigation process, we employed the SAM scale for self-assessment by the participants, as illustrated in Figure 2b. The SAM scale is a well-known emotional questionnaire assessment technique. The valence scale ranges from 1 to 9, extending from unpleasant (such as sad, stressed) to pleasant (such as happy, elated). The arousal scale spans from 1 to 9, extending from inactive (such as uninterested, bored) to active (such as alert, excited). The dominance scale also ranges from 1 to 9, from helpless (out of control) to a sense of being empowered (dominating everything). Therefore, the SAM scale is highly compatible with the VAD emotion model. Additionally, the rank of each subject and the time of inquiry were also recorded for the convenience of subsequent data alignment. The SAM scale scoring record of a seafarer during the first navigational watch is shown in Figure 3b, which depicts the emotional fluctuations throughout a navigation watch. The vertical axis indicates the scores obtained by seafarers across three emotional dimensions, while the horizontal axis represents the number of inquiries. This indicates that each inquiry generates 3 emotional ratings.

4.3. Experimental Design

4.3.1. Test Ship and Route

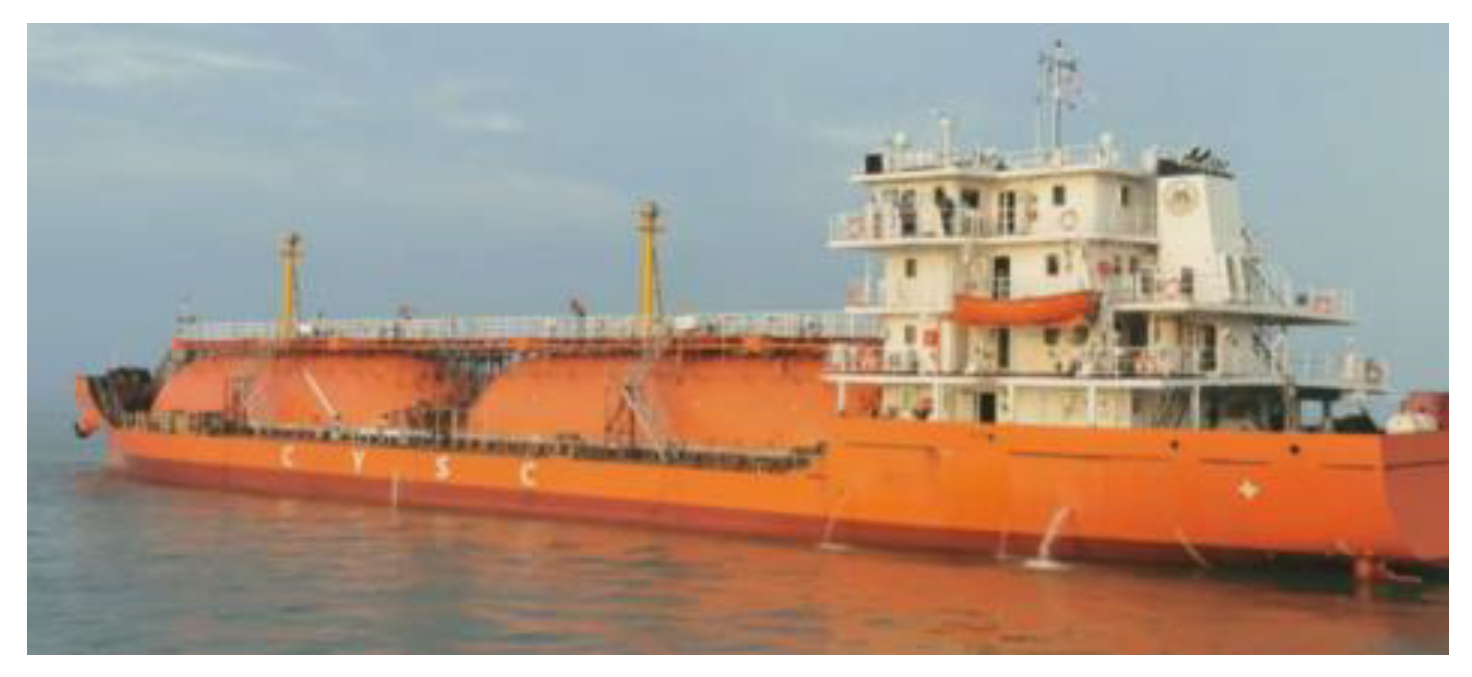
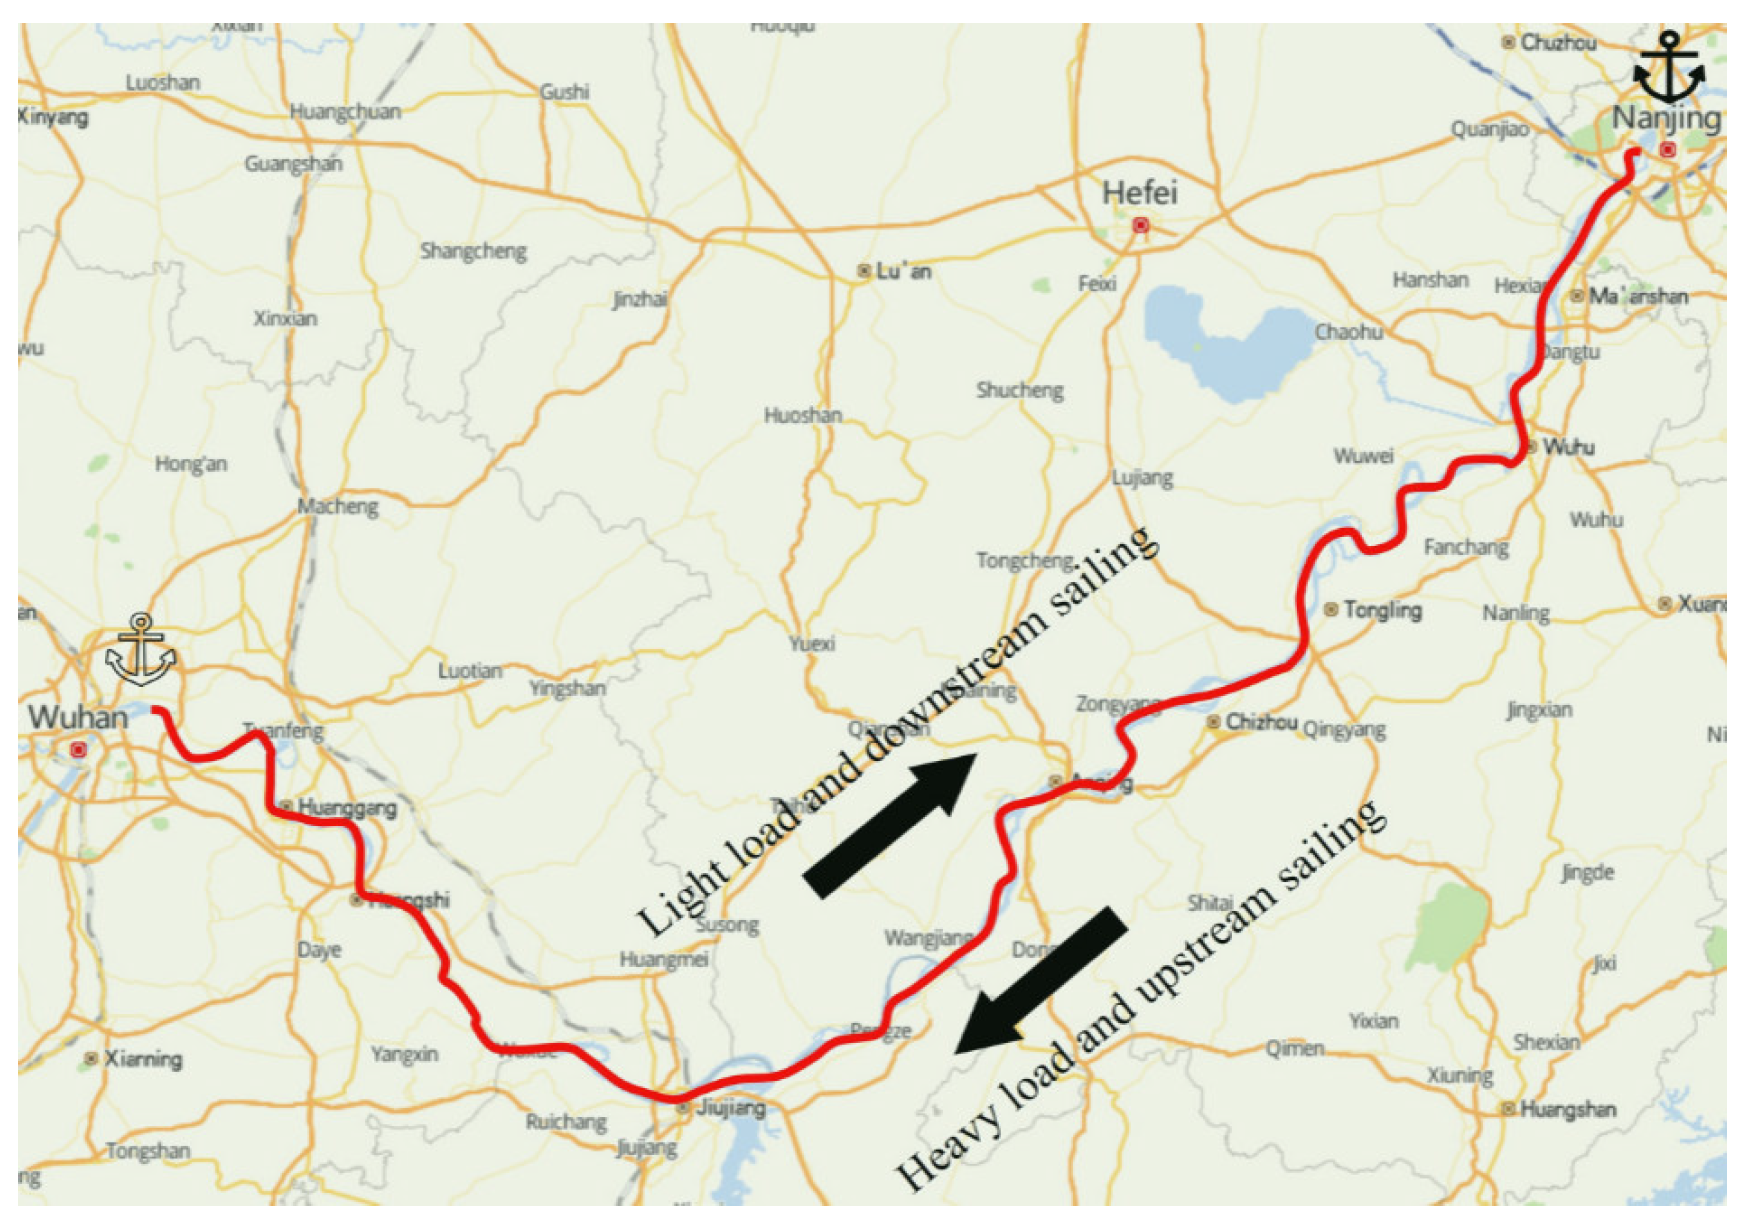
The test ship employed in this study is a Yangtze River LPG tanker, as shown in Figure 4. The technical parameters of the ship are shown in Table 2. In Figure 5, the navigation route utilized in the real ship plotting experiment is presented. The route is determined by the task of the ship on this occasion. It set off from Wuhan Port and retraced the same path upon reaching Nanjing Port. The average navigation speed was 12.68 km/h. The ship departed from Wuhan, navigated along the Yangtze River to Nanjing. After the ship finished loading in Nanjing, it navigated back to Wuhan.

4.3.2. Experimental Process

The experiment lasted for 7 days, including a complete outbound and return journey. Since cargo ship seafarers follow varied duty schedules, the research team conducted a 24-h tracking experiment covering over 1292 km from Wuhan to Nanjing to comprehensively capture the navigation data of 10 individuals. The researchers monitored the emotions of the seafarers with wearable devices supplemented with questionnaires on duty. Figure 6a presents the experimental procedure, and Figure 6b shows the seafarer performing a navigation watch in the experiment.
Seafarers are obligated to maintain the normal operation of the ship in various circumstances. To comprehensively assess the emotional state of the seafarers during work, the entire physiological data of one navigation watch (4 h) was continuously collected. Data were gathered at least 4 times per hour, and continuous data for half an hour was guaranteed each time. During a navigation watch, the seafarers will answer the questionnaire each time a specific experimental scenario (as detailed in Table 3) occurs. Specifically, when each navigation watch began, the researchers would enter the navigating bridge together with the seafarer. When the experimental scenario was about to occur, the researchers would give a reminder to the seafarer in advance and then ask them to answer the subjective scores of the three emotional dimensions in the SAM scale. At the start of the experiment, EEG signals were recorded for each subject, with baseline data derived from the signals from the first 3 min of each test. All subjects were exposed to the same environment with task scenarios.
The integrated bridge system used in this experiment is an advanced and automated integrated system that combines navigation, control, radar collision avoidance, and navigation management on the ship’s bridge. The key devices, such as the automatic identification system (AIS), auto-telephone, compass, speed log, and more, are installed on the bridge control console (BCC). Seafarers can perform ship maneuvering tasks through human-computer interaction. In order to minimize interference to the participants, one researcher put the equipment on the participants, one researcher conducted the questionnaire inquiries, and the last one ensured the normal input of the EEG data. According to the interviews with seafarers before the experiment, the most important thing during navigation is to maintain good visual and auditory observation at all times to observe the water transport situation to ensure the safety of the ship.
These scenarios include overtaking ships, passing under bridges, turning, navigating in adverse channel conditions, etc., as depicted in Table 3. It should be noted that these tasks typically do not occur independently. In case no specific task emerges within 15 min, it is regarded as “normal navigation”. The EEG data during each task (not exceeding 15 min), as well as the time when a specific scene occurs and the corresponding event, were recorded. In order to collect data as comprehensively and reliably as possible, before the experiment, the participants were informed of the experimental procedures. The researchers ensured that the participants wore the EEG device correctly and that the device operated normally throughout the entire experiment. The questionnaire inquiries for each experimental scenario were also recorded; the quality of the EEG signals collected in the experiment was also checked.

4.4. Data Collection and Processing

The EEG signals of 10 seafarers, their self-ratings of emotions in each specific scenario, as well as the ship navigation data at the corresponding moments, were collected. Additionally, the ship’s acceleration (asog), relative wind speed (ws), and relative wind direction (w) were added as auxiliary factors, as the seafarers’ states are typically influenced by the ship’s navigation states. The navigation data were collected by fixed sensors on the ship, and access to the data were obtained. The collected dataset spans a 7-day period, comprising a total of 525 questionnaire records. For each questionnaire record, EEG signals were captured for 1 min before and after the record. The data consists of 6 distinct experimental scenarios in Table 3 and involves three occupational groups: sailors, helmsman, and captains.

4.4.1. Processing of Subjective Questionnaires

The scores of the SAM scale will be utilized as the ground truth (label) for emotion recognition. Considering that the score range of the three emotional dimensions of the scale ranges from 1 to 9 and the practices of related work [29,51,53], we reasonably merged the original nine levels of each dimension into two levels. This helps maintain label balance and support more effective cross-validation, which is frequently adopted in emotion recognition studies. The division threshold was set at 5, indicating that the first five rating scales belong to low valence, arousal, and dominance, while the last four rating scales belong to high valence, arousal, and dominance.

4.4.2. EEG Data Preprocessing

During the experimental procedure, a variety of interfering signals will be encountered, including blink artifacts, electrooculogram (EOG), electromyogram (EMG), and power line interference. These signals, superimposed upon the collected electroencephalogram (EEG) signals will lower the signal-to-noise ratio, lead to signal distortion, and mislead research results. Hence, preprocessing is indispensable. The EEG signals of 1 min prior to each completion of a specific task were extracted for analysis.
  • Power Feature: Employing the EEGLAB (version 2024) toolbox of MATLAB (version 2023b), the baseline of the data was eliminated, and artifacts were removed at 1 s intervals. The band-pass filter within EEGLAB was utilized to attenuate the non-EEG signals through a 1 Hz high-pass filter and a 50 Hz low-pass filter. The enhanced periodogram method was adopted for power spectrum estimation. The relative spectral power of the theta band (4–7 Hz), the alpha band (8–13 Hz), the beta band (13–30 Hz), and the gamma band (30–48 Hz) was computed, respectively.
  • Differential Entropy Feature (DE): DE is the generalized form of Shannon’s information entropy with respect to continuous variables.
D E = a b p ( x ) log ( p ( x ) ) d x
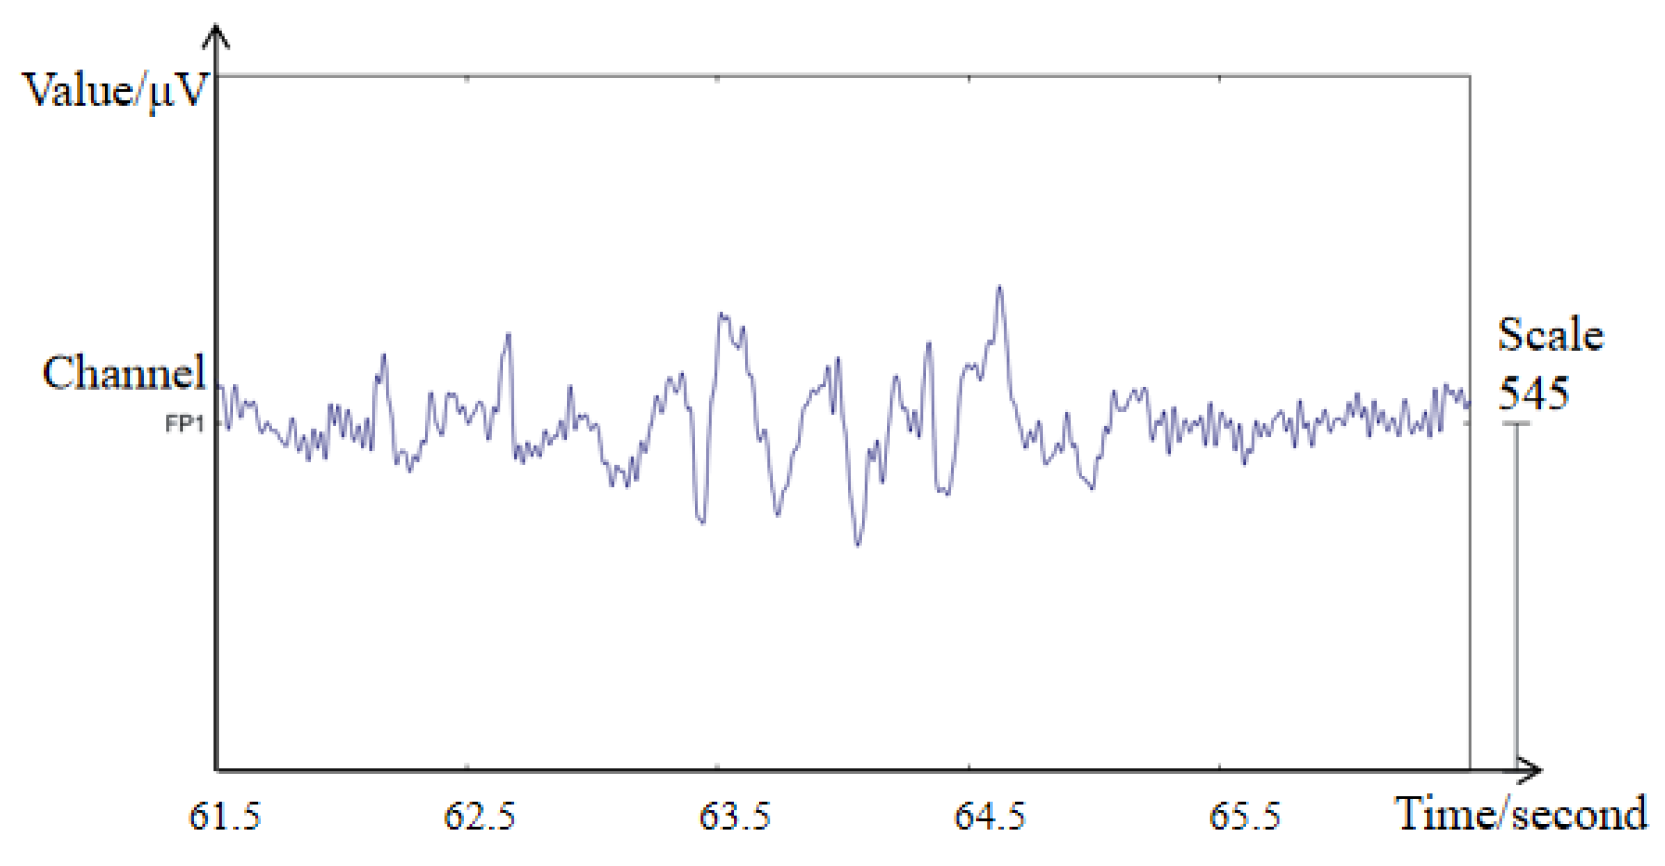
Likewise, the DE features corresponding to four frequency bands were extracted. In total, 8-dimensional EEG features were obtained. The partial EEG of a participant is shown in Figure 7. The horizontal axis indicates the sampling time, while the vertical axis reflects the value of the brain’s electrical signals. The fluctuation in the brain electrical signals of subject 1 can be observed in this segment.

4.4.3. Data Balancing

The issue of class imbalance across the three emotional dimensions is present in the original samples. If they are directly employed as the input for the machine learning model, the performance would be adversely affected. Hence, the Adaptive Synthetic (Adasyn) oversampling [54], which assigns distinct weights to different minority class samples, was adopted to generate varying quantities of samples. The comparisons of the sample sizes of the three emotional dimensions before and after processing are presented in Figure 8.

5. Result and Discussion

5.1. Results on Test Set

It is of great significance to evaluate the preliminary outcomes of the base models as constructed in Section 3.1, which is directly associated with the quality of fusion. The evaluation of machine learning models is usually centered around the four elements of the confusion matrix, covering true positive (TP), false positive (FP), false negative (FN), and true negative (TN). In binary classification, accuracy, precision, recall, and F1 score are commonly preferred as indicators for assessing models, as shown in Equations (16)~(20). To quantify the model’s discriminatory ability, the area under the ROC curve (AUC) is also used. The corresponding calculation formulas are as follows.
A c c u r a c y = T P + T N T P + T N + F P + F N
p r e c i s i o n = T P T P + F P
r e c a l l = T P T P + F N
F 1 s c o r e = 2 × p r e c i s i o n × r e c a l l p r e c i s i o n + r e c a l l
A U C = i p o s i t i v e r i M × ( M + 1 ) / 2 M × N
Here, M is the set of positive samples. N is the set of negative samples. ri indicates the rank of sample i among all samples, sorted by predicted probability from smallest to largest. The closer the AUC value is to 1, the better the model performance.
The preliminary results on the test set are presented in Table 4. Based on the average accuracy and F1-score of the eight models in three emotional dimensions, MLP, SVM, and RF emerge as the top three performing models, achieving 80.10%, 80.73%, and 79.24% on accuracy and 80.92%, 79.14%, and 78.39% on F1-score, respectively. SVM outperforms RF and MLP, signifying the considerable potential of the kernel function mechanism in dealing with high-dimensional features. MLP attains the highest F1 score, and the capacity of the fine-tuned multi-layer neural network in fitting data should not be undervalued. The ensemble model RF utilizing bagging, via the strategy of integrating weak learners, also exhibits relatively decent performance. Even though relatively satisfactory results have been obtained, there is still room for improvement. Hence, decision fusion is adopted to enhance the upper limit of the model. Based on the approaches in Section 3, from the perspective of minimizing uncertainty, the calibration is initially conducted on these three models, and the calibration evaluation will be presented in the next part.

5.2. Evaluation of Calibration

SVM, MLP, and RF are selected as the base classifiers (i.e., the evidence) in the fusion stage based on the preliminary identification outcomes. The construction of BPA depends on the probability output of the model. The reliability of the evidence will directly influence the quality of the fusion. Hence, calibration of the three models is carried out first. The performances of the calibrated models are depicted in Table 5. The comparison of the calibration quality of the three models before and after calibration is displayed. It can be noted that the output of the models remains unaltered after calibration, but the Binary-ECE has decreased to a certain extent, which means that the probability output of the models has changed.
From the calibration results above, all three classifiers have been calibrated to varying degrees. Among them, the SVM calibrated with Sigmoid exhibits the best performance in the Arousal dimension, with Binary-ECE reduced from 0.168 to 0.057. After calibration via the same approach, the error of RF decreased slightly in three dimensions, and the calibration effect was not very distinct. This could be attributed to the fact that the input of the logistic regression is a real scalar space, which is in consistent with the SVM converting the confidence distance into the probability, but the effect for other classifiers is not very obvious.
Through an iterative search strategy, the optimal T value of the softmax scaling of MLP on three emotion dimensions (valence, arousal, and dominance) is 2.91, 14.64, and 3.88, respectively. Temperature scaling “stretches” the softmax function, causing the output probabilities to gradually approach the end points of the [0, 1] interval. Meanwhile, the certainty of the output probabilities will increase progressively, which is in line with the conclusion in related literature [48,55]. Based on the above analysis, despite our inability to achieve perfect calibration (the diagonal line in the figure), the gap between the calibrated probability distribution and the observed probability distribution was still narrowed. Consequently, we have enough reasons to contend that the model after calibration is more reliable than before.

5.3. Comparison Between Single and Fusion Models

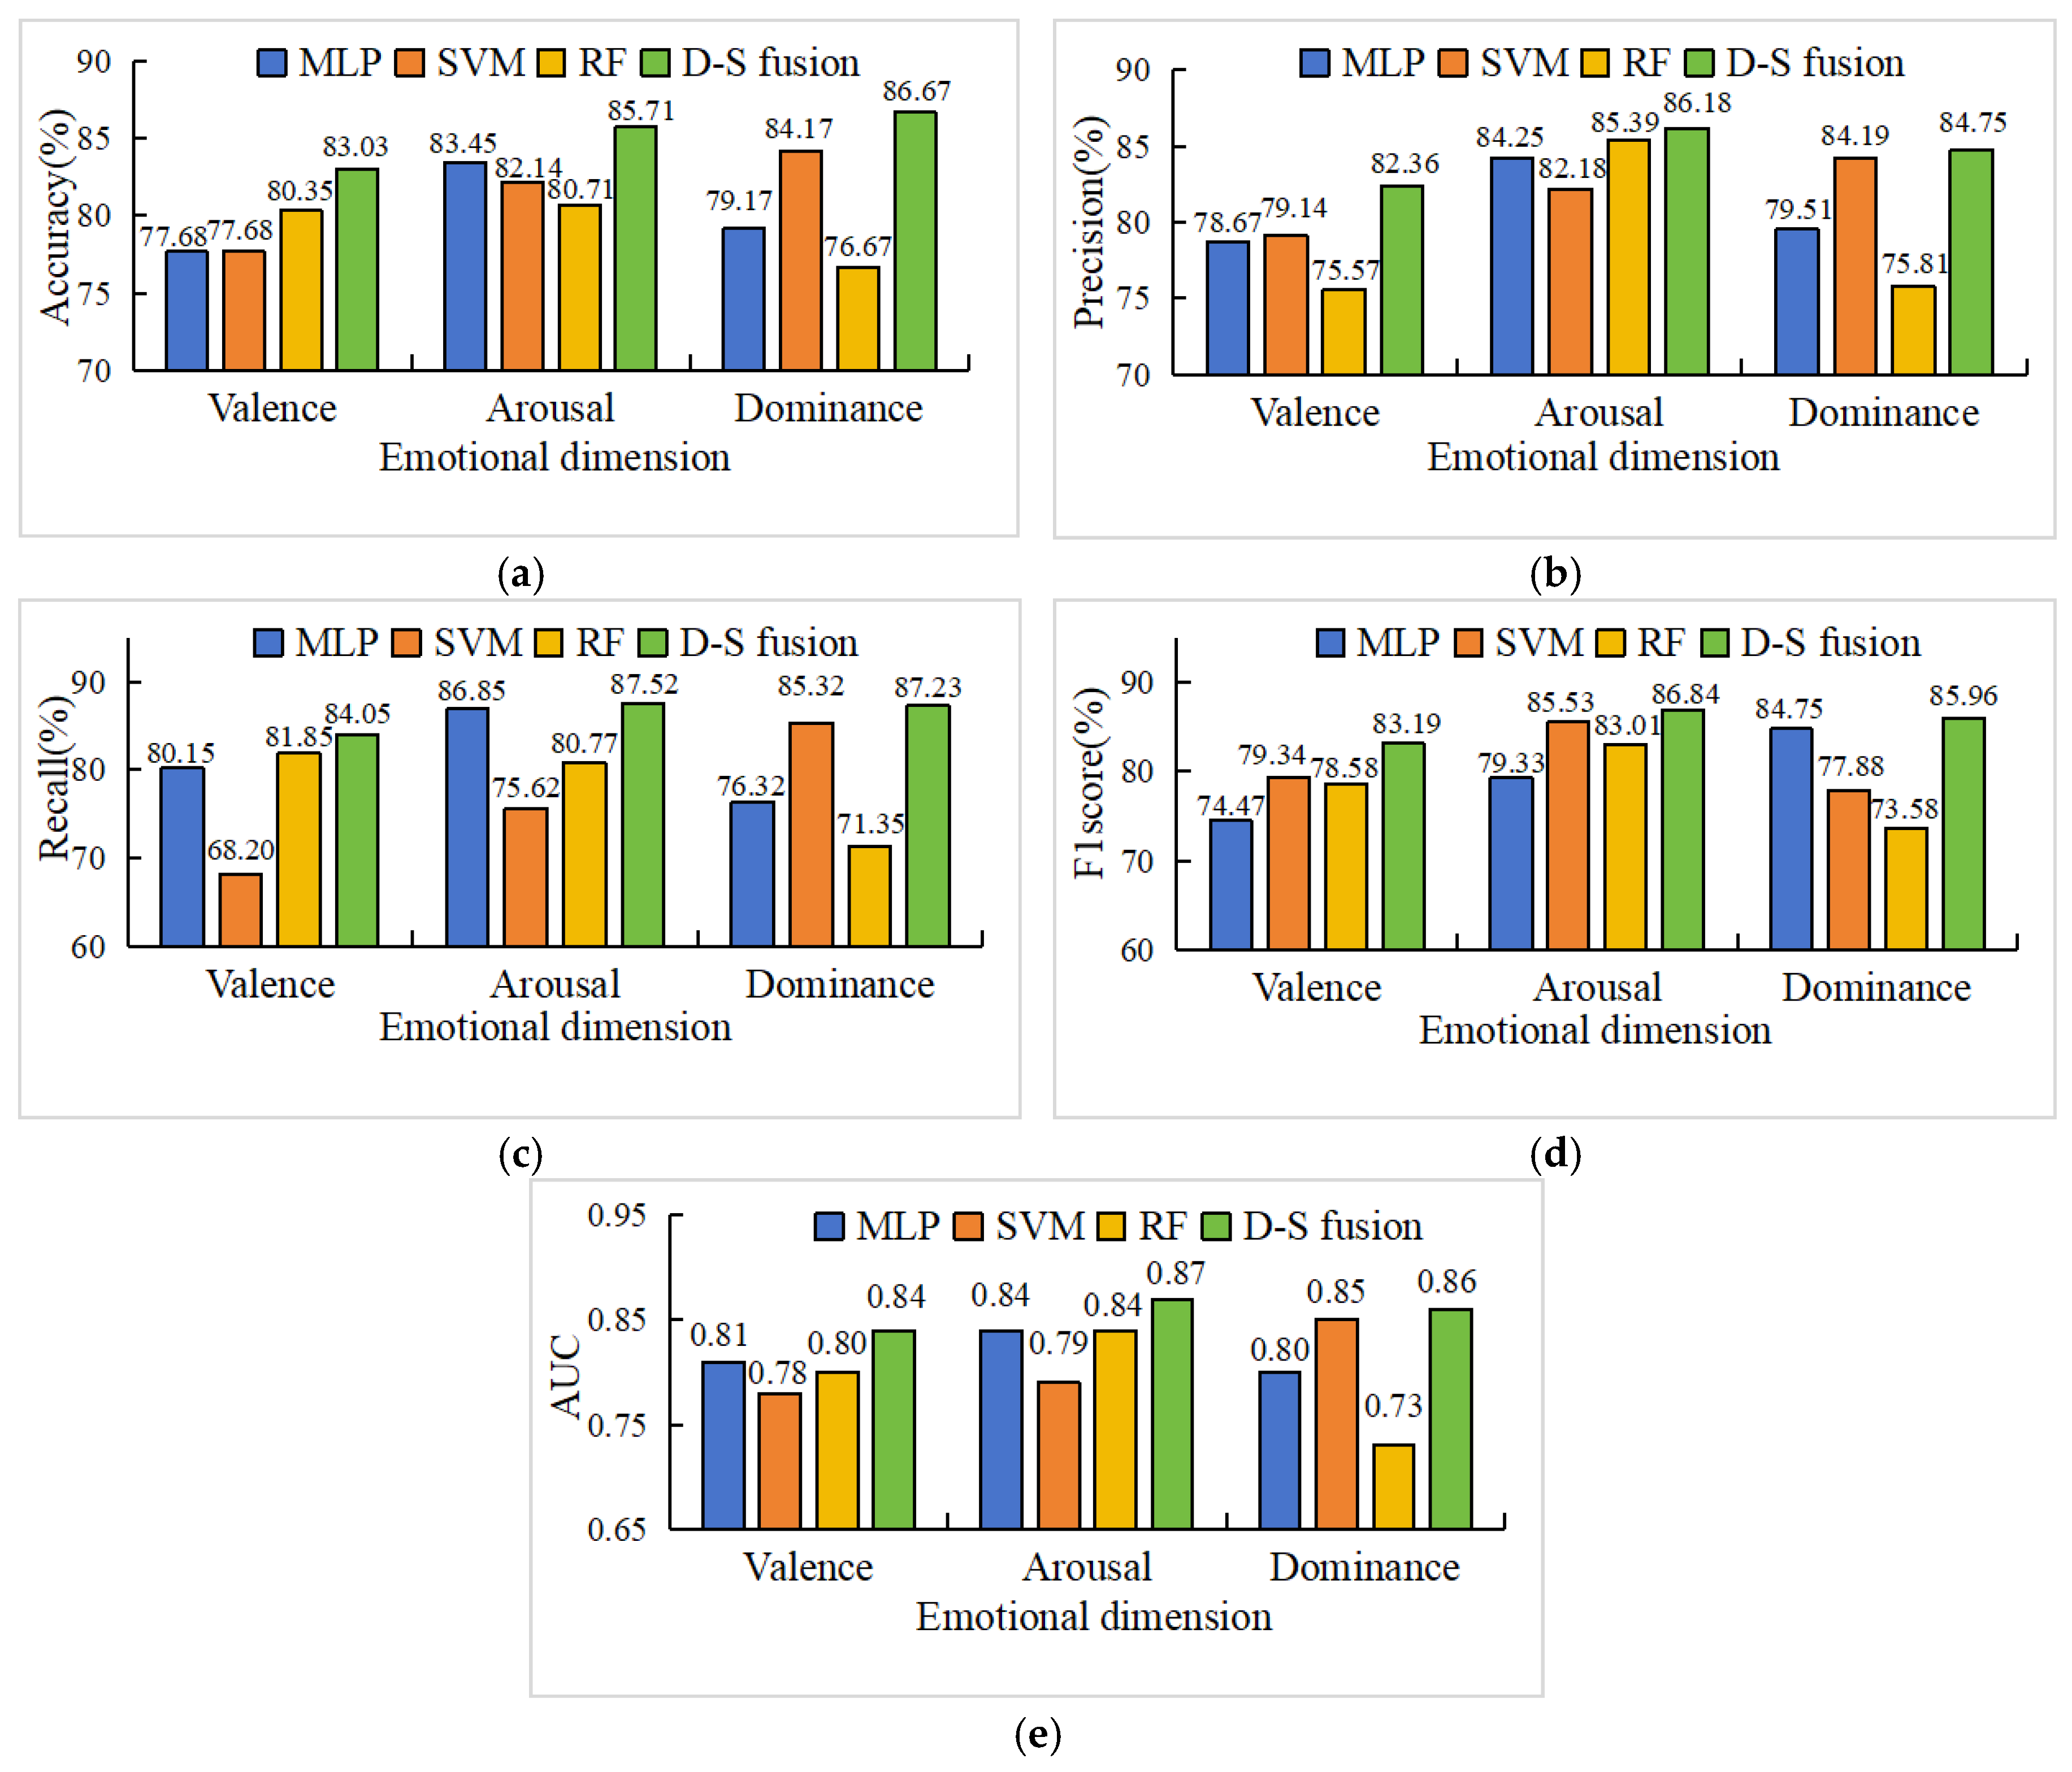
The comparison of the results between the fusion model and the single models is presented in Figure 9. Evidently, from the results of the histogram, it can be observed that the D-S fusion model proposed in this paper outperforms the three single models in terms of accuracy and F1 score, attaining 83.03%, 85.71%, and 86.67% in the three emotion dimensions respectively for accuracy, which have increased by 3.32%, 2.26%, and 2.5%, respectively compared to the previous best individual model (SVM). When conducting decision fusion, the higher the quality of the selected base classifiers and the greater the disparity, the stronger the generalization capacity and performance of the fusion model will be.
In this paper, the calibrated probability output is adopted as the basis for fusion, and the evidence distance formula is utilized to calculate the weights of each piece of evidence. The smaller the disparity between the predicted probability and the observed probability, the higher the weight obtained by the classifiers. Apparently, the fusion model, through integrating the outcomes of individual models, has raised the upper limit of individual models to a certain extent and demonstrated considerable potential in actual recognition and classification tasks.

5.4. Statistical Test

Paired-sample t-tests are employed to assess the significance of the fusion model in terms of performance improvement compared to the Top 3 models. In different random seed settings with hyper-parameters unchanged, the model is repetitively trained and tested to acquire multiple pairs of samples. A statistical hypothesis test prior to the formal test guarantees that the difference between the paired samples basically follows a normal distribution. Table 6 displays that the D-S fusion model exhibits a significant difference in the accuracy of emotion recognition compared with the Top 3 models. It can be seen that there is a significant difference in accuracy between the D-S fusion model and the Top3 models. This validates the effectiveness of the proposed method statistically.

5.5. Comparison with the Existing Studies

The research on emotion recognition of seafarers is still scarce, and the recognition approaches employed are mainly based on single machine learning algorithms, as shown in Table 7. It can be observed that, under small sample size conditions, both decision fusion stacking and ensemble models demonstrate superior performance compared to single models such as SVM and BPN. Furthermore, the fusion model proposed in this study outperforms traditional stacking approaches and neural network-based models in terms of overall performance. This once again indicates the limitations of relying on a single piece of evidence for pattern recognition. Consequently, for the application of expert systems such as machine learning models in engineering practice, especially in high-risk fields (e.g., autonomous driving, maritime transportation), multiple pieces of evidence should be integrated.

6. Discussion

6.1. Claims and Summary

This paper aims to identify seafarers’ emotions accurately. To ensure a real representation of emotional states across different navigation scenarios, we conducted a real navigation experiment to collect the EEG data of seafarers. Additionally, the ship’s navigation data and seafarers’ self-reports on emotion were obtained, which, together with the EEG, formed the ER dataset.
For the data, this study attempts to incorporate factors such as ship speed, wind speed, and wind direction into SER, which differs from previous studies that focused on physiological data. The good recognition performance demonstrates that the fusion of these two data modalities (EEG and ship navigation) can contribute to the improvement of performance for SER.
Given the limited research in SER and the relatively small sample size, this study did not choose deep learning models—despite their widespread application in road drivers’ ER. Instead, we explored the use of lightweight classical machine learning models for ER in the maritime context. Regarding model fusion strategies, traditional D-S evidence theory has been extensively applied across various domains due to its BPA, which significantly enhances the effectiveness of data fusion systems. However, the presence of the evidence conflict paradox restricts its broader applicability. Therefore, this paper adopted a weight-based combination approach, where the weights are derived from the probability outputs of the classifiers (i.e., “evidence”)—values that reflect the confidence levels of the machine learning models. This is where calibration comes into play. Specific calibration methods are used based on the characteristics of the base classifiers. By calibrating the probability outputs of the base classifiers, the calibration errors of SVM, RF, and MLP have been reduced to a certain extent (see Table 5). Therefore, more accurate weights are obtained, thereby improving the overall performance of the fusion system. This process forms the core logic of the proposed framework. The classification accuracies for the proposed fusion model are 3.26%, 2.26%, and 2.50% higher compared to the best single algorithm (i.e., SVM) for arousal, valence, and dominance, respectively. Comparisons with existing decision fusion methods further validate the superiority of the proposed framework.

6.2. Implication

Existing studies on SER primarily focus on physiological data and rely on single-class models for recognition, which, to some extent, limits the performance of recognition. The proposed fusion model for SER combines multiple machine learning models using weighted combinations to achieve better recognition performance. The evaluations of the proposed model demonstrate its superiority in SER. Human factors contribute to errors and mistakes, which cause severe maritime accidents.
For shipping companies, the findings of this paper can be incorporated into a bridge system to support the daily operation and seafarer management. Companies can establish real-time monitoring mechanisms for seafarers’ emotional states, enabling timely alerts when abnormal emotions are detected. Additionally, based on the proposed framework, shipping companies can identify high-risk emotional triggers for individual seafarers and design personalized training to improve emotional regulation, thereby strengthening crew resilience, which is becoming increasingly important in the shipping industry.
For the local maritime safety agencies, this research underscores the value of integrating advanced ER technologies into maritime safety protocols. The proposed method helps inform policy-making related to crew scheduling, rest periods, and mental health support—ultimately reducing the incidence of human-error accidents. By promoting the adoption of such data-driven tools, a more proactive and science-based approach to maritime safety can be developed.

6.3. Limitations

Although the proposed model demonstrates better results than methods in previous studies, this is only for 10 subjects on a specific ship, and the insufficient sample size is what we consider to be the main limitation. This study utilized 11-dimensional features to train and evaluate the proposed emotion recognition system. In the future, we plan to expand the scope of the study to include different ship types and a larger number of participants to increase the sample size and incorporate environmental factors during navigation. At that time, we will consider employing deep learning models to accommodate the expanded database.

7. Conclusions

This paper aims to accurately recognize seafarers’ emotional states. Based on the analysis, the following conclusions are derived.
The seafarers’ EEG data and ship navigation data were obtained as two modalities, which distinguishes them from the previous studies that mainly focused on physiological fusion. Based on the dataset, 8 machine learning models were deployed to identify the valence, arousal, and dominance of seafarers in diverse work scenarios. According to the results, multi-modal fusion integrating EEG and ship navigation features can effectively recognize the emotional states of seafarers. Based on the improved D-S evidence theory and calibration, a new fusion model for SER is proposed, demonstrating effective performance improvement compared with the single models and existing methods. The average recognition performance across the three emotional dimensions, as measured by accuracy, precision, recall, and F1 score, is 85.14%, 84.43%, 86.27%, and 85.33%, respectively. Therefore, the proposed method can effectively enhance the performance of SER.
The state of seafarers directly affects navigation operations. For shipping companies, the early identification of abnormal emotional states combined with proactive preventive measures can significantly mitigate risks caused by human errors. In light of the aforementioned, the findings of this paper can be incorporated into a bridge system to support normal daily operation and can help develop policies on human factors of maritime safety.
The proposed method has limitations though. This paper focuses on a case study of a specific ship. Insufficient sample size and incomplete data collection are the main limitations of this study. In the future, a larger scale of data collection covering different types of ships and exploration of additional factors affecting the physiological state of seafarers will be implemented to comprehensively identify the emotional states of seafarers.

Author Contributions

Conceptualization, L.Y., P.F. and J.Y.; Data curation, J.Y., C.C. and M.L.; Formal analysis, J.Y., L.Y. and P.F.; Funding acquisition, L.Y., P.F. and Q.L.; Investigation, J.Y., C.C. and M.L.; Methodology, J.Y., L.Y., P.F. and Q.L.; Project administration, P.F. and Q.L.; Software, J.Y.; Supervision, L.Y., P.F. and Q.L.; Validation, J.Y.; Visualization, J.Y.; Writing—original draft, L.Y., J.Y.; Writing—review & editing, L.Y., P.F. and Q.L. All authors have read and agreed to the published version of the manuscript.

Funding

This work was supported by the Science and Technology Innovation and Demonstration Project of Department of Transport of Yunnan Province, China (YNZC2024-G3-04393-YNZZ-0391), Hubei International Science and Technology Cooperation Project (2024EHA038), Self-Innovation Foundation of State Key Laboratory of Maritime Technology and Safety (104972024KFYd0020, SKL202401) and the Research and development Project of China COSCO Shipping Corporation Limited (2023-2-Z004-01).

Institutional Review Board Statement

Not applicable.

Informed Consent Statement

Not applicable.

Data Availability Statement

The data presented in this study are available on request from the corresponding author (Peng Fei) due to privacy/ethical restrictions.

Conflicts of Interest

The authors declare no conflicts of interest.

Abbreviations

The following abbreviations are used in this manuscript:
ERemotion recognition
SERseafarers’ emotion recognition

Appendix A

Table A1. The nomenclature of variables for an improved D-S weight fusion strategy.
d(E1, E2)The distance between the probability output vectors of two machine learning models
DConfidence distance matrix of the distance between the probability outputs of various machine learning models
||Ei||2Inner product of the probability output vector of a machine learning model
sSimilarity between probability output vectors of machine learning models
SSimilarity matrix between probability output vectors of machine learning models
R(Ei)The degree of a single probability output (evidence) is supported by other ones
wiWeight of the ith machine learning model

References

  1. Chen, D.; Pei, Y.; Xia, Q. Research on human factors cause chain of ship accidents based on multidimensional association rules. Ocean. Eng. 2020, 218, 107717. [Google Scholar] [CrossRef]
  2. Heij, C.; Knapp, S. Predictive Power of Inspection Outcomes for Future Shipping Accidents—An Empirical Appraisal with Special Attention for Human Factor Aspects. Marit. Policy Manag. 2018, 45, 604–621. [Google Scholar] [CrossRef]
  3. Wróbel, K. Searching for the origins of the myth 80% human error impact on maritime safety. Reliab. Eng. Syst. Saf. 2021, 216, 107942. [Google Scholar] [CrossRef]
  4. AGCS, Safety and Shipping Review 2022. Retrieved May 10, 2022 [EB/OL]. Available online: https://www.allianz.com/en/mediacenter/news/studies/220510_Allianz-AGCS-PressRelease-Safety-Shipping-Review-2022.html (accessed on 17 August 2025).
  5. Fan, S.; Yan, X.; Zhang, J.; Wang, J. A review on human factors in maritime transportation using seafarers’ physiological data. In Proceedings of the 2017 4th International Conference on Transportation Information and Safety (ICTIS), Banff, AB, Canada, 8–10 August 2017; pp. 104–110. [Google Scholar] [CrossRef]
  6. Sánchez-González, A.; Díaz-Secades, L.A.; García-Fernández, J.; Menéndez-Teleña, D. Screening for anxiety, depression and poor psychological well-being in Spanish seafarers: An empirical study of the cut-off points on three measures of psychological functioning. Ocean Eng. 2024, 309, 118572. [Google Scholar] [CrossRef]
  7. Bedyńska, S.; Żołnierczyk-Zreda, D. Stereotype threat as a determinant of burnout or work engagement: Mediating role of positive and negative emotions. Int. J. Occup. Saf. Ergon. 2015, 21, 1–8. [Google Scholar] [CrossRef]
  8. Dzedzickis, A.; Kaklauskas, A.; Bucinskas, V. Human Emotion Recognition: Review of Sensors and Methods. Sensors 2020, 20, 592. [Google Scholar] [CrossRef] [PubMed]
  9. Morris, J.D. SAM: The Self-Assessment Manikin: An Efficient Cross-Cultural Measurement of Emotional Response. J. Advert. Res. 1995, 35, 63–68. [Google Scholar] [CrossRef]
  10. Zimmermann, P.; Guttormsen, S.; Danuser, B.; Gomez, P. Affective computing—A rationale for measuring mood with mouse and keyboard. Int. J. Occup. Saf. Ergon. 2003, 9, 539–551. [Google Scholar] [CrossRef]
  11. Liu, Y.; Sourina, O. Real-Time Subject-Dependent EEG-Based Emotion Recognition Algorithm. In Transactions on Computational Science XXIII; Springer: Berlin/Heidelberg, Germany, 2014; pp. 199–223. [Google Scholar] [CrossRef]
  12. Hou, X.; Liu, Y.; Lim, W.L.; Lan, Z.; Sourina, O.; Mueller-Wittig, W.; Wang, L. CogniMeter: EEG-Based Brain States Monitoring. In Transactions on Computational Science XXVIII; Lecture Notes in Computer Science; Springer: Berlin/Heidelberg, Germany, 2016; pp. 108–126. [Google Scholar] [CrossRef]
  13. Chanel, G.; Rebetez, C.; Bétrancourt, M.; Pun, T. Emotion Assessment From Physiological Signals for Adaptation of Game Difficulty. IEEE Trans. Syst. Man Cybern. Syst. 2011, 41, 1052–1063. [Google Scholar] [CrossRef]
  14. Fan, S.; Zhang, J.; Blanco-Davis, E.; Yang, Z.; Wang, J.; Yan, X. Effects of seafarers’ emotion on human performance using bridge simulation. Ocean Eng. 2018, 170, 111–119. [Google Scholar] [CrossRef]
  15. Žagar, D.; Dimc, F. E-navigation: Integrating physiological readings within the ship’ s bridge infrastructure. Transp. Res. Procedia 2025, 83, 343–348. [Google Scholar] [CrossRef]
  16. Zhang, W.; Jiang, W.; Liu, Q.; Wang, W. AIS data repair model based on generative adversarial network. Reliab. Eng. Syst. Saf. 2023, 240, 109572. [Google Scholar] [CrossRef]
  17. Ma, J.; Li, W.; Jia, C.; Zhang, C.; Zhang, Y. Risk Prediction for Ship Encounter Situation Awareness Using Long Short-Term Memory Based Deep Learning on Intership Behaviors. J. Adv. Transp. 2020, 2020, 8897700. [Google Scholar] [CrossRef]
  18. Zhao, J.; Chen, Y.; Zhou, Z.; Zhao, J.; Wang, S.; Chen, X. Extracting vessel speed based on machine learning and drone images during ship traffic flow prediction. J. Adv. Transp. 2022, 2022, 3048611. [Google Scholar] [CrossRef]
  19. Kim, H.; Hong, T. Enhancing emotion recognition using multimodal fusion of physiological, environmental, personal data. Expert Syst. Appl. 2024, 249, 123723. [Google Scholar] [CrossRef]
  20. Khaleghi, B.; Khamis, A.; Karray, F.O.; Razavi, S.N. Multisensor Data Fusion: A Review of the State-of-the-Art. Inf. Fusion 2013, 14, 28–44. [Google Scholar] [CrossRef]
  21. Folgado, D.; Barandas, M.; Famiglini, L.; Santos, R.; Cabitza, F.; Gamboa, H. Explainability meets uncertainty quantification: Insights from feature-based model fusion on multimodal time series. Inf. Fusion 2023, 100, 101955. [Google Scholar] [CrossRef]
  22. Deng, Y. Generalized evidence theory. Appl. Intell. 2015, 43, 530–543. [Google Scholar] [CrossRef]
  23. Filho, T.; Song, H.; Perello-Nieto, M.; Santos-Rodriguez, R.; Kull, M.; Flach, P. Classifier Calibration: A survey on how to assess and improve predicted class probabilities. Mach. Learn. 2023, 112, 3211–3260. [Google Scholar] [CrossRef]
  24. Fan, S.; Blanco-Davis, E.; Fairclough, S.; Zhang, J.; Yan, X.; Wang, J.; Yang, Z. Incorporation of seafarer psychological factors into maritime safety assessment. Ocean. Coast. Manag. 2023, 237, 106515. [Google Scholar] [CrossRef]
  25. Liu, Y.; Hou, X.; Sourina, O.; Konovessis, D.; Krishnan, G. EEG-based human factors evaluation for maritime simulator-aided assessment. In Proceedings of the 3rd International Conference on Maritime Technology and Engineering (MARTECH 2016), Lisbon, Portugal, 4–6 July 2016; CRC Press: Boca Raton, FL, USA; pp. 859–864. [Google Scholar] [CrossRef]
  26. Wang, Z.; Zhang, J.; Mao, Z.; Fan, S.; Wang, Z.; Wang, H. Emotional State Evaluation during Collision Avoidance Operations of Seafarers Using Ship Bridge Simulator and Wearable EEG. In Proceedings of the 6th International Conference on Transportation Information and Safety (ICTIS) 2021, Wuhan, China, 22–24 October 2021; pp. 415–422. [Google Scholar] [CrossRef]
  27. Shi, K.; Weng, J.; Fan, S.; Yang, Z.; Ding, H. Exploring seafarers’ emotional responses to emergencies: An empirical study using a ship handling simulator. Ocean Coast Manag. 2023, 243, 106736. [Google Scholar] [CrossRef]
  28. Lim, W.L.; Liu, Y.; Subramaniam, S.C.H.; Liew, S.H.P.; Krishnan, G.; Sourina, O.; Wang, L. EEG-Based Mental Workload and Stress Monitoring of Crew Members in Maritime Virtual Simulator. In Transactions on Computational Science XXXII: Special Issue on Cybersecurity and Biometrics; Springer: Berlin/Heidelberg, Germany, 2018; pp. 15–28. [Google Scholar] [CrossRef]
  29. Koelstra, S.; Muhl, C.; Soleymani, M.; Lee, J.S.; Yazdani, A.; Ebrahimi, T.; Pun, T.; Nijholt, A.; Patras, I. Deap: A database for emotion analysis; using physiological signals. IEEE Trans. Affective Comput. 2011, 3, 18–31. [Google Scholar] [CrossRef]
  30. Wen, H.; Gao, B.; Yang, D.; Zhang, Y.; Huang, L.; Woo, W.L. Wearable Integrated Online Fusion Learning Filter for Heart PPG Sensing Tracking. IEEE Sensors. J. 2023, 23, 14938–14949. [Google Scholar] [CrossRef]
  31. Ma, Y.; Liu, Q.; Yang, L. Machine learning-based multimodal fusion recognition of passenger ship seafarers’ workload: A case study of a real navigation experiment. Ocean. Eng. 2024, 300, 117346. [Google Scholar] [CrossRef]
  32. Albuquerque, A.; Tiwari, M.; Parent, M.; Cassani, R.; Gagnon, J.-F.; Lafond, D.; Falk, T.H. WAUC: A Multi-Modal Database for Mental Workload Assessment Under Physical Activity. Front. Neurosci. 2020, 14, 549524. [Google Scholar] [CrossRef]
  33. Yang, L.; Li, L.; Liu, Q.; Ma, Y.; Liao, J. Influence of physiological, psychological and environmental factors on passenger ship seafarer fatigue in real navigation environment. Saf. Sci. 2023, 168, 106293. [Google Scholar] [CrossRef]
  34. Wan, Z.; Yang, R.; Huang, M.; Zeng, N.; Liu, X. A review on transfer learning in EEG signal analysis. Neurocomputing 2021, 421, 1–14. [Google Scholar] [CrossRef]
  35. Kittler, J.; Hatef, M.; Duin, R.P.W.; Matas, J. On combining classifiers. IEEE Trans. Pattern Anal. Mach. Intell. 1998, 20, 226–239. [Google Scholar] [CrossRef]
  36. Mohandes, M.; Deriche, M.; Aliyu, S.O. Classifiers Combination Techniques: A Comprehensive Review. IEEE Access 2018, 6, 19626–19639. [Google Scholar] [CrossRef]
  37. Toufiq, R.; Islam, M.R. Face recognition system using soft-output classifier fusion method. In Proceedings of the 2016 2nd International Conference on Electrical, Computer & Telecommunication Engineering (ICECTE), Rajshahi, Bangladesh, 8–10 December 2016; pp. 1–4. [Google Scholar] [CrossRef]
  38. Muhlbaier, M.D.; Topalis, A.; Polikar, R. Learn++NC: Combining Ensemble of Classifiers With Dynamically Weighted Consult-and-Vote for Efficient Incremental Learning of New Classes. IEEE Trans. Neural Netw. 2009, 20, 152–168. [Google Scholar] [CrossRef]
  39. Chitroub, C.; Salim, S. Classifier combination and score level fusion: Concepts and practical aspects. Int. J. Image Data Fusion 2010, 1, 113–135. [Google Scholar] [CrossRef]
  40. Han, D.Q.; Han, C.Z.; Yang, Y. Combination of heterogeneous multiple classifiers based on evidence theory. In Proceedings of the 2007 International Conference on Wavelet Analysis and Pattern Recognition (ICWAPR), Beijing, China, 2–4 November 2007; pp. 573–578. [Google Scholar] [CrossRef]
  41. Shi, C. A Novel Ensemble Learning Algorithm Based on D-S Evidence Theory for IoT Security. Comput. Mater. Contin. 2018, 57, 635–652. [Google Scholar] [CrossRef]
  42. Qiu, D.; Li, X.; Xue, Y.; Fu, K.; Zhang, W.; Shao, T.; Fu, Y. Analysis and prediction of rockburst intensity using improved D-S evidence theory based on multiple machine learning algorithms. Tunn. Undergr. Space Technol. 2023, 140, 105331. [Google Scholar] [CrossRef]
  43. Ghosh, M.; Dey, A.; Kahali, S. Type-2 fuzzy blended improved D-S evidence theory based decision fusion for face recognition. Appl. Soft Comput. 2022, 125, 109179. [Google Scholar] [CrossRef]
  44. Yi, D.; Su, J.; Liu, C.; Quddus, M.; Chen, W. A machine learning based personalized system for driving state recognition. Transp. Res. Part C Emerg. Technol. 2019, 105, 241–261. [Google Scholar] [CrossRef]
  45. Knapp, S.; Velden, M. Exploration of Machine Learning Methods for Maritime Risk Predictions. Marit. Policy Manag. 2024, 51, 1443–1473. [Google Scholar] [CrossRef]
  46. Peng, W.; Bai, X.; Yang, D.; Yuen, K.F.; Wu, J. A Deep Learning Approach for Port Congestion Estimation and Prediction. Marit. Policy Manag. 2023, 50, 835–860. [Google Scholar] [CrossRef]
  47. Zhao, Q.; Yang, L.; Lyu, N. A driver stress detection model via data augmentation based on deep convolutional recurrent neural network. Expert Syst. Appl. 2024, 238, 122056. [Google Scholar] [CrossRef]
  48. Guo, C.; Pleiss, G.; Sun, Y.; Weinberger, K.Q. On Calibration of Modern Neural Networks. In Proceedings of the 34th International Conference on Machine Learning (ICML), Sydney, Australia, 6–11 August 2017; PMLR 70; pp. 1321–1330. [Google Scholar] [CrossRef]
  49. Jousselme, A.L.; Grenier, D.; Bossé, É. A new distance between two bodies of evidence. Inf. Fusion 2001, 2, 91–101. [Google Scholar] [CrossRef]
  50. Zhang, J.; Chen, P. Selection of optimal EEG electrodes for human emotion recognition. IFAC-PapersOnLine 2020, 53, 10229–10235. [Google Scholar] [CrossRef]
  51. Zhu, Q.; Zheng, C.; Zhang, Z.; Shao, W.; Zhang, D. Dynamic confidence-aware multi-modal emotion recognition. IEEE Trans. Affective Comput. 2023, 15, 1358–1370. [Google Scholar] [CrossRef]
  52. Fan, J.; Yan, J.; Xiong, Y.; Shu, Y.; Fan, X.; Wang, Y.; He, Y.; Chen, J. Characteristics of real-world ship energy consumption and emissions based on onboard testing. Mar. Pollut. Bull. 2023, 194, 115411. [Google Scholar] [CrossRef] [PubMed]
  53. Li, W.; Zeng, G.; Zhang, J.; Xu, Y.; Xing, Y.; Zhou, R.; Guo, G.; Shen, Y.; Cao, D.; Wang, F. Cogemonet: A cognitive-feature-augmented driver emotion recognition model for smart cockpit. IEEE Trans. Comput. Social Syst. 2021, 9, 667–678. [Google Scholar] [CrossRef]
  54. He, H.; Bai, Y.; Garcia, E.A.; Li, S. ADASYN: Adaptive synthetic sampling approach for imbalanced learning. In Proceedings of the 2008 IEEE International Joint Conference on Neural Networks (IJCNN), Hong Kong, China, 1–8 June 2008; pp. 1322–1328. [Google Scholar] [CrossRef]
  55. Frenkel, L.; Goldberger, J. Network calibration by temperature scaling based on the predicted confidence. In Proceedings of the 2022 30th European Signal Processing Conference (EUSIPCO), Belgrade, Serbia, 29 August–2 September 2022; pp. 1586–1590. [Google Scholar] [CrossRef]
  56. Yang, L.; Zhao, Q. An aggressive driving state recognition model using EEG based on stacking ensemble learning. J. Transp. Saf. Secur. 2024, 16, 271–292. [Google Scholar] [CrossRef]
  57. Wang, J.; Ma, H.; Yan, X. Rockburst Intensity Classification Prediction Based on Multi-Model Ensemble Learning Algorithms. Mathematics 2023, 11, 838. [Google Scholar] [CrossRef]
  58. Yin, X.; Liu, Q.; Pan, Y.; Huang, X.; Wu, J.; Wang, X. Strength of Stacking Technique of Ensemble Learning in Rockburst Prediction with Imbalanced Data: Comparison of Eight Single and Ensemble Models. Nat. Resour. Res. 2021, 30, 1795–1815. [Google Scholar] [CrossRef]
Figure 1. Seafarer emotion recognition architecture based on the improved D-S theory.
Applsci 15 09253 g001
Figure 2. Experimental Equipment. EEG sensor (a), SAM scale (b).
Applsci 15 09253 g002
Figure 3. Emotional model and sample points. (a) VAD emotion model. (b) A sample of a subject’s emotion scoring during a navigation watch.
Applsci 15 09253 g003
Figure 4. Test ship [52] (Reproduced with permission of Ref. 52, Copyright of ©2025 Elsevier Ltd.).
Applsci 15 09253 g004
Figure 5. Testing route [52] (Reproduced with permission of Ref. 52, Copyright of ©2025 Elsevier Ltd.).
Applsci 15 09253 g005
Figure 6. The experimental procedure and the participant: (a) procedure, (b) the seafarer maneuvering the ship.
Applsci 15 09253 g006
Figure 7. EEG segment of participant 1 in a voyage.
Applsci 15 09253 g007
Figure 8. The variation of data before and after oversampling.
Applsci 15 09253 g008
Figure 9. The comparison between the fusion model and optimal single models. (a) Accuracy, (b) Precision, (c) Recall, (d) F1score, (e) AUC. (Model explanation: Multilayer Perceptron (MLP). Support Vector Machine (SVM). Random Forest (RF)).
Applsci 15 09253 g009
Table 1. Differences in calibration methods.
Types of ScenariosDescriptionAdvantageDrawbackApplication Scope
Empirical binningThe probability predictions are divided into different interval bins.Simple and intuitive, no need for complex modellingThe number of bins and the choice of boundaries are not easy to determine.Small to medium datasets
Isotonic calibrationAdjusting probabilities based on the monotonic relationship between predicted and actual probabilitiesHighly flexible to handle complex non-linear distortionsRequiring more data to prevent over-fitting.
Higher computational complexity
Medium to large datasets.
Sigmoid calibrationAdjusting probabilities using logistic regression Fewer parameters. Efficient calculationUnable to handle non-monotonic problems.
Sensitive to category imbalance
Binary classification tasks, small datasets, or scenarios requiring lightweight calibration
Beta calibrationThree-parameter model based on the beta distribution, allowing asymmetric tuningApplicable for skewed distributions.Still limited by parametric form.
Requires medium-sized data
Binary classification, cases with large differences in the distribution of classes.
Temperature scaling Introducing the parameter T in softmax, scaling logits to adjust the confidence level.Fewer parameters. Computationally efficient.Global adjustments only, limited effect on complex calibration problemsNeural networks, scenarios that require fast calibration and preservation of predictive order relationships
Table 2. Main ship technical parameters.
ParameterValue
Ship typeLPG tanker
Year of manufacture2021
Length88 m
Depth5.6 m
Width16 m
Design draft4.2 m
Deadweight tonnage2693 t
Rated speed150 r/min
Main engine power2 × 600 kw
Table 3. Experimental scenarios.
Types of ScenariosDetailed Description
Normal navigationNo specific scenario occurs within 15minutes.
Exchange information and ship operates normal.
Overtaking shipsOvertake the ships ahead
Exchange information.
Normal turnThe helmsman steers the ship.
Exchange information when encountering ships.
Sailors keep watching.
Passing under bridgesThe helmsman steers the ship. The bridge team maintains a proper look-out by sight and hearing as well as other available means, to ensure safe passage.
Exchange information.
Change lanes under complex conditionsThe captain intervenes. Seafarers act by order of the captain.
Special maneuvering turns with high
navigational difficulty
The captain intervenes. Seafarers act by order of the captain.
Table 4. The preliminary results on the test set (%).
ModelValence Arousal Dominance
Acc (%)Precision (%)Recall (%)F1 (%)AUCAcc (%)Precision (%)Recall (%)F1 (%)AUCAcc (%)Precision (%)Recall (%)F1 (%)AUC
ELM71.4375.0270.2072.530.7373.5773.4567.6370.420.7282.5083.2684.2383.740.83
RBF72.3567.6074.8571.040.7472.8665.4271.5768.350.7283.3383.9781.5782.750.81
MLP77.6878.6780.1579.340.8183.4584.2586.8585.530.8479.1779.5176.3277.880.80
XGB76.7977.5374.9076.190.7772.1481.5572.6876.920.7874.1773.9570.2872.070.72
RF80.3575.5781.8578.580.8080.7185.3980.7783.010.8476.6775.8171.3573.580.73
LGBM77.6877.8370.1573.790.7475.0074.2082.3378.050.7974.1773.8469.4271.560.71
KNN75.8975.6079.9077.690.7676.4377.4283.2780.230.8075.8372.9067.5370.100.70
SVM75.8979.1468.2073.330.7882.1482.1875.6279.330.7984.1784.1985.3284.750.85
Table 5. Comparison of Binary-ECE before and after calibration.
ModelValenceArousalDominanceMethod
BeforeAfterBeforeAfterBeforeAfter
SVM0.1120.0810.1680.0570.1470.108Sigmoid calibration
RF0.1610.0710.1740.1400.1540.144Sigmoid calibration
MLP0.2100.1440.2090.1630.2100.142Temperature scaling
Table 6. Statistical tests for comparing the classification performance of the Top 3 models and the D-S fusion model.
Paired t-TesttpCohen’s d
D-S fusion & SVM6.535<0.0012.067
D-S fusion & MLP13.769<0.0014.353
D-S fusion & RF10.614<0.0013.362
Table 7. Comparison of the fusion model in this paper with the existing methods.
ReferenceMethodOverall Accuracy
[11]SVM72.22%
[28]Autoencoder83.24%
[27]Ensemble model84.60%
[31]BPN76.23%
[56]Stacking83.12%
[57]Stacking, voting84.88%
[58]Stacking, bagging84.10%
This paperD-S fusion model85.14%
Disclaimer/Publisher’s Note: The statements, opinions and data contained in all publications are solely those of the individual author(s) and contributor(s) and not of MDPI and/or the editor(s). MDPI and/or the editor(s) disclaim responsibility for any injury to people or property resulting from any ideas, methods, instructions or products referred to in the content.