1. Introduction
Rotating machinery constitutes critical infrastructure across industrial systems, widely employed in sectors such as energy production, manufacturing, and transportation [
1,
2,
3]. However, due to prolonged high-load operation, harsh working environments, and structural aging, various faults—such as bearing damage, gear tooth breakage, and rotor eccentricity—are likely to occur. If not diagnosed promptly, these faults can lead to equipment shutdowns, production halts, or even safety incidents, posing significant threats to system stability and operational safety. Consequently, the development of efficient, accurate, and intelligent fault diagnosis techniques for rotating machinery has emerged as a prominent research focus in engineering and smart manufacturing domains [
4,
5,
6].
The evolution of fault diagnosis techniques can be broadly categorized into three key stages: model-based approaches [
7], knowledge-based methods [
8], and, more recently, data-driven techniques [
9,
10]. The first stage relies on physical modeling of mechanical systems, using formulations such as dynamic equations, finite element models, or transfer functions. While these approaches offer strong theoretical interpretability, their practical implementation is often hindered by the complex, nonlinear, and strongly coupled nature of rotating machinery, along with multi-source disturbances. These factors make accurate modeling challenging and limit the generalization capabilities of such models.
The second stage involves expert systems that integrate domain knowledge with rule-based reasoning, fuzzy logic, and manual inference to identify fault types. These methods offer a certain degree of practicality and interpretability. However, with the increasing complexity of industrial operations, such approaches face significant challenges, including slow knowledge updates, difficulty in model migration, and high maintenance costs due to their reliance on human expertise.
In recent years, the third stage—data-driven methods—has rapidly gained prominence, fueled by advancements in artificial intelligence, sensor technology, and big data analytics. These approaches eliminate the need for explicit physical modeling or manual feature engineering by learning directly from historical operational data. They offer notable advantages, such as modeling flexibility, adaptability, and scalability. Data-driven methods encompass both traditional machine learning algorithms—such as support vector machines (SVM), k-nearest neighbors (KNN), and decision trees—and deep learning models, including convolutional neural networks (CNN), deep belief network (DBN), long short-term memory (LSTM) networks, and gated recurrent units (GRU). Among these, deep learning has emerged as a dominant paradigm due to its powerful capabilities in automatic feature extraction and nonlinear representation learning. Extensive studies have demonstrated that deep learning models can effectively extract high-dimensional features directly from raw vibration signals, achieving excellent classification performance with minimal preprocessing. These methods utilize big data analytics and machine learning techniques, achieving breakthroughs not only in accuracy, real-time capability, and applicability but also demonstrating immense potential. Zhao et al. [
11] developed a hybrid information convolutional architecture and used this model to extract features with more distinct rows and high recognition. Their superior performance was verified through a series of experiments. Ruan et al. [
12] utilized the fault cycle and mechanical frequency (or shaft rotation frequency) information under different fault conditions to determine the input size for CNNs. Compared to traditional CNN models, this design improves diagnostic accuracy while reducing uncertainty. Additionally, Qu et al. [
13] proposed a fault diagnosis method based on an improved DBN, which was validated using an authoritative open-source dataset. Zhou et al. [
14] developed a two-stage joint denoising-driven intelligent diagnostic framework: first, coupling empirical mode decomposition with independent component analysis, followed by the use of stacked GRU as a deep classifier for fault classification. Kumar et al. [
15] enhanced fault signals and applied long short-term memory (LSTM) networks combined with GRU for gear fault diagnosis. Their results show that this combined model offers superior computational efficiency, with a diagnostic accuracy of 99.6%. Moreover, the integration of attention mechanisms enables more flexible allocation of feature weights, allowing the model to emphasize critical features while suppressing redundant information [
16].
Nevertheless, several challenges remain in existing methods. On one hand, the low-dimensional nature of raw one-dimensional (1D) vibration signals limits their capacity to represent complex fault patterns, particularly under strong noise or during early fault stages. On the other hand, single-model architectures often struggle to simultaneously capture both local and global patterns and generally exhibit limited robustness to varying operational conditions and signal interference.
To address these limitations, recent research has increasingly focused on feature reconstruction and multi-model fusion strategies. By transforming 1D vibration signals into two-dimensional (2D) representations—such as time–frequency images, phase space plots, and Gramian matrices—the expressive power of the input data can be significantly enhanced. In parallel, integrating diverse network architectures enables joint modeling of spatial, temporal, and semantic features. This hybrid modeling approach facilitates deeper fault pattern discovery and improves both classification accuracy and generalization.
Based on the above considerations, this study develops a hybrid framework for rotating machinery fault diagnosis, termed GAF-PCNN-GRU. Unlike existing approaches that typically combine a single-modality Gramian Angular Field (GAF) representation with a single CNN or a simple CNN-GRU structure, the proposed method innovatively integrates dual-modality GAF representations (GASF and GADF) with a parallel CNN (PCNN) architecture to achieve complementary spatial feature extraction. The extracted features are then modeled using a Gated Recurrent Unit (GRU) to capture temporal dependencies and further refined through a multi-head self-attention mechanism to emphasize critical fault-related features. This methodological design not only enhances feature diversity and strengthens spatial–temporal correlation modeling but also significantly improves robustness under noisy and variable operating conditions. Moreover, by organically combining multimodal feature fusion, temporal modeling, and attention mechanisms into a unified framework, the method achieves high accuracy while maintaining strong generalizability and scalability. It is not only applicable to rotating machinery fault diagnosis but also provides a generalizable paradigm for other time-series signal analysis tasks.
The main contributions of this work are summarized as follows:
(1) The GAF method is employed to convert raw one-dimensional vibration signals into two types of two-dimensional image representations: GASF and GADF, thereby constructing a dual-modality data input. This strategy fully exploits the relative phase and amplitude information embedded in the time-series signals, significantly enhancing the representational capacity and diversity of extracted features. The resulting high-dimensional complementary features effectively address the limitations of traditional approaches in capturing complex fault characteristics.
(2) A novel dual-branch parallel convolutional structure is designed at the front end of the network, in which GASF and GADF images are independently processed. This PCNN architecture enables the extraction of distinct spatial features from both modalities. Through hierarchical convolution operations, the network captures high-level semantic features such as edges, textures, and shapes, thereby improving the model’s ability to perceive complex mechanical failures.
(3) The fused features obtained from PCNN are reshaped and fed into a GRU to model temporal dependencies. Additionally, a multi-head self-attention mechanism is incorporated to further identify critical segments within the time series, enhancing the model’s sensitivity to localized and subtle fault patterns. This design significantly improves the efficiency of feature representation and the model’s discriminative capability.
(4) Extensive experiments, including baseline comparisons, cross-dataset evaluations, and noise injection tests, are conducted on two benchmark datasets (CWRU and UC). The results demonstrate that the proposed GAF-PCNN-GRU model consistently achieves high diagnostic accuracy and robustness under various operating conditions and fault types, confirming its strong adaptability and practical potential for real-world industrial deployment.
Paper organization:
Section 1 outlines the overall methodology proposed.
Section 2 discusses three foundational models: GAF, CNN, and GRU.
Section 3 constructs the fault diagnosis model.
Section 4 presents model simulations and analyses.
Section 6 concludes with discussions and future directions.
2. Overall Methodological Approach
Most existing fault diagnosis studies for rotating machinery adopt a strategy in which 1D vibration signals are first transformed into 2D images and then used as input to CNNs for feature extraction based on local textures or spectral representations. However, these approaches exhibit two main limitations: (1) the image representation is often based on a single-view transformation, resulting in limited utilization of signal information; (2) the reliance solely on CNNs neglects their inherent limitations in modeling temporal dependencies.
To address these challenges, a hybrid diagnostic architecture combining GAF-PCNN and GRU is proposed in this study. The method innovatively transforms one-dimensional vibration signals into two types of complementary two-dimensional image representations and integrates spatial feature extraction with temporal modeling to enhance both the accuracy and robustness of the diagnostic process.
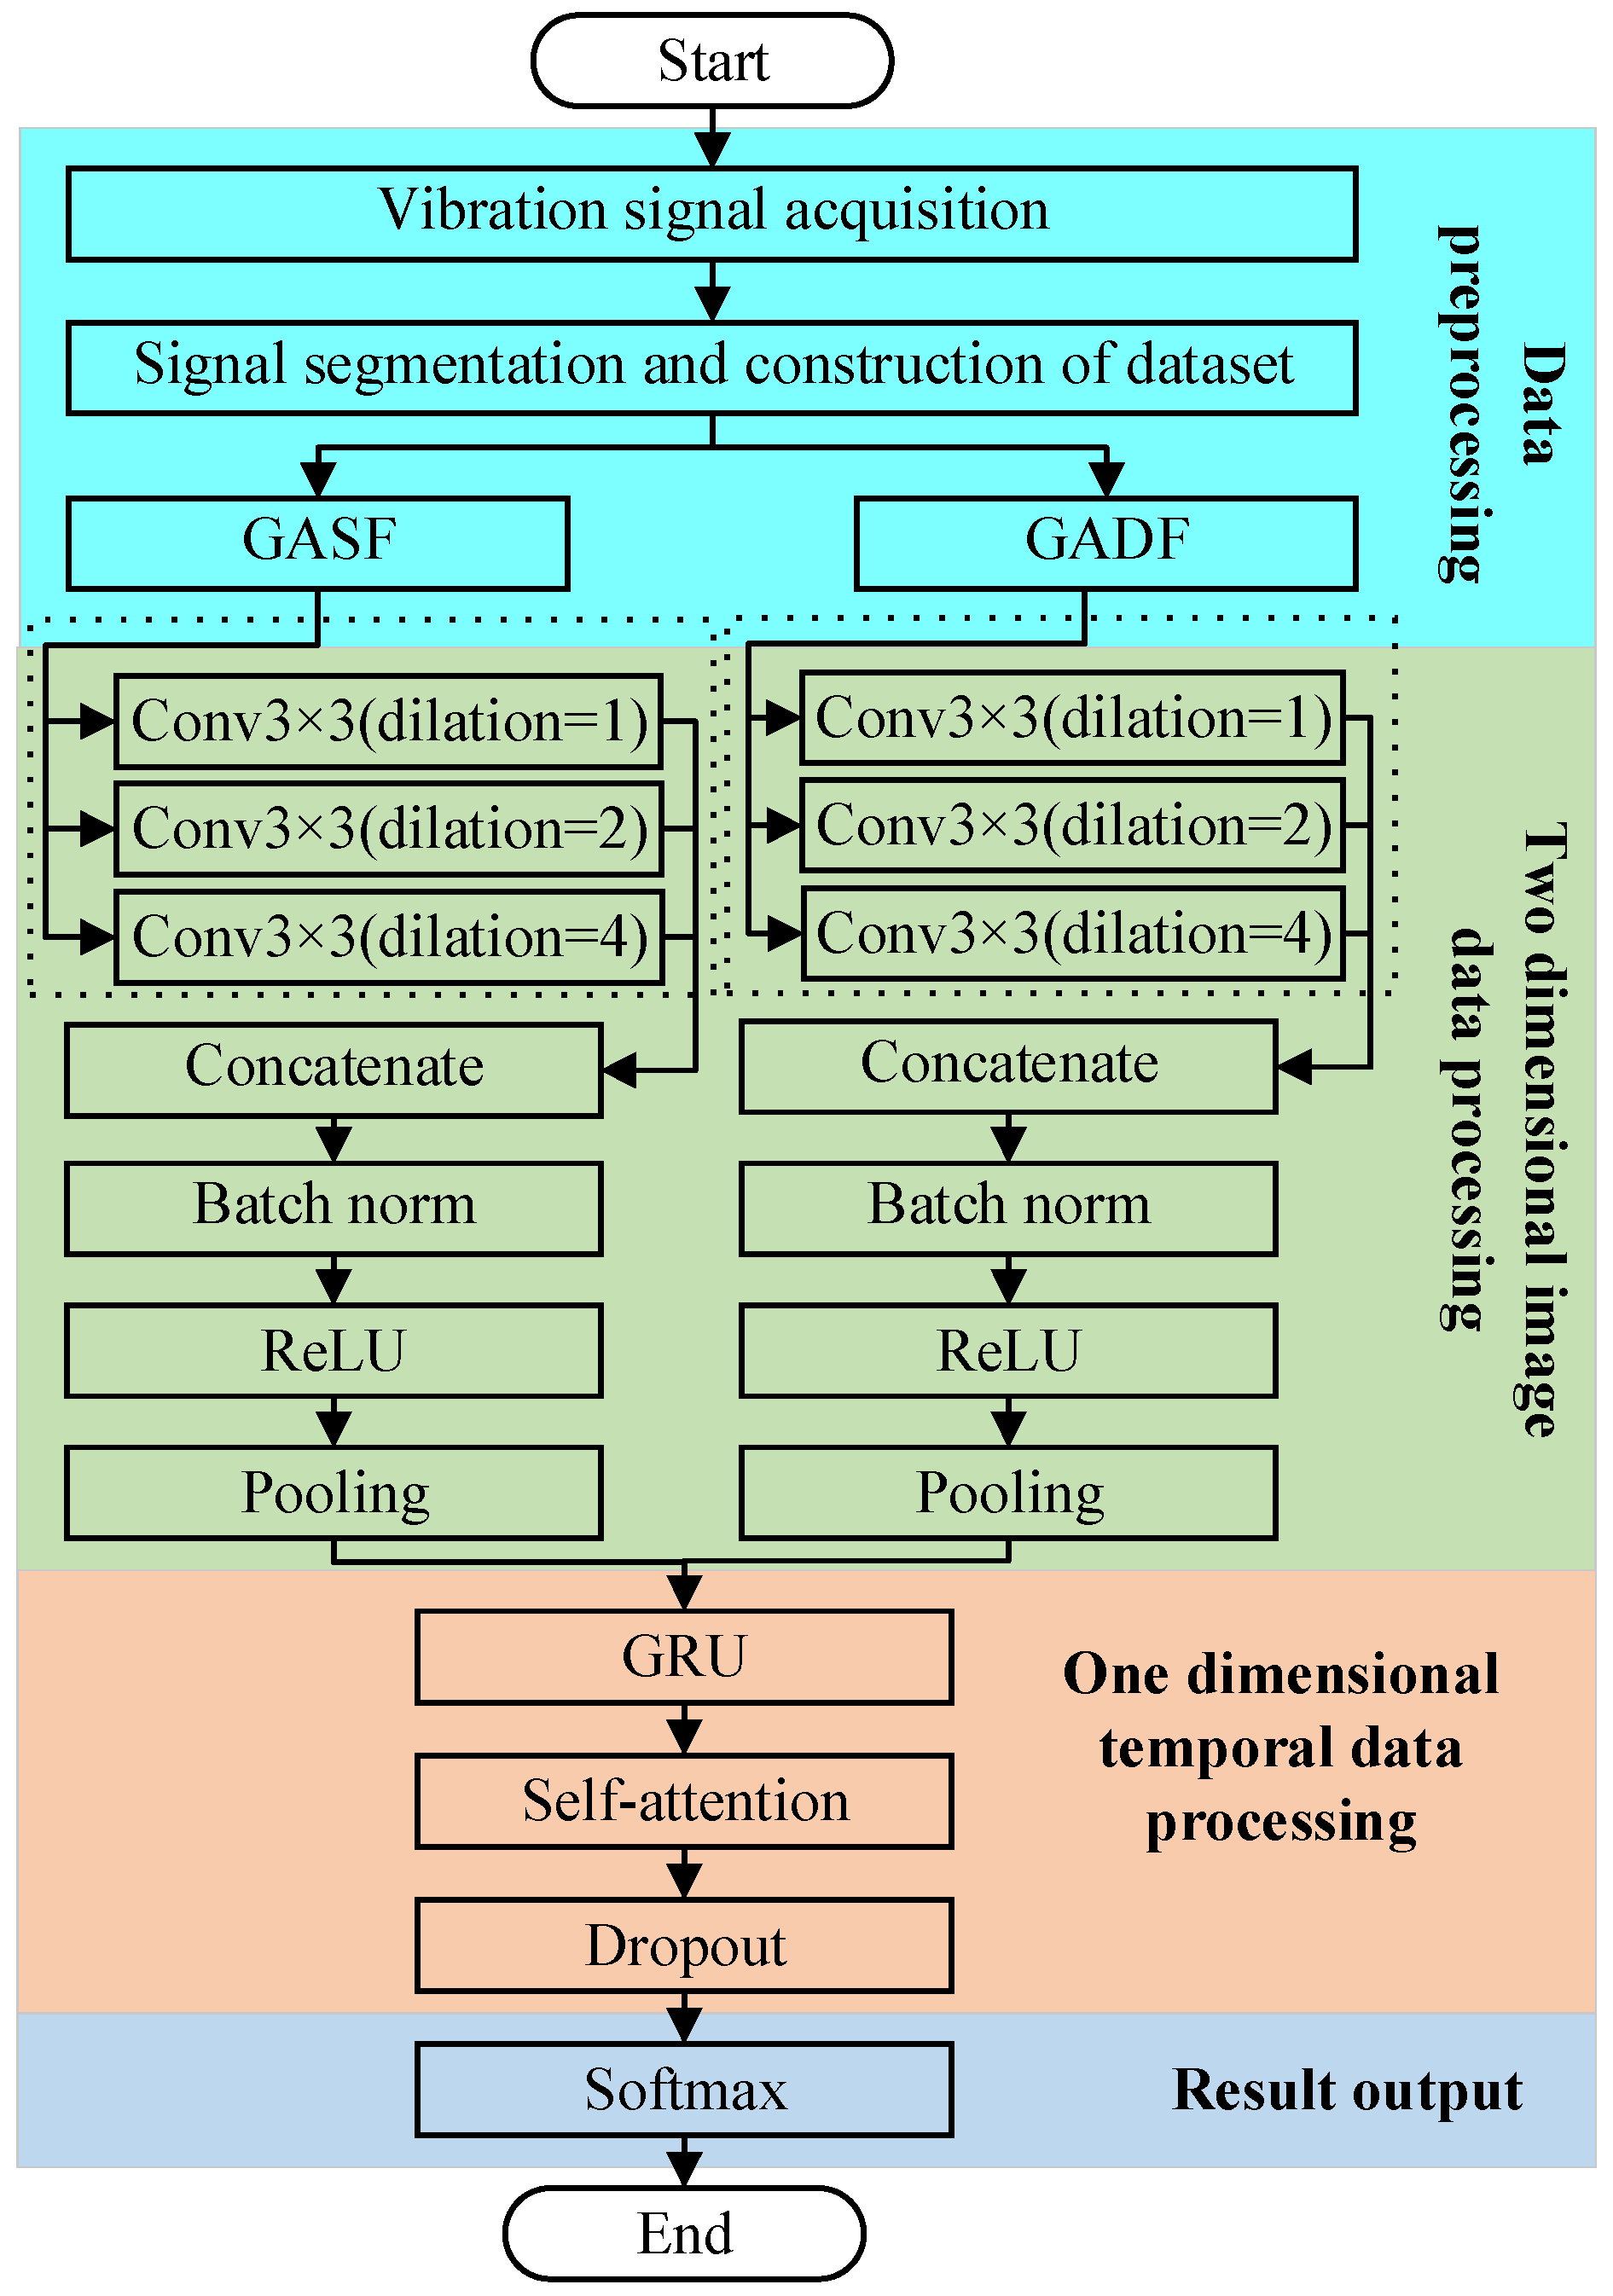
The overall architecture of the proposed model is illustrated in
Figure 1 and consists of four core functional stages. Initially, the raw vibration signal is segmented into fixed-length sub-sequences and converted into two different Gramian-based image types: GASF, which reflects the signal’s amplitude trend, and GADF, which captures the relative relationships in signal variations. This dual-channel image representation effectively addresses the insufficient expressiveness of single-image approaches by enriching the data’s semantic and structural content.
Next, the GASF and GADF images are separately fed into two parallel CNN branches with shared weights, which are responsible for extracting high-level spatial features. A layer-by-layer convolution and pooling structure is employed to improve the model’s ability to perceive complex local textures, frequency shifts, and structural patterns embedded in the images.
After spatial features are extracted from the two branches, they are fused and reshaped into sequential vectors, which are then input into a GRU network to capture temporal dependencies. A multi-head self-attention mechanism is applied to the GRU outputs to dynamically reweigh the sequence features, thereby enhancing the representation of key patterns associated with local fault sensitivity. In addition, Dropout is employed to suppress overfitting.
Finally, a Softmax classifier is used to predict the fault category based on the refined feature vector. This architecture effectively integrates enhanced image representation, spatial feature extraction, temporal modeling, and attention-based feature refinement, resulting in a highly accurate, generalizable, and noise-resilient solution for complex fault diagnosis tasks.
4. Construction of Fault Diagnosis Model
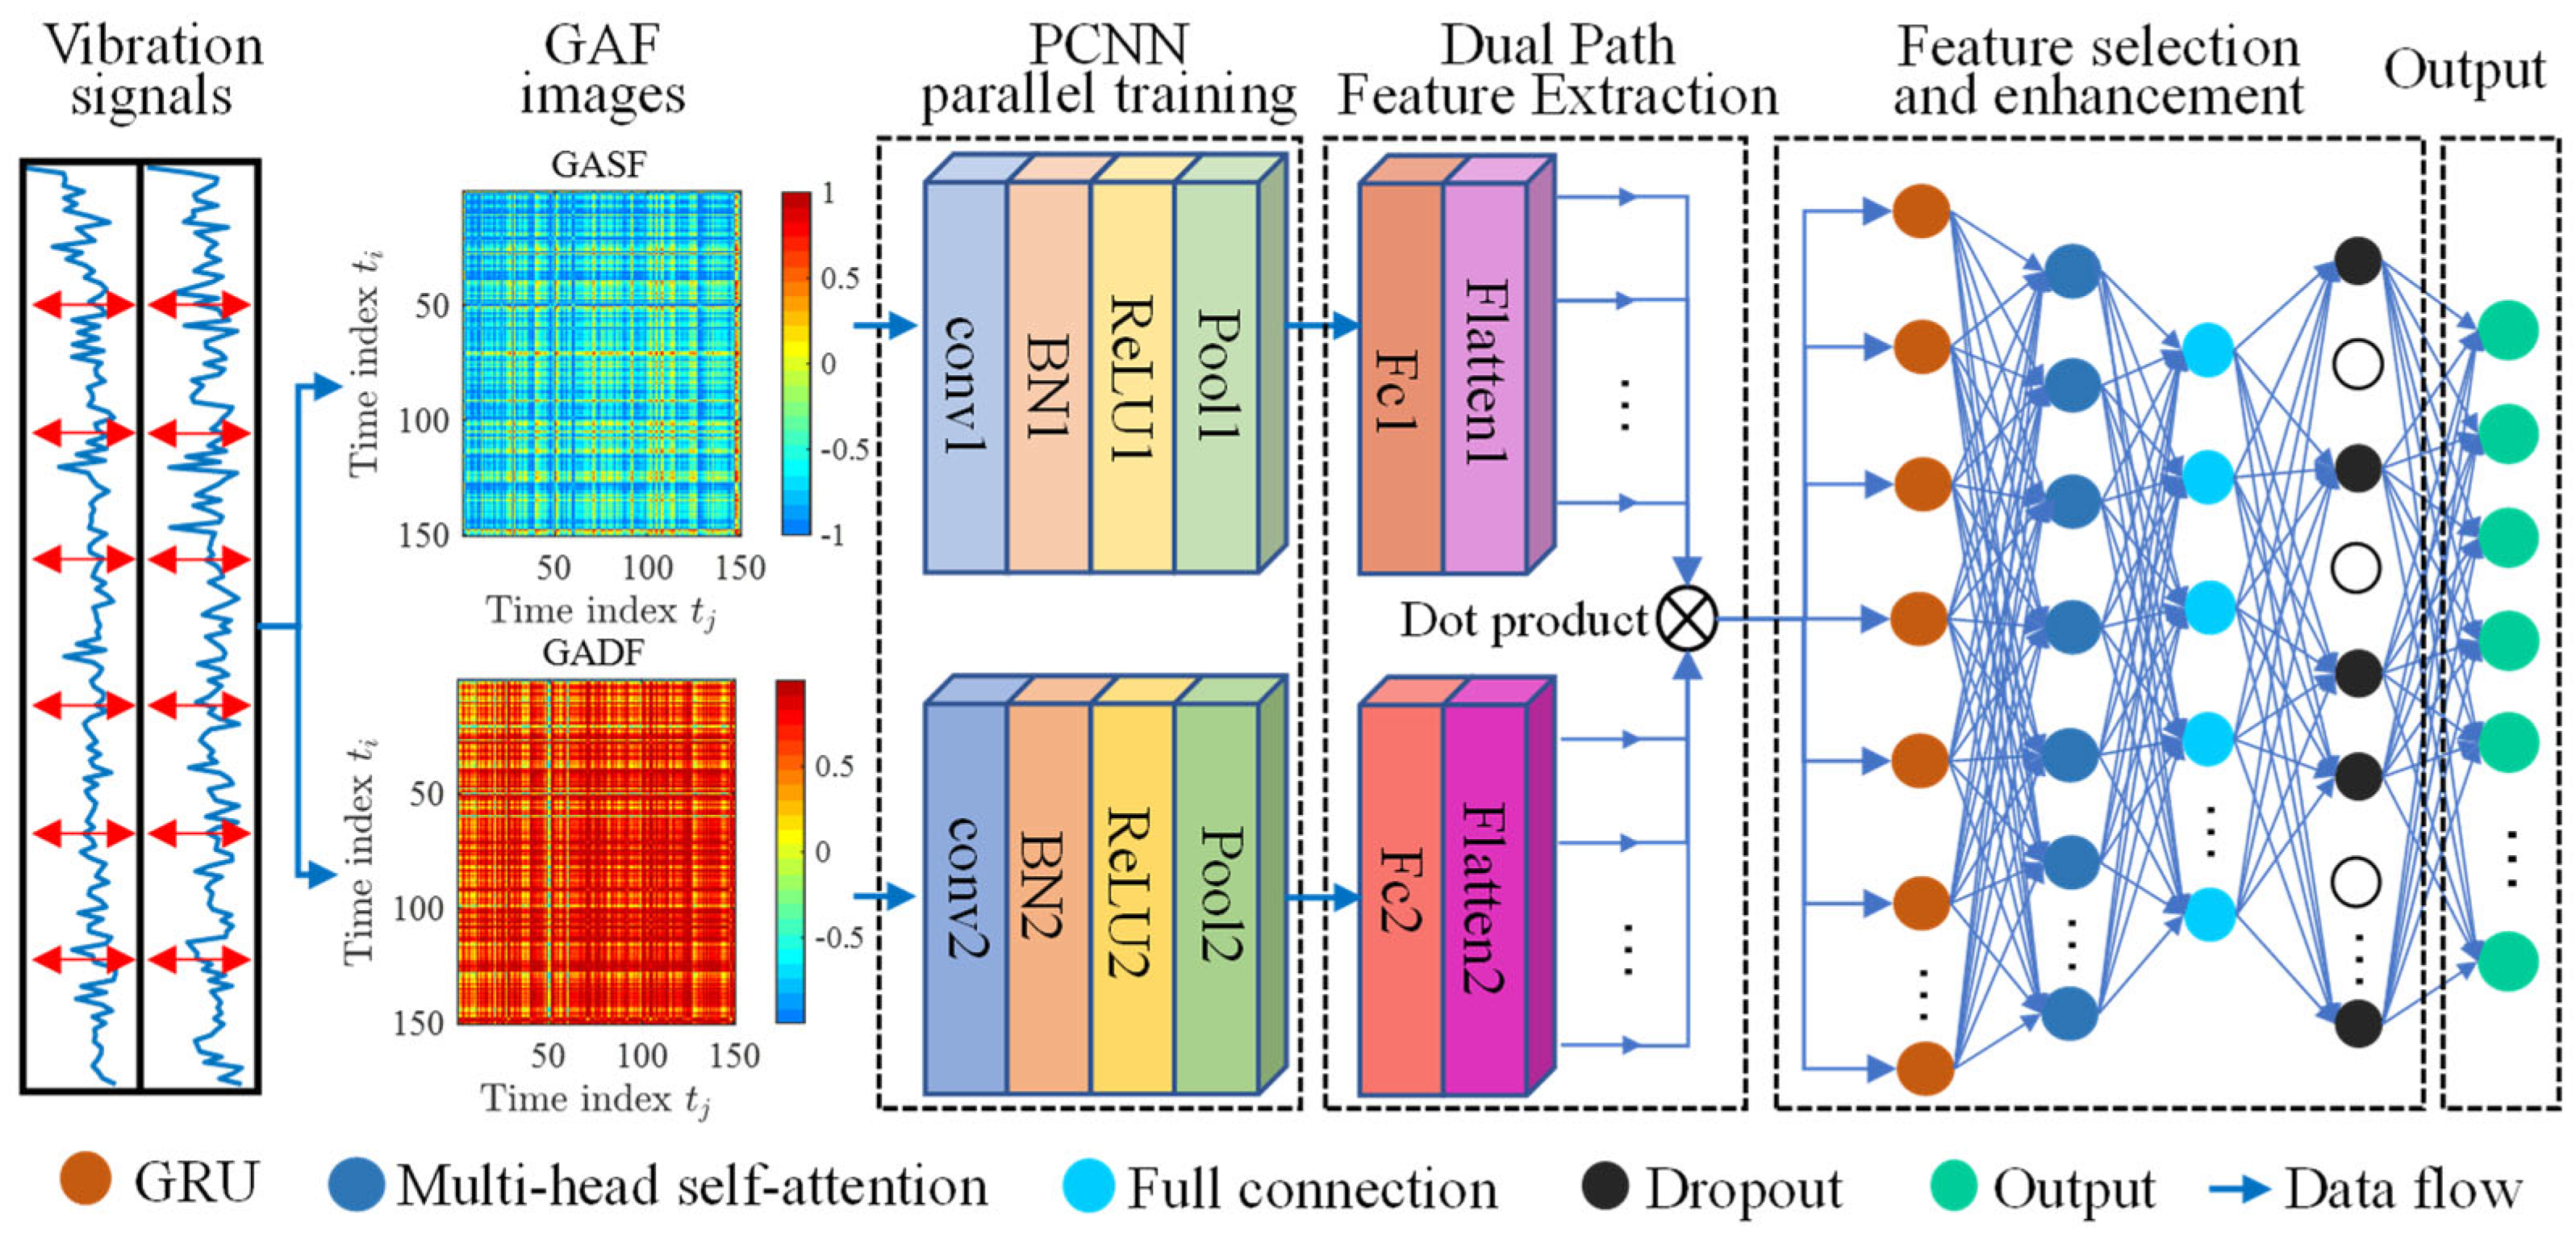
For the complex task of fault classification and recognition in rotating machinery, traditional diagnostic methods often suffer from two major limitations. First, directly inputting one-dimensional vibration signals into classification models makes it difficult to extract deep temporal features effectively. Second, while some approaches convert one-dimensional data into two-dimensional images for CNN-based processing, they typically extract only local spatial features and fail to capture the temporal dependencies inherent in vibration signals. To address these issues, a hybrid fault diagnosis model based on GAF-PCNN-GRU is proposed, as illustrated in
Figure 5.
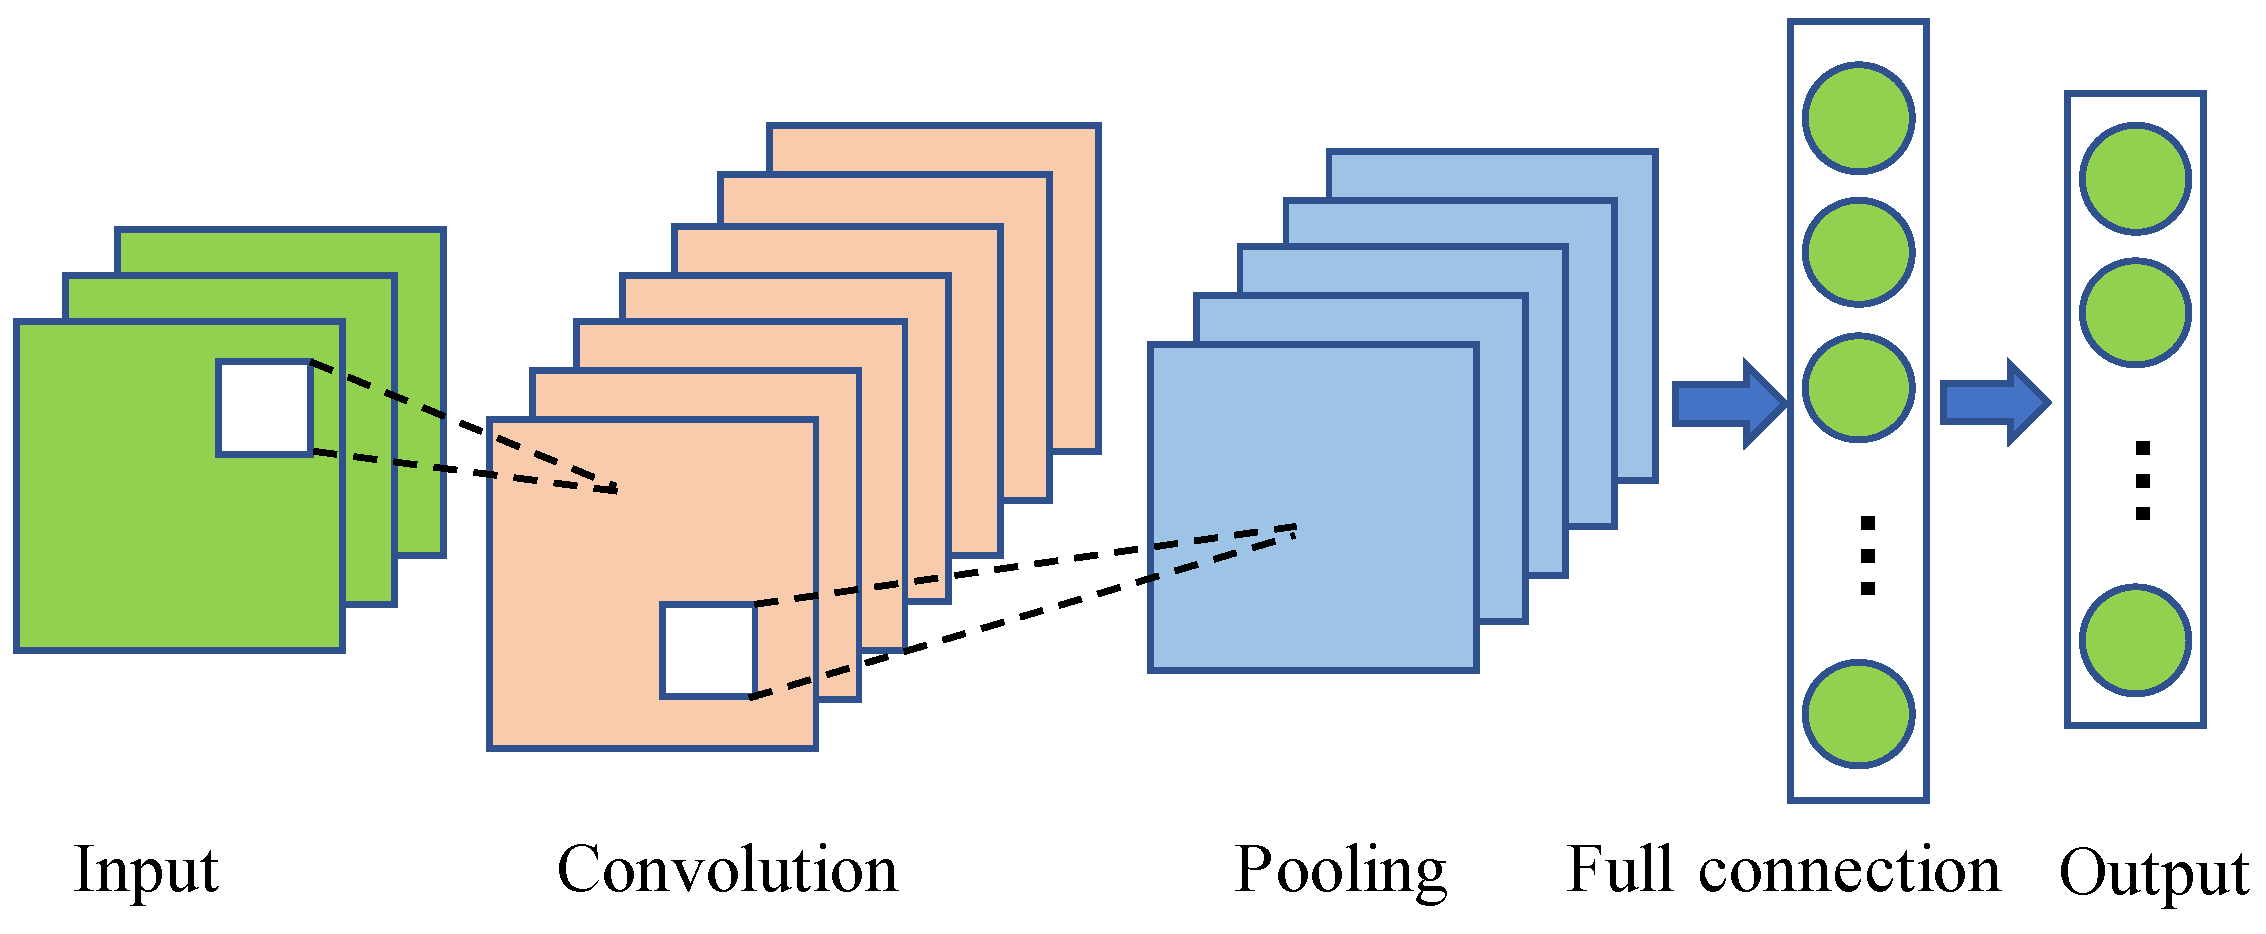
Initially, the original vibration signals are transformed into two types of GAF images—GASF and GADF—which serve as inputs to two parallel CNN branches within the PCNN structure. The use of CNNs for image processing enables the effective extraction of high-level spatial features, such as edges, textures, and local structures. Through multiple layers of convolution and pooling, the receptive field is expanded while the feature dimensionality is significantly reduced, thereby lowering computational complexity and mitigating the risk of overfitting. Subsequently, the feature maps extracted from the two CNN branches are fused via element-wise multiplication to obtain a unified feature tensor.
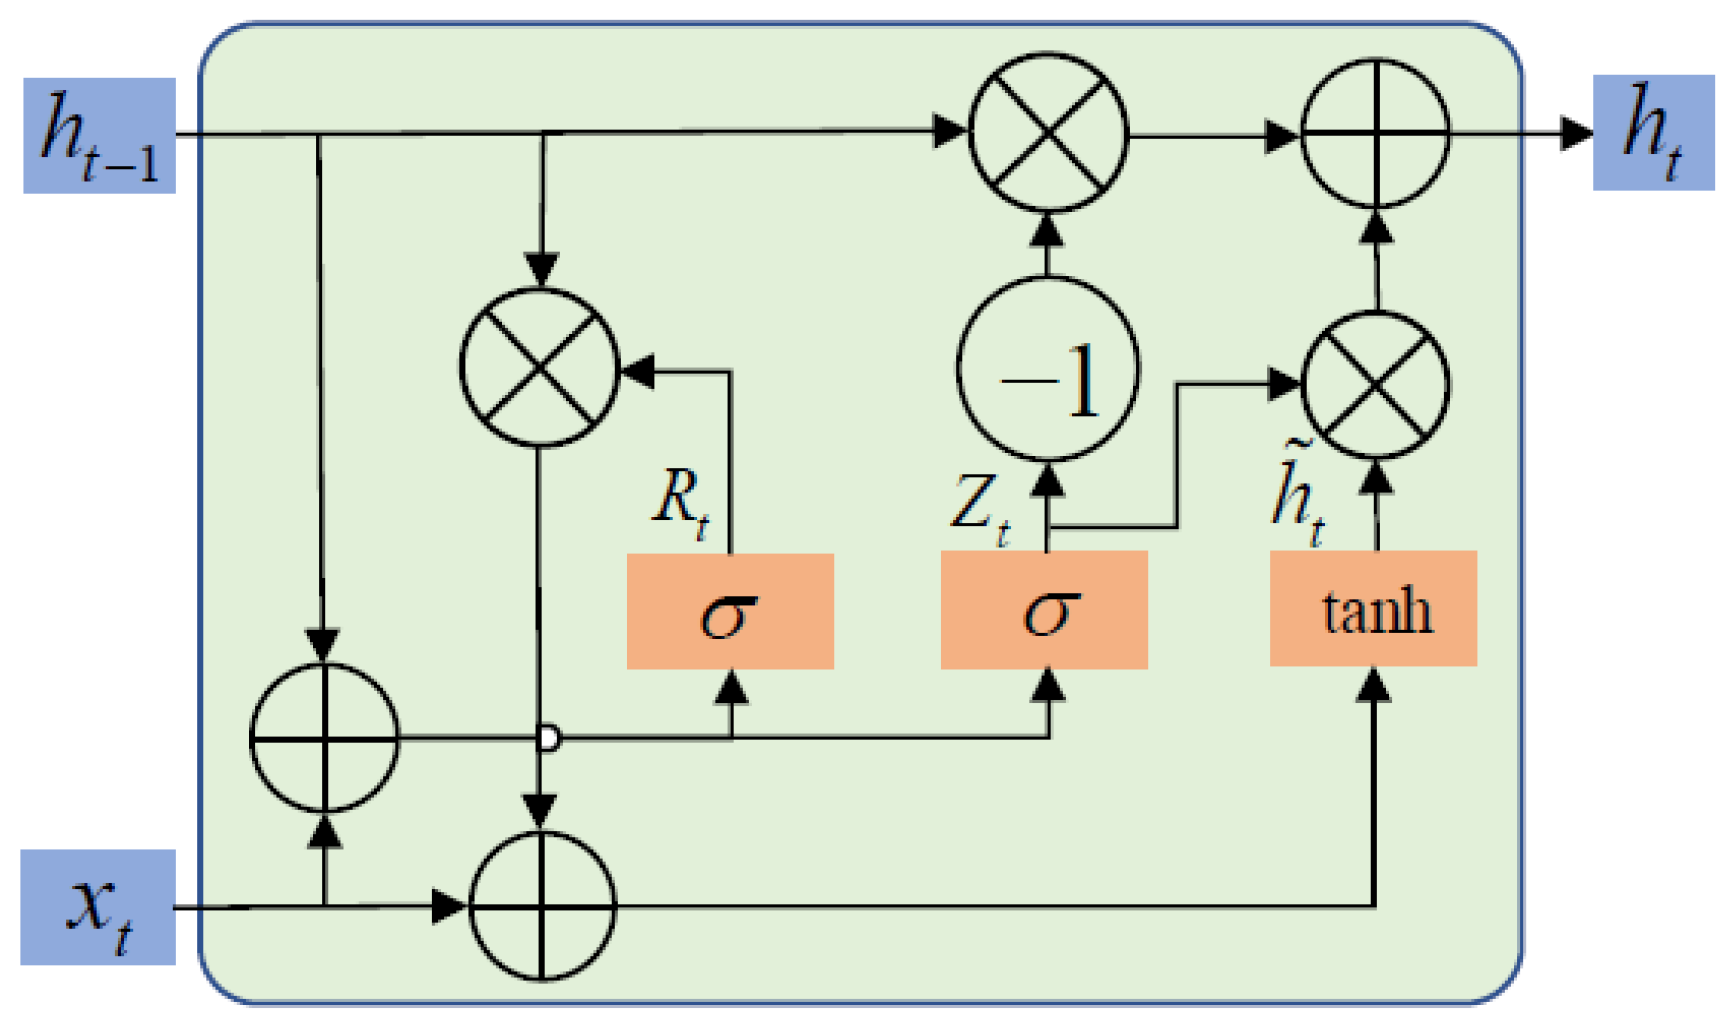
Considering that CNNs primarily focus on spatial domain features, a GRU structure is introduced to model the sequential dependencies within the fused features. As an improved variant of the RNN, GRU effectively captures temporal patterns in vibration signals while avoiding the vanishing gradient problem. By reshaping the fused CNN features into a time-series format and feeding them into the GRU, joint modeling of spatial and temporal features is achieved.
To further enhance the model’s ability to focus on critical temporal segments, a multi-head self-attention mechanism is introduced after the GRU to optimize the weighting of output features. Specifically, the hidden state sequence output by the GRU is linearly transformed into query (
Q), key (
K), and value (
V) vectors. These transformations are divided into H attention heads, where for the k-th head, the linear transformations of the query, key, and value are as follows:
where
denote the learnable weight matrix and
represent the bias term.
Compute the attention output for each head:
where
represents the query vector at time step
t,
is the key vector,
denotes the dimensionality of the key vector, and
is the attention weight of time step
t with respect to position
i.
The outputs from all heads are then concatenated and passed through a linear transformation to obtain the final multi-head self-attention output.
The integration of the multi-head self-attention mechanism emphasizes salient features, while a Dropout layer is added to enhance the model’s generalization ability, aiming to further improve fault diagnosis accuracy.
5. Simulation and Analysis of the Model
The proposed network is evaluated in a testing environment consisting of Windows 11, an Intel i9-12900H dual-core 2.50 GHz CPU, an NVIDIA RTX 3060 GPU, and 16 GB of RAM. All simulation experiments are conducted using MATLAB 2024b.
To ensure the reliability and practical applicability of the proposed model in engineering scenarios, a dual verification strategy was adopted: (1) the model was trained and tested on two internationally recognized rotating machinery fault datasets, CWRU and UC, to verify its classification performance under various operating conditions and fault types, while multiple mainstream fault diagnosis models were introduced for comparative experiments to comprehensively validate the model’s effectiveness; (2) gamma-distributed noise was injected into the UC dataset to simulate signal disturbances encountered in real industrial environments, thereby evaluating the model’s robustness and generalization capability under complex background noise. This dual verification process, equivalent to numerical simulation verification at the signal processing level, helps ensure that the proposed method is not only theoretically effective but also highly adaptable in practical engineering applications.
5.1. Description of the Dataset
5.1.1. Case 1
The dataset provided by Case Western Reserve University (CWRU) [
25] is used for the first stage of model performance evaluation. As shown in
Table 1, the CWRU dataset contains 10 operating conditions: one normal condition, three rolling element faults, three inner race faults, and three outer race faults. Each category consists of 100 samples, resulting in a total of 1000 samples. Each sample contains 2000 data points. All samples are randomly divided into a training set and a testing set at a ratio of 4:1, with 800 samples used for training and 200 for testing. This partitioning ensures the stability and generalization capability of the model during training, parameter tuning, and final evaluation.
Subsequently, both the training and testing sets are transformed into two-dimensional images using GAF, as illustrated in
Figure 6. This transformation first maps the one-dimensional vibration signals from Cartesian coordinates into polar coordinates. Based on a specific inner product formulation, the time correlations are encoded using trigonometric summation and difference operations, and the results are arranged from the top-left to bottom-right to generate the GASF and GADF images. The resulting GAF-encoded images exhibit significant sparsity, which not only mitigates nonlinearity and suppresses noise but also preserves the complete characteristics of the original one-dimensional signals. Additionally, this encoding captures temporal dependencies and latent correlations among the nonstationary and time-varying signal components.
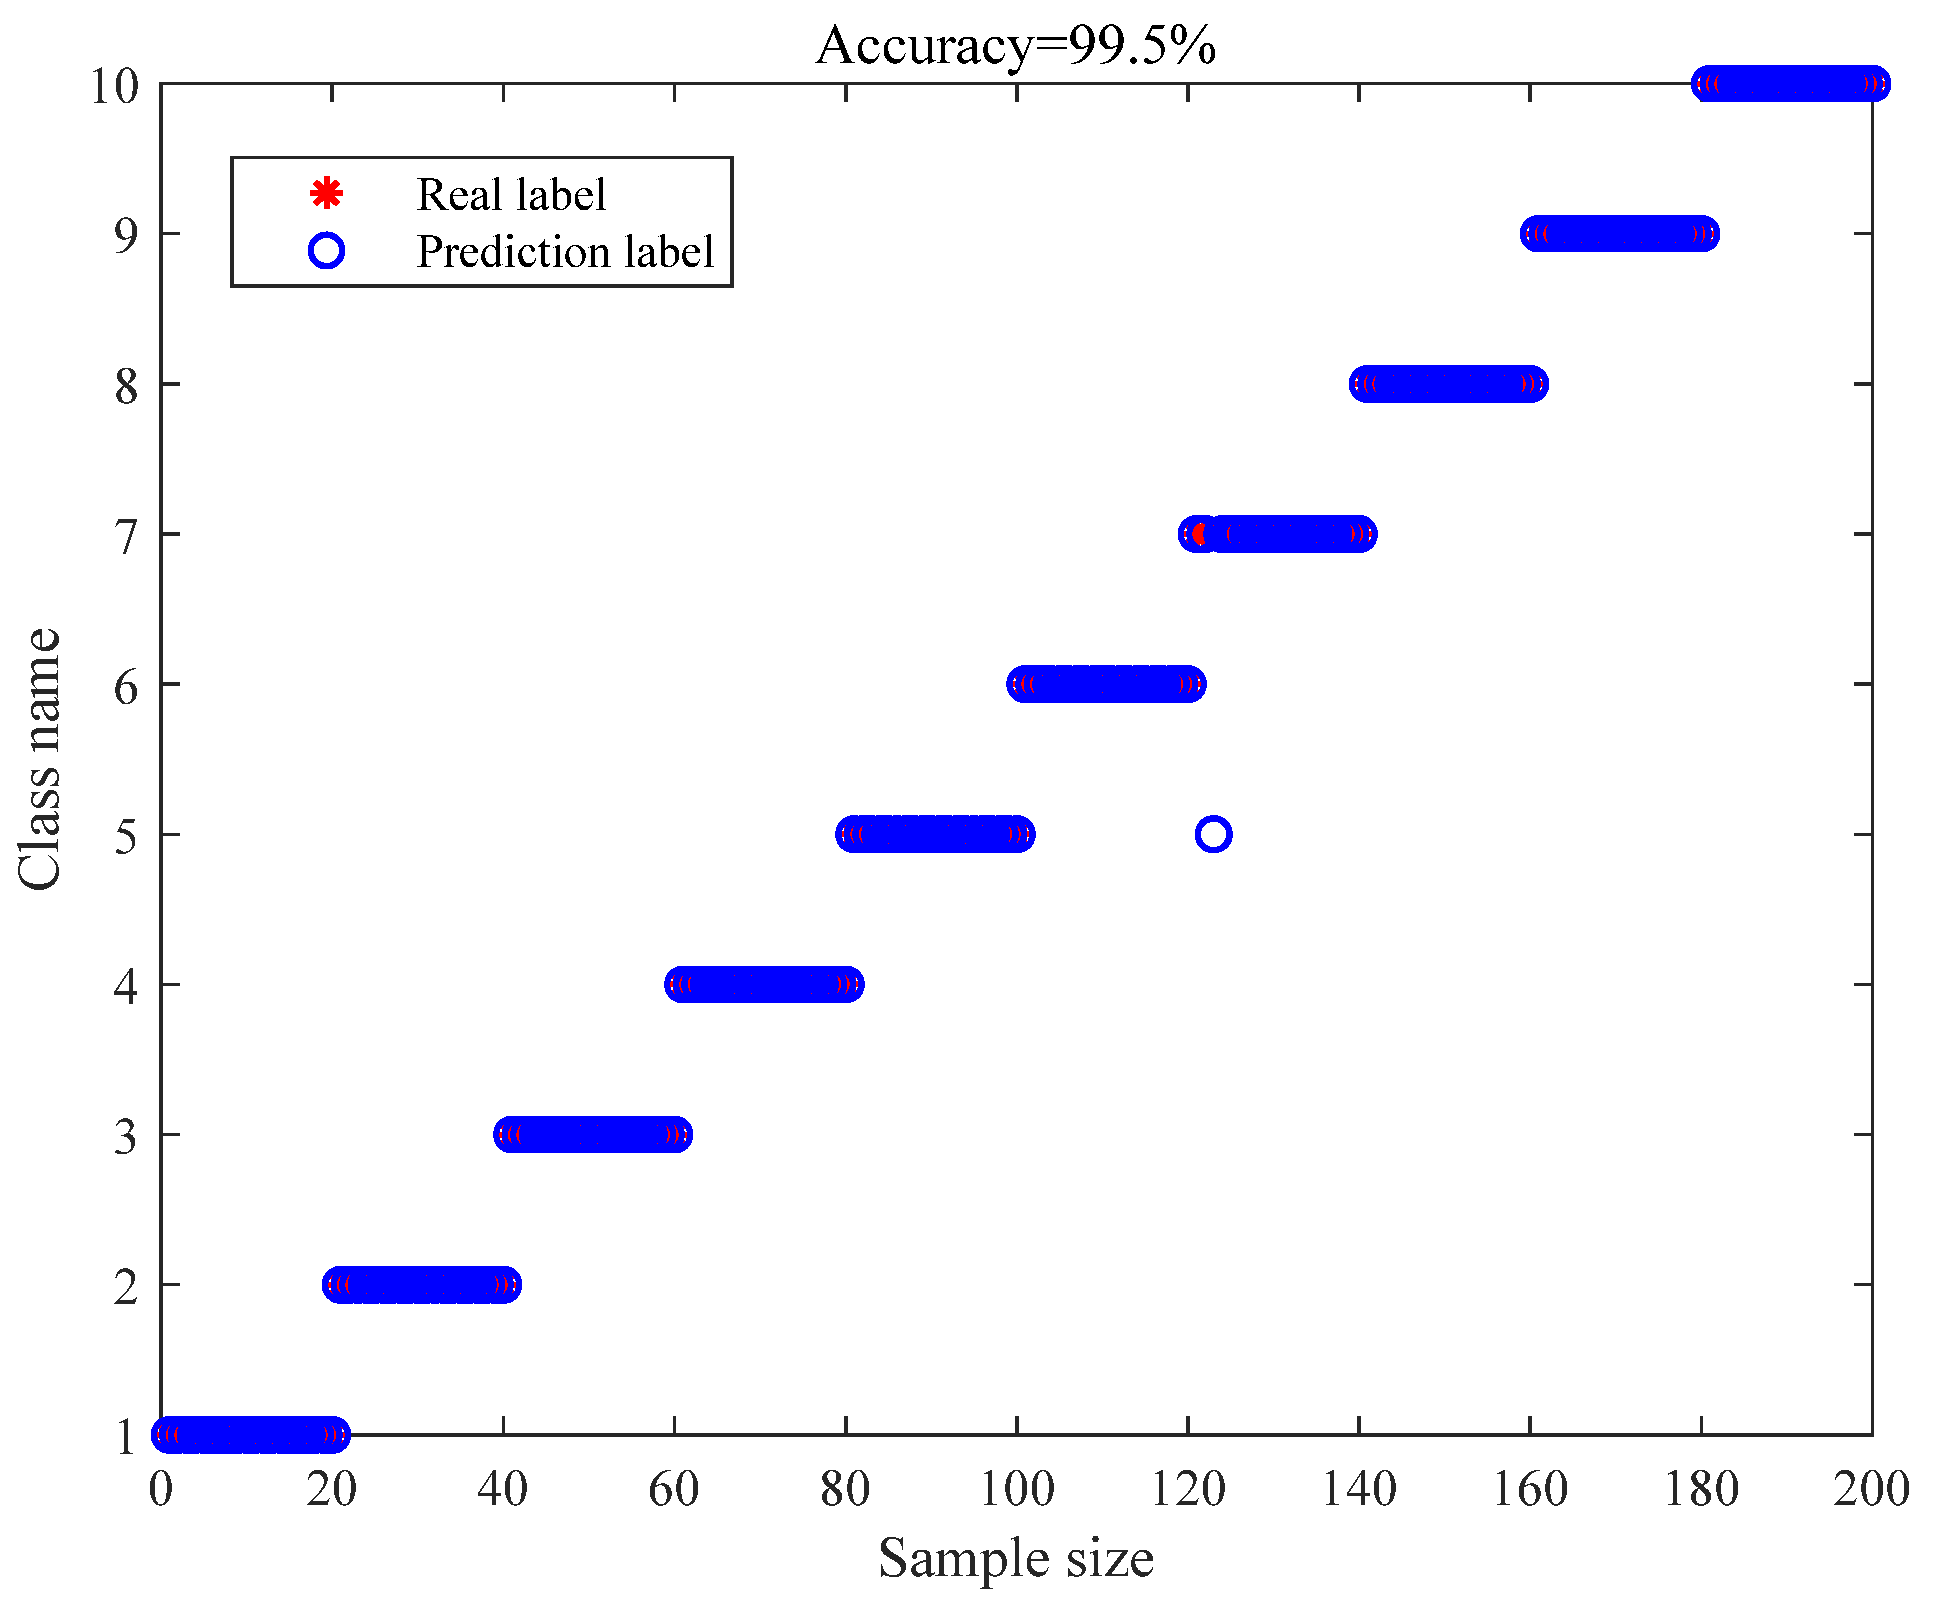
First, the performance of the GAF-PCNN-GRU model is comprehensively evaluated on the CWRU dataset. As shown in
Figure 7, the proposed model achieves a diagnostic accuracy of 99.5% on the test set, with only one misclassification among all test samples. The confusion matrix (
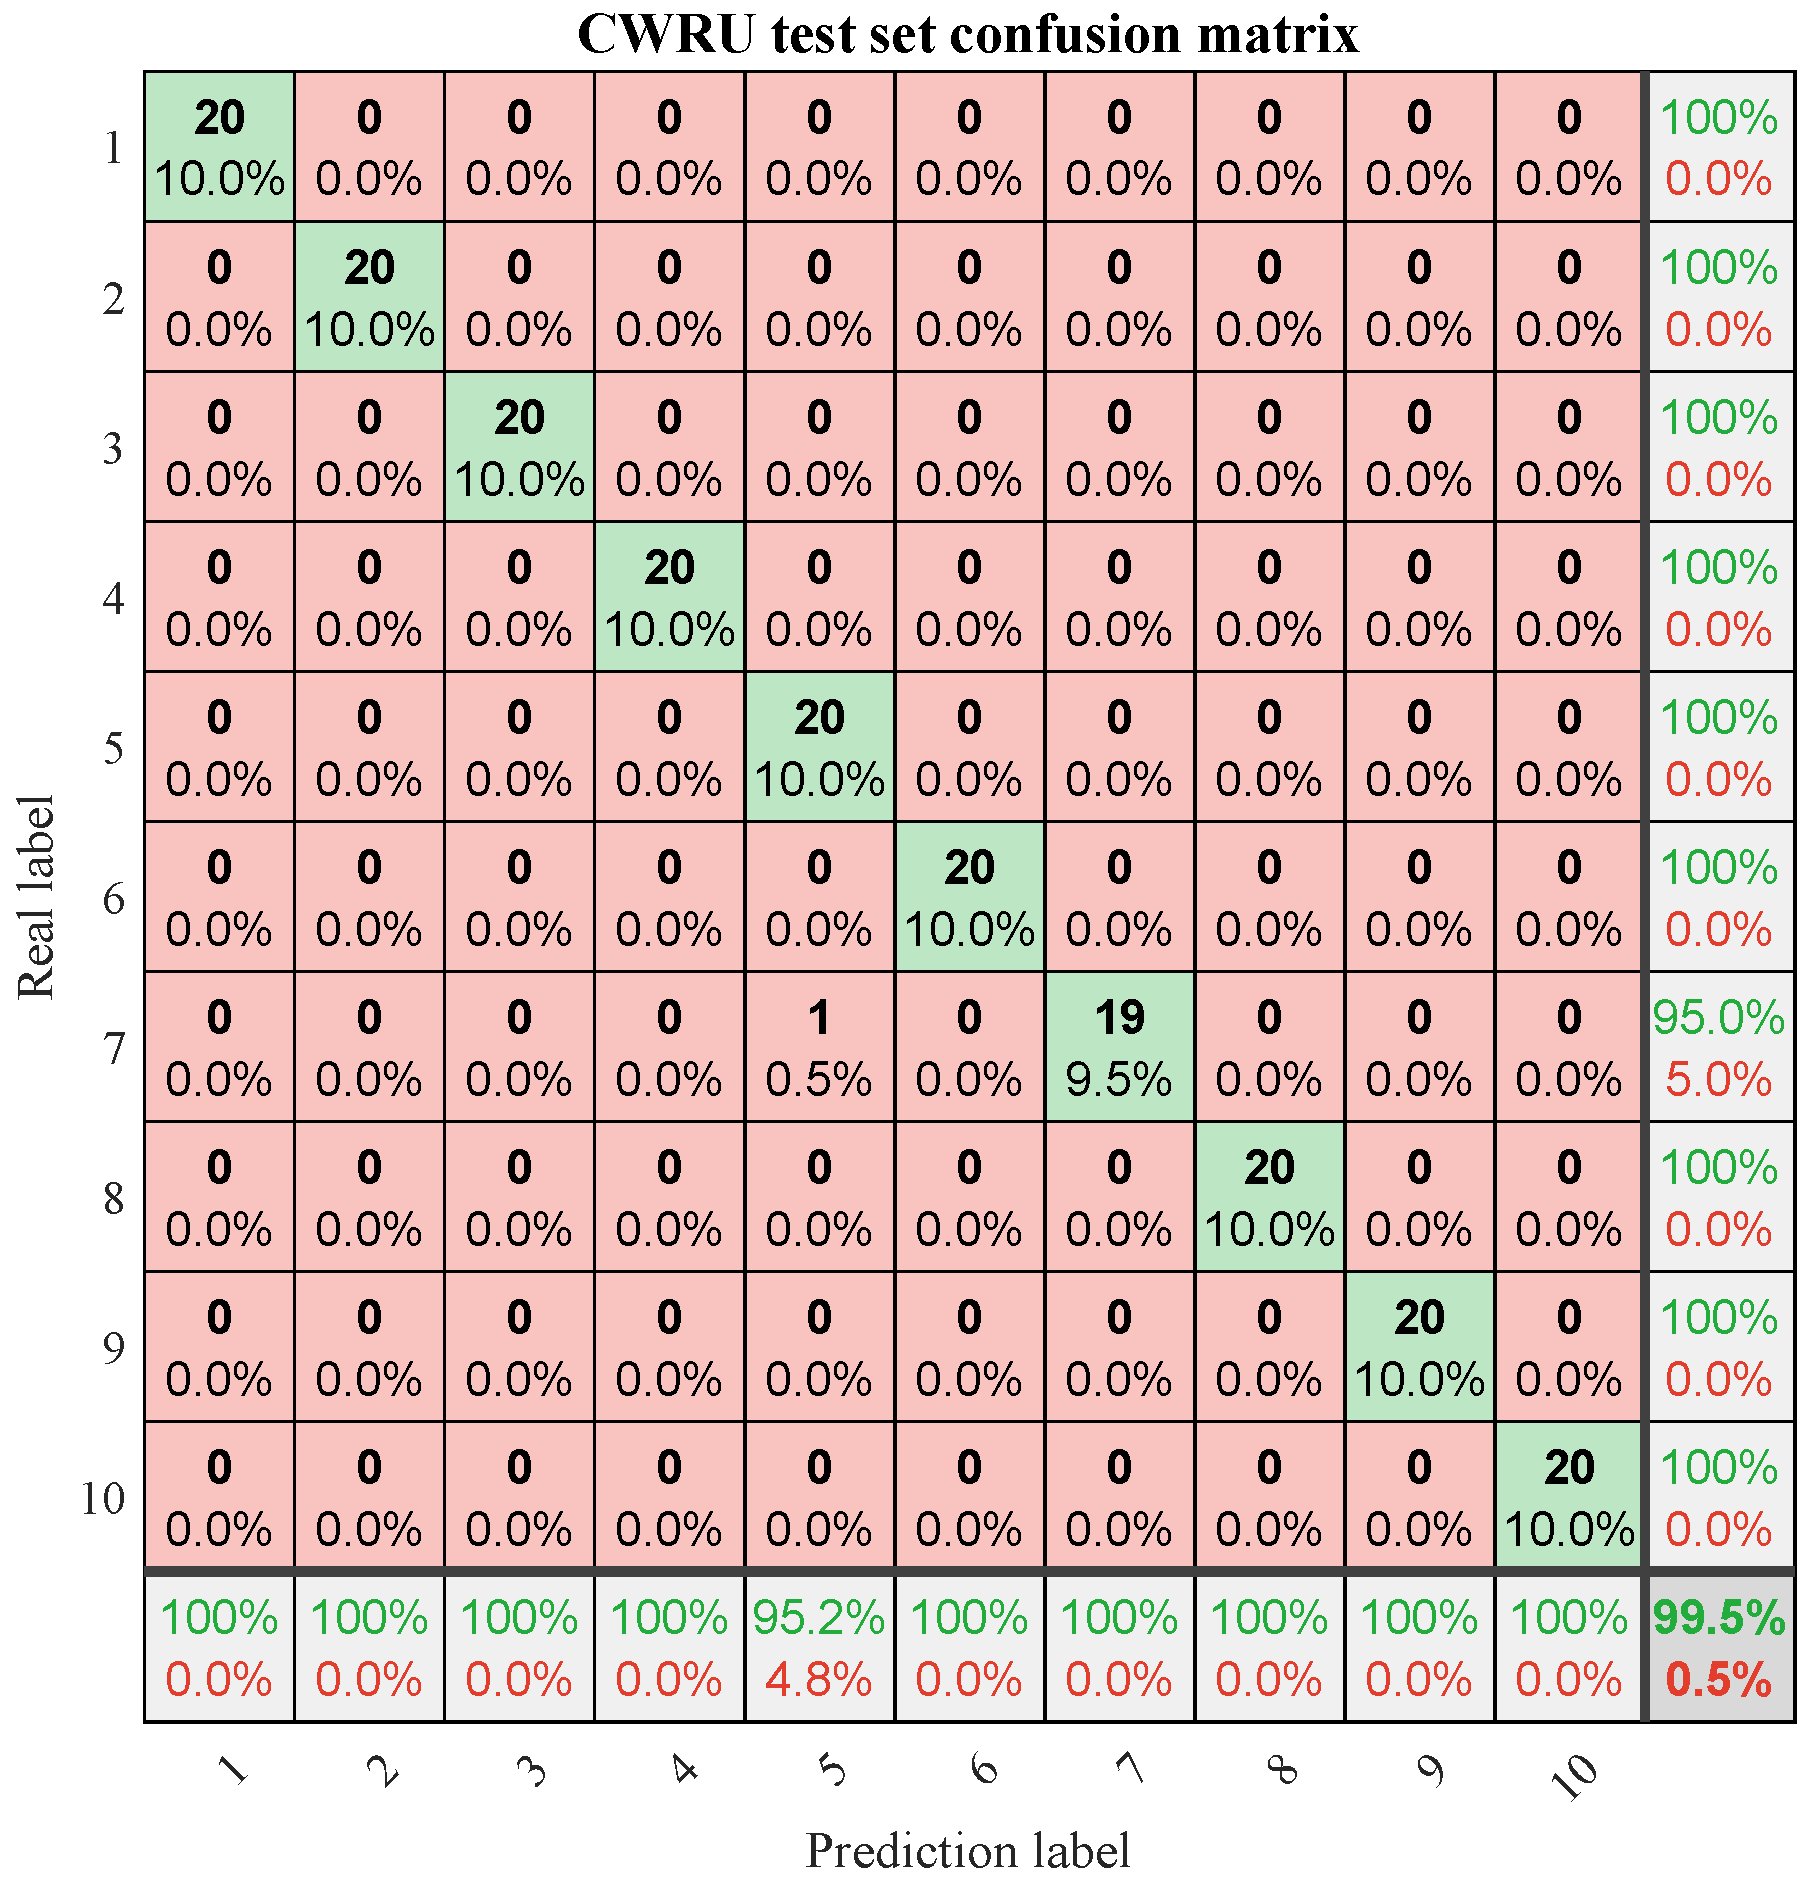
Figure 8) provides a more detailed analysis of the classification accuracy for each fault category. Except for a single misclassification in label 7, the other nine fault types are all correctly classified with 100% accuracy. These results strongly demonstrate the model’s outstanding capability in accurately identifying complex rolling bearing fault patterns in real-world industrial environments.
5.1.2. Case 2
The gear fault dataset from the University of Connecticut (UC) [
26] was collected through experiments conducted on a two-stage gearbox equipped with replaceable gears, with a sampling frequency of 20 kHz. The specific fault types are defined in
Table 2. The UC dataset contains a total of 936 samples covering nine distinct fault categories, including healthy (Healthy), missing tooth, root crack, spalling, and tip chipping with five different severity levels. Each category contains 104 samples, and each sample consists of 3600 data points. During the modeling process, the samples are randomly divided into a training set (720 samples) and a test set (216 samples) to ensure a relatively uniform distribution of each fault type across the subsets.
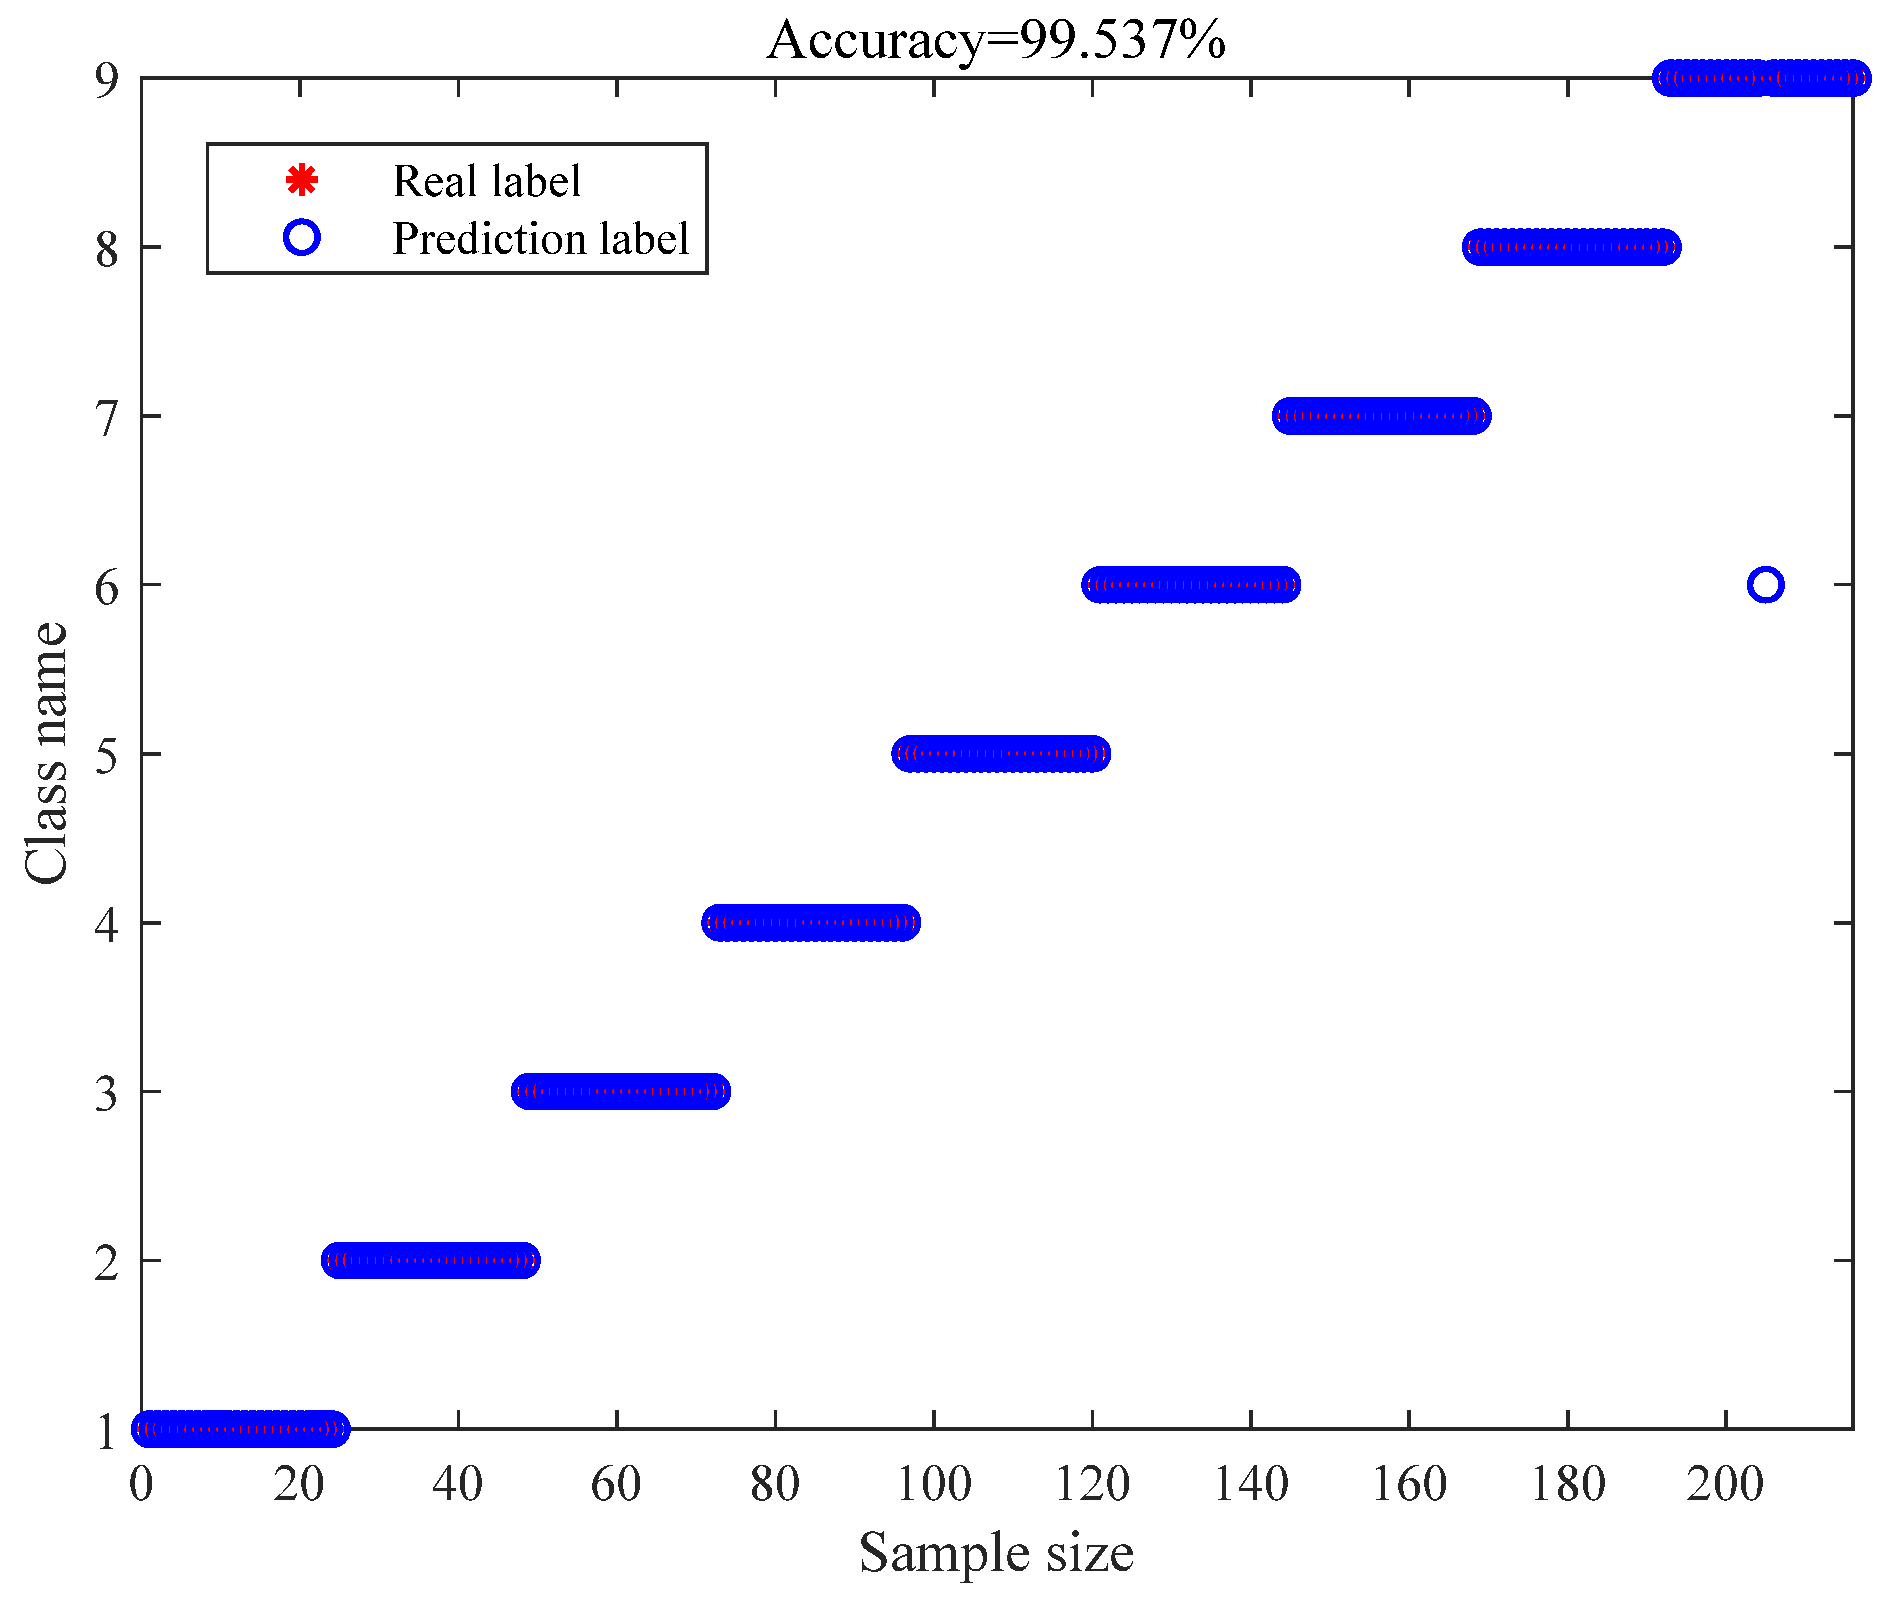
When utilizing the UC dataset,
Figure 9 illustrates the prediction results for the test set, achieving an overall diagnostic accuracy of 99.54%. The proposed model demonstrates superior diagnostic performance on the UC dataset as well. To further analyze the diagnostic outcomes for each fault category, the confusion matrix depicted in
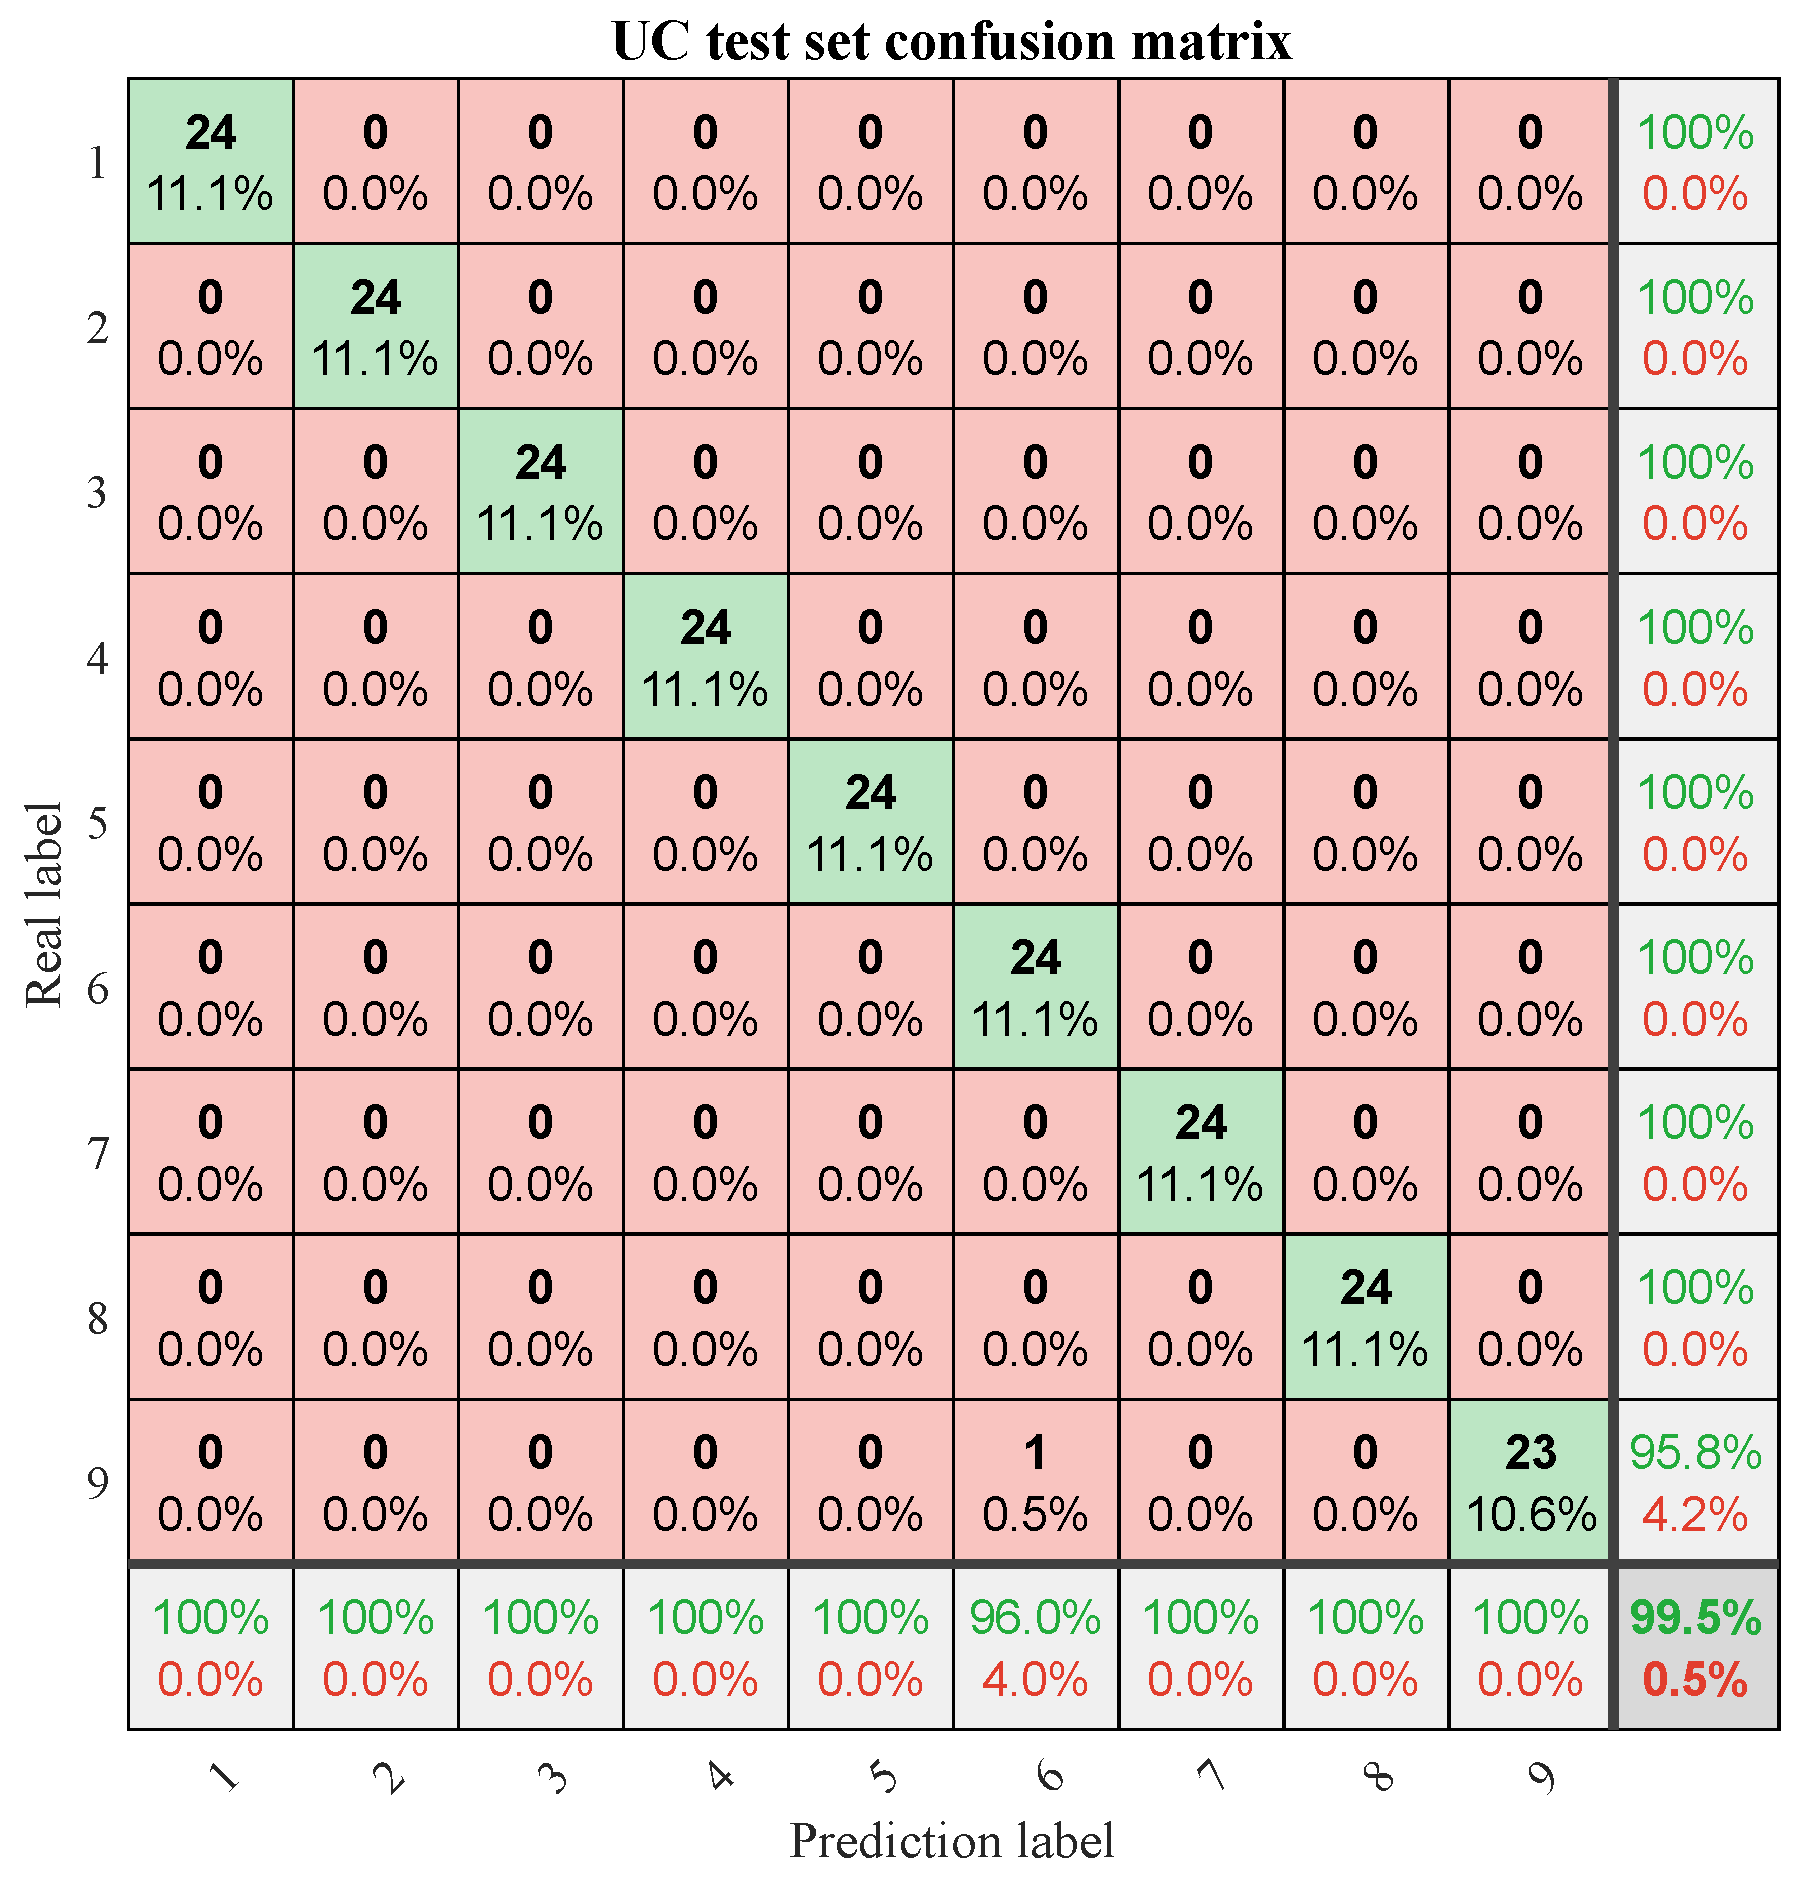
Figure 10 reveals that only one sample from label 9 was misclassified into label 6, while the diagnostic accuracy for all other fault categories reached 100%. These experimental findings collectively demonstrate that the proposed methodology adequately addresses the operational diagnostic requirements for rotating machinery in practical industrial settings.
5.2. Comparison Experiments
The proposed model’s diagnostic efficacy is benchmarked against GRU, GAF-CNN, GAF-PCNN, and GAF-CNN-GRU architectures. The parameter settings for each comparative model are detailed as follows:
(1) GRU: To maintain uniformity in input data across all comparative networks, images sized undergo flatten layer processing before being fed into GRU. The GRU’s hidden layer nodes are set to 128.
(2) GAF-CNN: GADF images are selected as input, with 64 filters in the CNN, with filter dimensions of and convolutional stride of .
(3) GAF-PCNN: The first branch of CNN takes GASF images as input, while the second branch takes GADF images. The dual-path architecture employs 64 filters per branch, featuring convolutional kernels of size accompanied by a stride length of .
(4) GAF-CNN-GRU: Similar to GAF-CNN, GADF images are used as input, with 64 filters in the CNN, with filter dimensions of and convolutional stride of .
The CWRU dataset constitutes a standard benchmark in fault diagnosis research due to its distinct categorization of failure modes. Consequently, the UC dataset was adopted for comparative analysis. Model efficacy was quantified through four metrics: accuracy (
Acc), precision (
P), recall (
R), and F1-score (
F1), computed via Equations (12)–(15).
In the equations, TP represents true positives; TN represents true negatives; FP represents false positives; and FN represents false negatives.
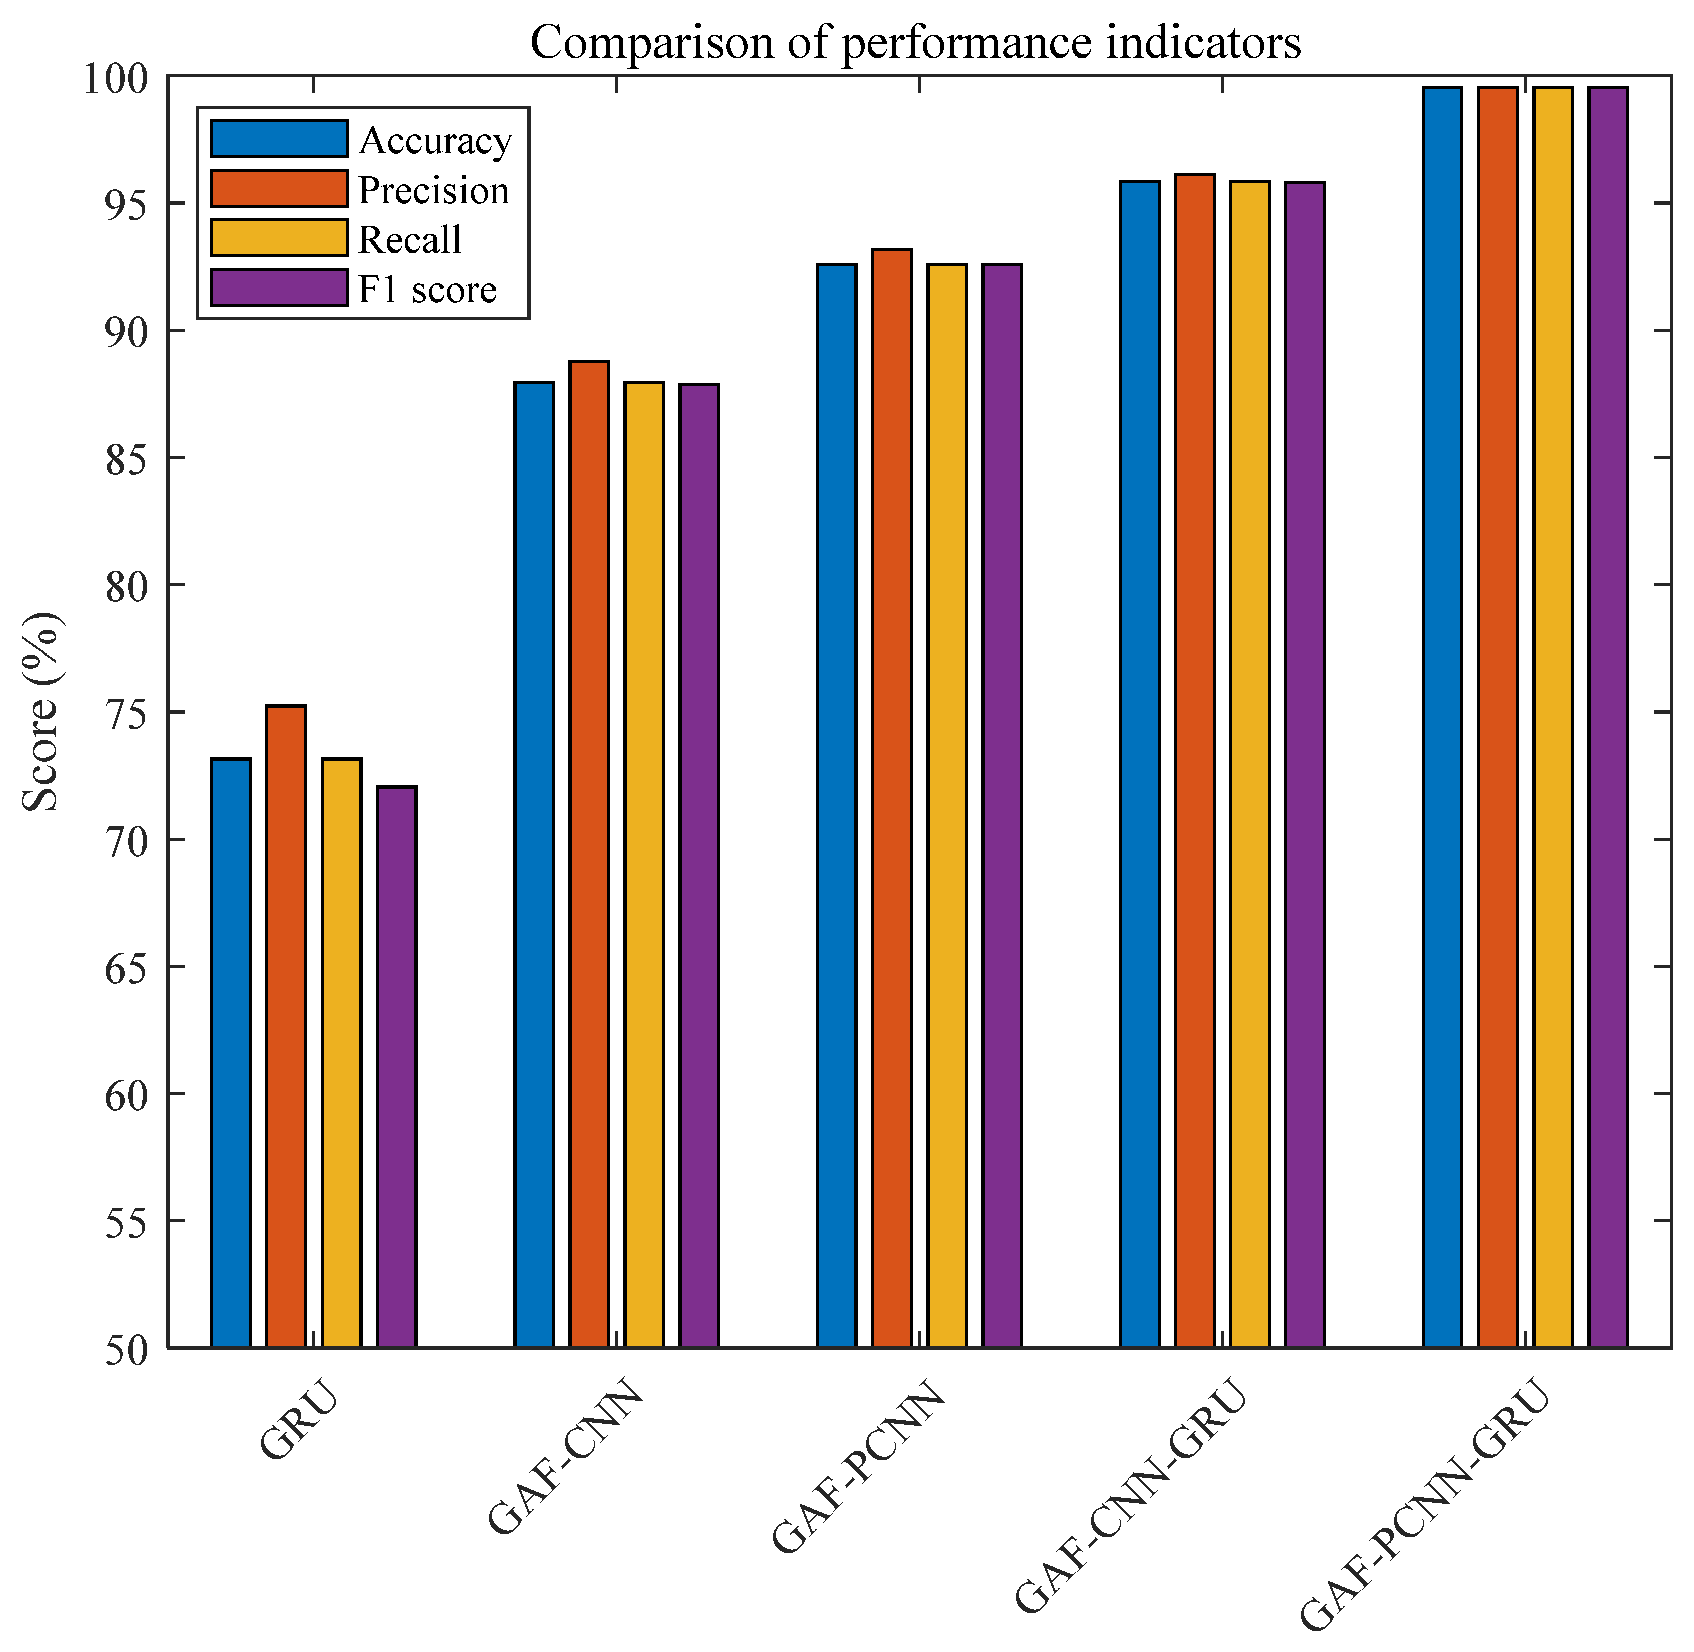
Figure 11 illustrates the performance metrics of each comparative network. From the figure, it is evident that the proposed model outperforms all comparative models across all four-evaluation metrics, thus further validating its superior fault classification capability.
Table 3 presents detailed performance metrics of each comparative network. Both the GRU and GAF-CNN models exhibit poorer performance metrics, all below 90%. The GAF-PCNN model achieves metrics around 92%, demonstrating the effectiveness of parallel training of CNN networks. The GAF-CNN-GRU model achieves metrics above 95%, confirming the efficacy of the combined model. The proposed GAF-PCNN-GRU model achieves metrics exceeding 99%, indicating its comprehensive and superior classification capabilities. These findings demonstrate substantive utility in practical rotating machinery diagnostic implementations.
As shown in
Table 4, both training and testing times increase progressively with the complexity of the model architecture. The GRU model demonstrates the shortest training time due to its reliance solely on one-dimensional sequential data, which limits its ability to extract deep features. The GAF-CNN series improves spatial feature extraction through image-based representation but lacks the capacity for temporal modeling.
In contrast, the proposed GAF-PCNN-GRU model requires slightly more computational time during both training and inference (e.g., 140 s for training and 2.6 s for testing on the UC dataset). However, it integrates dual-modality image modeling, attention mechanisms, and temporal feature learning, resulting in significantly improved diagnostic accuracy, robustness, and generalizability. In practical industrial applications, this level of training cost is acceptable, and the inference time—within a few seconds—is sufficient to support real-time fault diagnosis and rapid response. Therefore, the proposed method achieves a well-balanced trade-off between computational cost and diagnostic performance.
5.3. Noise Adding Experiment
To assess model robustness, gamma-distributed noise was injected into raw data ([936 × 100]) to simulate variations and uncertainties typical of real operational environments, as shown in Equation (16).
where “
input” denotes the raw data with dimensions [936, 100]; shape = 1, scale = 2.
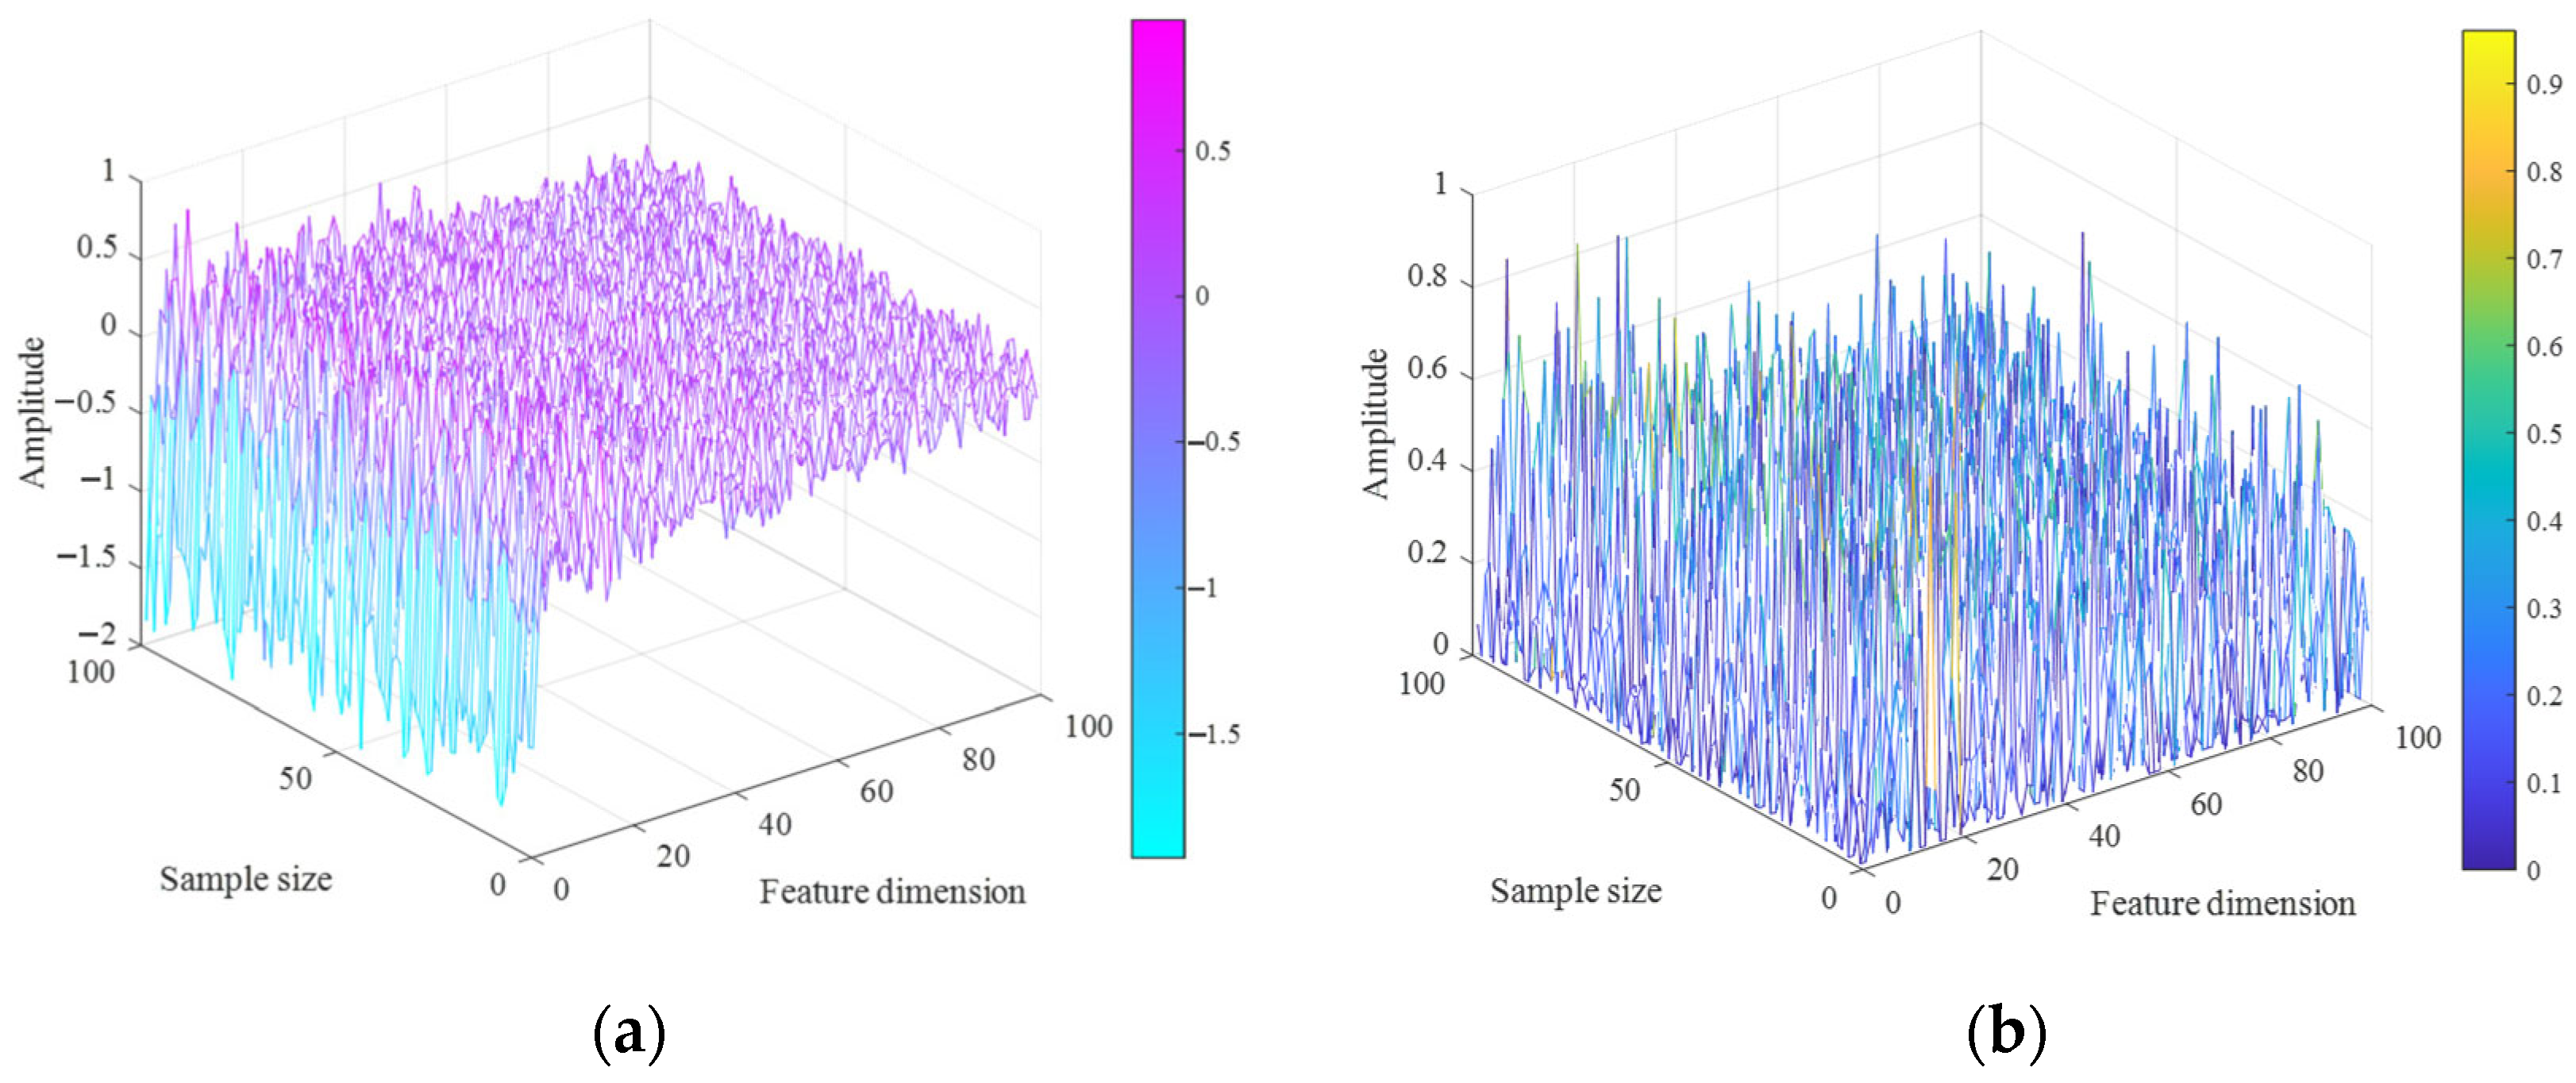
To intuitively analyze the impact of noise on the distribution characteristics of vibration data, gamma noise was introduced into the original samples of the UC dataset, and three-dimensional visualizations before and after noise injection were plotted, as shown in
Figure 12. Specifically,
Figure 12a shows the distribution of the original data without noise, and
Figure 12b shows the distribution after gamma noise injection. In the figure, the
x-axis represents the feature dimension of the vibration data, the
y-axis represents the number of plotted samples, and the
z-axis represents the vibration amplitude. It can be observed that after the injection of gamma noise, both the amplitude and spatial distribution of the data changed significantly, reflecting the disturbance effect of noise on the feature state. To enhance the readability of the figure, the first 100 samples were selected for plotting, and the figure was output in vector format to ensure that details remain clear when zooming in or out.
To intuitively evaluate the classification performance of the proposed model across different fault types, t-distributed stochastic neighbor embedding (t-SNE) [
27] is employed to visualize the high-dimensional features in a two-dimensional space. Specifically, the input to t-SNE is the high-dimensional feature representation obtained from the multi-head self-attention mechanism, and the top three principal dimensions are selected as inputs for dimensionality reduction to preserve representative feature information. As shown in the visualization results in
Figure 13, even under the influence of noise, the vast majority of samples are still correctly classified. The nine fault categories form clearly separated clusters in the feature space, with minimal overlap, indicating that the proposed model maintains strong fault discrimination capability under complex operating conditions.
According to
Table 5, the evaluation metrics for each comparative network after noise addition are presented. Following noise introduction, GRU exhibits the poorest robustness, with all metrics declining to below 70%. GAF-PCNN shows a decrease of approximately 10% across metrics, yet maintains higher scores compared to the GAF-CNN model. GAF-CNN-GRU experiences a decrease of around 4% in all metrics. The proposed GAF-PCNN-GRU model demonstrates a marginal decrease of only about 2% across metrics, highlighting its significantly superior robustness compared to other models.
6. Conclusions
This paper proposes a fault diagnosis method for rotating machinery that integrates GAF, PCNN, and GRU, aiming to address the limitations of one-dimensional vibration signals in feature representation and the difficulty of effectively extracting deep temporal features. Specifically, the GAF method enables the mapping of time-series signals into image space, preserving essential temporal characteristics; the PCNN architecture employs parallel branches to extract multi-modal image features, enhancing spatial representational capability; and the GRU network models temporal dependencies while incorporating a self-attention mechanism to improve the perception of critical fault information.
Extensive experiments conducted on two public datasets, CWRU and UC, demonstrate that the proposed method significantly outperforms several existing models in terms of diagnostic accuracy, robustness, and noise resistance. Notably, the model maintains high classification performance even under gamma noise interference, validating its potential for application in complex industrial environments.
Future work will focus on two main directions: first, compressing the model architecture to improve computational efficiency and reduce deployment costs without compromising diagnostic performance; and second, extending the model to fault diagnosis tasks involving multi-source heterogeneous data, such as multi-sensor fusion and cross-device transfer learning, to enhance its practicality and generalizability.
