Abstract
Background: Autism spectrum disorder (ASD) is a complex neurodevelopmental disorder characterized by social communication deficits and repetitive behaviors. Recent studies have suggested that gut microbiota may play a role in the pathophysiology of ASD. This study aims to develop a classification model for ASD diagnosis and to identify ASD-associated biomarkers by analyzing metagenomic data at the taxonomic level. Methods: The performances of five different methods were tested in this study. These methods are (i) SVM-RCE, (ii) RCE-IFE, (iii) microBiomeGSM, (iv) different feature selection methods, and (v) a union method. The last method is based on creating a union feature set consisting of the features with importance scores greater than 0.5, identified using the best-performing feature selection methods. Results: In our 10-fold Monte Carlo cross-validation experiments on ASD-associated metagenomic data, the most effective performance metric (an AUC of 0.99) was obtained using the union feature set (17 features) and the AdaBoost classifier. In other words, we achieve superior machine learning performance with a few features. Additionally, the SHAP method, which is an explainable artificial intelligence method, is applied to the union feature set, and Prevotella sp. 109 is identified as the most important microorganism for ASD development. Conclusions: These findings suggest that the proposed method may be a promising approach for uncovering microbial patterns associated with ASD and may inform future research in this area. This study should be regarded as exploratory, based on preliminary findings and hypothesis generation.
1. Introduction
Autism spectrum disorder (ASD) is a complex neurodevelopmental condition characterized by persistent deficits in social communication and interaction [1]. ASD symptoms typically emerge in early childhood, and they can vary widely in severity, which reflects the heterogeneity of the disorder. Symptoms of ASD typically appear in early childhood and can affect lifestyle, such as social interaction and success in school performance [2]. ASD is a comprehensive structure that combines Asperger syndrome and other developmental disorders classified as separate disease groups under a single umbrella [3]. Recent epidemiological studies indicate a rising prevalence of ASD globally. The etiology of ASD is multifactorial, involving a complex interplay of genetic and environmental factors [4]. Further research is needed to gain a more comprehensive understanding of how these environmental and genetic factors contribute to the development of ASD [5].
Early identification and intervention are critical for improving outcomes in individuals with ASD. Pharmacological treatments may be employed to manage associated symptoms such as irritability, anxiety, or attention deficits, although no medications currently target the core symptoms of ASD. Despite advancements in understanding and managing ASD, challenges remain in addressing the diverse needs of individuals across the spectrum. Ongoing research into the underlying mechanisms, early detection methods, and tailored interventions continues to be essential for improving the quality of life for those affected by ASD and their families [6]. In recent years, the number of ASD studies has increased globally due to the increase in biological data, the development of diagnostic tools, and the widespread use of screening studies [7].
A healthy digestive system is dependent on a rich microbial community found in the human intestine. This is known as the gut microbiota, and it consists of trillions of microorganisms. These microbes play a vital role in human health, supporting key bodily functions such as digestion, metabolism, immune system regulation, and brain activity [8]. Recent advances in metagenomic research have demonstrated strong links between the gut microbiota and metabolic disorders and health conditions [9]. The gut microbiota plays a crucial role in developing and regulating the immune system, which is vital for overall health. Through close interaction with intestinal cells and the immune defense system, it maintains balance and protects the human body from harmful invaders. This microbial balance is known as homeostasis. When this is disrupted, a condition called dysbiosis arises. This can lead to chronic inflammation. It can also lead to autoimmune diseases, and it can increase susceptibility to infections [10].Therefore, maintaining a balanced gut microbiota is crucial for preventing disease and supporting overall health. Currently, researchers are exploring ways to restore and maintain gut balance, such as through the use of probiotics and prebiotics and changes to dietary habits [11]. As we learn more about gut microbial communities, we can develop personalized treatments and therapies for individuals’ unique microbiomes.
Microbiome sequencing data are being utilized for the detailed characterization and investigation of microbiome profiles. Various analyses are performed using 16S rRNA and shotgun metagenomic data to identify microbiome profiles and detect diseases [12]. Taxonomic profiles are often used in disease prediction. Several tools, such as MetaPhlAn [13] and QIIME [14], are used to generate taxonomic profiles from sequencing data. For AI-based disease prediction, three types of metagenomic sequencing data are commonly used: (i) abundance values of different microorganisms, (ii) functional annotation of metagenomic samples, and (iii) k-mer abundance values derived from raw data. In this study, we use a dataset of relative abundances of taxonomic units calculated from metagenomic sequencing data. Relative abundance values are utilized as important data in disease analysis through information derived from taxonomic classifications. [15].
Feature selection and machine learning methods are used to reveal the relationships between microorganisms and diseases. Machine learning and feature selection approaches provide insights into how to predict disease, how to identify effective biomarkers for disease, and how to reduce high-dimensional data to only effective features [16]. Recently, there have been numerous studies using machine learning methods to detect diseases using metagenomic data [17,18,19]. Studies using metagenomic data aim to obtain lower-dimensional data from high-dimensional biological data and improve classification success [20].
This study aims to predict the disease using machine learning methods on a metagenomic dataset associated with ASD and to identify microbial signatures that may be associated with the disease. To achieve this, disease prediction was performed using five different methods, i.e., SVM-RCE, RCE-IFE, microBiomeGSM, different feature selection methods, and the union method, which includes the features with importance scores greater than 0.5 identified by at least one of the two best-performing feature selection methods. Each method highlights effective features in the classification process. Additionally, the SHAP (SHapley Additive exPlanations) method, an explainable artificial intelligence (XAI) technique, was applied to the union feature set to identify effective features. A literature review was conducted on the microbial signatures identified using the aforementioned tools and the proposed approach, and the relationship between the identified biomarkers and ASD was investigated. The high prediction performance achieved with the proposed methods and the numerous biomarkers validated in the literature suggest that this study could serve as an important tool for ASD diagnosis and detection.
2. Materials and Methods
2.1. Dataset
The dataset used in this study was obtained from the NCBI Sequence Reading Archive (SRA) database under accession number GSE113540 [21,22]. It was created to conduct a comprehensive analysis of the gut microbiota of individuals with ASD, aiming to identify functional differences and microbial diversity. This dataset was prepared by a team of researchers at Nanjing Medical University. It includes relative abundance values of species calculated from metagenomic sequencing data of gut microbiota obtained from fecal samples collected from 30 children with ASD and 30 healthy controls. It includes a total of 60 samples and 4527 feature information. In this dataset created by Liu et al. (2021) [22], the sample selection and preprocessing processes were carefully performed. Factors that could increase microbiota variability, such as a history of functional constipation, recent use of antibiotics/probiotics, and similar factors in individuals with ASD, were excluded. Raw sequences were subjected to quality filtering, aligned to the human hg19 genome, and taxonomically classified using reliable databases. In the study from which the data originated, human DNA was aligned and filtered to the hg19 reference genome using the bwa tool (v0.7.17), then PCR-amplified sequences were removed using Picard tools (v2.18.12). In this study, the analysis was performed with taxonomic profiles that had undergone the above preprocessing steps. All these steps were planned to obtain biologically meaningful and technically unbiased microbiome signals.
2.2. Methods
To predict ASD-related taxonomic biomarkers, this study analyzes metagenomic data via employing advanced machine learning techniques. Abundance values of the species are used as the input data, and the performance metrics of five different approaches have been comprehensively evaluated. The first approach is microBiomeGSM, which groups features based on biological domain knowledge and conducts classification at different taxonomic levels [17]. The microBiomeGSM tool performs classification using the Grouping–Scoring–Modeling (GSM) approach and has achieved effective results on colorectal cancer (CRC)-, type 2 diabetes (T2D)-, and inflammatory bowel disease (IBD)-associated metagenomic datasets [23,24]. Subsequently, two different clustering-based feature selection methods, i.e., SVM-RCE [25] and RCE-IFE [26], were applied. Finally, five different feature selection methods (SKB, XGBoost, MRMR, CMIM, and FCBF), which were previously proposed for microbiome-based disease prediction problems, were experimented with. Since XGBoost and SKB feature selection methods generate the highest area under the curve (AUC) values in our preliminary experiments [27], in this study, we focus on the features having importance scores greater than 0.5 in either the XGBoost or SKB results. Hence, we create a union feature set including 17 unique features. Classification algorithms are applied to this union feature set, and the results are comprehensively evaluated. Additionally, the SHAP approach, an XAI method, is applied to the union feature set and importance scores are assigned to the features. The general workflow of this study is illustrated in Figure 1.
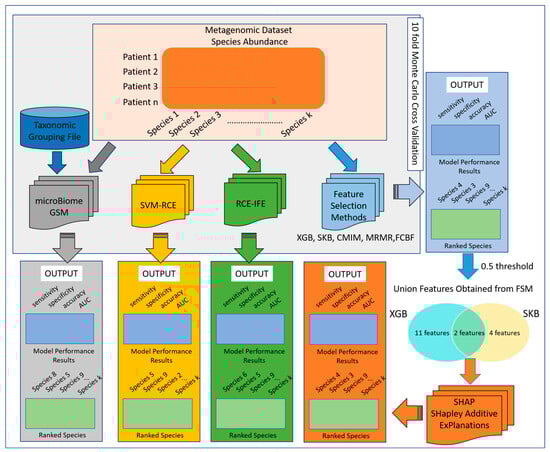
Figure 1.
Workflow of the methodology.
2.2.1. MicroBiomeGSM
The microBiomeGSM tool [17] analyzes metagenomic datasets to predict disease and identify potential taxonomic biomarkers. This tool consists of three components: grouping (G), scoring (S), and modeling (M). It performs classification at three major taxonomic levels, namely genus, family, and order, and aims to identify microorganisms associated with disease. In the first component of the approach, the grouping stage, species are separated according to the taxonomic levels to which they are related. In the second component, scoring, these subgroups are classified by a random forest algorithm using random stratified sampling and 10-fold cross-validation. The calculated accuracy metrics are assigned to each group, indicating their importance for classification tasks. Accordingly, the groups are ranked in order of importance, and the top k groups with the highest scores are selected for modeling. In the final stage, i.e., the modeling component, a random forest model is retrained using the species in these k selected groups with the 10-fold Monte Carlo cross-validation (MCCV) method, and the overall classification performance is evaluated.
2.2.2. SVM-RCE
Yousef et al. (2021) proposed an original and innovative approach called SVM-RCE, which combines a support vector machine (SVM) classifier and the recursive cluster elimination (RCE) method [25]. In this method, the dataset is divided into a training dataset and a test dataset, and then the 1000 most significant features are selected using a t-test. These features are clustered using the K-Means algorithm. After the clustering process, each cluster is ranked according to the SVM-based classification success rate, and the clusters with the lowest performance are excluded from the process at a certain percentage. The model created by combining the features into clusters with a significant success rate is applied to the previously separated test data to evaluate the prediction performance. This iterative process of clustering and cluster elimination is repeated until the target number of clusters is reached. In this way, the model performance is comprehensively analyzed for different cluster sizes.
2.2.3. RCE-IFE
The RCE-IFE method updates the SVM-RCE approach by providing an additional step of feature elimination after the clustering process [26]. This method iteratively and simultaneously repeats the elimination processes at the cluster level and feature level. While the SVM-RCE approach continues the process with the elimination of irrelevant clusters, the RCE-IFE method aims to optimize the features within the remaining clusters. A random forest algorithm is used to determine the importance of features and clusters. As with SVM-RCE, the dataset is first divided into a training group and a test group, and then the features are clustered using the K-Means algorithm. However, in this approach, after eliminating the low-scoring clusters, the low-scoring features within each selected cluster are systematically extracted according to a predetermined ratio. This feature refinement step, executed after each clustering iteration, ensures the elimination of both irrelevant clusters and noisy or redundant features within the retained clusters. Consequently, the model benefits from a more refined and informative feature set, improving classification performance.
2.2.4. Feature Selection Methods
To diagnose ASD and identify microbial signatures contributing to ASD, five different feature selection methods—CMIM [28], FCBF [29], MRMR [30], Select K Best [31], and XGBoost—were combined with five different classification algorithms—AdaBoost, LogitBoost, Decision Tree, Random Forest, and XGBoost—to evaluate the performance of the proposed approach. Using default parameters, we have each feature selection method identify its top 100 features. Among these identified features, the proposed method focuses on features with a scaled importance value of ≥ 0.5, as determined by the feature selection techniques. The feature importance cutoff was chosen as 0.5, as suggested in prior studies [27,32,33,34]. By prioritizing the most relevant features, this approach aims to reduce feature dimensionality while achieving enhanced classification performance with a smaller subset of features.
2.2.5. Union Method Based on the Features That Are Selected by at Least One of the Best Two Different Feature Selection Algorithms
In our experiments with four different feature selection methods and five different classifiers, we observe that the AdaBoost classifier and XGBoost and SelectKBest (SKB) feature selection methods yielded the highest AUC score. The identified features of these algorithms were ranked based on their importance scores. Features with an importance score of 0.5 or higher were defined as the union feature set. Using the XGBoost feature selection algorithm in combination with the AdaBoost classifier, thirteen features with importance scores above this threshold were identified. On the other hand, six features were identified using the SKB feature selection method and the AdaBoost classifier. Among these, two features were commonly selected by both methods. As a result, a total of seventeen unique features were obtained and collectively referred to as the union feature set. Machine learning models were retrained and tested using this feature set, and their classification performance was comparatively analyzed.
3. Results
3.1. Model Performance Evaluation
This section presents the performance metrics obtained from experiments conducted on a metagenomic dataset associated with ASD using five different methods. In the relevant analyses, experiments were carried out using 80% of the data for training and 20% for testing. All classification tasks were performed using 10-fold Monte Carlo cross-validation (MCCV).
3.1.1. Model Performance Results Based on Taxonomic Grouping (microBiomeGSM)
To evaluate the performance of the group-based selection strategy, the microBiomeGSM tool is utilized. This approach enables the identification of biologically meaningful feature groups at different taxonomic levels. Table 1 displays the performance metrics obtained using the microBiomeGSM tool. microBiomeGSM is a group-based approach, and it identifies the most effective feature groups by cumulatively merging them. Due to the increasing number of features with each group combination, groups with an average of 100 features were selected. To ensure a fair comparison with other methods, in other methods, the number of features was balanced accordingly. As shown in Table 1, the best result was achieved at the genus level, where an average of 96.9 features yielded an AUC value of 0.96. Additionally, at the family taxonomic level, an average of 107.3 features resulted in an AUC of 0.95.

Table 1.
MicroBiomeGSM results at three different taxonomic levels. Acc: accuracy, Sens: sensitivity, Spe: specificity, F-mea: F-measure, AUC: area under the curve.
3.1.2. Comparative Performance Evaluation of SVM-RCE, RCE-IFE, MicroBiomeGSM Models
In order to compare the effectiveness of the different strategies applied in this study, the performance metrics of each method are systematically evaluated. This comparison highlights how varying algorithmic approaches affect model accuracy and feature compactness. Table 2 presents the performance results of the methods used in this study, namely SVM-RCE, RCE-IFE, and microBiomeGSM. As shown in Table 2, the highest performance in the microBiomeGSM analyses was achieved at the genus level, yielding an AUC value of 0.96 with an average of 96.9 features (taxa). Using RCE-IFE, an AUC of 0.94 was obtained with an average of 104.8 features. In contrast, the SVM-RCE method achieved an AUC value of 0.89 with an average of 135.5 features.
Table 2.
Comparative evaluation of performance metrics obtained using SVM-RCE and RCE-IFE and microBiomeGSM methods on ASD-associated metagenomic dataset. Acc: accuracy, Sens: sensitivity, Spe: specificity, F-mea: F-measure, AUC: area under the curve.
3.1.3. Comparative Performance Evaluation of Conventional Feature Selection Methods
To assess the impact of different feature selection and classification strategies on model performance, a comprehensive comparison was conducted. Figure 2 presents the machine learning performance results obtained using five different feature selection methods (CMIM, FCBF, MRMR, Select K Best, and XGBoost) and five different classification algorithms (AdaBoost, LogitBoost, Decision Tree, Random Forest, and XGBoost).

Figure 2.
Comparative evaluation of AUC values obtained using different feature selection methods and different classifiers on the ASD-associated metagenomic dataset.
Figure 2 shows that AdaBoost, LogitBoost, and XGBoost classification algorithms and XGBoost and SelectKBest (SKB) feature selection methods outperform other methods in terms of the AUC metric. The best result is achieved with the XGBoost feature selection method and the AdaBoost classification algorithm with an AUC of 0.99. Similarly, an AUC of 0.98 is achieved with the XGBoost feature selection method and the XGBoost classification algorithm. Another effective result (0.98 AUC) is obtained with the XGBoost feature selection algorithm using the LogitBoost classification algorithm. One can conclude from Figure 2 that the XGBoost feature selection algorithm has a significant impact on ASD classification. The XGBoost feature selection algorithm has the potential to provide important insights for researchers studying autism spectrum disorders (ASDs).
3.1.4. Performance Evaluation of Selected Union Features
Table 3 presents the performance metrics obtained using seventeen features that are identified using the union method mentioned in Section 2.2.5. Five different classification algorithms, namely AdaBoost, Random Forest, Decision Tree, XGBoost, and LogitBoost, were tested. The accuracy, sensitivity, specificity, F-measure, and area under the curve (AUC) metrics obtained by these classification algorithms were used as performance evaluation metrics. When Table 3 is analyzed, one may notice that AdaBoost and XGBoost methods are more successful than other methods regarding overall performance. The AdaBoost algorithm achieved an effective machine learning prediction performance with an AUC of 0.99, an accuracy of 0.97, and an F-measure of 0.97. With the XGBoost algorithm, the correct classification rate was high with an AUC of 0.99, a sensitivity of 0.95, and a specificity of 0.96. These two algorithms generated reliable classification results with high AUC and low standard deviation values. As a result, high-performance metrics obtained with a small number of features (17) draw attention to the union method as an effective approach for ASD diagnosis.
Table 3.
Performance metrics of different classifiers using 17 union features.
3.2. Potential ASD-Associated Microbial Biomarkers
3.2.1. ASD-Associated Microbial Biomarkers Based on Taxonomic Grouping
In this section, we present the potential ASD-related microbial signatures identified through microBiomeGSM. The microBiomeGSM tool provides an effective approach for identifying microorganisms that exhibit significant differences at various taxonomic levels based on microbiome data analysis. By utilizing relative abundance values from the samples, the tool successfully identifies key biomarker candidates across three distinct taxonomic ranks (e.g., family, genus, and order levels). These findings are valuable not only for enhancing disease prediction performance but also for gaining deeper insights into the functional differences within microbial communities. Notably, some of the discriminative features identified by microBiomeGSM are consistent with biomarkers previously reported in the literature, further supporting the biological relevance of the results. The relevance of these microorganisms for ASD is discussed in the following section. The detailed outcomes regarding the selected features at each taxonomic level are presented in Figure 3.
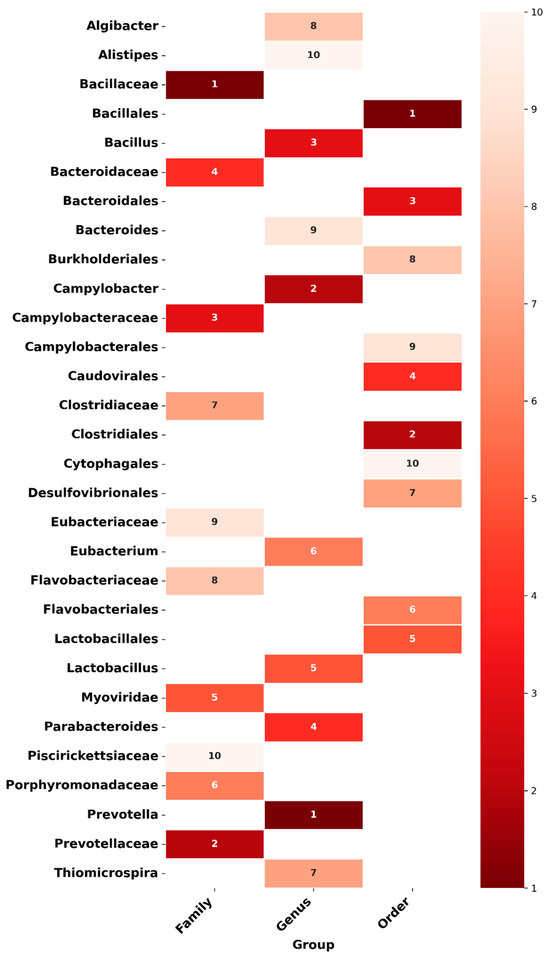
Figure 3.
Heatmap illustrates the importance of microorganisms in the predictive model based on taxonomic groups (order, genus, and family) obtained using the microBiomeGSM tool. The color intensity represents the importance level, with lighter shades indicating lower importance and darker shades representing higher importance.
Figure 3 presents the heatmap illustrating the importance of microorganisms in the predictive model, based on taxonomic groups obtained by the microBiomeGSM tool. This figure shows the importance of microorganisms on a scale from 1 (highest importance) to 10 (lowest importance) at the taxonomic levels of order, genus, and family. The color shading reflects these importance levels, with darker colors indicating more important microorganisms and lighter colors indicating less important ones. The heatmap clearly highlights the microorganisms with the highest importance at each taxonomic level. For example, Bacillales at the order level, Prevotella at the genus level, and Bacillaceae at the family level stand out as the groups that contribute most to the model’s predictive mechanisms. This graph illustrates the influence of microorganisms at different taxonomic levels on the model; it shows that groups with high importance are more decisive for the model predictions. In contrast, microorganisms with low importance have less influence, and more variation is observed in these groups.
3.2.2. ASD-Associated Microbial Biomarkers Obtained from SVM-RCE and RCE-IFE
SVM-RCE and RCE-IFE methods are used to identify possible biomarkers associated with autism spectrum disorders (ASDs). Both methods utilize the RobustRankAggreg algorithm to identify effective microorganisms. This algorithm combines the rankings generated by each technique, assigns statistical significance values (p-values) to the features, and ranks them according to their overall importance, allowing for a more reliable feature selection. This integrative method ensures the consistent identification of relevant microbial taxa and reduces the effect of bias between methods.
Figure 4 provides a comparative representation of the relative importance scores of microbial taxa identified using the SVM-RCE and RCE-IFE methods. On the Y-axis, microbial taxa are listed in alphabetical order; on the X-axis, normalized importance scores are presented (1.0: most important, 0.1: least important). Bars are precisely aligned with the corresponding taxa and displayed on the same horizontal line to facilitate visual comparison. According to the SVM-RCE method, the top three most important taxa are Shewanella sp. Sh95, Bacteroides coprosuis, and Streptococcus mutans [35,36], whereas Bacteroides vulgatus [37,38], Spirosoma radiotolerans, and Luteimonas huabeiensis are prioritized by the RCE-IFE approach.
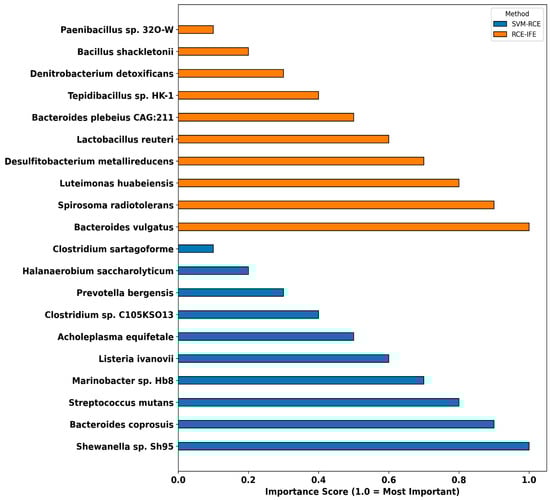
Figure 4.
The top 10 microorganisms identified as potential microbial signatures by the SVM-RCE and RCE-IFE methods.
3.2.3. ASD-Associated Microbial Biomarkers Obtained from Different Feature Selection Methods
Feature selection techniques play a critical role in identifying the most informative features from high-dimensional datasets, thereby enhancing classification performance. In this study, classification was performed using 100 features across various classifiers and various feature selection methods. Each feature selection method assigned importance scores to the features, and the top 10 features were selected based on these scores, independently of the classifier used. To avoid redundancy, features identified by multiple classifiers were included only once in the final list; if a feature appeared more than once, the next highest-ranked feature was selected instead. Table 4 presents the top 10 features identified through the combined use of five distinct feature selection methods and five different classifiers.
Table 4.
Top 10 features identified by different feature selection methods.
3.2.4. ASD-Associated Microbial Biomarkers Obtained Using Union Method
The union feature set was constructed based on the features with an importance score of 0.5 or higher, identified through the application of the AdaBoost classifier in combination with the XGBoost and SelectKBest (SKB) feature selection methods. In this process, features selected by either XGBoost or SKB feature selection techniques were compiled to form the union set, as shown in Figure 5.
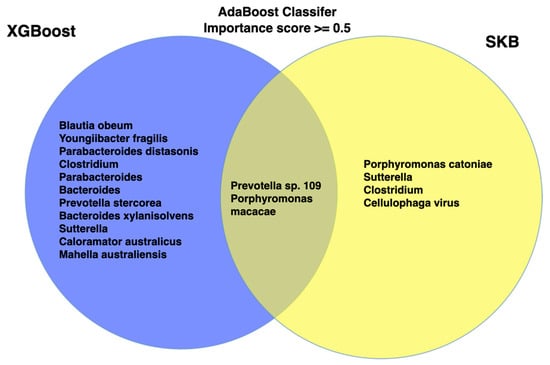
Figure 5.
Venn diagram represents union and intersects of the features obtained by XGB and SKB feature selection methods.
Following feature selection, it is essential to evaluate the relative importance of each feature within the predictive model. To this end, SHAP values were utilized to quantify the contribution of each union feature to the model’s predictions. SHAP (SHapley Additive exPlanations) is a model-agnostic interpretability method based on cooperative game theory that quantifies the individual contribution of each feature to the performance of the model [39]. For this purpose, the average marginal contribution of a feature is calculated across all possible feature subgroups, ensuring a fair and consistent assignment of importance. SHAP values can be interpreted both globally and locally: they allow features to be categorized according to their overall importance and also explain individual predictions on a sample basis. This makes SHAP particularly suitable for identifying important biomarkers and understanding how certain features influence modeling decisions in clinical or biological applications. Figure 6 shows the average absolute SHAP values calculated using the XGBoost classification algorithm with 5-fold cross-validation and their corresponding standard deviations.

Figure 6.
Feature importance based on SHAP Values using union feature set.
This approach enables assessment of both the magnitude and consistency of feature importance. Among the features, Prevotella sp. 109, Parabacteroides distasonis, Porphyromonas macacae, Prevotella stercorea CAG:629, and Bacteroides xylanisolvens demonstrated the highest and most stable contributions to the model. In contrast, lower-ranked features exhibited greater variability across folds, indicating less consistent predictive influence. These findings emphasize the importance of specific microbial taxa and contribute to the development of robust, interpretable clinical decision-support systems.
4. Discussion
The human microbiome is recognized as a fundamental component of the body and is increasingly associated with various aspects of development and health. There is a growing body of research showing that microbiota plays a crucial role in the diagnosis and treatment of human diseases. In particular, structures in the gut microbiome derived from human feces have been found to be associated with a variety of diseases, such as autism spectrum disorder (ASD), colorectal cancer (CRC) [40], type 2 diabetes (T2D) [41], and inflammatory bowel disease (IBD) [42]. Current research focuses on the identification of predictive microorganism biomarkers through machine learning techniques using species relative abundance data. In this study, model validation was only performed using the internal cross-validation method on a single dataset. Therefore, the generalizability of the model to other populations remains uncertain. These results should be considered as exploratory.
4.1. Performance Evaluation of Proposed Methods
This study evaluates the performance of modeling approaches developed to achieve higher accuracy in disease classification and prediction with fewer features. At the taxonomic level, metagenomic data are used to generate a dataset of relative abundance values of species. In this context, five different methods were comprehensively tested. Additionally, this research also identified microbial signatures associated with ASD. The applied machine learning models generally showed high classification performance. In 10-fold MCCV experiments, the highest AUC (0.99) was achieved following two approaches. The first approach is the model with 100 features obtained with an XGBoost-based feature selection and combined with the AdaBoost classifier. The second approach is the model using 17 union features obtained with different feature selection methods. These impressive results are followed by the microBiomeGSM tool with about 100 features and an AUC of 0.96, and the RCE-IFE method with an AUC of 0.94. In contrast, the SVM-RCE method showed lower discriminatory power compared to the other methods, with an AUC value of 0.89. The results demonstrate that learning-based and integrative feature selection strategies can substantially enhance classification performance. As illustrated in Table 1, taxonomic resolution emerges as a critical determinant within the modeling framework. Notably, the family-level taxonomy yielded well-balanced AUC, sensitivity, and specificity metrics, suggesting a higher degree of biological discriminative capacity at this level. These findings underscore the strategic importance of selecting the appropriate taxonomic tier in alignment with the classification objective, as it plays a pivotal role in determining the overall efficacy of the predictive model. On the other hand, the AUC values in Table 2 provide a comparative assessment of the classification performance of the analyzed models. In this context, the microBiomeGSM model developed at the genus level showed the best performance with an AUC value of 0.96. This high value shows that the model can effectively distinguish between positive and negative samples and provide reliable results in classification tasks. The RCE-IFE method also showed strong discriminatory ability with an AUC of 0.94, while the SVM-RCE method lagged behind the others with a lower AUC of 0.89. The RCE-IFE method is a cluster-based selection approach that works with feature sets in a similar way to the SVM-RCE method; however, there is a fundamental difference between the two methods. RCE-IFE applies an internal elimination mechanism not only between clusters but also to individual features within each cluster. This allows not only low-performing clusters to be eliminated but also features of low importance within those clusters, resulting in a more refined and informative feature subset. This internal filtering process allows the model to learn from more informative biomarkers, increasing its generalizability and contributing to better results for performance metrics such as AUC. The AUC values shown in Table 3 allow meaningful conclusions to be drawn about the discriminatory power of the individual models. Among the algorithms evaluated, AdaBoost and XGBoost achieved the highest AUC values of 0.99 with small standard deviations of ±0.01 and ±0.03, respectively, suggesting that they performed well not only in terms of high accuracy but also in terms of interfold consistency. As can be seen in Figure 2, the feature selection methods used have a significant impact on the performance of the classification models. Specifically, XGBoost-based feature selection consistently achieved the highest AUC values across all classifiers, indicating superior class discrimination capabilities. In contrast, MRMR and FCBF led to substantially lower performance in several models. These results underscore the importance of adopting learning-based feature selection strategies to enhance the overall predictive accuracy and robustness of the models.
4.2. Biological Interpretations of the Findings
Prevotella emerged as the most significant genus identified by the microBiomeGSM tool (shown in Figure 3). Additionally, Prevotella species were also found to be important by the XGBoost and SKB feature selection methods (shown in Figure 5 and Figure 6). Furthermore, Prevotella bergensis was also identified by SVM-RCE (Figure 4). Prevotella spp. are highly abundant in the human microbiome [43]. Moreover, they play a pivotal role in maintaining human physiological balance through various factors such as diet, lifestyle, and geographical conditions. These factors affect the diversity and prevalence of Prevotella in the human microbiome. Reduced Prevotella abundance, consistently observed in individuals with autism spectrum disorder (ASD) across multiple studies, may contribute to ASD-related pathophysiology through several interlinked mechanisms. Prevotella species are key fiber-fermenting commensals that produce SCFAs such as butyrate, propionate, and acetate, which regulate gut barrier integrity, immune homeostasis, and neuroactive signaling [44]. A decline in Prevotella can therefore alter SCFA profiles, impair mucosal barrier function, and facilitate the translocation of microbial products, promoting systemic inflammation and neuroimmune activation [45]. Furthermore, Prevotella-associated metabolic pathways influence tryptophan catabolism, modulating serotonin and kynurenine production, and can affect bile acid metabolism, both of which are implicated in gut–brain communication and neurodevelopmental processes [46,47]. In the literature, a study revealed that autism is associated with reduced diversity and distinct alterations in gut microbiota, particularly marked by lower levels of Prevotella [48]. These microbial changes were more strongly linked to autistic symptoms than to gastrointestinal issues or diet, highlighting the potential of gut microbiota as targets for diagnosis or treatment [49]. Loss of fiber fermentation altered short-chain fatty acid (SCFA) profile, gut barrier dysfunction, immune/inflammatory modulation, tryptophan/serotonin and kynurenine pathways, bile-acid and other metabolite changes, neural signaling, and microglial effects, which may correlate with ASD formation and progression. Another metagenomic study reported that mucosa-associated bacterial species, including Prevotella, are associated with gut dysbiosis in autism [50]. In another study, it is suggested that dietary vitamin A may influence ASD symptoms by regulating Prevotella in the gut, offering a potential new treatment approach [51]. One review discussed in detail gut microbiota changes in children with ASD [52]. In this review, it is mentioned that vitamin A supplementation on gut microbiota results in increasing Prevotella levels in children with autism since vitamin A plays an important role in the regulation of gut microbiota [53]. A recent study on microbiota transfer therapy (MTT) showed increased levels of Prevotella, Bifidobacterium, and Desulfovibrio species after treatment, along with significant and lasting improvements in ASD behavioral symptoms [54]. However, the causality of ASD still remains uncertain, as dietary patterns low in fiber, frequent antibiotic use, and gastrointestinal comorbidities are known to reduce Prevotella abundance, suggesting that its depletion may also be a consequence of these factors. Feature studies are therefore needed to enlighten the cause–effect relationships and clarify the mechanistic role of Prevotella in ASD.
Parabacteroides distasonis has been identified as the second top-scoring species in SHAP analysis (Figure 6). Also, the importance of Parabacteroides is revealed by microBiomeGSM analysis at the genus level (Figure 3). A metagenomic study indicated that children with ASD had a lower percentage of Parabacteroides in their gut microbiota compared to typically developing children, suggesting a potential association between reduced Parabacteroides abundance and ASD [55]. Another study evaluated the gut microbiota composition in children with ASD [56]. At the genus level, the researchers observed that the relative abundance of Parabacteroides was significantly decreased in children with ASD [56].
In our approach, Porphyromonas macacae, consistently identified by three distinct feature selection methods, has very limited support in the current literature regarding its association with autism. However, one study highlights the role of the microbiome in the neurobiology of social behavior [57]. Yet another study suggests that the gut microbiome may influence stress responses, with certain bacteria like Bifidobacterium, lower levels of Firmicutes, and higher levels of Bacteroidetes (Parapedobacter spp., and Porphyromonas spp.) potentially promoting resilience to social stress [58].
Bacteroides vulgatus is shown in Figure 4 as the most important species obtained from RCE-IFE. A study that analyzes fecal microbiota revealed that the increased relative abundance of Bacteroides vulgatus in children with autism suggests potential site-specific variations in microbial abundance [59]. However, further research is needed to clarify its specific function and potential as a biomarker or therapeutic target. In a peer review, changes in the relative abundance of bacterial taxa, such as increased levels of Clostridium sp. and Bacteroides vulgatus and reduced levels of Prevotella sp. in ASD, have been discussed in detail [60]. In a two-phase study, the fecal metagenomes of children with ASD were analyzed and compared to those of typically developing children, revealing gut dysbiosis in ASD marked by a decrease in Prevotella species [61]. Following a three-month pilot intervention involving a combination of probiotics and dietary changes, fecal levels of Bifidobacterium increased, while Blautia obeum levels decreased [61]. These findings suggest a potential link between Blautia obeum abundance and ASD symptoms, highlighting the possibility that targeting this bacterium could help alleviate gastrointestinal and behavioral issues associated with ASD.
Several microorganisms identified by the SVM-RCE and RCE-IFE tools have previously been reported in the literature as being associated with ASD. However, no overlapping microorganisms were found between the two methods. In contrast, the microBiomeGSM tool identified microorganisms spanning three different taxonomic levels, offering a potentially valuable resource for researchers in this field. Among the predicted biomarker candidates, some, such as Bacillales [62], Prevotella, and Alistipes [63], have been experimentally validated in prior studies for their association with ASD. Microorganisms not yet experimentally validated or reported in the literature may represent promising targets for future research. In upcoming studies, deep learning approaches are planned to be integrated into the existing tools to further improve prediction performance.
This study has some limitations. Firstly, the sample size used for the analysis was relatively small (N = 60), which may limit the generalizability of the model. Small datasets are more prone to overfitting and may not capture all of the biological heterogeneity present in the broader population. In addition, model validation was only performed by internal cross-validation, and predictive performance was not assessed using independent external datasets obtained from different research centers. Therefore, the external validity of the identified microbial biomarkers is not yet fully established. In addition, potential confounding variables that may influence the gut microbiome—such as dietary habits and gastrointestinal symptoms—were not available in the dataset and could therefore not be controlled for. For these reasons, the current results should be interpreted as preliminary, and further validation using larger and well-characterized independent cohorts is required. The gut microbiota can be influenced by various confounding factors such as diet, gastrointestinal symptoms, and medication. In the dataset used, ASD individuals were selected from individuals with functional constipation in order to obtain a homogeneous sample. However, as detailed metadata at the individual level was not available, it cannot be said that all of these variables were fully controlled.
5. Conclusions
In this study, to identify microbial signatures associated with autism spectrum disorder (ASD), we analyzed metagenomic data derived from the human gut microbiota of individuals with ASD and healthy controls using SVM-RCE, RCE-IFE, various feature selection methods, and the microBiomeGSM tool. While SVM-RCE and RCE-IFE are computational, clustering-based feature selection approaches, microBiomeGSM utilizes biological domain knowledge to group, score, and model features. By employing the Grouping–Scoring–Modeling (GSM) approach, microBiomeGSM aims to identify the most relevant taxonomic groups associated with disease within metagenomic datasets. The SVM-RCE method achieved an AUC of 0.89, whereas the RCE-IFE method yielded a higher AUC of 0.94. The microBiomeGSM tool demonstrated an AUC of 0.96 for classification at the genus level. The highest performance among the applied feature selection methods was achieved using the XGBoost-based feature selection approach in combination with the AdaBoost classifier, resulting in an AUC of 0.99. Furthermore, the methods proposed in this study facilitated the identification of potential microbial signatures. Specifically, Bacteroides vulgatus was identified as a microbial signature at the species level by the SVM-RCE method, Shewanella sp. Sh95 was detected by the RCE-IFE method, and Blautia obeum was emphasized by the XGBoost-based approach. Prevotella species have been found to be ASD-associated by the microBiomeGSM tool at the genus level, by XGB and SKB feature selection methods, and by the RCE-IFE method. The microbial biomarkers identified in this study have the potential to serve as supportive tools in the diagnosis of ASD. Microbiome profiling based on taxa such as Prevotella and Parabacteroides could become key targets in the development of future non-invasive diagnostic kits. These biomarkers could also be promising candidates for microbiota-based therapeutic interventions. The importance of parabacterioides has been proposed by microBiomeGSM (at the genus level) and the FCBF, MRMR, XGB, and SKB feature selection methods. Previously unreported features that are identified by the proposed tools provide valuable insights that may contribute to future research. In subsequent studies, the integration of deep learning approaches into the proposed framework is planned, aiming to enhance disease prediction performance and improve biomarker identification within metagenomic datasets.
Author Contributions
Conceptualization, M.T., N.S.E., B.B.-G., and M.Y.; methodology, M.T., N.S.E., B.B.-G., and M.Y.; software, M.T., N.S.E., B.B.-G., and M.Y.; validation, M.T., N.S.E., B.B.-G., and M.Y.; formal analysis, M.T. and N.S.E.; investigation, M.T., N.S.E., B.B.-G., and M.Y.; resources, M.T., N.S.E., B.B.-G., and M.Y.; data curation, M.T. and N.S.E.; writing—original draft preparation, M.T. and N.S.E.; writing—review and editing, M.T., N.S.E., and B.B.-G.; visualization, M.T. and N.S.E.; supervision, B.B.-G. and M.Y.; project administration, B.B.-G. and M.Y.; funding acquisition, B.B.-G. and M.Y. All authors All authors have read and agreed to the published version of the manuscript.
Funding
The work of B.B.G. has also been supported by the Abdullah Gul University Support Foundation (AGUV). B.B.G. would like to express her gratitude to the L’Oréal-UNESCO Young Women Scientist Program. The work of M.Y. has been supported by Zefat Academic College. The work of N.S.E. is supported by the TUBITAK 2211-A BIDEB program.
Institutional Review Board Statement
Not applicable.
Informed Consent Statement
Not applicable.
Data Availability Statement
The dataset used in this study was obtained from the NCBI Sequence Reading Archive (SRA) database under accession number GSE113540.
Acknowledgments
We extend our gratitude to COST Action ML4Microbiome, which has played a pivotal role in advancing microbiome research and facilitating the expansion of these research endeavors. During the preparation of this manuscript, the author used ChatGPT (GPT-4, May 2025 version) for the purposes of editing sentence structure and checking for grammatical errors. The author has reviewed and edited the output and takes full responsibility for the content of this publication.
Conflicts of Interest
The authors declare no conflicts of interest.
Abbreviations
The following abbreviations are used in this manuscript:
| ASD | Autism Spectrum Disorder |
| AUC | Area Under the Curve |
| SHAP | SHapley Additive exPlanations |
| XAI | Explainable Artificial Intelligence |
References
- Ganai, U.J.; Ratne, A.; Bhushan, B.; Venkatesh, K.S. Early detection of autism spectrum disorder: Gait deviations and machine learning. Sci. Rep. 2025, 15, 873. [Google Scholar] [CrossRef]
- Lord, C.; Elsabbagh, M.; Baird, G.; Veenstra-Vanderweele, J. Autism spectrum disorder. Lancet 2018, 392, 508–520. [Google Scholar] [CrossRef] [PubMed]
- Hodges, H.; Fealko, C.; Soares, N. Autism spectrum disorder: Definition, epidemiology, causes, and clinical evaluation. Transl. Pediatr. 2020, 9, S55–S65. [Google Scholar] [CrossRef]
- Jabbar, U.; Iqbal, M.W.; Alourani, A.; Shinan, K.; Alanazi, F.; Sarwar, N.; Ashraf, M.U. Machine Learning–Based Approach for Early Screening of Autism Spectrum Disorders. Appl. Comput. Intell. Soft Comput. 2025, 2025, 9975499. [Google Scholar] [CrossRef]
- Rylaarsdam, L.; Guemez-Gamboa, A. Genetic Causes and Modifiers of Autism Spectrum Disorder. Front. Cell. Neurosci. 2019, 13, 385. [Google Scholar] [CrossRef]
- Estes, A.; Swain, D.M.; MacDuffie, K.E. The effects of early autism intervention on parents and family adaptive functioning. Pediatr. Med. 2019, 2, 21. [Google Scholar] [CrossRef]
- Talantseva, O.I.; Romanova, R.S.; Shurdova, E.M.; Dolgorukova, T.A.; Sologub, P.S.; Titova, O.S.; Kleeva, D.F.; Grigorenko, E.L. The global prevalence of autism spectrum disorder: A three-level meta-analysis. Front. Psychiatry 2023, 14, 1071181. [Google Scholar] [CrossRef]
- Gomaa, E.Z. Human gut microbiota/microbiome in health and diseases: A review. Antonie Van Leeuwenhoek 2020, 113, 2019–2040. [Google Scholar] [CrossRef] [PubMed]
- Mejía-Granados, D.M.; Villasana-Salazar, B.; Coan, A.C.; Rizzi, L.; Balthazar, M.L.F.; de Godoi, A.B.; do Canto, A.M.; Rosa, D.C.; Silva, L.S.; Tacla, R.d.R.; et al. Gut microbiome in neuropsychiatric disorders. Arq. Neuropsiquiatr. 2022, 80, 192–207. [Google Scholar] [CrossRef] [PubMed]
- Belkaid, Y.; Hand, T.W. Role of the microbiota in immunity and inflammation. Cell 2014, 157, 121–141. [Google Scholar] [CrossRef]
- Marchesi, J.R.; Adams, D.H.; Fava, F.; Hermes, G.D.A.; Hirschfield, G.M.; Hold, G.; Quraishi, M.N.; Kinross, J.; Smidt, H.; Tuohy, K.M.; et al. The gut microbiota and host health: A new clinical frontier. Gut 2016, 65, 330–339. [Google Scholar] [CrossRef]
- Shi, K.; Liu, Q.; Ji, Q.; He, Q.; Zhao, X.-M. MicroHDF: Predicting host phenotypes with metagenomic data using a deep forest-based framework. Brief. Bioinform. 2024, 25, bbae530. [Google Scholar] [CrossRef]
- Truong, D.T.; Franzosa, E.A.; Tickle, T.L.; Scholz, M.; Weingart, G.; Pasolli, E.; Tett, A.; Huttenhower, C.; Segata, N. MetaPhlAn2 for enhanced metagenomic taxonomic profiling. Nat. Methods 2015, 12, 902–903. [Google Scholar] [CrossRef]
- Kuczynski, J.; Stombaugh, J.; Walters, W.A.; González, A.; Caporaso, J.G.; Knight, R. Using QIIME to Analyze 16S rRNA Gene Sequences from Microbial Communities. Curr. Protoc. Microbiol. 2012, 27, 1E.5.1–1E.5.20. [Google Scholar] [CrossRef] [PubMed]
- LaPierre, N.; Ju, C.J.-T.; Zhou, G.; Wang, W. MetaPheno: A critical evaluation of deep learning and machine learning in metagenome-based disease prediction. Methods 2019, 166, 74–82. [Google Scholar] [CrossRef] [PubMed]
- Hodgkiss, R.; Acharjee, A. Unravelling metabolite-microbiome interactions in inflammatory bowel disease through AI and interaction-based modelling. Biochim. Biophys. Acta (BBA)-Mol. Basis Dis. 2025, 1871, 167618. [Google Scholar] [CrossRef] [PubMed]
- Bakir-Gungor, B.; Temiz, M.; Jabeer, A.; Wu, D.; Yousef, M. microBiomeGSM: The identification of taxonomic biomarkers from metagenomic data using grouping, scoring and modeling (G-S-M) approach. Front. Microbiol. 2023, 14, 1264941. [Google Scholar] [CrossRef]
- Sun, Y.; Gan, Z.; Liu, S.; Zhang, S.; Zhong, W.; Liu, J.; Huang, X.; He, W.; Zhong, H.; Cao, Q. Metagenomic and Transcriptomic Analysis Reveals Crosstalk Between Intratumor Mycobiome and Hosts in Early-Stage Nonsmoking Lung Adenocarcinoma Patients. Thorac. Cancer 2025, 16, e15527. [Google Scholar] [CrossRef]
- Zhang, D.; Wang, Q.; Li, D.; Chen, S.; Chen, J.; Zhu, X.; Bai, F. Gut microbiome composition and metabolic activity in metabolic-associated fatty liver disease. Virulence 2025, 16, 2482158. [Google Scholar] [CrossRef]
- Syama, K.; Jothi, J.A.A.; Khanna, N. Automatic disease prediction from human gut metagenomic data using boosting GraphSAGE. BMC Bioinform. 2023, 24, 126. [Google Scholar] [CrossRef]
- Dan, Z.; Mao, X.; Liu, Q.; Guo, M.; Zhuang, Y.; Liu, Z.; Chen, K.; Chen, J.; Xu, R.; Tang, J.; et al. Altered gut microbial profile is associated with abnormal metabolism activity of Autism Spectrum Disorder. Gut Microbes 2020, 11, 1246–1267. Available online: https://www.tandfonline.com/doi/abs/10.1080/19490976.2020.1747329 (accessed on 17 February 2025). [CrossRef]
- Liu, Z.; Mao, X.; Dan, Z.; Pei, Y.; Xu, R.; Guo, M.; Liu, K.; Zhang, F.; Chen, J.; Su, C.; et al. Gene variations in autism spectrum disorder are associated with alteration of gut microbiota, metabolites and cytokines. Gut Microbes 2021, 13, 1854967. [Google Scholar] [CrossRef] [PubMed]
- Bakir-Gungor, B.; Temiz, M.; Canakcimaksutoglu, B.; Yousef, M. Prediction of colorectal cancer based on taxonomic levels of microorganisms and discovery of taxonomic biomarkers using the Grouping-Scoring-Modeling (G-S-M) approach. Comput. Biol. Med. 2025, 187, 109813. [Google Scholar] [CrossRef]
- Temiz, M.; Kuzudisli, C.; Yousef, M.; Bakir-Gungor, B. Prediction of Type 2 Diabetes using Metagenomic Data and Identification of Taxonomic Biomarkers. In Proceedings of the 2024 32nd Signal Processing and Communications Applications Conference (SIU), Mersin, Turkey, 15–18 May 2024; pp. 1–4. [Google Scholar]
- Yousef, M.; Jabeer, A.; Bakir-Gungor, B. SVM-RCE-R-OPT: Optimization of Scoring Function for SVM-RCE-R. In Database and Expert Systems Applications-DEXA 2021 Workshops; Kotsis, G., Tjoa, A.M., Khalil, I., Moser, B., Mashkoor, A., Sametinger, J., Fensel, A., Martinez-Gil, J., Fischer, L., Czech, G., et al., Eds.; Communications in Computer and Information Science; Springer International Publishing: Cham, Switzerland, 2021; pp. 215–224. [Google Scholar]
- Kuzudisli, C.; Bakir-Gungor, B.; Qaqish, B.; Yousef, M. RCE-IFE: Recursive cluster elimination with intra-cluster feature elimination. PeerJ Comput. Sci. 2025, 11, e2528. [Google Scholar] [CrossRef] [PubMed]
- Bakir-Gungor, B.; Temiz, M.; Inal, Y.; Cicekyurt, E.; Yousef, M. CCPred: Global and population-specific colorectal cancer prediction and metagenomic biomarker identification at different molecular levels using machine learning techniques. Comput. Biol. Med. 2024, 182, 109098. [Google Scholar] [CrossRef]
- Fleuret, F.; Ch, E. Fast Binary Feature Selection with Conditional Mutual Information. J. Mach. Learn. Res. 2004, 5, 1531–1555. [Google Scholar]
- Senliol, B.; Gulgezen, G.; Yu, L.; Cataltepe, Z. Fast Correlation Based Filter (FCBF) with a different search strategy. In Proceedings of the 2008 23rd International Symposium on Computer and Information Sciences, Istanbul, Turkey, 27–29 October 2008; pp. 1–4. [Google Scholar] [CrossRef]
- Ding, C.; Peng, H. Minimum redundancy feature selection from microarray gene expression data. J. Bioinform. Comput. Biol. 2005, 3, 185–205. [Google Scholar] [CrossRef]
- Pedregosa, F.; Varoquaux, G.; Gramfort, A.; Michel, V.; Thirion, B.; Grisel, O.; Blondel, M.; Prettenhofer, P.; Weiss, R.; Dubourg, V.; et al. Scikit-learn: Machine Learning in Python. Mach. Learn. Python 2011, 12, 2825–2830. [Google Scholar]
- Bakir-Gungor, B.; Bulut, O.; Jabeer, A.; Nalbantoglu, O.U.; Yousef, M. Discovering Potential Taxonomic Biomarkers of Type 2 Diabetes From Human Gut Microbiota via Different Feature Selection Methods. Front. Microbiol. 2021, 12, 628426. [Google Scholar] [CrossRef]
- Bakir-Gungor, B.; Hacılar, H.; Jabeer, A.; Nalbantoglu, O.U.; Aran, O.; Yousef, M. Inflammatory bowel disease biomarkers of human gut microbiota selected via different feature selection methods. PeerJ 2022, 10, e13205. [Google Scholar] [CrossRef] [PubMed]
- Jabeer, A.; KoÇak, A.; Akkaş, H.; Yenisert, F.; Nalbantoğlu, Ö.U.; Yousef, M.; GÜngÖr, B.B. Identifying Taxonomic Biomarkers of Colorectal Cancer in Human Intestinal Microbiota Using Multiple Feature Selection Methods. In Proceedings of the 2022 Innovations in Intelligent Systems and Applications Conference (ASYU), Biarritz, France, 7–9 September 2022; IEEE: Piscataway, NJ, USA, 2022; pp. 1–6. [Google Scholar]
- Tulumbacı, F.; Korkut, E.; Özer, H. Comparative Evaluation of Oral Health Status in Healthy Children and Children with Autism Spectrum Disorder. J. Pediatr. Infect. Dis. 2020, 15, 223–227. [Google Scholar] [CrossRef]
- Gong, W.; Qiao, Y.; Li, B.; Zheng, X.; Xu, R.; Wang, M.; Mi, X.; Li, Y. The Alteration of Salivary Immunoglobulin A in Autism Spectrum Disorders. Front. Psychiatry 2021, 12, 669193. [Google Scholar] [CrossRef]
- Zou, R.; Xu, F.; Wang, Y.; Duan, M.; Guo, M.; Zhang, Q.; Zhao, H.; Zheng, H. Changes in the Gut Microbiota of Children with Autism Spectrum Disorder. Autism Res. 2020, 13, 1614–1625. [Google Scholar] [CrossRef]
- Wang, M.; Wan, J.; Rong, H.; He, F.; Wang, H.; Zhou, J.; Cai, C.; Wang, Y.; Xu, R.; Yin, Z.; et al. Alterations in Gut Glutamate Metabolism Associated with Changes in Gut Microbiota Composition in Children with Autism Spectrum Disorder. mSystems 2019, 4, e00321-18. [Google Scholar] [CrossRef]
- Shapley, L.S. Stochastic Games*. Proc. Natl. Acad. Sci. USA 1953, 39, 1095–1100. [Google Scholar] [CrossRef]
- Song, M.; Chan, A.T.; Sun, J. Influence of the Gut Microbiome, Diet, and Environment on Risk of Colorectal Cancer. Gastroenterology 2020, 158, 322–340. [Google Scholar] [CrossRef] [PubMed]
- Salamon, D.; Sroka-Oleksiak, A.; Kapusta, P.; Szopa, M.; Mrozińska, S.; Ludwig-Słomczyńska, A.; Wołkow, P.; Bulanda, M.; Klupa, T.; Malecki, M.; et al. Characteristics of the gut microbiota in adult patients with type 1 and 2 diabetes based on the analysis of a fragment of 16S rRNA gene using next-generation sequencing. Pol. Arch. Intern. Med. 2018, 128, 336–343. [Google Scholar] [CrossRef] [PubMed]
- Alam, M.T.; Amos, G.C.A.; Murphy, A.R.J.; Murch, S.; Wellington, E.M.H.; Arasaradnam, R.P. Microbial imbalance in inflammatory bowel disease patients at different taxonomic levels. Gut Pathog. 2020, 12, 1. [Google Scholar] [CrossRef] [PubMed]
- Tett, A.; Pasolli, E.; Masetti, G.; Ercolini, D.; Segata, N. Prevotella diversity, niches and interactions with the human host. Nat. Rev. Microbiol. 2021, 19, 585–599. [Google Scholar] [CrossRef]
- Silva, Y.P.; Bernardi, A.; Frozza, R.L. The Role of Short-Chain Fatty Acids from Gut Microbiota in Gut-Brain Communication. Front. Endocrinol. 2020, 11, 25. [Google Scholar] [CrossRef] [PubMed]
- Zhou, M.; Niu, B.; Ma, J.; Ge, Y.; Han, Y.; Wu, W.; Yue, C. Intervention and research progress of gut microbiota-immune-nervous system in autism spectrum disorders among students. Front. Microbiol. 2025, 16, 1535455. [Google Scholar] [CrossRef]
- Gao, K.; Mu, C.; Farzi, A.; Zhu, W. Tryptophan Metabolism: A Link Between the Gut Microbiota and Brain. Adv. Nutr. 2020, 11, 709–723. [Google Scholar] [CrossRef]
- Golubeva, A.V.; Joyce, S.A.; Moloney, G.; Burokas, A.; Sherwin, E.; Arboleya, S.; Flynn, I.; Khochanskiy, D.; Moya-Pérez, A.; Peterson, V.; et al. Microbiota-related Changes in Bile Acid & Tryptophan Metabolism are Associated with Gastrointestinal Dysfunction in a Mouse Model of Autism. eBioMedicine 2017, 24, 166–178. [Google Scholar] [CrossRef]
- Bezawada, N.; Phang, T.H.; Hold, G.L.; Hansen, R. Autism Spectrum Disorder and the Gut Microbiota in Children: A Systematic Review. Ann. Nutr. Metab. 2020, 76, 16–29. [Google Scholar] [CrossRef]
- Kang, D.-W.; Park, J.G.; Ilhan, Z.E.; Wallstrom, G.; LaBaer, J.; Adams, J.B.; Krajmalnik-Brown, R. Reduced Incidence of Prevotella and Other Fermenters in Intestinal Microflora of Autistic Children. PLoS ONE 2013, 8, e68322. [Google Scholar] [CrossRef]
- Agarwala, S.; Naik, B.; Ramachandra, N.B. Mucosa-associated specific bacterial species disrupt the intestinal epithelial barrier in the autism phenome. Brain Behav. Immun. Health 2021, 15, 100269. [Google Scholar] [CrossRef] [PubMed]
- Xu, X.; Zhang, Y.; Zhang, X. Autism Spectrum Disorder is Related to Increasing Intestinal Prevotella That Can Be Regulated by Vitamin A. Iran. J. Psychiatry Behav. Sci. 2023, 17, e126508. [Google Scholar] [CrossRef]
- Ho, L.K.H.; Tong, V.J.W.; Syn, N.; Nagarajan, N.; Tham, E.H.; Tay, S.K.; Shorey, S.; Tambyah, P.A.; Law, E.C.N. Gut microbiota changes in children with autism spectrum disorder: A systematic review. Gut Pathog. 2020, 12, 6. [Google Scholar] [CrossRef] [PubMed]
- Liu, J.; Liu, X.; Xiong, X.-Q.; Yang, T.; Cui, T.; Hou, N.-L.; Lai, X.; Liu, S.; Guo, M.; Liang, X.-H.; et al. Effect of vitamin A supplementation on gut microbiota in children with autism spectrum disorders—A pilot study. BMC Microbiol. 2017, 17, 204. [Google Scholar] [CrossRef]
- Kang, D.-W.; Adams, J.B.; Gregory, A.C.; Borody, T.; Chittick, L.; Fasano, A.; Khoruts, A.; Geis, E.; Maldonado, J.; McDonough-Means, S.; et al. Microbiota Transfer Therapy alters gut ecosystem and improves gastrointestinal and autism symptoms: An open-label study. Microbiome 2017, 5, 10. [Google Scholar] [CrossRef]
- Xu, M.; Xu, X.; Li, J.; Li, F. Association Between Gut Microbiota and Autism Spectrum Disorder: A Systematic Review and Meta-Analysis. Front. Psychiatry 2019, 10, 473. [Google Scholar] [CrossRef] [PubMed]
- Strati, F.; Cavalieri, D.; Albanese, D.; De Felice, C.; Donati, C.; Hayek, J.; Jousson, O.; Leoncini, S.; Renzi, D.; Calabrò, A.; et al. New evidences on the altered gut microbiota in autism spectrum disorders. Microbiome 2017, 5, 24. [Google Scholar] [CrossRef]
- Sarkar, A.; Harty, S.; Johnson, K.V.-A.; Moeller, A.H.; Carmody, R.N.; Lehto, S.M.; Erdman, S.E.; Dunbar, R.I.M.; Burnet, P.W.J. The role of the microbiome in the neurobiology of social behaviour. Biol. Rev. Camb. Philos. Soc. 2020, 95, 1131–1166. [Google Scholar] [CrossRef]
- Szyszkowicz, J.K.; Wong, A.; Anisman, H.; Merali, Z.; Audet, M.-C. Implications of the gut microbiota in vulnerability to the social avoidance effects of chronic social defeat in male mice. Brain Behav. Immun. 2017, 66, 45–55. [Google Scholar] [CrossRef]
- Angelis, M.D.; Piccolo, M.; Vannini, L.; Siragusa, S.; Giacomo, A.D.; Serrazzanetti, D.I.; Cristofori, F.; Guerzoni, M.E.; Gobbetti, M.; Francavilla, R. Fecal Microbiota and Metabolome of Children with Autism and Pervasive Developmental Disorder Not Otherwise Specified. PLoS ONE 2013, 8, e76993. [Google Scholar] [CrossRef] [PubMed]
- Caputi, V.; Hill, L.; Figueiredo, M.; Popov, J.; Hartung, E.; Margolis, K.G.; Baskaran, K.; Joharapurkar, P.; Moshkovich, M.; Pai, N. Functional contribution of the intestinal microbiome in autism spectrum disorder, attention deficit hyperactivity disorder, and Rett syndrome: A systematic review of pediatric and adult studies. Front. Neurosci. 2024, 18, 1341656. [Google Scholar] [CrossRef] [PubMed]
- Li, Y.; Hu, W.; Lin, B.; Ma, T.; Zhang, Z.; Hu, W.; Zhou, R.; Kwok, L.-Y.; Sun, Z.; Zhu, C.; et al. Omic characterizing and targeting gut dysbiosis in children with autism spectrum disorder: Symptom alleviation through combined probiotic and medium-carbohydrate diet intervention—A pilot study. Gut Microbes 2024, 16, 2434675. [Google Scholar] [CrossRef]
- Yang, J.; He, L.; Dai, S.; Zheng, H.; Cui, X.; Ou, J.; Zhang, X. Therapeutic efficacy of sulforaphane in autism spectrum disorders and its association with gut microbiota: Animal model and human longitudinal studies. Front. Nutr. 2024, 10, 1294057. [Google Scholar] [CrossRef]
- Wang, W.; Fu, P. Gut Microbiota Analysis and In Silico Biomarker Detection of Children with Autism Spectrum Disorder across Cohorts. Microorganisms 2023, 11, 291. [Google Scholar] [CrossRef] [PubMed]
Disclaimer/Publisher’s Note: The statements, opinions and data contained in all publications are solely those of the individual author(s) and contributor(s) and not of MDPI and/or the editor(s). MDPI and/or the editor(s) disclaim responsibility for any injury to people or property resulting from any ideas, methods, instructions or products referred to in the content. |
© 2025 by the authors. Licensee MDPI, Basel, Switzerland. This article is an open access article distributed under the terms and conditions of the Creative Commons Attribution (CC BY) license (https://creativecommons.org/licenses/by/4.0/).