Article

Bio-Inspired Visual Network for Detecting Small Moving Targets in Low-Light Dynamic Complex Environments Based on Target Gradient Temporal Features

1
School of Food Science and Engineering, South China University of Technology, Guangzhou 510006, China
2
Postdoctoral Research Workstation of Mltor Numerical Control Technology Limited Company, Zhongshan 528400, China
*
Author to whom correspondence should be addressed.
Appl. Sci. 2025, 15(16), 9207; https://doi.org/10.3390/app15169207 (registering DOI)
Submission received: 25 July 2025 / Revised: 16 August 2025 / Accepted: 17 August 2025 / Published: 21 August 2025

Abstract

Monitoring and tracking small moving objects in cluttered environments remain a major challenge for artificial-intelligence-based motion vision systems. This difficulty is not only due to the limited features presented by small objects themselves but also because of the numerous fake features present in complex dynamic environments. Drawing inspiration from the efficient small target motion detection mechanisms in insects’ brains, researchers have developed various visual networks for detecting tiny moving objects within complex natural environments. Although these networks perform well in detecting small-object motion by leveraging motion information, their ability to distinguish true targets from background noise remains severely limited under low-light conditions, where the contrast of small targets drops sharply and they are more easily overwhelmed by false motion in the background. To resolve the aforementioned limitation, this research proposes a new visual neural network. The network achieves effective discrimination between small moving targets and false targets in the background in low-light environments by leveraging the motion information for the targets and the differences in the response gradients between real moving targets and fake objects from the background. The designed network is composed of two main components: a motion perception module and a response gradient analysis module. The motion information perception module is responsible for acquiring the motion and position information for small targets, while the response gradient detection module extracts the response gradients between a tiny object and a background object and integrates the motion information, thereby effectively distinguishing small targets from fake background objects. The experimental results demonstrate that the proposed model can effectively distinguish small targets and suppress background false alarms in low-light environments. Comparisons of the experimental performance show that under a fixed false alarm rate, our model achieved a detection rate of 0.8. In addition, the proposed method recorded an average precision of 0.1 and an average F1-score of 0.1888. In contrast, the highest average precision achieved by the other methods was only 0.0075, and the highest F1-score was 0.0151. These results clearly indicate that our method substantially outperforms previous approaches in both its average precision and F1-score. These results collectively validate the effectiveness and competitiveness of the proposed model in small target detection tasks under low-light conditions.

1. Introduction

Target tracking is a fundamental technology within the computer vision domain aiming to accurately identify and continuously track moving objects within environments. This technology not only facilitates the perception of dynamic environments and a deeper understanding of changes in scene but also provides essential data support and decision-making foundations for diverse high-level vision applications. For example, in intelligent surveillance systems [1], it offers strong public safety support through efficient early-warning mechanisms and post-event analyses. In the rapidly evolving field of autonomous driving [2], it serves as a critical component of environmental perception, enabling vehicles to accurately detect and avoid moving obstacles, thereby significantly enhancing driving safety. Additionally, this technology holds substantial value in domains such as natural disaster early warnings and military reconnaissance.
Although recent years have seen significant progress in target motion detection in terms of the detection accuracy, processing efficiency, and adaptability to diverse environments—showing broad application prospects in various real-world scenarios—the detection of small targets in low-light, complex dynamic backgrounds still faces severe challenges. These difficulties mainly stem from the fact that when the target is extremely small or located at a far distance, it usually occupies only a few pixels—or even a single pixel—within an image. This results in extremely limited visual information (see Figure 1), lacking stable contours, a clear color distribution, or distinctive textures as recognizable physical features. Consequently, the traditional feature extraction methods, including background elimination [3,4], frame differencing [5], and optical flow estimation [6], become ineffective, and deep learning models struggle to capture sufficiently rich discriminative semantic and spatial information [7,8,9]. Moreover, in low-light complex real-world scenarios, small targets often exhibit low contrast, making them easily overwhelmed by dynamically changing background noise and false targets (such as swaying branches, flowers, and debris). These background distractions often share similar visual characteristics with the targets, significantly interfering with the detection process and greatly increasing the risk of false alarms and misclassification. Given the above challenges, there is an urgent need to develop more robust visual perception networks capable of accurately extracting fine-grained target features and effectively suppressing various types of interference under low-light and complex dynamic background conditions.
Research in biological sciences has shown that some insects, including dragonflies, are able to precisely track small flying targets within complex natural scenarios by relying solely on limited visual cues, achieving a prey capture success rate of over 97% [10]. This remarkable ability is attributed to a specialized category of neurons within their brains named Small Target Motion Detectors (STMDs) which exhibit high sensitivity to the motion of small-sized targets [11,12]. STMD neurons generate strong responses to small targets occupying approximately 1 to 3 degrees of the visual angle while showing little or no response to large objects or wide-field stimuli exceeding 10 degrees of the visual angle [13]. More importantly, research has revealed that even in complex and dynamically changing backgrounds, STMD neurons retain their ability to respond selectively to small moving targets. These findings suggest that visual systems in insects—particularly their precise mechanism for small target tracking—may offer valuable biological inspiration and theoretical grounding for the development of robust visual neural networks specifically designed for small target detection.
Over the past few decades, with a growing understanding of the electrophysiological mechanisms of STMD neurons, scholars have introduced a range of biologically inspired visual networks aiming to detect tiny moving targets from natural surroundings. For instance, Wiederman et al. originally established the ESTMD system network [14] to emulate the size-selective characteristics of STMD neurons. This method identifies small moving targets by correlating the brightness variations in each pixel across consecutive frames. Subsequently, the DSTMD model [15], along with two cascaded models [16,17], incorporated information from paired spatial positions to enable recognition of the direction of motion. However, these models still exhibit certain limitations when applied to tracking small-scale targets in highly cluttered dynamic surroundings. To resolve these issues, Wang et al. and Ling et al. leveraged feedback mechanisms in combination with the neural perception mechanisms of insect small target motion to propose the Feedback STMD model [18], the Spatiotemporal Feedback STMD model ( ST -STMD) [19], and the F STMD model [20]. These models effectively enhance the detection accuracy by either suppressing background responses similar to those of real small targets or amplifying the responses to motion of the actual target. Moreover, Xu et al. designed a fractional-order inspired visual network founded on fractional derivative concepts [21] capable of detecting small moving targets in low-frame-rate scenarios. To achieve a better performance in identifying low-contrast tiny objects, Wang enhanced the classic STMD framework by incorporating both an attention mechanism and a prediction module, resulting in the attention-based apg-STMD model [22]. This model dynamically adjusts the output of the current frame based on the detection results from the previous frame, thereby improving the system’s sensitivity to potential tiny moving targets. Furthermore, Chen et al. provided a theoretical proof demonstrating that the computational STMD model can accurately convey the dynamic features of translational visual motion, maintaining consistency between the input motion stimuli and the model’s output [23]. M. A. Billah et al. incorporated tiny object recognition techniques into control theory, establishing the corresponding theoretical constructs [24]. Meanwhile, Uzair M and colleagues extended the STMD-inspired visual framework to the infrared imaging domain, achieving precise detection of small and distant targets [25,26,27].
Most of the aforementioned STMD-related models rely on motion information captured by large monopolar cells (LMCs) [28,29] and have successfully reproduced the response patterns of STMD neurons to small moving targets. However, since LMCs primarily sense luminance changes, they struggle to effectively distinguish tiny targets from background noise under low-light conditions, resulting in detection outputs containing numerous background-induced false positives. To address this challenge, it is imperative to introduce additional discriminative features that can separate real targets from spurious responses in dynamic, complex, and low-light environments. One highly promising approach is to exploit the temporal gradient differences between the responses of true targets and those of background false positives. Gradients characterize the rate of change in the responses, serving as a key metric for capturing spatial and spatiotemporal variations. For moving targets, temporal gradient variations are typically more pronounced than those for background-induced false features. Numerous studies have demonstrated that gradient-based features not only enable effective motion detection but also significantly improve the ability to identify and suppress background-triggered false alarms, thereby enhancing both the accuracy and robustness of small target detection.
This paper presents a biologically inspired visual neural system, termed RT -STMD, specifically developed for detecting tiny moving targets within low-light and complex dynamic background conditions. The proposed system consists of two core modules: a motion perception module, which extracts the motion cues of tiny targets to accurately detect movement and localize the target, and a response gradient analysis module, which analyzes the gradient features of the output responses and integrates them with motion information. By leveraging the temporal differences in the response gradients between true targets and background-induced false features, this system effectively distinguishes true targets from distractors. Extensive numerical experiments demonstrate that the RT -STMD network significantly enhances the distinction of tiny targets from false background features. Compared with the existing models, RT -STMD shows a superior performance in terms of its detection accuracy and robustness under challenging conditions such as low illumination and complex dynamic scenes.
The structure of this paper is as follows. Section 2 provides a comprehensive review of related work. Section 3 elaborates on the proposed visual neural network in detail. Section 4 validates the effectiveness of the proposed network through extensive experiments. Section 5 highlights the model’s performance advantages in detecting small moving targets under low-light conditions via comparative studies. Finally, Section 6 concludes this paper.

2. Prior Work

This section primarily summarizes prior research on networks inspired by motion perception neurons in insect vision, along with various approaches to infrared small target detection. Additionally, it provides a brief overview of studies employing gradient features for object tracking.

2.1. A Network Inspired by Motion Perception Neurons in Insect Vision

Physiological studies have revealed that insects in nature are capable of accurately perceiving diverse motion cues within their visual fields, including collision, wide-field, and tiny object motion stimuli. The visual processing system in an insect achieves these functions through three key neuron types specialized for motion detection: lobula giant movement detectors (LGMDs) [30,31], lobula plate tangential cells (LPTCs) [32,33], and STMD neurons [34]. Evidence indicates that LGMDs are highly sensitive to approaching stimuli, whereas their response to receding stimuli is weak. This functionality has inspired the design of several neural visual networks for collision detection [35,36,37]. Within insect vision research, it has been found that LPTC neurons respond to wide-field motion when objects cover a substantial part of the visual field. Drawing inspiration from LPTC neuron functions, researchers have introduced models such as EMD [38], TQD [39], and the weighted-quadrant detector [40] to identify broad-field motion. These visual systems are highly effective for detecting collisions and wide-area motion. However, they are unable to detect or distinguish small objects due to their inability to discern object size.
STMD neurons represent a specialized type of neuron that can precisely detect motion stimuli from small objects. Leveraging the response properties of these neurons to tiny moving targets, researchers have developed various STMD-inspired visual systems, including ESTMD [14], DSTMD [15], Feedback STMD [18], F STMD [20], ST -STMD [19], and fractional-order STMD [21] to identify small moving objects in complex environments. While these models demonstrate a strong performance in dynamic scenes, they continue to encounter difficulties in differentiating small targets from background noise under low-light conditions.

2.2. Gradient Features for Object Detection

A real-world visual scene is highly intricate, and multiple motion-related cues can facilitate the detection of movement, among which gradient information is particularly significant. A gradient represents the rate of change in an image’s intensity with respect to the spatial coordinates and is primarily used to describe how an image varies in a specific direction. It is widely utilized in computer vision applications, including target identification. For example, Hao et al. [41] proposed an infrared small target detection algorithm based on multi-directional gradient filtering and adaptive size estimation. By estimating and iteratively utilizing the optimal target size, this method effectively suppresses false alarms caused by bright clutter and achieves high-precision small target detection in complex scenes. Zhang et al. [42] introduce the Gradient-Correlation Filtering and Contrast Measurement (GCF-CM) approach, which leverages a synergistic enhancement–suppression mechanism based on infrared gradient vector fields, gradient-correlation filtering, and contrast measurement to achieve robust detection of weak infrared small targets in challenging backgrounds such as dense clouds and dynamic clutter. Li et al. [43] introduces a target detection algorithm based on a Gradient-Intensity Saliency Metric (GISM), which jointly leverages gradient and intensity domains to suppress complex background clutter, enabling efficient and robust recognition of dim infrared small objects.
Moreover, previous studies have consistently demonstrated that incorporating gradient information can substantially enhance the system performance, with applications spanning edge detection [44], feature extraction [45], and image enhancement [46]. However, within the domain of STMD (Small Target Motion Detector) vision systems, few efforts have explored the integration of motion cues and gradient features for the precise detection of small target movements. This highlights a potential research gap and an opportunity for innovation in this field.

2.3. Small Object Detection in Infrared Images

Detecting small infrared targets primarily involves recognizing heat-emitting objects like missiles and bombs. Numerous approaches have emerged over the past decade to confronting this challenge. For example, Zhang et al. [47] introduced an improved IPT framework for infrared small target detection, employing a hybrid constraint that integrated a tensor nuclear norm with a weighted L 1 norm to effectively reduce the background interference and the enhance detection accuracy. Nie et al. [48] presented a novel MLHM framework for infrared small target discrimination, achieving highly competitive detection outcomes. Zhang et al. [49] proposed an approach to improving infrared small target detection by jointly leveraging intensity and gradient information. Despite their ability to identify small target motion effectively, these methods are strongly dependent on temperature differences between the targets and backgrounds. Furthermore, they necessitate clear backgrounds, which are seldom present in natural settings.

3. The Model Framework

Figure 2a illustrates the processing flowchart of the model, and Figure 2b shows the structure of the model. Our visual system is built around two core modules: the motion information perception module and the response gradient feature discrimination module (see Figure 2b). The motion perception module leverages the neural pathways of the STMD vision system to sense luminance changes induced by target motion, thereby detecting both the movement and position of a tiny object. Figure 3 illustrates the operating principle of the STMD vision system. Through its ommatidium structure, the STMD network receives external luminance inputs, which first undergo preliminary denoising to minimize the effect of environmental noise. The LMC neurons then compute the temporal variations in luminance—an essential step for motion detection, as it captures brightness fluctuations caused by a moving target. The resulting luminance signals are processed in parallel by Tm3 and Tm1 neurons. Finally, the STMD neurons integrate these outputs to produce the final response, which represents the detection of a small moving target, typically manifested as a strong activation signal indicating the target’s presence and location.
The response gradient feature discrimination module further refines this detection by exploiting the differences in the temporal gradient patterns between true targets and background false positives. Specifically, it extracts gradient information from the response outputs of the motion perception module and calculates the neural response gradients based on detected motion data. The system then records the motion trajectory and its corresponding gradient trajectory. At each time step, it computes the coefficient of variation (CV) in the gradient along each trajectory (see Figure 4). This CV serves as a key discriminative feature: by applying a threshold to the gradient variability, the network reliably separates genuine tiny moving targets from false alarms.
The theoretical foundation of this approach stems from the observation that genuine small targets exhibit pronounced temporal fluctuations in their response gradients, whereas background-induced false features—typically static or slowly varying—show minimal gradient changes over time. Building on this insight, we propose a novel method that employs the temporal coefficient of variation in the response gradients as a reliable cue for distinguishing tiny moving targets in complex environments.

3.1. The Motion Perception Module

This subsection provides a detailed mathematical formulation of the motion information perception module.

3.1.1. Ommatidia

As depicted in Figure 2, the motion information detection module relies on ommatidia [50,51], which act as sensory receptors to acquire brightness information from the surrounding environment. They are also equipped with Gaussian filters to apply Gaussian blurring to the incoming information. Mathematically, the luminance captured by the ommatidial neurons can be expressed as I ( x , y , t ) R , ( x , y , t ) R 3 . The output responses of the ommatidia, denoted as O O M M ( x , y , t ) , are mathematically represented as
O O M M ( x , y , t ) = I ( u , v , t ) G σ 1 ( x u , y v ) d u d v ,
where G σ 1 ( x , y ) stands for a Gaussian kernel, defined as
G σ 1 ( x , y ) = 1 2 π σ 1 2 e ( x 2 + y 2 ) 2 σ 1 2 ,
where σ 1 stands for the Gaussian function’s standard deviation.

3.1.2. Large Monopolar Cells

Large monopolar cells (LMCs) are positioned downstream of the ommatidia and exhibit a strong response to variations in brightness [39,40]. As a target moves across a pixel, the corresponding brightness fluctuates over time t. In the motion perception module, the LMCs operate as temporal band-pass filters, filtering ommatidial signals to detect brightness fluctuations over time t. Specifically,
L L M C ( x , y , t ) = O O M M ( x , y , s ) H B P ( t s ) d s .
Here, L L M C ( x , y , t ) denotes the response of the LMC, with H B P ( t ) functioning as the temporal kernel, defined by
H B P H ( t ) = Γ n 1 , τ 1 ( t ) Γ n 2 , τ 2 ( t ) ,
Γ n , τ ( t ) = ( n t ) n e n t τ ( n 1 ) ! · τ n + 1 , for t 0 , 0 , for t < 0 ,
where n and τ are the order and time constant associated with the Gamma kernel [52].

3.1.3. Tm3 and Tm1

Tm3 and Tm1 neurons constitute the downstream components of the LMC neuron (see Figure 2) [53], with the Tm3 neurons reacting vigorously to brightness increases and the Tm1 neurons being more responsive to brightness decreases. As part of the motion information perception module, Tm3 and Tm1 function as half-wave rectifiers to segregate and process the LMC output in parallel. Let O N T m 3 ( x , y , t ) signify the response of the Tm3 neuron, which is derived by extracting the excitatory part of the LMC response L L M C ( x , y , t ) . Specifically,
O N T m 3 ( x , y , t ) = L L M C ( x , y , t ) + .
Furthermore, research indicates that Tm1 responds with a temporal delay compared to Tm3 at identical coordinates ( x , y ) (see Figure 3). Accordingly, Tm1’s output O F F T m 1 ( x , y , t ) is expressed via
O F F T m 1 ( x , y , t ) = [ L L M C ( x , y , s ) ] Γ n 3 , τ 3 ( t s ) d s .
Here, [ u ] + = | u | + u 2 , [ u ] = | u | u 2 .

3.1.4. STMDs

In the proposed visual network, STMD neurons, specialized for motion detection, utilize signals from Tm3 and Tm1 to localize moving targets [14,15]. The STMD response is obtained by combining O N T m 3 ( x , y , t ) and O F F T m 1 ( x , y , t ) multiplicatively, producing strong activation at ( x , y ) . Specifically,
S S T M D ( x , y , t ) = O N T m 3 ( x , y , t ) × O F F T m 1 ( x , y , t ) .
Moreover, to filter out large-object responses, the STMD response S S T M D ( x , y , t ) leverages lateral inhibition (see Figure 2). Specifically,
D S T M D ( x , y , t ) = [ S S T M D ( u , v , t ) L I N ( x u , y v ) d u d v ] + ,
where L I N ( x , y ) corresponds to the inhibition kernel, formulated as
L I N ( x , y ) = λ [ r ( x , y ) ] + + η [ r ( x , y ) ] ,
and the function r ( x , y ) is formulated by offsetting the linear combination of two Gaussian functions with a constant, defined as
r ( x , y ) = G σ 2 ( x , y ) ϵ G σ 3 ( x , y ) ω ,
and λ , η , ϵ , ω are predefined constants.

3.2. The Response Gradient Analysis Module

The response gradient analysis module comprises two parallel processing pathways. The first pathway is dedicated to determining the target’s spatial position and estimating its trajectory by examining the motion detection module’s output over successive frames. The second pathway is dedicated to extracting the response gradient information from the same motion module output. These two streams of information are then integrated to compute the coefficient of variation in the response gradient over time. By comparing this temporal variability against a predefined threshold, the module can accurately detect tiny target motion while effectively filtering out false positives caused by background interference.

3.2.1. Recording the Motion Trajectory

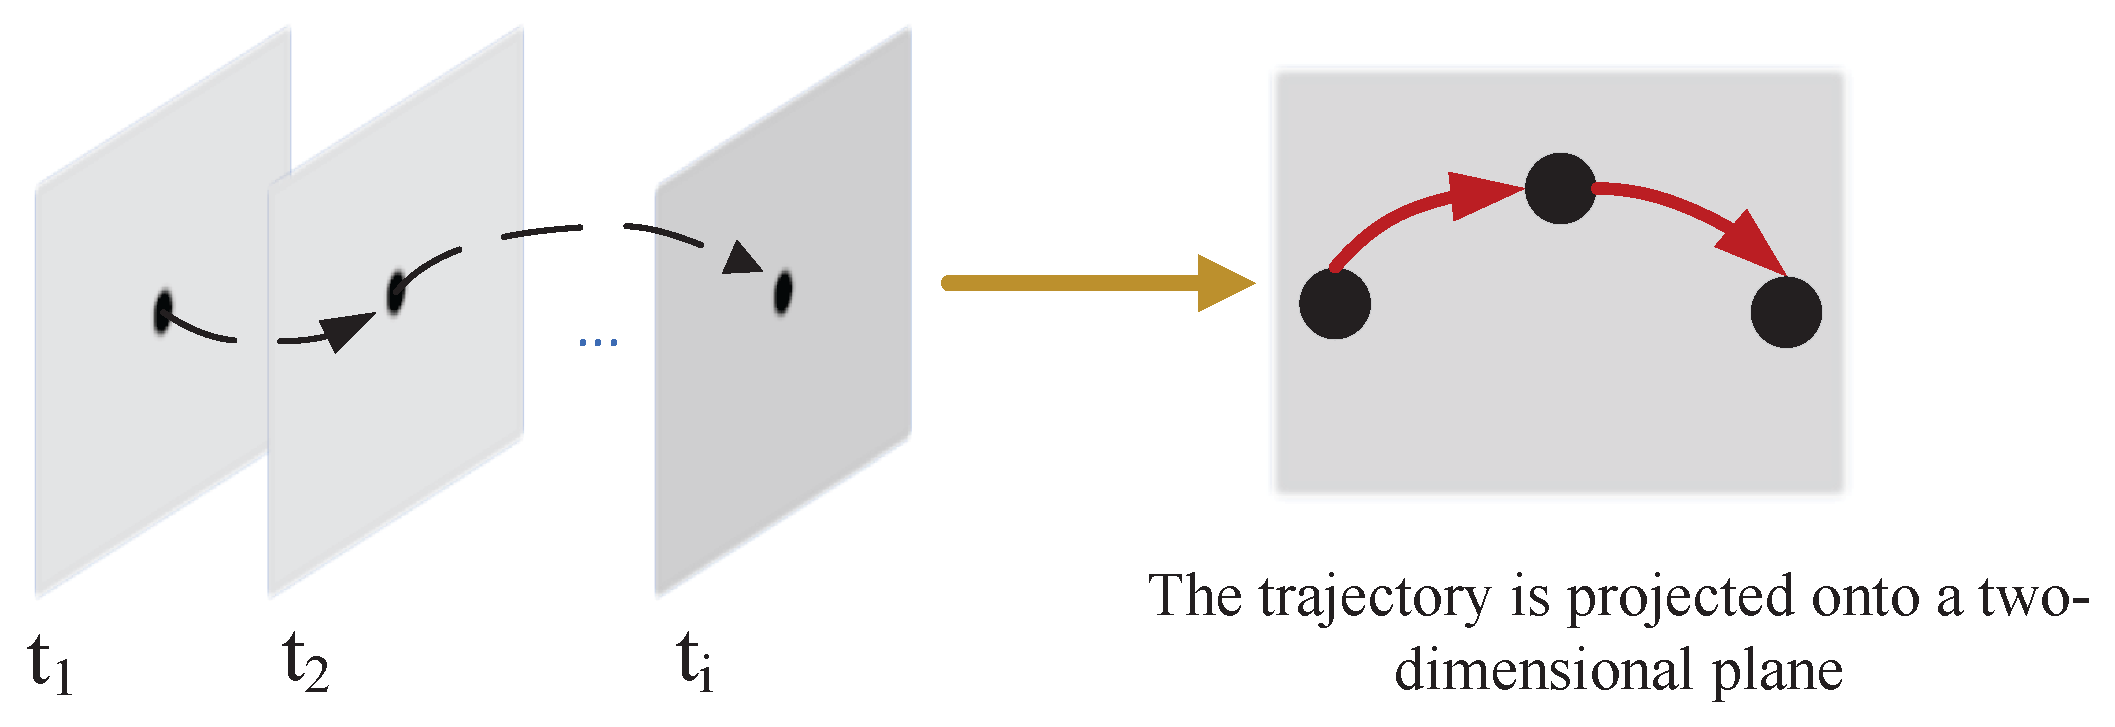
In the proposed visual neural network, the motion detection module’s outputs are utilized to identify the positions of small features and to document their motion trajectories, as illustrated in Figure 5. By setting a detection threshold ς , the module determines the position of a small feature through a comparison with its outputs. At a specified threshold ς and time t 0 , when the output D S T M D ( x 0 , y 0 , t 0 ) at location ( x 0 , y 0 ) exceeds ς , a small feature is identified at ( x 0 , y 0 ) . Similarly, at the subsequent time point t 1 , another location ( x 1 , y 1 ) can be identified and recorded. If ( x 1 , y 1 ) at t 1 is within a small vicinity of ( x 0 , y 0 ) at t 0 , these positions are considered part of the same trajectory. By iteratively applying this process over time, a complete motion trajectory T R C can be constructed. Formally, the motion trajectory T R C is described as
T R C = ( x ( t ) , y ( t ) ) , t [ t 0 , t i ] .
The pair ( x ( t ) , y ( t ) ) specifies the spatial point with time t, with t 0 and t i corresponding to the initial and current time.

3.2.2. Extracting Gradient Information and Gradient Trajectories

In the proposed visual model, we utilize the response output of the motion module to compute the spatial gradient. Specifically,
D S T M D ( x , y , t ) = D S T M D ( x , y , t ) x , D S T M D ( x , y , t ) y ,
Here, D S T M D ( x , y , t ) x and D S T M D ( x , y , t ) y indicate the image’s partial derivatives along the x and y directions, respectively, at time t.
In the subsequent experiments, we obtain the gradients of the response output in the x and y directions in the spatial domain by convolving the response output with two Sobel operators. To integrate the gradient information, we determine the magnitude of the gradient by calculating the gradients in the x and y directions in the spatial domain. Specifically, the magnitude of the gradient is obtained by synthesizing the gradient components in the x and y directions, and the formula for this calculation is as follows:
G ( x , y , t ) = ( D S T M D ( x , y , t ) x ) 2 + ( D S T M D ( x , y , t ) y ) 2 ,
where G ( x , y , t ) represents the Euclidean norm of the gradient vector, which is the length of the gradient vector. For each motion trajectory, the magnitude trace can be derived by integrating the trajectory position and the STMD neuron’s response magnitude. The magnitude motion trajectory M R C is given by
M R C = ( G ( x ( t ) ) , G ( y ( t ) ) ) , t [ t 0 , t i ] .
After extracting the magnitude motion trajectory M R C , we can calculate the coefficient of variation C V in the magnitude for each movement trace with time t. The coefficient of variation C V is used to measure the degree of variation in the magnitude over time and is defined as the ratio of the standard deviation to the mean. Therefore, we first calculate the mean and standard deviation of the magnitude for each motion trajectory at each time point t, as follows:
First, we calculate the mean magnitude μ :
μ = 1 n i = 1 n M R C i ( t )
where M R C i ( t ) is the magnitude of the i-th motion trajectory at time point t, and n is the total number of motion trajectories. Next, we calculate the standard deviation σ of the magnitude:
σ = 1 n i = 1 n ( M R C i ( t ) μ ) 2
Finally, we calculate the coefficient of variation C V :
C V = σ μ
In this way, we obtain the coefficient of variation C V for each motion trajectory at each time point t, which is used to measure the degree of variation in the magnitude over time. To differentiate small targets, we establish a threshold υ and evaluate the coefficient of variation C V at each time point t. When C V ( x , y , t ) exceeds υ , a small object is recognized at the coordinate ( x 0 , y 0 ) at time point t 0 .

4. Experimental Results and Analysis

We performed a series of comprehensive evaluations on simulated and actual image sequence datasets to validate the proposed method. The simulated videos [54] were generated by compositing small computer-generated targets onto complex background images, vividly simulating the motion of tiny targets in cluttered environments. All simulated sequences were sampled at a high frame rate of 1000 Hz (i.e., 1000 frames per second) to capture subtle motion variations, and a video segment consisting of 800 frames was used in the experiments. The RIST dataset [55], on the other hand, consists of real-world videos captured using high-definition cameras, containing various moving targets and diverse environmental conditions. The dataset features difficult conditions like significant occlusion, camera movement, and variations in the overall brightness under low-light settings, enabling a rigorous assessment of our method’s robustness in complex real-world situations. A sample video containing 750 frames was selected for evaluation. All of the experiments were conducted on a high-performance computer with a 3.10 GHz i7 CPU, 16 GB of RAM, and running Windows 10. MATLAB R2017a was used as the experimental platform, leveraging its powerful image processing and data analysis capabilities to implement the proposed approach. As shown in Table 1, the RT -STMD model parameters are specified in detail. The parameters for the motion detection channel were determined through a sensitivity analysis based on the findings from [15], ensuring the model’s adaptability to various motion patterns and compliance with the STMD neurons’ biological constraints on the response speed and receptive field size. The CV threshold parameter was optimized through a series of sensitivity experiments, as visualized in Figure 6. The findings indicate that as the CV threshold increases, the model’s detection performance initially improves and then slightly declines. When the threshold is set too low, it fails to effectively suppress false positive signals from the background, leading to an increase in false detections. Conversely, if the threshold is too high, the model may mistakenly suppress true target signals by misclassifying them as background noise, resulting in more missed detections. The experiments ultimately determined that a CV threshold of nine yields the best detection performance. This confirms that at this configuration, the model achieves its peak performance in terms of precision and robustness. Consequently, the selected threshold was employed across all subsequent simulations to uphold the reliability and uniformity of the findings.

4.1. The Effectiveness of the Motion Perception Module

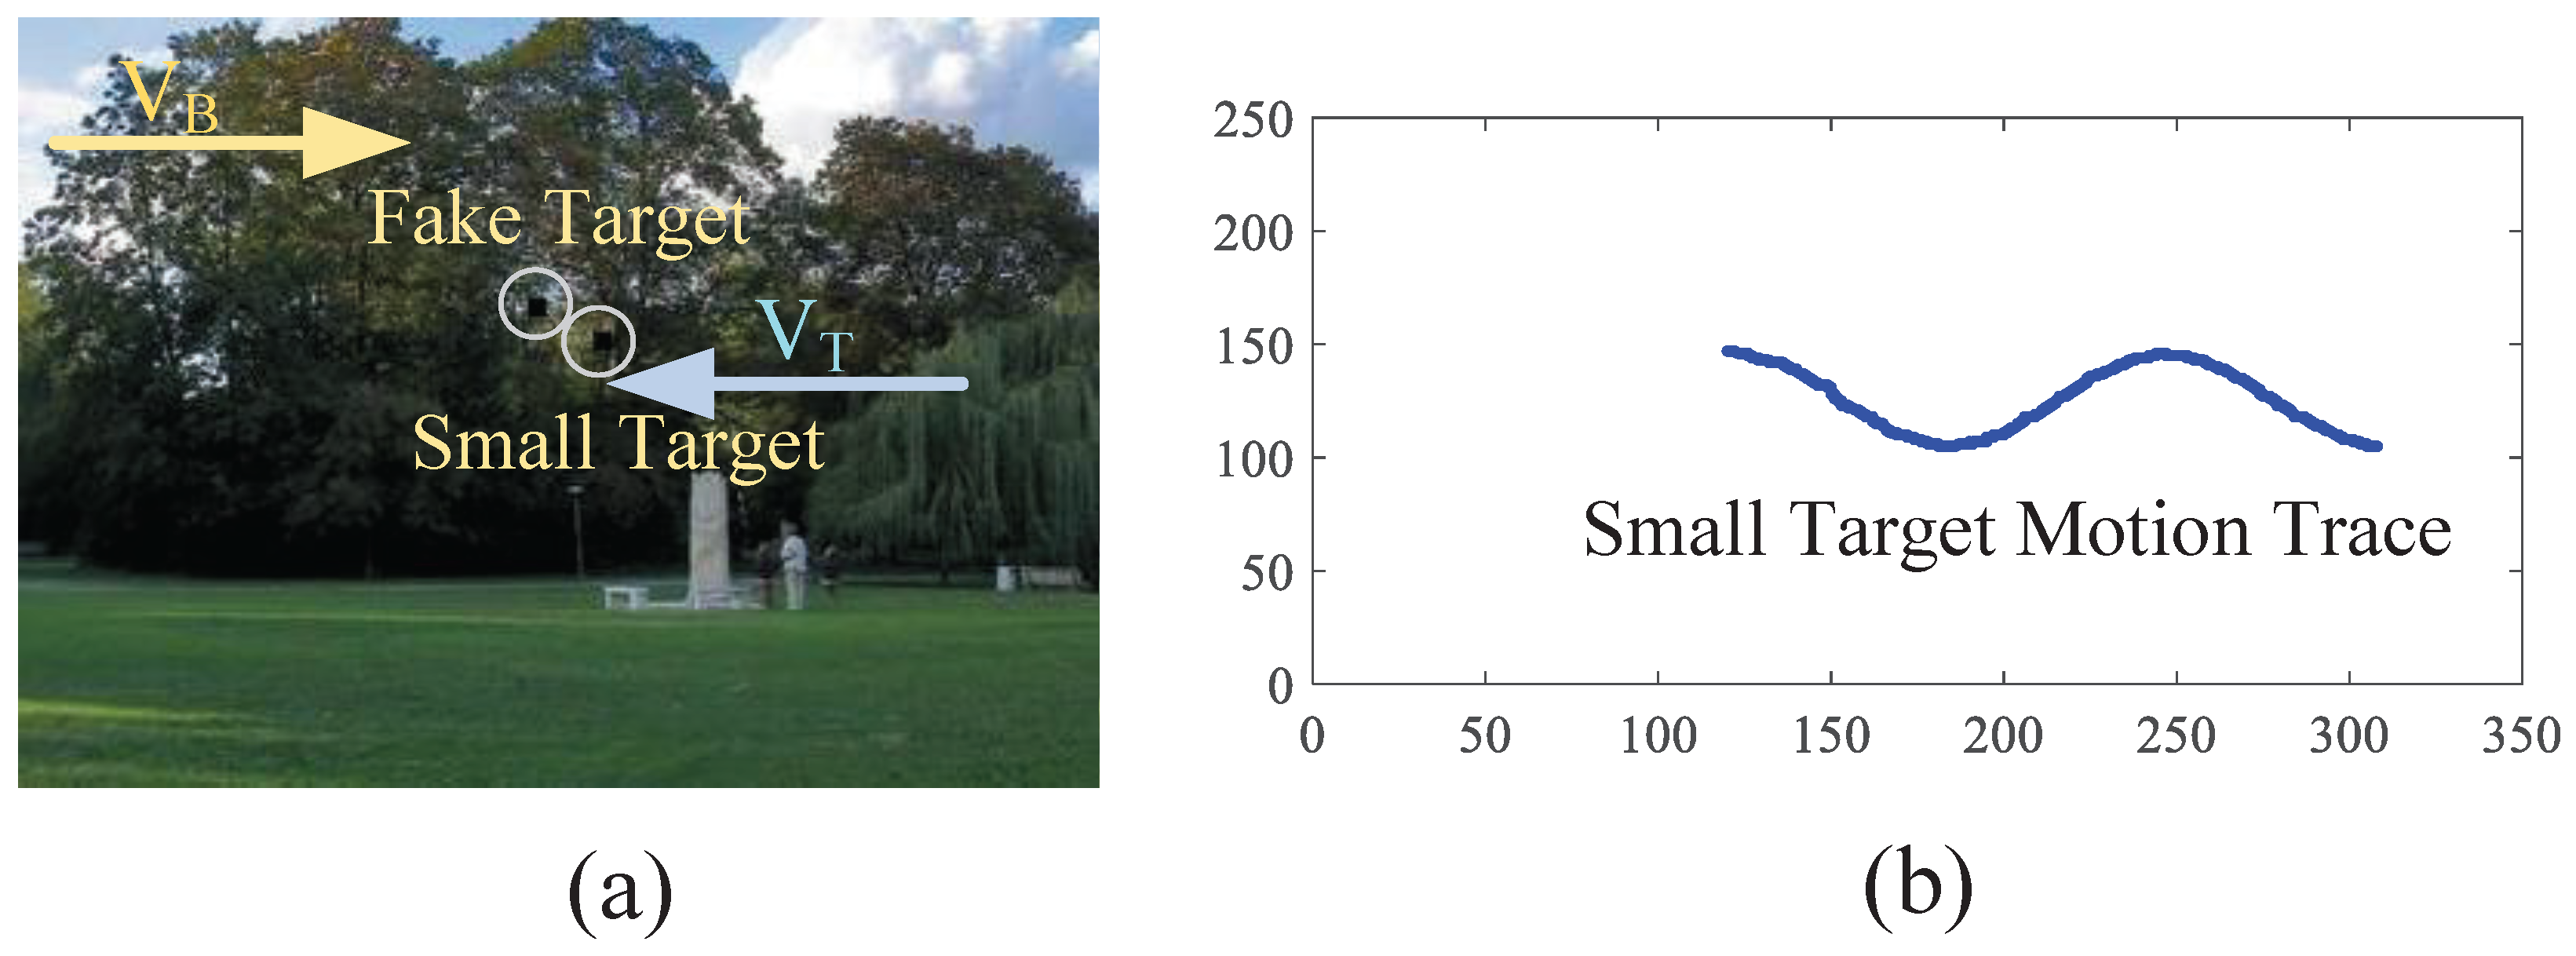
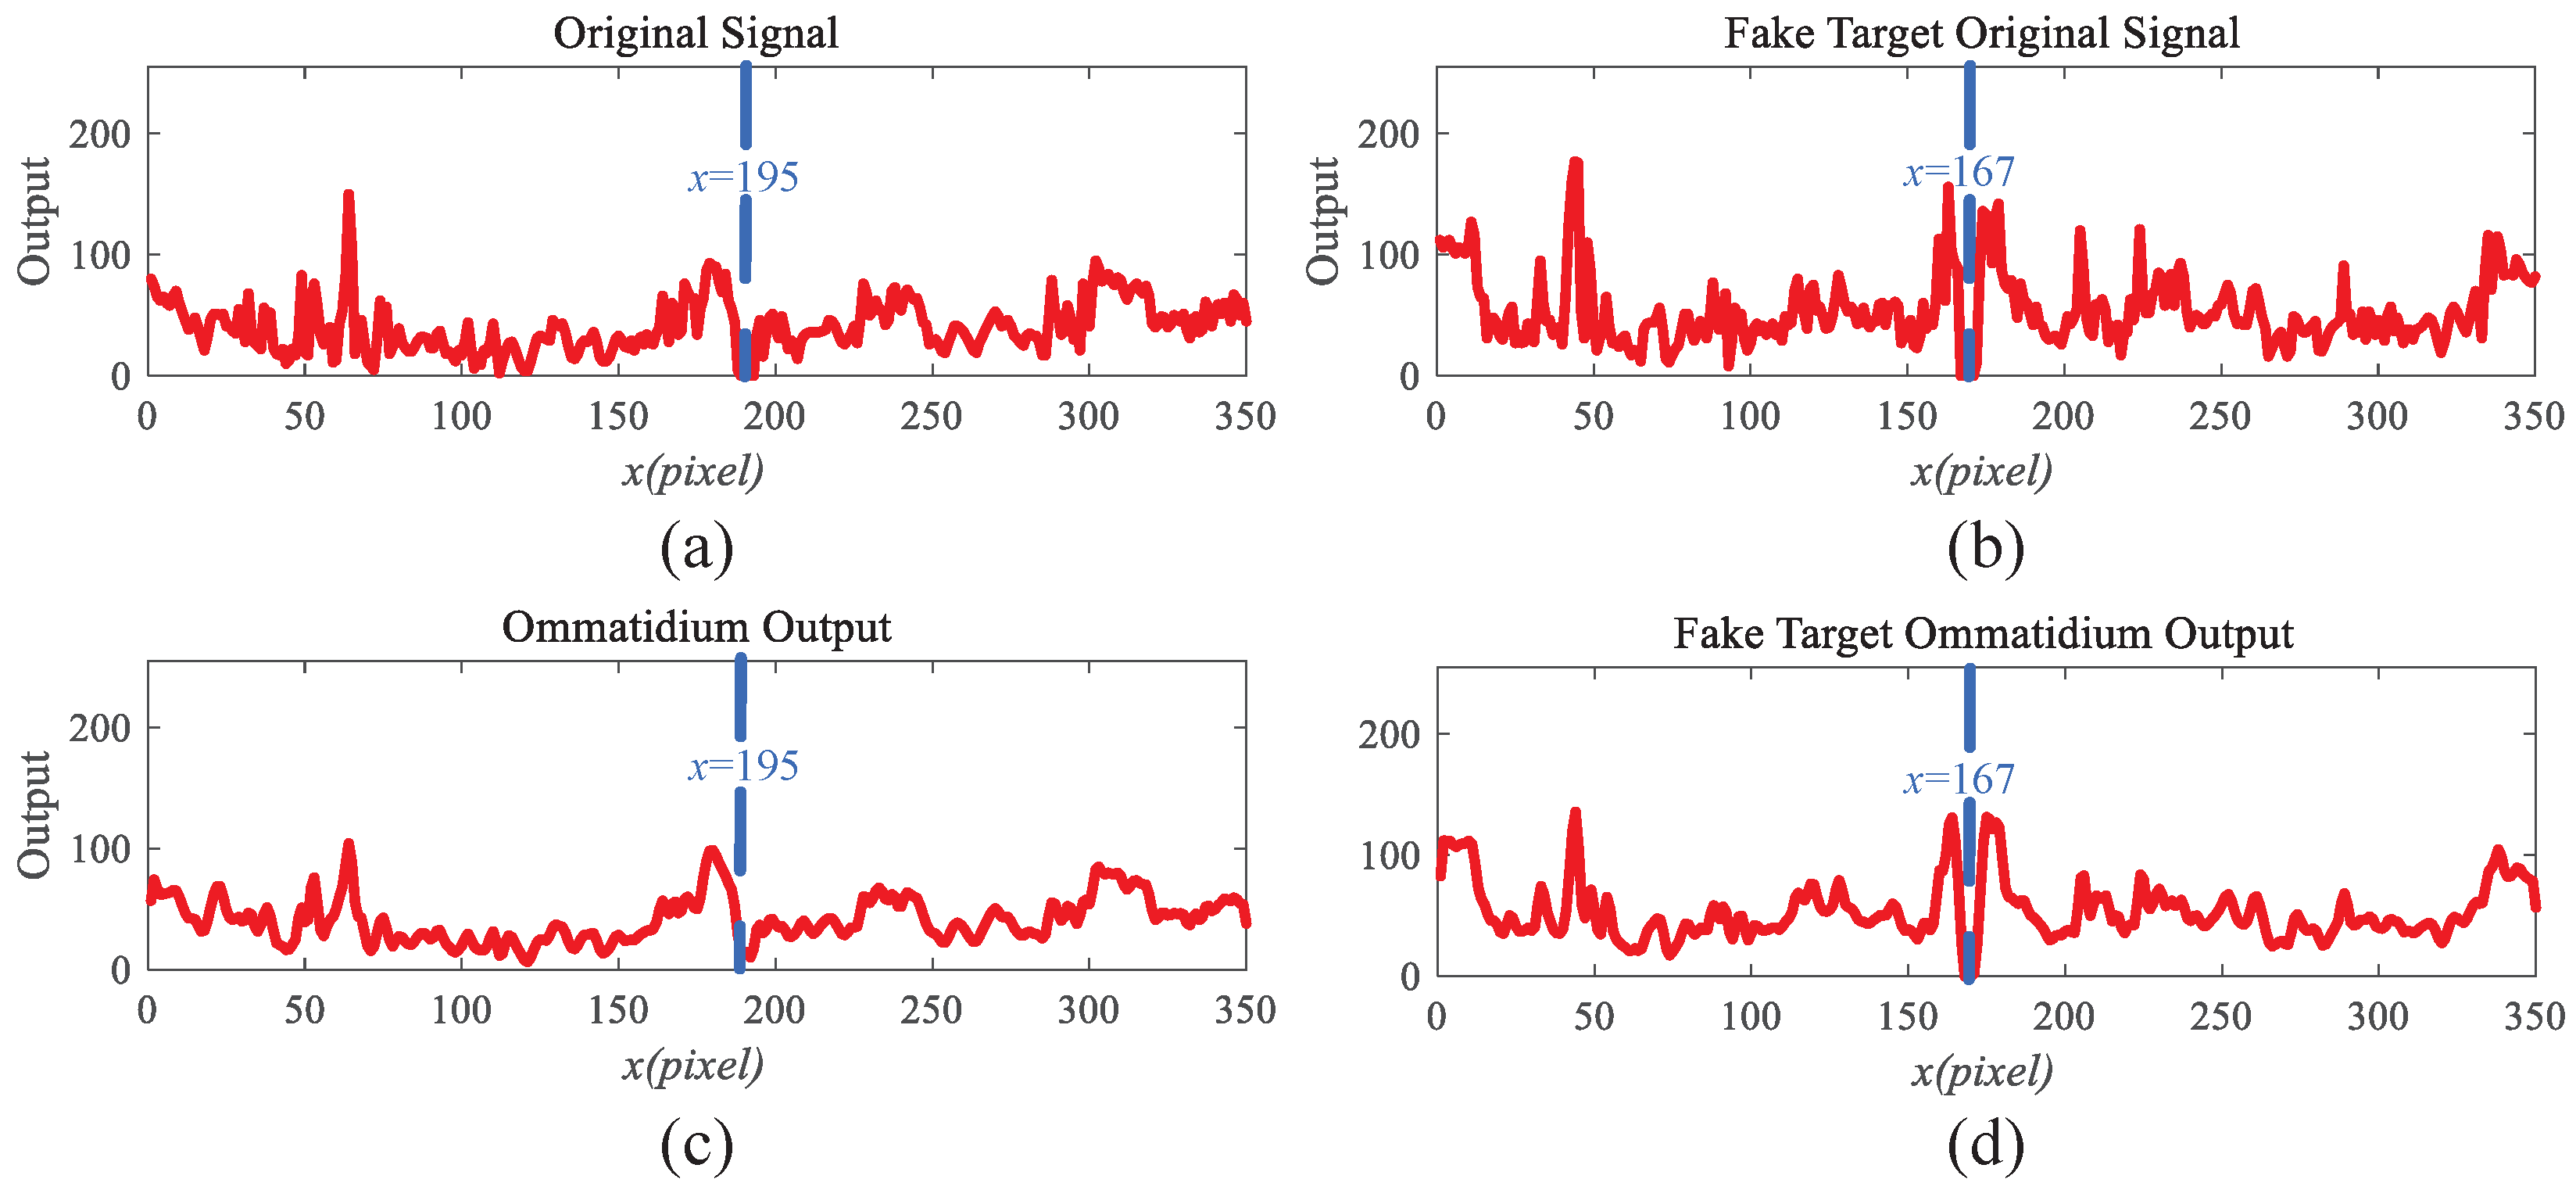
To provide a clear understanding of the RT -STMD’s operation, we adopted Vision Agg-generated synthetic sequences to visualize its information flow. As illustrated in Figure 7a, a representative picture from the synthetic sequences captures a situation in which a tiny target moves against a complex low-light background, with the respective speeds being 250 and 150 pixels per second. The directions of motion are represented by the vectors V T (target) and V B (background), respectively. Man-made background features are interpreted as false objects and share the background’s motion pattern. Figure 7b visually illustrates the trajectory of the target. To clearly present the model’s response output, we fix the time at t 0 = 600 ms and extract the neural response at the vertical position y 0 = 69, 195, 237, 319 pixels and the artificial feature position y 0 = 167 pixels. Figure 8 shows the received luminance signal I ( x , y 0 , t 0 ) and the corresponding ommatidium response P ( x , y 0 , t 0 ) . In detail, in Figure 8a,c, the input brightness and ommatidium outputs of the true target column are shown, while Figure 8b,d illustrate these outputs for a column containing a false object. It is evident that the incoming signals are heavily contaminated by background noise, making it difficult to distinguish the real target from background interference. As shown in Figure 8c,d, the ommatidium neurons apply Gaussian denoising, resulting in smoother output signals compared to the raw input. Figure 9a,b further show the complex outputs of the LMCs, which are obtained by computing the temporal changes in the ommatidium responses. Positive LMC signals indicate an increase in luminance at time t 0 , while negative signals indicate a decrease. However, since these figures only reflect signal variations at t 0 , they fail to highlight target-specific features and are insufficient for identifying target motion or suppressing false responses.
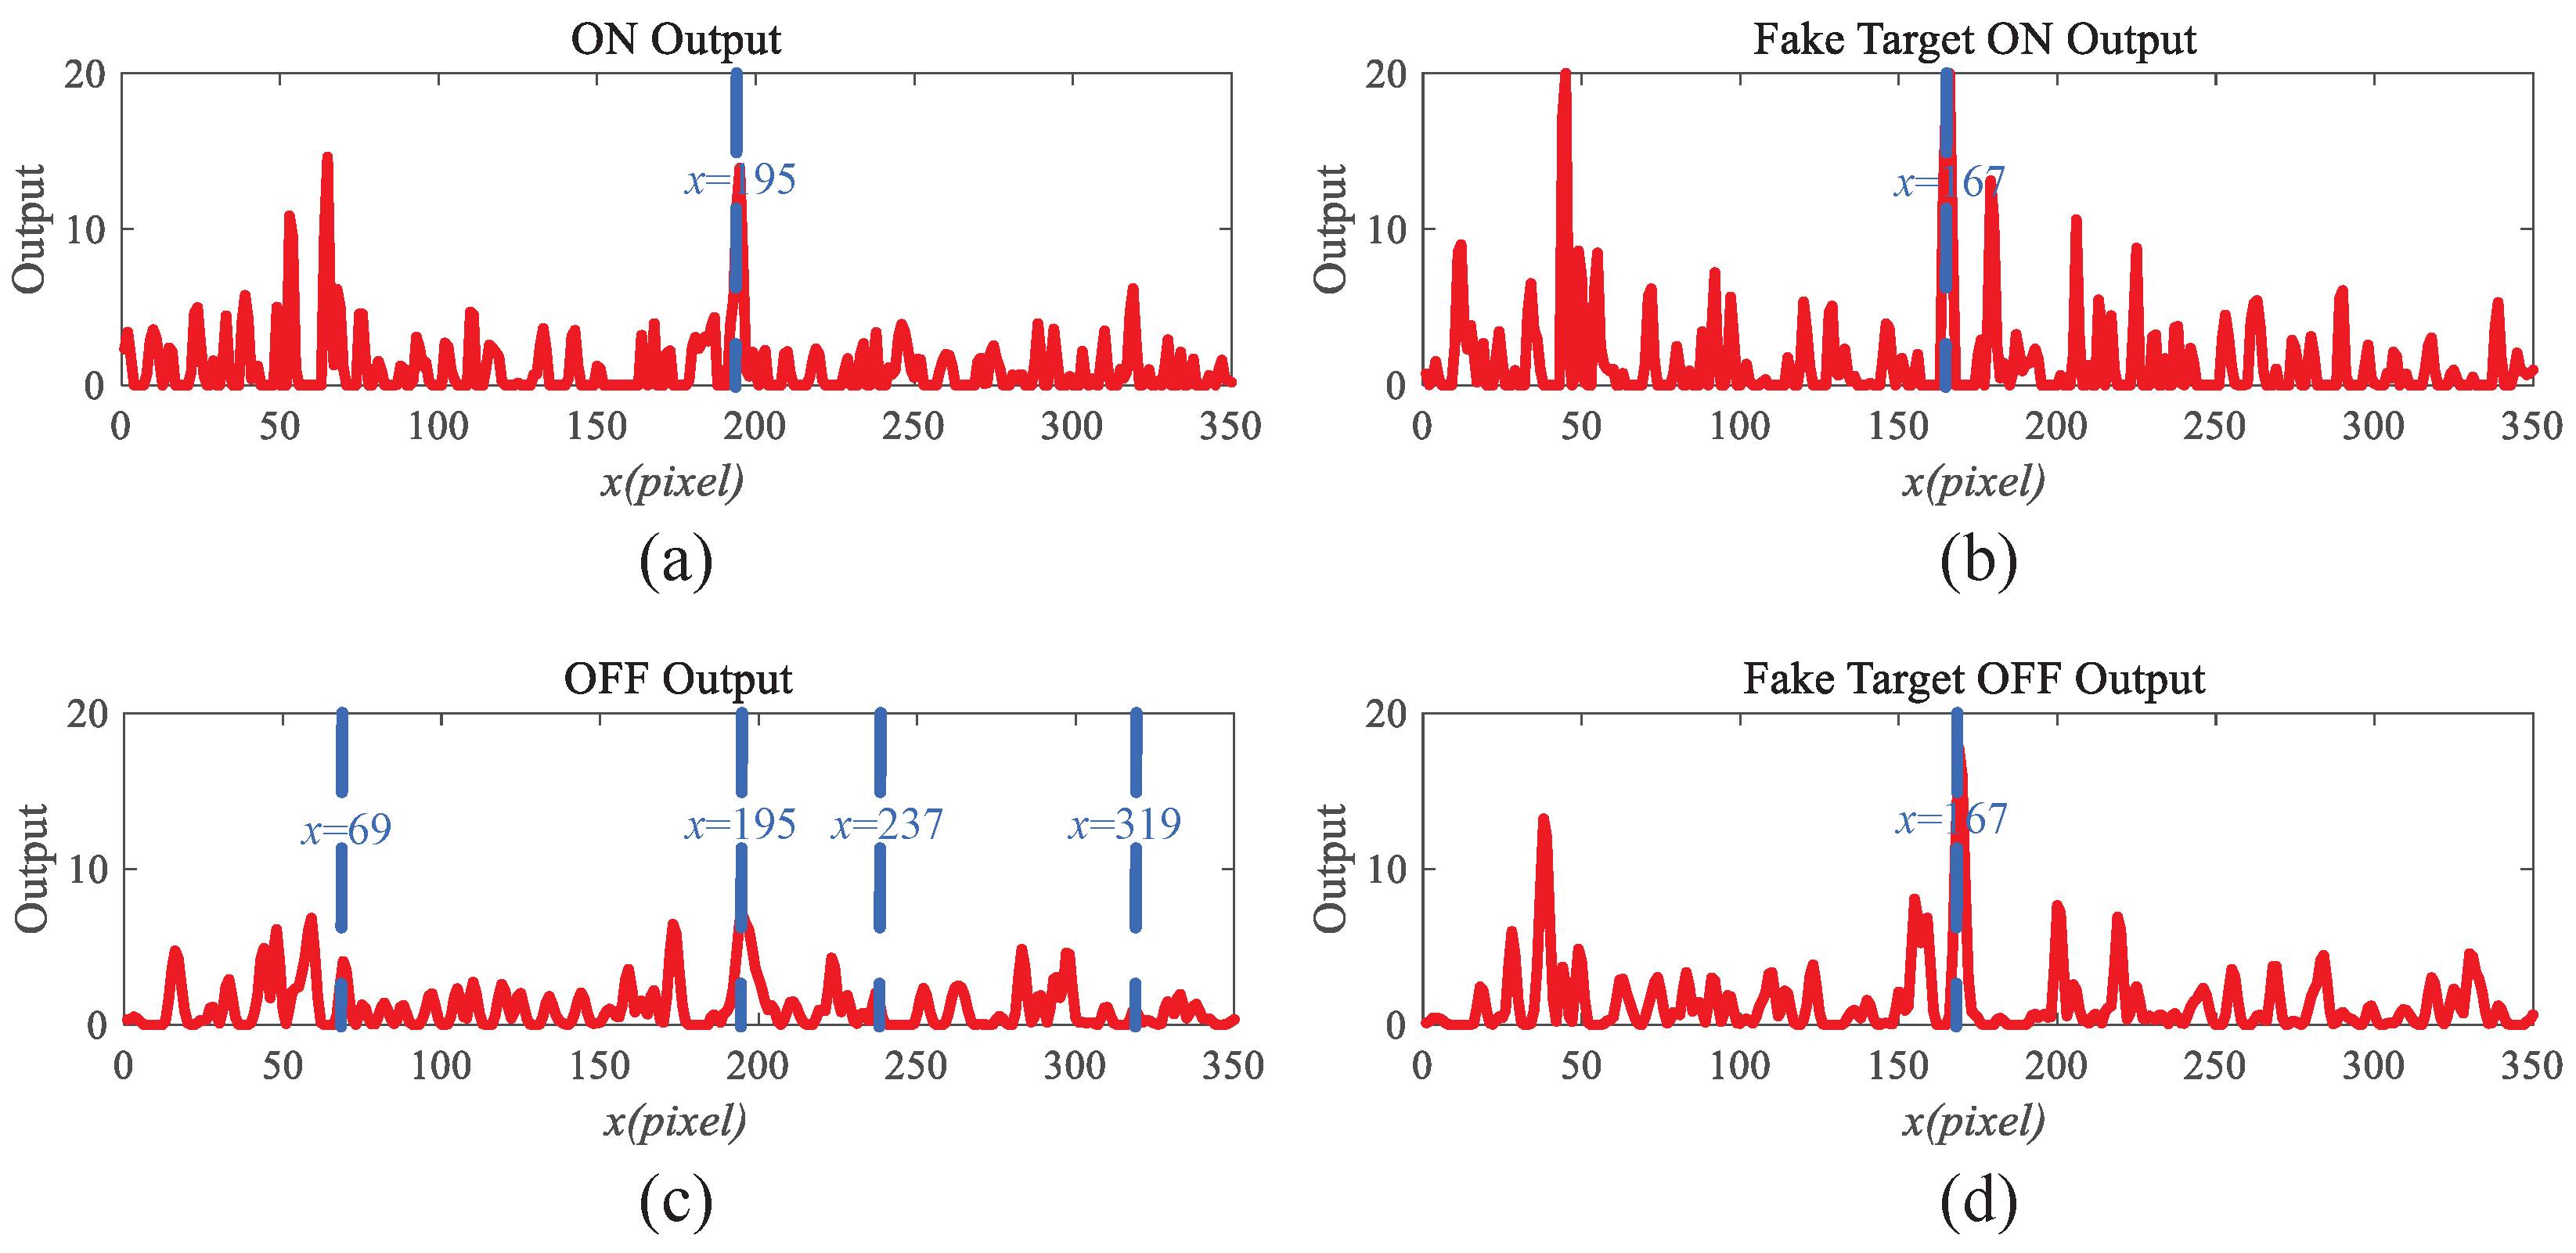
The responses generated by the Tm3 and Tm1 neurons are depicted in Figure 10. The signals are processed by dividing the LMC outputs into positive and negative parts to obtain these results. In particular, the Tm3 neuron output represents the positive part of the LMC response, mainly indicating rises in luminance. Conversely, the Tm1 neuron encodes the delayed negative portion of the LMC signal, signifying light decreases. Figure 11 shows the STMD fusing outputs from the Tm3 and Tm1 neurons in the motion perception module. As shown in the figures, both the real tiny object (located at x = 195 ) and the false objects embedded into the surroundings can elicit reactions from the STMD neurons. This highlights a critical limitation: relying solely on the intrinsic processing mechanisms of the STMD neurons is insufficient to effectively distinguish true tiny objects from complex background noise. Thus, enhancing tiny target detection requires incorporating additional discriminative features that enable precise identification and separation of the target in complex, low-light cluttered environments, thereby improving both the accuracy and robustness.

4.2. The Working Mechanisms of the Response Gradient Analysis Module

In this study, we designed a response gradient analysis module based on the STMD neural network. This module is intended to extract gradient information from the response signals of tiny targets and integrate it with the original response output, thereby improving the system’s ability to distinguish between true moving targets and false features embedded into the background. To validate the effectiveness of this module, we first elaborate on its working principles and then evaluate the performance differences before and after its integration through an experimental analysis.
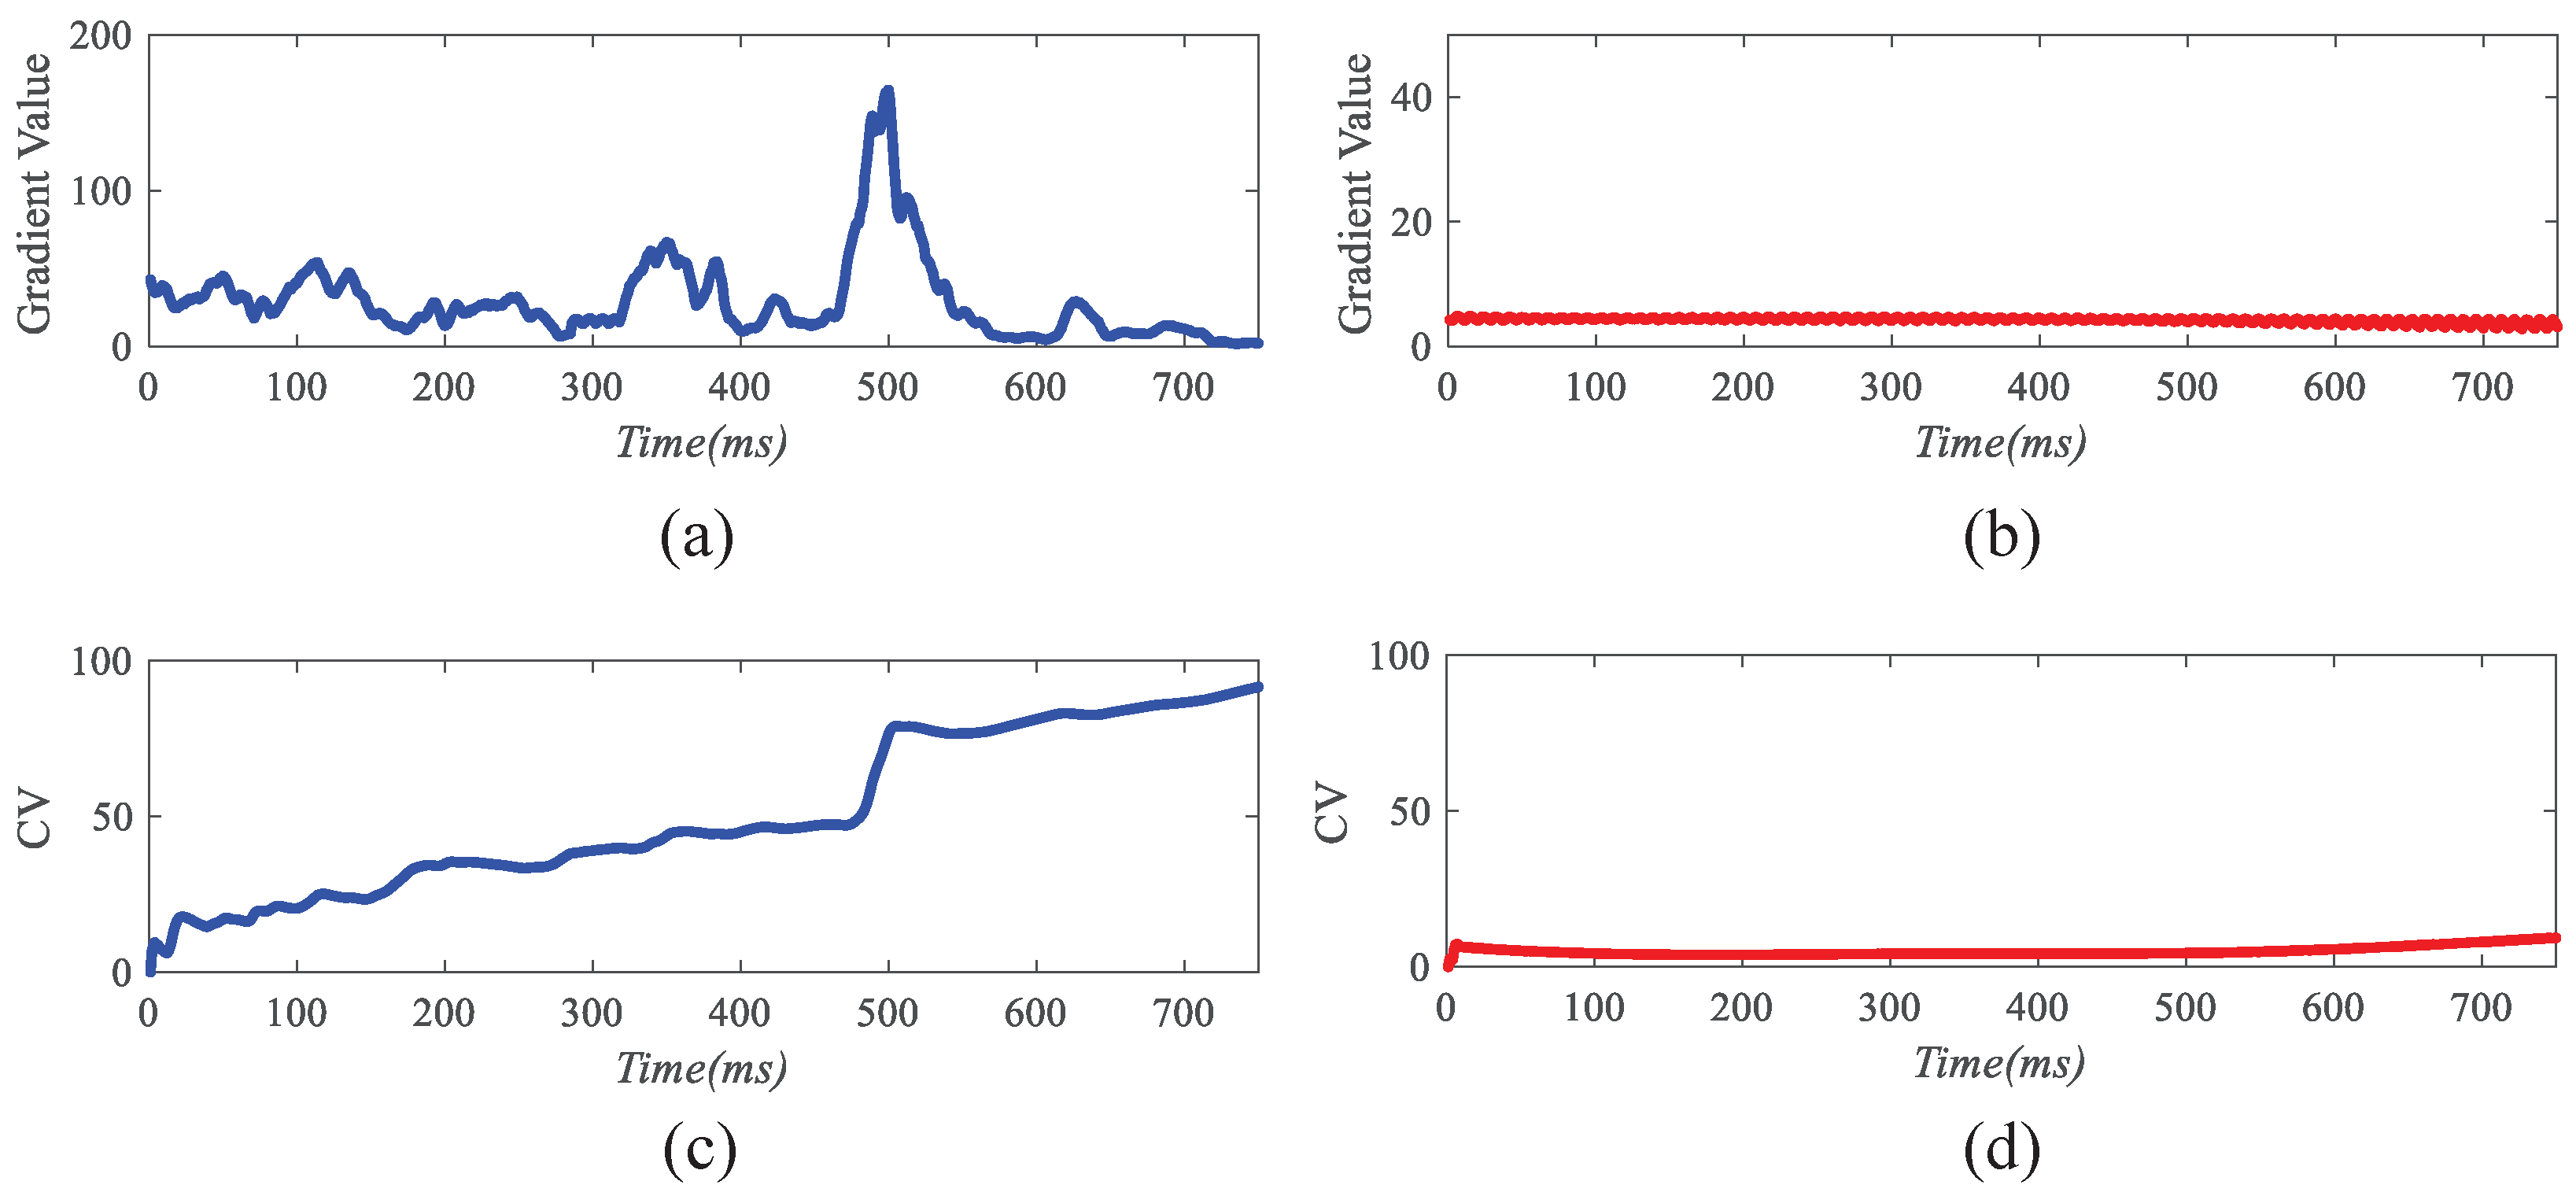
Figure 12 illustrates the gradient response information for tiny targets and false features. It can be noted that both the positions of the tiny targets and the background false alarms display pronounced gradient signals. Therefore, relying solely on gradient response information is insufficient to effectively suppress background false positives. Figure 13a,b illustrates the temporal variations in the gradient responses for tiny targets and false features. It can be observed that the gradient fluctuation curve for the tiny target exhibits a distinct oscillatory pattern over time, whereas the gradient signal of the false features remains relatively stable, with minimal variation. This difference indicates that by analyzing the temporal variability in the gradient information, we can effectively distinguish moving tiny targets from background-induced false features. Such an approach can significantly enhance the accuracy and robustness of target detection.
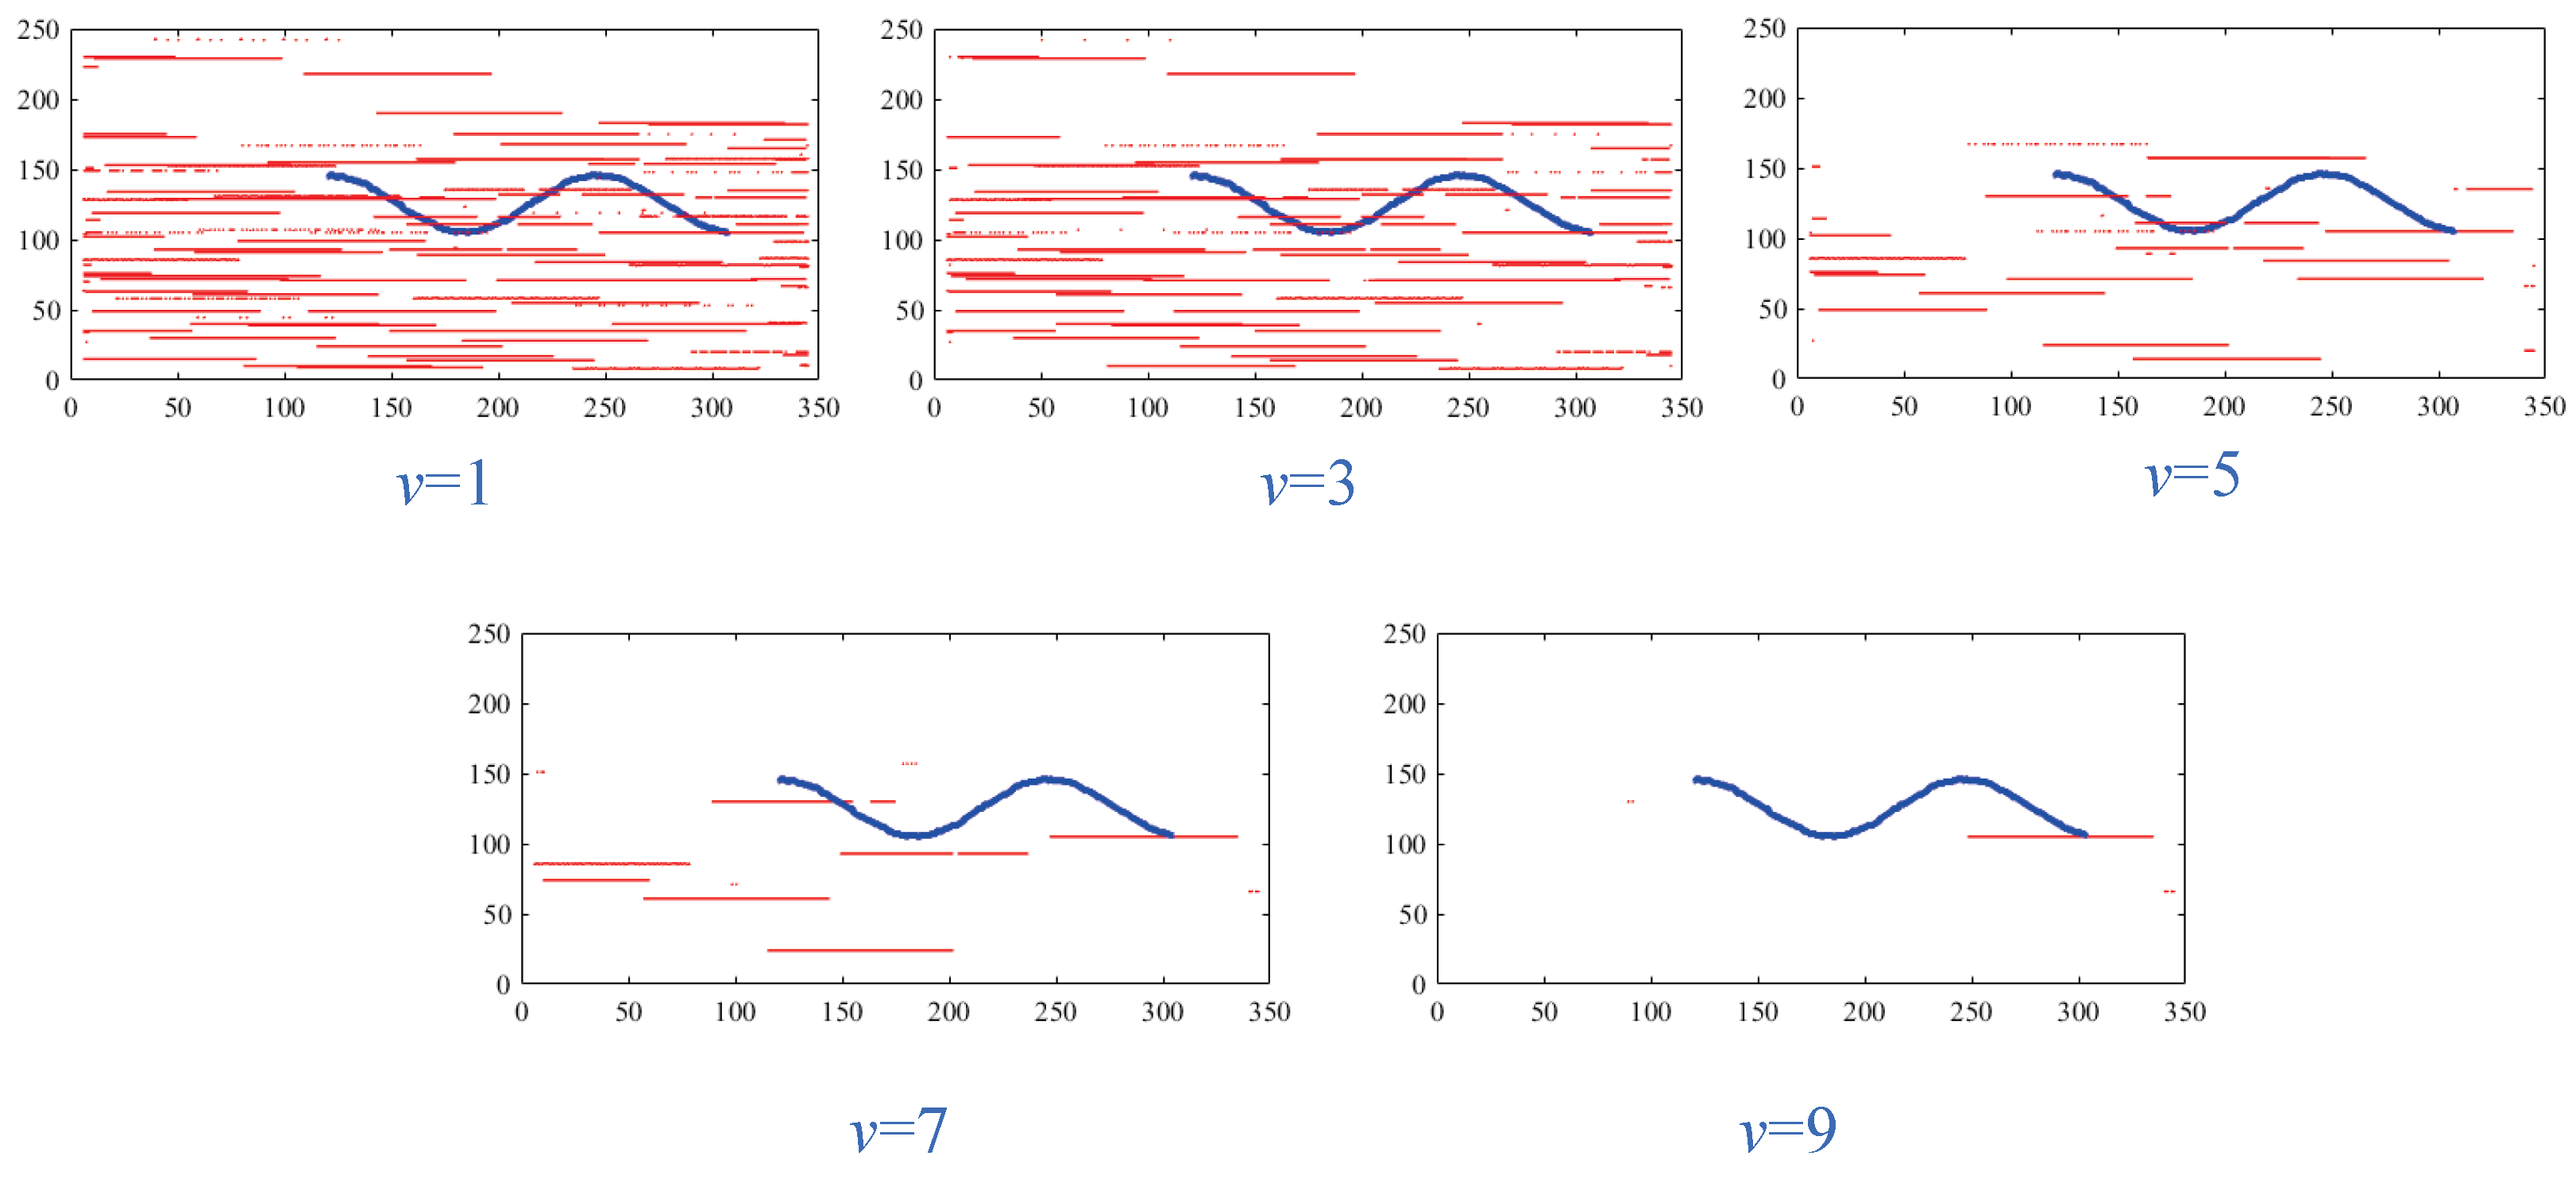
Hence, the unique characteristics of gradient variation make it possible to distinguish true tiny targets from background artifacts. The key to this separation lies in the fact that tiny targets and false background features exhibit markedly different dynamic characteristics in their gradient fluctuation curves. To quantify this intrinsic difference, we introduce the coefficient of variation as a statistical metric. The CV standardizes the degree of fluctuation in the gradient variation curve, allowing for an effective description of the differences between tiny targets and false background features. This enables accurate identification of small moving targets even under heavy background interference. Figure 13c,d present the temporal variation curves for the CV for the tiny target and the false target. From the observations, we can see that the CV in the tiny target gradually increases over time and reaches relatively high values. In contrast, the CV in the background false target remains small, with negligible variation. This difference suggests that by selecting an appropriate CV threshold, false positive signals from the background can be effectively suppressed, thereby improving the accuracy of target detection. Figure 14 depicts the motion trajectories for small targets (blue) and false positives (red) obtained using various CV threshold values ν within our detection framework. It can be clearly observed that a large number of false trajectories is always present in the recorded results. Nevertheless, with a rise in the threshold parameter, the quantity of false trajectories steadily declines, highlighting the threshold’s key function in managing the false alarm rate. A higher threshold enables a more effective distinction between true target trajectories, thereby reducing the probability of false alarms. This demonstrates that our model can effectively suppress false positives from the background, thus improving the detection accuracy. In Figure 15, the motion traces identified by different models, including the ESTMD, DSTMD, F STMD, Feedback STMD, Frac-STMD, ST-STMD and RT -STMD methods, are displayed. It can be observed that the trajectories generated by the ESTMD, DSTMD, F STMD, Feedback STMD, Frac-STMD, and ST-STMD models contain a large number of false features, making it difficult to accurately identify the tiny targets. In contrast, our proposed model, after applying the coefficient of variation (CV) threshold, effectively suppresses background false positives. As a result, the trajectories consist mainly of the true paths of tiny targets with only a few residual false positives from the background. This significantly reduces false detections and enhances both the accuracy and robustness of target detection.
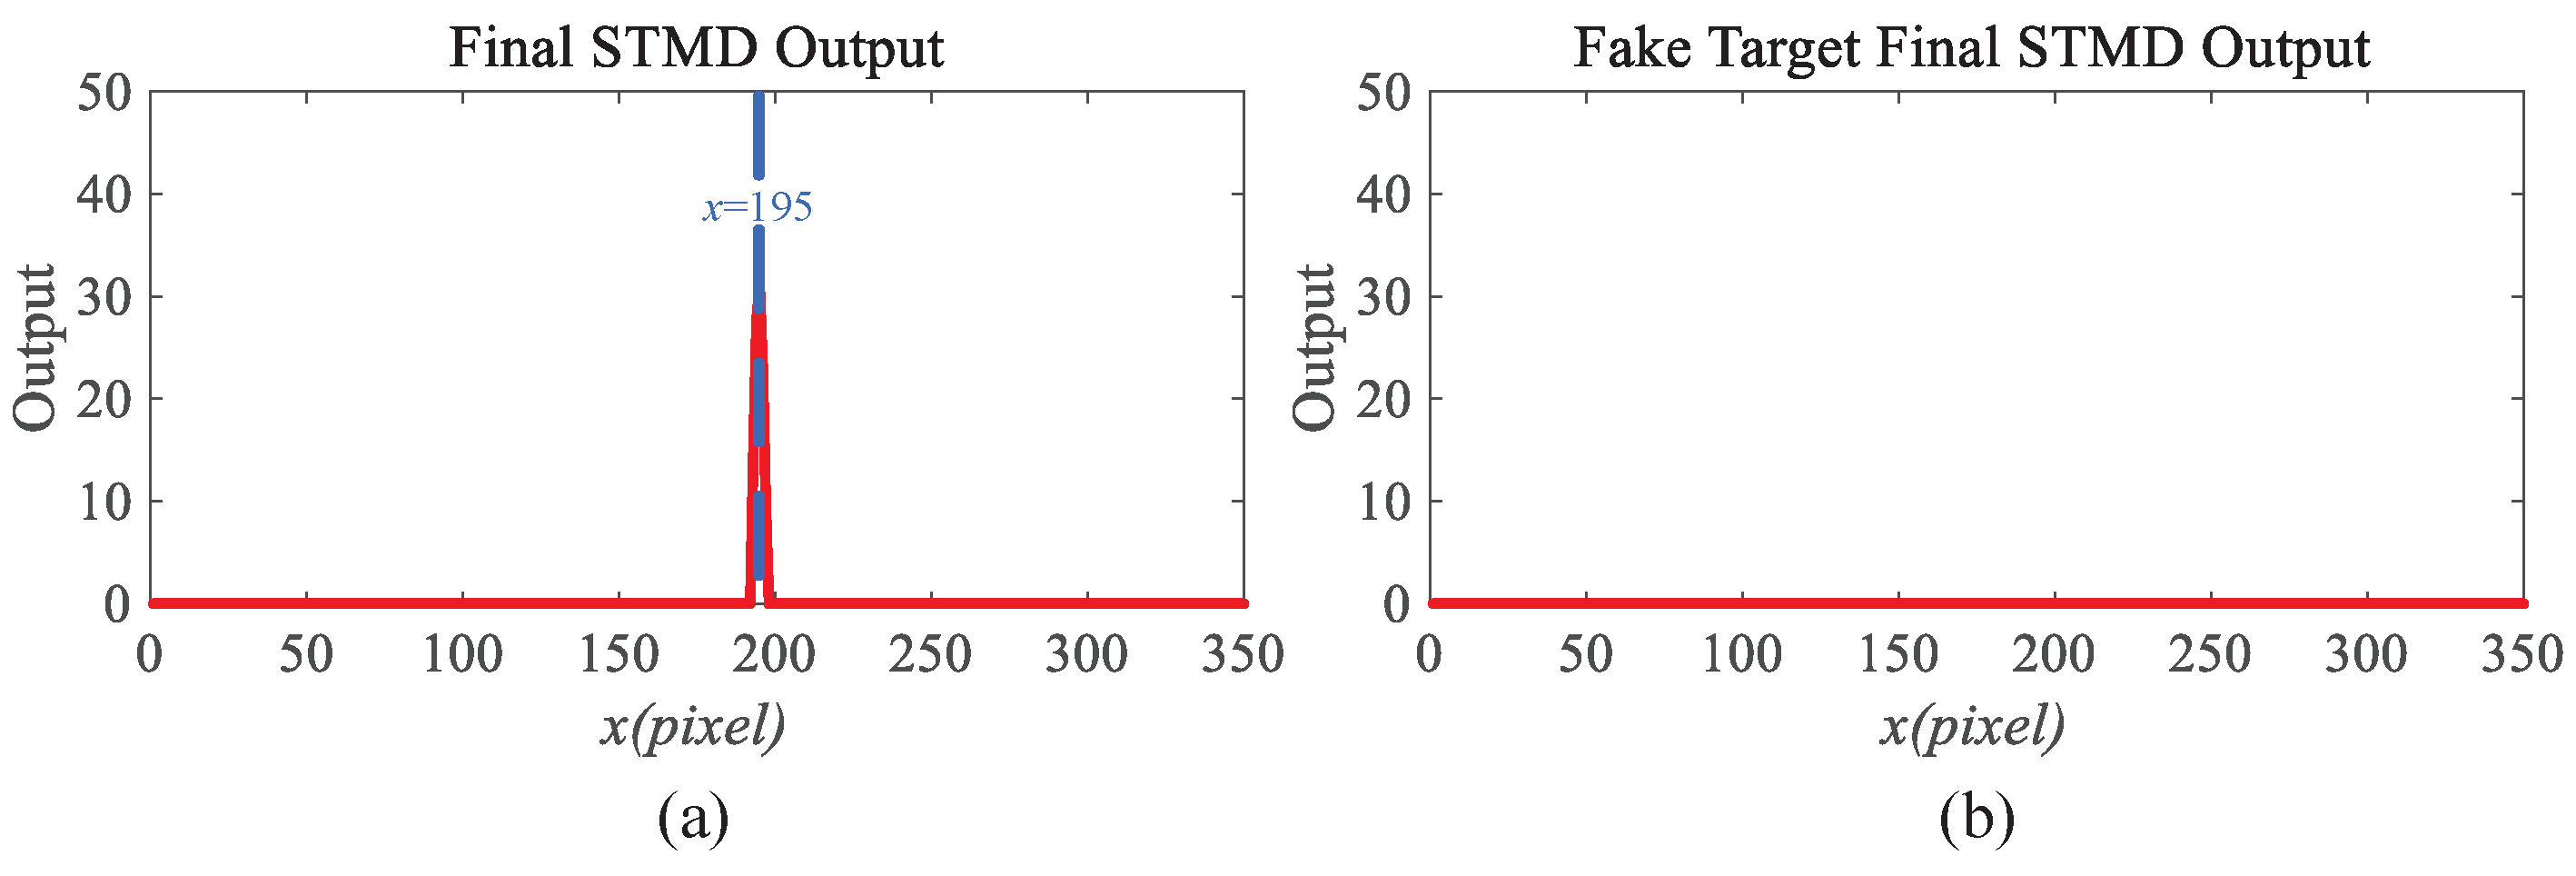
Figure 16a,b illustrate the response outputs after threshold processing. As clearly shown, only the responses corresponding to the true tiny target locations are successfully retained, while the responses caused by false features at other locations are effectively suppressed. These results confirm the capability of the proposed method to precisely distinguish tiny targets from background noise, significantly boosting the detection performance and robustness. In addition, we present the final detection results for several comparison models, as shown in Figure 17. It is apparent that the other models generate outputs with excessive false positives, thereby impairing effective target–background discrimination. In contrast, the proposed model significantly suppresses false positive responses and retains only the responses corresponding to true tiny targets. These findings further substantiate the capability of the proposed approach to accurately and robustly detect tiny targets under low-light complex background conditions.

5. The Comparative Analysis

The advantages of the RT -STMD network are showcased in this section through comparative performance evaluations. A quantitative evaluation of the detection performance is carried out by comparing seven STMD-based frameworks: RT -STMD, ESTMD [14], DSTMD [15], Feedback STMD [18], F STMD [20], ST-STMD [19], and Frac-STMD [21]. We employ the ROC curve, plotted with D A F A , as the evaluation metric, with D A and F A defined as follows:
D A = t r u e d e t e c t i o n s t o t a l t a r g e t s , F A = f a l s e d e t e c t i o n s i m a g e c o u n t .
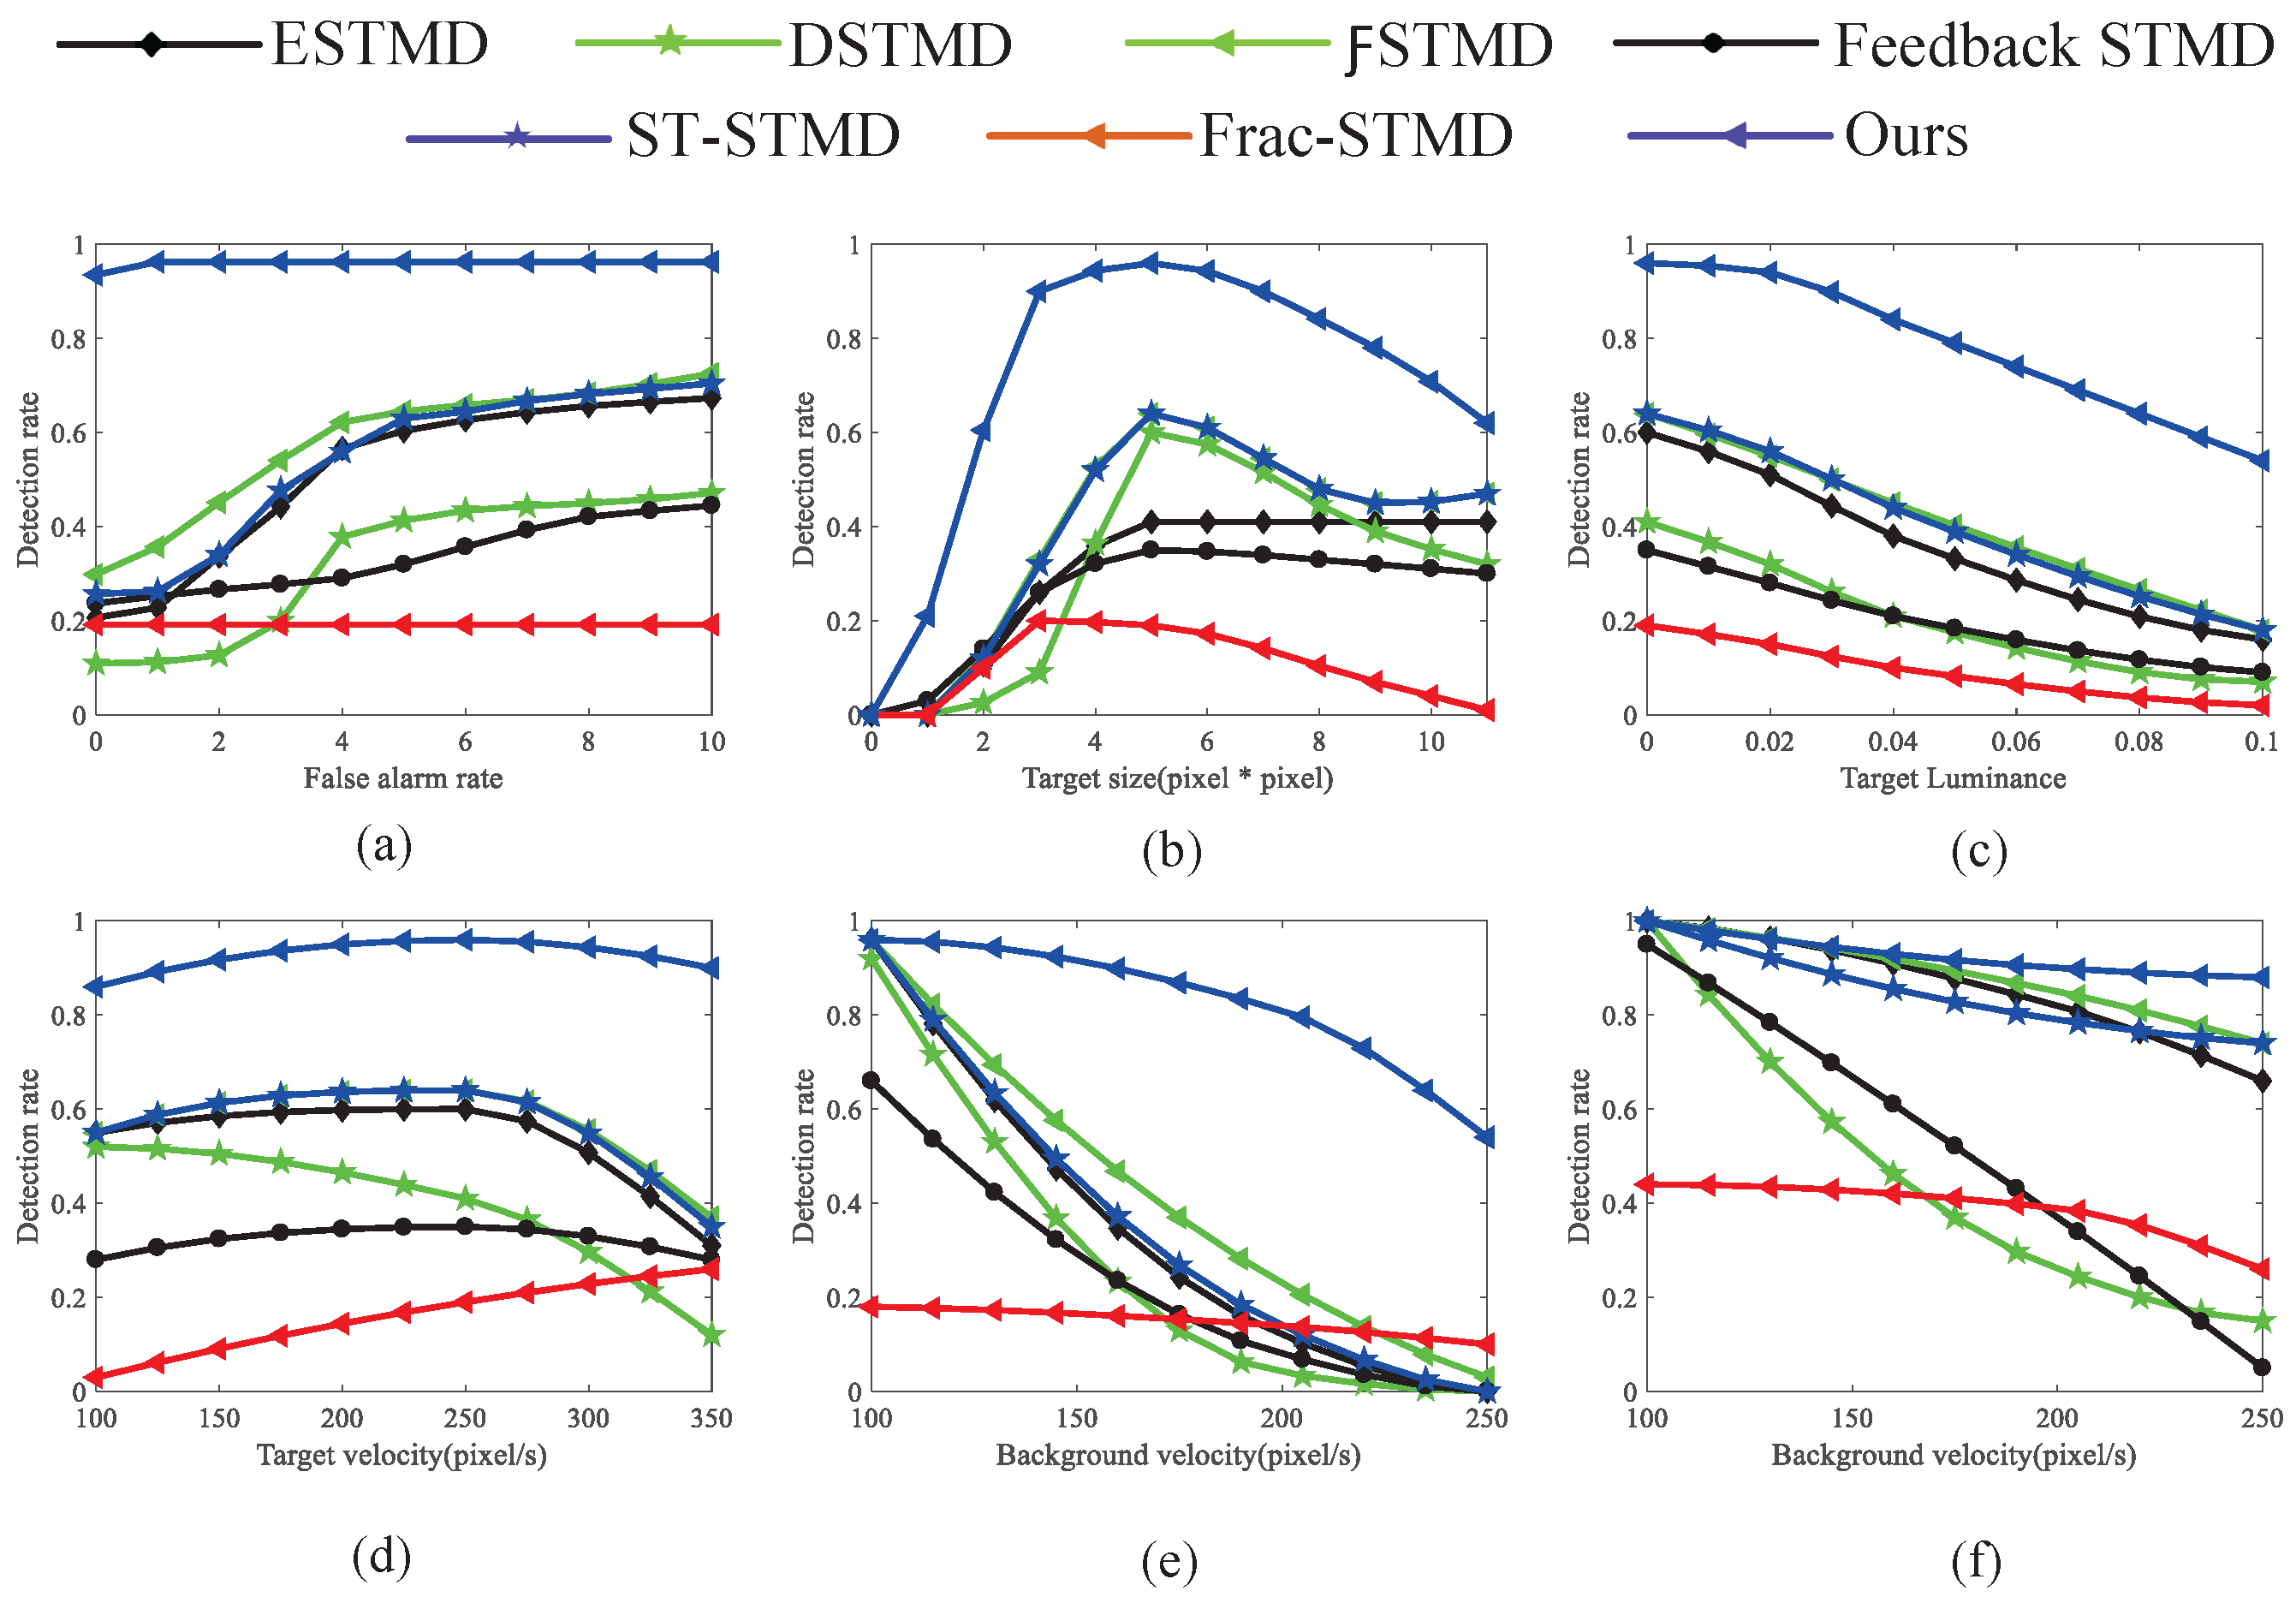
We first compared our model with existing benchmark models, including ESTMD, DSTMD, F STMD, Feedback-STMD, Frac-STMD, and ST-STMD, considering various simulation factors such as the target speed, size, luminance, background motion speed and direction, and background image. The characteristics of the simulated frame sequences are listed in Table 2. The ROC curves presented in Figure 18a demonstrate the detection capabilities of different comparative models for identifying small objects in simulated image sequences. The RT -STMD model consistently outperforms the other three by maintaining elevated detection rates at various false alarm levels. This suggests that our proposed model successfully suppresses background false positives, thereby greatly improving the detection accuracy. Figure 18b–f show the ROC curves for the comparative networks evaluated under different simulation settings, keeping the false alarm rate ( F A ) fixed at 5. In particular, Figure 18b displays ROC curves related to the detection performance for various object sizes in the simulated images. It can be observed that most models prefer target sizes between 4 × 4 and 8 × 8 pixels. However, thanks to the addition of the response gradient recognition module, our model’s detection performance significantly surpasses that of the other six models. This demonstrates that incorporating the response gradient recognition module markedly enhances the detection capability, yielding superior results across various target sizes. Figure 18c illustrates the detection performance curves for different models across varying target brightness levels. It is evident that as the target’s brightness increases from 0 to 0.1, the ROC curves for all four models exhibit a downward trend. Notably, despite this brightness range, the RT -STMD model consistently maintains the best performance across all target brightness levels. This indicates that our model remains highly robust when detecting low-contrast targets in low-light conditions, further validating the crucial role of the response gradient recognition module in enhancing both the robustness and detection accuracy in such environments. Figure 18d illustrates the detection curves for different models under varying target velocities. As shown in Figure 18d, across the entire range of 0–300 pixels/s, the ROC curve of the RT-STMD model consistently remains above those of ESTMD [14], DSTMD [15], Feedback STMD [18], F STMD [20], ST-STMD [19], and Frac-STMD [21]. This indicates that the RT -STMD model achieves a higher detection rate ( D A ) while significantly reducing the false alarm rate. These findings suggest that the response gradient recognition module introduced effectively captures velocity-sensitive motion features, thereby suppressing background dynamic interference and markedly enhancing the model’s robustness and accuracy across different motion speeds. The detection results for all of the compared models under changing background velocities and movement directions are shown in Figure 18e,f. These results show that regardless of changes in background speed or target motion direction, the ROC curve for the RT -STMD model consistently remains above those of ESTMD, DSTMD, F STMD, Feedback-STMD, Frac-STMD, and ST-STMD, achieving higher detection rates while significantly lowering false alarms. These findings further confirm that the incorporated response gradient recognition module can adaptively capture differential features between the background and target motion, thereby enhancing the model’s robustness and accuracy in complex dynamic background scenarios.
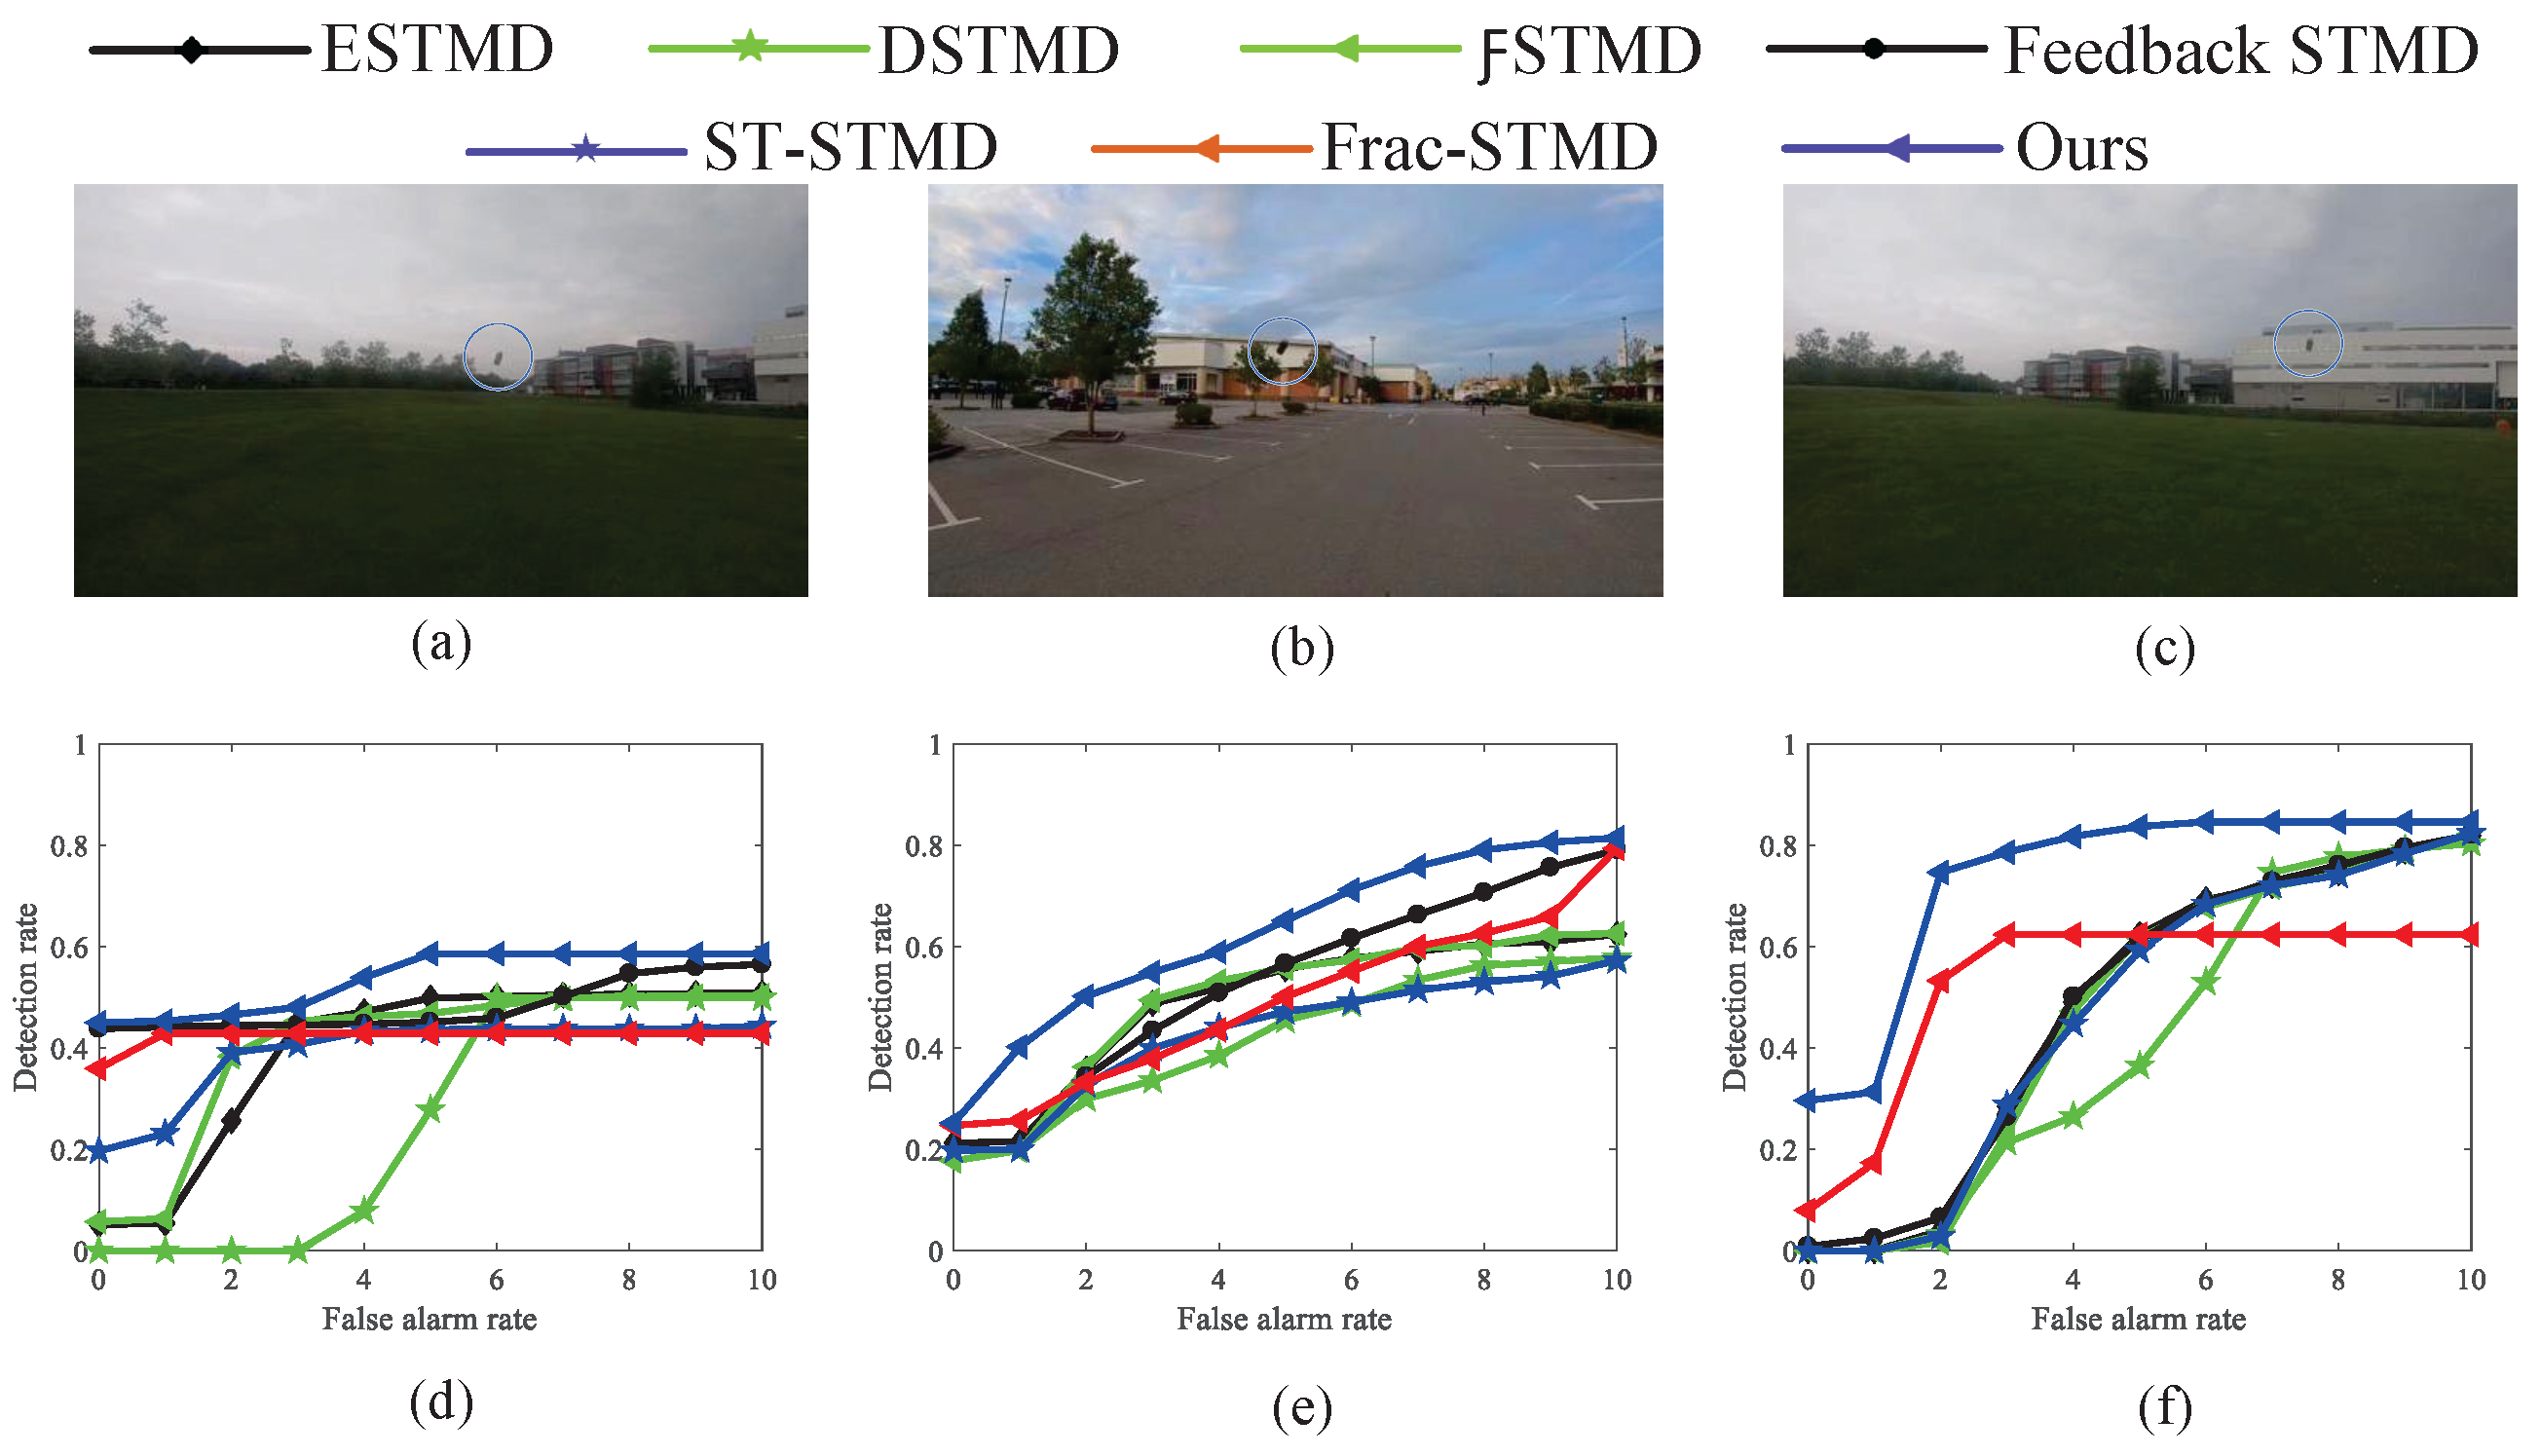
The ROC curves in Figure 19 demonstrate the detection capabilities of the comparison model for real small objects across multiple low-light and complicated motion settings. Figure 19a–c,g–i depict sample frames of small target motion in complex scenes, while Table 3 shows that all videos have an average brightness below 0.5, reflecting low-light conditions. The motion orientations of the background and the real target are represented by the arrows V B and V T . In Figure 19d–f,j–l, the ROC curves depict the performance of seven models in small target detection under dynamic, complex background conditions. The experimental data reveal that our visual neural network exceeds the performance of the six comparison models in all assessed backgrounds. Figure 20 presents the performance of various comparison models in multi-target detection tasks under different complex and dynamic backgrounds. The results demonstrate that even when detecting two or more moving targets simultaneously, our model can fully exploit the temporal characteristics of the response gradient differences between true targets and background false positives; effectively suppress background interference; and maintain a significant performance advantage. This further validates the robustness and applicability of the proposed method in multi-target detection scenarios. In addition, the detection performance of the RT -STMD model on real-world datasets is examined. Figure 21 illustrates representative frames and comparative results across the seven models. In Figure 21a–c, typical frames from three unique real datasets are presented, with Figure 17d–f showing the ROC performance curves of the comparison models in various practical environments. The findings indicate that the RT -STMD model achieves a better detection performance than ESTMD, DSTMD, F STMD, Feedback-STMD, Frac-STMD, and ST-STMD while keeping the false alarm rate unchanged.
In Table 3, Table 4, Table 5 and Table 6, we present a comprehensive quantitative comparison of various models, including GISM, GCF-CM, DSTMD, ESTMD, F STMD, Feedback STMD, Frac-STMD, ST-STMD, and RT -STMD, in terms of the detection rate, precision, F1-score, and runtime. When the false alarm rate ( F A ) is set to 5, our proposed RT -STMD achieves an average detection rate of 0.80, significantly outperforming all other models—GISM (0.04), GCF-CM (0.10), DSTMD (0.39), ESTMD (0.53), FSTMD (0.55), Feedback STMD (0.43), Frac-STMD (0.29), and ST-STMD (0.51)—which are all below 0.60. In terms of the precision and F1-score, RT -STMD attains an average precision of 0.1 and an F1-score of 0.1888, markedly higher than those of all other models (all precision values below 0.008 and F1-scores below 0.1), demonstrating superior accuracy in identifying small moving targets while effectively suppressing background false alarms and maintaining a balanced trade-off between precision and recall. Regarding the runtime, our model averages at 88.8 ms/frame, outperforming GISM (145.8 ms/frame), GCF-CM (585.5 ms/frame), and ST-STMD (234.1 ms/frame) while being slightly slower than DSTMD (86.8 ms/frame), ESTMD (21.5 ms/frame), F STMD (25.9 ms/frame), Feedback STMD (33.3 ms/frame), and Frac-STMD (20.2 ms/frame). Although it is slightly slower than some models, its high accuracy and robustness in complex backgrounds make it highly promising for practical applications. Overall, these results highlight the exceptional robustness, stability, and detection performance of the RT -STMD visual network under low-light and complex dynamic backgrounds, as well as across different target types, confirming its significant advantages for practical small target detection applications.

6. Conclusions

This paper presents a visual network designed to distinguish tiny moving targets from background false alarms in low-light, dynamic, and complex environments by exploiting differences in their temporal response gradient patterns. The network comprises two key modules: a motion perception module and a response gradient analysis module. The motion perception module identifies target positions and trajectories, while the response gradient extraction module obtains the gradient features of the motion responses through the motion perception pathway. The network then derives gradient trajectories aligned with the target’s movement and computes their coefficients of variation. Utilizing the variations in the gradient characteristics between true targets and background artifacts, along with a thresholding strategy, the network successfully reduces false alarms and accurately detects small moving objects. To assess the effectiveness of the proposed approach, comprehensive experiments were performed on both simulated and real-world datasets. The results clearly demonstrate that compared to existing approaches, this visual network significantly reduces false alarms and improves the detection accuracy. Moreover, the method attains an average detection rate of 0.8, substantially outperforming the other state-of-the-art techniques, thereby confirming its strong robustness and precision in detecting small moving targets in complex scenarios.

Author Contributions

Methodology: J.L.; validation: J.L.; investigation: H.M.; data curation: J.L. and H.M.; writing—original draft preparation: J.L.; writing—review and editing: J.L., H.M. and D.G.; visualization: J.L.; supervision: H.M. and D.G.; project administration: H.M. and D.G. All authors have read and agreed to the published version of the manuscript.

Funding

This research received no external funding.

Institutional Review Board Statement

Not applicable.

Data Availability Statement

The data presented in this study are available on request from the corresponding author.

Conflicts of Interest

Author Prof. Deming Gong was employed by the Miltor Numerical Control Technology Limited Company. The remaining authors declare that the research was conducted in the absence of any commercial or financial relationships that could be construed as a potential conflict of interest.

References

  1. Escobar-Alvarez, H.D.; Ohradzansky, M.; Keshavan, J.; Ranganathan, B.N.; Humbert, J.S. Obstacle avoidance and path planning methods for autonomous navigation of mobile robot. Sensors 2024, 24, 3573. [Google Scholar] [CrossRef]
  2. Mahaur, B.; Mishra, K.K. Small-object detection based on YOLOv5 in autonomous driving systems. Pattern Recognit. Lett. 2023, 168, 115–122. [Google Scholar] [CrossRef]
  3. Teja, Y.D. Static object detection for video surveillance. Multimed Tools Appl. 2023, 82, 21627–21639. [Google Scholar] [CrossRef]
  4. Kalsotra, R.; Arora, S. Background subtraction for moving object detection: Explorations of recent developments and challenges. Vis. Comput. 2022, 38, 4151–4178. [Google Scholar] [CrossRef]
  5. Xiao, Y.; Yuan, Q.; Jiang, K.; Jin, X.; He, J.; Zhang, L.; Lin, C.W. Local-global temporal difference learning for satellite video super-resolution. IEEE Trans. Circuits Syst. Video Technol. 2023, 34, 2789–2802. [Google Scholar] [CrossRef]
  6. Sun, S.; Mo, B.; Xu, J.; Li, D.; Zhao, J.; Han, S. Multi-YOLOv8: An infrared moving small object detection model based on YOLOv8 for air vehicle. Neurocomputing 2024, 588, 127685. [Google Scholar] [CrossRef]
  7. Xu, S.; Zhang, M.; Song, W.; Mei, H.; He, Q.; Liotta, A. A systematic review and analysis of deep learning-based underwater object detection. Neurocomputing 2023, 527, 204–232. [Google Scholar] [CrossRef]
  8. Diwan, T.; Anirudh, G.; Tembhurne, J.V. Object detection using YOLO: Challenges, architectural successors, datasets and applications. Multimed Tools Appl. 2023, 82, 9243–9275. [Google Scholar] [CrossRef]
  9. Zhou, Y. A YOLO-NL object detector for real-time detection. Multimed Tools Appl. 2024, 238, 122256. [Google Scholar] [CrossRef]
  10. Mischiati, M.; Lin, H.T.; Herold, P.; Imler, E.; Olberg, R.; Leonardo, A. Internal models direct dragonfly interception steering. Nature 2015, 517, 333–338. [Google Scholar] [CrossRef]
  11. Barnett, P.D.; Nordström, K.; O’carroll, D.C. Retinotopic organization of small-field-target-detecting neurons in the insect visual system. Curr. Biol. 2007, 17, 569–578. [Google Scholar] [CrossRef]
  12. Keleş, M.F.; Frye, M.A. Object-detecting neurons in Drosophila. Curr. Biol. 2017, 27, 680–687. [Google Scholar] [CrossRef]
  13. Nordström, K.; Barnett, P.D.; O’Carroll, D.C. Insect detection of small targets moving in visual clutter. PLoS Biol. 2006, 4, e54. [Google Scholar] [CrossRef]
  14. Wiederman, S.D.; Shoemaker, P.A.; O’Carroll, D.C. A model for the detection of moving targets in visual clutter inspired by insect physiology. PLoS ONE 2008, 3, e2784. [Google Scholar] [CrossRef] [PubMed]
  15. Wang, H.; Peng, J.; Yue, S. A directionally selective small target motion detecting visual neural network in cluttered backgrounds. IEEE Trans. Cybern. 2018, 50, 1541–1555. [Google Scholar] [CrossRef] [PubMed]
  16. Wiederman, S.D.; O’Carroll, D.C. Biologically inspired feature detection using cascaded correlations of off and on channels. J. Artif. Intell. Soft. 2013, 3, 5–14. [Google Scholar] [CrossRef]
  17. Wiederman, S.D.; O’Carroll, D.C. Biomimetic target detection: Modeling 2 nd order correlation of off and on channels. In Proceedings of the 2013 IEEE Symposium on Computational Intelligence for Multimedia, Signal and Vision Processing (CIMSIVP), Singapore, 16–19 April 2013; pp. 16–21. [Google Scholar]
  18. Wang, H.; Wang, H.; Zhao, J.; Hu, C.; Peng, J.; Yue, S. A time-delay feedback neural network for discriminating small, fast-moving targets in complex dynamic environments. IEEE Trans. Neural Netw Learn. Syst. 2021, 34, 316–330. [Google Scholar] [CrossRef]
  19. Wang, H.; Zhong, Z.; Lei, F.; Peng, J.; Yue, S. Bio-inspired small target motion detection with spatio-temporal feedback in natural scenes. IEEE Trans. Image Process. 2024, 33, 451–465. [Google Scholar] [CrossRef]
  20. Ling, J.; Wang, H.; Xu, M.; Chen, H.; Li, H.; Peng, J. Mathematical study of neural feedback roles in small target motion detection. Front. Neurorobot. 2022, 16, 984430. [Google Scholar] [CrossRef]
  21. Xu, M.; Wang, H.; Chen, H.; Li, H.; Peng, J. A fractional-order visual neural model for small target motion detection. Neurocomputing 2023, 550, 126459. [Google Scholar] [CrossRef]
  22. Wang, H.; Zhao, J.; Wang, H.; Hu, C.; Peng, J.; Yue, S. Attention and prediction-guided motion detection for low-contrast small moving targets. IEEE Trans. Cybern. 2022, 53, 6340–6352. [Google Scholar] [CrossRef]
  23. Chen, H.; Fan, B.; Li, H.; Peng, J. Rigid propagation of visual motion in the insect’s neural system. Neural Netw. 2025, 181, 106874. [Google Scholar] [CrossRef]
  24. Billah, M.A.; Faruque, I.A. Modeling Small-Target Motion Detector Neurons as Switched Systems with Dwell Time Constraints. In Proceedings of the 2022 American Control Conference (ACC), Atlanta, GA, USA, 8–10 June 2022; pp. 3192–3197. [Google Scholar]
  25. Uzair, M.; Finn, A.; Brinkworth, R.S. Efficient Sampling of Bayer Pattern for Long Range Small Target Detection in Color Images. In Proceedings of the 2023 38th International Conference on Image and Vision Computing New Zealand (IVCNZ), Palmerston North, New Zealand, 29–30 November 2023; pp. 1–5. [Google Scholar]
  26. Uzair, M.; Brinkworth, R.S.; Finn, A. Detecting small size and minimal thermal signature targets in infrared imagery using biologically inspired vision. Neuron 2021, 21, 1812. [Google Scholar] [CrossRef]
  27. Uzair, M.; Brinkworth, R.S.A.; Finn, A. A bio-inspired spatiotemporal contrast operator for small and low-heat-signature target detection in infrared imagery. Neuron 2021, 33, 7311–7324. [Google Scholar] [CrossRef]
  28. Stöckl, A.L.; O’Carroll, D.C.; Warrant, E.J. Hawkmoth lamina monopolar cells act as dynamic spatial filters to optimize vision at different light levels. Sci. Adv. 2020, 6, eaaz8645. [Google Scholar] [CrossRef]
  29. Clark, D.A.; Demb, J.B. Parallel computations in insect and mammalian visual motion processing. Curr. Biol. 2016, 26, R1062–R1072. [Google Scholar] [CrossRef]
  30. Sztarker, J.; Rind, F.C. A look into the cockpit of the developing locust: Looming detectors and predator avoidance. Dev. Neurobiol. 2014, 74, 1078–1095. [Google Scholar] [CrossRef] [PubMed]
  31. Rind, F.C. Recent advances in insect vision in a 3D world: Looming stimuli and escape behaviour. Curr. Opin. Insect Sci. 2024, 63, 101180. [Google Scholar] [CrossRef] [PubMed]
  32. Scheffer, L.K.; Xu, C.S.; Januszewski, M.; Lu, Z.; Takemura, S.Y.; Hayworth, K.J.; Huang, G.B.; Shinomiya, K.; Maitlin-Shepard, J.; Berg, S.; et al. A connectome and analysis of the adult Drosophila central brain. eLife 2020, 9, e57443. [Google Scholar] [CrossRef] [PubMed]
  33. Maisak, M.S.; Haag, J.; Ammer, G.; Serbe, E.; Meier, M.; Leonhardt, A.; Schilling, T.; Bahl, A.; Rubin, G.M.; Nern, A.; et al. A directional tuning map of Drosophila elementary motion detectors. Nature 2013, 500, 212–216. [Google Scholar] [CrossRef]
  34. Hussaini, M.M.; Evans, B.J.; O’Carroll, D.C.; Wiederman, S.D. Temperature modulates the tuning properties of small target motion detector neurons in the dragonfly visual system. Curr. Biol. 2024, 34, 4332–4337. [Google Scholar] [CrossRef]
  35. Zheng, Y.; Wang, Y.; Wu, G.; Li, H.; Peng, J. Enhancing LGMD-based model for collision prediction via binocular structure. Front. Neurosci. 2023, 17, 1247227. [Google Scholar] [CrossRef]
  36. Chang, Z.; Fu, Q.; Chen, H.; Li, H.; Peng, J. A look into feedback neural computation upon collision selectivity. Neural Netw. 2023, 166, 22–37. [Google Scholar] [CrossRef] [PubMed]
  37. Chang, Z.; Chen, H.; Hua, M.; Fu, Q.; Peng, J. A bio-inspired visual collision detection network integrated with dynamic temporal variance feedback regulated by scalable functional countering jitter streaming. Neural Netw. 2025, 182, 106882. [Google Scholar] [CrossRef] [PubMed]
  38. Hassenstein, B.; Reichardt, W. Systemtheoretische analyse der zeit-, reihenfolgen-und vorzeichenauswertung bei der bewegungsperzeption des rüsselkäfers chlorophanus. Z. FüR Naturforsch. B 1956, 11, 513–524. [Google Scholar] [CrossRef]
  39. Clark, D.A.; Bursztyn, L.; Horowitz, M.A.; Schnitzer, M.J.; Clandinin, T.R. Defining the computational structure of the motion detector in Drosophila. Neuron 2011, 70, 1165–1177. [Google Scholar] [CrossRef]
  40. Warrant, E.J. Matched filtering and the ecology of vision in insects. Ecol. Anim. Senses Matched Filters Econ. Sens 2016, 11, 143–167. [Google Scholar]
  41. Hao, C.; Li, Z.; Zhang, Y.; Chen, W.; Zou, Y. Infrared Small Target Detection Based on Adaptive Size Estimation by Multi-directional Gradient Filter. IEEE Trans. Geosci. Remote Sens. 2024, 62, 5007915. [Google Scholar] [CrossRef]
  42. Zhang, X.; Ru, J.; Wu, C. Infrared small target detection based on gradient correlation filtering and contrast measurement. IEEE Trans. Geosci. Remote Sens. 2023, 61, 1–12. [Google Scholar] [CrossRef]
  43. Li, Y.; Li, Z.; Li, W.; Liu, Y. Infrared small target detection based on gradient-intensity joint saliency measure. IEEE Trans. Geosci. Remote Sens. 2022, 15, 7687–7699. [Google Scholar] [CrossRef]
  44. Liu, L.; Liu, Z.; Hou, A.; Qian, X.; Wang, H. Adaptive edge detection of rebar thread head image based on improved Canny operator. IET Image Process. 2024, 18, 1145–1160. [Google Scholar] [CrossRef]
  45. Tiwari, M.; Bhargava, A.; Chaurasia, V.; Shandilya, M.; Siddiqui, E.A.; Bhardwaj, S. Automated lung cancer detection using Prewitt gradient kernel and SVM from CT-Lung images. In Proceedings of the 2023 1st International Conference on Innovations in High Speed Communication and Signal Processing (IHCSP) 2023: 16th European Conference, Glasgow, UK, 23–28 March 2023; pp. 508–513. [Google Scholar]
  46. Vijayalakshmi, D.; Nath, M.K. A novel contrast enhancement technique using gradient-based joint histogram equalization. Circuits Syst. Signal Process. 2021, 40, 3929–3967. [Google Scholar] [CrossRef]
  47. Zhang, L.; Peng, Z. Infrared small target detection based on partial sum of the tensor nuclear norm. Remote Sens. 2019, 11, 382. [Google Scholar] [CrossRef]
  48. Nie, J.; Qu, S.; Wei, Y.; Zhang, L.; Deng, L. An infrared small target detection method based on multiscale local homogeneity measure. Infrared. Phys. Technol. 2018, 90, 186–194. [Google Scholar] [CrossRef]
  49. Zhang, H.; Zhang, L.; Yuan, D.; Chen, H. Infrared small target detection based on local intensity and gradient properties. Infrared. Phys. Technol. 2018, 89, 88–96. [Google Scholar] [CrossRef]
  50. Borst, A.; Helmstaedter, M. Common circuit design in fly and mammalian motion vision. Nat. Neurosci. 2015, 18, 1067–1076. [Google Scholar] [CrossRef]
  51. Sanes, J.R.; Zipursky, S.L. Design principles of insect and vertebrate visual systems. Neuron 2010, 66, 15–36. [Google Scholar] [CrossRef]
  52. De Vries, B.; Príncipe, J. A theory for neural networks with time delays. In Proceedings of the Conference: Advances in Neural Information Processing Systems 3, Denver, CO, USA, 26–29 November 1990; pp. 162–168. [Google Scholar]
  53. Joesch, M.; Schnell, B.; Raghu, S.V.; Reiff, D.F.; Borst, A. ON and OFF pathways in Drosophila motion vision. Nature 2010, 468, 300–304. [Google Scholar] [CrossRef]
  54. Straw, A.D. Vision egg: An open-source library for realtime visual stimulus generation. Front. Neuroinform. 2008, 2, 339. [Google Scholar] [CrossRef]
  55. RIST Data Set. 2020. Available online: https://sites.google.com/view/hongxinwang-personalsite/download/ (accessed on 6 April 2020).
Figure 1. Small targets in a low-light background.
Applsci 15 09207 g001
Figure 2. (a) A flowchart of the RT -STMD model framework. (b) The architecture of the RT -STMD model comprises two main components: a motion information extraction module and a response gradient feature extraction module. The former identifies the positions of small targets by capturing their motion characteristics, while the latter computes gradient features from the response data. Ultimately, integrating motion cues with gradient features enables the system to effectively suppress background-induced false alarms under low-light conditions.
Applsci 15 09207 g002
Figure 3. The operational mechanism of the STMD (Small Target Motion Detector) neural network can be divided into several stages. First, the STMD network acquires external luminance signals through its ommatidium structure. These raw optical inputs undergo an initial denoising step to minimize the influence of environmental noise on subsequent processing. Next, the LMC (large monopolar cell) neurons compute the temporal variations in the received luminance, which is critical for motion detection, as it captures the brightness fluctuations caused by the target’s movement. The extracted luminance changes are then processed in parallel by Tm3 and Tm1 neurons. Finally, the STMD neurons integrate the outputs from Tm3 and Tm1 to generate a final response. This response reflects the network’s detection of small target motion, typically manifesting as a strong activation signal that indicates the presence and position of the target.
Applsci 15 09207 g003
Figure 4. The working mechanism of the response gradient extraction module is as follows: this module first derives gradient information from the output of the motion information perception module and then analyzes the temporal gradient variations between true small targets and background-induced false positives. As illustrated in Figure 4, the gradient of a genuine small target exhibits significant fluctuations over time, whereas that of a background false positive remains nearly constant due to its fusion with the background. Based on this distinction, the system computes the coefficient of variation (CV) in the gradient for each trajectory: true small targets produce noticeably higher CV curves, while background false positives yield markedly lower ones. Consequently, the gradient coefficient of variation serves as a reliable criterion for distinguishing real small targets from false alarms.
Applsci 15 09207 g004
Figure 5. The procedure for documenting the motion trajectories involves checking whether a detected small target at ( x t + 1 , y t + 1 ) with t + 1 is within a limited field of the location ( x t , y t ) at time t. If so, both points are assigned to a common trajectory. This step is repeated to record the trajectory over time.
Applsci 15 09207 g005
Figure 6. The sensitivity analysis curve for the coefficient of variation (CV) threshold. As the threshold increases from low to high, the detection rate of the model first rises steadily, reaches its peak, and then gradually declines. The eperimental results indicate that the model achieves the optimal detection performance when the CV threshold is set to 9.
Applsci 15 09207 g006
Figure 7. (a) A dataset frame presents a case where the tiny object and the complex low-light background move in opposite directions, with velocities of 250 and 150 pixels per second, respectively. The movement directions are denoted by the vectors V T for the target and V B for the background. Man-made structures within the background are regarded as false targets and share the same motion as the background. (b) The trace of a true small target.
Applsci 15 09207 g007
Figure 8. (a) The original input for the small target’s position. (b) The original input for the fake target’s position. (c) The ommatidia response for the small target’s position. (d) The ommatidia response for the fake target’s position.
Applsci 15 09207 g008
Figure 9. (a) The LMC response for the small target’s position. (b) The LMC response for the fake target’s position.
Applsci 15 09207 g009
Figure 10. (a) Tm3 response for small target position ( x = 195 ) and background false positives (x = 69, 237, 319). (b) Tm3 response for fake target position ( x = 167 ). (c) Tm1 response for small target position ( x = 195 ) and background false positives (x = 69, 237, 319). (d) Tm1 response for fake target position ( x = 167 ).
Applsci 15 09207 g010
Figure 11. (a) STMD response for small target position ( x = 195 ) and background false positives (x = 69, 237, 319). (b) STMD response for the fake target’s position ( x = 167 ).
Applsci 15 09207 g011
Figure 12. (a) The gradient response in small target position ( x = 195 ) and background false positives ( x = 69 , 237 , 319 ). (b) The gradient response in fake target position ( x = 167 ).
Applsci 15 09207 g012
Figure 13. (a,b) The temporal variation in the gradient signals for both the tiny target and spurious objects within [ 0 , 800 ] ms. (c,d) The curve for the coefficient of variation for both the tiny target and spurious objects across the interval [ 0 , 800 ] ms.
Applsci 15 09207 g013
Figure 14. The trajectories detected by the RT -STMD model across varying thresholds ν .
Applsci 15 09207 g014
Figure 15. The movement traces detected by the existing benchmark models and RT -STMD approaches.
Applsci 15 09207 g015
Figure 16. (a) Final STMD response for true small target position. (b) Final STMD response for fake target position.
Applsci 15 09207 g016
Figure 17. Two-dimensional views of the detection results from several methods. A comparison reveals that the results from ESTMD, DSTMD, F STMD, Feedback STMD, Frac-STMD, and ST-STMD contain numerous false positive features. In contrast, the RT -STMD detection results primarily consist of the true trajectories of the tiny targets, significantly reducing the interference from background false positives. This demonstrates the superior capability of RT -STMD to suppress false features, thereby enhancing the accuracy of tiny target detection.
Applsci 15 09207 g017
Figure 18. (a) The receiver operating characteristic (ROC) curves obtained by the existing benchmark models and RT -STMD methods on original video. (bf) The ROC curves derived from existing benchmark models and RT -STMD methods under different data parameters, including object size, object brightness, object velocity, and background velocity.
Applsci 15 09207 g018
Figure 19. (ac,gi) Representative frames from six simulated datasets under low-light conditions. (df,jl) The receiver operating characteristic (ROC) curves obtained by the existing benchmark models and RT -STMD methods in detecting small moving target in different low-light synthetic datasets.
Applsci 15 09207 g019
Figure 20. (ac) Representative multi-target frames from three simulated datasets under low-light conditions. (df) The receiver operating characteristic (ROC) curves obtained by the existing benchmark models and RT -STMD methods in detecting many small moving targets in different low-light synthetic datasets.
Applsci 15 09207 g020
Figure 21. (ac) Representative frames from three real datasets under low-light conditions. (df) The receiver operating characteristic (ROC) curves obtained by the existing benchmark models and RT -STMD methods in detecting small moving target in different low-light real datasets.
Applsci 15 09207 g021
Table 1. Model coefficients.
EquationParameters
(1) σ 1 = 1
(3) n 1 = 2 , τ 1 = 3 , n 2 = 6 , τ 2 = 9
(7) n 3 = 5 , τ 3 = 25
(10) σ 2 = 1.5 , σ 3 = 3
(11) φ = 1 , ψ = 3 , e = 1 , ρ = 0
Table 2. Settings for the simulated data.
Video DataPrimary VideoEvaluation OneEvaluation TwoEvaluation ThreeEvaluation FourEvaluation Five
Target scale 5 × 5 1 × 1 11 × 11 5 × 5 5 × 5 5 × 5 5 × 5
Target illumination range00 0 0.1 000
Target motion speed range (pixels per second)250250250 100 350 250250
Range of background motion speeds (pixels per second)150150150150 100 250 100 250
Background motion directionIn the right directionIn the right directionIn the right directionIn the right directionIn the right directionIn the left direction
Background sceneFigure 7aFigure 7aFigure 7aFigure 7aFigure 7aFigure 7a
Table 3. Detection rate across various approaches ( F A = 5 ).
VideoMean BrightnessGISMGCF-CMDSTMDESTMD F STMDFeedback STMDFrac-STMDST-STMD RT -STMD
Primary video0.290.010.030.410.640.640.350.190.640.96
Simulated one0.240.010.010.170.300.380.110.030.300.91
Simulated two0.210.030.030.460.500.500.370.320.490.71
Simulated three0.210.020.020.520.560.560.330.170.580.92
Simulated four0.300.040.040.460.640.680.510.330.640.92
Simulated five0.230.030.020.450.580.580.510.250.590.73
Simulated six0.160.020.060.180.410.470.470.090.410.74
Real one0.480.080.130.280.500.470.450.430.430.59
Real two0.440.060.070.450.550.570.560.500.470.65
Real three0.430.060.620.360.620.620.620.620.590.84
Mean 0.040.100.390.530.550.430.290.510.80
Table 4. Comparative precision of various algorithms.
MethodsGISMGCF-CMDSTMDESTMD F STMDFeedback STMDFrac-STMDST-STMD RT -STMD
Primary video0.00480.00720.00870.00700.00700.00670.00710.00700.3667
Simulated one0.00470.00620.00970.00740.00740.00760.00930.00740.1094
Simulated two0.00350.00490.01010.00810.00800.00610.00980.00840.0857
Simulated three0.00350.00500.00900.00780.00770.00700.00930.00800.0509
Simulated four0.00420.00560.00740.00680.00680.00610.00680.00680.0555
Simulated five0.00400.00290.00780.00680.00660.00610.00730.00700.0316
Simulated six0.00380.00510.00620.00580.00580.00630.00630.00580.1064
Real one0.00440.00510.00550.00450.00430.00420.00460.00460.0264
Real two0.00390.00500.00580.00420.00420.00410.00460.00430.0857
Real three0.00310.00500.00480.00370.00360.00440.00420.00360.0748
Mean0.00400.00500.00750.00620.00610.00590.00690.00630.1000
Table 5. Comparative F1-scores of various algorithms.
VideoGISMGCF-CMDSTMDESTMD F STMDFeedback STMDFrac-STMDST-STMD RT -STMD
Primary video0.00960.01420.01730.01390.01390.01330.01410.01390.5343
Simulated one0.00930.01230.01910.01460.01460.03170.01840.01470.1969
Simulated two0.00700.00960.02000.01600.01590.01210.01940.01670.1565
Simulated three0.00700.00980.01960.01540.01530.01390.01850.01600.3071
Simulated four0.00830.01100.01460.01360.01350.01220.01340.01350.1050
Simulated five0.00800.00570.01540.01350.01310.01220.01450.01380.0611
Simulated six0.00760.01000.01230.01150.01160.01260.01250.01160.1882
Real one0.00870.01010.01100.00900.00870.00850.00910.00910.0511
Real two0.00780.01000.01160.00840.00840.00820.00910.00860.1539
Real three0.00630.01000.00960.00730.00720.00880.00830.00730.1342
Mean0.00800.01030.01510.01230.01220.01340.01370.01250.1888
Table 6. Runtime of various algorithms (frame/ms).
VideoGISMGCF-CMDSTMDESTMD F STMDFeedback STMDFrac-STMDST-STMD RT -STMD
Primary video145.2627.191.823.227.835.421.5234.3108.0
Simulated one149.0599.486.721.026.432.416.5234.296.2
Simulated two149.2582.882.120.324.331.019.7233.892.3
Simulated three137.4610.096.820.824.335.519.0234.194.9
Simulated four146.8595.0110.824.828.733.624.6233.2112.4
Simulated five145.2580.7107.825.836.235.620.7235.0119.8
Simulated six175.2602.790.925.729.739.221.9245.1115.2
Real one118.8490.053.715.015.624.516.2212.841.4
Real two183.2730.998.524.931.647.425.7278.171.7
Real three107.6437.148.513.514.718.515.7200.636.3
Mean145.8585.586.821.525.933.320.2234.188.8
Disclaimer/Publisher’s Note: The statements, opinions and data contained in all publications are solely those of the individual author(s) and contributor(s) and not of MDPI and/or the editor(s). MDPI and/or the editor(s) disclaim responsibility for any injury to people or property resulting from any ideas, methods, instructions or products referred to in the content.