Article

Uniaxial Compressive Mechanical Behavior of Coals with Different Joint Spacing and Angles: A DEM Numerical Simulation Study

1
School of Safety Engineering, China University of Mining and Technology, Xuzhou 221008, China
2
School of Resources and Geosciences, China University of Mining and Technology, Xuzhou 221008, China
3
College of Resources, Shandong University of Science and Technology, Tai’an 271019, China
4
Zaozhuang Mining Group Co., Ltd., Zaozhuang 277000, China
*
Author to whom correspondence should be addressed.
Appl. Sci. 2025, 15(16), 9196; https://doi.org/10.3390/app15169196 (registering DOI)
Submission received: 15 May 2025 / Revised: 9 July 2025 / Accepted: 9 July 2025 / Published: 21 August 2025

Abstract

Coal rupture in coal mining is prone to cause rockburst dynamic hazards. To investigate the effect of joint structure characteristics on the mechanical behavior and the fracture mechanism of coal sample. In this study, uniaxial compression numerical simulation experiments were carried out on coal sample with joint spacings (JSs) of 3 mm and 6 mm and joint angles (JAs) of 0°, 30°, 60°, 90°, respectively, by using the discrete element method (DEM) method. The combined effect of JS and JA on the mechanical properties of coal and its damage mechanism is investigated. The results show that: (1) By increasing JA, the uniaxial compressive strength (UCS) of the specimen first decreased and increased, and the UCS was minimized at θ = 60°. The cracks in the coal sample were transformed from “X”-shaped distribution to “V”-shaped distribution and were dominated by shear cracks. (2) The enlargement of JS contributed to increasing the UCS of the coal sample. At the same time, the crack length remarkably expanded, and the crack distribution broadened. (3) A smaller JA favors the development of tensile cracks and the aggregation of tensile chains towards the end of the specimen. The cracking inclination of the coal sample showed an inverse “N”-type movement with the increase in JA. (4) As the increase in JS benefits the forming of tensile cracks, the extension of cracking inclination of coal sample diminishes. The spread range and accumulation level of tensile chain grows.

1. Introduction

Rockburst is a dynamic hazard that affects the safe mining of coal mines, which is defined as the sudden, sharp, and violent release of elastic deformation energy accumulated in coal and rock masses, causing violent ejection and severe damage to coal and rock masses [1,2,3,4]. In addition, coal is abundant in joints, which have a crucial effect on rockburst, and it is more likely to occur when the surrounding rocks of the roadway have joints in their proximity [5,6,7,8]. The strong rockburst in coal mines leads to severe roadway closure and equipment damage, resulting in physical injuries and heavy property losses. Therefore, it is of great value to investigate the effect of structural characteristics of coal joints on the mechanical behavior and fracture mechanism of coal sample.
In recent years, scholars have conducted many studies on the influence of joint angle on coal or rock specimens. They adopted uniaxial [9], biaxial [10], and triaxial [11] experiments to study the mechanical characteristics and fracture mechanisms of jointed rock masses. Ma et al. [12] used numerical simulation based on energy theory to investigate the damage characteristics of rocks with different joint inclinations under fluid–solid coupling and established a new pre-peak damage constitutive model. Fan et al. [13] conducted a study on the crack extension behavior and fracture characteristics of specimens containing a single nonpenetrating defect by means of uniaxial compression tests and numerical simulations. The crack initiation and extension mechanisms of sandstone specimens were explained from a microscopic perspective. Hu et al. [14] studied the mechanical properties and crack evolution of a bilayer composite rock sample specimen with two parallel cracks by using uniaxial compression tests, and the results suggest that a larger crack angle has a remarkable effect on the crack extension and consolidation. Zhao et al. [15] investigated the crack extension pattern of a rock containing two parallel pre-existing cracks using the Universal Distinct Element Code (UDEC) numerical method and uniaxial compression tests and revealed that the bridge angle influences not only the crack agglomeration pattern but also the peak strength of the specimen. Lin et al. [16] probed the effects of joint angle, ligament angle, and joint location on the crack extension behavior of specimens from a soft–hard composite rock with three parallel joints employing uniaxial compression experiments. Mu et al. [17] analyzed the mechanical and acoustic emission (AE) response characteristics as well as the damage evolution characteristics of multi-jointed sample with different joint angles by uniaxial compression test. A damage model characterized by the accumulation of AE counts was established. Hu et al. [18] explored the size effect of multiple-jointed rock mass by numerical simulation and established a characteristic size function according to multiple-jointed rock mass. The above scholars systematically investigated the effects of joint angles on the mechanical characteristics, damage characteristics, and fracture modes of coal or rock masses from single, twin, triple, and multiple joint specimens, but the influence of joint spacing on the mechanical characteristics and microscopic behaviors of the specimens has been less regarded.
The joint spacing has an important influence on the mechanical characteristics of coal or rock masses. Scholars have investigated the effect of joint spacing on rock mechanical characteristics by means of uniaxial compression [19,20], biaxial compression [10], and triaxial compression [21] experiments, and observed that the peak strength of the rock mass increased with the increase in joint spacing. Hu et al. [22] adopted a numerical simulation method to study the influence of parallel joint spacing on the rock size effect and established a feature size mode based on parallel joint spacing. Huang et al. [23] investigated the influence of joint spacing on the mechanical parameters and damage process of brittle rock-like specimens with multiple non-persistent joints by employing laboratory tests and discrete element method simulations. The above scholars have investigated the effect of joint spacing on the mechanical characteristics of coal or rock bodies by means of laboratory tests, numerical simulations, and a combination of the two, respectively. However, the combined effect of joint spacing and joint angle on coal sample is less studied. In addition, Partical Flow Code (PFC) is widely used in the simulation of microscopic damage and crack evolution in coal/rock masses due to its great advantages of reflecting the fine-scale rupture behavior of coal or rock and being able to simulate the force chain transfer and energy evolution process during the damage process.
Therefore, based on the PFC numerical simulation tool, this study sets up a numerical model of combined effect of JS and JA. The stress–strain, strength, destructive mode, microcrack evolution characteristics, and force chain characteristics of coal sample with different JS and JA are explored. Mechanisms of the effects of JS and JA on damage and crack extension in coal sample from a macroscopic and microscopic point of view were examined, which in turn reveal their combined effects on rockburst.

2. Numerical Modeling and Micro Parameter Assignment

DEM can explain the deformation, damage, and destruction processes of non-homogeneous materials (rock, concrete, and others) from a fine view perspective. It can delicately portray contact connections, force chain transfer, energy evolution, and other advantages, so it has been widely adopted by scholars in various countries [24,25]. Among them, the PFC procedure is extensively adopted in coal mining and slope stability evaluation due to its benefits of reproducing crack extension, particle fragmentation, and revealing macroscopic mechanical response by particle scale behavior.
The size of the numerical model in this study was 100 mm × 50 mm. The particle sizes were uniformly distributed in the range of 0.3 to 0.5 mm. Each complete numerical sample was discretized into 8266 particles with the global damping coefficient set to 0.1. The particle contacts satisfy the parallel-bonded constitutive model. By referring to the PFC contact selection method in the paper by Yang et al. [26], a discrete fracture network was invoked to locate the joints and install the smoothed joint model. The model allows slip deformation parallel to the contact surface, avoids entanglement behavior along the particle surface, and is widely used to simulate the mechanical behavior of structural surfaces in coal masses. Finally, the numerical models of coal sample with JAs of 0°, 30°, 60°, and 90° JSs of 3 mm and 6 mm, respectively, were built, as shown in Figure 1.
The numerical model parameters in this study were validated using literature [27] to finalize the micromechanical parameters in the parallel bonding model, as shown in Table 1.

3. Analysis and Discussion of Results

3.1. Stress–Strain Curves and Key Mechanical Parameters

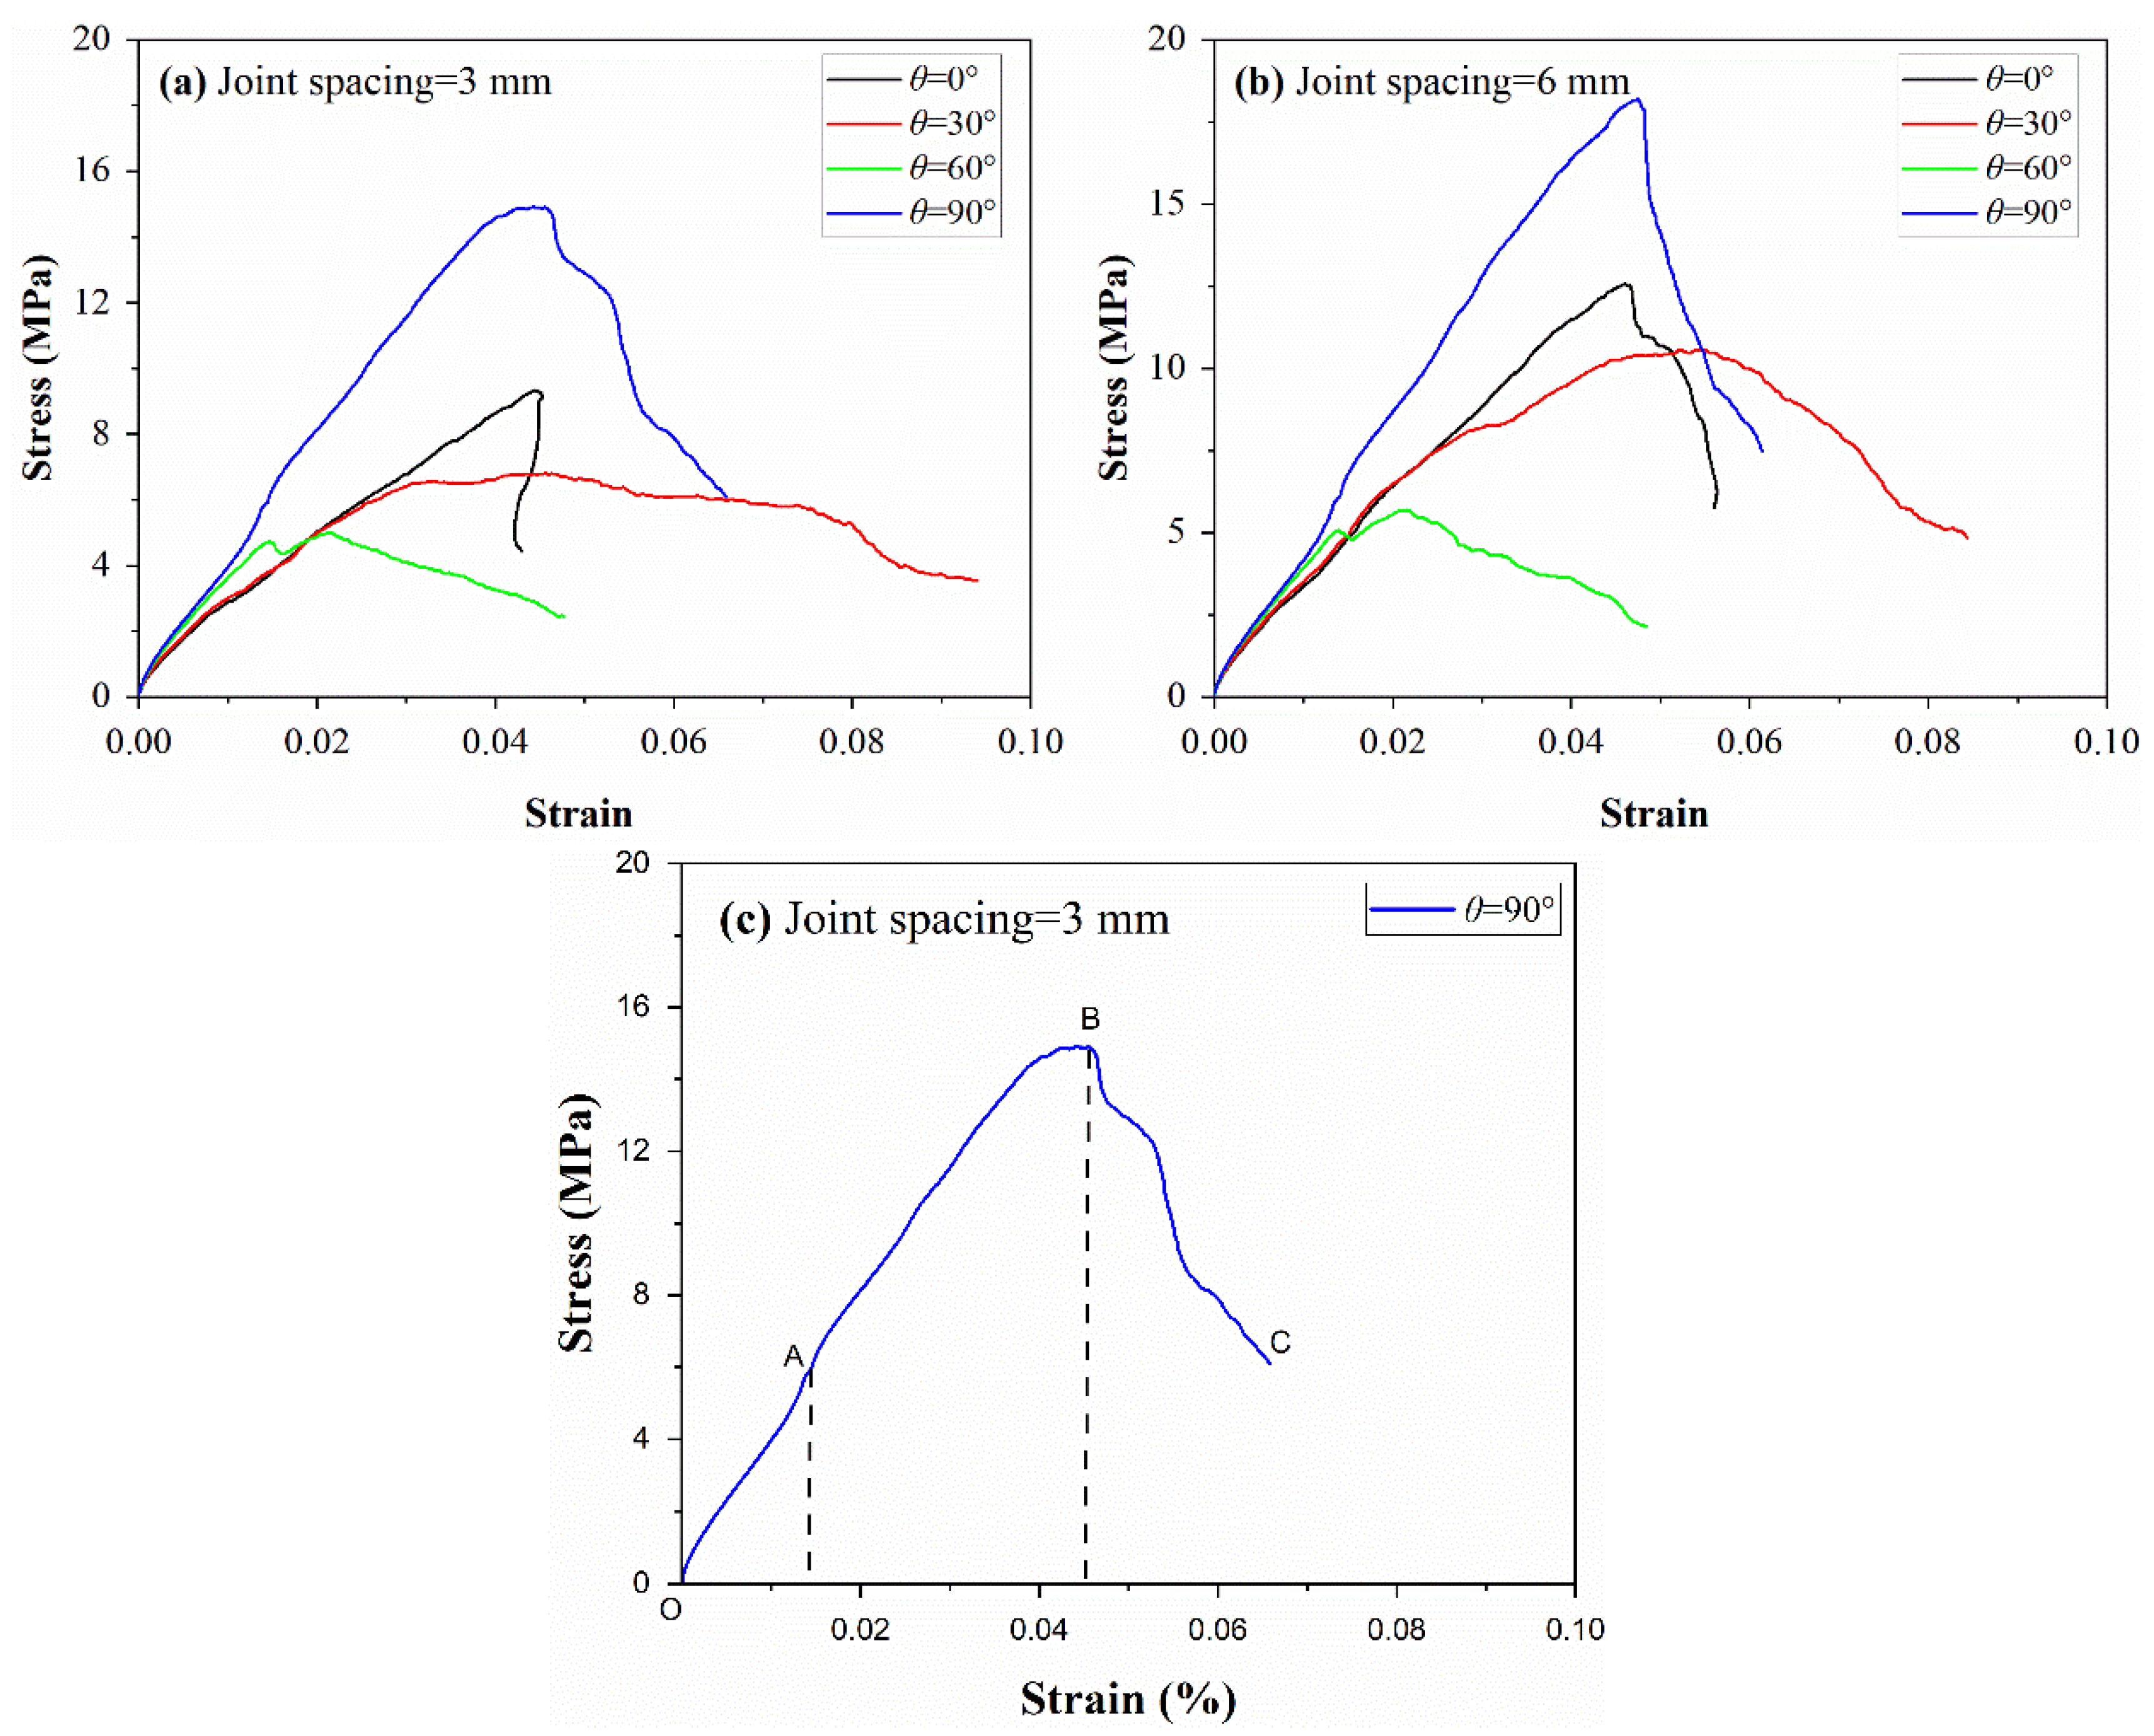
The stress–strain curves of coal sample under different JS and JA are shown in Figure 2. As indicated by the Figure, the curve was separated into three phases (Figure 2c): fissure closure phase (OA), elastic compaction phase (AB), and damage destruction phase (BC).
Fissure closure phase: under the action of longitudinal loading, the micro-fissures and joints within the coal sample were gradually compacted, and different JSs and JAs in the curves showed the same performance, suggesting that the joints have less influence on the coal sample in this phase.
Elastic compaction phase: the stress gradually increases with increasing strain, approximately linearly, from Figure 2a, there were significant differences in this phase for different JA and JS.
Damage destruction phase: When the strain achieved the peak strain, the coal sample reached the peak strength, the stress–strain curve decreased rapidly, and the specimen showed damage followed by brittle damage, and the plasticity of the curve in Figure 2b increased significantly compared with Figure 2a.
Comparison of different JAs reveal that the destructive brittleness of the coal sample was similar when θ = 0° and 90°, which was much larger than that of the sample with θ = 30° and 60°, and the post-peak plasticity of the sample with θ = 30° and 60° was remarkably enhanced. The curve in Figure 2b had the same trend. The results show that there are significant differences in the damage pattern and damage degree of coal sample under different JAs. The reason for this may be that the rupture surface of coal sample was the same as JA, which induced the specimens to incur shear damage. This result was the same as the experimental results of Zhao et al. [28]. Comparison of different JSs revealed a notable increase in plasticity after the stress–strain curve was disrupted when the JS was increased from 3 mm to 6 mm.
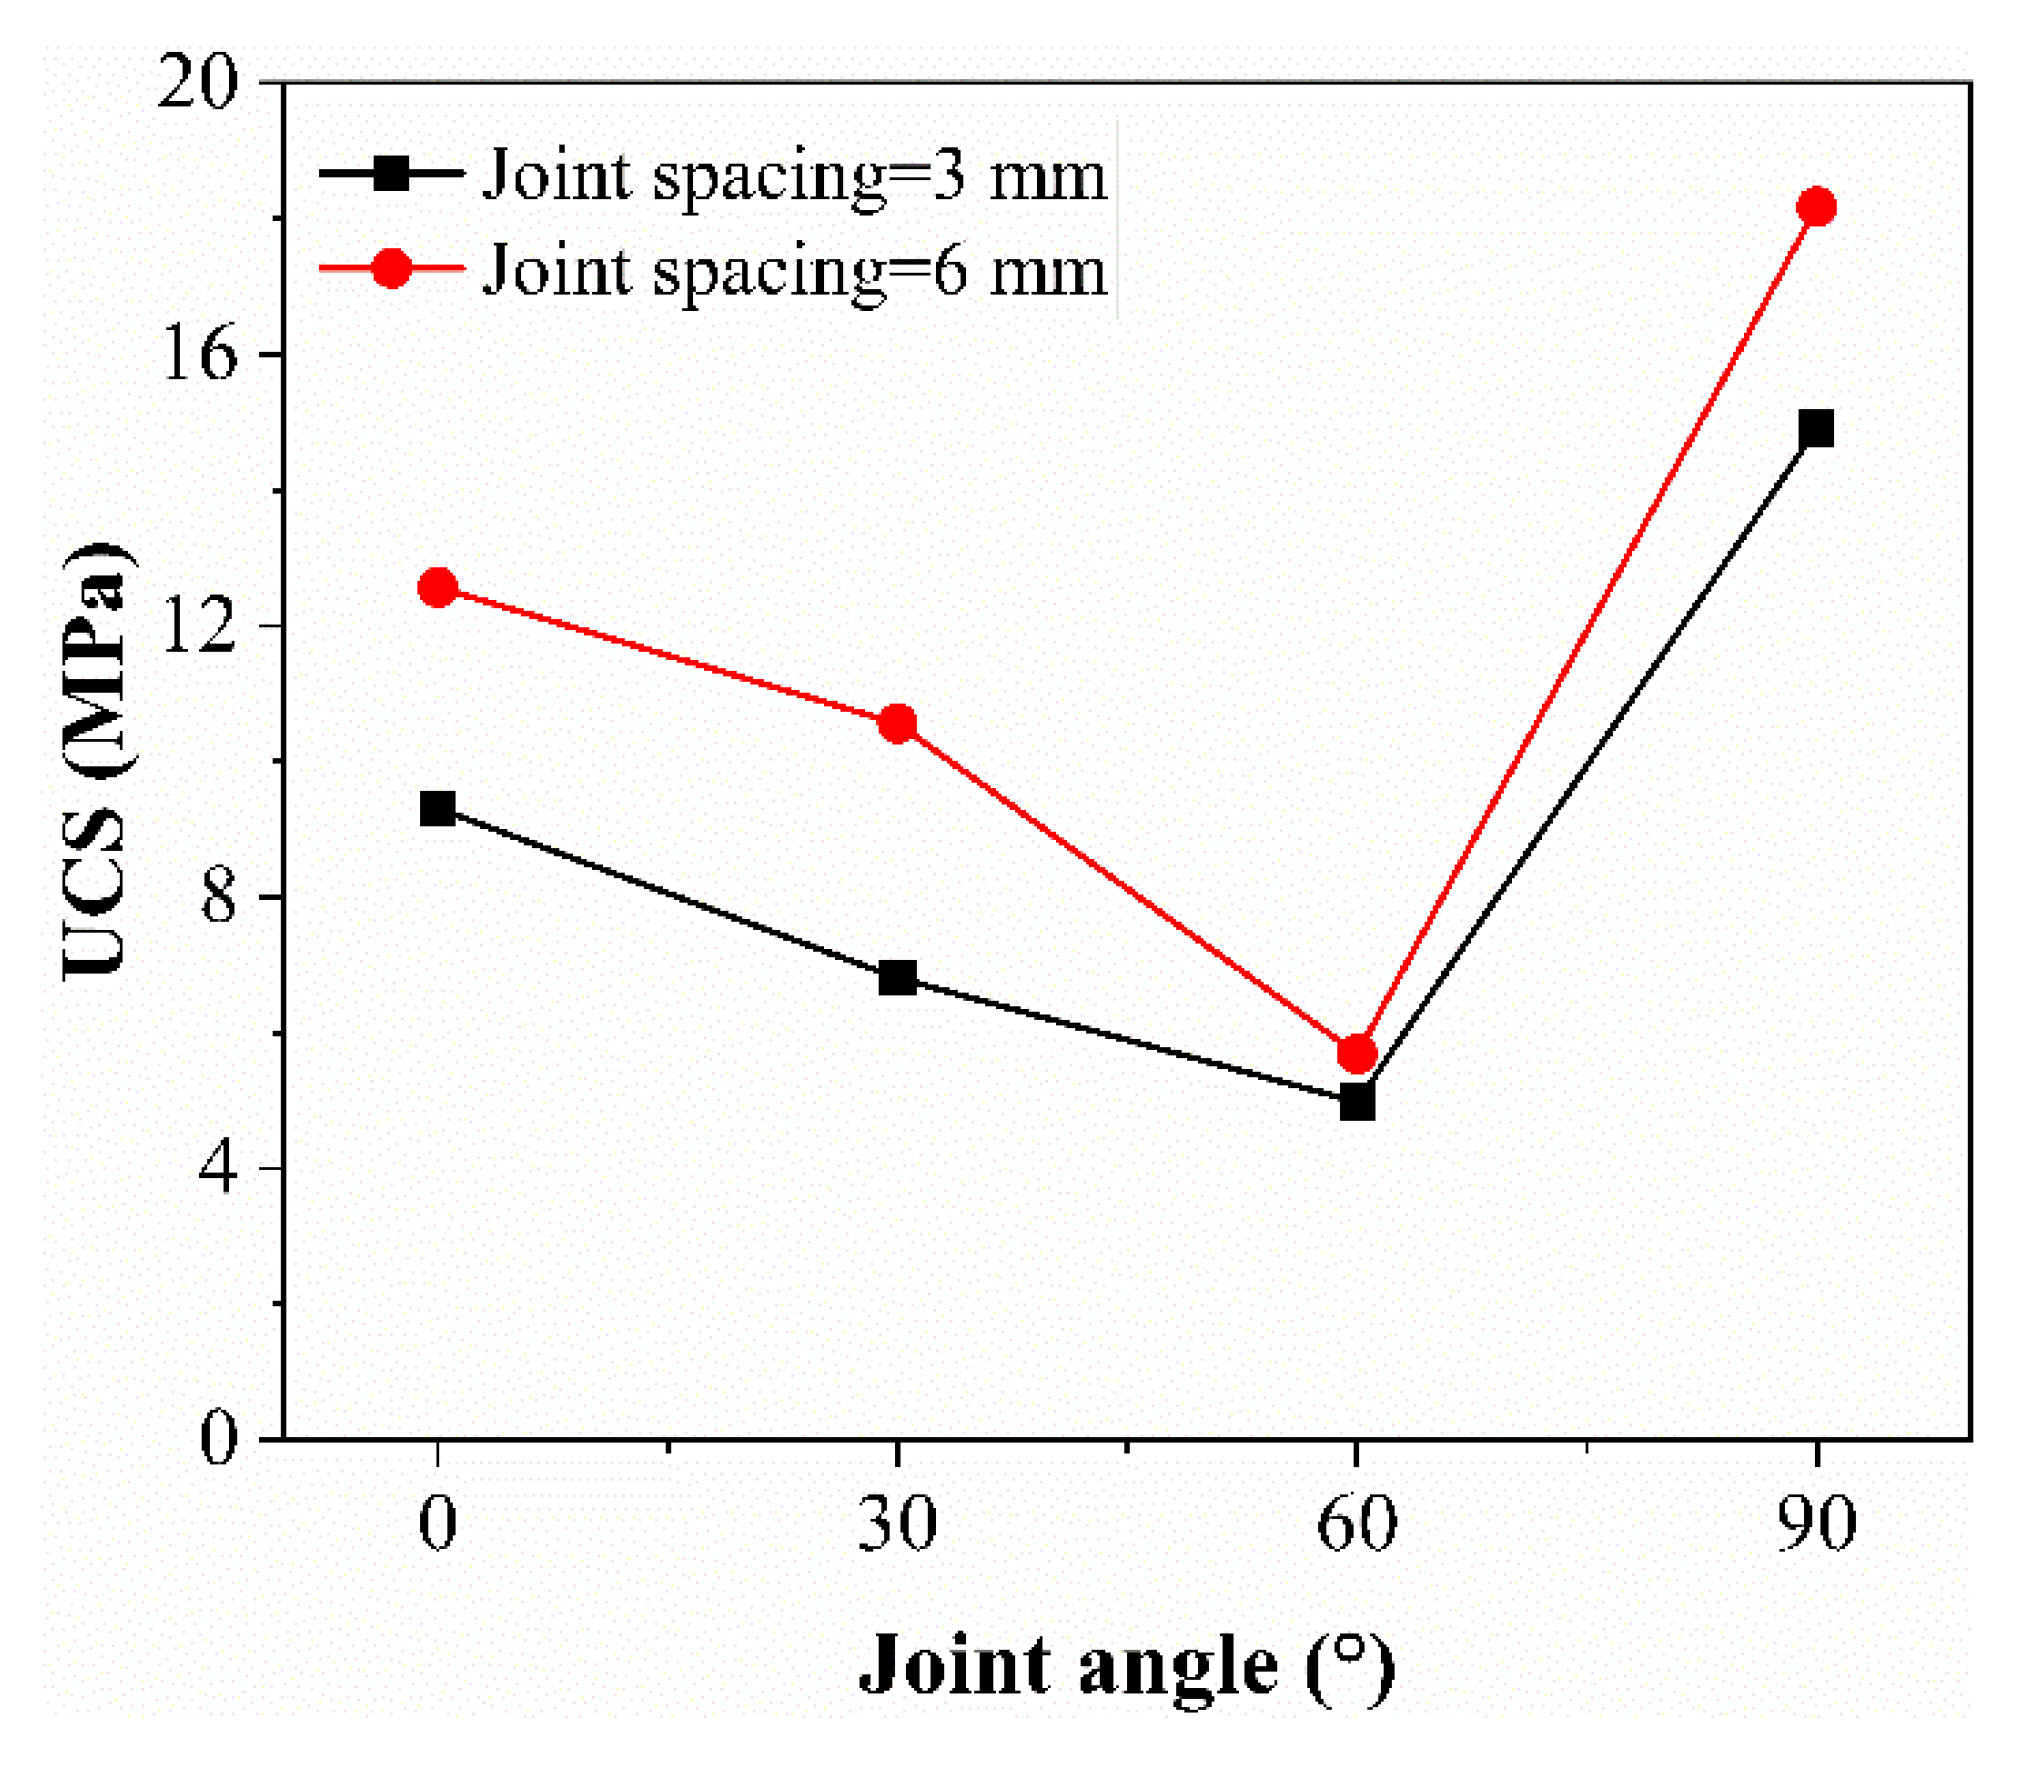
Taking the highest peak point of the stress–strain curve as the peak strength of the coal sample, the evolution curves of UCS for different JSs and JAs coal sample were plotted, respectively, as shown in Figure 3.
From Figure 3, it could be noted that when JS = 3 mm, as JA increased from 0° to 90°, the UCS of the coal sample decreased initially from 9.31 MPa to 4.98 MPa and then increased to 14.91 MPa and achieved a minimum value of 4.98 MPa when JA was 60°. When JS = 6 mm, the curve had the same pattern, and the curve acquired a minimum value of 5.69 MPa at JA of 60°. This result was the same as that of Zhou et al. [29]. The results demonstrated that the UCS of the coal sample displayed a “V”-shaped changed with the increase in JA. Comparing the curves of JS = 6 mm and JS = 3 mm, it was observed that the latter was smaller than the former. The findings suggest that the increase in JS was favorable to the increase in UCS of the sample. In short, JS enhanced the strength of sample.
Therefore, when the JS of the coal sample was the same, the UCS decreased and then increased with the increase in JA in a “V” shape. When JA was the same, JS helped to enhance the UCS of coal sample.

3.2. Failure Mode

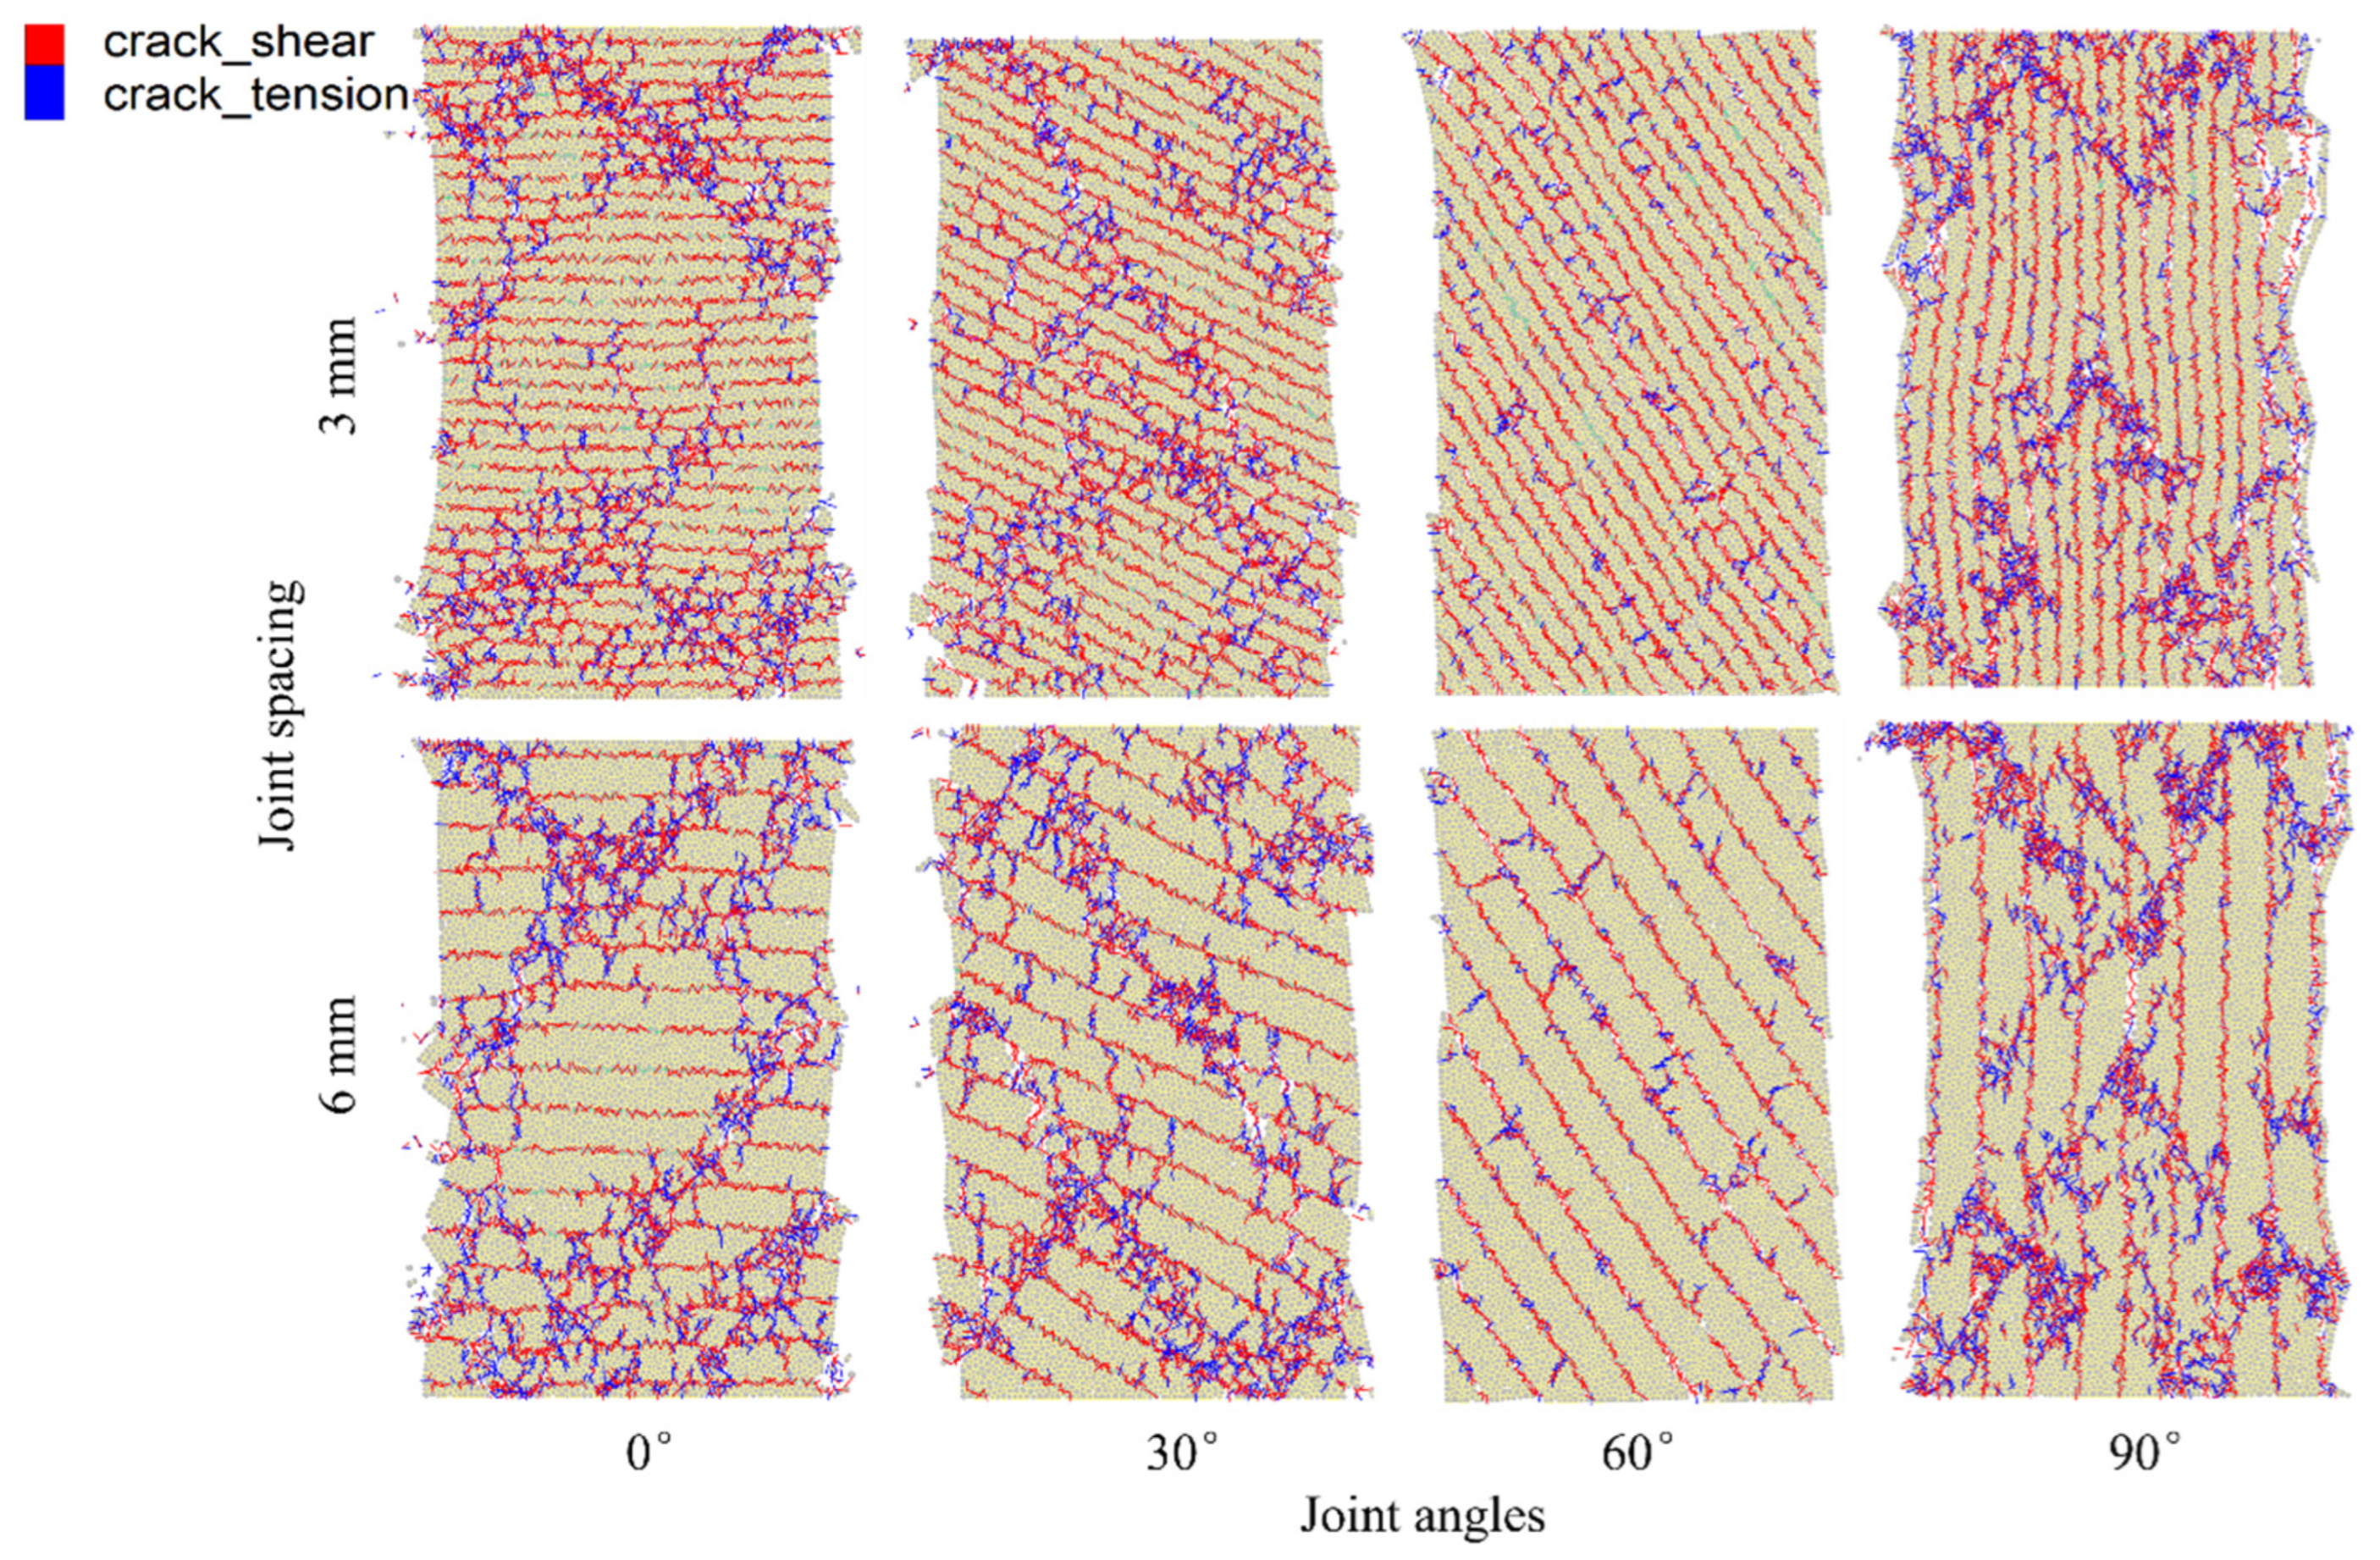
To further analyze the effects of JS and JA on the damage pattern of coal sample from a microscopic point of view, the PFC 7.0 software monitoring command was employed to plot the distribution of the damage pattern of coal sample, as shown in Figure 4 (in which red represents shear cracks, and blue represents tensile cracks).
In Figure 4, multiple tensile and shear cracks were generated in the coal sample when JS = 3 mm, but the distribution of tensile and shear cracks varied among coal samples with different JAs. With the increase in JA from 0° to 30°, the cracks in the sample were converted from an “X”-type distribution at the two ends to the distribution in the direction of central joints, and the crack types were converted from tensile-dominated to shear-dominated. When JA increased from 30° to 60°, the cracks were mainly of shear-type and extended along the joint direction, and the tensile cracks were sporadically distributed in the model. As JA increased to 90°, the number of tensile and shear cracks reached the maximum and is distributed in a “V” shape at both ends of the model, at which time the model was damaged to a greater extent. The results show that different JAs have a significant influence on the model damage pattern, not only on the number of tensile shear cracks but also on the spectral distribution of the cracks.
When JS = 6 mm, the distribution of tensile and shear cracks generated in coal sample was more concentrated and the crack length was longer than that of JS = 3 mm. However, the distribution of tensile and shear cracks in coal sample with different JA also differed. With the increase in JA from 0° to 30°, the cracks in the sample were converted from “X”-type distribution at the two ends to the distribution in the direction of central joints, and the crack types were dominated by shear. However, compared with JS = 3 mm, at JA = 30°, cracks appeared in the direction of the joint normal with reversed joint cracking, which might be related to JS. When JA increased from 30° to 60°, the specimen cracks were mainly shearing type and extended along the joint direction, tensile cracks were sporadically distributed in the model, but the crack length increased significantly compared to JS = 3 mm. As JA increased from 60° to 90°, the number of tensile and shear cracks increased to a maximum and was distributed in a “V” shape at both ends of the model, at which point the model was damaged to a greater extent, but the range of cracks in the “V” shape was significantly increased in comparison with that of JS = 3 mm. The results show that the number of tensile shear cracks and the spatial distribution of cracks in the model damage pattern were not only related to JS but also to JA.
In summary, under uniaxial compression conditions, the crack patterns and crack distributions of coal samples with different JCs and JAs were significantly different. With the increase in JA, the cracks of coal sample were transformed from “X”-type distribution to “V”-type distribution, and shear cracks dominated. With the increase in JS, the crack length increased significantly, and the crack distribution range expanded.

3.3. Microcrack Characteristics

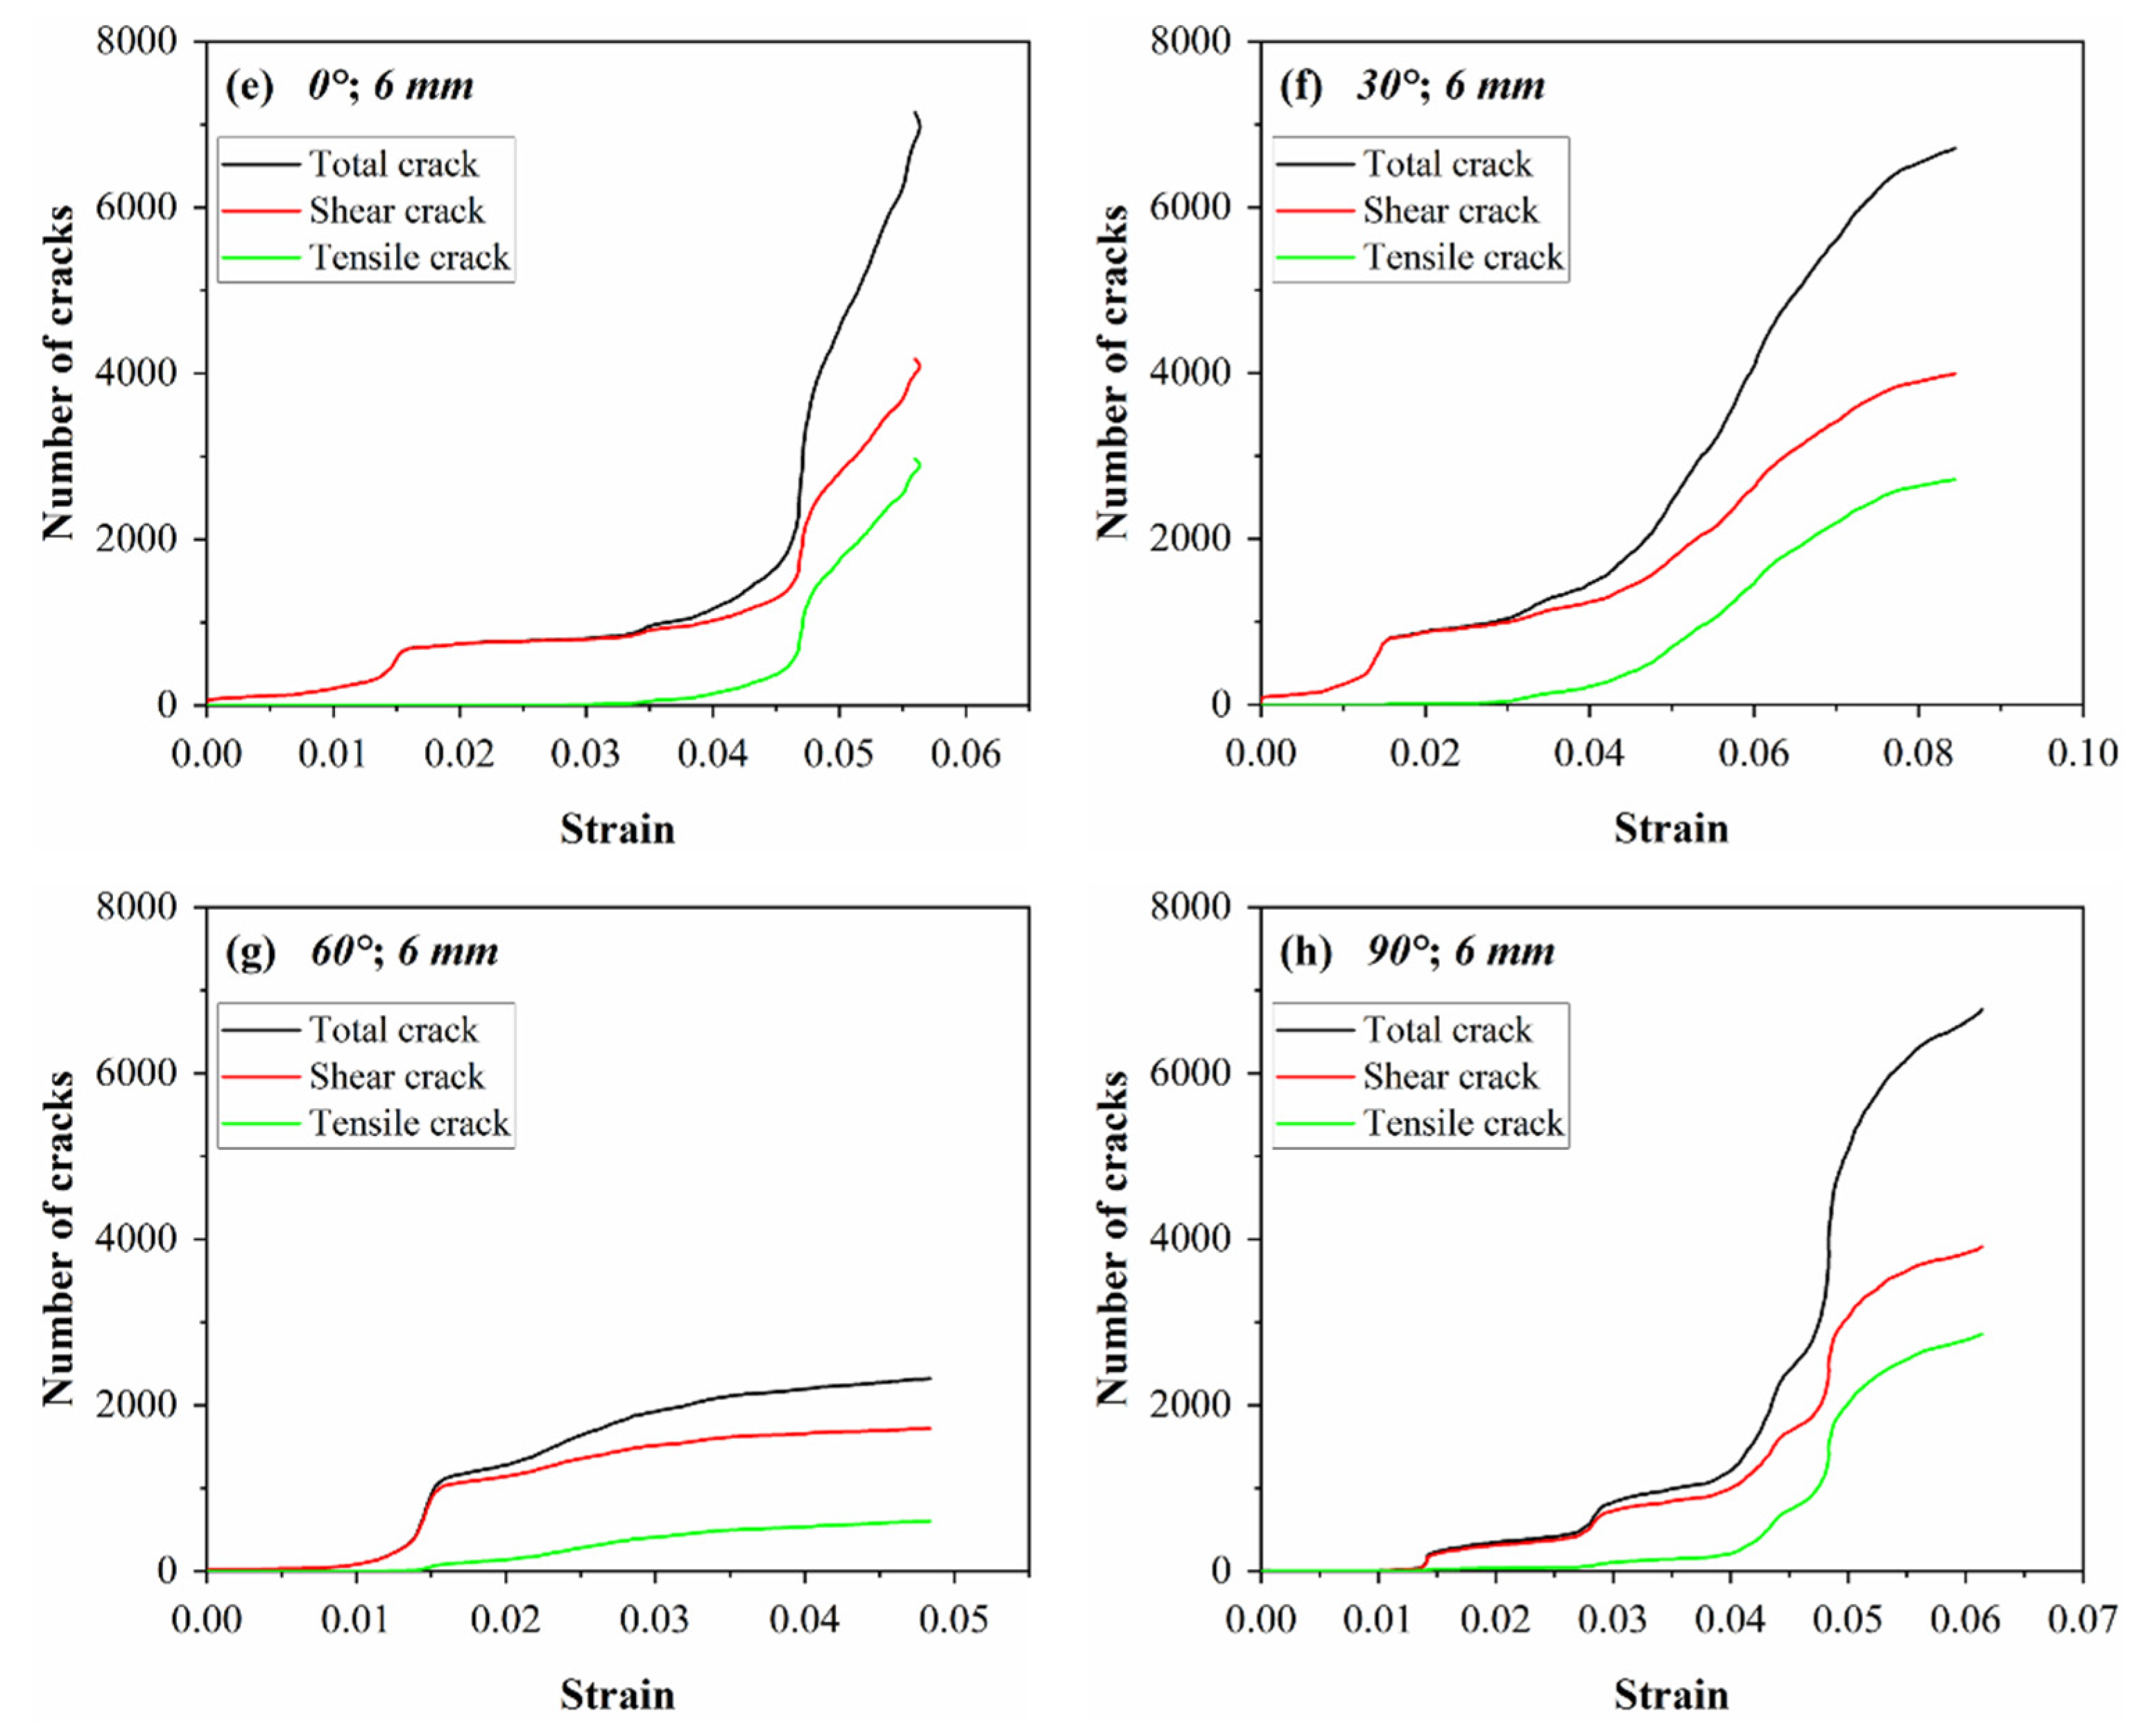
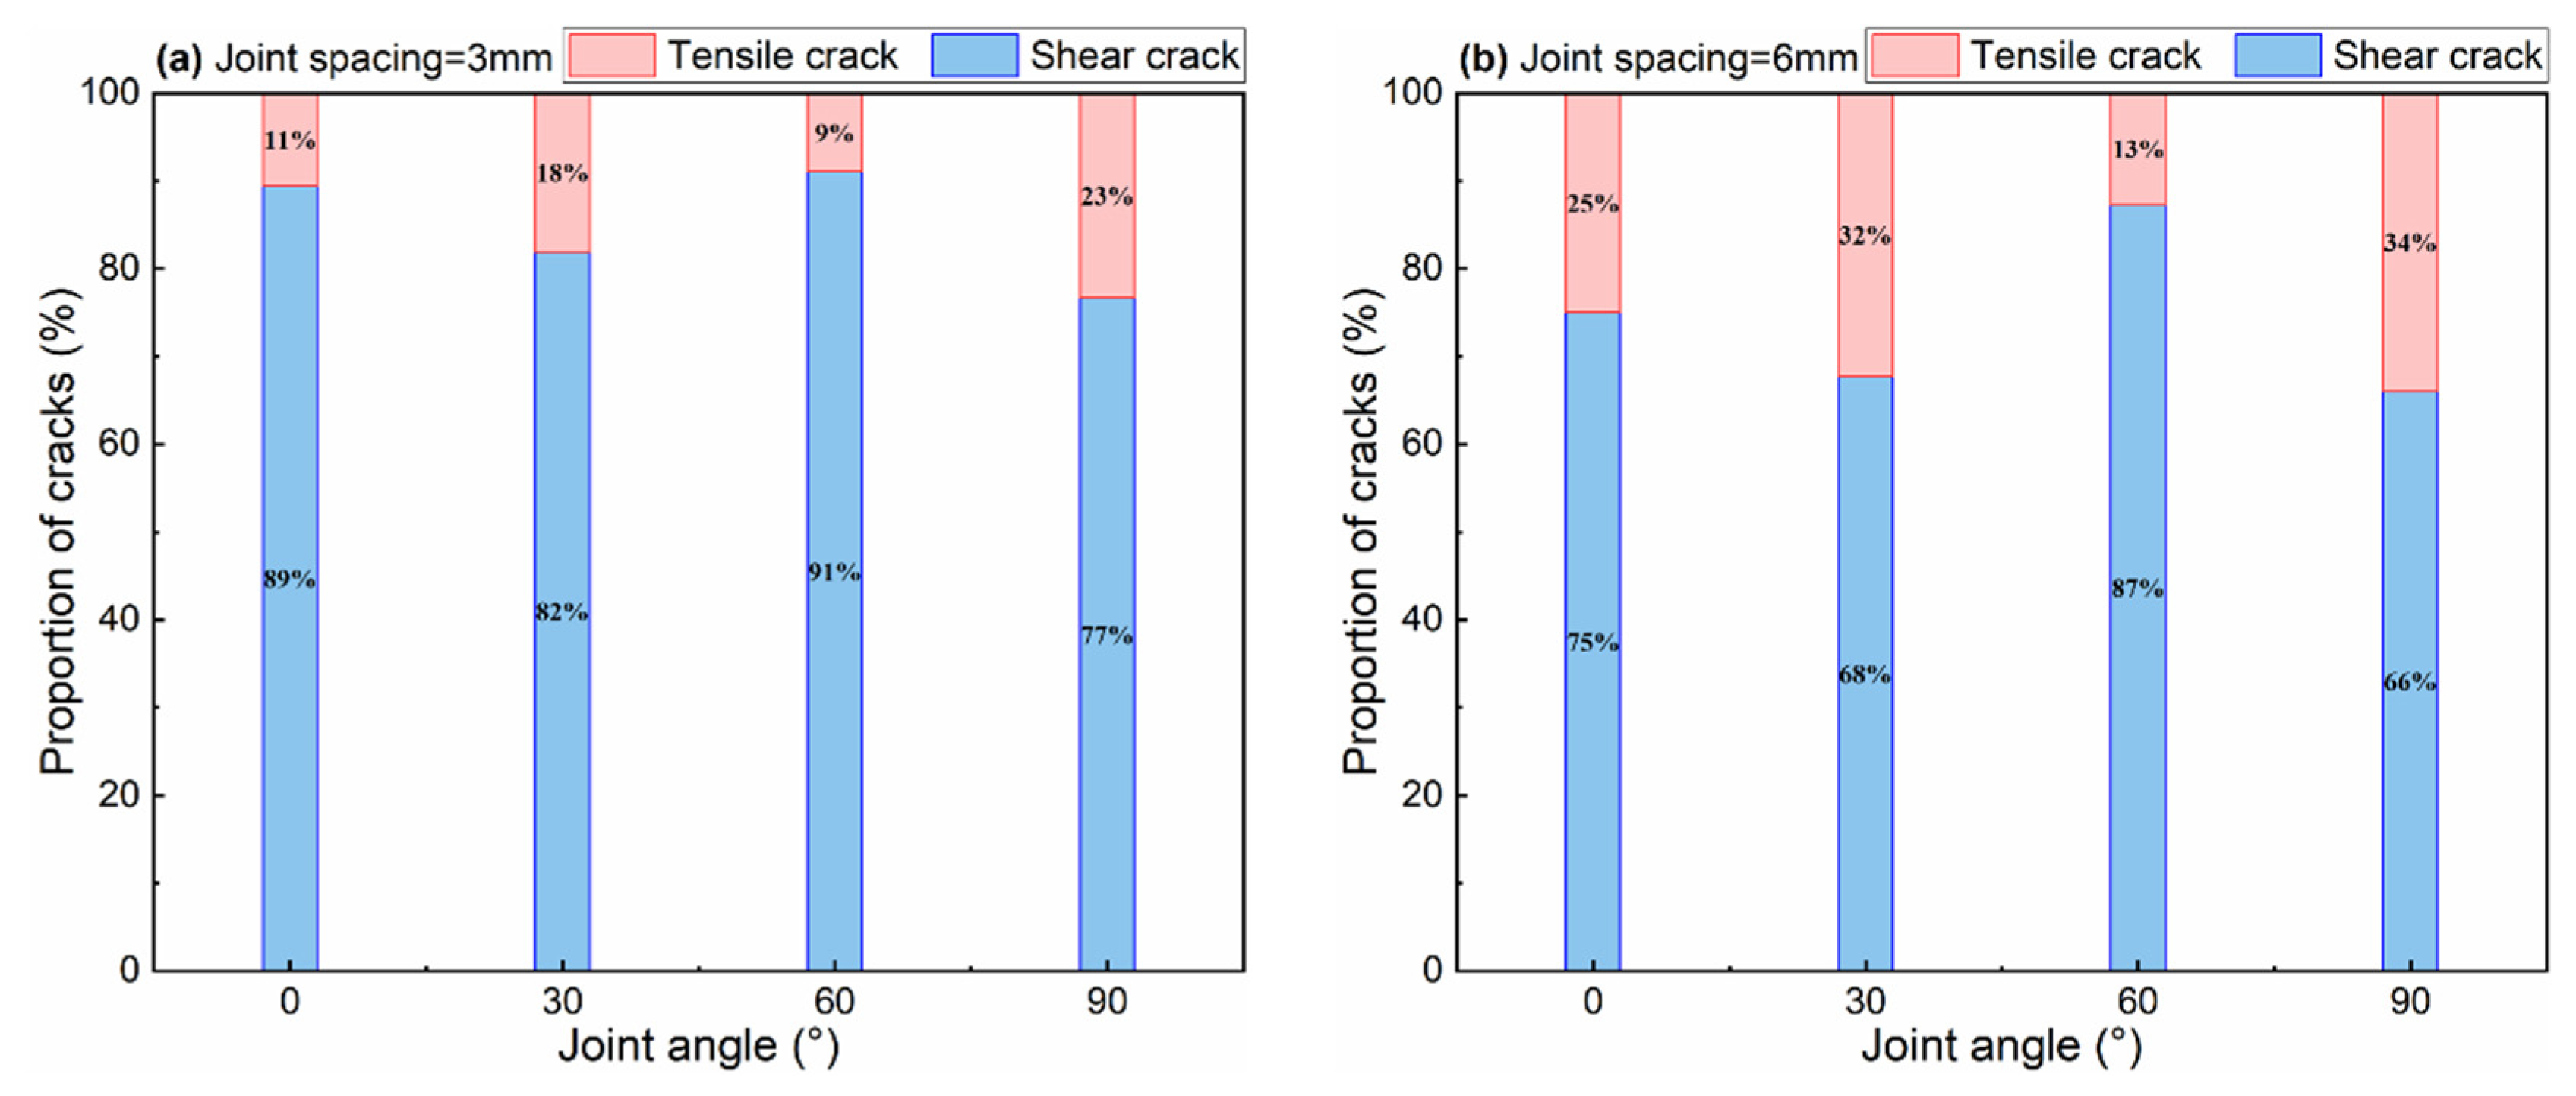
To quantitatively describe the varying characteristics of cracks in different JSs and JAs coal sample during the loading process, the different kinds of cracks with strain evolution pattern were plotted, as shown in Figure 5. The percentage of tensile cracks and shear cracks at peak strength for different JSs and JAs coal sample were also summarized, as shown in Figure 6.
As can be seen from Figure 5, the evolution of the total, shear, and tensile cracks in coal sample with increasing strain could be divided into three stages as follows: stationary phase, steady crack growth phase, and rapid crack growth phase (black, red, and green curves represent total, shear, and tensile cracks, respectively).
From Figure 5a, as the axial strain increases, the coal sample appeared to have only a very small number of shear cracks and no tensile cracks. This might be related to the existence of joints. When the axial strain increased to 0.015, the shear crack curve turned into an inflection point and the count increased further. When the axial strain increased to 0.04, tensile cracks emerged in the coal sample for the first time. With the further increase in axial strain, the amount of shear and tensile cracks increased gradually. Currently, the proportion of shear cracks was 89%, and the proportion of tensile cracks was 11%, and the damage of coal sample was dominated mainly by shear. The results revealed that the coal sample had reached macroscopic failure when the peak strain was achieved, leading to an increasing amount of cracks and predominantly shear damage. As JA increased from 0° to 60°, the strain at which tensile cracks first appeared to decrease from 0.04 to 0.015 (a decrease of 62.5%). When JA increased from 60° to 90°, the strain at the first appearance of tensile cracks increased from 0.015 to 0.022 (an increase in 46.7%). The percentage of shear cracks was obviously higher than the percentage of tensile cracks, and the maximum percentage of shear cracks was 91% at JA = 60°. It further illustrates that JA influenced the distribution and percentage of shear and tensile cracks in coal samples.
As shown in Figure 5e, shear cracks steadily increased as loading proceeded, appeared as an inflection point at 0.015, while shear cracks further increased. This could mean that the crack extension of coal pattern at this stage is dominated by shear cracks. When the strain was 0.035, a tensile crack appeared. With the further increase in axial strain, the number of shear and tensile cracks gradually increased. The shear and tensile cracks reached the maximum value when the peak strain was reached. Currently, the percentage of shear cracks was 75%, the percentage of tensile cracks was 1/3 of shear cracks, and the damage was dominated by shear. The evolution of tensile and shear cracks with different JA was the same as that of JC = 3 mm, but the percentage of shear cracks was lower than that of JC = 3 mm. The results indicated that the increase in JC was favorable for the generation of tensile cracks.
In conclusion, when JS was the same, the strain at the first occurrence of tensile crack decreased from 0.04 to 0.015 as JA increased from 0° to 60°. The strain at the first emergence of tensile crack increased from 0.015 to 0.022 as JA increased from 60° to 90°. It was demonstrated that when JA was at 0–60°, the tensile crack was assisted to form. When JA was 60–90°, it was unfavorable for tensile crack development. When JA was the same, the increase in JS contributed to tensile crack generation.
To further clarify the internal crack distribution characteristics of coal sample with different JSs and JAs, PFC post-processing program was applied to derive the distribution charges of cracks between 0 and 180°. It was presented with a rosette diagram of the microcrack trend of the coal sample after damage, as shown in Figure 7.
From Figure 7, when JS = 3 mm and JA = 0°, the crack tendency was mainly distributed in 30–130°. With the gradual increase in JA from 0° to 90°, the microcrack tendency was mainly distributed in the range of 30–150°, 30–130°, and 30–150°. The crack tendency transformed from centralized distribution to decentralized aggregation and then to centralized distribution. There were differences in the distribution range of microcracks in coal samples with different JA. This showed that JA altered the crack fracture mode, which in consequence caused distribution differences in crack positions.
When JS = 6 mm and JA = 0°, the crack tendency was mainly spread in the range of 38–125°. With the gradual increment of JA from 0° to 90°, the microcrack tendency was concentrated in 50–110°, 30–130°, and 50–110°. Comparing JS = 3 mm and JS = 6 mm coal sample, it was noted that the distribution range of crack tendency was larger in the former. It indicated that JS = 3 mm had the highest micro-cracker number and was the earliest to reach yielding under axial loading.
Thus, the cracking tendency of coal sample decreased with the increase in JA, then increased and then decreased again, and the cracking tendency shifted from centralized distribution to decentralized aggregation and then to centralized distribution. With the increase in JS, the range of cracking propensity of coal samples was smaller. When JA was 30° and 90°, the microcrack damage trend was strongly concentrated in the range of 50–110°. The results suggested that the trend of microcrack concentration in coal sample was not only influenced by JA, but also by JS, i.e., the trend of cracks was influenced by both.

3.4. Force Chain Characteristics

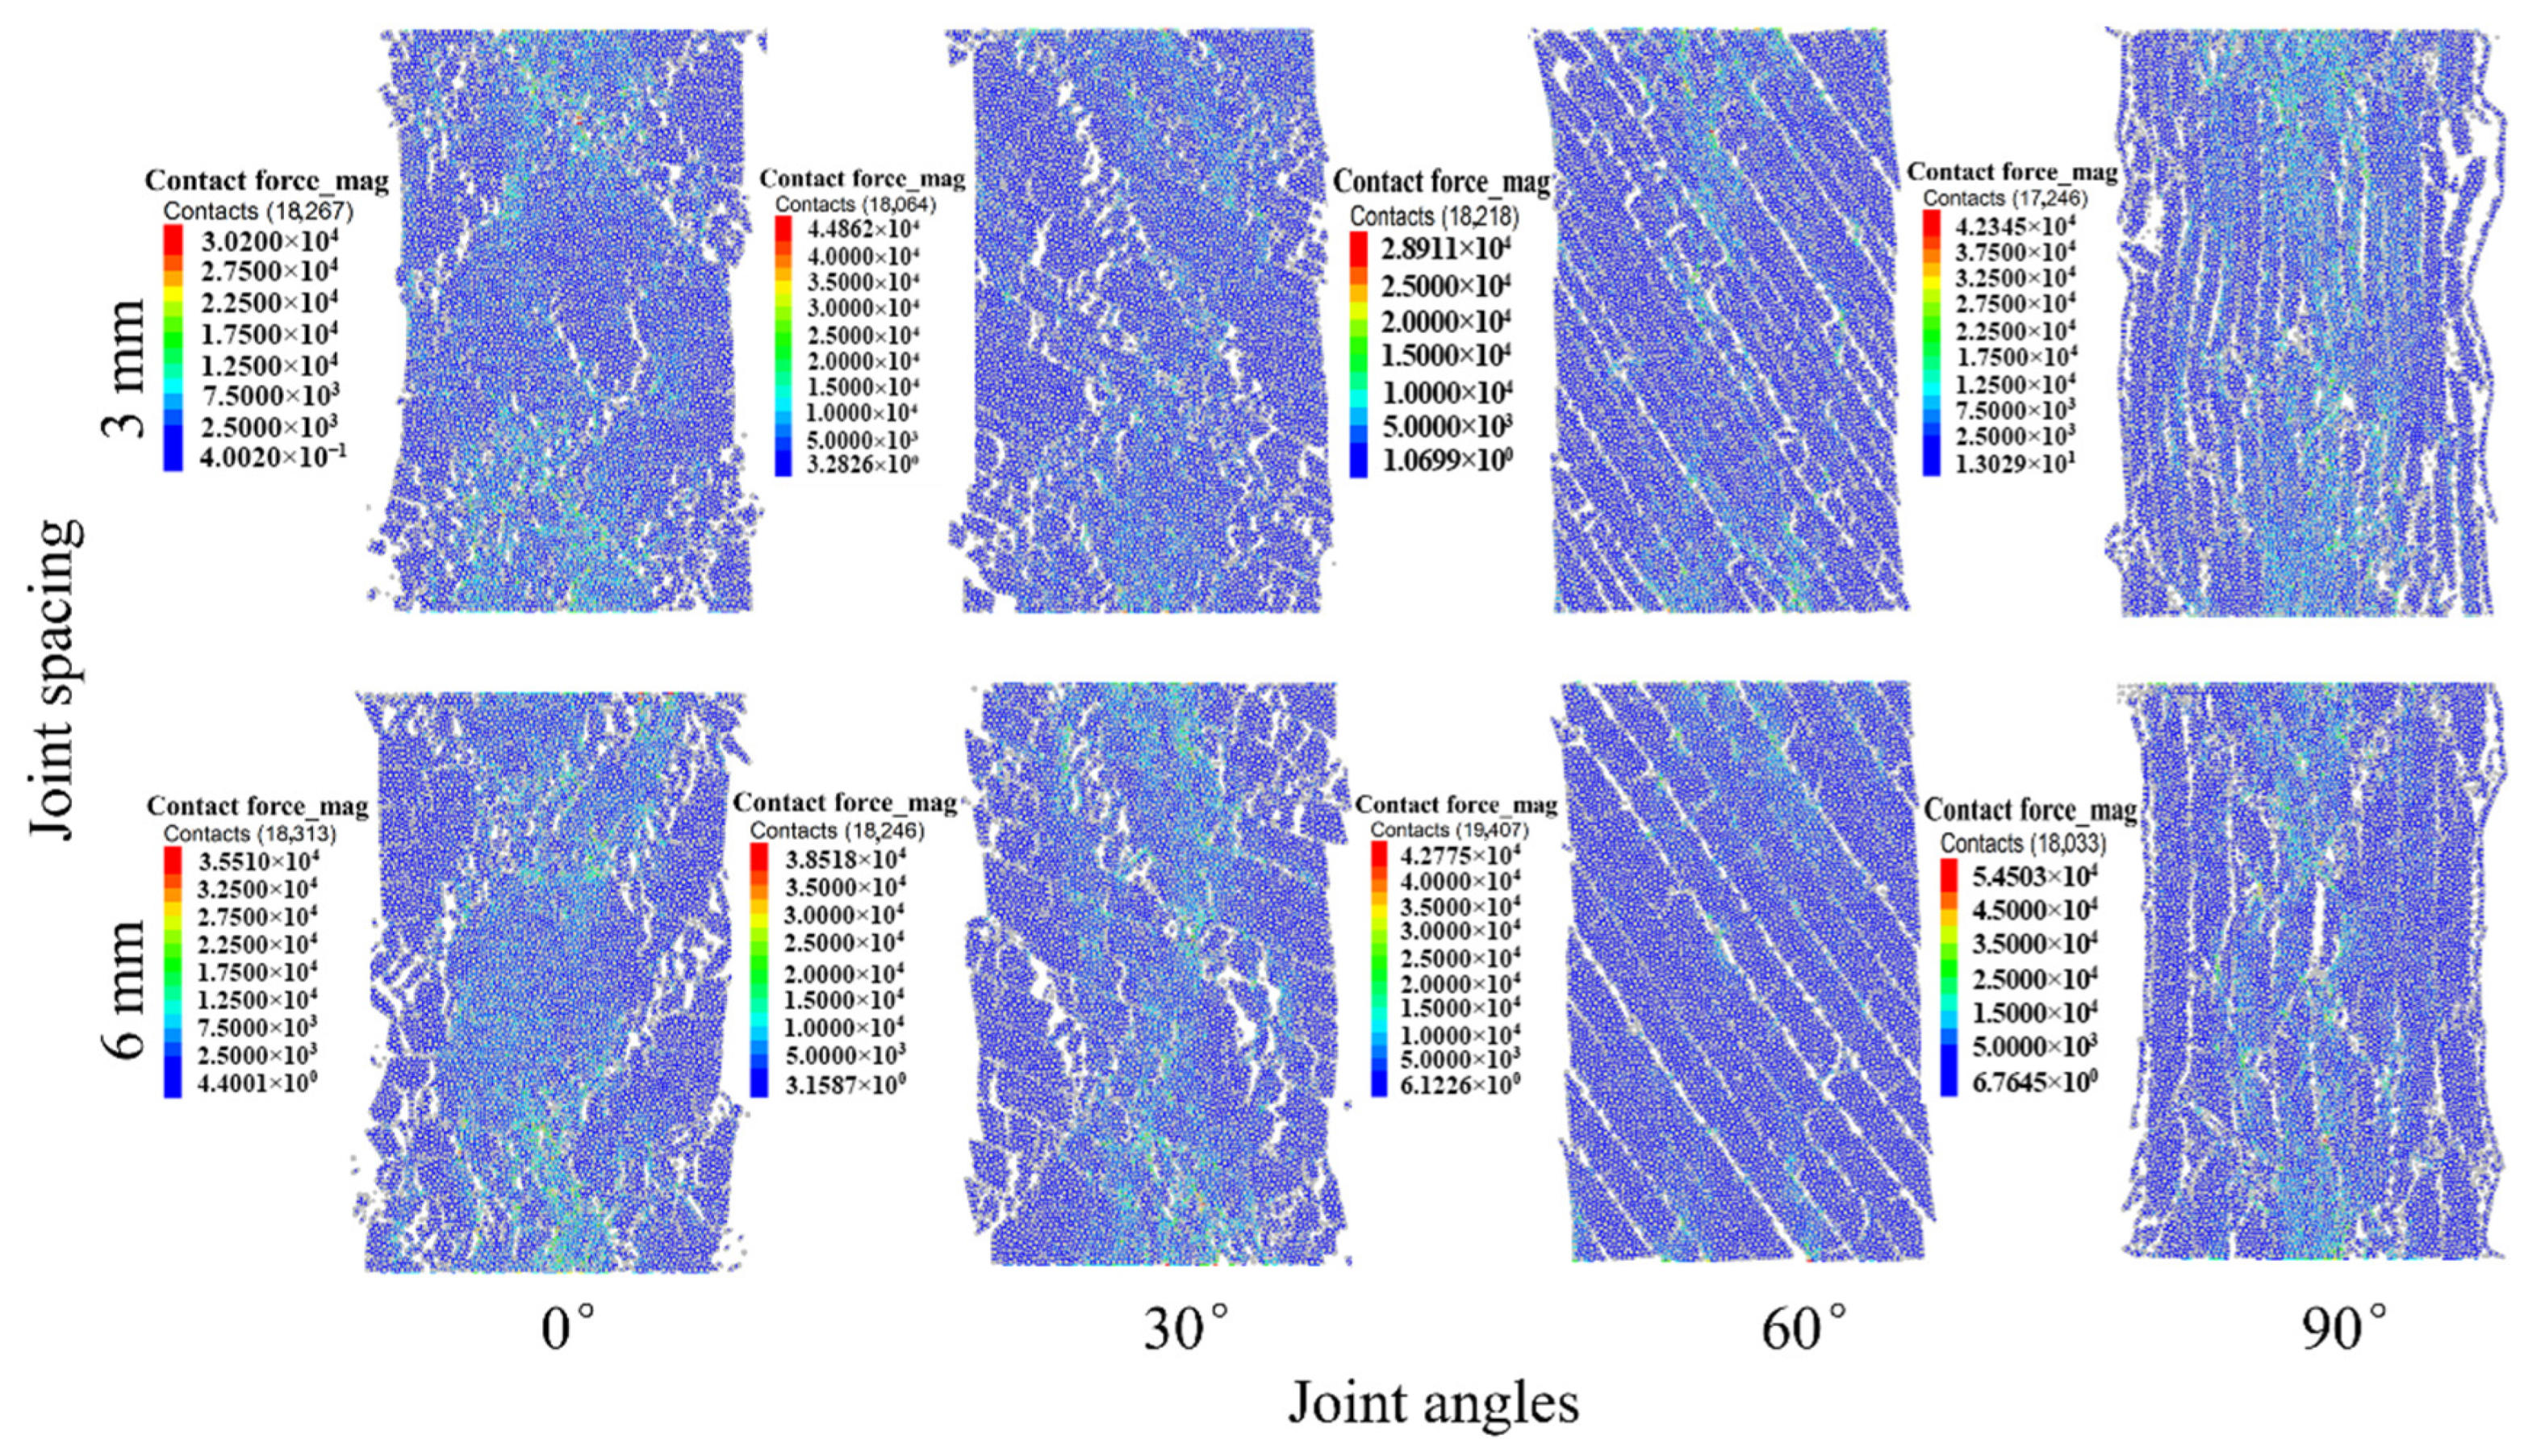
After the loose particles are pre-compressed, the inter-fracture porosity gradually decreases, and when the inter-particle force reaches peak strength, we consider that the particles reach balance. After the model is loaded by axial force, it leads to contact between the particles, which in turn leads to the generation of force chains in the model [30,31]. The PFC software can reproduce the force chain network transfer process between particles when the model is exposed to external loads. When the force chain network is aggregated in the model, the macroscopic cracking of coal sample is developed [32]. Therefore, it is of special meaning to emphasize the spatial distribution characteristics of force chain in coal sample in uncovering the evolution mechanism of macroscopic cracks in specimens. Figure 8 shows the spatial distribution feature of the contact force chain of coal sample under different JS and JA, respectively (where red is compressive stress and blue is tensile stress).
Figure 8 shows that the force chain distribution of coal sample under different JSs and JAs was dominated by compressive stress and the tensile stress was smaller, and they were very different from each other. The internal fracture zone of the model was mainly situated around compressive stress concentration, and the amount of tensile stress concentration was lower. As an example, JA = 0° and JS = 3 mm were used to analyze the evolution law of the force chain in the model. When the specimen achieved the peak stress, many compressive forces chains along the fracture surface occurred inside the model. The tensile force chains were mainly distributed near the joint surface and less distributed on the fracture surface. As JA increased sequentially from 0° to 60°, the density of compressive force chains inside the specimen further increased and aggregated toward the end, and the density of tensile force chains also gradually increased and aggregated along the joint surface. The largest degree of aggregation was recorded at 60°. This might be related to the fact that the fracture surface was close to 60°. When JA increased from 60° to 90°, the distribution position of the tensile force chain was shifted from the center to the left and right sides and the distribution range of the tensile force chain decreased. The above findings revealed that JA in the range of 0° to 60° was favorable for the increase in tensile force chain, JA in the range of 60° to 90° was unfavorable for the increase in tensile force chain, and the increase in JA could change the aggregation position of force chain.
The influence of JS on the force chain distribution was emphasized by taking JA = 0° as an example. Comparative analysis of JS = 3 mm and JS = 6 mm revealed that with the increase in JS, the range of tensile force chain distribution increases and the degree of force chain aggregation increased, and the degree of destruction of the specimen increased after reaching peak stress. The above-mentioned findings suggest that the degree of aggregation of tensile force chains and their locations were not only affected by JA but also by JS, i.e., they were affected by the combined effect of JA and JS.
Therefore, when 0° ≤ JA ≤ 60°, the tensile force chain inside the specimen increased and its density aggregated towards the end. When 60° ≤ JA ≤ 90°, the tensile force chain inside the specimen decreased and its distribution location shifted from the center to the left and right sides. As JS increased, the distribution range of tensile force chains increased, and the degree of force chain aggregation increased.
The degree of aggregation of force chain location distribution mirrored the microscopic crack evolution process, which lead to various macroscopic damage modes of coal sample. However, the force chain size could reveal the damage degree of coal sample under external loading [33]. Therefore, it was of major significance to recognize the macroscopic fracture mechanism of coal sample induced by the combined effect of JS and JA by the mechanism of force chain size evaluation of coal sample from a microscopic viewpoint. Figure 9 showed the characteristics of the spatial distribution of force chain sizes of coal sample under different JS and JA, respectively (where red represents the strong force chains produced, blue represents the weak force chains, and gray represents the spherical particles).
Figure 9 shows that the force chain size distribution of the coal sample continuously transferred as the external load was imposed. When the specimen reached the peak stress, the force chain size distribution tended to stabilize. To analyze the effect of JA on the force chain size and its distribution, JA = 0° and JS = 3 mm were considered as examples. The size distribution of the force chain ranged from 7.5 × 10³–2.25 × 10⁴ N, mainly distributed in the upper middle and lower middle, and the force chain was distributed in the middle of the upper “X”-type fracture surface. With the increase in JA from 0° to 60°, the size of force chain gradually concentrated to 2.0 × 10⁴–1.0 × 10⁴ N, and the size increased significantly. The distribution of the force chain gradually moved from the upper middle and lower middle to the middle and formed the upper and lower penetration. When JA increased from 60° to 90°, the size of the force chain was concentrated to 2.75 × 10⁴–1.75 × 10⁴ N, and the size increased further. The force chain distribution was further aggregated toward the middle and through the top and bottom, but the density of aggregation toward the middle increased significantly. The results showed that JA could significantly change the force chain size and its distribution characteristics.
When JA = 0°, the maximum value of the force chain of coal sample increased from 3.02 × 10⁴ N to 3.55 × 10⁴ N with the increase in JS from 3 mm to 6 mm. Distribution of the force chain size was mainly moved from the upper middle and the lower middle to the two ends, and the degree of aggregation increased. The force chain size and its distribution characteristics of different JA coal samples have the same law. The findings showed that JS could increase the size of force chains and the degree of aggregation of force chains in the specimens.

4. Conclusions and Discussions

In this study, the influence of the combined effect of JS and JA on the mechanical properties and rupture mechanism of coal sample was investigated by adopting the DEM method. By analyzing the mechanical characteristics and crack evolution law of coal sample, the conclusions are summarized as follows:
(1)
Under uniaxial compression, the stress–strain curves of the coal sample were divided into three phases, and the increase in JS was beneficial to improve the plasticity of the coal sample. The post-peak plasticity of the sample at JA = 30° and 60° was significantly larger than that of the sample at JA = 0° and 90°. When JS = 3 mm, the UCS decreased and then increased with the increase in JA in a “V”-shape. When JA = 60°, the minimum peak stress is 4.98 MPa. JS = 6 mm has the same law. When JA is the same, JS contributes to the enhancement of UCS in coal sample;
(2)
There are remarkable differences in the rupture modes and crack distributions of coal samples with different JCs and JAs at uniaxial compression conditions. With the increase in JA, the cracks of coal samples transform from “X”-type distribution to “V”-type division, which is dominated by shear cracks. When JA increased from 60° to 90°, the amount of tensile and shear cracks increased to the maximum. With the increase in JC, the crack length increased remarkably, and the crack distribution range expanded;
(3)
Tensile crack formation is facilitated at joint angles of 0–60° but suppressed at 60–90°. When JA is the same, the increase in JS benefits tensile crack occurrence. The cracking tendency of coal samples decreased with the increase in JA, then increased and then decreased again, and the cracking tendency converted from centralized distribution to decentralized aggregation and then to centralized distribution. With the increase in JS, the cracking tendency of coal sample is smaller. When JA is 30° and 90°, the microcrack damage tendency is strongly concentrated in the range of 50–110°;
(4)
When 0° ≤ JA ≤ 60°, the tensile force chain within the specimen increases and the density of the tensile force chain converges to the end. When 60° ≤ JA ≤ 90°, the tensile force chain within the specimen decreases and the distribution location of the tensile force chain moves from the center to the left and right edges. As JS increases, the distribution range of tensile force chains increases, and the degree of force chain aggregation increases.
The key underlying mechanisms affecting the mechanical behavior of jointed coal rock masses (especially when changing the angle of the joints) is a complex issue involving multiple interacting factors. Several of the aspects you mention (type of crack first appearing, pull/shear crack ratio, tension chain distribution) are very important, but they have different levels of contribution and causality. The distribution of tension chains is the most central and fundamental underlying mechanism that affects the behavior of jointed coal [34,35,36]. When the joint angle is altered, significant variation in the positive and shear stress components on the joint surface occurs as a result. Simultaneously varying the joint angle will completely transform the direction, density, and concentration of these high-stress force chains. In summary, varying the joint angle causes a drastic change in the stress distribution and force transfer path in the specimen, which in turn determines the type and location of localized stress concentrations. The joint angle controls the type of crack (tensile or shear) that initiates, directing crack expansion and interaction, and ultimately resulting in a specific tensile/shear crack ratio and macroscopic damage pattern.

Author Contributions

Conceptualization, H.Z. and E.W.; writing-original draft, H.Z.; project administration, J.Y.; investigation, B.M., D.X. and X.T. All authors have read and agreed to the published version of the manuscript.

Funding

This work was supported in part by the National Key Research and Development Program of China under Grant 2023YFC3008901, in part by the National Natural Science Foundation of China under Grant 42230811.

Institutional Review Board Statement

Not applicable.

Informed Consent Statement

Not applicable.

Data Availability Statement

The related data used to support the findings of this study are included within the article.

Conflicts of Interest

Author Bin Miao was employed by the company Zaozhuang Mining Group Co., Ltd. The remaining authors declare that the research was conducted in the absence of any commercial or financial relationships that could be construed as a potential conflict of interest.

References

  1. He, M.C.; Ren, F.Q.; Liu, D.Q. Rockburst mechanism research and its control. Int. J. Min. Sci. Technol. 2018, 28, 829–837. [Google Scholar] [CrossRef]
  2. Hu, J.; He, M.C.; Li, H.R. Rockburst hazard control using the excavation compensation method (ECM): A case study in the Qinling water conveyance tunnel. Engineering 2024, 34, 154–163. [Google Scholar] [CrossRef]
  3. Li, H.R.; He, M.C.; Qiao, Y.F.; Cheng, T.; Han, Z.Y. Assessing burst proneness and seismogenic process of anisotropic coal via the realistic energy release rate (RERR) index. Rock Mech. Rock Eng. 2024, 58, 2999–3013. [Google Scholar] [CrossRef]
  4. Akdag, S.; Karakus, M.; Nguyen, G.D.; Taheri, A.; Bruning, T. Evaluation of the propensity of strain burst in brittle granite based on post-peak energy analysis. Undergr. Space 2021, 6, 1–11. [Google Scholar] [CrossRef]
  5. Li, J.Y.; Liu, D.Q.; He, M.C. Excess energy characteristics of true triaxial multi-faceted rapid unloading rockburst. J. Cent. South Univ. 2024, 31, 1671–1686. [Google Scholar] [CrossRef]
  6. Sun, J.; Ling, K.; Zhang, S.D. Experimental study on mesoscopic fracture process and weakening mechanism of water on rockbursts. Eng. Fract. Mech. 2025, 318, 110950. [Google Scholar] [CrossRef]
  7. Hu, J.; He, M.C.; Li, H.R. Control effect of negative poisson’s ratio (NPR) cable on impact-induced rockburst with different strain rates: An experimental investigation. Rock Mech. Rock Eng. 2023, 56, 5167–5180. [Google Scholar] [CrossRef]
  8. Li, H.R.; He, M.C.; Xiao, Y.M. Granite strainbursts induced by true-triaxial transient unloading at different stress levels: Insights from excess energy ∆E. J. Rock Mech. Geotech. Eng. 2025, in press. [Google Scholar] [CrossRef]
  9. Ju, F.; Wang, D.; Wang, Z.; Xiao, M.; He, Z.; Ning, P.; Wang, T.; Li, L.; Yan, C.; Zhou, T. Mechanical properties and acoustic emission characteristics of coal sample with a single natural joint of different dip angles. Bull. Eng. Geol. Environ. 2023, 82, 456. [Google Scholar] [CrossRef]
  10. Ji, P.X.; Viegas, G.; Zhang, Q.B. Mechanical and fracturing characteristics of defected rock-like materials under biaxial compression. Int. J. Rock Mech. Min. Sci. 2024, 176, 105692. [Google Scholar] [CrossRef]
  11. Yang, S.Q.; Tian, W.T.; Ranjith, P.G. Three-dimensional failure behavior and cracking mechanism of rectangular solid sandstone containing a single fissure under triaxial compression. Rock Mech. Bull. 2022, 1, 100008. [Google Scholar] [CrossRef]
  12. Ma, G.; He, M.; Hu, J. Mechanical and damage properties study of rocks with different joint inclinations under seepage-stress coupling: Insights based on energy theory. Comput. Part. Mech. 2025. [Google Scholar] [CrossRef]
  13. Fan, X.; Yu, H.; Deng, Z.Y. Cracking and deformation of cuboidal sandstone with a single nonpenetrating flaw under uniaxial compression. Theor. Appl. Fract. Mech. 2022, 119, 103284. [Google Scholar] [CrossRef]
  14. Hu, J.H.; Wen, G.P.; Lin, Q.B. Mechanical properties and crack evolution of double-layer composite rocklike specimens with two parallel fissures under uniaxial compression. Theor. Appl. Fract. Mech. 2020, 108, 102610. [Google Scholar] [CrossRef]
  15. Zhao, C.; Zhou, Y.M.; Zhao, C.F. Cracking processes and coalescence modes in rock-like specimens with two parallel pre-existing cracks. Rock Mech. Rock Eng. 2018, 51, 3377–3393. [Google Scholar] [CrossRef]
  16. Lin, H.; Li, S.; Zhang, X. Macro-micro failure and crack coalescence behavior of soft-hard composite rock with three parallel joints under uniaxial compression. J. Mater. Res. Technol. 2024, 29, 2947–2958. [Google Scholar] [CrossRef]
  17. Mu, H.W.; Song, D.Z.; He, X.Q. Damage and fracture law of coal sample with different joint angles and their characterisation by acoustic emission. Struct. Control Health Monit. 2020, 27, e2639. [Google Scholar] [CrossRef]
  18. Hu, G.J.; Ma, G.; Liu, J. Size effect of the number of parallel joints on uniaxial compressive strength and characteristic strength. Minerals 2022, 12, 62. [Google Scholar] [CrossRef]
  19. Lin, Q.B.; Cao, P.; Wen, G.P. Crack coalescence in rock-like specimens with two dissimilar layers and pre-existing double parallel joints under uniaxial compression. Int. J. Rock Mech. Min. Sci. 2021, 139, 104621. [Google Scholar] [CrossRef]
  20. Xiong, L.X.; Chen, H.J.; Li, T.B. Uniaxial compressive study on mechanical properties of rock mass considering joint spacing and connectivity rate. Arab. J. Geosci. 2019, 12, 642. [Google Scholar] [CrossRef]
  21. Shan, R.; Liu, N.; Sun, P.; Zhao, Z.; Dong, R.; Dou, H.; Meng, H.; Bai, Y. Experimental and numerical simulation study of rough jointed rock samples under triaxial compression conditions. Eng. Fract. Mech. 2025, 314, 110707. [Google Scholar] [CrossRef]
  22. Hu, G.J.; Ma, G. Size effect of parallel-joint spacing on uniaxial compressive strength of rock. PLoS ONE 2021, 16, e0257245. [Google Scholar] [CrossRef] [PubMed]
  23. Huang, C.C.; Yang, W.D.; Duan, K. Mechanical behaviors of the brittle rock-like specimens with multi-nonpersistent joints under uniaxial compression. Constr. Build. Mater. 2019, 220, 426–443. [Google Scholar] [CrossRef]
  24. Ríos-Bayona, F.; Johansson, F.; Mas-Ivars, D. Using PFC2D to simulate the shear behaviour of joints in hard crystalline rock. Bull. Eng. Geol. Environ. 2022, 81, 381. [Google Scholar] [CrossRef]
  25. Zheng, Z.; Tang, H.; Zhang, Q. True triaxial test and PFC3D-GBM simulation study on mechanical properties and fracture evolution mechanisms of rock under high stresses. Comput. Geotech. 2023, 154, 105136. [Google Scholar] [CrossRef]
  26. Yang, S.Q.; Sun, B.W.; Tian, W.L. Discrete element simulation of the mechanical properties of shale with different bedding inclinations under conventional triaxial compression. Chin. J. Eng. 2022, 44, 430–439. [Google Scholar]
  27. Zhou, Y.; Li, C.; Wang, W.L. A meso-level study on mechanical properties of bedding coal under uniaxial compression. J. Cent. South Univ. 2022, 53, 4036–4047. [Google Scholar]
  28. Zhao, H.; Hou, J.C.; Zhang, L. Towards concrete-rock interface shear containing similar triangular asperities. Int. J. Rock Mech. Min. 2021, 137, 104547. [Google Scholar] [CrossRef]
  29. Huang, L.S.; Li, B.; Li, C.; Wu, B.; Wang, J.X. Research on anisotropic characteristics and energy damage evolution mechanism of bedding coal under uniaxial compression. Energy 2024, 301, 131659. [Google Scholar] [CrossRef]
  30. Li, J.M.; Huang, Y.L.; Pu, H. Influence of block shape on macroscopic deformation response and meso-fabric evolution of crushed gangue under the triaxial compression. Powder Technol. 2021, 384, 112–124. [Google Scholar] [CrossRef]
  31. Nie, Z.H.; Qi, Q.; Wang, X.; Zhu, Y.G. DEM investigation of strain behaviour and force chain evolution of gravel-sand mixtures subjected to cyclic loading. Particuology 2022, 68, 13–28. [Google Scholar] [CrossRef]
  32. Li, H.R.; Qiao, Y.F.; Shen, R.X.; He, M.C.; Cheng, T.; Xiao, Y.M.; Tang, J. Effect of water on mechanical behavior and acoustic emission response of sandstone during loading process: Phenomenon and mechanism. Eng. Geol. 2021, 294, 106386. [Google Scholar] [CrossRef]
  33. Liu, S.K.; Nie, Z.H.; Hu, W.; Gong, J.; Lei, P. Effect of particle type on the shear behaviour of granular materials. Particuology 2021, 56, 124–131. [Google Scholar] [CrossRef]
  34. Luo, F.; Gao, S.; Xu, Z.; Dong, E.; Diao, Y.; Sang, Y. Mechanical behavior and tension-shear failure mechanism of fractured rock mass under uniaxial condition. Bull. Eng. Geol. Environ. 2023, 82, 314. [Google Scholar] [CrossRef]
  35. Zhu, K.; Sun, G.; Shi, L.; Lin, S.; Yu, X. Analysis of multi-level force chain network in granite tensile fracture based on 3D-GBM. Eng. Fail. Anal. 2024, 166, 108849. [Google Scholar] [CrossRef]
  36. Zhang, T.; Yu, L.; Wei, J.; Pu, H.; Zhang, Q.; Hu, L.; Mi, X. Stress evolution in rocks around tunnel under uniaxial loading: Insights from PFC3D-GBM modelling and force chain analysis. Theor. Appl. Fract. Mech. 2024, 134, 104728. [Google Scholar] [CrossRef]
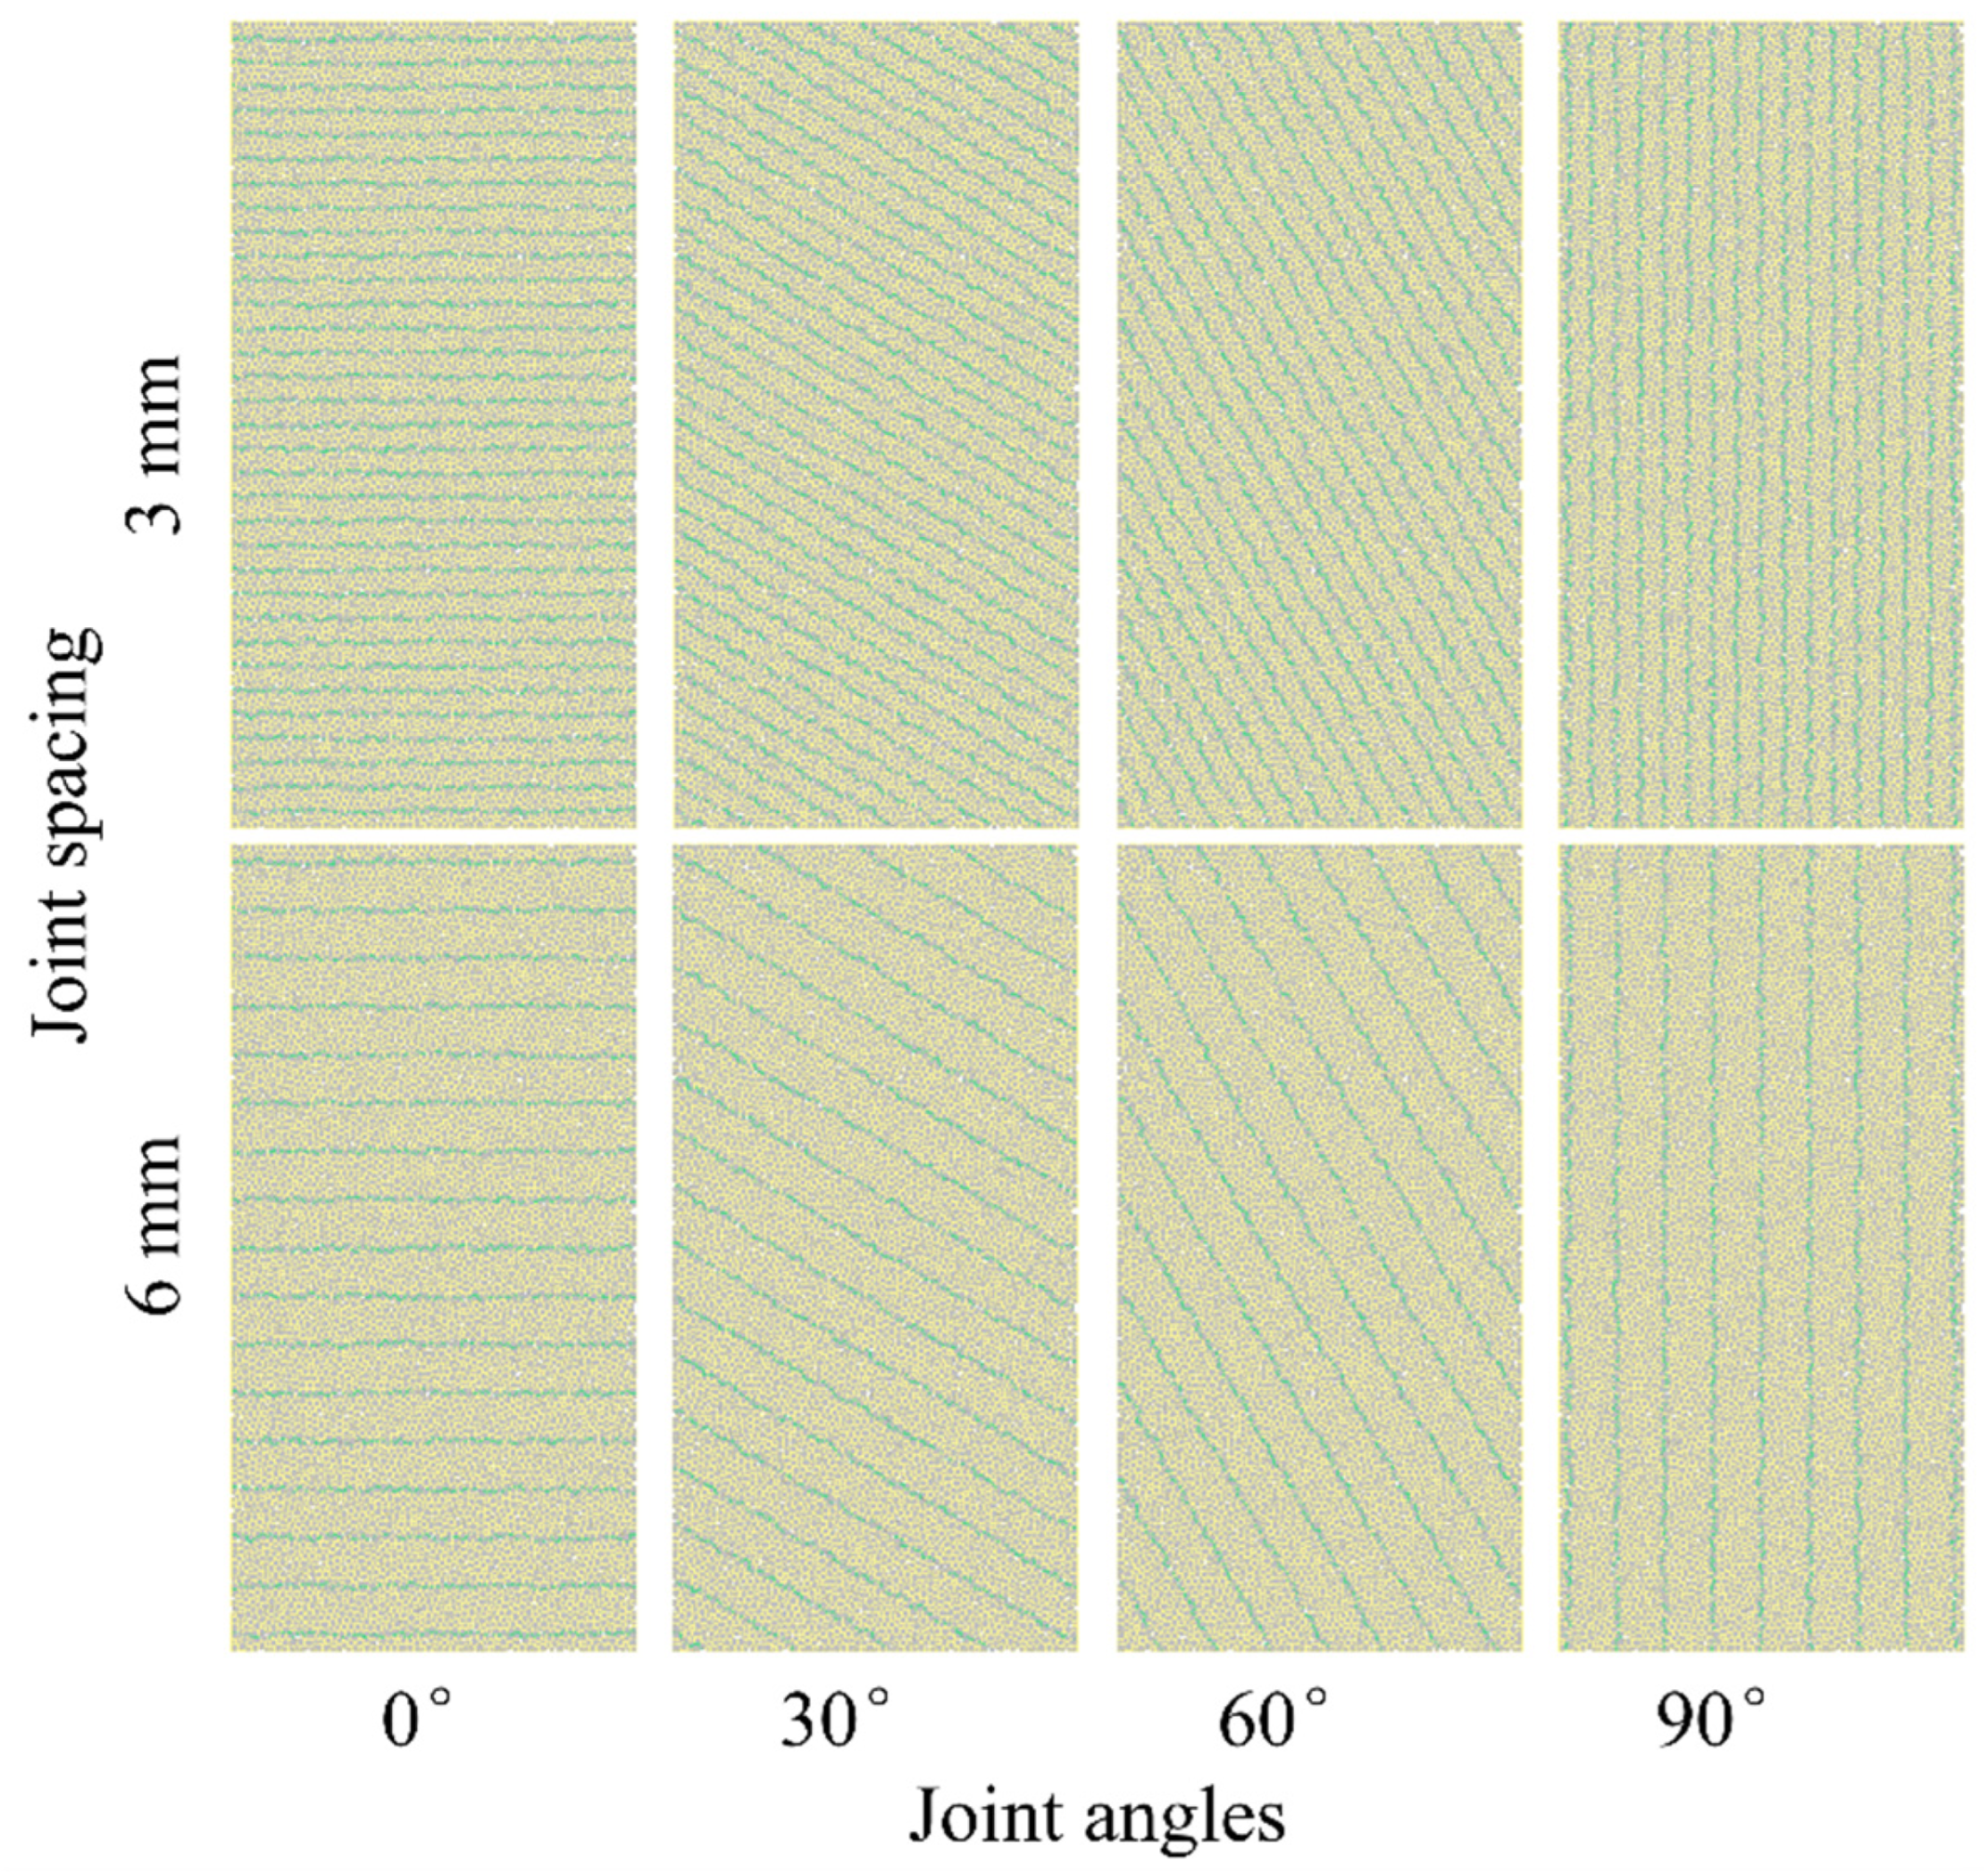
Figure 1. DEM modeling of coal with different joint spacing and angles. (Yellow represents the parallel bonding model between matrix particles, blue represents the smooth joint model of joints, and gray represents material particles.)
Applsci 15 09196 g001
Figure 2. Stress–strain curves of coal sample with different joint spacing and angles.
Applsci 15 09196 g002
Figure 3. Peak strength of coal sample with different joint spacing and angles.
Applsci 15 09196 g003
Figure 4. Failure mode of coal sample with different joint spacing and angles.
Applsci 15 09196 g004
Figure 5. Microcrack characteristics of coal samples with different joint spacing and angles.
Applsci 15 09196 g005aApplsci 15 09196 g005b
Figure 6. Proportion of different types of microcracks at peak stresses.
Applsci 15 09196 g006
Figure 7. Crack inclination distribution of coal sample with different joint spacing and angles.
Applsci 15 09196 g007
Figure 8. Force chain attribute characterization of coal samples with different joint spacing and angles.
Applsci 15 09196 g008
Figure 9. Force chain magnitude characteristics of coal sample with different joint spacing and angles.
Applsci 15 09196 g009
Table 1. Values of microscopic parameters in numerical simulation.
Particle-ParametersValuesContact-ParametersValues
Minimum radius of the particle, Rmin/mm0.28Standard deviation of bond tangential strength, τs,dev/MPa1.25
Ratio of maximum to minimum of radius, Rrat1.66Young’s modulus of the parallel bond, E ¯ C /GPa2.25
Density of the particle, ρ/(kg·m−3)1400Ratio of normal to shear stiffness of the parallel bond, K ¯ n / K ¯ s 3.0
Friction coefficient, μ0.5Average bond normal strength, σn,mean/MPa12.5
Young’s modulus of the particle, EC/GPa2.25Standard deviation of bond normal strength, σn,dev/MPa1.25
Ratio of normal to shear stiffness of the particle, kn/ks3.0Average bond tangential strength, τs,mean/MPa12.5
Parallel bonding radius factor, λ0.5
Disclaimer/Publisher’s Note: The statements, opinions and data contained in all publications are solely those of the individual author(s) and contributor(s) and not of MDPI and/or the editor(s). MDPI and/or the editor(s) disclaim responsibility for any injury to people or property resulting from any ideas, methods, instructions or products referred to in the content.