Article

Non-Contact Heart Rate Monitoring Method Based on Multi-Source Data Fusion

1
Tianjin Key Laboratory for Advanced Signal Processing, Civil Aviation University of China, Tianjin 300300, China
2
Systems Engineering Institute, Academy of Military Science, People’s Liberation Army, Tianjin 300161, China
*
Authors to whom correspondence should be addressed.
Appl. Sci. 2025, 15(16), 9189; https://doi.org/10.3390/app15169189
Submission received: 28 May 2025 / Revised: 30 July 2025 / Accepted: 19 August 2025 / Published: 21 August 2025

Abstract

Featured Application

The proposed non-contact heart rate monitoring system, combining microwave radar and rPPG technologies, enables accurate, identity-matched vital sign detection in both well-lit and dark environments, with applications in hospital wards, nursing homes, emergency detection, and smart living spaces.

Abstract

This paper proposes a non-contact heart rate long-time monitoring system based on multi-source data fusion. Microwave radar cannot associate the identity of a target with its signal, whereas rPPG can achieve this through facial recognition. Additionally, rPPG technology is unable to monitor heart rate in completely dark environments, while visible light is not a prerequisite for radar-based heart rate monitoring. Consequently, this paper proposes a method for heart rate monitoring that fuses microwave and video data. The methodology involves preprocessing both microwave and video data, extracting specific features of different types of data, and identifying the heart rate by the signal features. In the experiments, the identification accuracy for heart rates ranging from 57 to 171 bpm was 73.1%, with accuracies of 75.8% for heart rates below 60 bpm and 89.9% for heart rates above 120 bpm. Compared to single-source data, the accuracy increased by 25.4% and 28.6%, respectively. The monitoring duration is approximately 30 s and achieves model optimization through algorithm deployment. These results validate the effectiveness and timeliness of the proposed method.

1. Introduction

Heart rate is a crucial vital sign for assessing human health, as many diseases are directly or indirectly related to changes in physiological signals [1]. Heart rate monitoring provides doctors with reliable diagnostic and real-time information [2]. Currently, in hospital treatments, heart rate monitoring is mostly conducted using contact devices such as fingertip pulse oximeters and electrocardiograms. However, contact devices are not only uncomfortable but may also cause additional harm to burn patients and infants [3]. At the same time, long-duration heart rate monitoring with such devices hinders patient mobility. Therefore, non-contact heart rate monitoring has emerged as a promising alternative.
Currently, the mainstream technologies for non-contact heart rate monitoring are based on remote photoplethysmography (rPPG) and radar signal processing. Research teams at the University of Tennessee have demonstrated that both methods can achieve accurate monitoring of vital signs, with each technology offering unique advantages; for instance, radar can monitor through walls, while cameras can additionally assess blood oxygen saturation [4]. The rPPG technique estimates heart rate by analyzing variations in reflected light from the facial region, and facial recognition algorithms can be employed to identify individuals, allowing for patient information matching during monitoring. In the early stages of research, traditional signal processing methods were primarily used for rPPG extraction. However, with the advancement of deep learning, large models have gradually become the focus of rPPG extraction techniques. However, under low-light or even nighttime conditions, the performance of heart rate monitoring is compromised regardless of the processing method used [5,6,7,8,9]. Furthermore, most rPPG extraction techniques based on large models utilize end-to-end networks, which are complex, require substantial computational resources and time for training, and impose high performance demands on hardware. The black-box nature of these networks also makes it challenging for researchers to interpret and debug the results.
Radar systems that utilize electromagnetic technology are particularly sensitive to the weak movements associated with heartbeats due to their high frequency and short wavelength characteristics. In low-light environments, radar monitoring technology effectively addresses this challenge, as radar remote monitoring systems can operate in complete darkness [10] and smoke-filled areas [11]. Consequently, the advantages of this technology enable its application in various practical settings, such as nighttime hospital wards, nursing homes, and conference rooms. It can also be used to detect potential emergencies, including cardiovascular diseases [12], sudden infant death syndrome (SIDS) [13], and fall incidents [14]. However, detection technologies based on Frequency Modulated Continuous Wave (FMCW) radar are unable to match detection results with the subjects being monitored. If subjects swap positions during the signal acquisition process, result confusion may occur. In the study of identity recognition using radar data, researchers from Clarkson University, led by Rissacher et al., were the first to propose the extraction of cardiac signals from radar echo data as biometric features [15]. A research team from the University at Buffalo developed a continuous identity verification system based on cardiac scanning, utilizing 2.4 GHz Doppler radar to analyze both geometric and non-volitional features [16]. Meanwhile, a research group from Nanjing University of Aeronautics and Astronautics processed data using short-time Fourier transform and implemented heartbeat-based recognition through deep convolutional neural networks [17].
However, these studies idealized the identity recognition problem, as it is impossible to collect heartbeat signals from every individual globally; thus, when utilizing models to identify individuals not in the database, they are often incorrectly categorized into known identities. To address this issue, a research team from Shanghai Jiao Tong University proposed a novel dipole deep learning model to distinguish between known and unknown identities [18].
The proposed method in this paper aims to achieve a one-to-one correspondence between user identity information and physiological data; if a new user appears, facial recognition technology will be employed to match the new user with information from a large database.
Therefore, there is an urgent need for solutions that can match user identity information with heart rate data while enabling heart rate monitoring in dark environments. To address the aforementioned issues, this study proposes a heart rate monitoring method that integrates microwave data with video data. This approach effectively mitigates the poor performance of rPPG monitoring under low-light conditions and prevents confusion in radar monitoring results due to subject position changes. Additionally, it does not rely on a single type of data, thereby enhancing the credibility of the results. The study extracts time-domain, frequency-domain, and nonlinear features from the two types of preprocessed data and performs feature-level fusion. A hybrid feature selection algorithm is utilized to refine the features, and heart rate classification is achieved using an SVM classifier. This method combines signal processing with machine learning, providing an efficient approach for real-time heart rate classification.

2. Methods and Procedures

2.1. Data Acquisition

2.1.1. Experimental System Setup

The experimental system consists of data acquisition modules and a data processing module. The data acquisition module can be divided into the microwave module, camera module, and pulse oximeter, as shown in Figure 1.
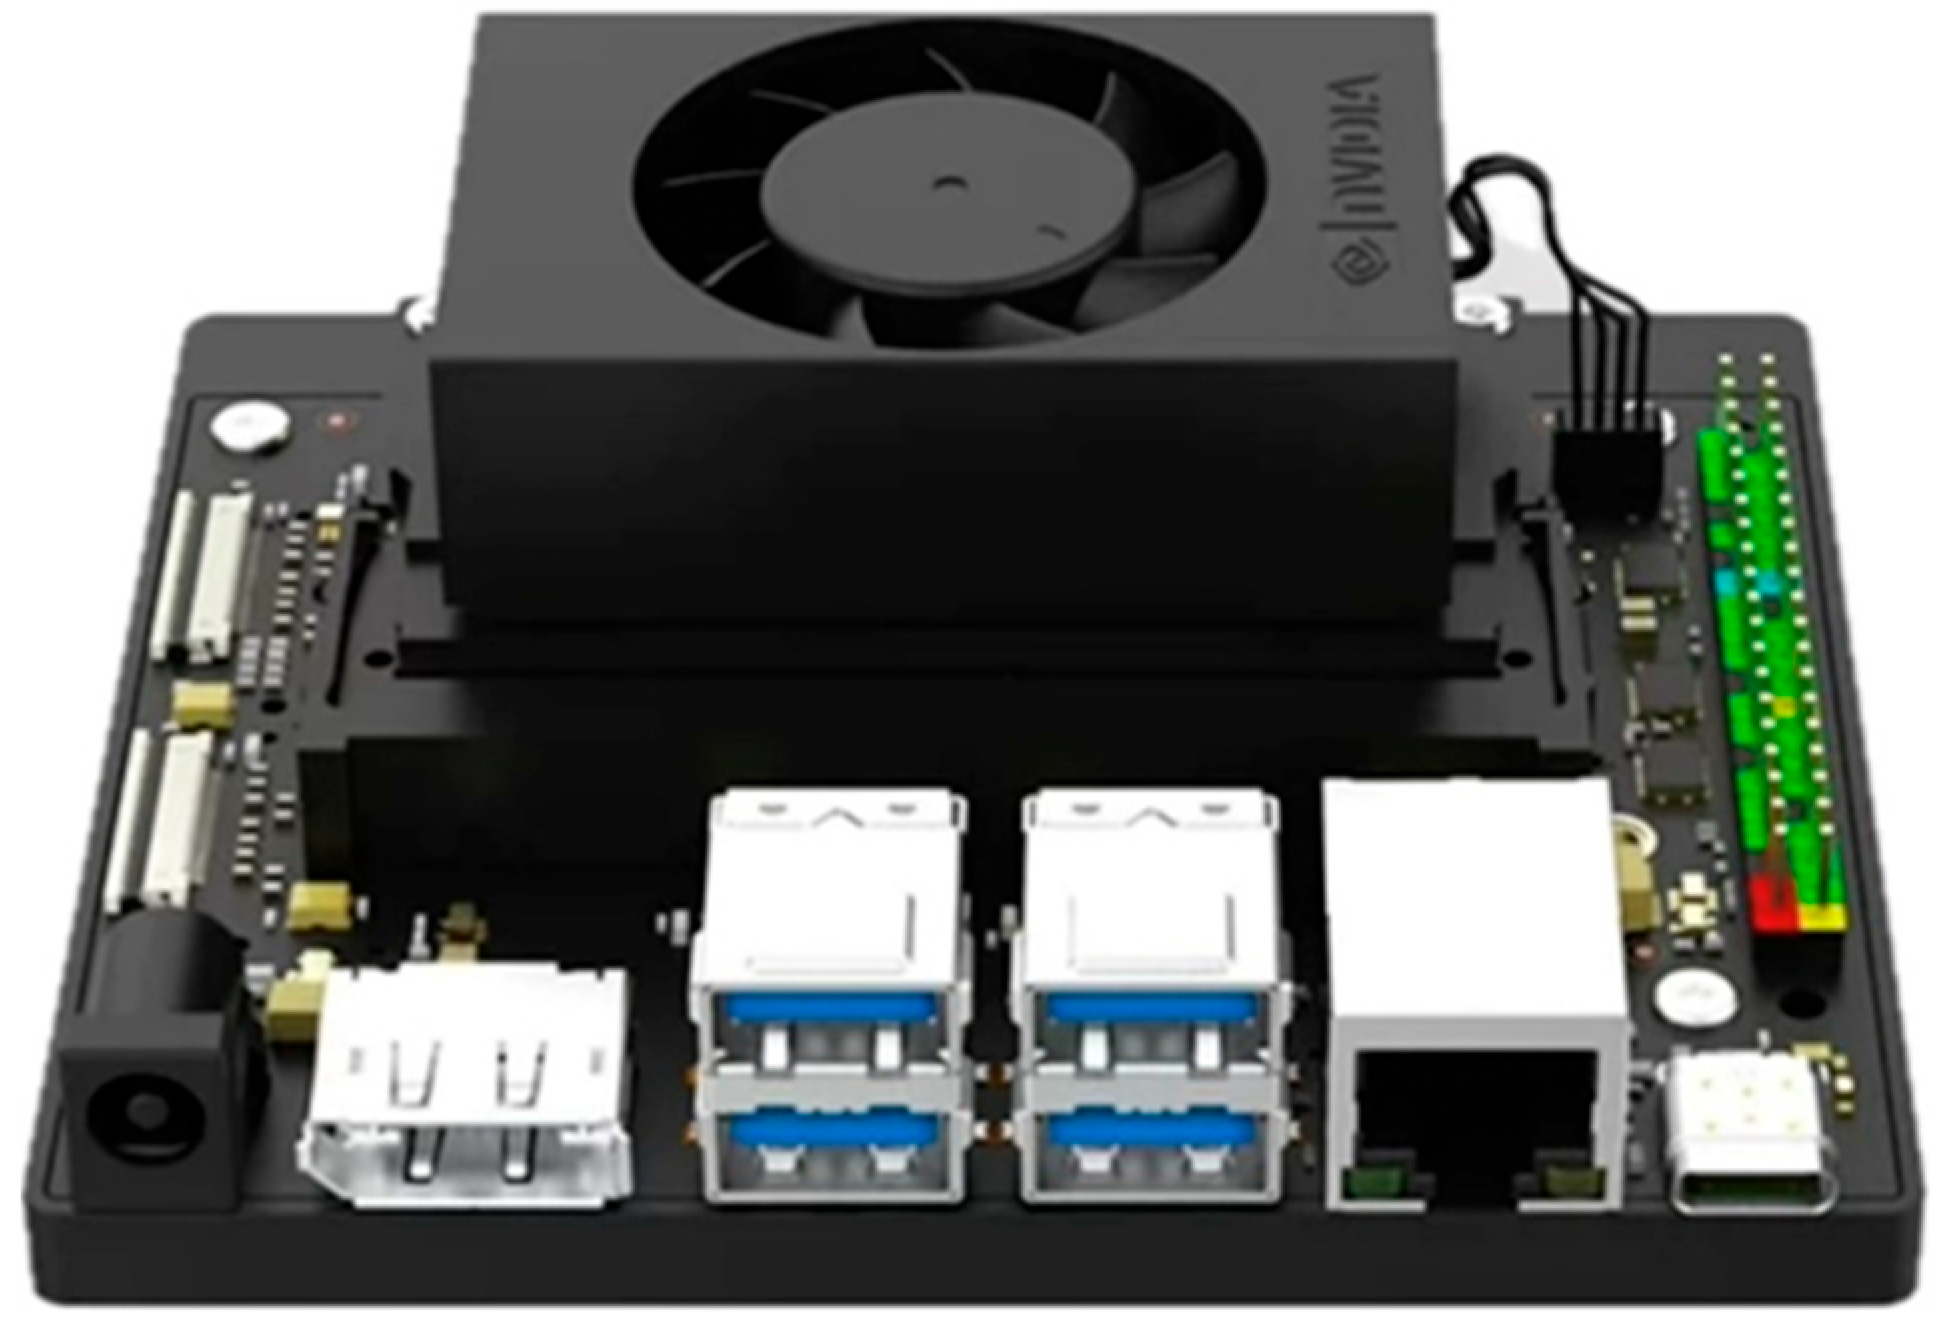
The microwave module includes a radar board and a data acquisition board, both sourced from Texas Instruments. The radar board model is IWR6843ISK-ODS, which operates in the frequency range of 60–64 GHz and is equipped with three transmitting antennas and four receiving antennas, which can meet the requirements of monitoring the heart rates of two individuals. The data acquisition board model is DCA1000EVM, which can store radar echo signals in real time for subsequent experiments. The camera module is model KC-200WQJ-180, with a resolution of 1280 × 720 (approximately 2 million pixels) and a frame rate of 180 frames per second; it is a color camera. The pulse oximeter utilizes the CONTEC CMS50E module, which supports the real-time storage of heart rate data to fulfill the experimental requirements. The data processing module is NVIDIA Jetson Xavier NX, as shown in Figure 2. The algorithm is processed on NX, which makes the model lightweight and enhances the real-time performance of the system by acquiring and processing data in real time.

2.1.2. Data Registration

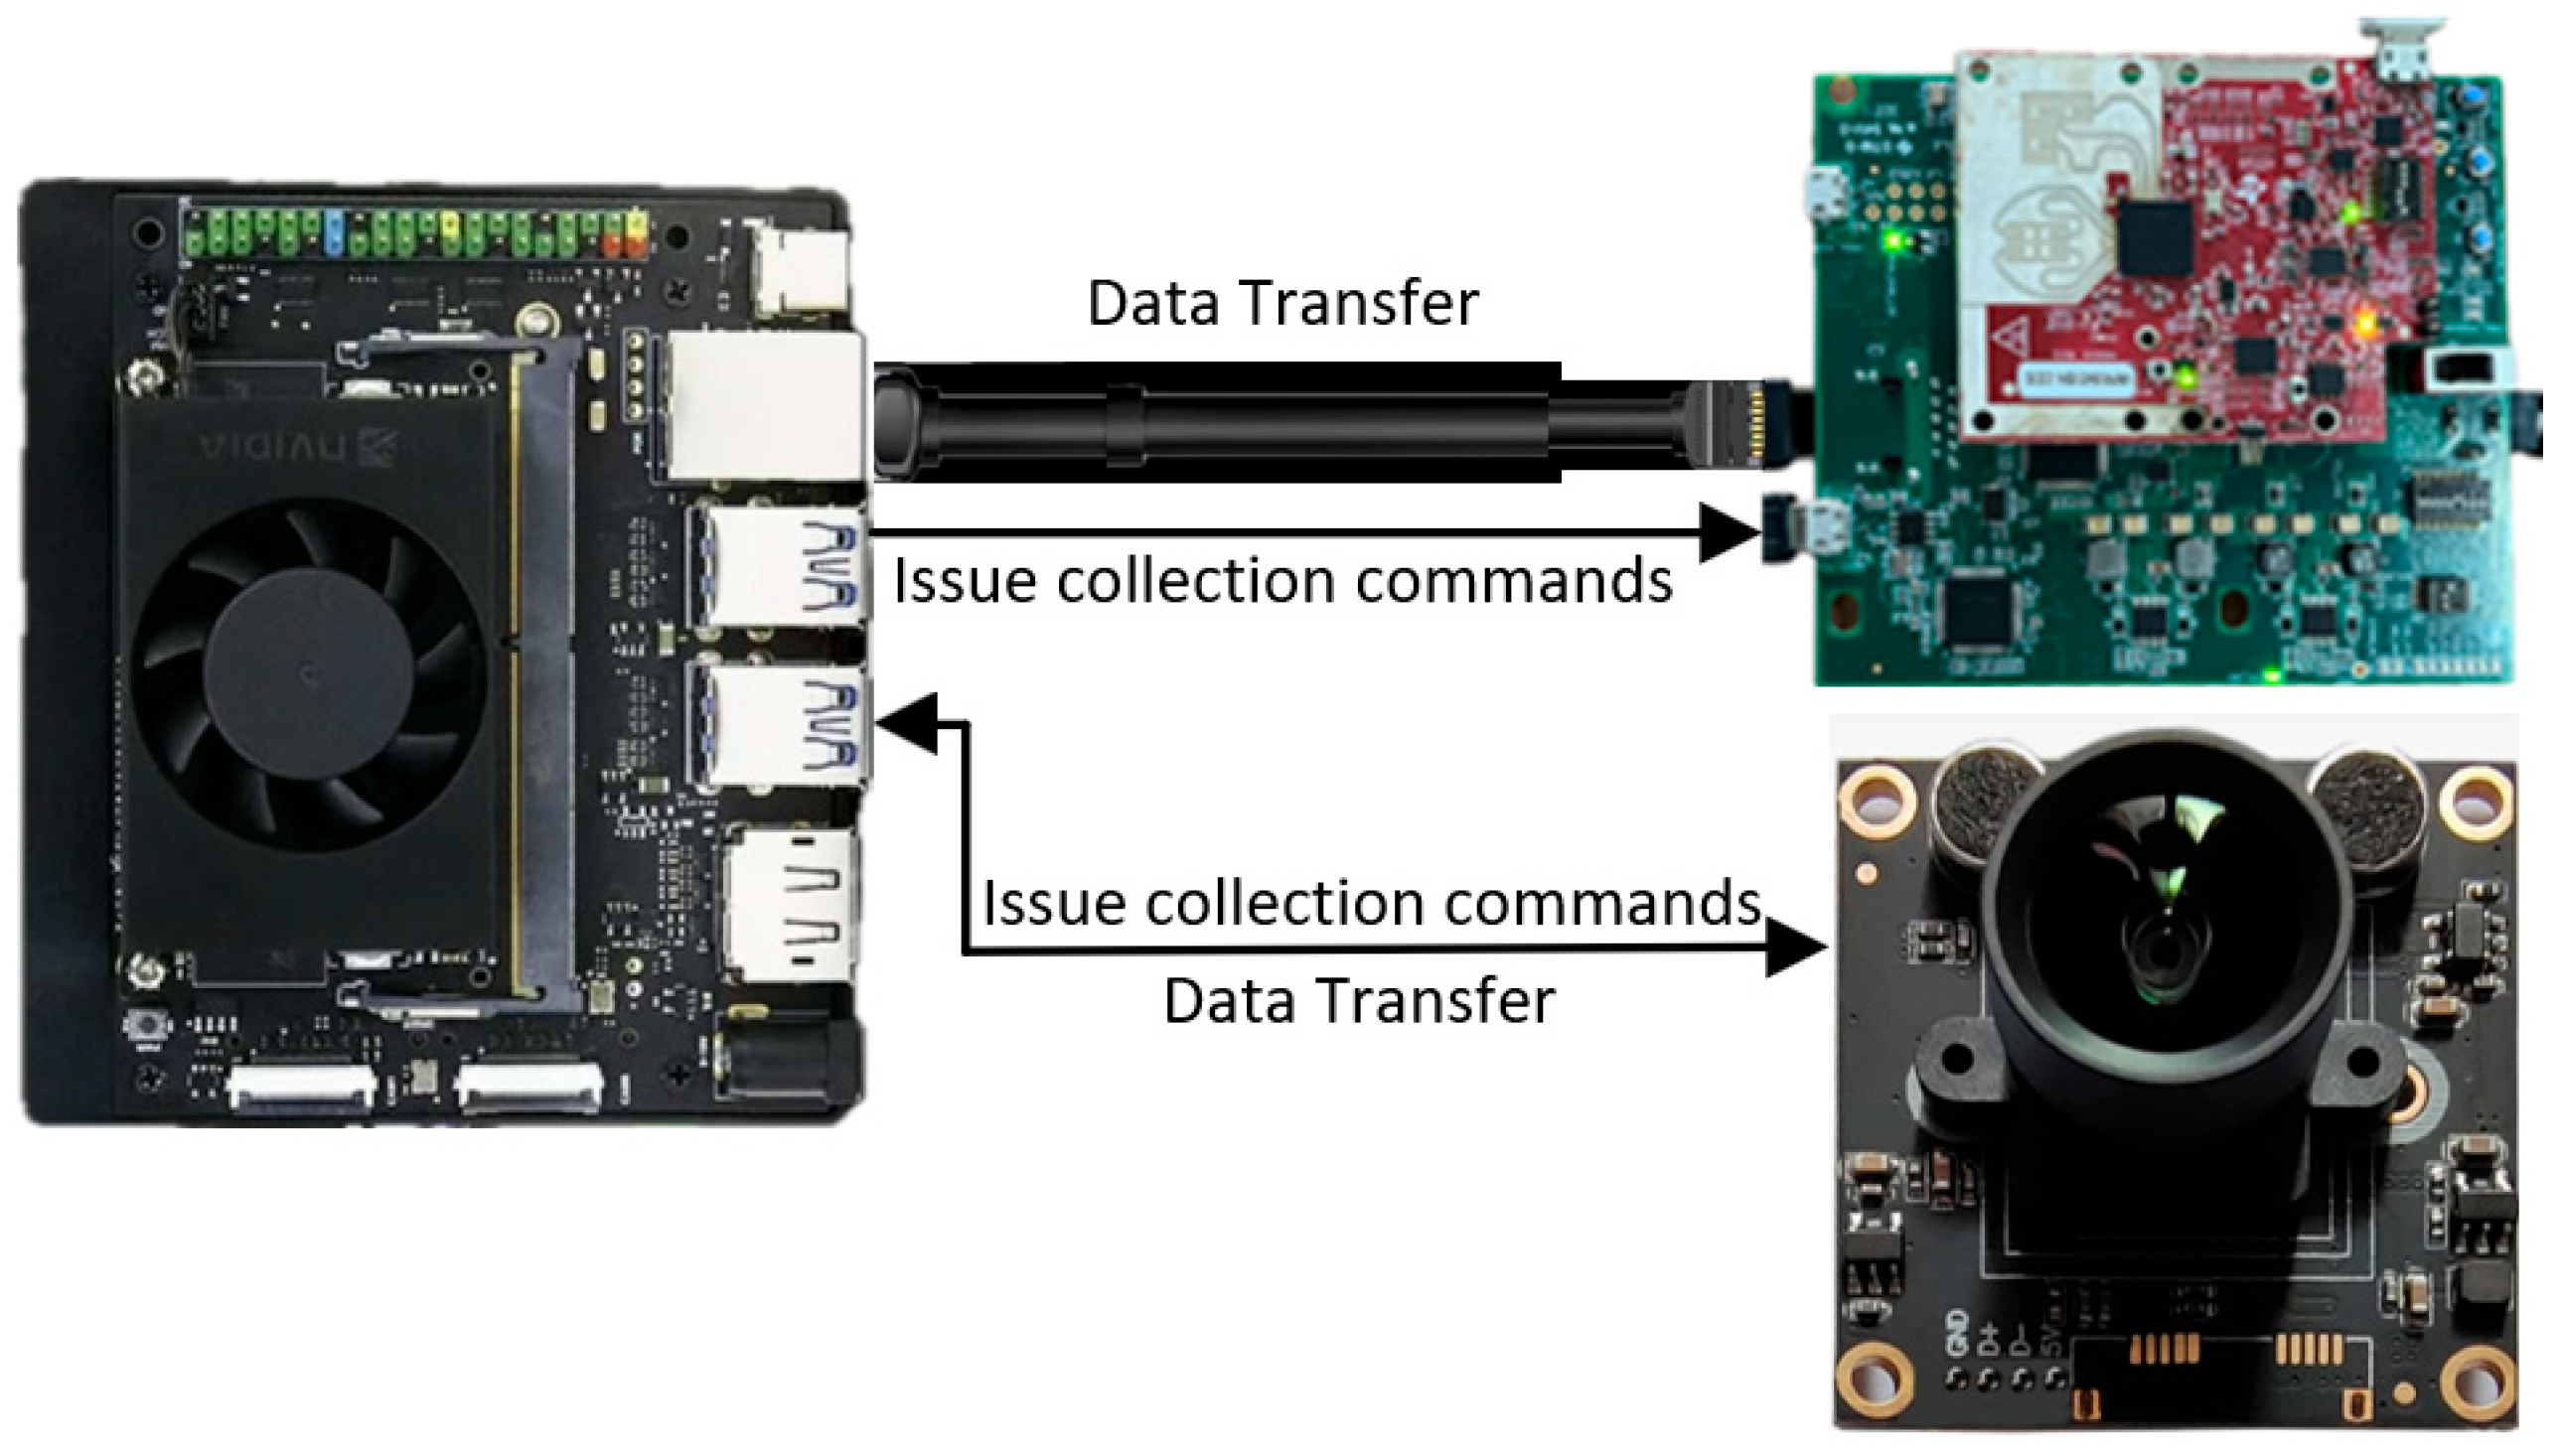
To enhance the practicality of the system, this paper integrates the acquisition module with the processing module, as illustrated in Figure 3. The internal wiring design is shown in Figure 4, where the NX board is connected to the microwave module via Ethernet and USB cables, and the NX board is also linked to the camera through a USB connection. This setup allows the NX board to issue acquisition commands to both the radar board and the camera, facilitating the transmission of radar echo data.
Since this paper utilizes two types of data sources—radar data and video data—it is essential to ensure temporal alignment and spatial registration of the multi-source data. Temporal consistency is a prerequisite for data acquisition. Once initialization is complete, the NX board will simultaneously send acquisition commands to both the radar board and the camera module, using the completion signal of radar echo data acquisition to halt the video data acquisition.
The radar module parameters set in this paper are shown in Table 1. The effective chirp time depends on the idle time, TX start time, ADC start time, and ramp end time [19]. Since the chirp time T c 57 μ s T s , multiple chirps can be used within a single slow time frame to improve the signal-to-noise ratio of the received chirp and stabilize the recognition of the target range bin [20].
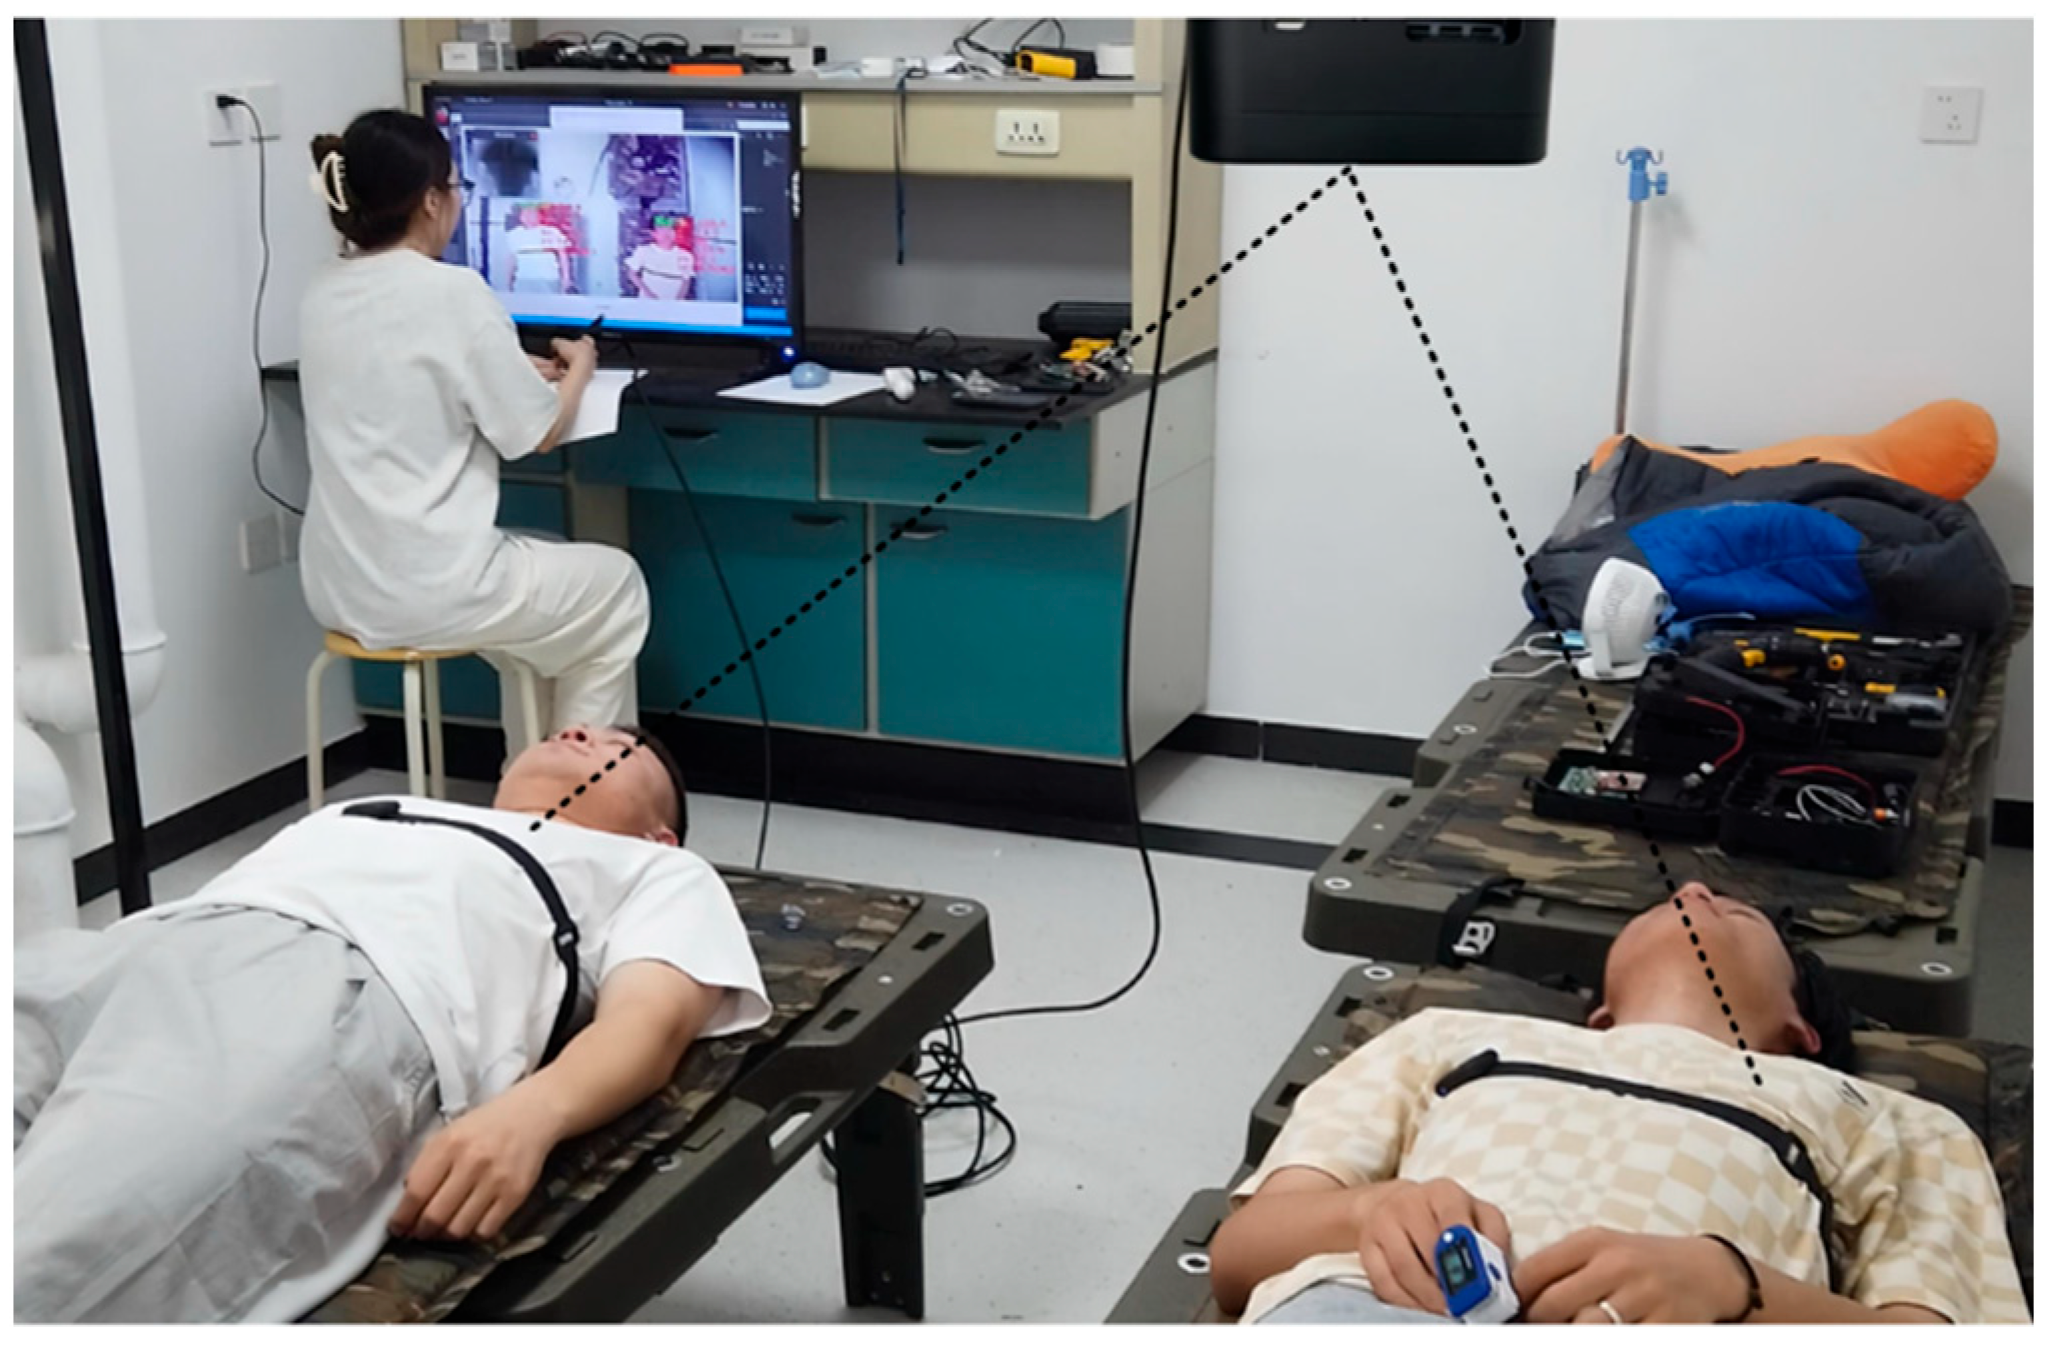
The experiment acquired microwave data and video data from 54 individuals aged between 20 and 35 years old, while real-time heart rate was recorded using a pulse oximeter as the ground truth. Among the participants, 34 were male and 20 were female. The recording duration for each person was 3 min, with data captured in 1 s intervals, resulting in a total of 9900 data samples, which met the training requirements of the classifier. To obtain a wider range of heart rate data and expand the application scenarios of the system, data were acquired both during the resting state of the subjects and after step exercise experiments. The data acquisition scenarios are illustrated in Figure 5.
After data acquisition, spatial registration of the two data types is required to achieve data alignment, specifically aligning the signals of individual targets in the microwave and video data. For the microwave data, due to the varying angles of the experimenters relative to the radar while maintaining a constant vertical distance, this study extracts single-person microwave signals by detecting the angle of the signal source. For the video data, the Retina Face [21] face detection algorithm is utilized for facial extraction, enabling the acquisition of the experimenters’ facial images. The registration of the facial images with respect to the angle is illustrated in Figure 6.

2.2. Proposed Data Fusion Algorithm

2.2.1. Data Preprocessing

The data preprocessing process consists of two parts: preprocessing of the microwave data and preprocessing of the video data. This data preprocessing filters out irrelevant information, thereby highlighting the useful data. Additionally, the preprocessing stage standardizes the formats of the two different modalities, resulting in one-dimensional data that contains the target’s heart rate signal.
The mathematical framework directly guides our practical implementation. Equation (1) for target range calculation ( R c = n 1 d r e s ) enables precise radar signal processing by determining the specific range bin containing the target’s heartbeat information. The phase unwrapping and differencing operations, while mathematically complex, translate to practical signal enhancement techniques that amplify the weak heartbeat signals buried in radar noise. Similarly, the standardization process in Equation (2) ensures that both radar and video data are normalized to comparable scales, which is essential for the subsequent feature-level fusion process.
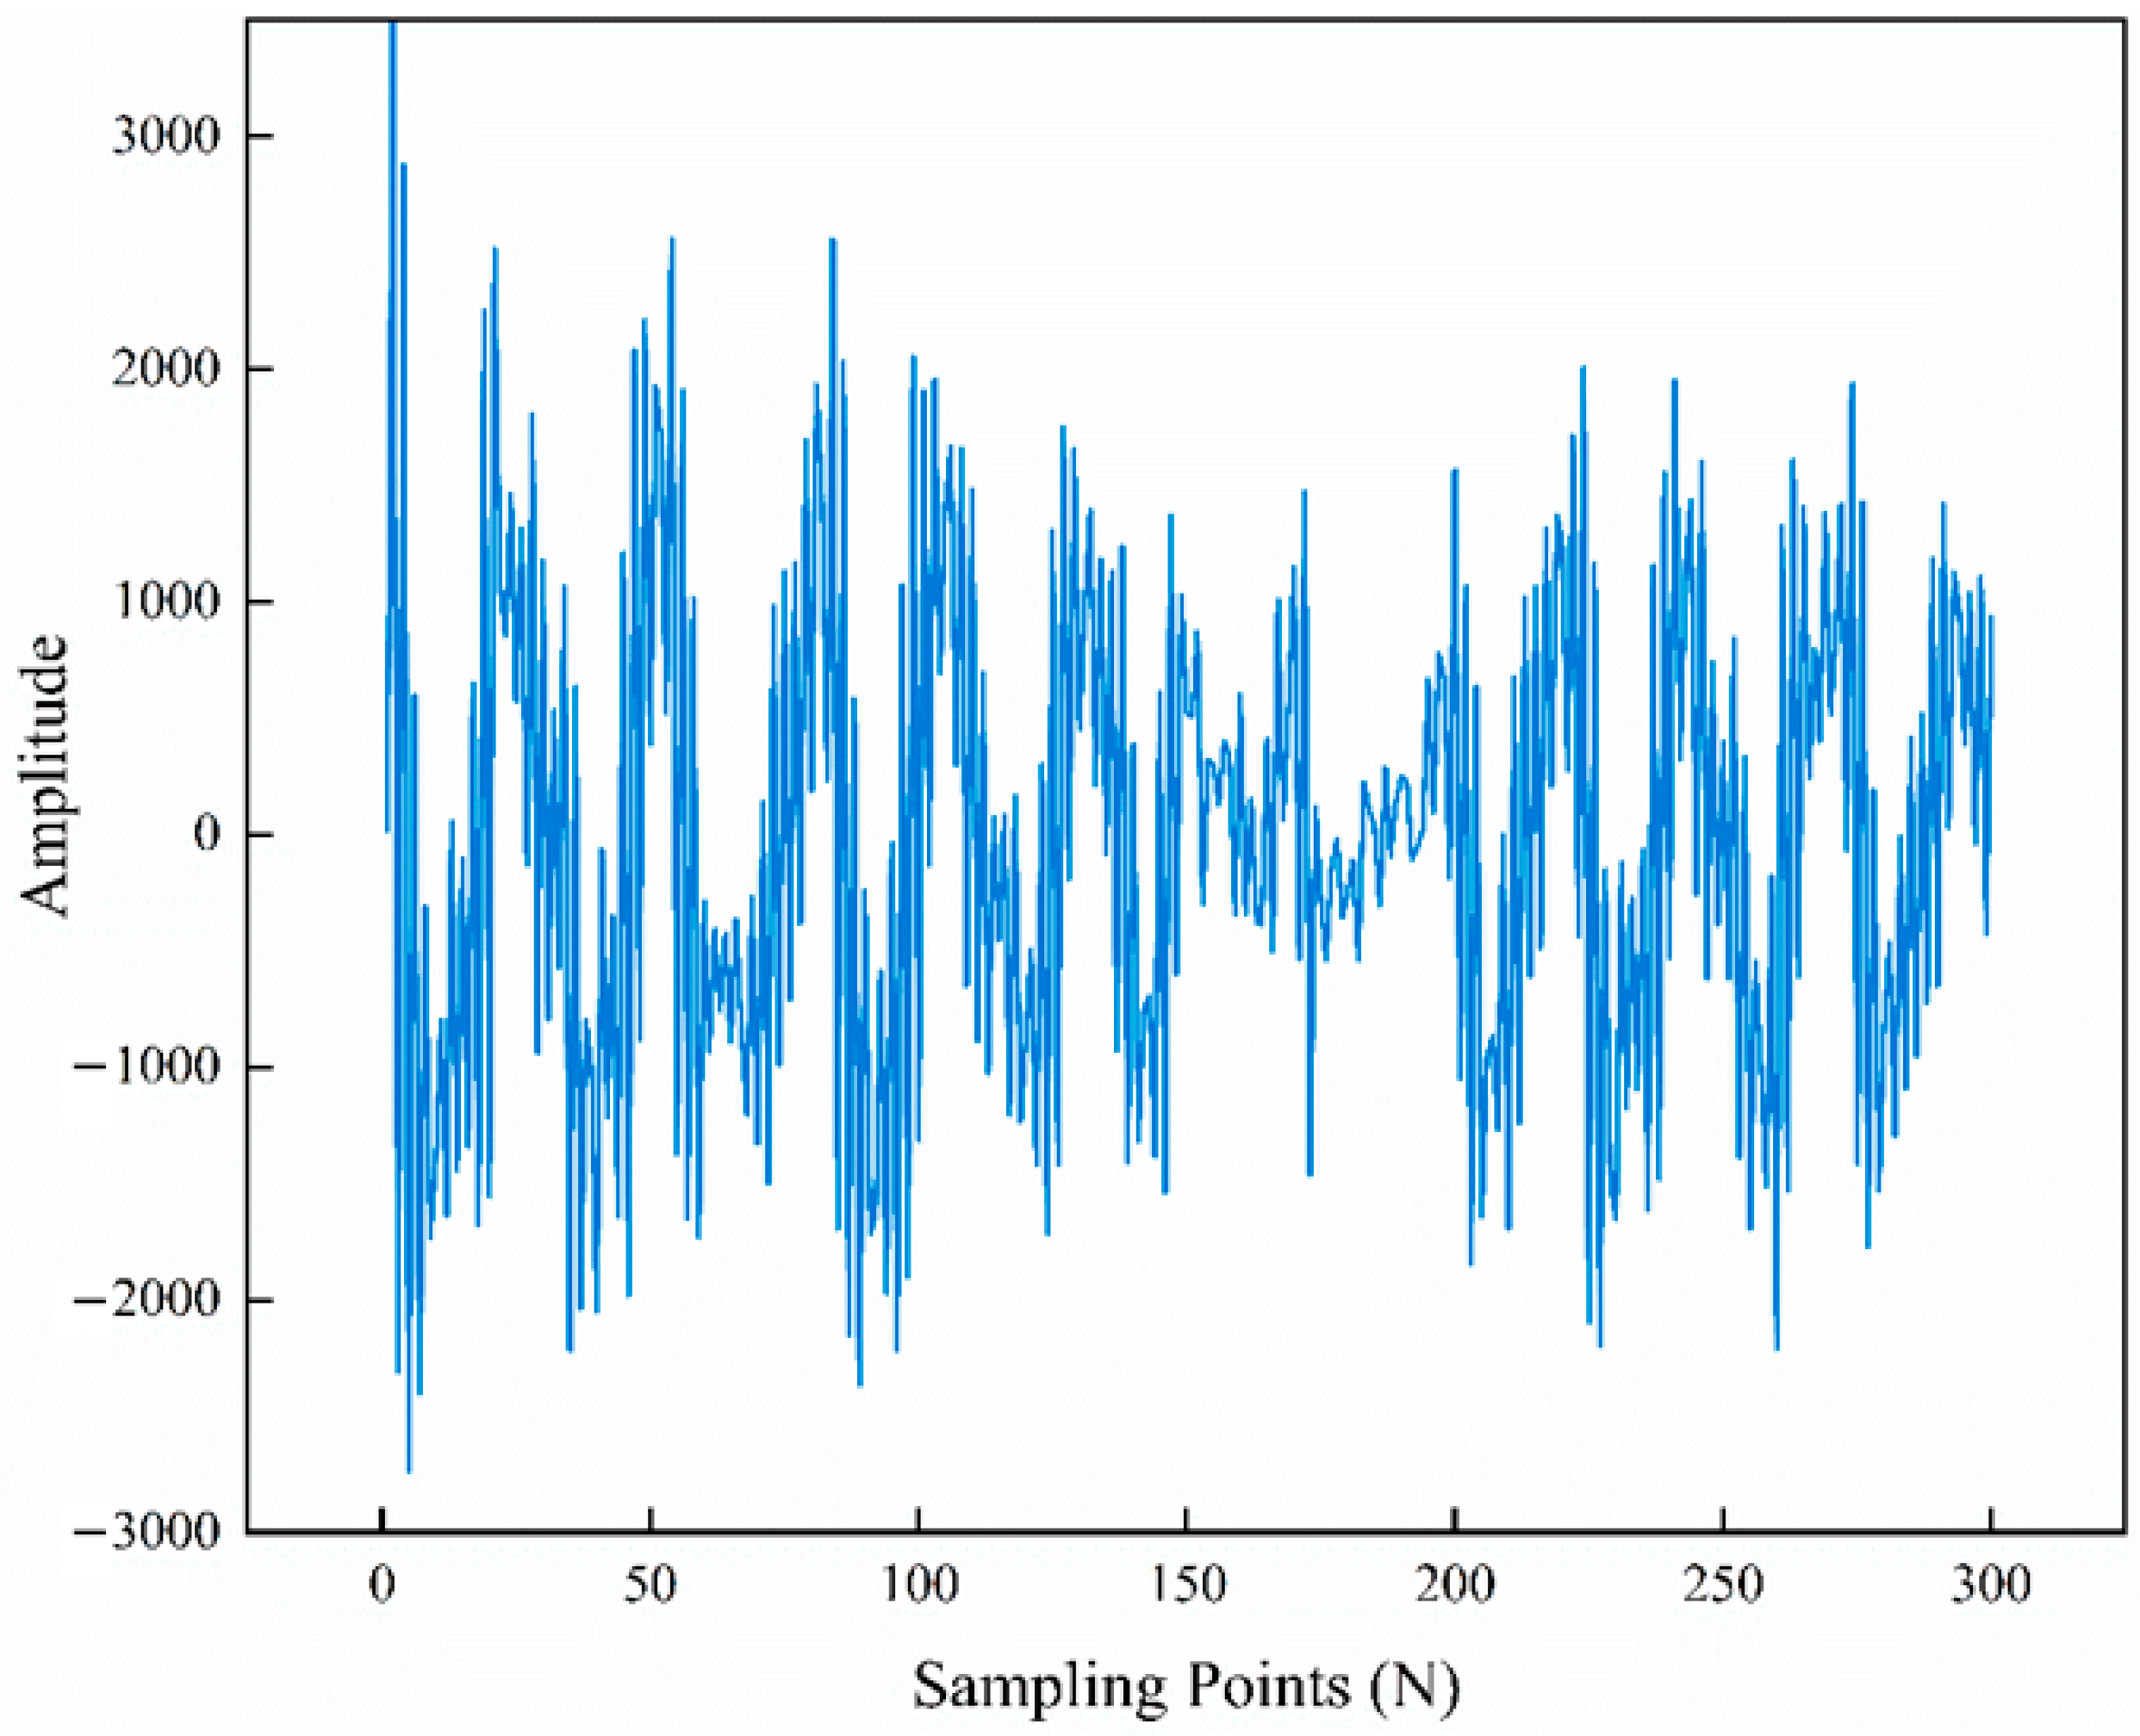
The radar echo signal is shown in Figure 7. After receiving the radar echo signal, the microwave data is first rearranged into a data matrix M S M , N , where M is the number of chirp cycles in the slow time dimension and N is the number of sampling points in the fast time dimension within a single chirp cycle. The arrangement is shown in Figure 8. A P -point Fast Fourier Transform (FFT) is performed on each column of matrix M S M , N to obtain the range dimension FFT spectrum matrix D S M , P . The column with the maximum energy value, denoted as the p -th column, corresponds to the target range cell. Since the first column corresponds to a frequency of zero, the target range can be expressed as Equation (1):
R c = n 1 d r e s
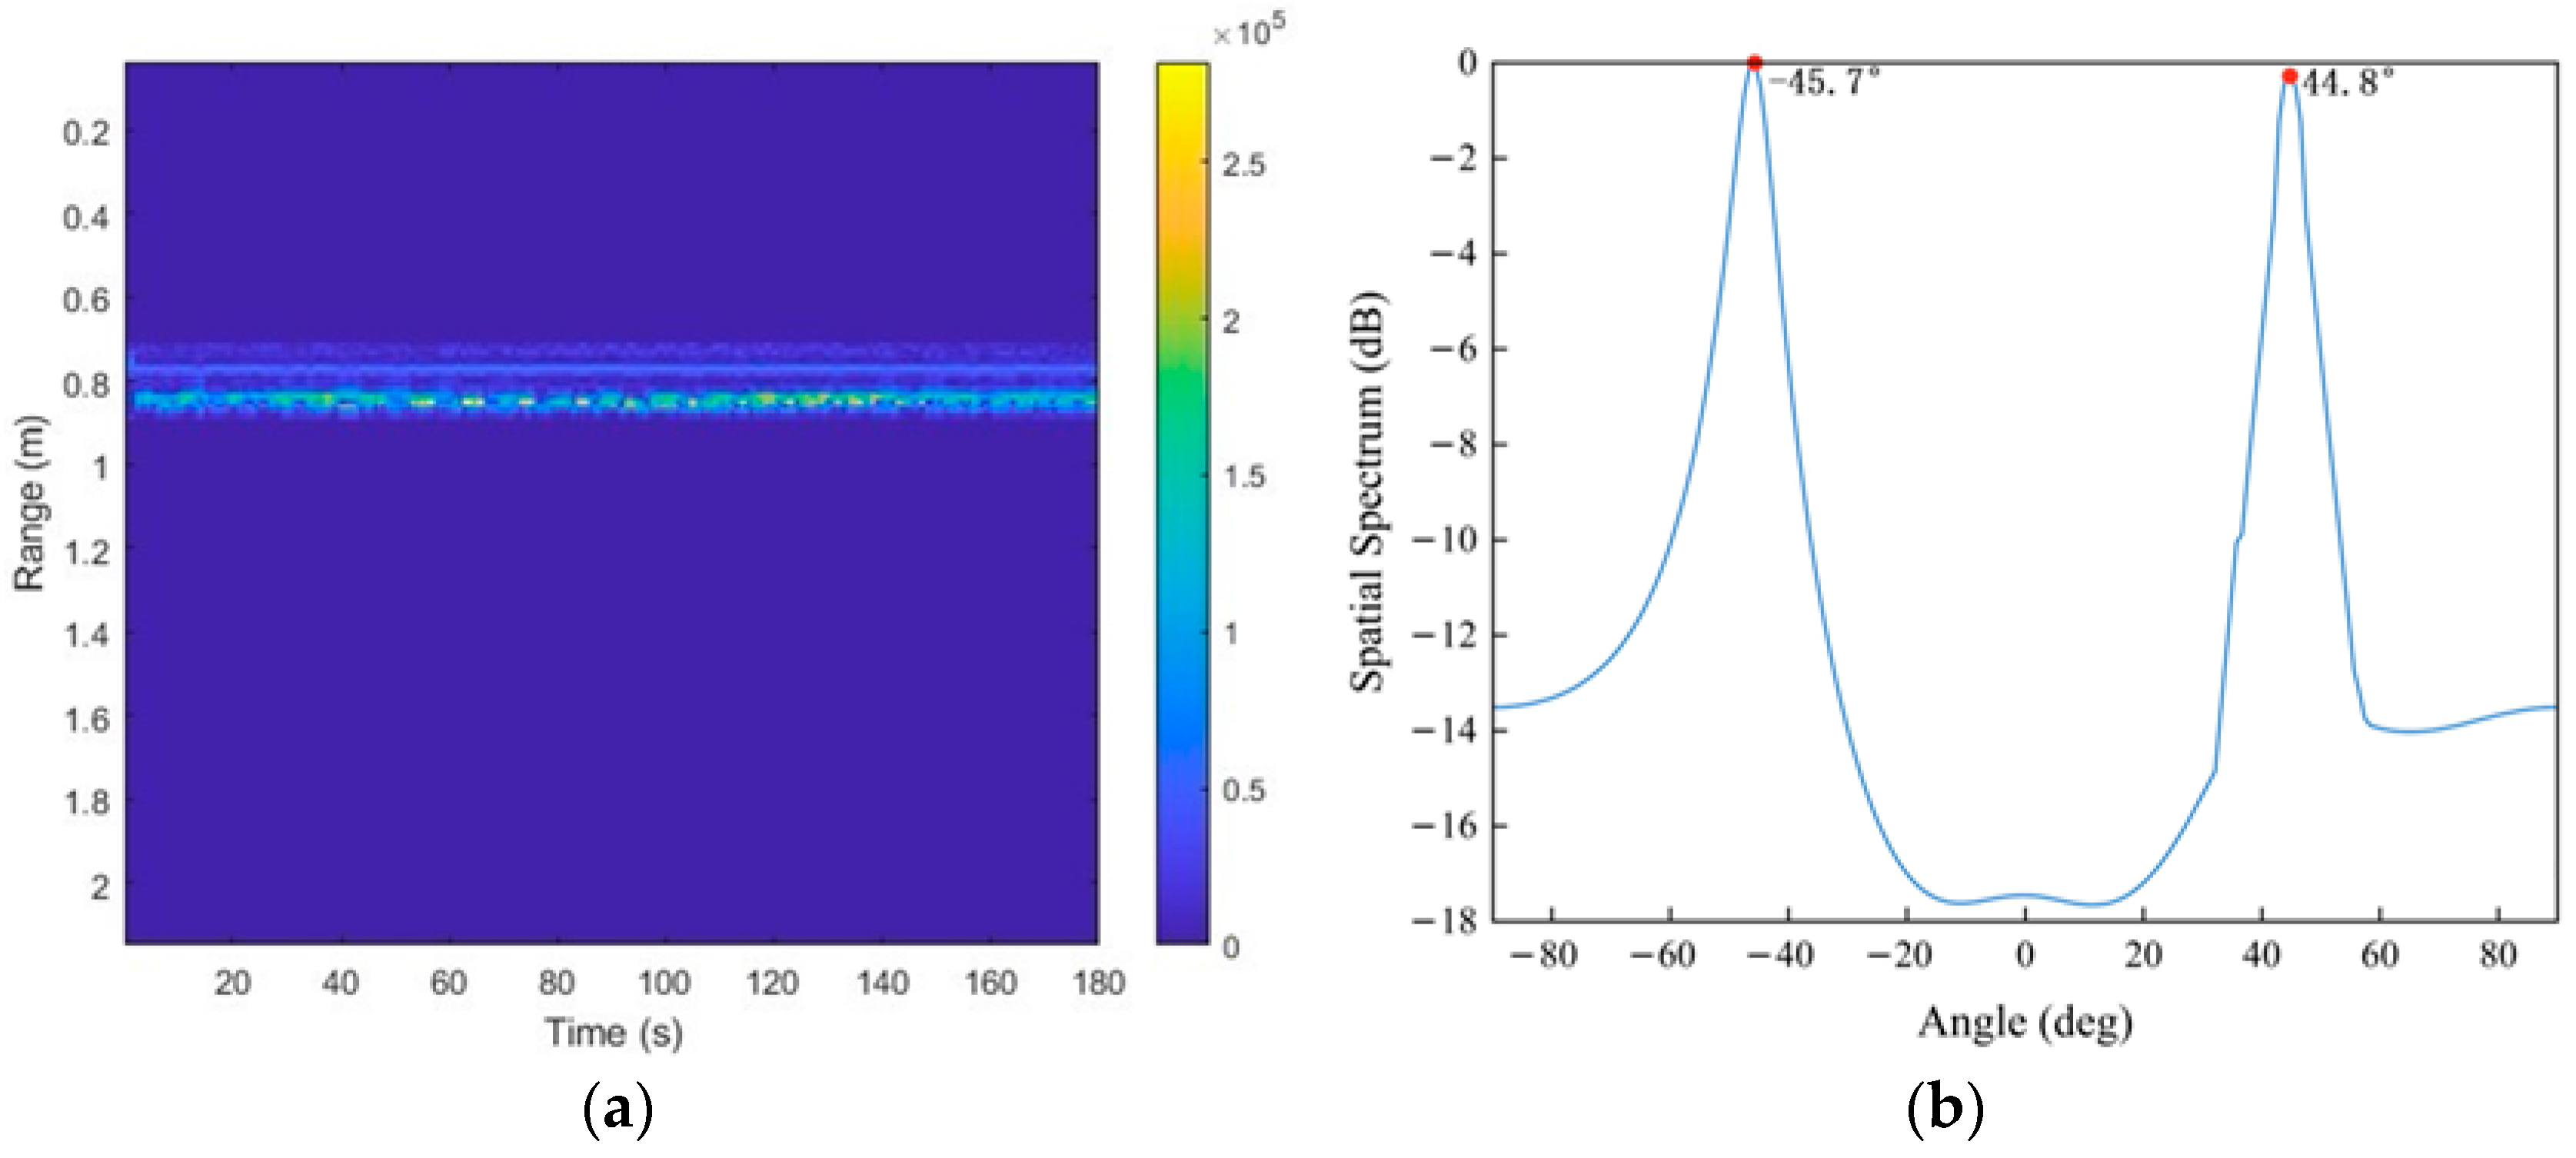
To detect the target’s position, a distance-domain FFT is applied to the microwave data, selecting the distance unit with the maximum amplitude and extracting the corresponding phase signal, as shown in Figure 9a. By combining the signal source angle extracted during spatial registration, illustrated in Figure 9b.
Due to the presence of phase wrapping, phase unwrapping is necessary to obtain the complete phase variation. Given the weak amplitude of heartbeats, phase differencing is applied to enhance the heart rate signal, resulting in the preprocessed microwave signal, as shown in Figure 10.
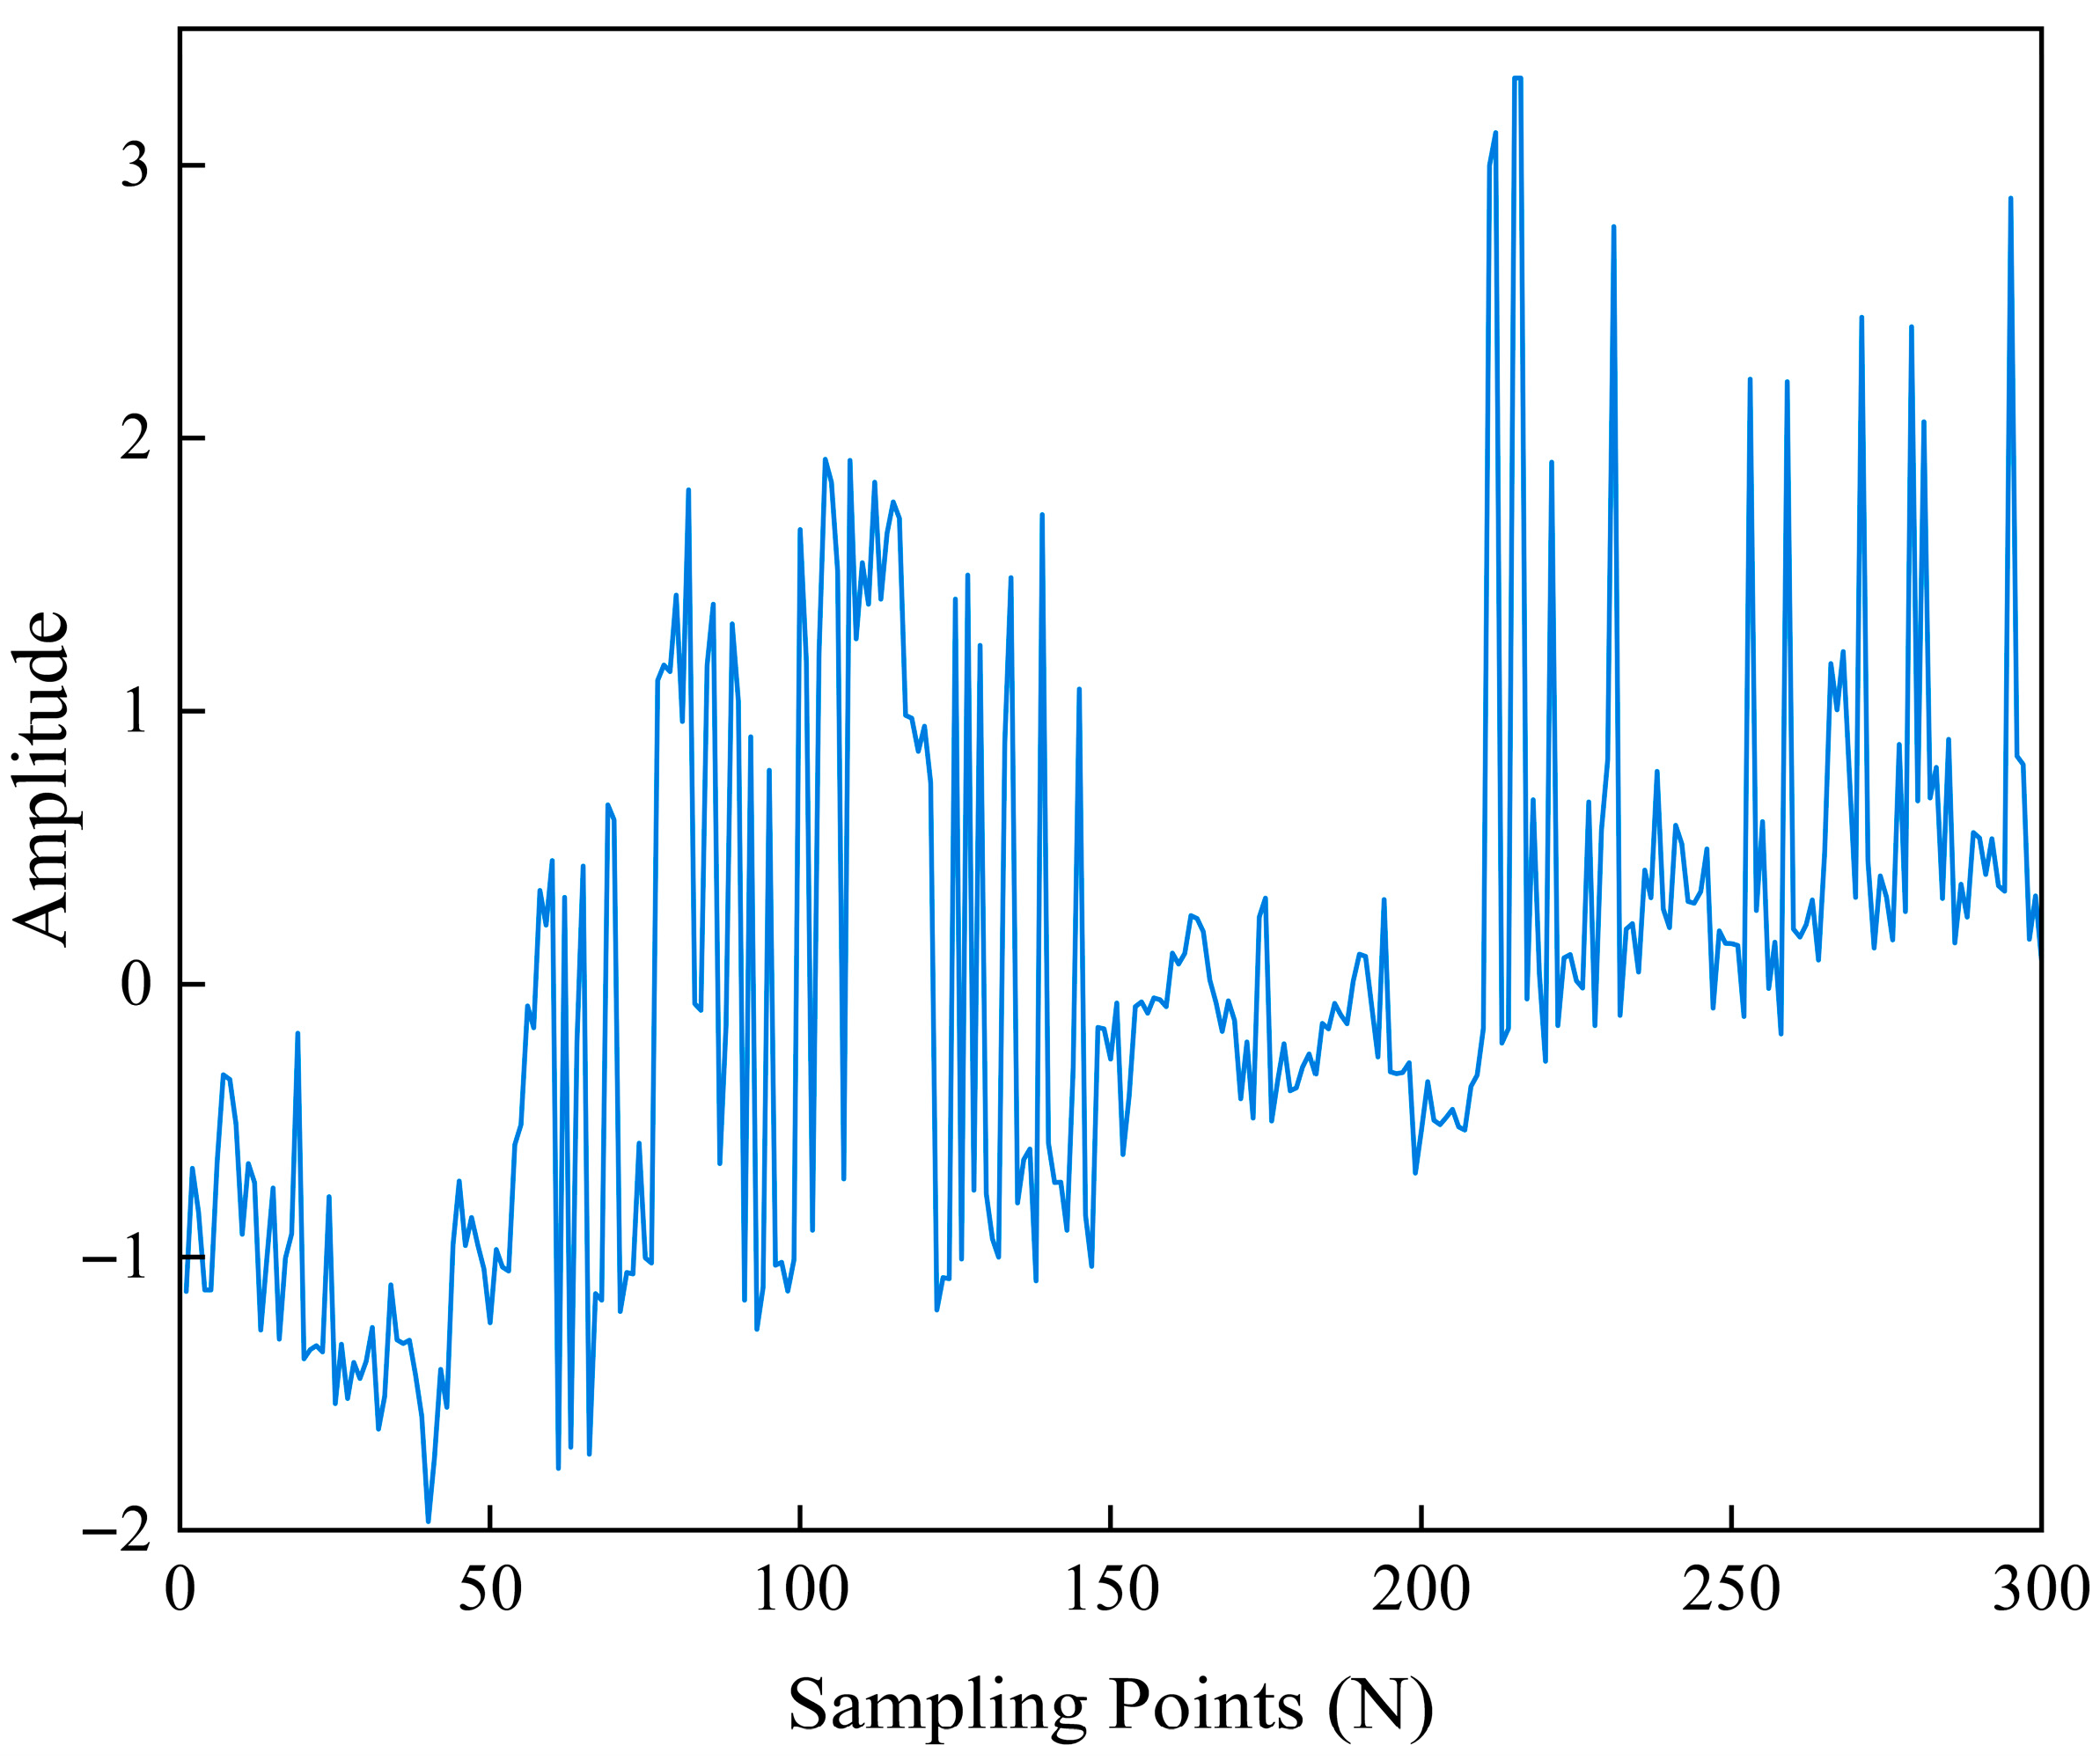
The number of facial images extracted is n = f r t , where f r is the camera frame rate, set at 30 frames per second, and t is the duration of the video. Since the green (G) channel in the RGB color space has the lowest mean squared error (MSE) for heart rate analysis based on rPPG [22], this study separates the three channels of the RGB images and extracts the green channel data, which contains rich information about human vascular changes, as shown in Figure 11.
The volume wave data of 30 images within 1 s is extracted using a standardized Equation (2):
x r P P G = x m e a n x σ x
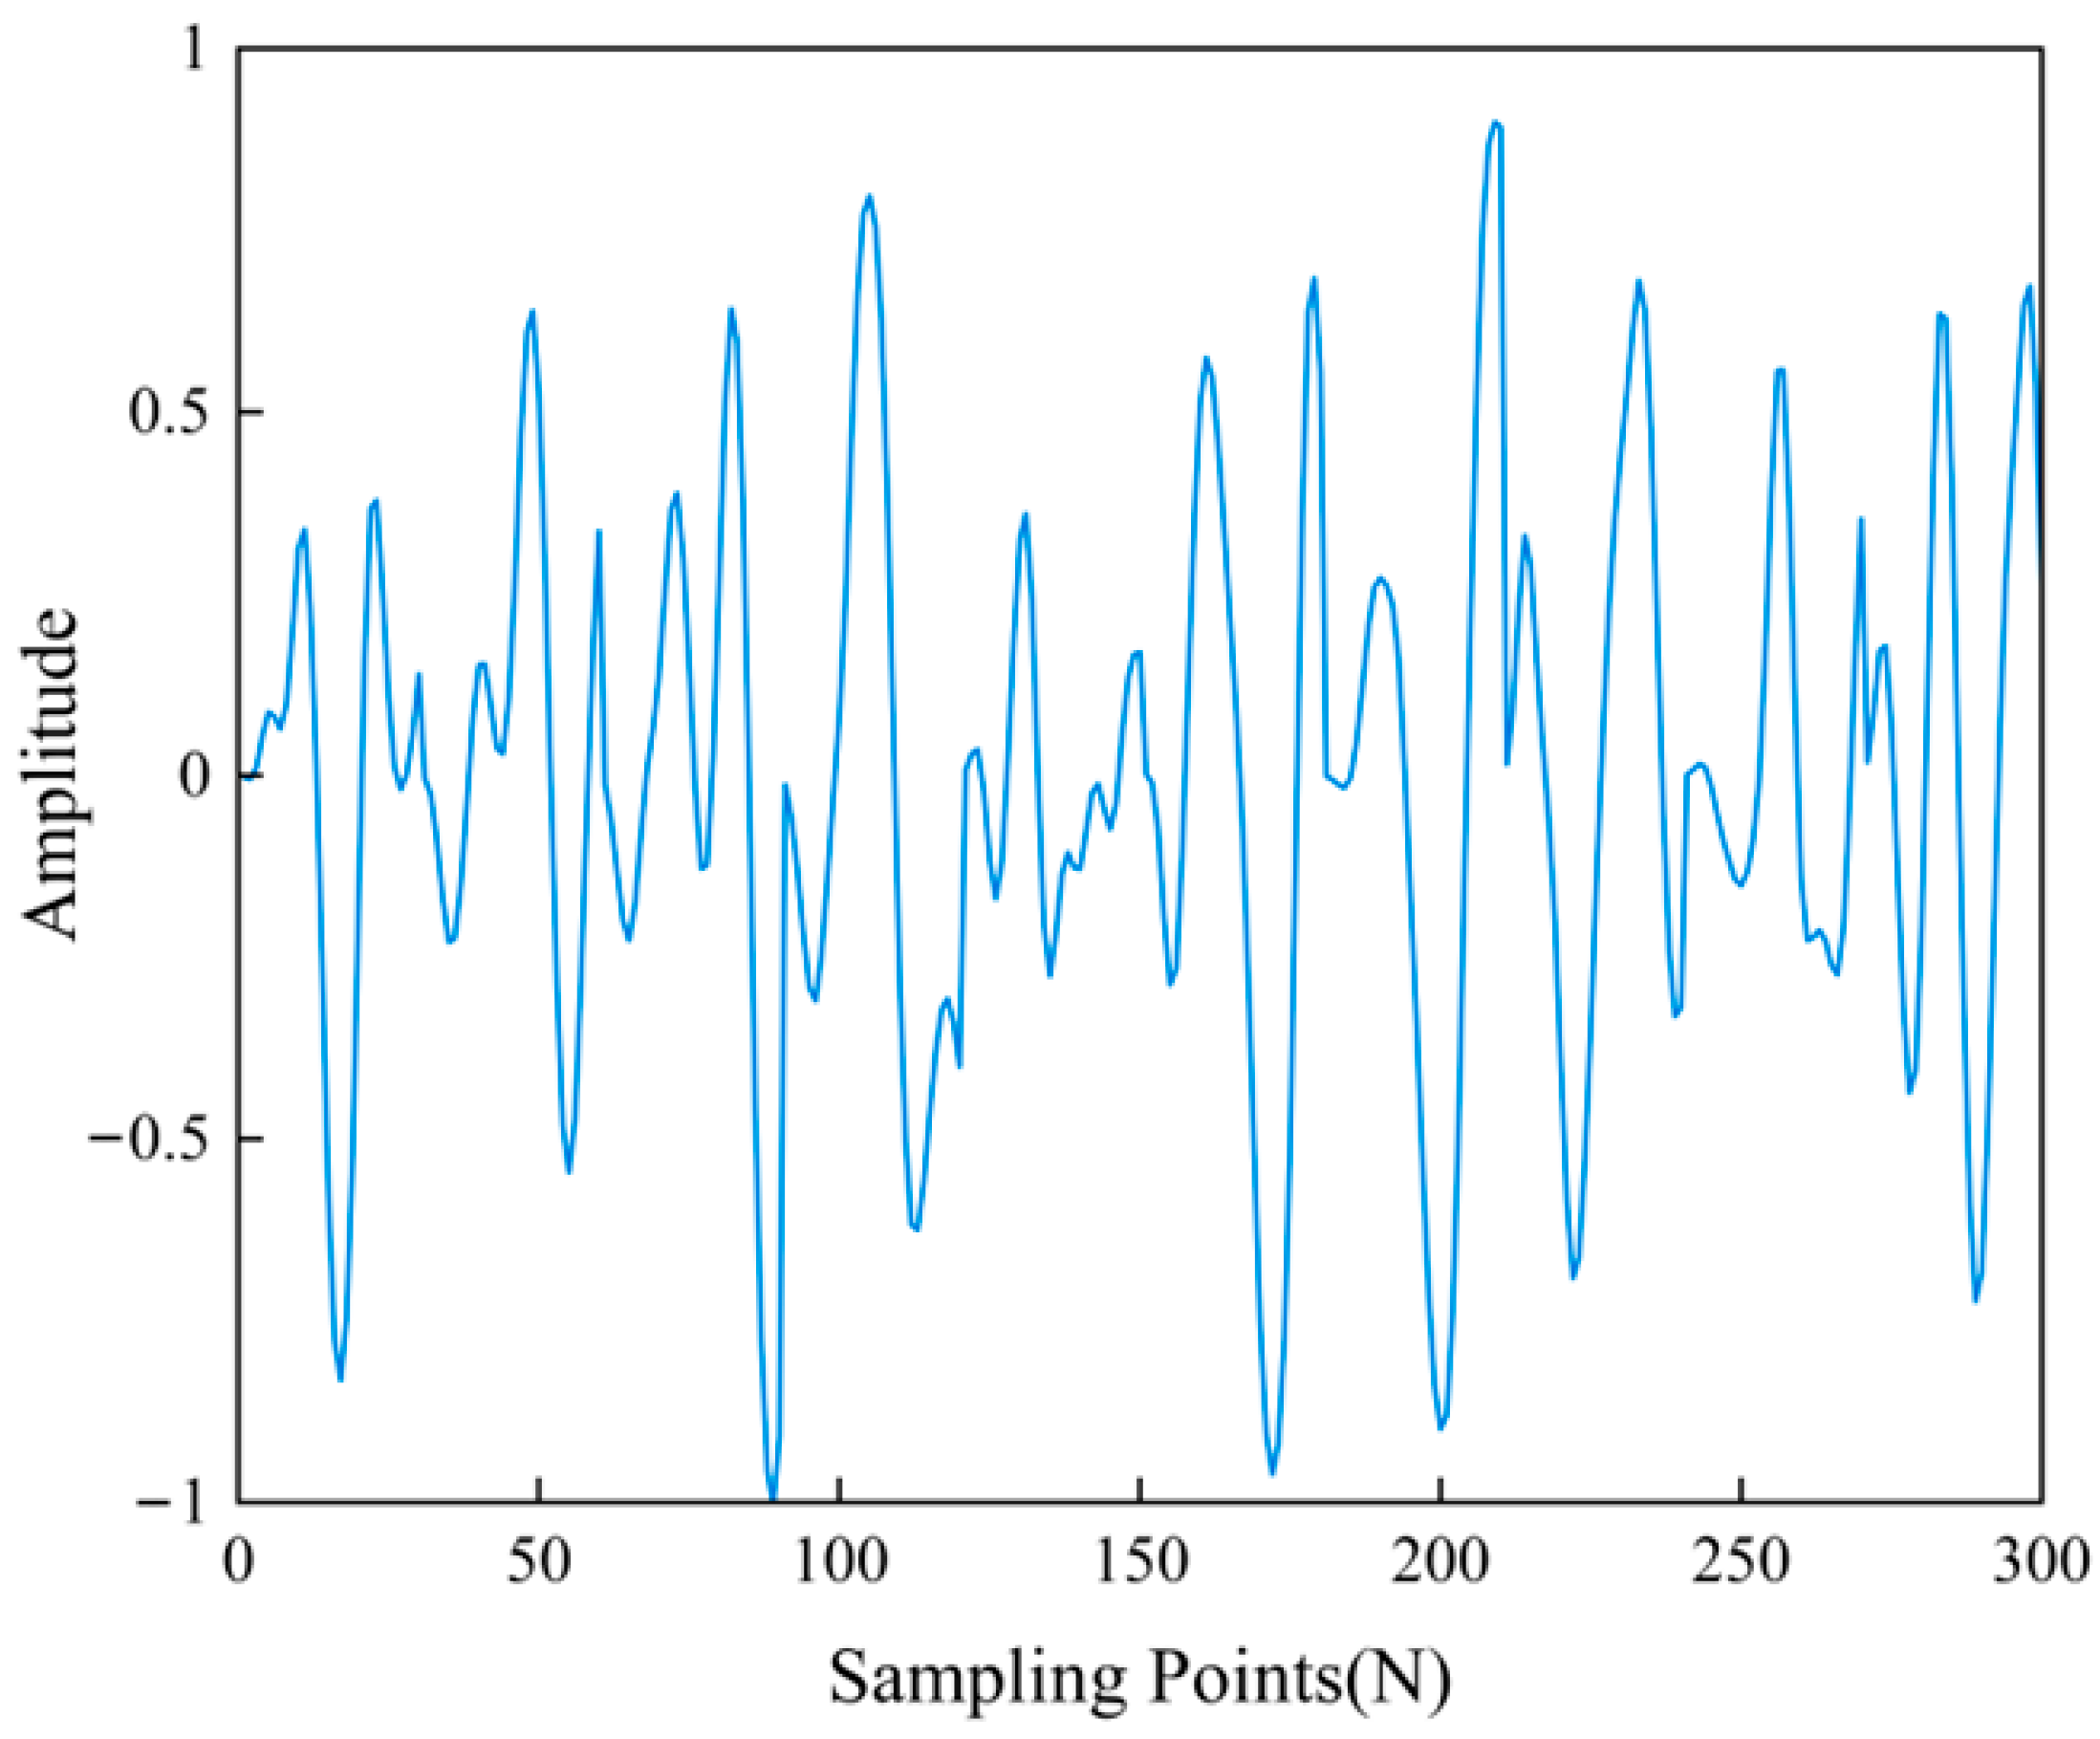
The data is input into a Butterworth bandpass filter with a passband frequency of 0.8–3 Hz to obtain the preprocessed video data, as illustrated in Figure 12.

2.2.2. Feature Fusion Module

To address the challenge of extracting meaningful heart rate information from heterogeneous multi-modal data, we developed a comprehensive feature fusion framework specifically designed for our radar-camera system. Our approach systematically combines temporal, spectral, and complexity features, each selected and optimized for heart rate classification in our dual-modality monitoring system.
When dealing with high-dimensional signals from different sensing modalities, feature extraction becomes critical for effective dimensionality reduction while preserving physiologically relevant information. To comprehensively study the relationship between the data and heart rate, this study extracts time domain features, frequency domain features, and nonlinear features from the preprocessed microwave data and volume wave data [23,24].
Given that heart rate signals are temporal signals, time domain features offer significant advantages in representing signal amplitude and time scale [25]. Additionally, time domain features have the benefit of low computational complexity. The mathematical properties of different feature types provide theoretical justification for our experimental approach. Time-domain features capture the direct amplitude and temporal characteristics of heartbeat signals, which mathematically correspond to the first- and second-order statistical moments. Frequency-domain features, obtained through FFT transformation, theoretically represent the spectral energy distribution that correlates with heart rate variability. The nonlinear entropy measures quantify signal complexity, which theoretically should differ between normal and abnormal heart rate patterns. This mathematical foundation supports our choice of 58-dimensional feature space and demonstrates why feature-level fusion is theoretically optimal for combining the complementary information from radar and video modalities.
Consequently, this paper extracts a series of temporal features, where the mean indicates variations in heart rate frequency, the standard deviation reflects the dispersion of the heart rate signal in the frequency domain, and kurtosis measures the degree of peakedness or flatness of the heart rate signal’s tail.
Frequency domain analysis converts the heart rate signal, which varies in amplitude over time, into the heart rate power spectrum that varies with frequency, and converts the time domain signal of each frequency band into the frequency domain signal through fast Fourier transform. Four frequency-domain features are extracted in this study, which are defined as follows:
The centroid frequency represents the frequency at which the larger components of the heart rate signal in the frequency spectrum. The average frequency reflects the magnitude of the energy of the heart rate signal. The frequency variance reflects the degree of dispersion of the heart rate signal in the frequency domain. The root mean square (RMS) frequency reflects the position of the main frequency band in the spectrum.
Entropy characterizes the overall features of the source in an average sense and can be used to evaluate the irregularity and complexity of nonlinear dynamic signals, making it widely applicable across various fields [26,27,28]. Since the difficulty in identifying relevant time scales within the time series, this study employs multiscale entropy to extract effective information from the original sequence across different time scales.
Using the multiscale concept, multiple time scales are derived from the time series by downsampling the original heartbeat signal. The original signal is divided into several non-overlapping frames, each of length τ. By calculating the mean value of the data points within each frame, the coarse-grained signals of each scale factor are obtained, as shown in Equation (3):
y t = 1 τ x i t τ i = t 1 τ + 1 , 1 t N τ
Chen et al. proposed Fuzzy Entropy (FuzzyEn) to improve the consistency of one-dimensional entropy measurement, particularly for short signals [29]. Studies have shown that compared with sample entropy, FuzzyEn exhibits continuous similarity behavior and more flexible parameter selection, resulting in smoother outcomes. For the m-dimensional heartbeat time series signal x i , x i m is defined as an m dimensional vector, with the formula as shown in Equation (4):
x i m = x i , x i + 1 , , x i + m 1
The distance d i , j m between two templates x i m and x j m can be defined as the maximum absolute difference between the templates, which is mathematically expressed as Equation (5):
d i , j m = m a x k 0 , 1 , , m 1 | x i m k x j m k | , i j
Here, d i , j m is the final scalar distance value between the two templates. The calculation process uses k as an index variable, where k 0 , 1 , , m 1 represents the position index within the m-dimensional vectors, x i m k denotes the k-th element of template x i m , x j m k denotes the k-th element of template x j m , and the max operation finds the largest absolute difference among all m element-wise comparisons.
This approach follows the Chebyshev distance metric commonly used in fuzzy entropy calculations. Once d i , j m is calculated for each template pair, this scalar distance value is then used in subsequent similarity calculations.
The similarity between two templates is defined as the tolerance r , fuzzy power n , and the distance D i , j m between the templates, as shown in Equation (6):
D i , j m n , r = e d i , j m n r , i j
The function ϕ m n , r is determined by the average similarity, as shown in Equation (7):
ϕ m n , r = 1 N m i = 1 N m 1 N m 1 j = 1 , i j N m D i , j m n , r
Similarly, ϕ m + 1 n , r is defined by using the similarity values D i , j m + 1 of m + 1 points; the F u z z y E n of the heartbeat signal can be calculated as Equation (8):
F u z z y E n m , n , r = ln ϕ m n , r ϕ m + 1 n , r
The selection of mathematical parameters in our entropy calculations is guided by practical signal characteristics. The tolerance parameter r and dimension m in both Fuzzy Entropy and Approximate Entropy are chosen based on the observed noise levels and temporal patterns in our experimental heartbeat data, ensuring that the mathematical model accurately reflects the physical properties of the measured signals.
Approximate entropy (ApEn) was proposed from the perspective of measuring the complexity of signal sequences, specifically to quantify the self-similarity of a time series in terms of its patterns. Use x i to represent N-dimensional time series. The m-dimensional vectors are reconstructed from x i m , denoted as Equation (9):
x i m = x i , x i + 1 , , x i + m 1
The conditional probability C i m r represents the relative frequency (probability) that templates similar to x i m exist within the similarity threshold r . This function evaluates whether the distance between templates is within the acceptable threshold r , as shown in Equation (10):
C i m r = θ r max x i m x j m N m + 1
where C i m r represents the conditional probability that templates similar to x i m exist within the similarity threshold r. In this formula, θ is the Heaviside step function, where θ x = 1 if x 0 and θ x = 0 if x < 0 , m a x | x i m x j m | refers to the distance value d i , j m that was previously calculated using Equation (5), the condition evaluates whether this pre-calculated distance falls within the tolerance r , and N m + 1 is the normalization factor representing the total number of template comparisons.
Note that there is no maximization operation performed within Formula (10) itself—the max term simply refers to the distance values computed earlier in Formula (5).
The function ϕ m r can be expressed as Equation (11):
ϕ m r = 1 N m + 1 i = 1 N m + 1 ln C i m r
Finally, the A p E n of the signal is calculated as Equation (12):
A p E n m , r = ϕ m r ϕ m + 1 r
The preprocessed microwave signals and volumetric wave data undergo temporal, frequency, and nonlinear feature extraction. Specifically, there are 15 temporal features, 4 frequency features, and 10 nonlinear signal features. After concatenating these features, a signal feature set with a dimensionality of 58 is obtained.

2.2.3. Multi-Source Data Fusion and Classification

Data fusion methods are mainly categorized into data-level fusion, feature-level fusion, and decision-level fusion. Due to the high computational complexity associated with data-level fusion and the potential for suboptimal performance in one dataset with decision-level fusion, this study uses feature-level fusion to achieve data fusion. Feature concatenation fusion, one of the primary methods of feature-level fusion, combines multiple types of signal features to form a new feature set. After performing feature concatenation, a signal feature set with a dimensionality of 58 is obtained.
Due to the high dimensionality of the features, directly inputting all 58 features into the classifier may lead to poor generalization performance of the model. Therefore, it is necessary to perform feature selection. The evaluation criteria for feature subsets can be primarily classified into filter and wrapper methods. Filter methods only rely on the feature set itself, selecting the optimal feature subset based on predefined thresholds. In contrast, wrapper methods depend on the classification results, evaluating signal features through the classification effect to obtain the optimal feature subset.
The maximum relevance minimum redundancy (mRMR) algorithm is a filtering method that utilizes the correlation and redundancy of features to filter out irrelevant features. It adheres to the principle of maximum relevance, selecting the features that are most correlated with the classification categories of the samples, with higher correlation indicating more effective features [30]. The higher the correlation between features, the greater the redundancy [31]. To reduce redundancy, the minimum redundancy principle is employed to evaluate the degree of redundancy between features.
The Support Vector Machine-Recursive Feature Elimination (SVM_RFE) algorithm constructs a ranking criterion for features based on the absolute value of the weight of each dimension in the SVM hyperplane [32]. It recursively eliminates the least significant signal features from the feature set, classifying it as a wrapper method. The SVM_RFE algorithm iteratively trains the SVM classifier until the number of remaining features reaches the specified requirement. This algorithm effectively reduces redundancy among features and provides strong interpretability.
In summary, mRMR focuses on the relationships among features to produce a feature subset with minimal redundancy and maximum correlation, while SVM_RFE considers the relationship between features and decisions, selecting the optimal feature subset based on classification performance. To combine the advantages of both algorithms, this study uses a combination of the mRMR and SVM_RFE algorithms for feature selection. After applying the hybrid feature selection algorithm, the feature dimensionality is reduced from 58 to 25. When assessing feature importance using the SVM classifier, the threshold for retaining feature dimensions is set at 2000, with a penalty parameter c of 4 and an RBF parameter g of 0.2.
When selecting a classifier, the longer training time of neural networks results in low training efficiency for this study. Therefore, machine learning methods are used for heart rate signal classification. Among the various classifiers, SVM is based on the principle of structural risk minimization and offers the advantages of requiring fewer training samples and having strong generalization capabilities [33].
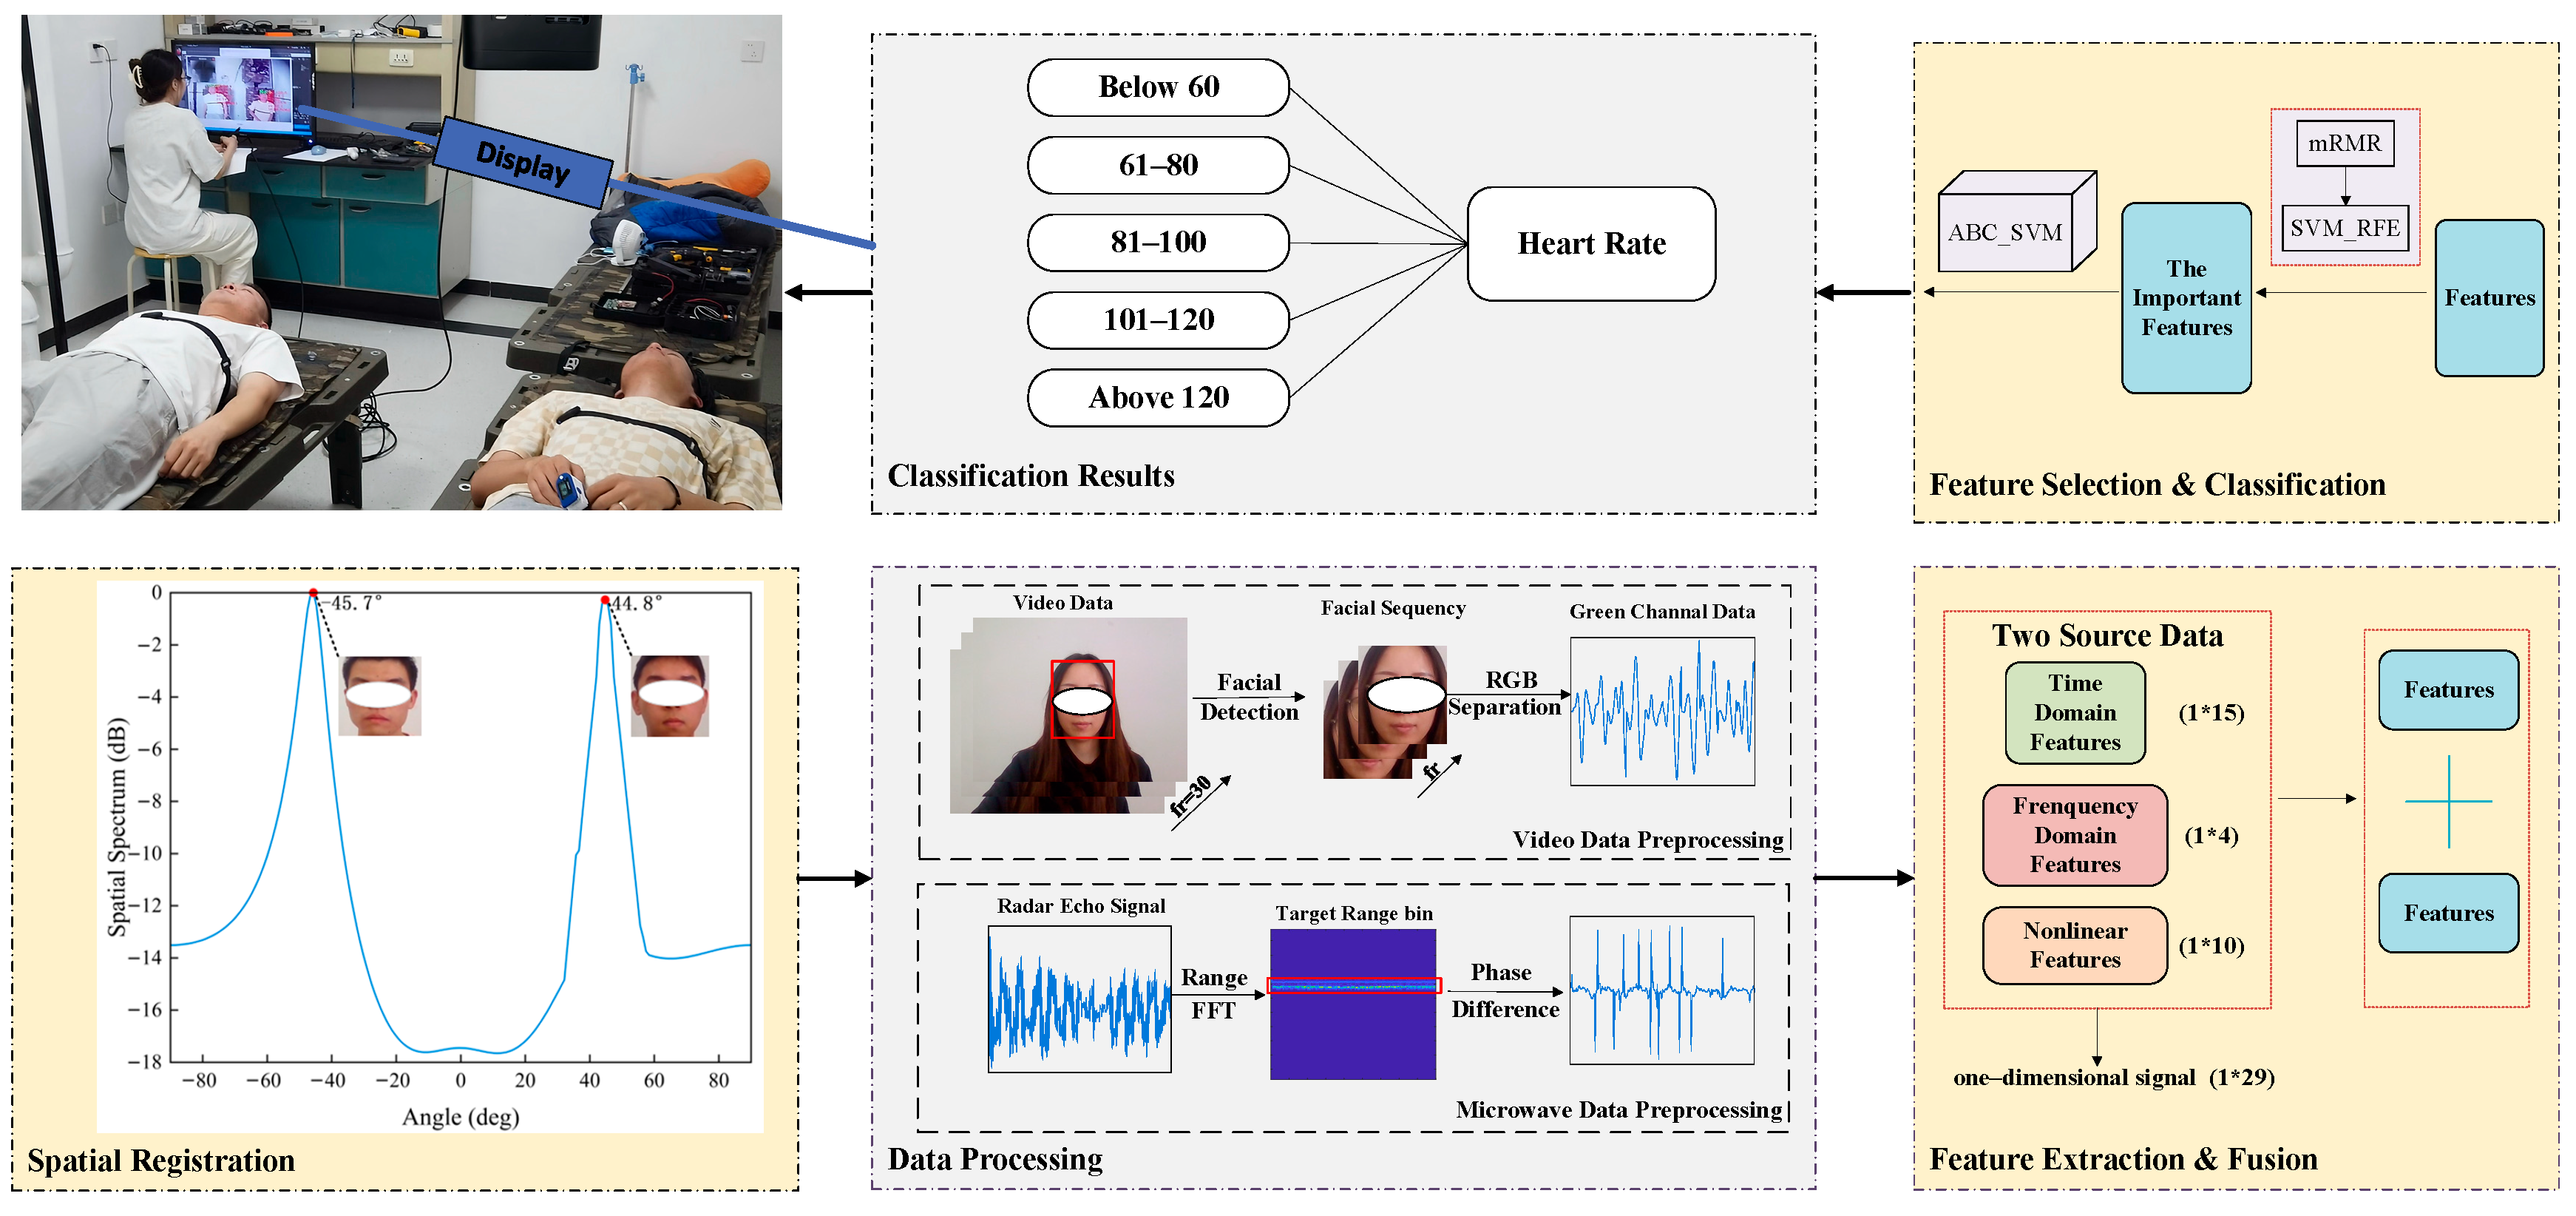
In the application of SVM, the penalty factor c and the radial basis function (RBF) parameter g need to be set manually, and researchers have limited the accuracy of the classifier by inputting these values based on experience. To further improve the performance of the heart rate classification model based on SVM, it is essential to find the optimal parameter values for c and g within the algorithm. Artificial Bee Colony (ABC) is a well-established algorithm known for its excellent convergence properties. Therefore, this study uses the ABC algorithm to optimize the SVM parameters, seeking the optimal combination of parameters (c, g) [34] and constructing an ABC_SVM-based heart rate classification model. The overall flowchart of this paper is shown in Figure 13.
When applying the SVM classifier based on ABC optimization for classification, set the number of food sources to 10, the number of times a honey source is not updated before initialization to 60, and the number of iterations to 30. The optimized parameters are c , g . The robustness of the program is evaluated by 5 runs of the ABC algorithm. The optimized penalty parameter c is 23.7, and the RBF parameter g is 0.28.

3. Results and Discussion

The experimental labels are set to 5 categories, corresponding to heart rates per minute as follows: below 60, 61–80, 81–100, 101–120, and above 120. Each heart rate interval spans 20 values. This label-setting method can effectively mark abnormal heart rate signals.
The obtained 9900 sets of feature data were inspected and cleaned to remove outliers, thereby restoring the objective authenticity of the data and yielding better analysis results. After data cleaning, 2731 sets of data were input into the network. Due to the difficulty in acquiring high heart rate data and its rapid decline, to prevent sample imbalance, the lower heart rate data was randomly sampled to match the number of high heart rate data, resulting in 1575 sets of feature data. In this study, 80% of the total data was selected as the training set and 20% as the test set, with the training set containing 1260 sets of data and the test set containing 315 sets of data.
In this experiment, the final training accuracy for heart rate classification is 74.8%, while the testing accuracy reaches 73.1%. When heart rates are above 120, the classification accuracy can achieve 89.9%, and for heart rates below 60, the classification accuracy reaches 75.8%. This indicates that the detection algorithm proposed in this paper has a high accuracy rate in detecting individuals with abnormal heart rates, validating the effectiveness of the proposed algorithm.
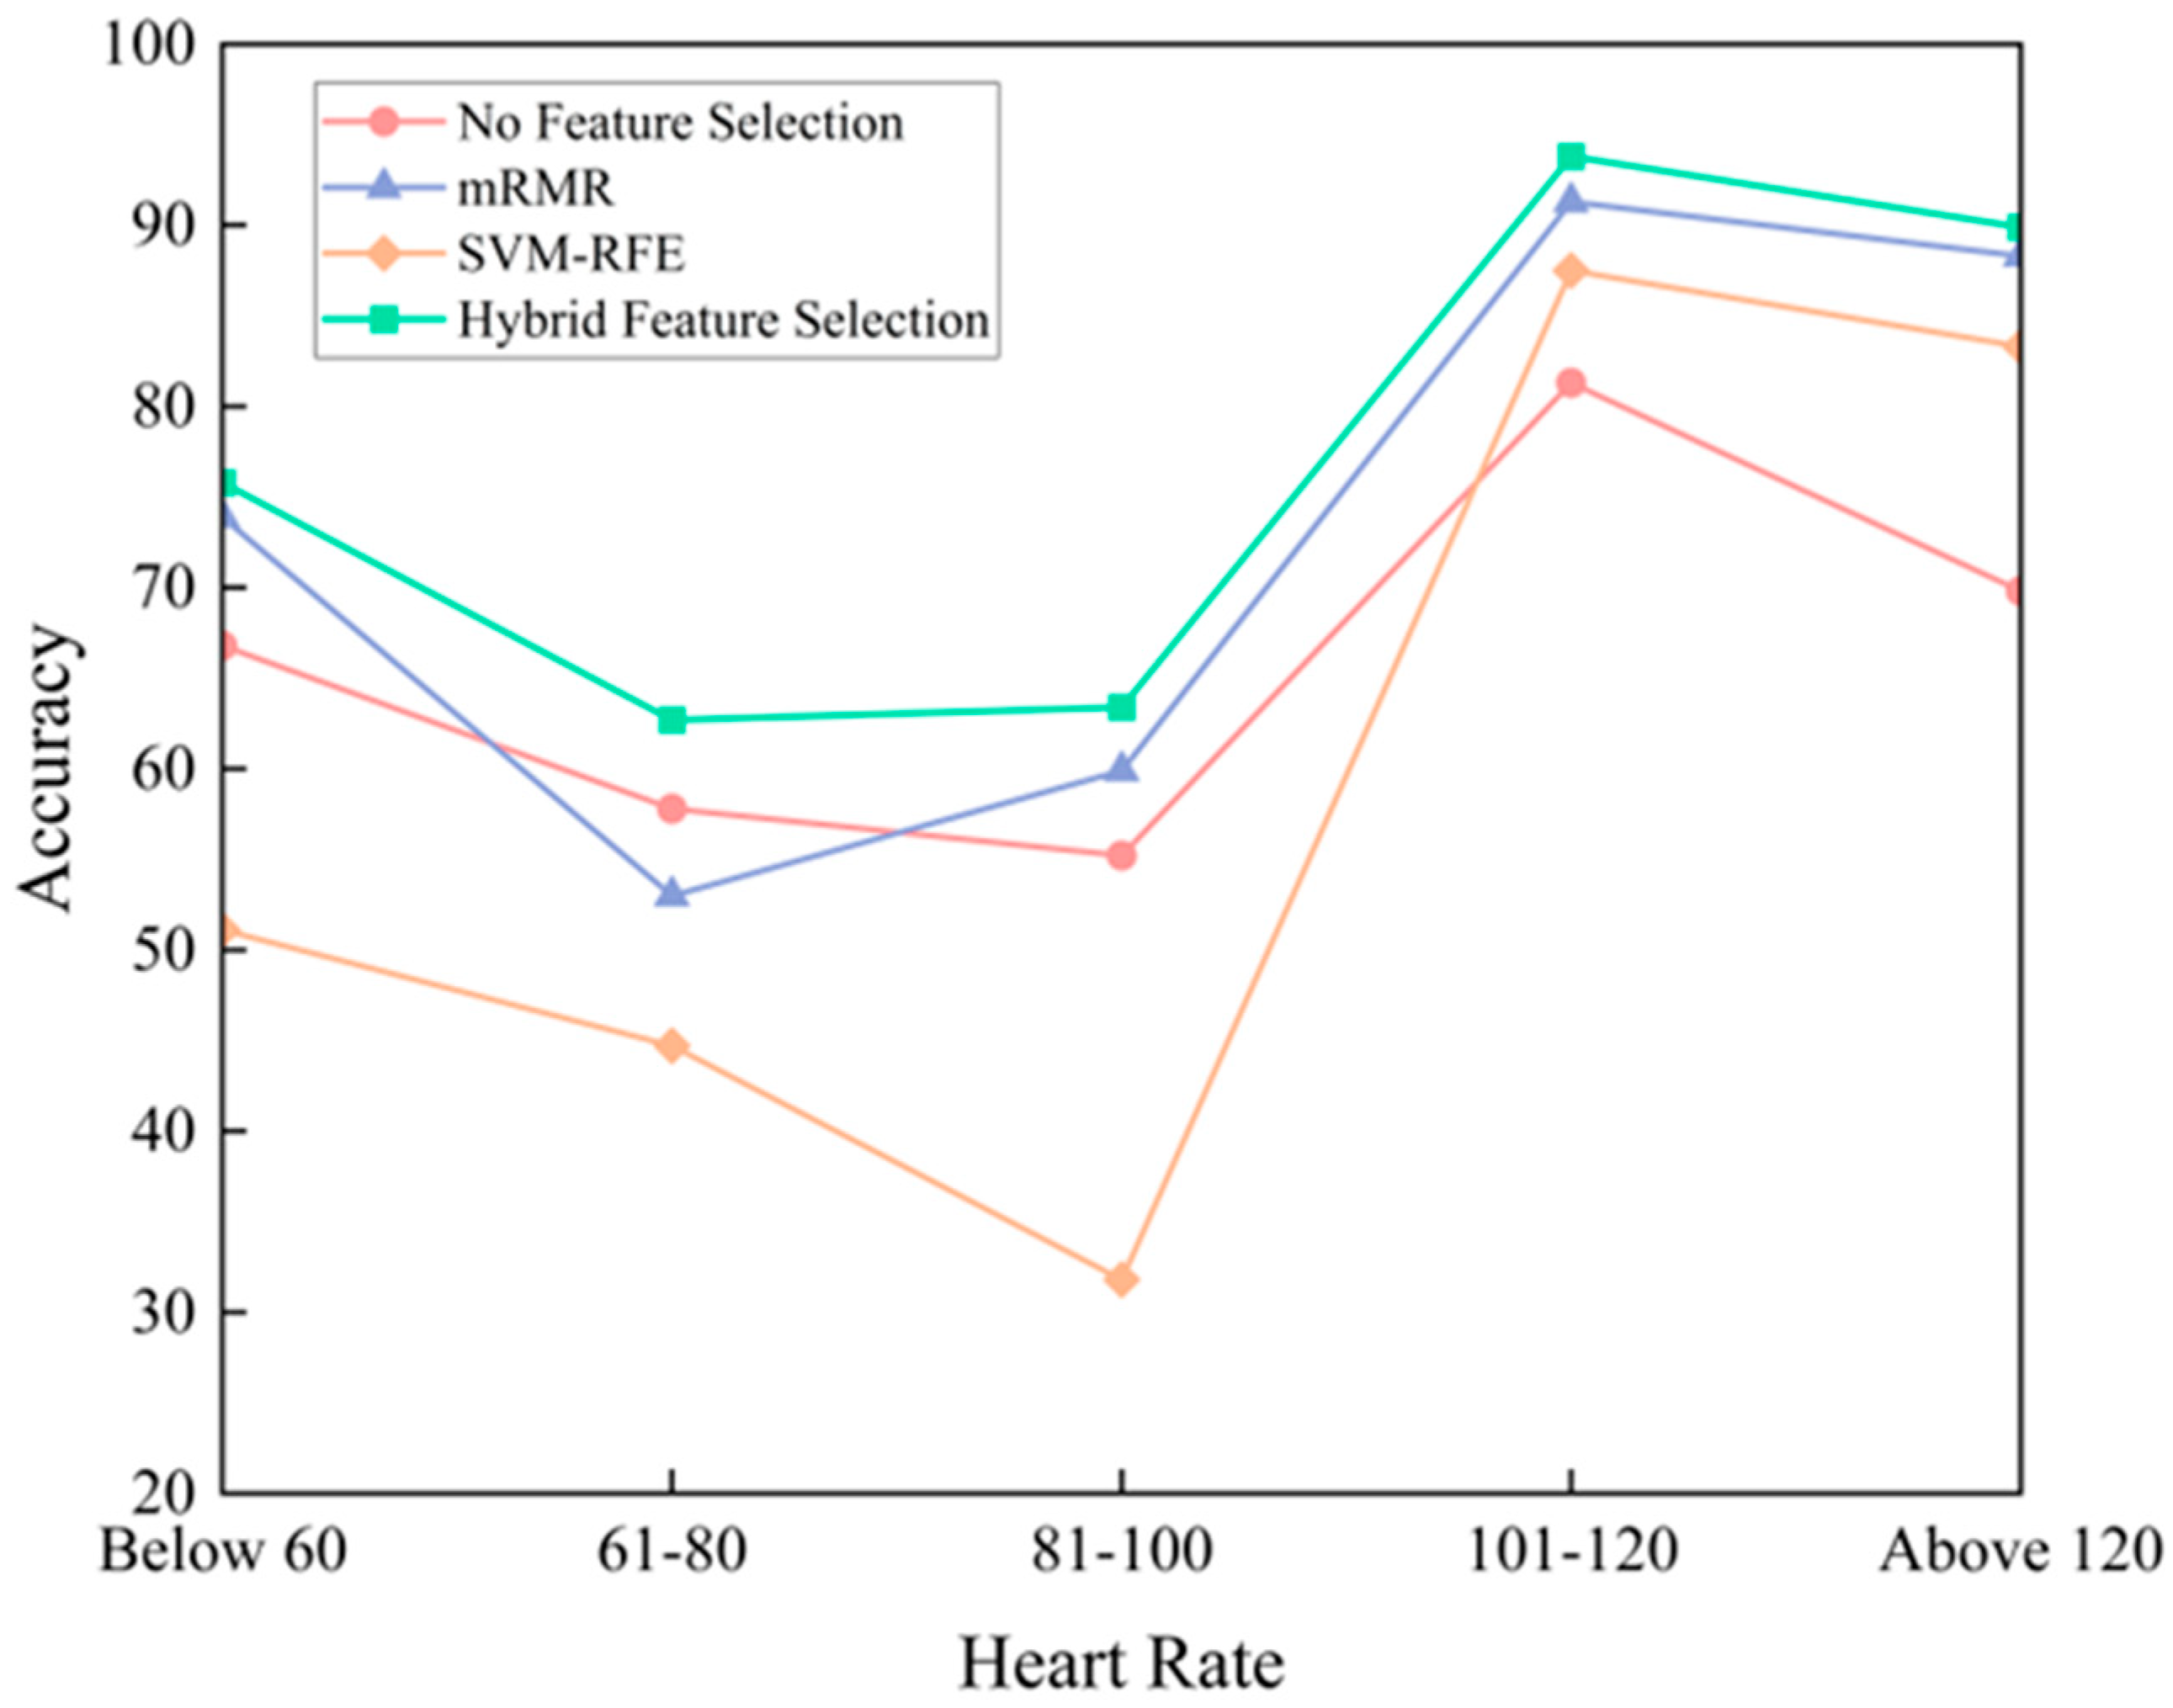
To show the validation of the proposed method, we also compare the proposed hybrid feature selection algorithm with other feature selection algorithms. Figure 14 shows the classification results of different algorithms, clearly demonstrating that the hybrid feature selection algorithm combining mRMR and SVM_RFE performs better, resulting in a higher quality feature subset.
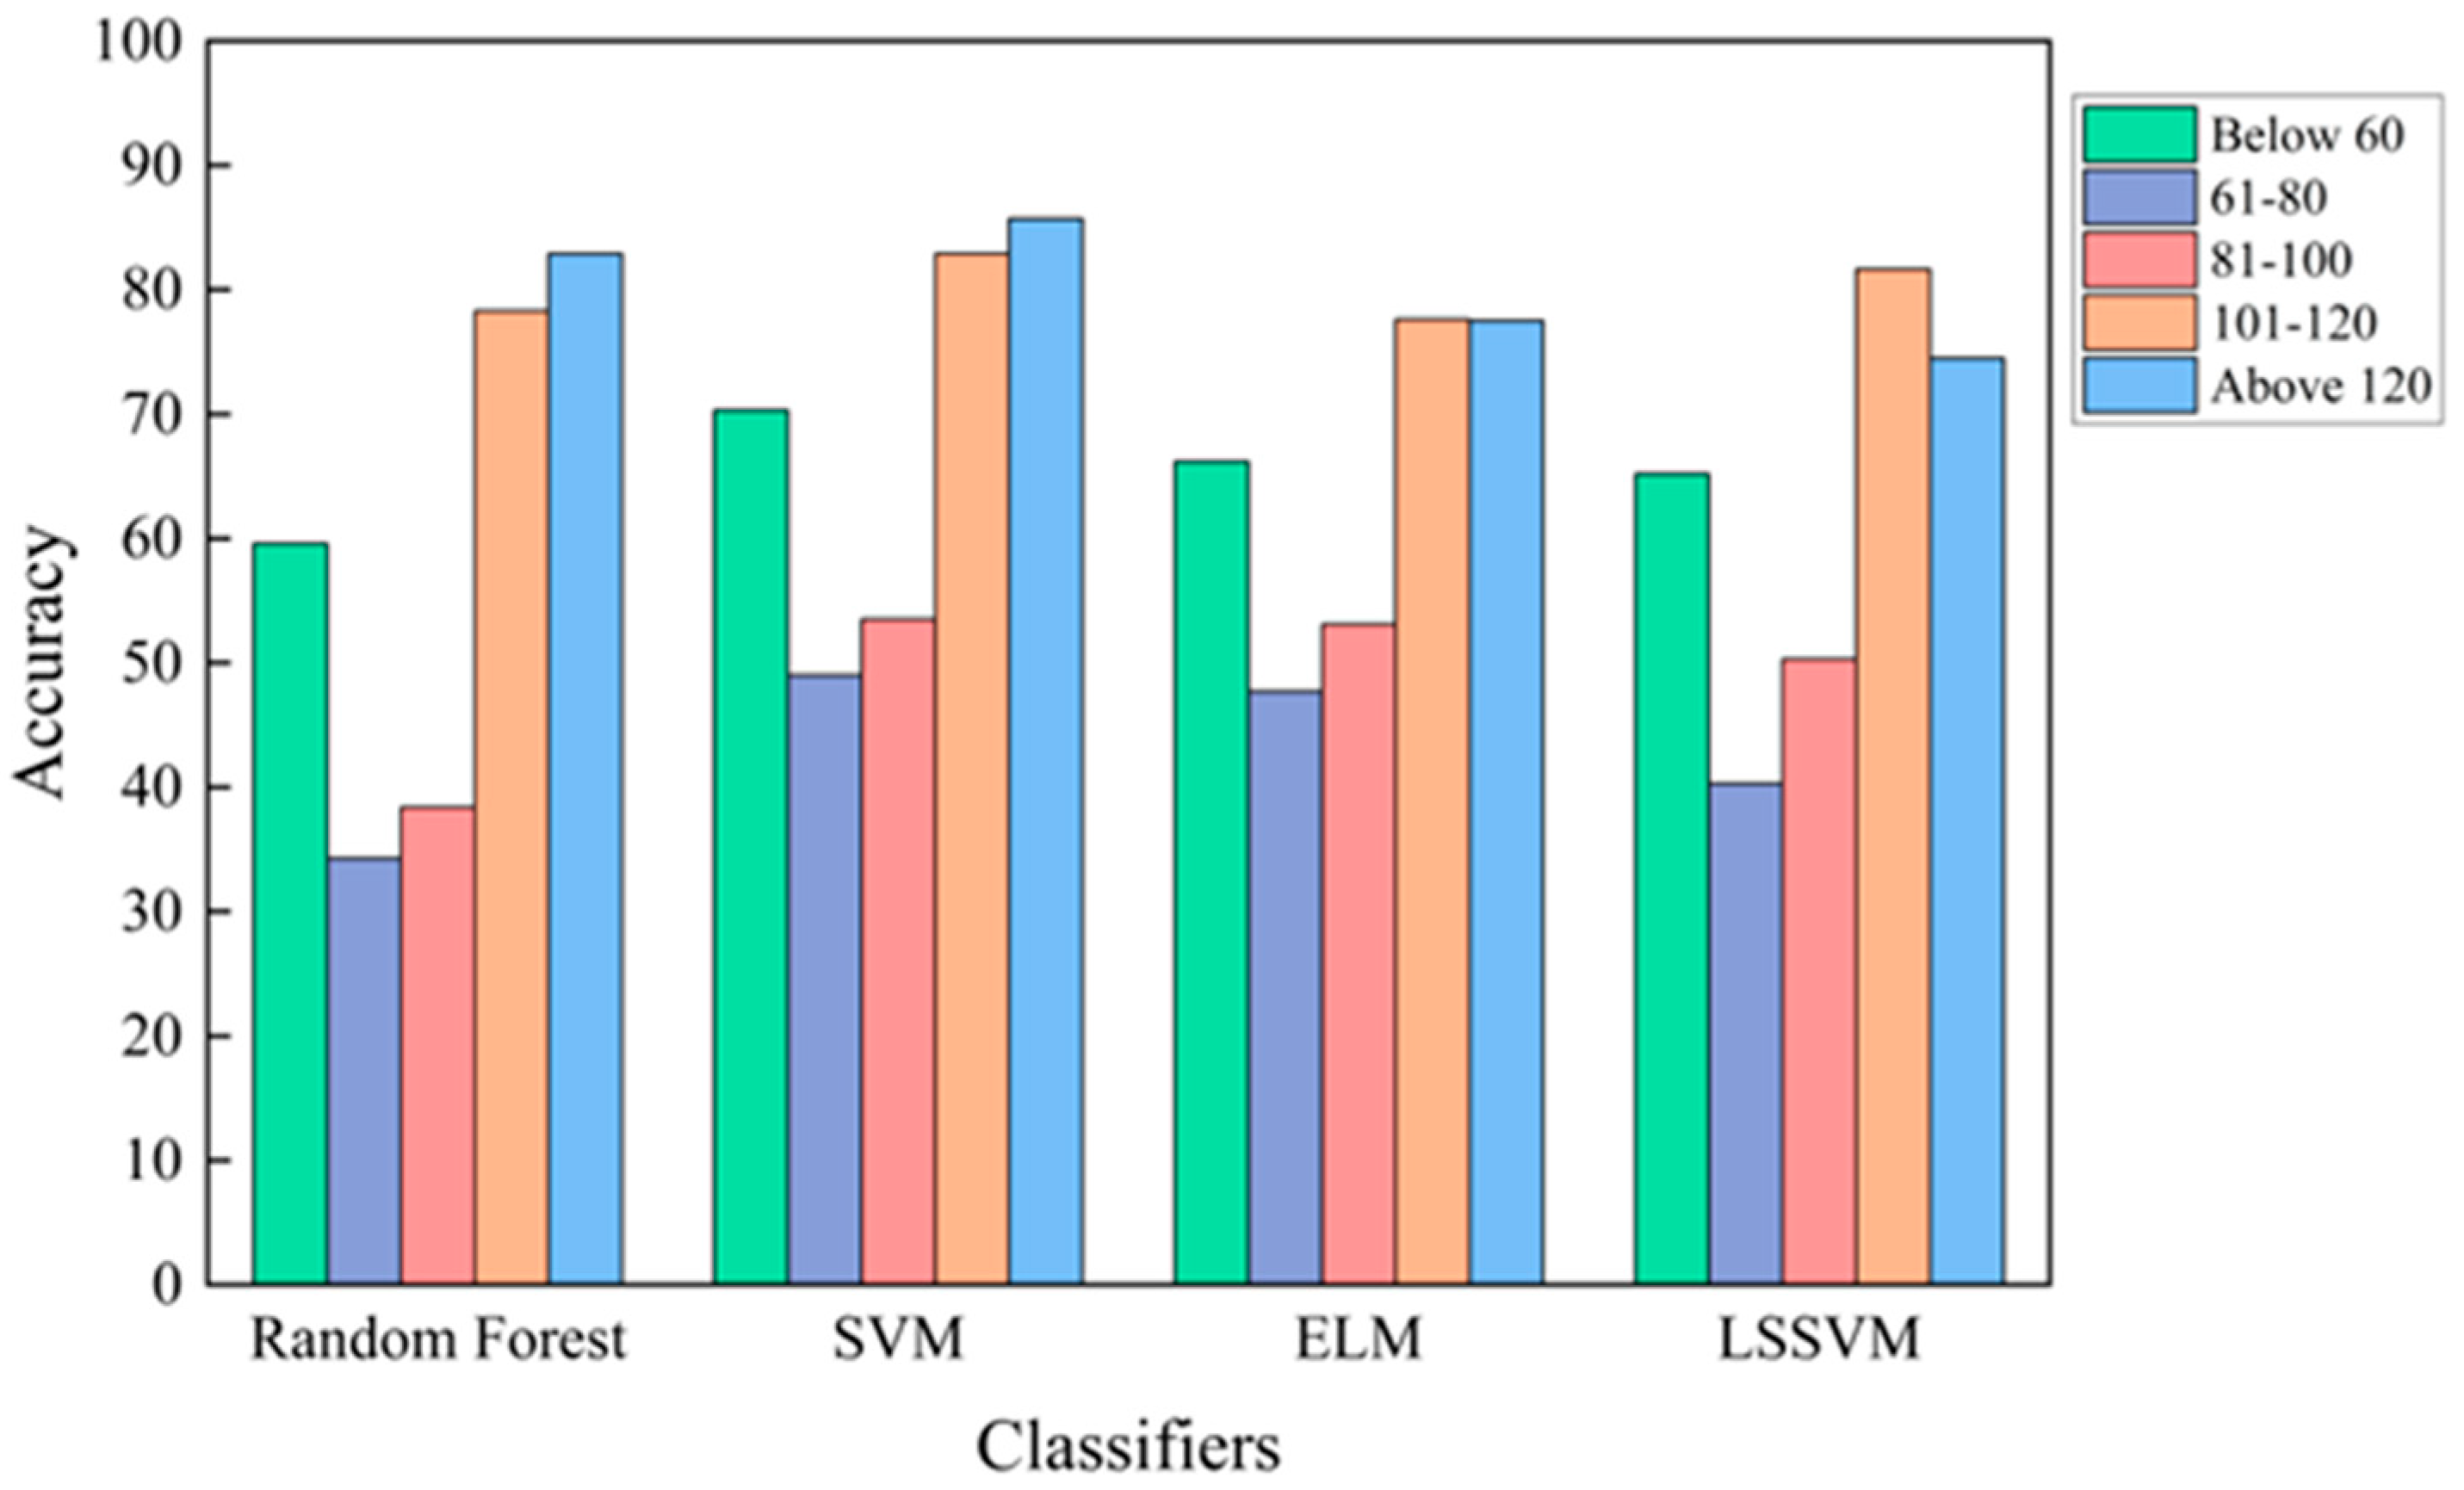
Figure 15 shows the classification results of different classifiers across all heart rate categories, and Table 2 compares the classification results and runtime of various machine learning methods. It is evident that the SVM classifier exhibits significant advantages over other classifiers, with shorter runtime and higher accuracy, particularly achieving superior performance for abnormal heart rate detection (Below 60 and Above 120 bpm categories).
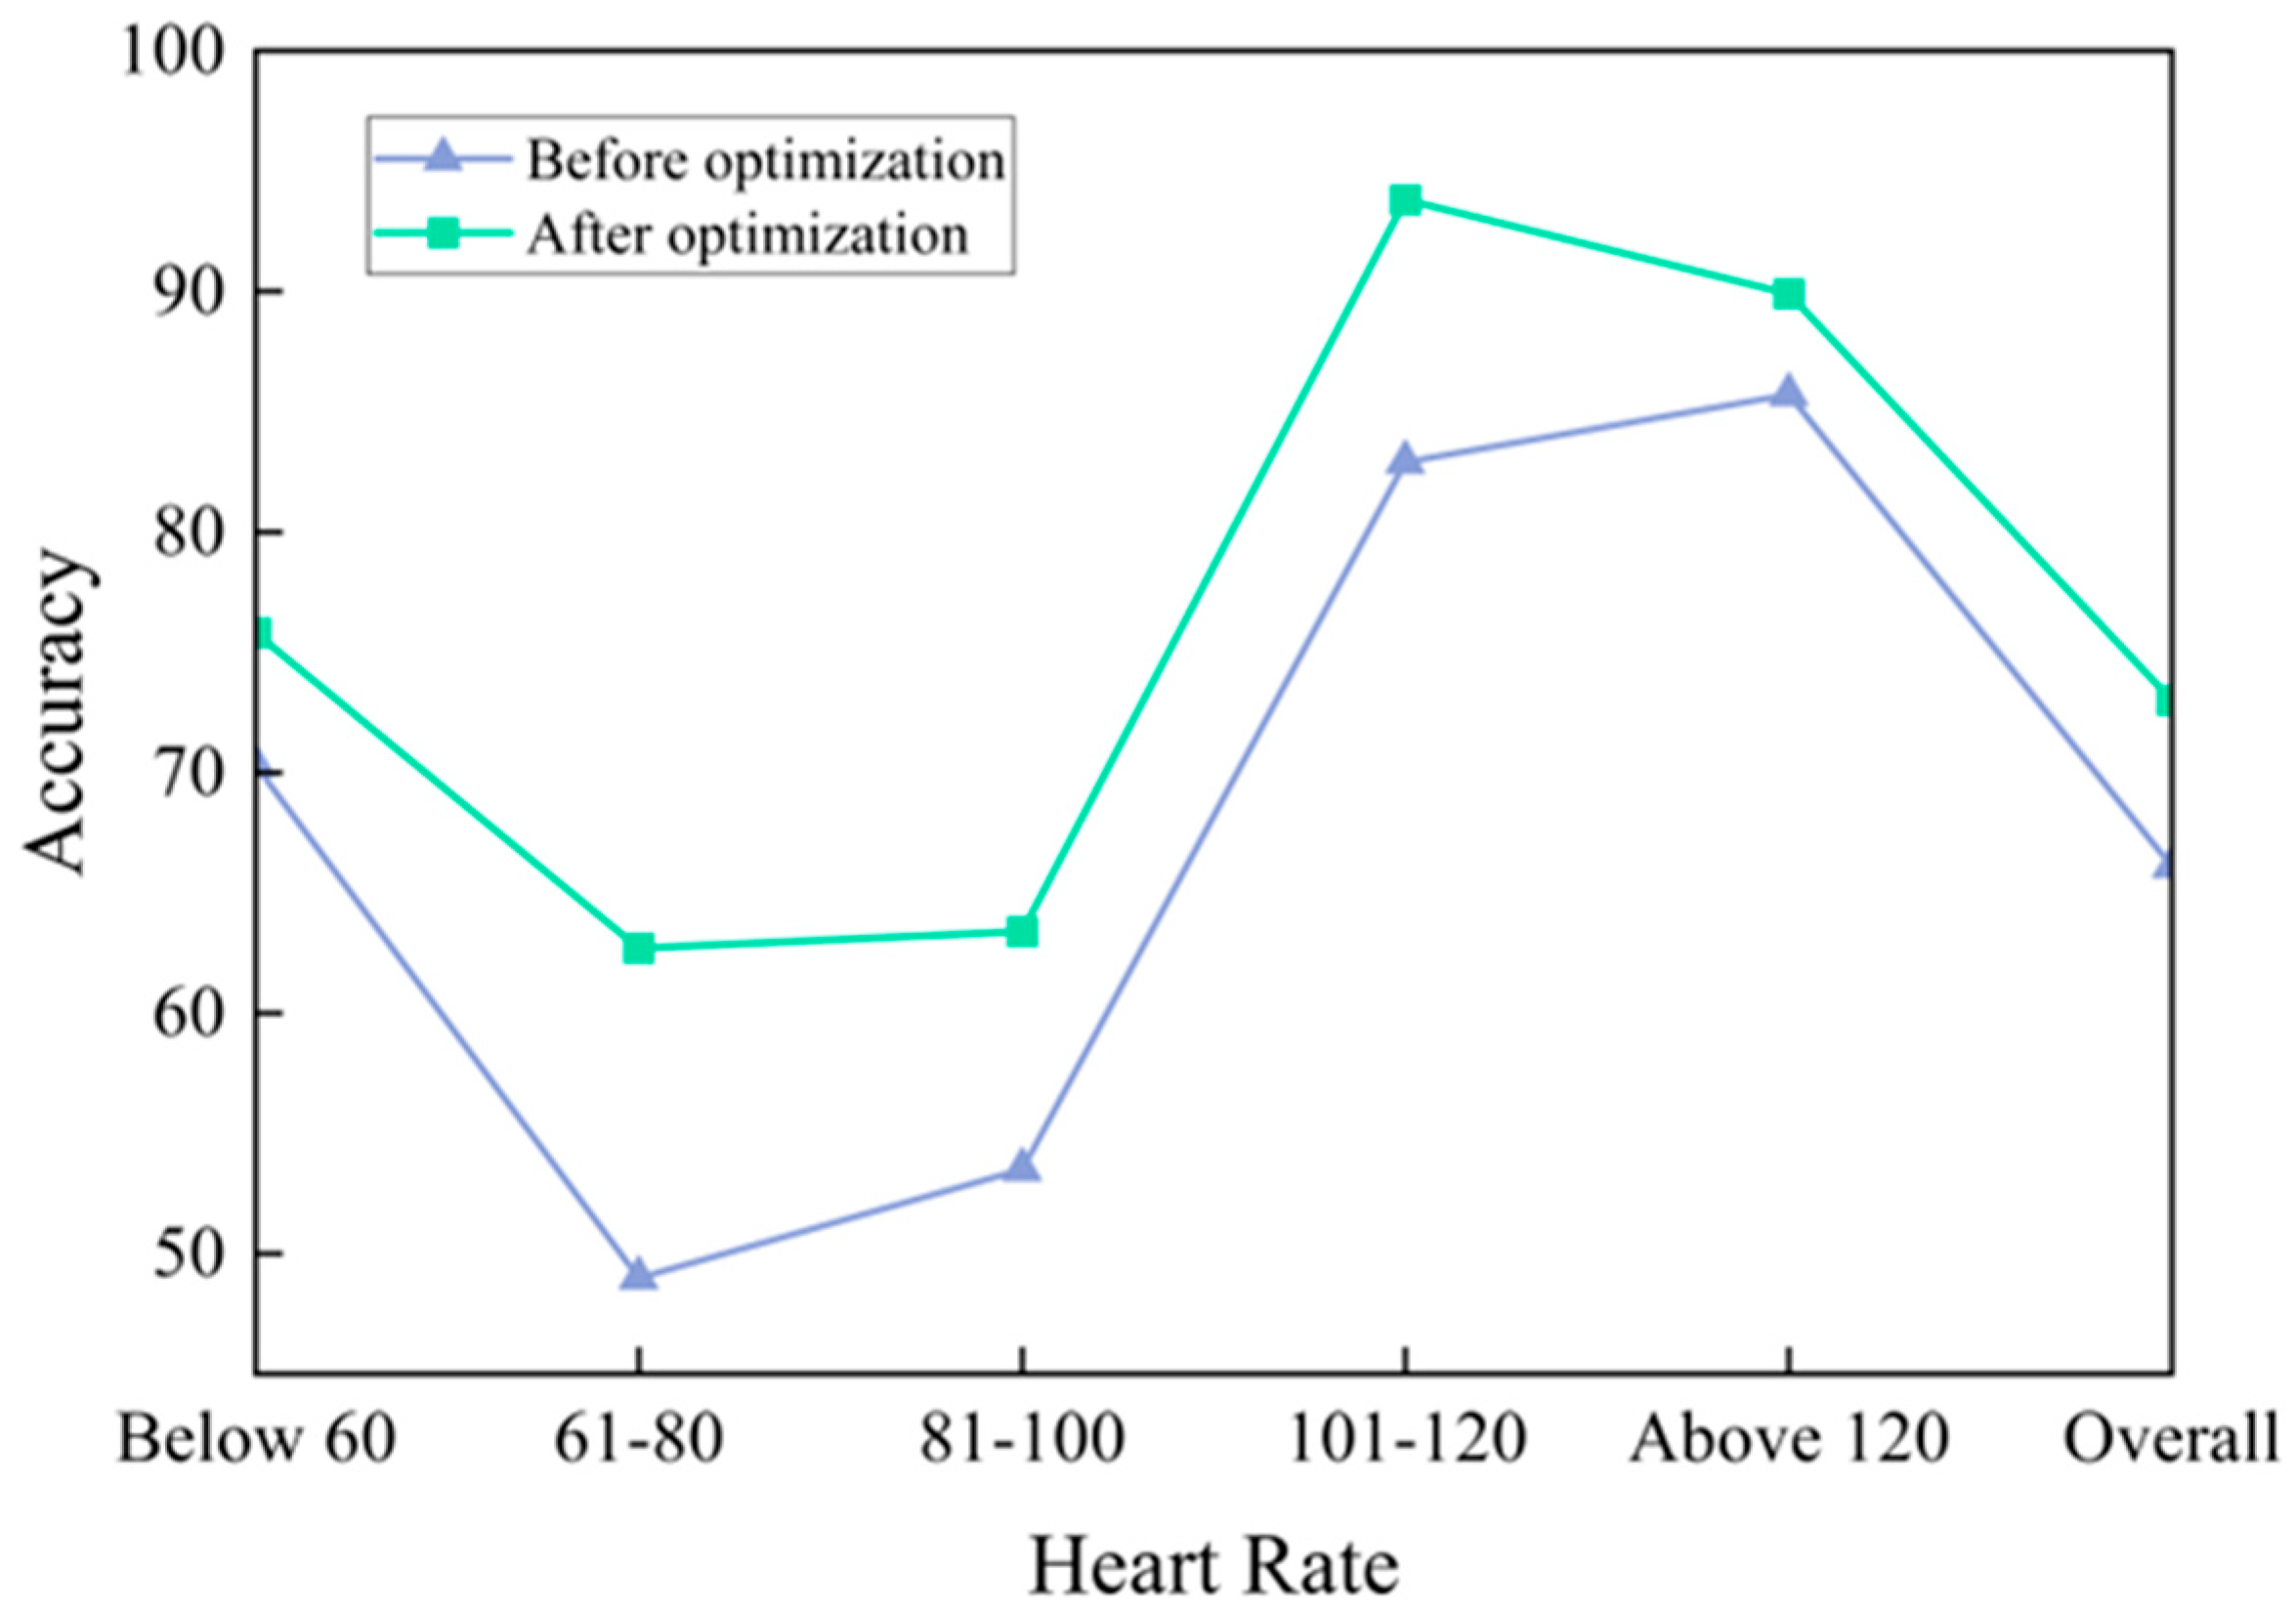
After optimizing the parameters of the SVM classifier using the ABC algorithm, the accuracy of heart rate classification shows a significant improvement. Figure 16 illustrates the comparison of classification accuracy before and after the optimization.
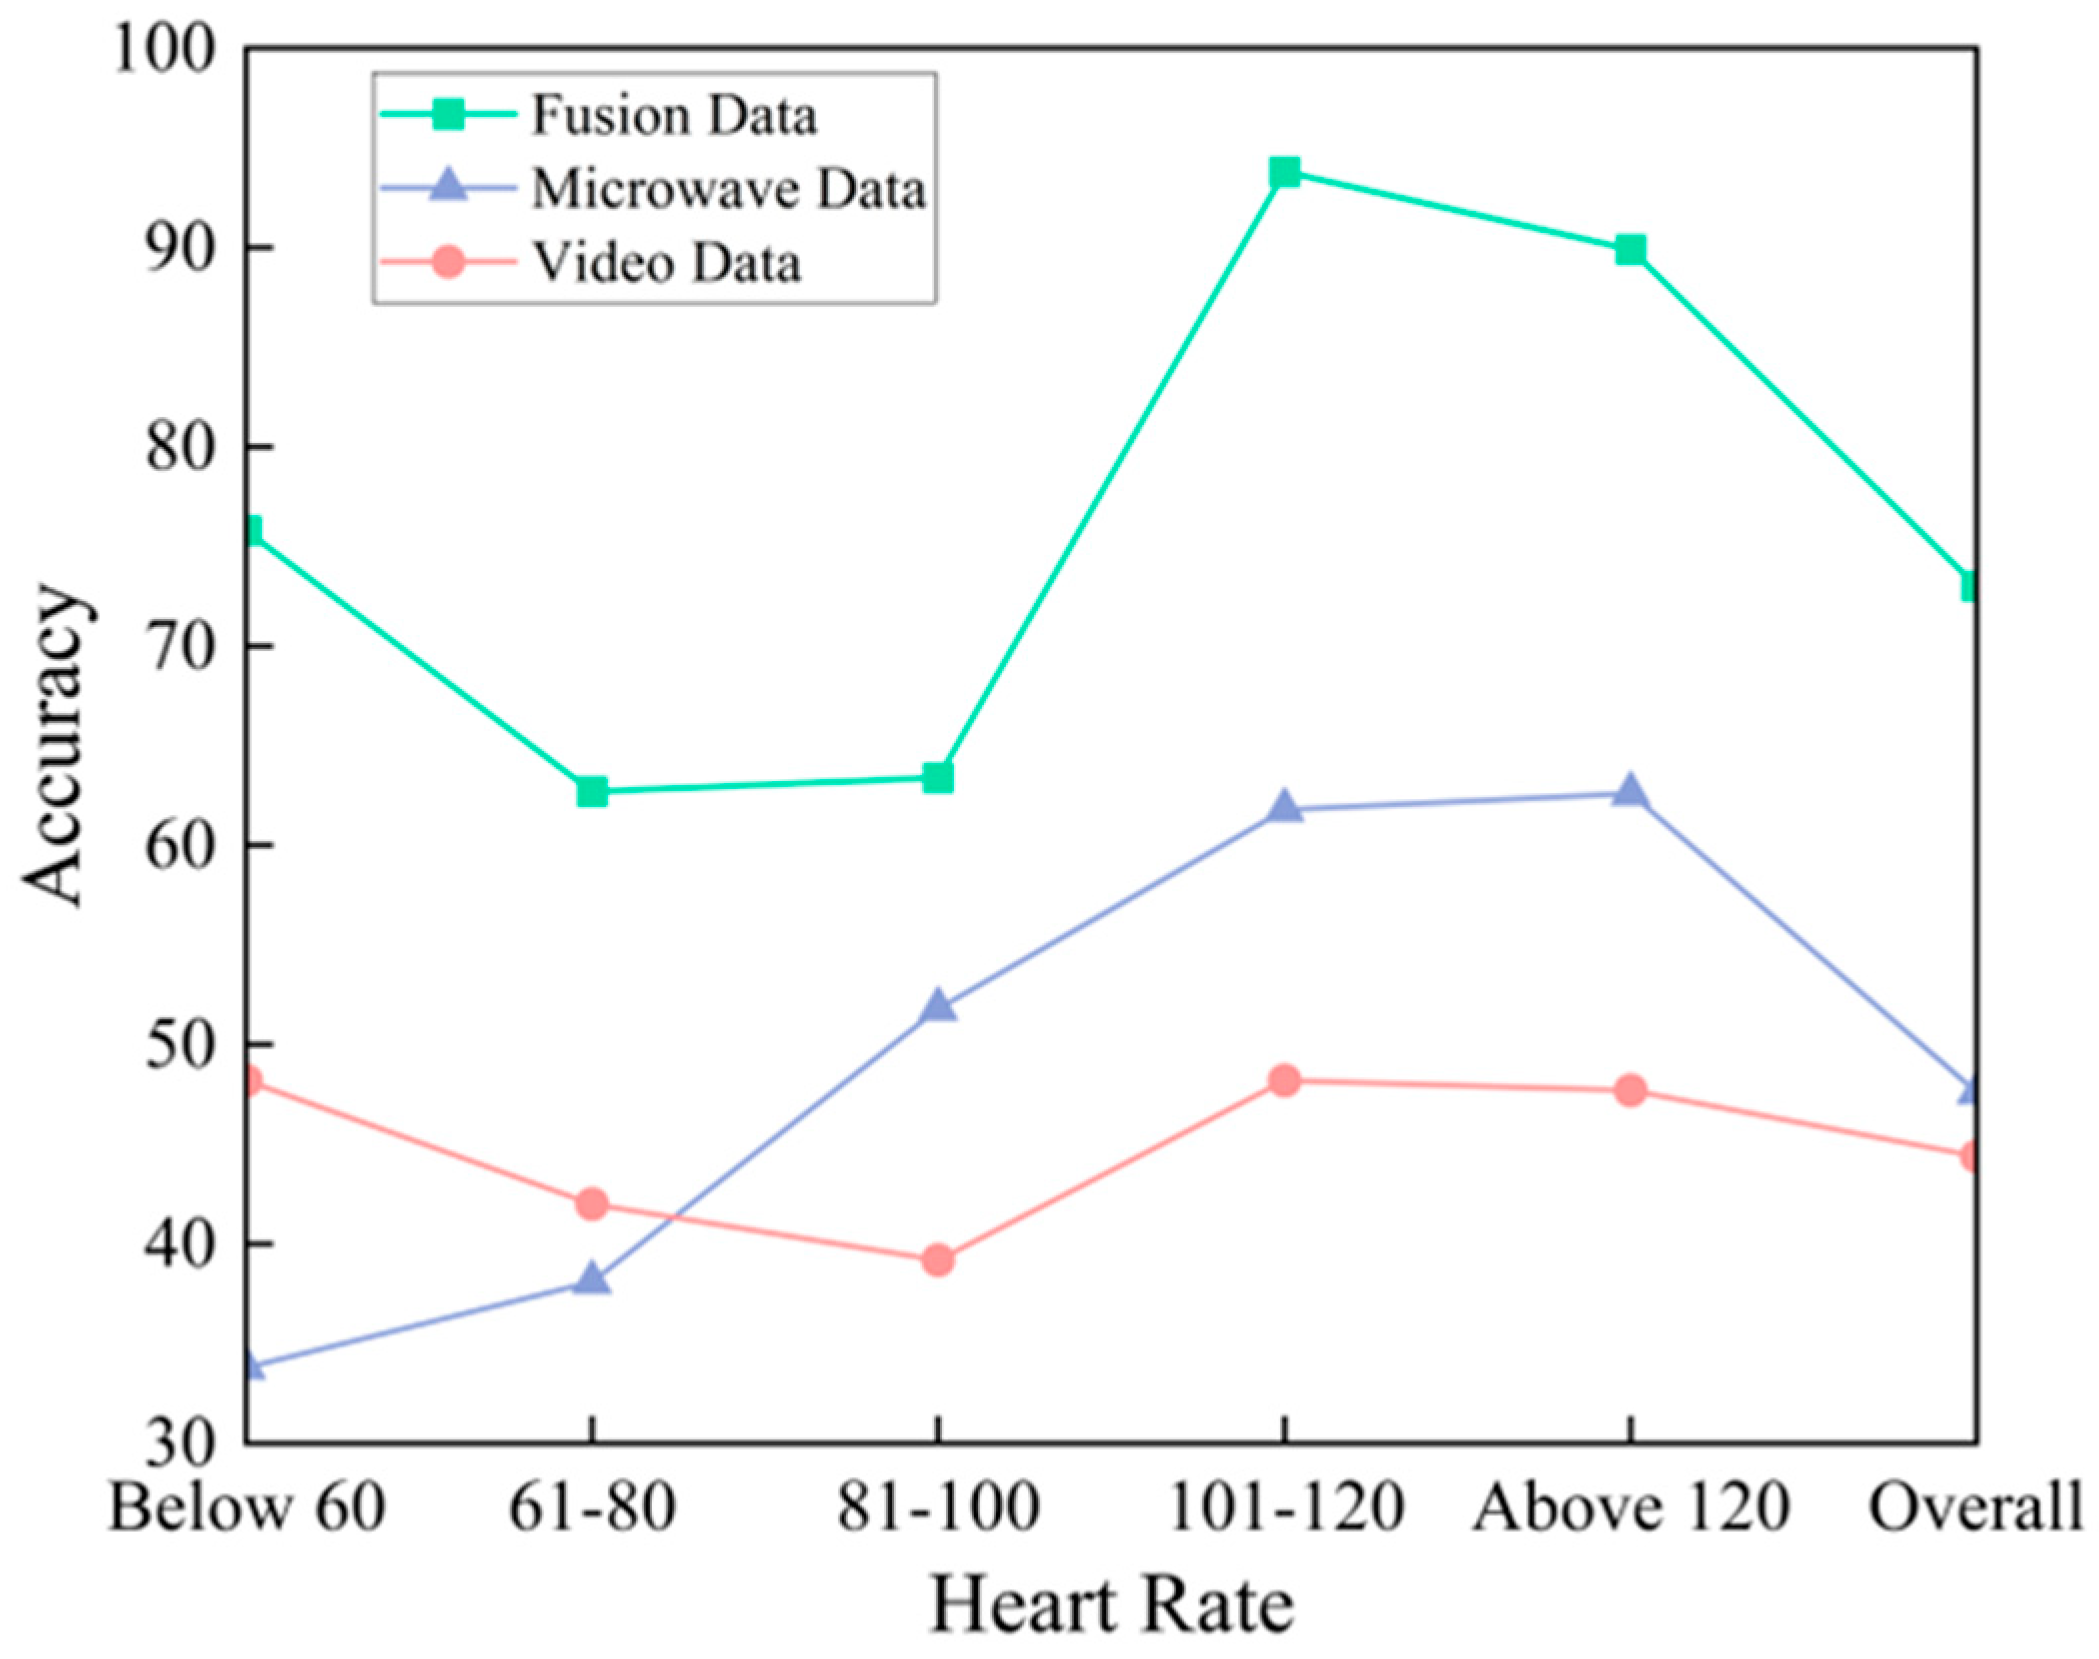
In addition, this paper also conducted heart rate classification experiments using single-source data. Figure 17 shows the comparison of classification accuracy before and after data fusion. It is evident that the classification accuracy significantly improved after data fusion, demonstrating the effectiveness of the proposed method.

4. Conclusions

Abnormal heart rates often indicate various sudden illnesses; remote long-time monitoring could help paramedics provide timely treatment. Compared to conventional medical devices, the non-contact monitoring method proposed in this paper is more comfortable for burn patients and infants. The monitoring duration of this algorithm is approximately 30 s. By employing this algorithm for rapid heart rate identification, monitoring duration can be significantly reduced, thereby saving valuable time for patient care and facilitating the quick identification of individuals with abnormal heart rates.
This study proposes a rapid heart rate classification method based on multi-source data fusion, and experimental validation demonstrates the feasibility of feature processing combined with an Artificial Bee Colony-Support Vector Machine (ABC_SVM) classifier. In the experiments, the test accuracy for heart rate classification was 73.1%, with an accuracy of up to 89.9% for high heart rates and 75.8% for low heart rates. The results indicate that the proposed method can successfully detect abnormal heart rate conditions.
In this study, multimodal data were preprocessed to obtain data of the same modality, followed by feature extraction and fusion. This approach allows different representations and combinations of multimodal data in the same dimensional space, providing more valuable information compared to single-source monitoring technologies. The method combines feature extraction, selection, and identification instead of using an end-to-end network model, reducing the requirements for data volume and computational resources. Although end-to-end networks can directly input raw signals, their interpretability is poor. For the multimodal data in this study, end-to-end network models would be more complex.
Currently, the limitations of this study include a relatively large interval between heart rate classifications and lower monitoring accuracy. In the future, more refined data processing techniques will be employed to reduce the interval, expand application scenarios, and achieve more precise heart rate monitoring.
Additionally, while this study employed SVM for classification, we acknowledge that other machine learning methods, such as neural networks (NN) and k-nearest neighbors (k-NN), have shown superior performance in many medical data analysis tasks. Neural networks, particularly deep learning models, could potentially achieve higher classification accuracy, as they can capture complex nonlinear relationships in multi-source data fusion. Similarly, k-NN and other pattern recognition methods might provide better performance for physiological signal analysis due to their ability to preserve local data structures. However, these methods were not employed in the current study due to several considerations: (1) our dataset size is relatively limited for training robust neural networks, (2) the computational complexity of these methods may compromise the real-time performance requirements of our monitoring system, and (3) our hybrid feature selection algorithm was specifically optimized for SVM classifiers. Future work will investigate the application of neural networks, k-NN, and other advanced machine learning methods as larger datasets become available and computational resources improve, which may lead to enhanced classification accuracy while maintaining real-time performance.

Author Contributions

Conceptualization, Q.L. and M.Y.; methodology, Q.L. and Z.T.; software, Z.T.; validation, Q.L.; formal analysis, Q.L. and Z.T.; investigation, Q.L.; data curation, Y.S.; formal analysis and visualization, G.Z.; writing—original draft preparation, Q.L.; writing—review and editing, Z.T.; supervision, M.Y.; project administration, M.Y. All authors have read and agreed to the published version of the manuscript.

Funding

Tianjin Education Commission (No. 2023KJ226).

Institutional Review Board Statement

Verbal informed consent was obtained from all participants. This study qualified for exemption from ethics committee approval under China’s Ethical Review Measures (2023, Article 32(2)), as it involved non-invasive monitoring, anonymized data, and no risks to participants. All procedures adhered to the principles of the Declaration of Helsinki.

Informed Consent Statement

Verbal informed consent was obtained from all participants involved in the study. Verbal consent was obtained rather than written consent because the study involved only non-invasive, non-contact monitoring procedures with minimal risk to participants, and all personal data were immediately anonymized to protect participant privacy.

Data Availability Statement

The data presented in this study are available on request from the corresponding author. The data are not publicly available due to privacy restrictions, as the research involved human subjects and contains personal health-related information, which needs to be protected in accordance with ethical and legal requirements regarding patient privacy.

Acknowledgments

We would like to acknowledge Hang Wu, Ping Han, and Dezhao Zhai for their valuable contributions to this research. Hang Wu provided funding acquisition support, while Ping Han and Dezhao Zhai provided administrative support and resource provision during this research.

Conflicts of Interest

The authors declare no conflicts of interest.

References

  1. Choi, S.H.; Yoon, H. Convolutional Neural Networks for the Real-Time Monitoring of Vital Signs Based on Impulse Radio Ultrawide-Band Radar during Sleep. Sensors 2023, 23, 3116. [Google Scholar] [CrossRef] [PubMed]
  2. Seflek, I.; Acar, Y.E.; Yaldiz, E. Small Motion Detection and Non-Contact Vital Signs Monitoring with Continuous Wave Doppler Radars. Elektron. Elektrotechnika 2020, 26, 54–60. [Google Scholar] [CrossRef]
  3. Peng, K.-C.; Sung, M.-C.; Wang, F.-K.; Horng, T.-S. Non-contact Vital Sign Detection Using Gain Detection Technique. In Proceedings of the 2021 IEEE International Symposium on Radio-Frequency Integration Technology (RFIT), Hualien, Taiwan, 25–27 August 2021; pp. 1–2. [Google Scholar]
  4. Ren, L.; Kong, L.; Foroughian, F.; Wang, H.; Theilmann, P.; Fathy, A.E. Comparison Study of Noncontact Vital Signs Detection Using a Doppler Stepped-Frequency Continuous-Wave Radar and Camera-Based Imaging Photoplethysmography. IEEE Trans. Microw. Theory Tech. 2017, 65, 3519–3529. [Google Scholar] [CrossRef]
  5. Chen, S. An image enhancement based method for improving rPPG extraction under low-light illumination. Biomed. Signal Process. Control 2025, 100 Pt B, 106963. [Google Scholar] [CrossRef]
  6. Xi, L. Weighted combination and singular spectrum analysis based remote photoplethysmography pulse extraction in low-light environments. Med. Eng. Phys. 2022, 105, 103822. [Google Scholar] [CrossRef]
  7. Yang, Z.; Wang, H.; Lu, F. Assessment of Deep Learning-Based Heart Rate Estimation Using Remote Photoplethysmography Under Different Illuminations. IEEE Trans. Hum.-Mach. Syst. 2022, 52, 1236–1246. [Google Scholar] [CrossRef]
  8. Cao, M.; Cheng, X.; Liu, X.; Jiang, Y.; Yu, H.; Shi, J. ST-Phys: Unsupervised Spatio-Temporal Contrastive Remote Physiological Measurement. IEEE J. Biomed. Heal. Inform. 2024, 28, 4613–4624. [Google Scholar] [CrossRef]
  9. Chen, S.; Ho, S.K.; Chin, J.W.; Luo, K.H.; Chan, T.T.; So, R.H.Y.; Wong, K.L. Deep learning-based image enhancement for robust remote photoplethysmography in various illumination scenarios. In Proceedings of the 2023 IEEE/CVF Conference on Computer Vision and Pattern Recognition Workshops (CVPRW), Vancouver, BC, Canada, 17–24 June 2023; pp. 6077–6085. [Google Scholar]
  10. Tschopp, S.; Borner, U.; Caversaccio, M.; Tschopp, K. Long-term night-to-night variability of sleep-disordered breathing using a radar-based home sleep apnea test: A prospective cohort study. J. Clin. Sleep Med. 2024, 20, 1079–1086. [Google Scholar] [CrossRef]
  11. Majer, F.; Yan, Z.; Broughton, G.; Ruichek, Y.; Krajník, T. Learning to see through haze: Radar-based Human Detection for Adverse Weather Conditions. In Proceedings of the 2019 European Conference on Mobile Robots (ECMR), Prague, Czech Republic, 4–6 September 2019; pp. 1–7. [Google Scholar]
  12. Iyer, S.; Zhao, L.; Mohan, M.P.; Jimeno, J.; Siyal, M.Y.; Alphones, A.; Karim, M.F. mm-Wave Radar-Based Vital Signs Monitoring and Arrhythmia Detection Using Machine Learning. Sensors 2022, 22, 3106. [Google Scholar] [CrossRef]
  13. Wen, L.; Dong, S.; Wang, Y.; Gu, C.; Tang, Z.; Liu, Z.; Wang, Y.; Mao, J. Noncontact Infant Apnea Detection for Hypoxia Prevention With a K-Band Biomedical Radar. IEEE Trans. Biomed. Eng. 2023, 71, 1022–1032. [Google Scholar] [CrossRef]
  14. Shen, M.; Tsui, K.-L.; Nussbaum, M.A.; Kim, S.; Lure, F. An Indoor Fall Monitoring System: Robust, Multistatic Radar Sensing and Explainable, Feature-Resonated Deep Neural Network. IEEE J. Biomed. Health Inform. 2023, 27, 1891–1902. [Google Scholar] [CrossRef]
  15. Rissacher, D.; Galy, D. Cardiac radar for biometric identification using nearest neighbour of continuous wavelet transform peaks. In Proceedings of the IEEE International Conference on Identity, Security and Behavior Analysis (ISBA 2015), Hong Kong, China, 23–25 March 2015; pp. 1–6. [Google Scholar]
  16. Lin, F.; Song, C.; Zhuang, Y.; Xu, W.; Li, C.; Ren, K. Cardiac Scan: A Non-contact and Continuous Heart-based User Authentication System. In Proceedings of the 23rd Annual International Conference on Mobile Computing and Networking, Snowbird, UT, USA, 16–20 October 2017; pp. 315–328. [Google Scholar]
  17. Cao, P.; Xia, W.; Li, Y. Heart ID: Human Identification Based on Radar Micro-Doppler Signatures of the Heart Using Deep Learning. Remote. Sens. 2019, 11, 1220. [Google Scholar] [CrossRef]
  18. Yan, B.; Zhang, H.; Yao, Y.; Liu, C.; Jian, P.; Wang, P.; Du, L.; Chen, X.; Fang, Z.; Wu, Y. Heart signatures: Open-set person identification based on cardiac radar signals. Biomed. Signal Process. Control 2022, 72, 103306. [Google Scholar] [CrossRef]
  19. Dham, V. Programming Chirp Parameters in TI Radar Devices; Texas Instruments: Texas, TX, USA, 2017. [Google Scholar]
  20. Dai, T.K.V.; Oleksak, K.; Kvelashvili, T.; Foroughian, F.; Bauder, C.; Theilmann, P.; Fathy, A.E.; Kilic, O. Enhancement of Remote Vital Sign Monitoring Detection Accuracy Using Multiple-Input Multiple-Output 77 GHz FMCW Radar. IEEE J. Electromagn. RF Microw. Med. Biol. 2022, 6, 111–122. [Google Scholar] [CrossRef]
  21. Niu, X.; Shan, S.; Han, H.; Chen, X. RhythmNet: End-to-End Heart Rate Estimation From Face via Spatial-Temporal Representation. IEEE Trans. Image Process. 2020, 29, 2409–2423. [Google Scholar] [CrossRef]
  22. Zhang, C.; Tian, J.; Li, D.; Hou, X.; Wang, L. Comparative study on the effect of color spaces and color formats on heart rate measurement using the imaging photoplethysmography (IPPG) method. Technol. Health Care 2022, 30, 391–402. [Google Scholar] [CrossRef] [PubMed]
  23. Jinbao, Z.; Tiangang, Z.; Min, W.; Shidong, C. Bearing Fault Diagnosis Based on the Refined Composite Generalized Multi-Scale Bubble Entropy. In Proceedings of the 2021 4th International Conference on Electron Device and Mechanical Engineering (ICEDME), Guangzhou, China, 19–21 March 2021; pp. 172–175. [Google Scholar]
  24. Sánchez, R.-V.; Lucero, P.; Vásquez, R.E.; Cerrada, M.; Macancela, J.-C.; Cabrera, D. Feature ranking for multi-fault diagnosis of rotating machinery by using random forest and KNN. J. Intell. Fuzzy Syst. 2018, 34, 3463–3473. [Google Scholar] [CrossRef]
  25. Xu, Y.; Zhang, S.; Cao, Z.; Chen, Q.; Xiao, W. Extreme Learning Machine for Heartbeat Classification with Hybrid Time-Domain and Wavelet Time-Frequency Features. J. Healthc. Eng. 2021, 2021, 6674695. [Google Scholar] [CrossRef]
  26. Li, Y.; Geng, B.; Jiao, S. Refined Composite Multi-Scale Reverse Weighted Permutation Entropy and Its Applications in Ship-Radiated Noise. Entropy 2021, 23, 476. [Google Scholar] [CrossRef] [PubMed]
  27. Wolfson, E.J.; Fekete, T.; Loewenstein, Y.; Shriki, O. Multi-scale entropy assessment of magnetoencephalography signals in schizophrenia. Sci. Rep. 2024, 14, 14680. [Google Scholar] [CrossRef]
  28. Ying, W.; Tong, J.; Dong, Z.; Pan, H.; Liu, Q.; Zheng, J. Composite Multivariate Multi-Scale Permutation Entropy and Laplacian Score Based Fault Diagnosis of Rolling Bearing. Entropy 2022, 24, 160. [Google Scholar] [CrossRef]
  29. Chen, W.; Wang, Z.; Xie, H.; Yu, W. Characterization of Surface EMG Signal Based on Fuzzy Entropy. IEEE Trans. Neural Syst. Rehabil. Eng. 2007, 15, 266–272. [Google Scholar] [CrossRef]
  30. Wu, H.; Yang, T.; Li, H.; Zhou, Z. Air quality prediction model based on mRMR–RF feature selection and ISSA–LSTM. Sci. Rep. 2023, 13, 12825. [Google Scholar] [CrossRef] [PubMed]
  31. Alshamlan, H.; Badr, G.; Alohali, Y. mRMR-ABC: A Hybrid Gene Selection Algorithm for Cancer Classification Using Microarray Gene Expression Profiling. BioMed Res. Int. 2015, 2015, 604910. [Google Scholar] [CrossRef] [PubMed]
  32. Sanz, H.; Valim, C.; Vegas, E.; Oller, J.M.; Reverter, F. SVM-RFE: Selection and visualization of the most relevant features through non-linear kernels. BMC Bioinform. 2018, 19, 432. [Google Scholar] [CrossRef]
  33. Bonneau, M.; Benet, B.; Labrune, Y.; Bailly, J.; Ricard, E.; Canario, L. Predicting sow postures from video images: Comparison of convolutional neural networks and segmentation combined with support vector machines under various training and testing setups. Biosyst. Eng. 2021, 212, 19–29. [Google Scholar] [CrossRef]
  34. Gao, F.; Tian, T.; Yao, T.; Zhang, Q. Human Gait Recognition Based on Multiple Feature Combination and Parameter Optimization Algorithms. Comput. Intell. Neurosci. 2021, 2021, 6693206. [Google Scholar] [CrossRef] [PubMed]
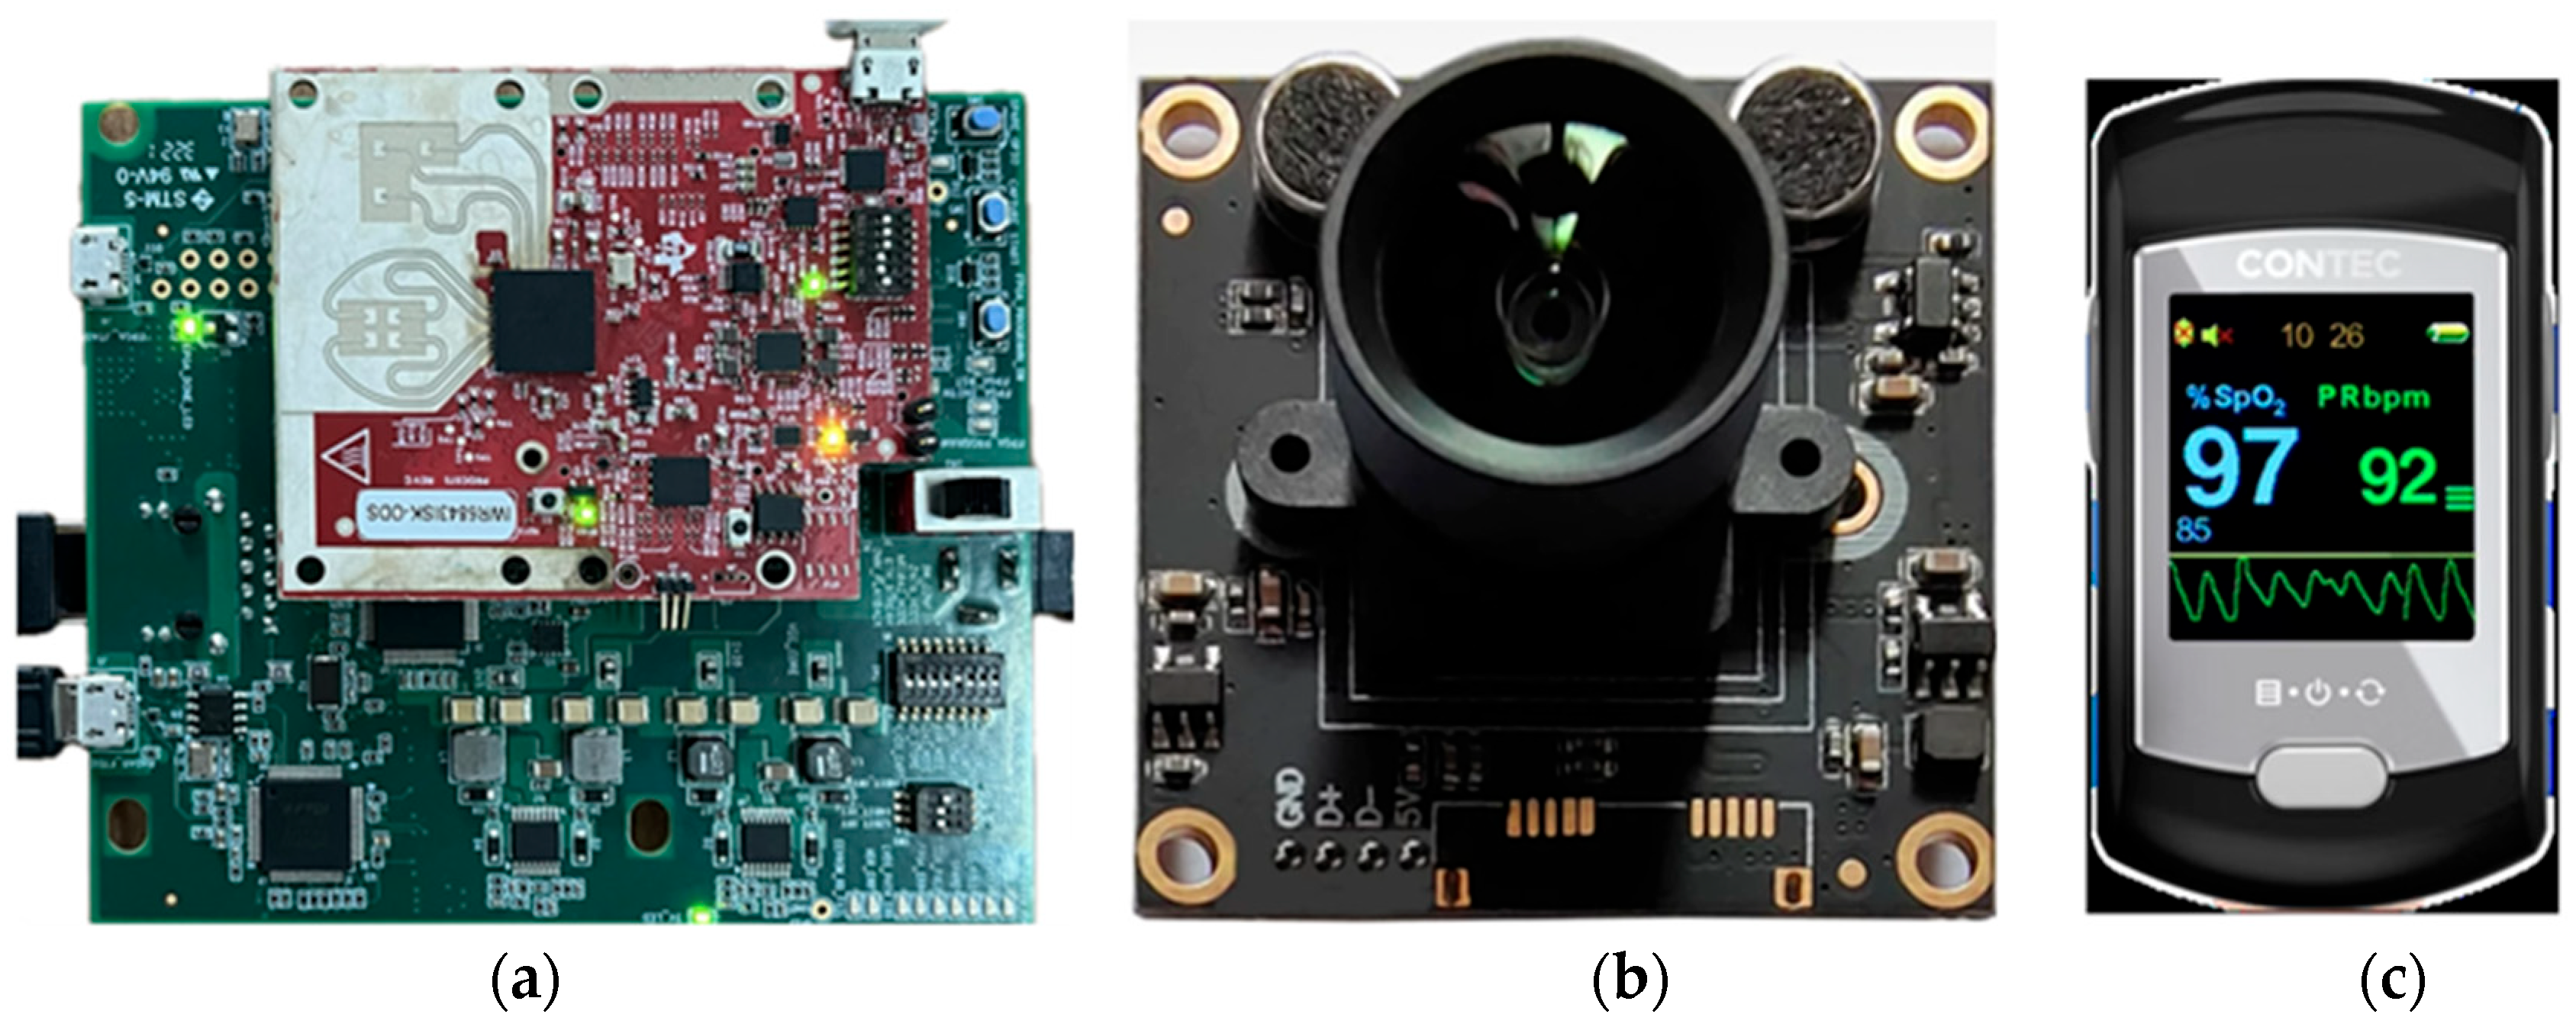
Figure 1. Data acquisition module: (a) microwave module; (b) camera module; (c) pulse oximeter.
Applsci 15 09189 g001
Figure 2. Data processing module.
Applsci 15 09189 g002
Figure 3. (a) Exterior design diagram; (b) physical diagram.
Applsci 15 09189 g003
Figure 4. Internal design diagram.
Applsci 15 09189 g004
Figure 5. Data acquisition scenarios.
Applsci 15 09189 g005
Figure 6. Radar data target monitoring.
Applsci 15 09189 g006
Figure 7. Radar echo signal.
Applsci 15 09189 g007
Figure 8. Arrangement of microwave data.
Applsci 15 09189 g008
Figure 9. Detection of target positions: (a) range-time image; (b) direction of arrival of subjects.
Applsci 15 09189 g009
Figure 10. Preprocessed microwave signal.
Applsci 15 09189 g010
Figure 11. The green channel data.
Applsci 15 09189 g011
Figure 12. Preprocessed video data.
Applsci 15 09189 g012
Figure 13. The overall flowchart.
Applsci 15 09189 g013
Figure 14. Comparison of feature selection algorithm accuracy.
Applsci 15 09189 g014
Figure 15. Classification results of different classifiers.
Applsci 15 09189 g015
Figure 16. Comparison before and after algorithm optimization.
Applsci 15 09189 g016
Figure 17. Comparison of single-source vs. multi-source data.
Applsci 15 09189 g017
Table 1. Parameters of the radar module.
ParametersValue
Start Frequency, f c ( GHz ) 60
Frequency Slope, S ( MHz / μ s ) 70
Idle Time ( μ s ) 7
TX Start Time ( μ s ) 1
ADC Start Time ( μ s ) 6
ADC Samples200
Ramp End Time ( μ s ) 57
Slow-time Sampling Frequency200
Range Resolution4.29
Table 2. Performance of different classifiers.
ClassifiersRuntime (s)Accuracy (%)
Random Forest4.2861.7
SVM2.8866.1
ELM2.7963.5
LSSVM1.5564.5
Disclaimer/Publisher’s Note: The statements, opinions and data contained in all publications are solely those of the individual author(s) and contributor(s) and not of MDPI and/or the editor(s). MDPI and/or the editor(s) disclaim responsibility for any injury to people or property resulting from any ideas, methods, instructions or products referred to in the content.