Article

Acoustic Transmission Characteristics and Model Prediction of Upper and Lower Completion Pipe Strings for Test Production of Natural Gas Hydrate

1
Institute of Exploration Techniques, Chinese Academy of Geological Sciences, Tianjin 300000, China
2
Innovation Base for Automatic and Intelligent Drilling Equipment, Geological Society of China, Tianjin 300000, China
3
Technology Innovation Center for Directional Drilling Engineering, Ministry of Natural Resources, Tianjin 300000, China
4
School of Mechanical Engineering and Electronic Information, China University of Geosciences, Wuhan 430074, China
*
Authors to whom correspondence should be addressed.
Appl. Sci. 2025, 15(16), 9174; https://doi.org/10.3390/app15169174
Submission received: 3 July 2025 / Revised: 31 July 2025 / Accepted: 1 August 2025 / Published: 20 August 2025

Abstract

This study adopts numerical simulation methods to explore the acoustic transmission characteristics of pipe strings in the upper and lower completions of a monitoring system for test production of natural gas hydrate. A finite-element simulation model for acoustic transmission in the pipe string system is established through COMSOL. The sound pressure level attenuation and the sound pressure amplitude ratio are chosen as evaluation indexes. Parametric numerical simulations are carried out to study the effects of the number of tubing cascades and the size of connection joints in the pipe string system on the acoustic transmission characteristics of the pipe string. The Light Gradient Boosting Machine (LightGBM) algorithm is adopted to predict the acoustic transmission characteristic curves of the pipe string. Based on this prediction model, with the maximum transmission distance, maximum sound pressure amplitude ratio, and minimum transmission attenuation as objective functions, the NSGA-II (Non-dominated Sorting Genetic Algorithm-II) optimization algorithm is adopted to obtain the optimal combinations of the pipe string system structure and the transmission frequency. The findings show that within the range of 20–2000 Hz, when the acoustic wave propagates in the column system, the amplitude attenuation caused by structural damping is positively correlated with the transmission distance, and the high-frequency acoustic wave attenuates faster. When the frequency exceeds 500 Hz, the sound pressure amplitude ratio is lower than 0.4, and the attenuation is stabilized at 90% above 1500 Hz. The thickness of the joints has a weak impact on the transmission, while an increase in length raises the characteristic frequency but exacerbates sound pressure attenuation. The LightGBM algorithm has a high prediction accuracy, reaching up to 88.54% and 84.82%, respectively. The optimal parameter combinations (n, hkg, lkg, freq) optimized by NSGA-II provide an optimization scheme for the structure and frequency of acoustic transmission in down-hole pipe strings.

1. Introduction

With the potential for onshore hydrocarbon resources as non-renewable energy resources to become fully exploited, great attention is being paid to the potential of hydrocarbon resources in the deep ocean [1]. Deep wells and low-permeability oil and gas wells are usually thousands of meters deep, and their exploitation involves high risk and complexity, so it is crucial to accurately obtain information about the down-hole conditions and stratigraphy. Due to its unique advantages, acoustic signal transmission has become a hot research topic. Technology used for acoustic transmission while drilling can cope with a variety of formation conditions, is not affected by the drilling fluids and formation damping, has a fast transmission rate, and can transmit down-hole data in real time [2], which is of great importance for the development of technology for intelligent logging while drilling. In addition, acoustic wireless telemetry technology can overcome the limitations of traditional cables, enable installation of monitoring equipment at key locations, and provide pressure and temperature data, offering significant advantages and application potential [3].
The development of acoustic transmission systems at the bottom hole has benefited from the contributions of many scholars. At the beginning of the 21st century, Wang et al. proposed subsurface GPS, radar, and CT systems, which are important for intelligent drilling [4]. Subsequently, Drumheller et al. developed a wireless communication tool based on acoustic telemetry and verified its feasibility to transmit signals through steel drill pipes [5]. In 2006, Gao et al. tested a prototype for acoustic data transmission while drilling, proving the effectiveness of Frequency Shift Keying (FSK) and Binary Phase Shift Keying (BPSK) [6,7]. In 2007, Filoux et al. simulated the acoustic propagation of a high-frequency sensor [8]. In 2009, Ma et al. proposed a sound velocity prediction method based on a relevance vector machine with high accuracy [9]. In 2015, Che et al. designed an acoustic phased arc array transmitter to simulate a borehole acoustic field using a 3D finite-difference method, and derived the relationship between the P-wave reflection and the interface distance [10]. In 2017, Hawthorn et al. developed a wireless acoustic telemetry system for real-time transmission of down-hole data, which improved efficiency and reduced non-productive time (NPT) [11]. In 2019, Xue et al. designed and tested a laser-induced plasma acoustic signal acquisition system and verified its online monitoring capability [12]. In 2020, Ellmauthaler et al. proposed a distributed acoustic sensing (DAS) scheme based on submarine fiber optics, demonstrating its potential in submarine infrastructure [13]. In the same year, Bachman et al. designed an acoustic fluid mixer, demonstrating its potential in oil and gas exploration [14]. Ali et al. summarized underwater wireless communication technologies and discussed the application prospects of 5G and IoT [15]. Gao et al. designed an underwater metamaterial structure for low-frequency broadband acoustic absorption and verified its accuracy [16]. In 2022, Marin tested a DAS system coexisting with optical communication and achieved a data transmission rate of 4.2 Gb/s [17]. Zheng et al. developed an Orthogonal Frequency Division Multiplexing (OFDM)-based acoustic wireless communication system with a transmission rate of 250 kbit/s [18].
The study of acoustic transmission characteristics lays the foundation for improvement in acoustic systems at the bottom hole. In 2006, Wang et al. investigated the effects of logging while drilling (LWD) and data transmission in measurement while drilling (MWD) and found that the transfer matrix method was more accurate than the finite difference method [19]. In 2011, Shen et al. investigated the propagation of Quadrature Phase Shift Keying (QPSK) signals in drilling stems [20]. In 2013, Wei et al. proposed an LWD data transmission method based on the Single-Carrier Frequency Domain Equalization (SC-FDE) technique, which significantly reduced the Bit Error Rate (BER) [21]. In 2015, Hou et al. investigated the acoustic effects on oil reservoirs and found that the method could improve oil–water mobility [22]. In 2018, Perez-Arancibia et al. proposed and modeled the acoustic well stimulation method (AWS), which improved formation permeability [23]. In 2021, Bai et al. proposed an acoustic dynamic model matching method, which improved the identification accuracy of wireless acoustic communication in oil wells [24]. In 2022, he further investigated the attenuation characteristics of acoustic signals transmitted along the wall of metal tubing and proposed an optimal frequency selection scheme [25]. In 2023, Paillet et al. conducted a study on acoustic logging in boreholes [26]. Chiantello et al. proposed a method to facilitate the collection of acoustic data from pipe string systems and address the data collection challenge pipe string [27]. Ullah et al. built a machine learning-based leak detection platform and evaluated multiple classifiers in light of pipeline leakage hazards [28].
In summary, although scholars have carried out many studies on down-hole acoustic transmission devices and the acoustic transmission characteristics of pipe strings, most of the current studies focus on the acoustic transmission characteristics of periodic pipe string channels. Moreover, most of the subjects investigated involve single-layer tubing, and few studies have been conducted on multilayer pipe string systems containing casing, extended connecting tubes of the sand control liner, oil tubing, and fluid media inside and outside the tubing, as shown in Table 1. It is extremely important to study the acoustic transmission of multilayer pipe strings for the exploitation and monitoring of new unconventional resources, such as natural gas hydrates and shallow gas, especially in deep water areas. More than 90% of natural gas hydrates are stored in unconsolidated sediments on the seafloor. As a result, several problems may arise, including reservoir bed creep, seafloor sedimentation, wellbore deformation, methane leakage, and other engineering safety and environmental pollution problems, during the exploitation process. Through the multilayer pipe string channel, acoustic transmission can break through the communication connection technology barrier between the upper completion and the lower completion construction technology. Then, it can achieve contact monitoring between the lower completion and the stratum; for example, it can monitor the changes in temperature and pressure inside and outside the sand control liner, or it can directly measure the mechanical changes in the reservoir bed creep [29].
Therefore, this paper constructs a finite element model for acoustic transmission of a multilayer pipe string system and the fluid medium for hydrate straight well test production, analyzes the acoustic transmission characteristics of the model, and predicts the characteristic curves of the acoustic transmission frequency based on a parameterized numerical simulation. The structure of this paper is as follows: Section 1 introduces the background and significance of acoustic transmission in multilayer pipe strings for natural gas hydrate test production, as well as providing a review of relevant studies; Section 2 conducts numerical analysis of the acoustic transmission characteristics of pipe strings; Section 3 focuses on prediction and parameter optimization of the acoustic transmission model; Section 4 presents the conclusions and outlook.

2. Numerical Analysis of the Acoustic Transmission Characteristics of Pipe Strings

2.1. Overall Program for the Acoustic Transmission of Pipe Strings

The acoustic signal transmission monitoring scheme for the hydrate test production is illustrated in Figure 1. Based on the first round of hydrate test production in China [31], the design of the completion monitoring system in this paper mainly consists of three parts: upper completion, lower completion, and monitoring transmission, and adopts a straight well design. The upper completion comprises completion tubing and an Electric Submersible Pump (ESP), while the lower completion consists of a sand control liner, extended connecting tube for the sand control liner, and a packer for the sand control liner. The monitoring and transmission system incorporates cable thermobarometers, cables, acoustic generators, repeaters, and sonar tools. Among them, the cable thermobarometer is mounted and fixed around the periphery of the sand control liner and is connected to the acoustic generator via a cable. The acoustic generator is a device for generating frequency acoustic information and is mounted and fixed around the periphery of the sand control liner. The acoustic wave is transmitted through the sand control liner of the lower completion to the tubing of the upper completion and to the first-stage repeater strapped to the upper completion. The repeaters are located in the tubing of the upper completion, and the tubing is provided with multiple acoustic repeaters to ensure that the bottom hole signals are reliably propagated to the top of the well. The sonar tool is placed on the Blowout Preventer (BOP) architecture to receive and transmit telemetry signals from the down-hole and communicate with the vessel by sending ultrasonic pulses through the sonar into the water and then monitoring the echo return, which provides a complete echo response.
For the detection system based on acoustic transmission, the acoustic transmission path can be divided into two sections: one is the acoustic transmission at the bottom hole, from the acoustic generator to the extended connecting tube of the sand control liner, then to the liquid–oil tubing-acoustic repeaters, following the main transmission path of solid–liquid–solid. Another is acoustic transmission by multiple repeaters in a pipe string system, where the main transmission path is a multilayer pipe string system dominated by tubing. This section focuses on the acoustic transmission characteristics of the periodic multilayer pipe string, which provides a theoretical basis for guiding the arrangement of repeaters and the selection of acoustic transmission channels. In this regard, this study focuses on the periodic multilayer pipe string system as the subject investigated, and establishes a finite element simulation model of the acoustic transmission of the periodic tubular column based on the structure of the well body of drilling wells in the second round of hydrate test production in China [31]. It further investigates the acoustic transmission characteristics of the periodic pipe string, as well as the effects of the structural parameters of the pipe string system, the acoustic transmission frequency, the interval among the repeaters, and the lawful acoustic transmission characteristics.
In this study, the production casing adopts 9-5/8″ casing (outer diameter: 244.5 mm, inner diameter: 220.5 mm). The extended connecting tubes of the sand control liner are located between the casing and the oil casing to connect the sand control liner and the packer for the sand control liner fixed with the casing seat seal, while the sand control liner is in contact with the casing gap. The size of the sand control liner is 5-1/2″ (outer diameter: 139.7 mm, inner diameter: 121 mm). Oil tubing is the pipeline located in the innermost layer, which is the key channel for transporting oil and gas from underground to the surface. Due to the horizontal straight well, the oil tubing is in contact with the extended connecting tubes of the sand control liner under the action of gravity. The gas flow line adopts 3-1/2″ EUE tubing (outer diameter: 88.9 mm, inner diameter: 76 mm) and 2-3/8″ EUE tubing (outer diameter: 60.3 mm, inner diameter: 50.3 mm). The depth of the 3-1/2″ tubing is up to 10 m above the packer for the sand control liner, and then it turns to 2-3/8″ tubing to be lowered into the sand control liner.

2.2. Numerical Simulation of Acoustic Transmission in the Pipe String

2.2.1. A Finite Element Model for Acoustic Transmission

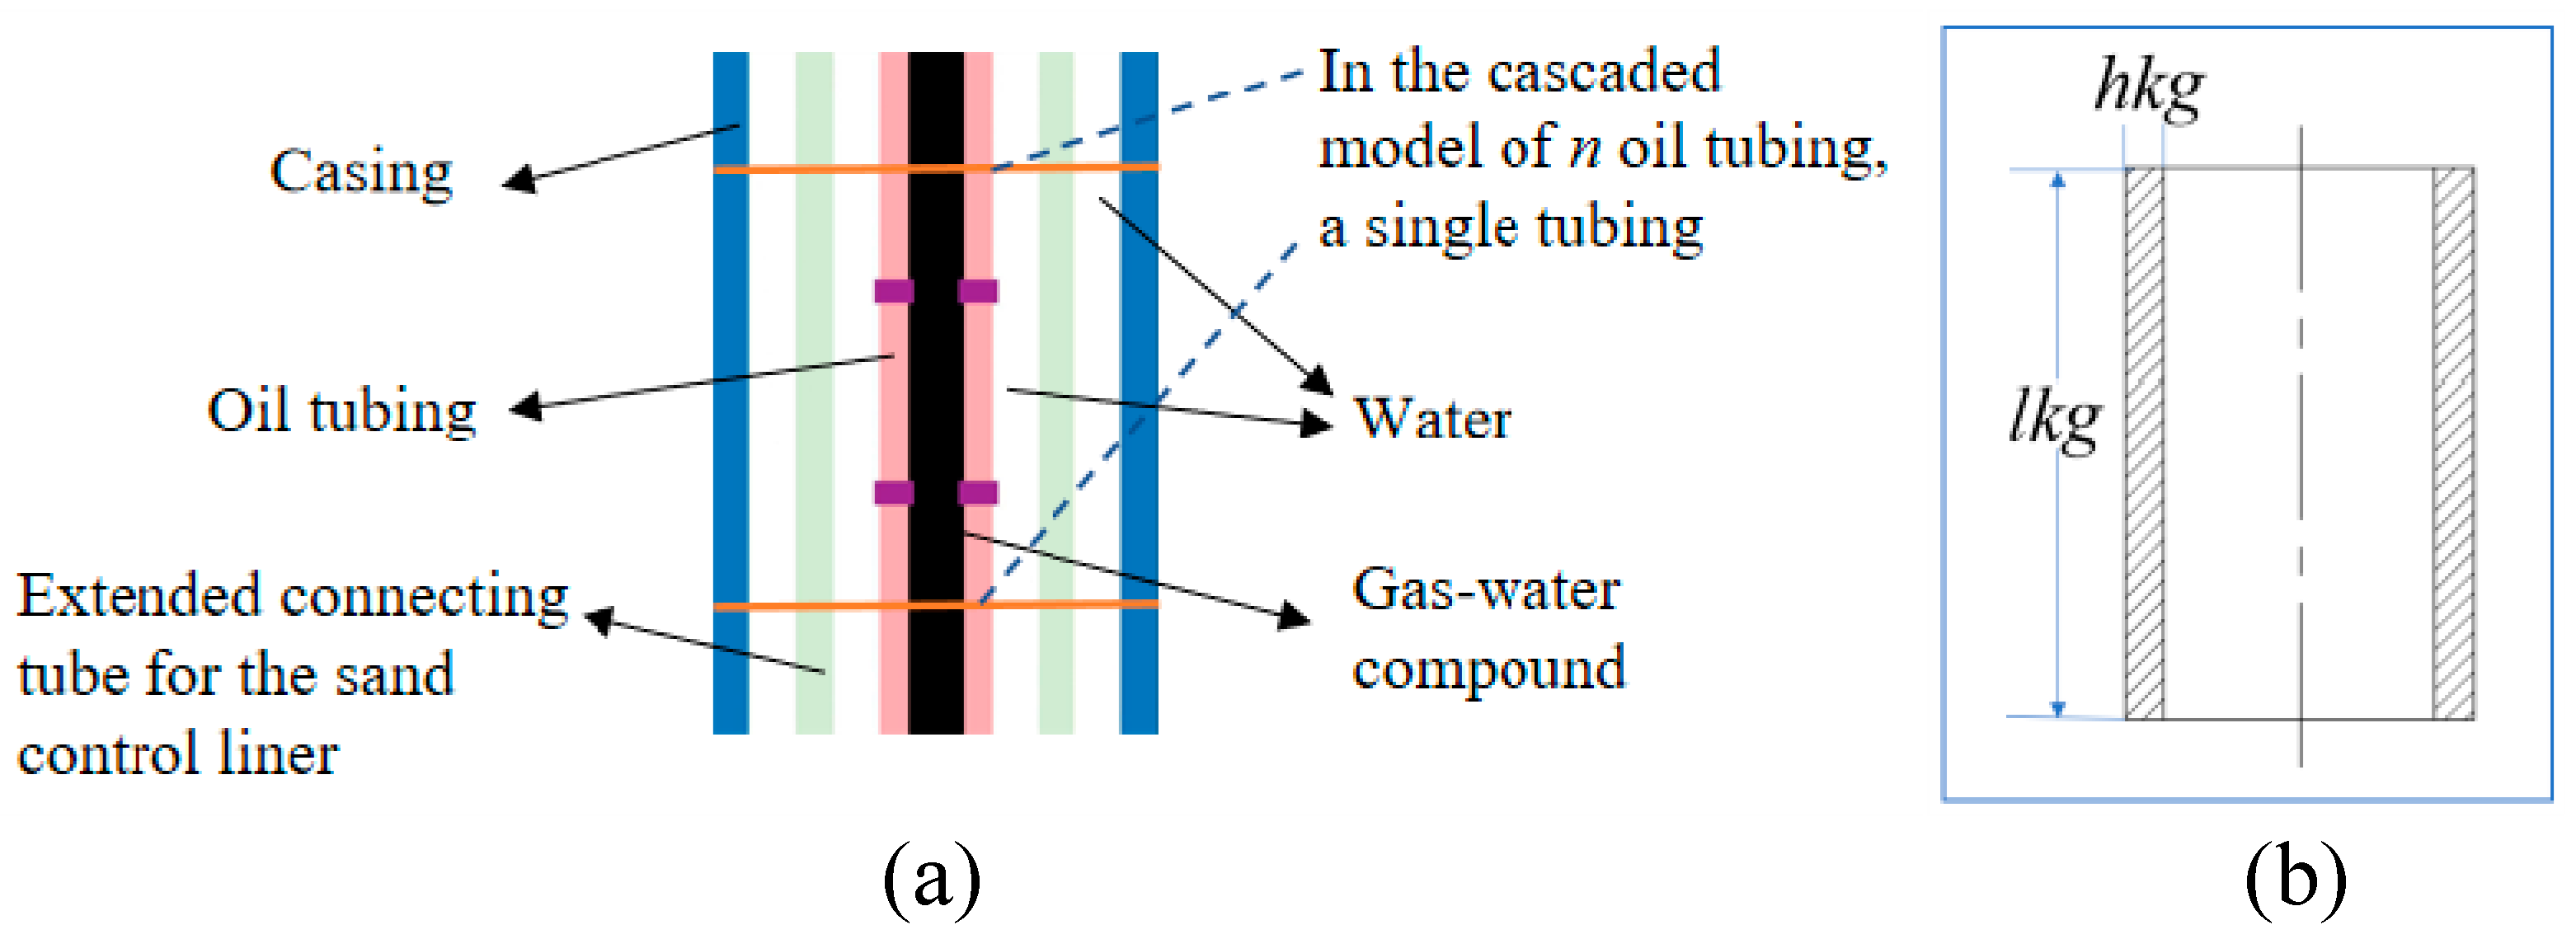
The oil tubing is connected by the connecting clamps to form a periodic string acoustic transmission system composed of multiple cascaded oil tubings. In COMSOL, the model construction process is as follows: First, half of two tubes and their connecting clamps are intercepted as a geometric unit. The linear array function in the software is utilized, and the array parameter n is set to control the number of tubing cascades. Specifically, the length of the tubing cascade number is equal to the spacing of the repeater arrangement. Since the oil tubing, as the innermost pipeline, is usually more than 1000 m long, a two-dimensional axisymmetric model is adopted to simplify the computation. However, this simplification may overlook 3D effects like pipe eccentricity, and the homogeneous gas–water mixture assumption ignores multiphase inhomogeneity, potentially introducing prediction biases. In setting up the physical field, a pressure acoustic is used in the liquid and solid mechanics of the structural steel, and the whole content is investigated using an acoustic-solid clamp. In this case, a homogeneous liquid (gas-water compound) is filled between the casing and the extended connecting tubes of the sand control liner, between the extended connecting tubes of the sand control liner and the oil tubing, and inside the oil tubing. The simplified model of the string system and the medium settings are shown in Figure 2a. The medium physical parameters are set as shown in Table 2, and the connection sizes at the oil tubing clamp are shown in Figure 2b.
Among them, the left boundary of the gas–water compound in the oil tubing is set as an axisymmetric boundary condition to ensure the validity of the two-dimensional axisymmetric model; the upper and lower boundaries of the pipeline fluid are set as plane-wave radiation, which implies that the acoustic can be propagated and absorbed on the upper and lower surfaces of the pipeline fluid and will not be reflected. The upper and lower boundaries of the oil tubing, the extended connecting tubes of the sand control liner, and the casing are set as free boundary conditions, which means that there is no constraint on their displacements, and the acoustic wave propagation will not be interfered with by the edges. The outside of the casing is set as a fixed constraint to show that it is buried in the ground and is constrained by the ground. The packer for the sand control liner is set as a fixed constraint to the casing, the sand control liner is set as a fixed constraint to the casing, and the two ends of the extension pipe are affected by the fixed constraints of the packer for the sand control liner and the sand control liner. The frequency range studied was 20–2000 Hz.
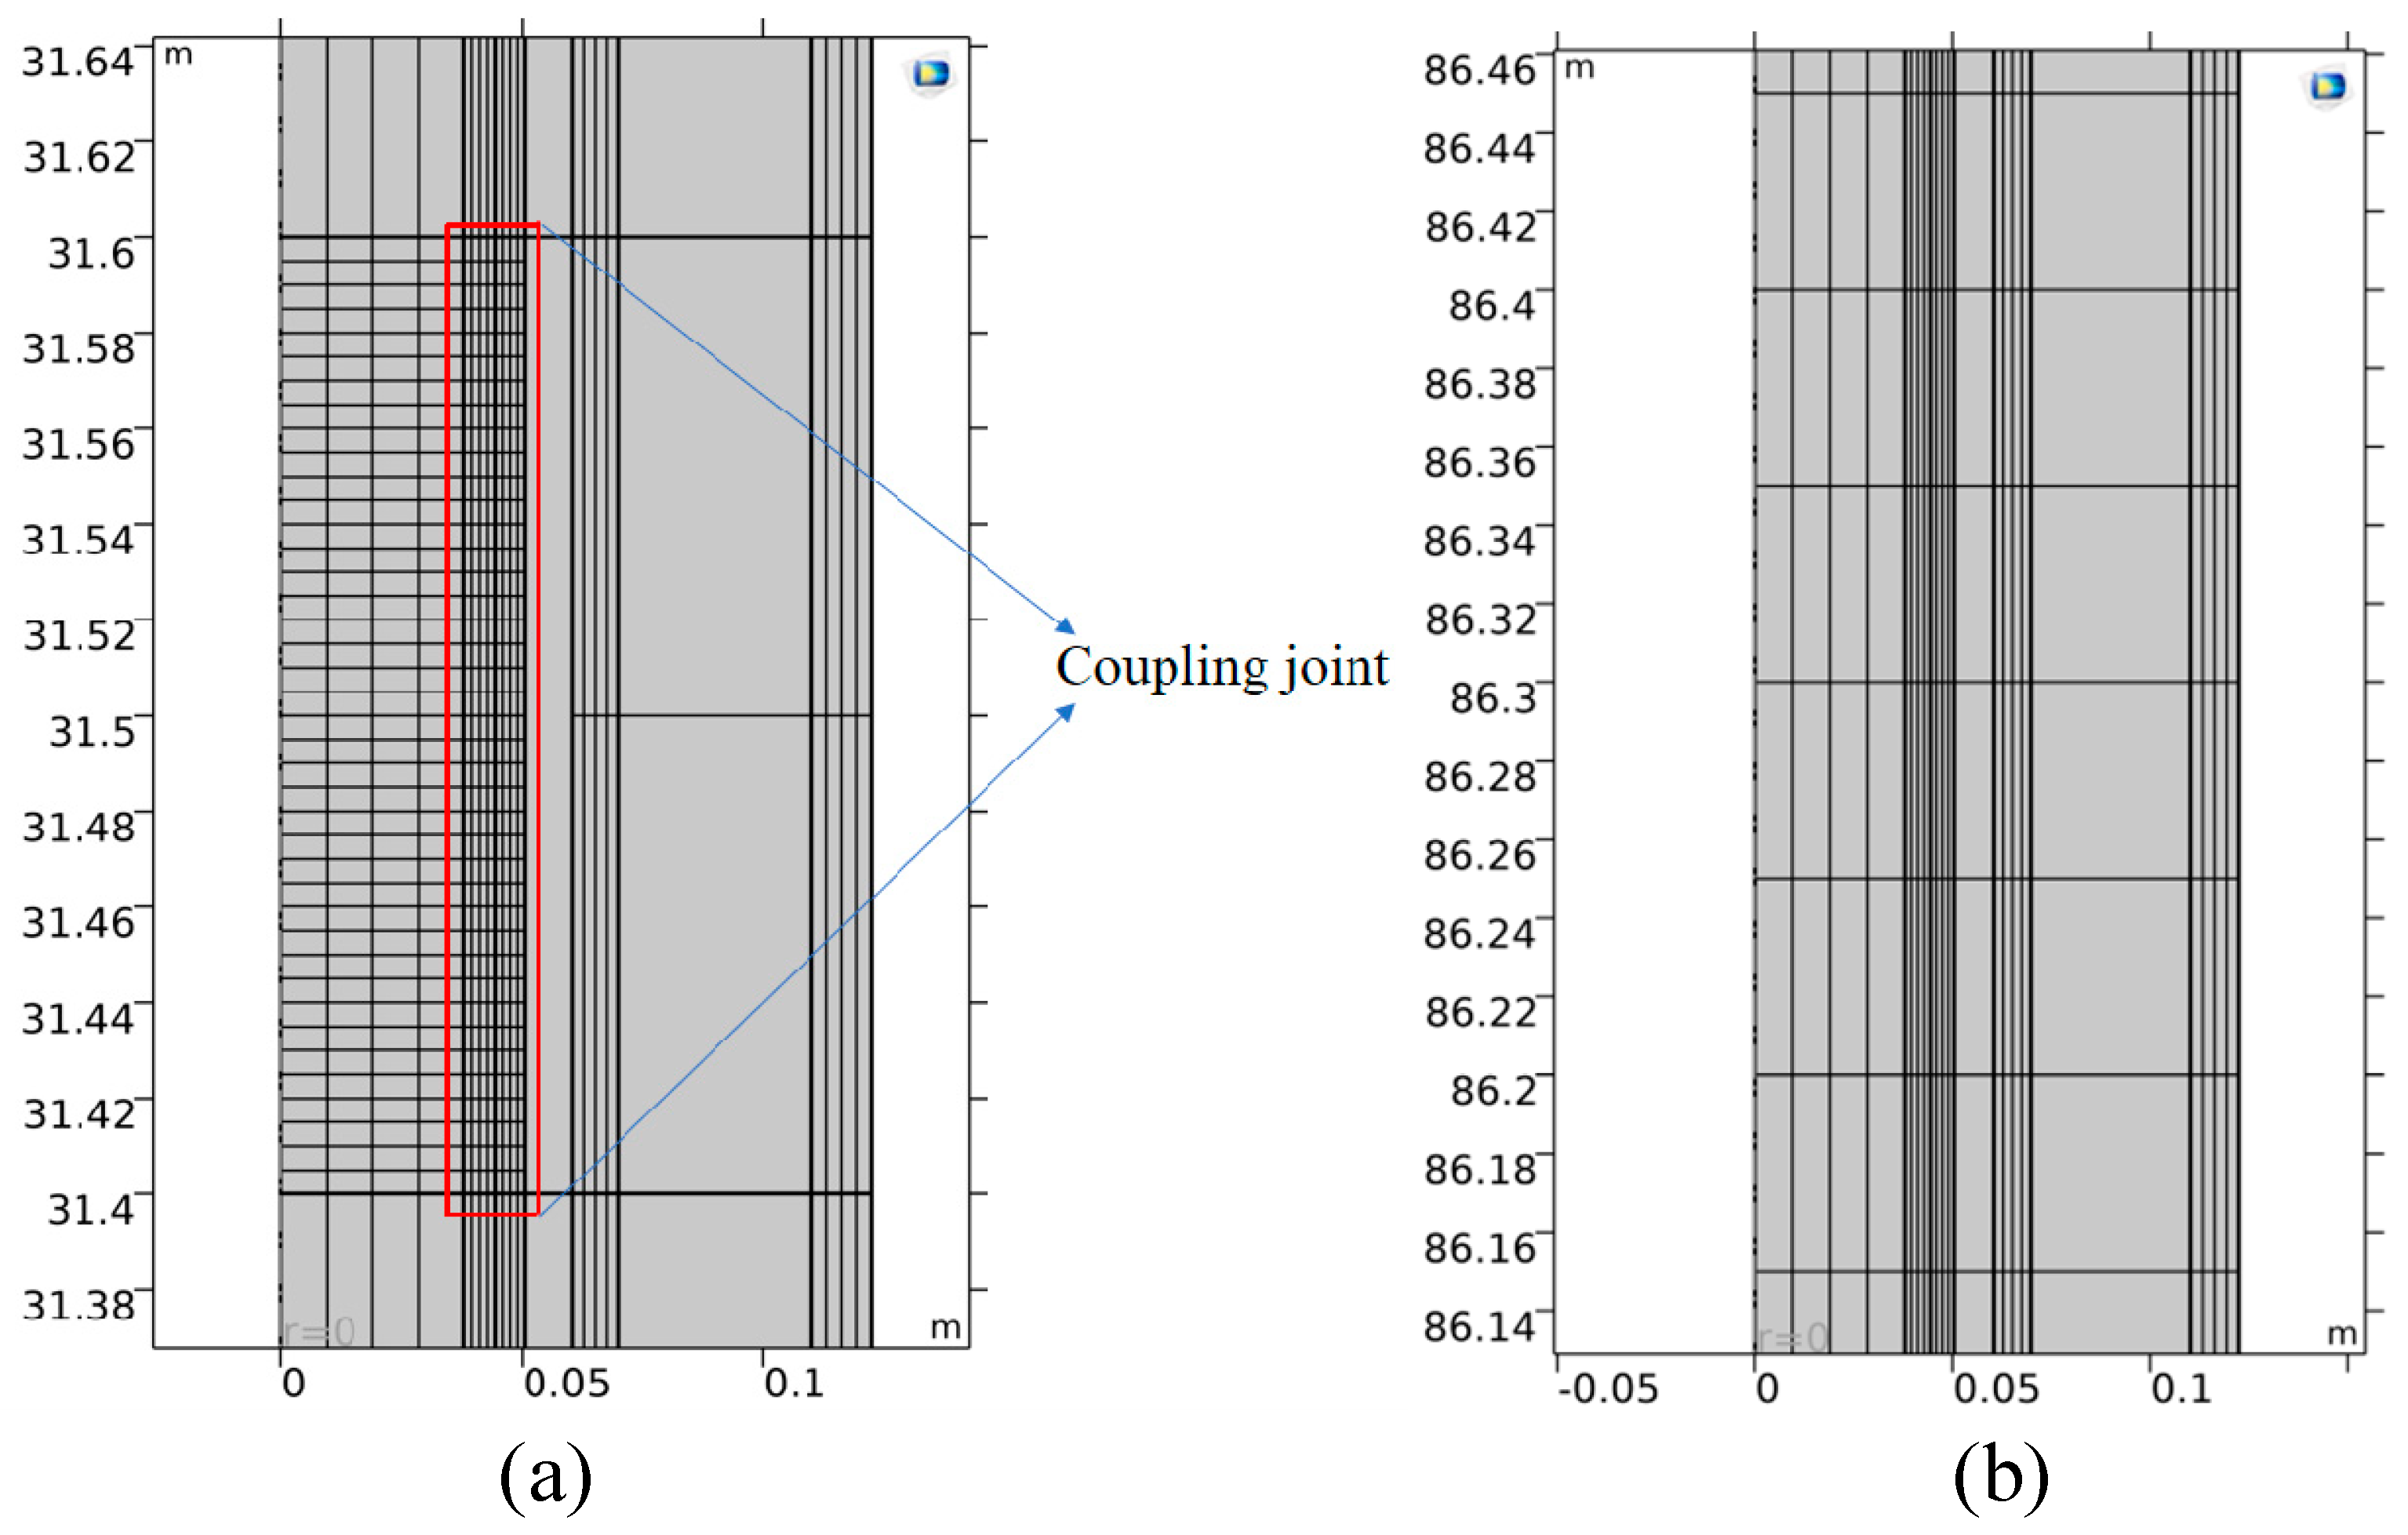
Through grid-independence verification, the cell size of the designated splicing area is set to 0.005 m, and the designated tubing located at the boundary of the symmetry axis is set to 0.01 m. The rest of the area is gridded by the mapping method, and a regular quadrilateral grid is drawn, with a total of 172,816 grid cells, which are divided into 20 cascade drill pipe individual models. The grid distribution results are shown in Figure 3.

2.2.2. Evaluation Metrics for the Acoustic Transmission Characteristics

This study is intended to evaluate the acoustic transmission characteristics of the string system by using the sound pressure amplitude ratio, tubing displacement ratio, and sound pressure attenuation, where the sound pressure amplitude ratio is defined as the ratio of the sound pressure amplitude at the exit and incident end to assess the transmission loss, the tubing displacement ratio is defined as the ratio of the displacements at the exit and incident end of the tubing to assess the characteristics of the pipe string system in terms of the eigenfrequencies, and the sound pressure attenuation is defined as the ratio of the incoming and outgoing acoustic energy to assess the energy loss of acoustic transmission in the pipe string system [32]. These indicators collectively offer a comprehensive perspective on the acoustic behavior within the system, complementing each other to capture transmission efficiency, structure–frequency interactions, and energy dissipation. The formulas for these three calculations are as follows:
T L = p o u t p i n
T W = W o u t W i n
d w = 10 log w in   w out  
where T L is the transmission loss (ratio of sound pressure amplitude at the exit and incident end), p o u t is the sound pressure at the exit end, p i n is the sound pressure at the incident end; T W is the tubing displacement ratio (ratio of displacement at the exit and incident end of the tubing), W o u t is the displacement at the exit end of the tubing, W i n is the displacement at the incident end of the tubing; d w is the sound pressure attenuation inside the tubing, and w in   and w out   denote the incident power at the inlet and the output power at the outlet, respectively.

2.3. Parameters for Acoustic Transmission Analysis of Pipe Strings

The parameters studied in this paper are the number of tubing cascades, the hoop size, and the frequency of acoustic transmission. With increase in the number of cascades, the acoustic propagation path length and the transmission loss and delay also increase. The hoop will induce reflection and scattering of the acoustic wave transmission due to the sudden change in structure, which will also lead to attenuation of the acoustic wave. With respect to the transmission frequency, it is known from previous studies that the acoustic transmission frequency of the pipe string system has a comb-like structure with alternating band-pass and band-stop distribution. In this regard, this paper explores its effects on the acoustic transmission performance of the law, the specific research parameters, and their range of change from the oil tubing cascade number, hoop size, and transmission frequency, as shown in Table 3.
The thickness and width of the oil tubing connection hoop are affected by the working conditions of the pipeline, the application requirements, and the industry standards followed. In general, the thickness of the clamp usually ranges from 5 mm to 20 mm, and the width ranges from 200 mm to 1500 mm or more. For simulation purposes, the ranges of the value for the parameters lkg and hkg in this paper are the same as those specified in the standards. The two specifications involved in this paper are 3-1/2″ EUE tubing and 2-3/8″ EUE tubing, and the dimensional specifications for the clamps refer to the API specification dimension table for external thickened tubing and clamps.
In the test well, high-frequency signals attenuate rapidly beyond 1000 m. High-frequency simulations above 2000 Hz in COMSOL require extremely fine meshing, leading to a sharp increase in computational cost for 20 kHz and prolonged calculation time. Future work will adopt a hybrid method-using the finite element method for frequencies below 2000 Hz and analytical models, such as the transfer matrix method, for frequencies above 2000 Hz-to extend the frequency range to 20 kHz.

2.4. Analysis of Pipe String Acoustic Transmission Simulation Results

2.4.1. Cloud and Line Plots of the Sound Pressure and Sound Pressure Level in the Pipe String at Different Frequencies

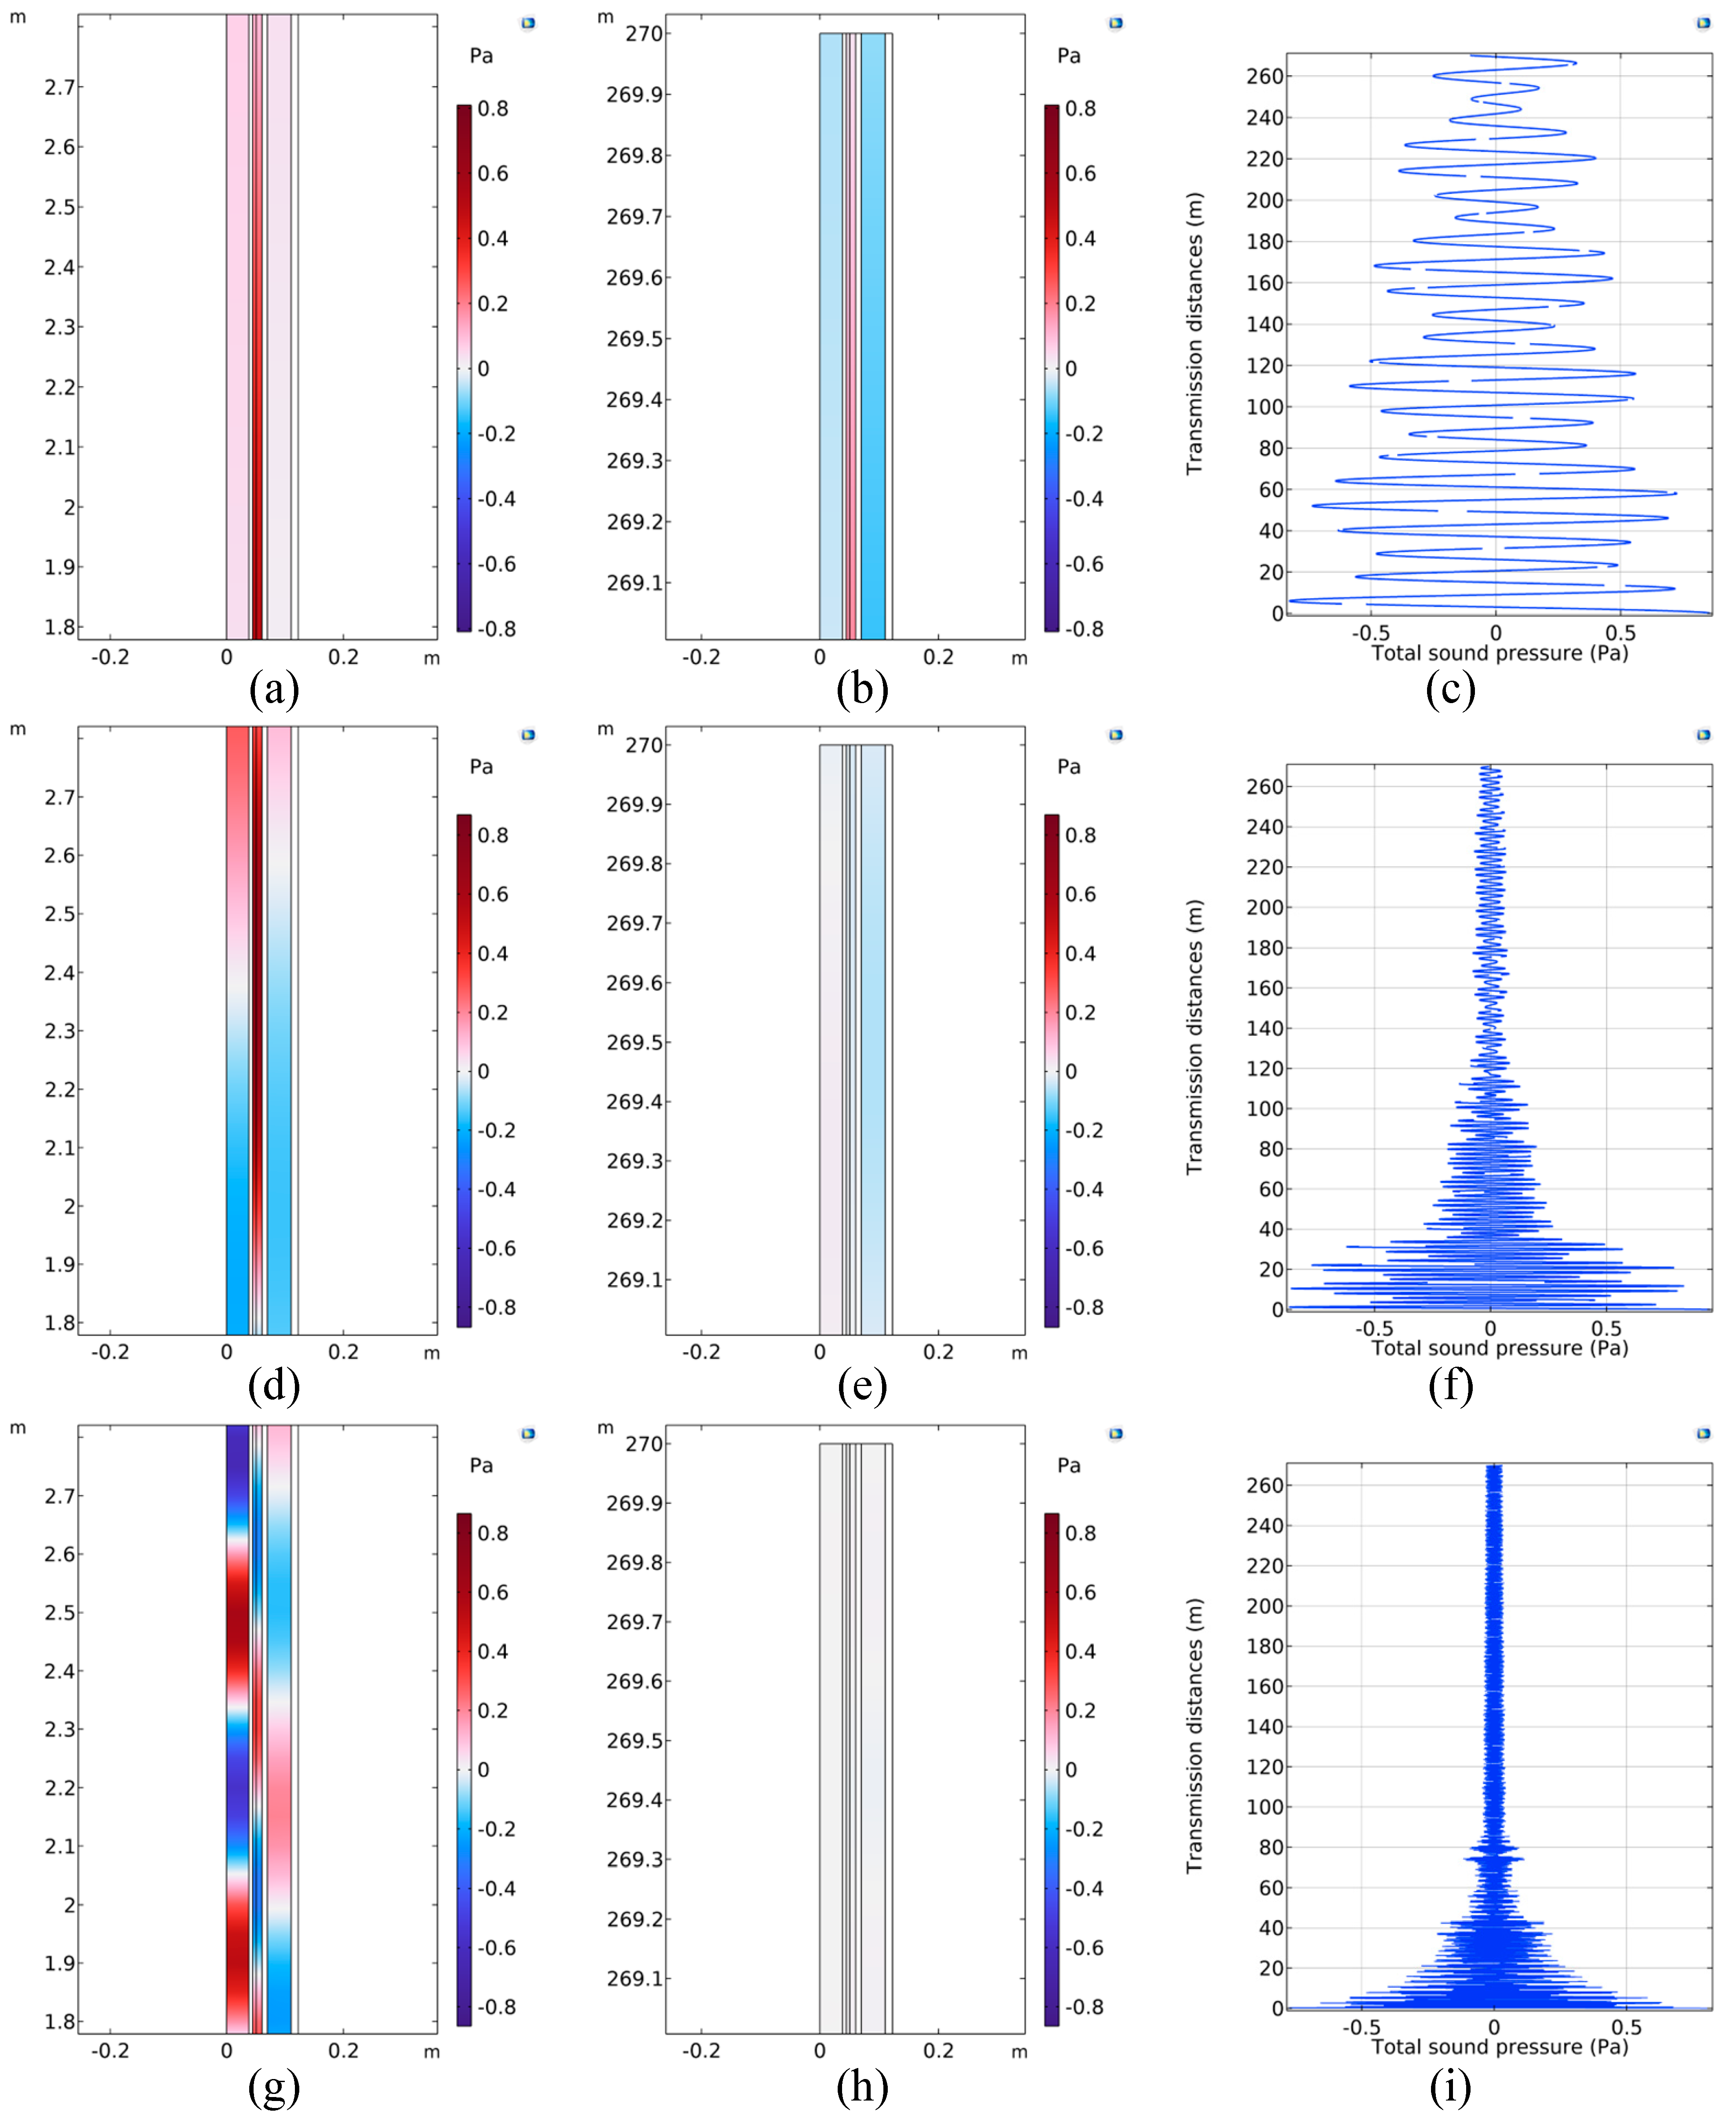
Figure 4 shows the sound pressure cloud diagrams of the incident end and the outlet end at different frequencies, as well as the curve diagram of the change in the sound pressure with transmission length. From the sound pressure cloud diagram, it can be seen that at the incident end, the water at the location where the acoustic repeater is installed, i.e., between the oil tubing and the extended connecting tubes of the sand control liner, generates the largest sound pressure, followed by that inside the oil tubing, and then that inside the casing. At the incident end of the sound source, the transmission loss occurs at different frequencies. As the frequency becomes larger, the wavelength of the sound pressure fluctuation becomes smaller in the three media. In these three separated media, under the action of the same sound source, their wavelengths differ from each other, and the wavelength of the water located in the extended connecting tubes of the sand control liner is the shortest among the three at the same sound source frequency. At the exit end, the sound pressure attenuates to a certain extent at different frequencies, and the attenuation is more obvious as the frequency rises. At the same time, it can be seen that at the exit end, the wavelength is inconsistent in these three media. As a result, the exit end of these three acoustic pressures presents a phase difference, which is more pronounced at high frequency. From the sound pressure graph, it can be seen that there is a comb-like phenomenon of an alternating band-pass and band-stop distribution of the acoustic wave along the direction of the transmission distance. The sound pressure with increase in the transmission distance shows a trend of attenuation. With increase in the transmission frequency, the sound pressure attenuation amplitude increases significantly and advances into a greater attenuation state, the attenuation is more obvious, and most of the sound pressure attenuation reaches up to 90%.
The sound pressure level is a physical quantity used to express the level or intensity of sound or sound pressure, usually expressed in decibels (dB). The sound pressure level is a popular way of quantifying the intensity of sound in acoustics and is used to describe the loudness of a sound or the intensity level of auditory perception [34].
Figure 5 shows the cloud plots of the sound pressure level at the incident and exit end at different frequencies, as well as a plot of variation in the sound pressure level with transmission length. From the sound pressure level cloud plot, it can be seen that the sound pressure level is maximum in the water between the extended connecting tubes of the sand control liner and the oil tubing, followed by the gas–water compound region, while the sound pressure level is minimum in the waters between the casing and the extended connecting tubes of the sand control liner. At the incident end of the sound source, the sound pressure level rises with increase in the transmission frequency, and the wavelength of the sound pressure level fluctuations becomes shorter in all three media. In addition, the acoustic wavelength in the three different media differs in the same sound source, and the wavelength of the water in the extended connecting tubes of the sand control liner is the shortest at the same frequency. At the outlet end, the sound pressure level attenuates to a certain extent at different frequencies, and the attenuation is more obvious as the frequency increases. From the sound pressure level curve graph, it can be seen that with increase in the acoustic wave transmission distance, the sound pressure level attenuates to a certain extent. With increase in transmission frequency, the attenuation of the oscillation is more intense; the attenuation of the sound pressure level mostly ranges between 60 dB and 100 dB.

2.4.2. Evaluation Indexes of Acoustic Transmission Characteristics

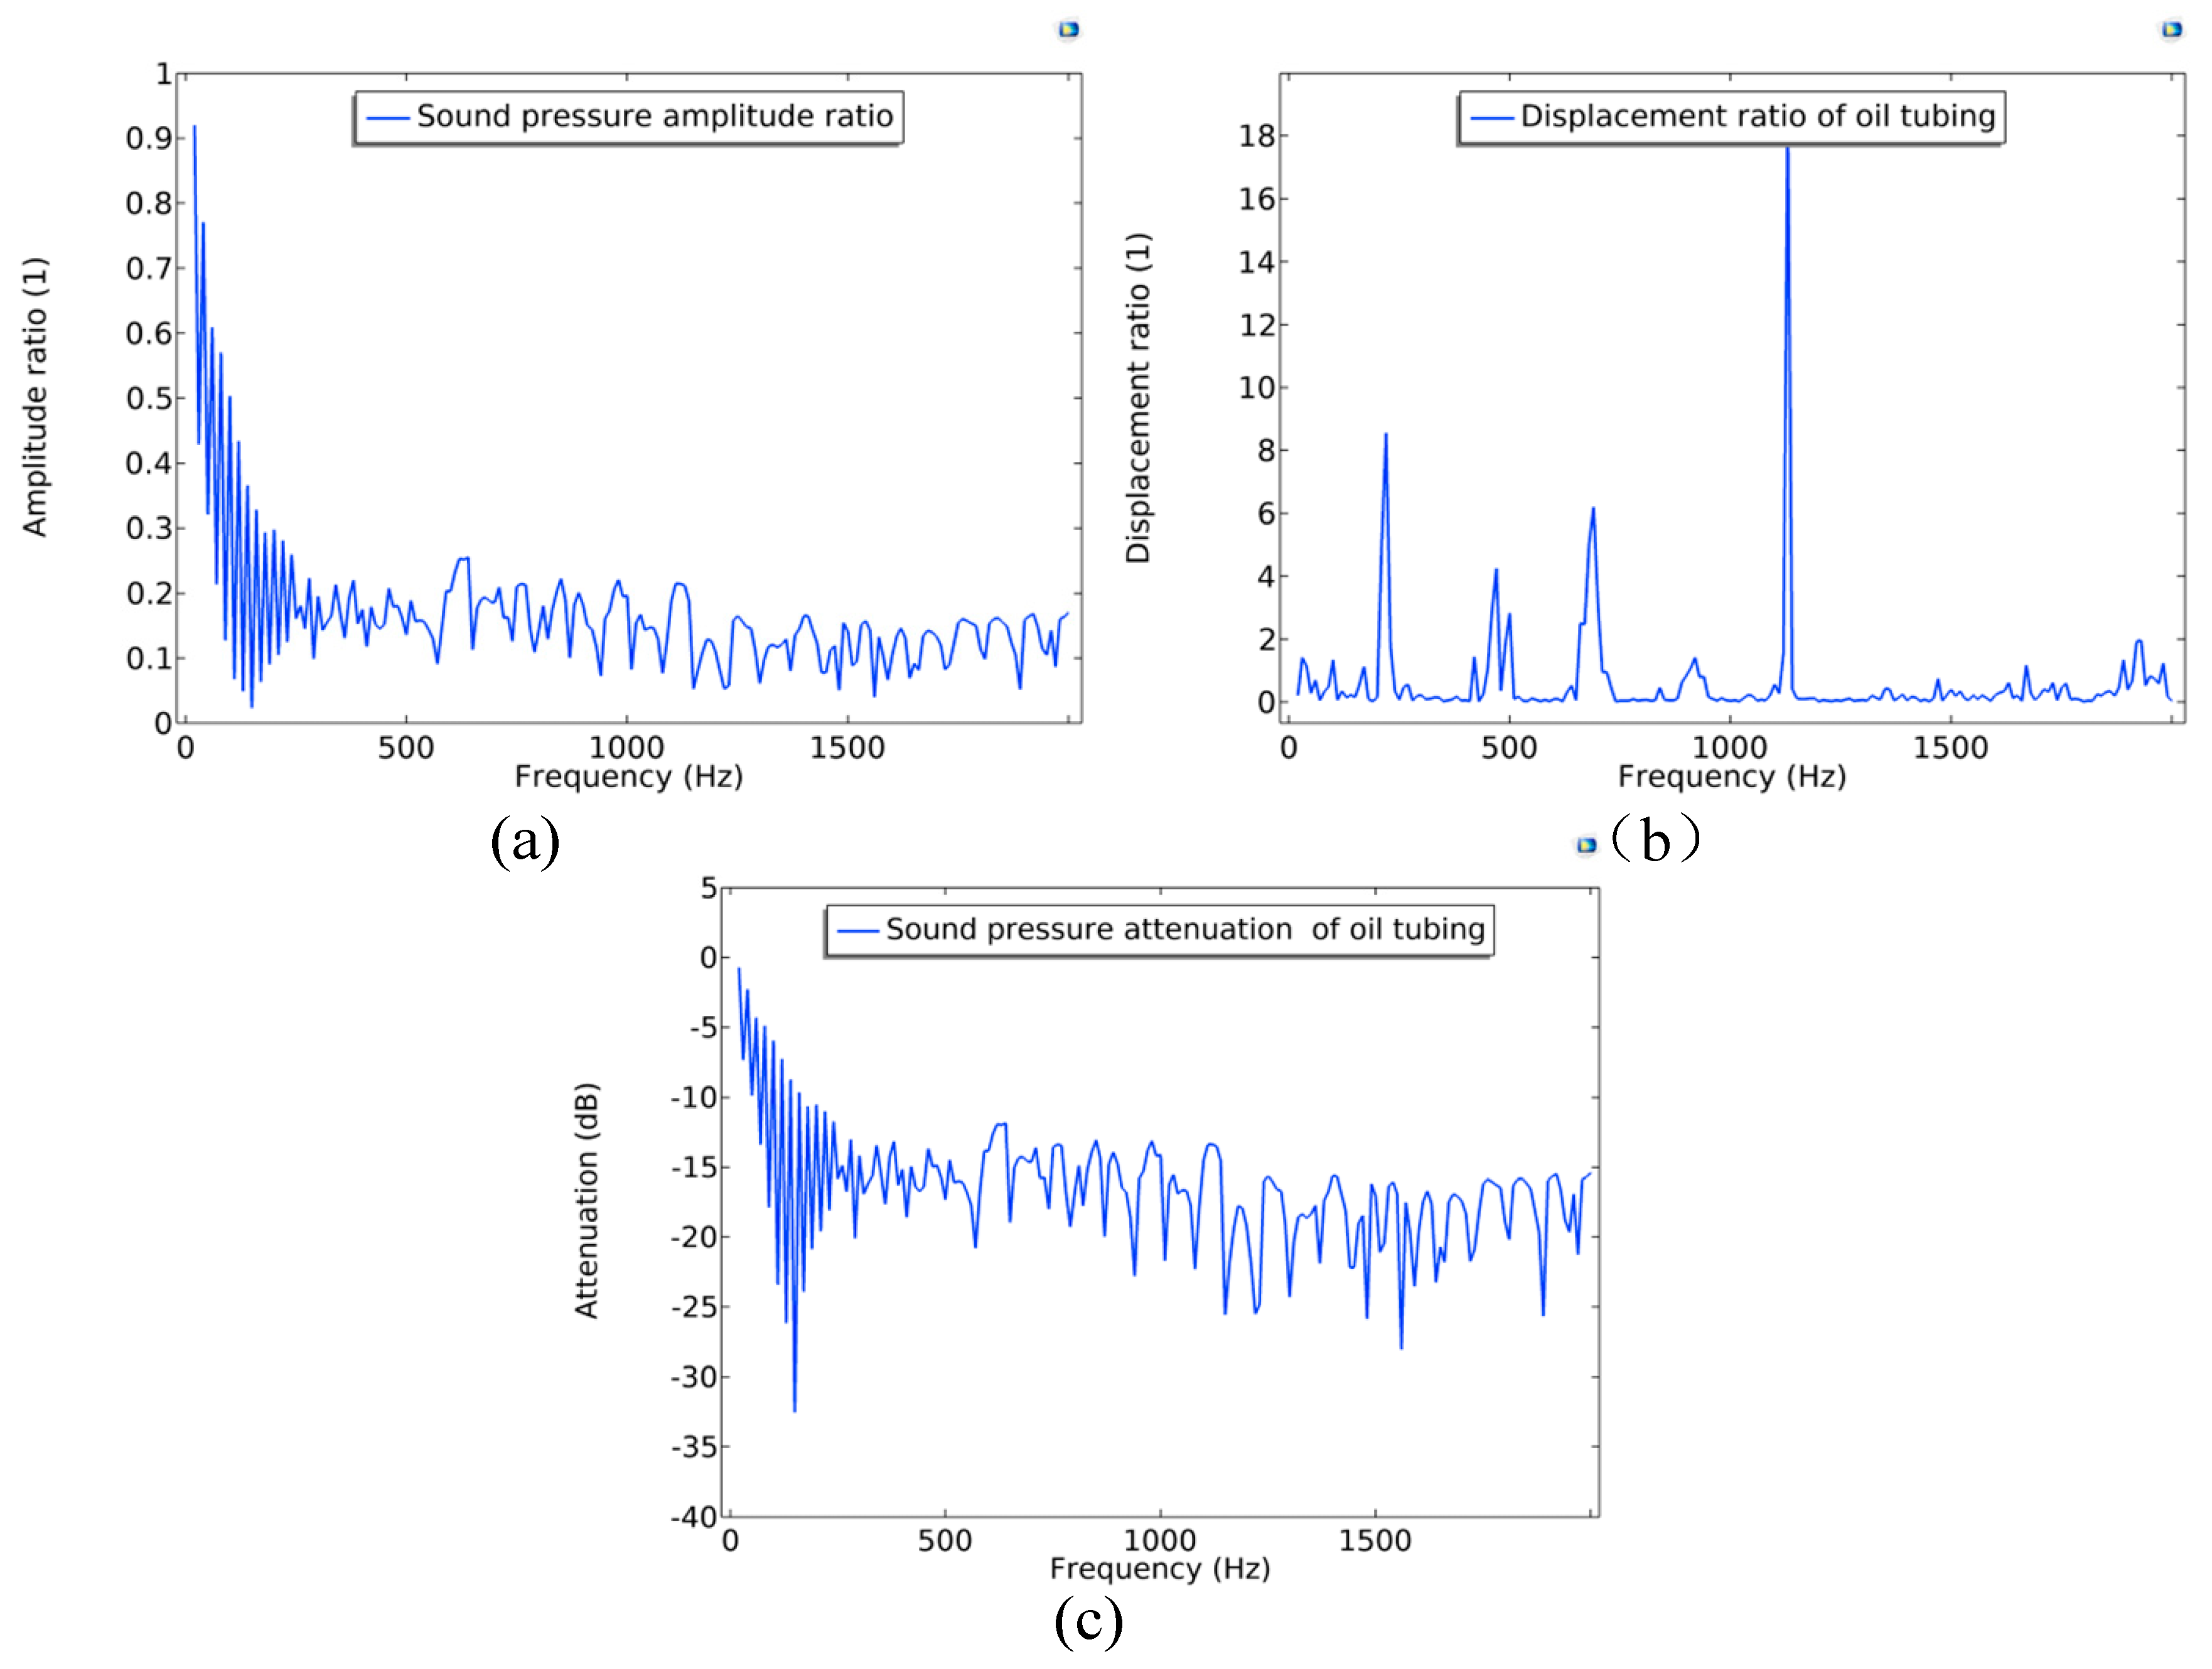
Figure 6 shows the acoustic transmission characteristic curves at different frequencies. From the sound pressure amplitude ratio curves, it can be seen that the sound pressure amplitude ratio between the outlet end and the incident end of the piping system cascaded through 30 tubes shows different degrees of loss. The loss increases with reduction in the frequency, with most of the attenuation reaching 90% by the time it exceeds 2000 Hz. It can be seen from the displacement ratio curves of the tubes that the displacement ratio of the tubes is near the characteristic frequency, even beyond the source end due to the resonance, which implies that in the structural domain, within the range of the frequency of the wave peaks, its sound propagation will be more efficient. It can also be seen that as the transmission frequency increases, the amplitude of the vibration at the outlet end remains low, and even at the attachment of the characteristic frequency, the wave peaks are much lower than the amplitude at a lower frequency. This means that it is more reasonable to use a transmission frequency lower than 1500 Hz in the acoustic transmission of the oil pipe. From the several wave peaks, it can be seen that suitable frequencies for transmission are 230 Hz, 460 Hz, and 690 Hz, respectively. From the acoustic pressure attenuation curves of the oil pipe, it can be seen that attenuation of the acoustic pressure is less at low frequency, and with increase in frequency, the max. acoustic pressure attenuation reaches 19 dB at 1640 Hz, which means this frequency is not suitable for acoustic transmission.

2.4.3. Effects of the Number of Oil Tubing Cascades on Acoustic Transmission Performance

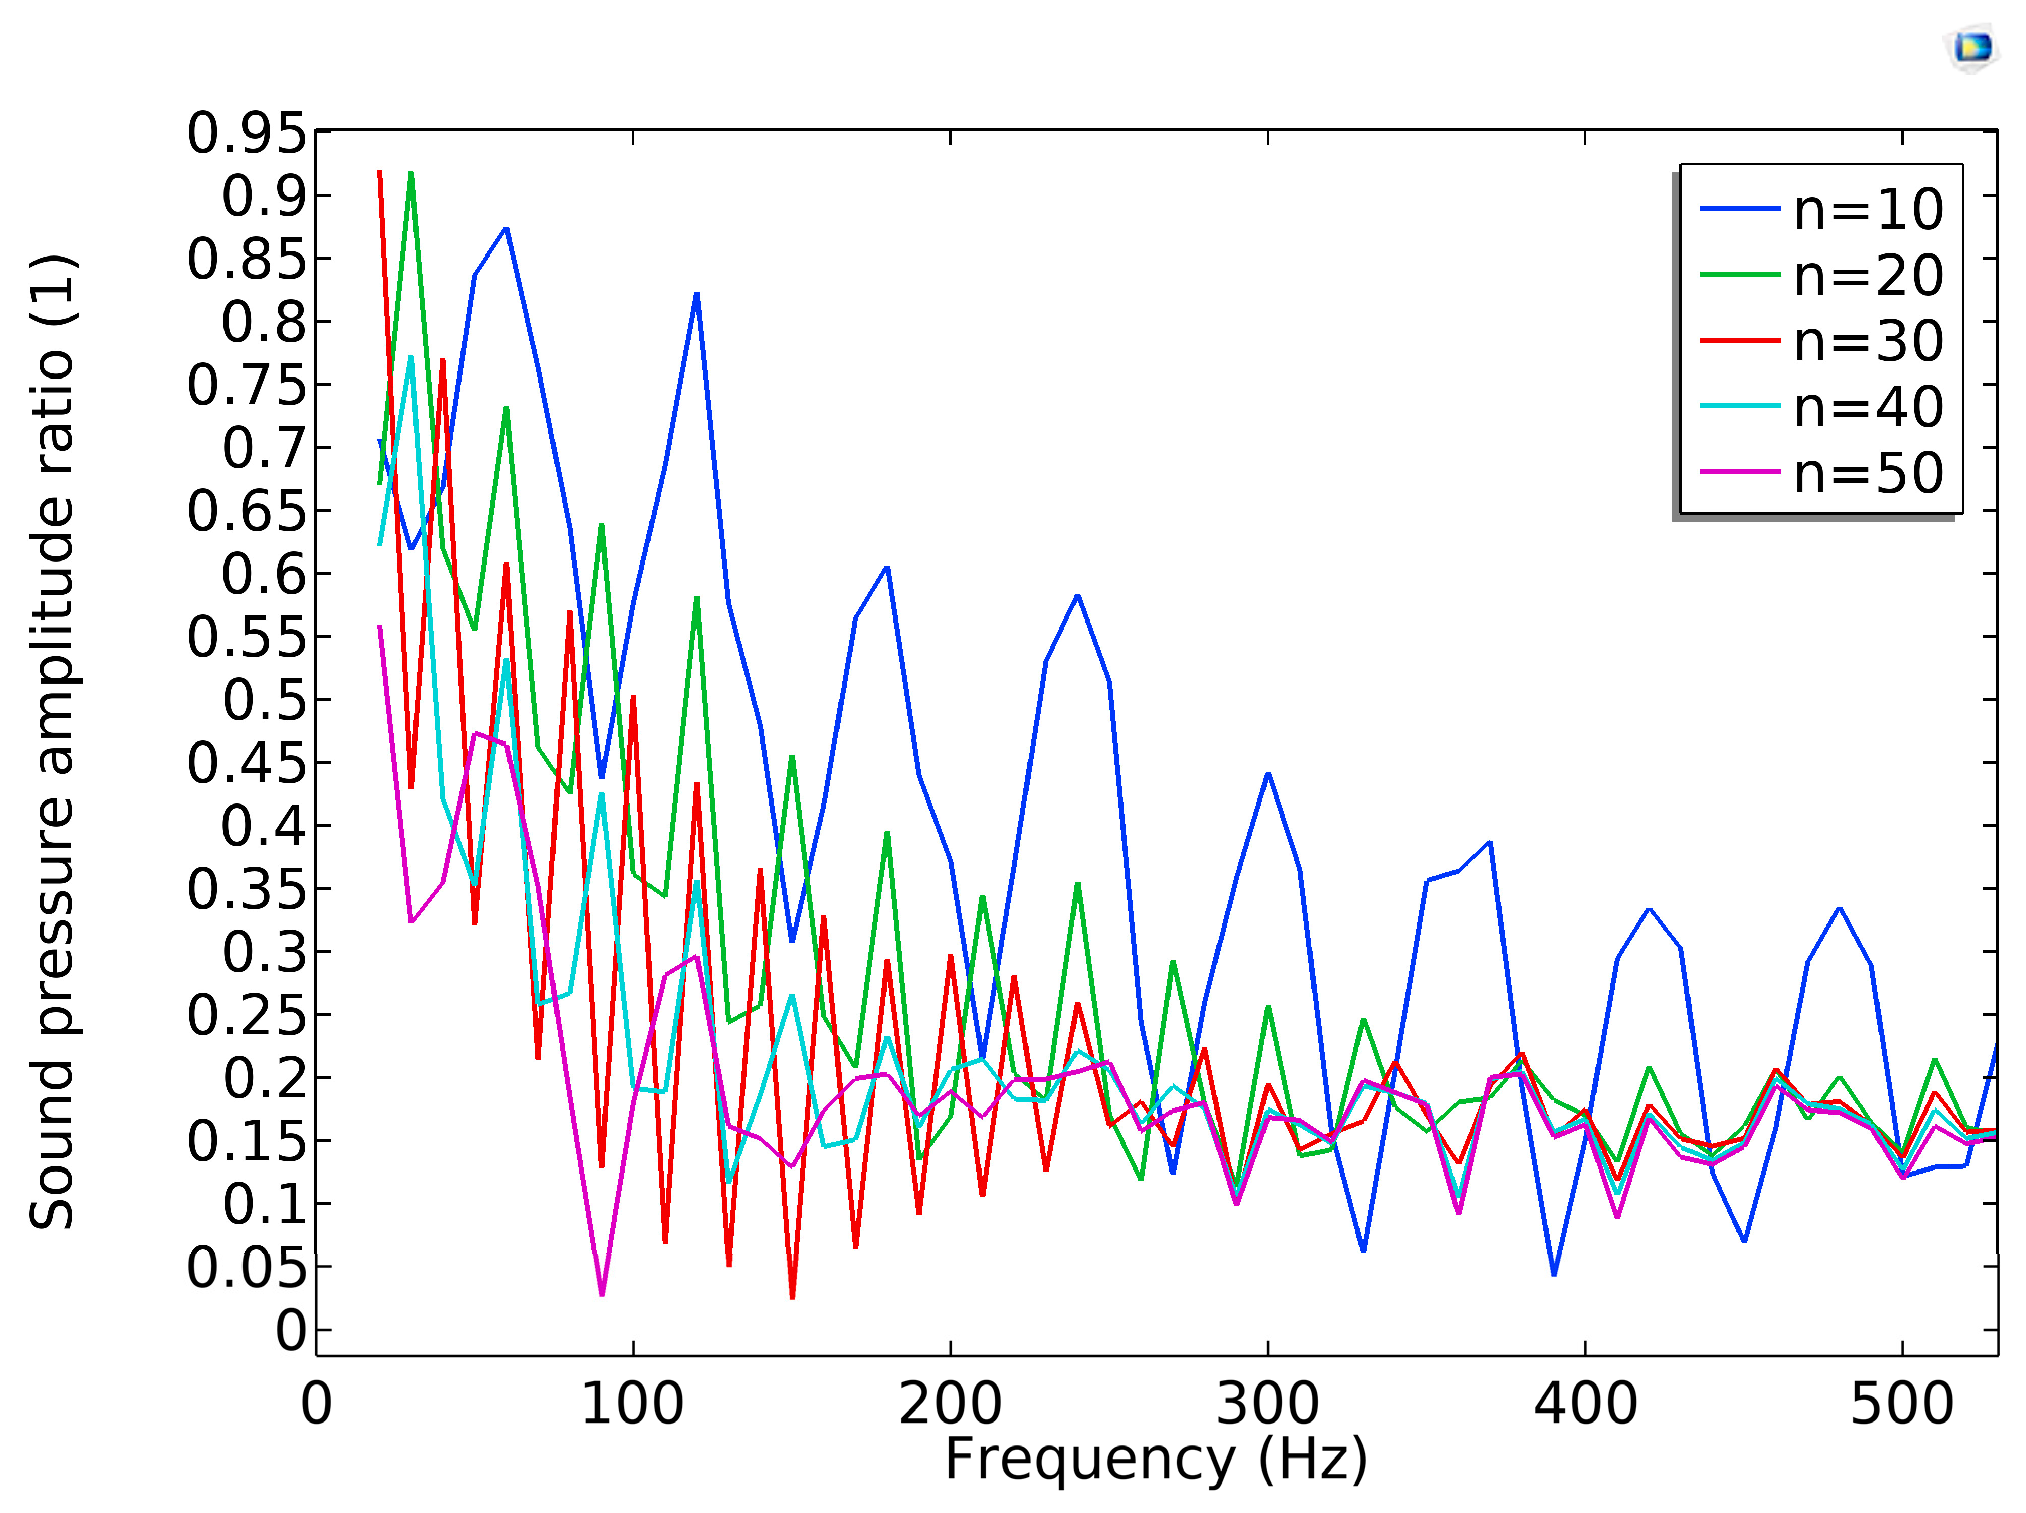
The investigation of the effects of the number of oil tubing cascades on the acoustic transmission performance helps to provide a rational basis for the spacing arrangement of the repeaters. Parametric simulations are carried out for 10, 20, 30, 40, and 50 oil tubing cascades to obtain their sound pressure amplitude ratios at different frequencies to evaluate their attenuation performances. From Figure 7, it can be seen that the amplitude attenuation caused by structural damping loss becomes increasingly serious as the number of pipe string cascades increases, i.e., as the acoustic transmission distance increases, for a specific pipe string channel, the degree of amplitude attenuation varies in different pass bands. The higher the frequency at which the pass band is located, the higher the amplitude attenuation is, so it is not recommended to adopt a high-frequency acoustic signal for data transmission.
From Figure 7, it can also be seen that when the frequency is more than 500 Hz, the sound pressure amplitude ratio is lower than 0.4; so, it can be seen that, for the oil tubing transmission, the operating frequency below 500 Hz is the key interval concerned. In Figure 8, the curves are enlarged, from which it can be concluded that change in the number of cascades of the oil tubing will affect the characteristic frequency of the acoustic transmission to a certain extent. When the number of oil tubing cascades is smaller, the number of wave peaks is less; when the number of oil tubing cascades is larger, more wave peaks are shown, and the eigenfrequency obtained by its solution is higher. From the figure, it is also possible to determine the number of tubing cascades by inferring the amplitude ratio based on the acoustic transmission frequency from the acoustic repeater.

2.4.4. Effects of Hoop Size on Acoustic Transmission Performance

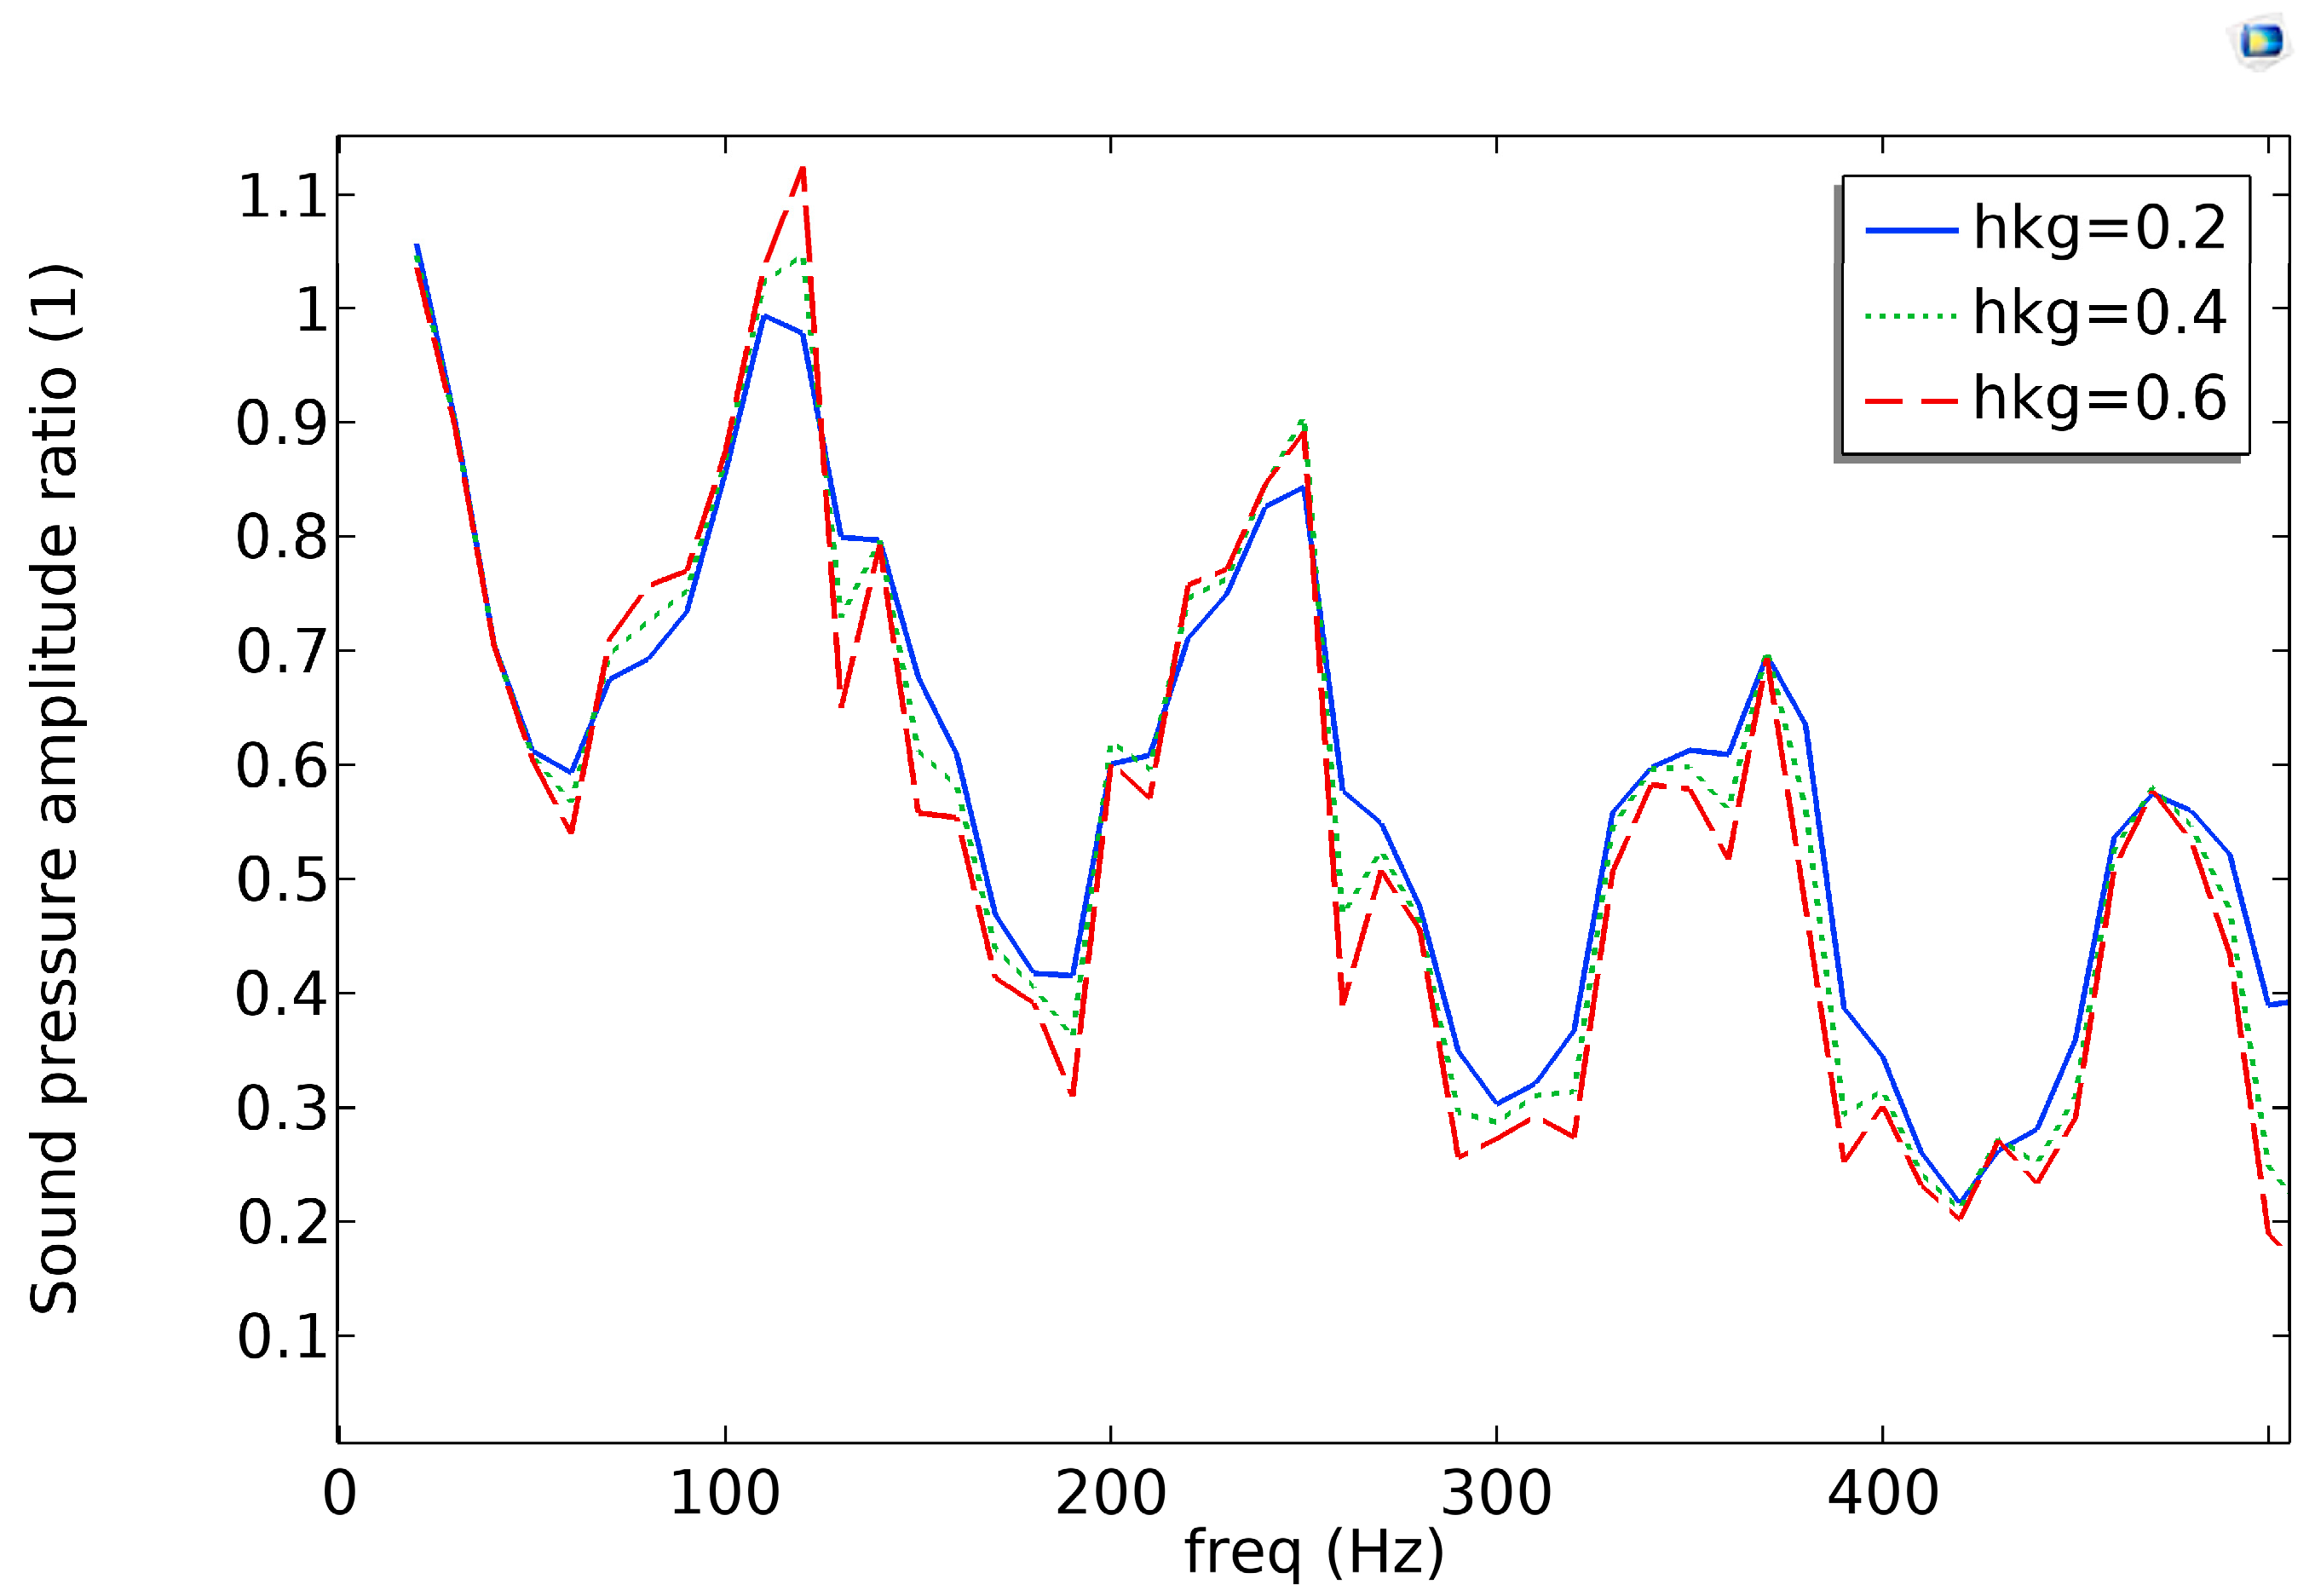
In the acoustic transmission of oil tubing, the effects of the oil tubing clamps on acoustic propagation are mainly reflected in the reflection and scattering of acoustic waves at the clamps. According to the basic principle of acoustic reflection, when the acoustic wave encounters the interface of two different impedance media, reflection and transmission will take place. For this study, the effects of the threaded structure of the clamp and the oil tubing on acoustic transmission are not considered, and the study is carried out considering two parameters, including the wall thickness and the length of the hoop. The wall thickness of the hoop is lkg and the length of the hoop is hkg, which are set as covariates for the parametric scanning study.
Firstly, the length of the hoop is fixed, and the thickness of the hoop is changed to observe the amplitude ratio curves of the acoustic wave in different thicknesses, as shown in Figure 9. It can be seen that change in the thickness of the hoop has few effects on the attenuation curve of the acoustic wave amplitude. This is because the hoop cannot exceed the inner diameter of the extended connecting tubes of the sand control liner, so the change in its cross-sectional area is small compared to the wavelength. The propagation of acoustic waves in the oil tubing occurs mainly as longitudinal waves, and when small changes are encountered in the cross-section, change in the transmission characteristics of the acoustic waves is limited.
To observe the amplitude ratio curves of the acoustic wave with different clamp lengths, the thickness of the clamp is fixed and the length of the clamp is changed, as shown in Figure 10. From the figure, it can be seen that the acoustic transmission characteristics change significantly with length of the hoop, which is mainly reflected in the fact that increase in the length of the hoop will make the eigenfrequency shift to the right, i.e., the eigenfrequency will be increased. At the same time, increase in the length of the hoop also reduces the peak value at a certain wave crest, which leads to a greater attenuation of the sound pressure, which is obvious at a low frequency, especially at the first crest. The increase in length of the hoop significantly reduces the peak value at the first wave crest.

3. Prediction and Parameter Optimization of an Acoustic Transmission Model for Pipe Strings

3.1. LightGBM-Based Prediction of the Acoustic Transmission Characteristic Curves of Pipe Strings

3.1.1. Principles of the LightGBM Algorithm
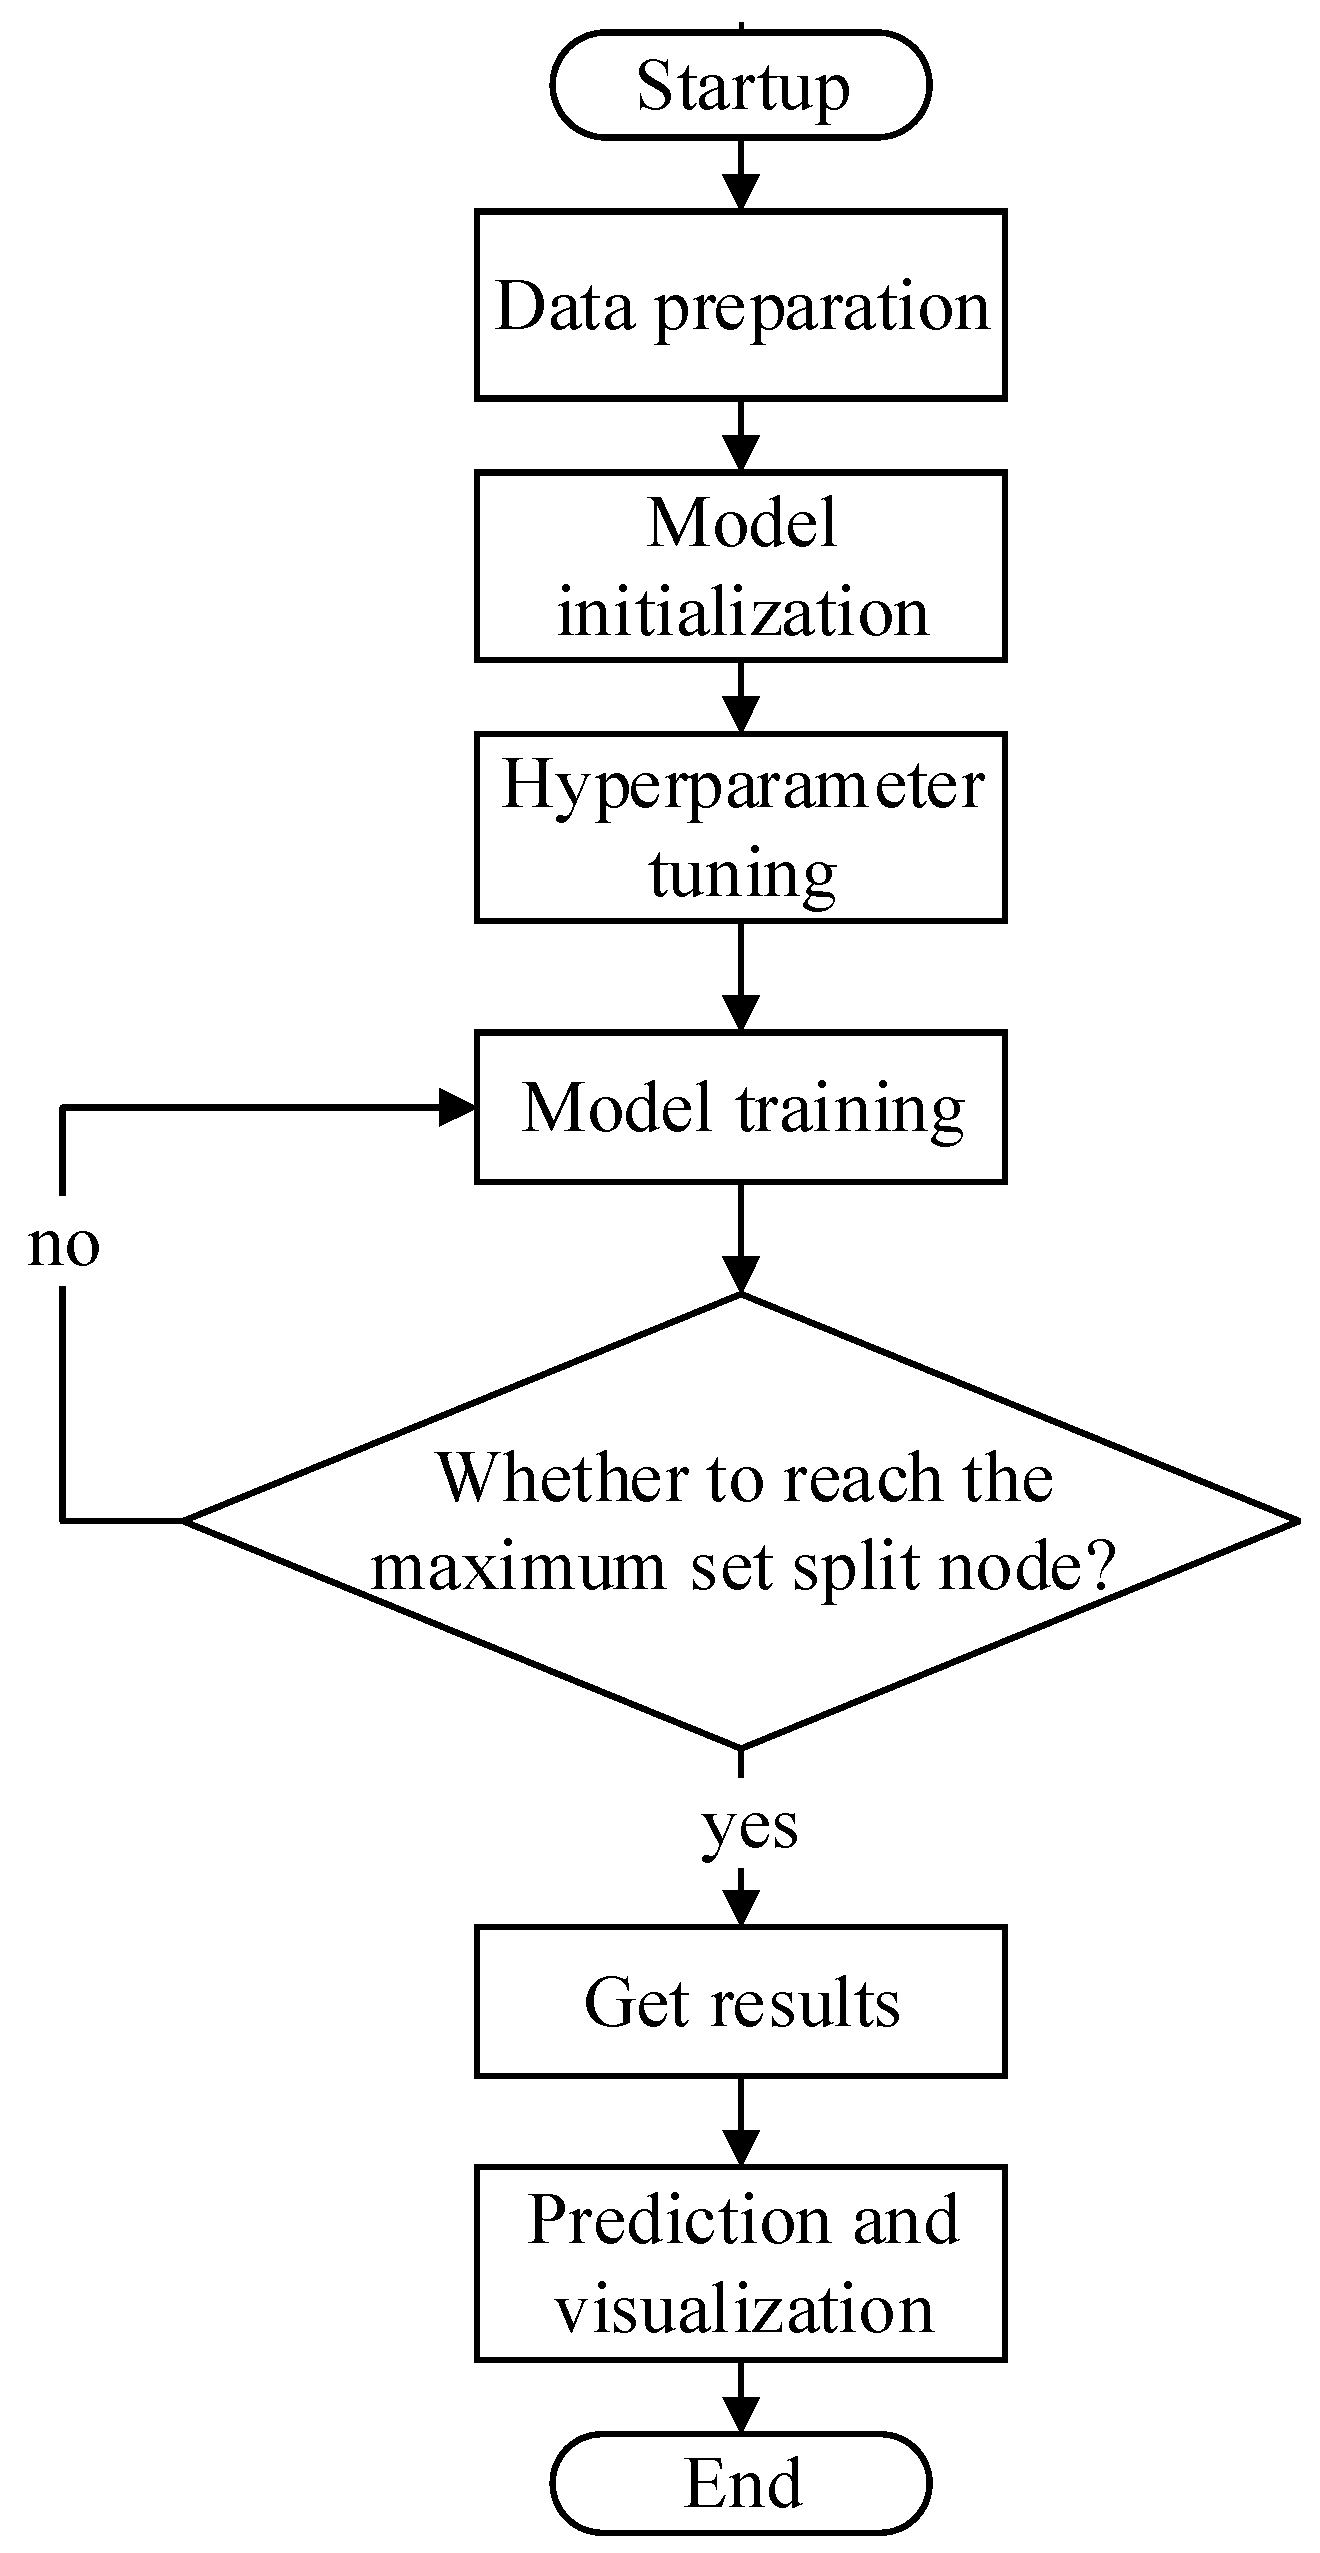
The curves of the acoustic pressure amplitude ratio and acoustic pressure attenuation with transmission frequency characterize the acoustic transmission properties of the pipe string system. It is observed that the curve shows a periodic band-pass band-stop characteristic with amplitude variation, according to which the optimal transmission frequency under the given structure of the pipe string system can be determined. A comprehensive and in-depth comparison between the LightGBM [35] algorithm and the Back Propagation (BP) algorithm is carried out on the acoustic transmission prediction in the pipe strings, with the LightGBM algorithm exhibiting more accurate prediction accuracy. In addition, the LightGBM algorithm has a significant advantage in processing large and complex nonlinear acoustic datasets, emphasizing its superior applicability and efficiency. In this regard, the LightGBM method is used in this study to predict the acoustic transmission characteristic curves of the pipe strings. A flowchart of the algorithm is shown in Figure 11.
The main principles of the algorithm include:
(1) Gradient Boosting Decision Tree (GBDT)
Based on the GBDT algorithm, LightGBM reduces the gradient direction of the loss function by iteratively training a decision tree, and the squared loss function is commonly used as a measure of the model prediction error. Given a training dataset ( x i , y i ) i = 1 n , where x i is the feature vector of the i -th sample and yi is the corresponding label. For regression problems [36], the loss function is usually chosen as a squared loss function, i.e.:
L ( y , y ^ i ) = ( y y ^ i ) 2
where y ^ i is the value predicted by the model. For classification problems, commonly used loss functions include logistic loss functions (logistic loss) and so on.
GBDT learns a series of decision trees T m ( x ) in the form of iterations whereby each tree fits the residuals based on the predicted values of all previous trees [37]. The goal of the m -th iteration is to optimize the following loss function:
i = 1 n L ( y i , y ^ i ( m 1 ) + T m ( x i ) )
where y ^ i ( m 1 ) is the predicted result of the model in the ( m 1 ) -th iteration.
(2) Histogram-based decision tree algorithm
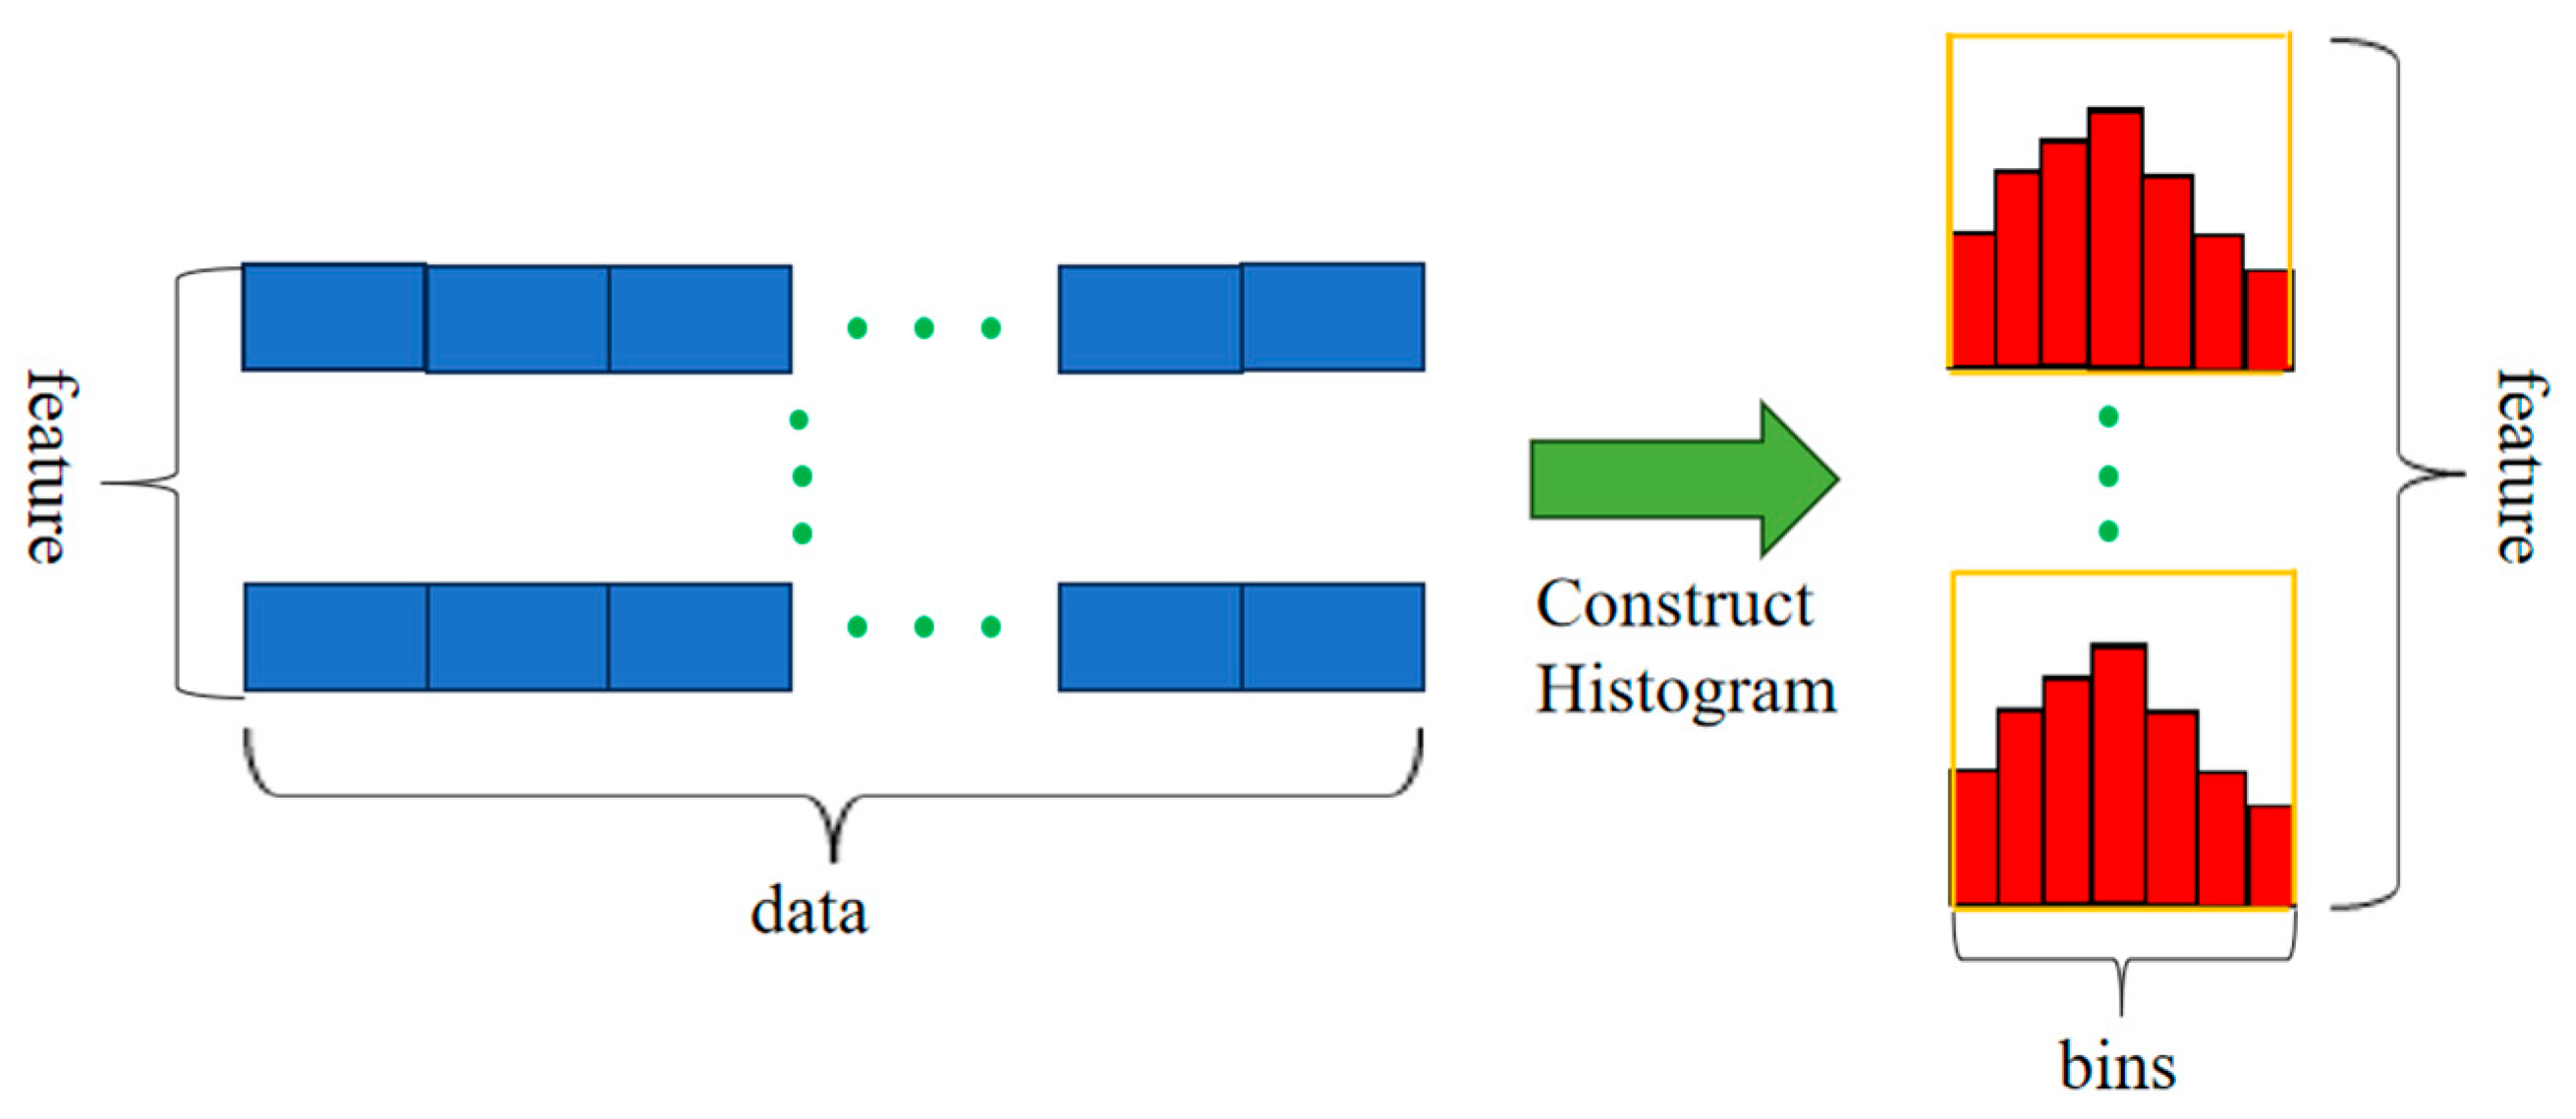
LightGBM uses a histogram decision tree algorithm [38] to quickly find the optimal segmentation point by discretizing the eigenvalues, statistical gradient histograms, and data distributions to improve computational efficiency, as shown in Figure 12.
(3) Leaf-wise decision tree growth strategy
LightGBM adopts a leaf-wise decision tree growth strategy, selecting the leaf nodes with the largest splitting gain for splitting in order to improve the model accuracy, and introducing parameters to control the number of leaf nodes to prevent over-fitting at the same time. On the basis of the histogram algorithm, LightGBM is further optimized by using a leaf-wise algorithm with depth restriction, which is formulated [39] as:
( p m , f m , v m ) = arg min ( p , f , v ) L ( T m 1 ( X ) s p l i t ( p , f , v ) , Y )
T m X = T m 1 X s p l i t p m , f m , v m
where p m is the best segmentation point found in the m -th iteration, f m is the feature used for the best segmentation in the m -th iteration, and v m is the value of the segmentation performed against the feature in the m -th iteration. a r c min ( p , f , m ) indicates the value of p , f , and m that minimize the loss function L . L is the loss function, which measures the differences between the predicted and actual values Y , where T m 1 X denotes the model prediction in the ( m 1 ) -th iteration, and s p l i t ( p , f , v ) denotes the operation of segmenting the data X using the features f and v at Point p . s p l i t ( p m , f m , v m ) is the operation of segmentation using the best segmentation point p m , feature f m , and segmentation value v m found in the m -th iteration.
Figure 11. Flowchart of LightGBM algorithm [40].
Applsci 15 09174 g011
Figure 12. LightGBM histogram algorithm.
Applsci 15 09174 g012
In this study, the specific steps for operation of the LightGBM algorithm are shown as follows:
Step 1: Data preprocessing is extremely critical, involving feature extraction, scaling, and dataset partitioning. After the useful features are filtered from the original data, they are normalized to have a mean of 0 and a variance of 1, which can effectively accelerate the model convergence and improve the prediction performance. At the same time, the data are divided into a training set and a validation set for subsequent evaluation of the model performance. Among them, the dataset is divided into input variables (hkg, lkg, n, freq) and output variables (upper basement tube sound pressure level, sound pressure amplitude ratio, and sound pressure level attenuation).
Step 2: In the model initialization phase, multiple weak learners (i.e., decision trees) are constructed with the help of LightGBM to enhance the overall model performance. Hyper-parameter tuning uses grid search and cross-validation to systematically traverse different hyper-parameter combinations. The optimal hyper-parameter configuration is determined through multiple training and validation to ensure that the parameter selection is robust and has good generalization ability. Based on the optimal hyperparameters, the LightGBM model is retrained, and the training process is presented in an iterative mode, where a new tree is fitted based on the error of the current model and the gradient descent method is applied to optimize the model and gradually reduce the error.
Step 3: Once the model is trained, it is evaluated using a validation set that measures the model’s ability to explain the variances in the data through the R2 score.

3.1.2. Analysis of Model Prediction Results

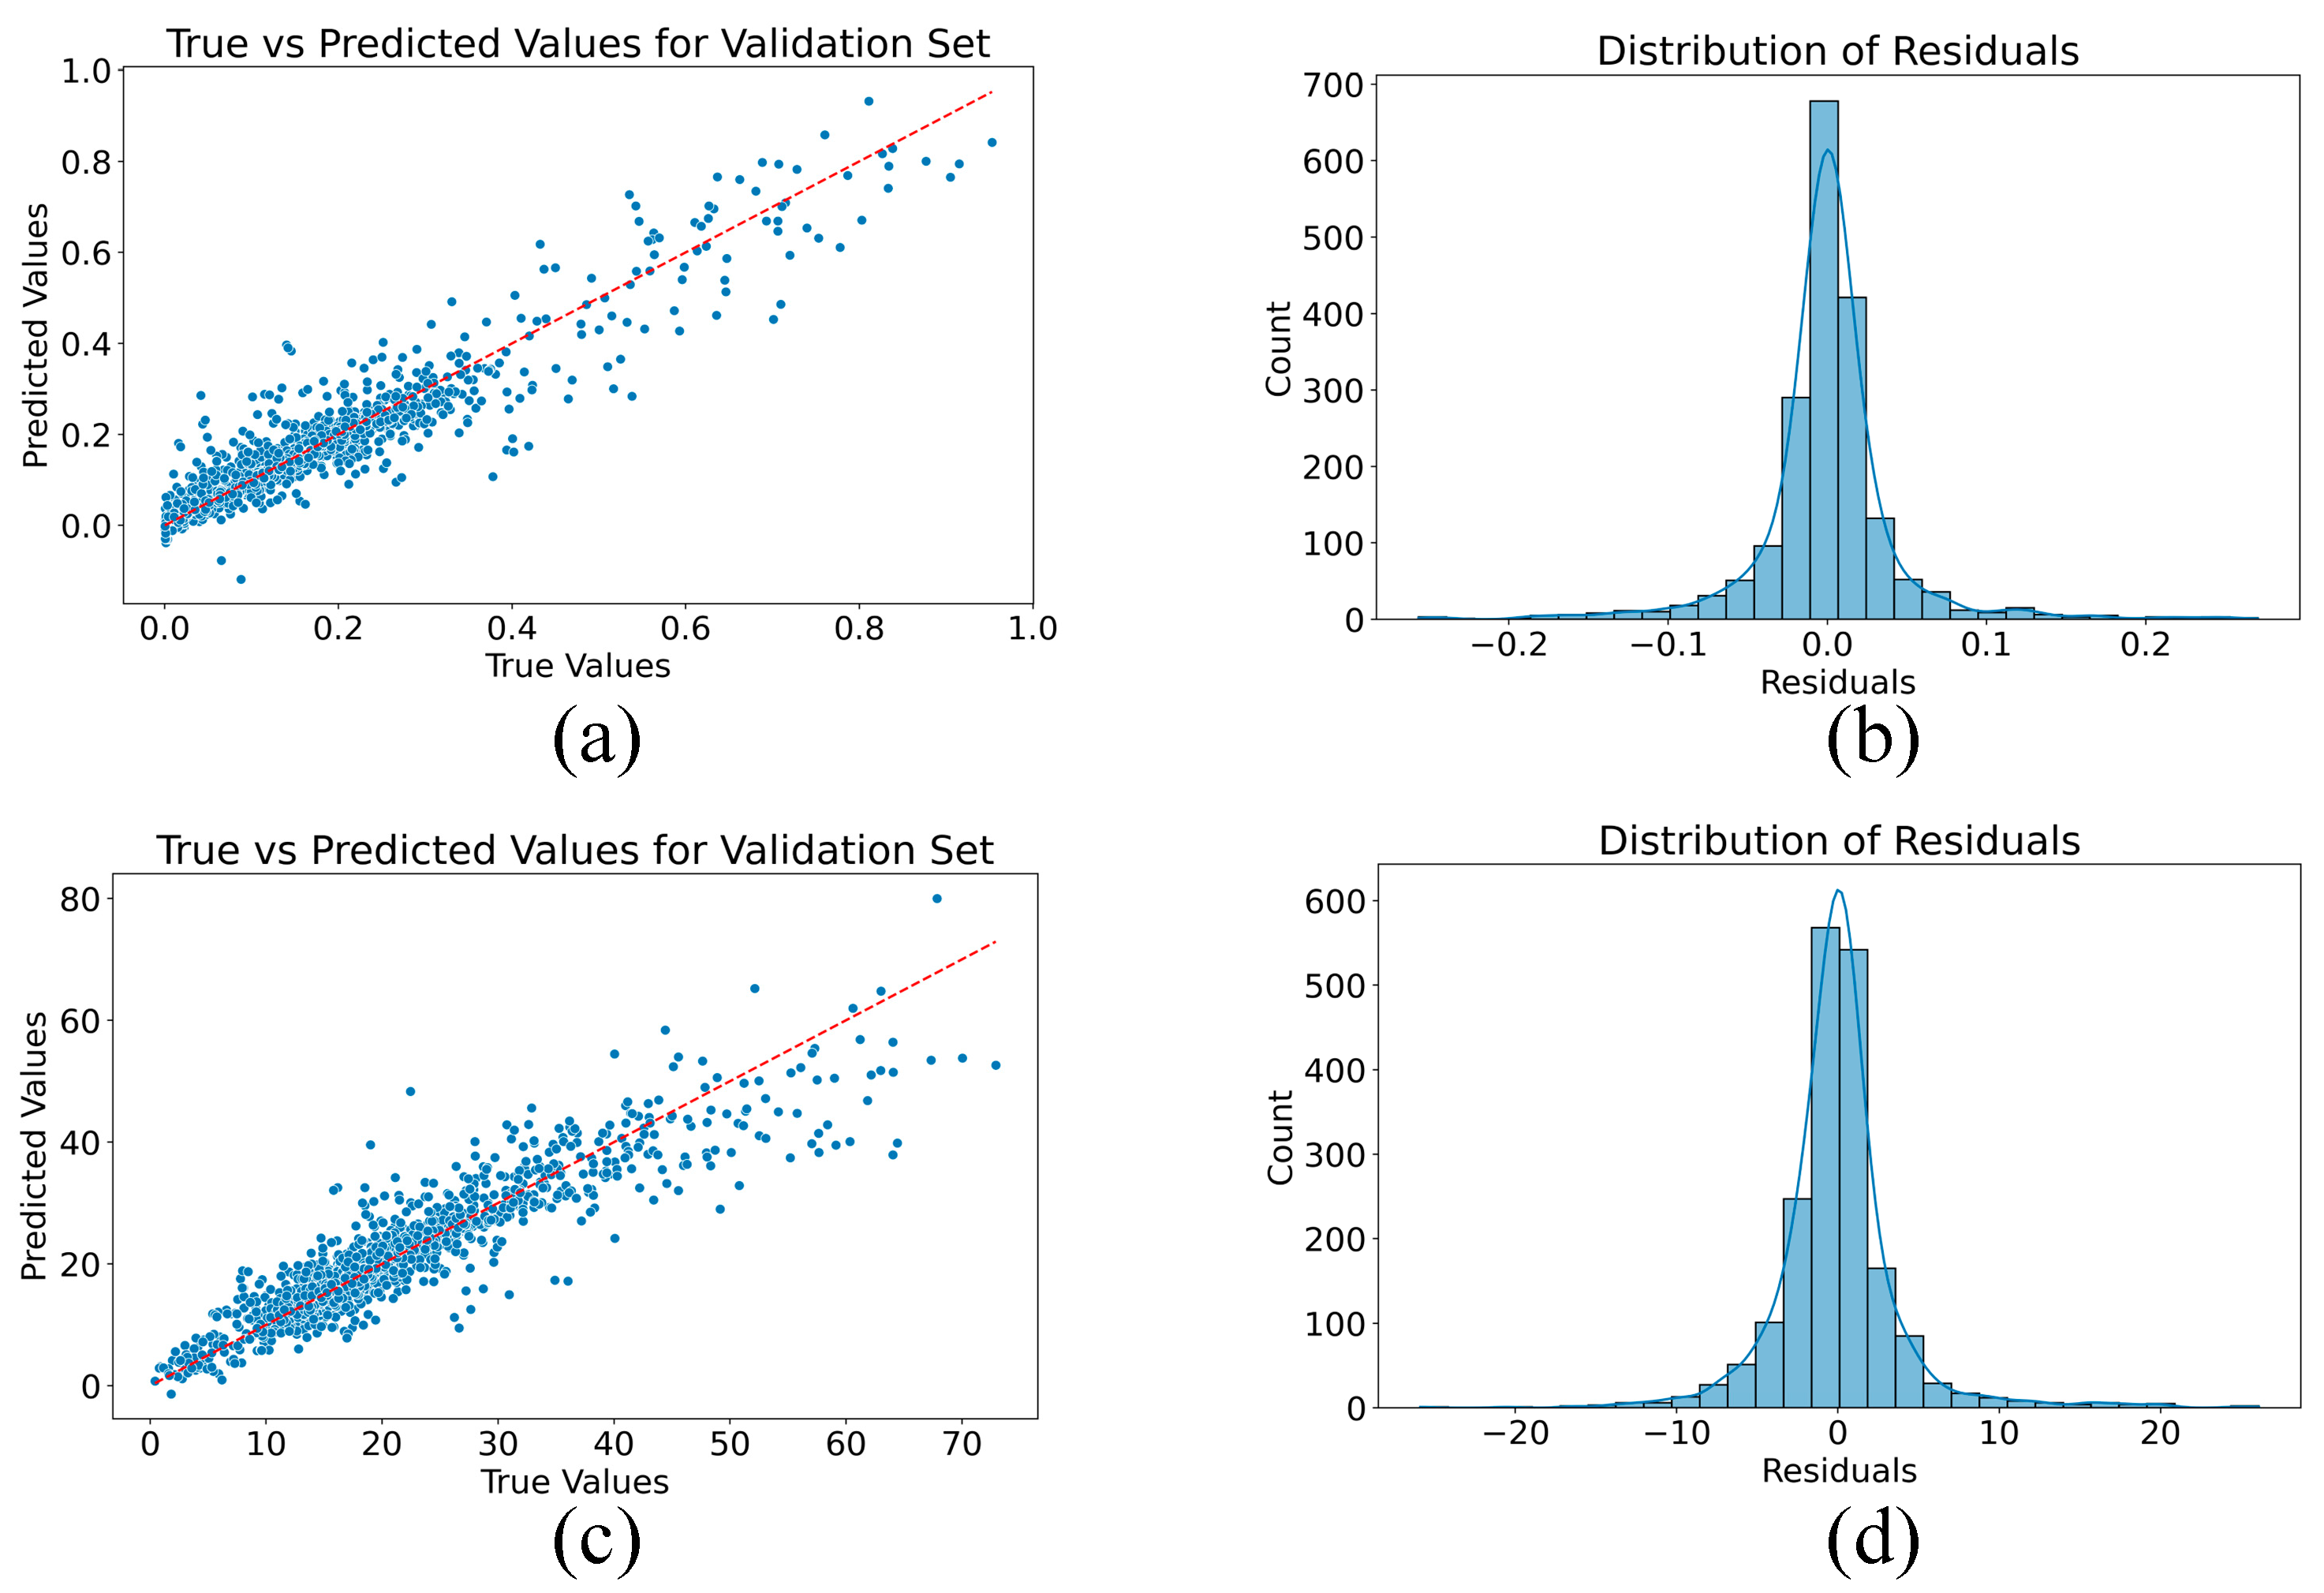
Table 4 demonstrates the model evaluation metric R2, the root mean square error (RMSE), and the LightGBM algorithm parameter settings for identification of Model 1 and 2. R2 is a key evaluation metric reflecting the model’s ability to explain the data variance: the higher the R2 value, the better the fitting effect. From Table 4, it can be seen that the models have a high degree of accuracy in prediction; the R2 scores are 0.8879 and 0.8508, respectively, which indicates that the models can explain 88.79 percent and 85.08 percent of the corresponding data variances, implying that the overall performance is excellent. Additionally, the RMSE values are 0.0473 dB and 4.3955 dB, further validating the models’ predictive accuracy in practical units.
The optimal LightGBM parameter settings balance model complexity and training speed, enabling effective capture of data features while avoiding overfitting. These hyperparameters are determined through 5-fold cross-validation and grid search; their search ranges are detailed in Table 4, with the final parameters selected based on the minimum RMSE of the validation set.
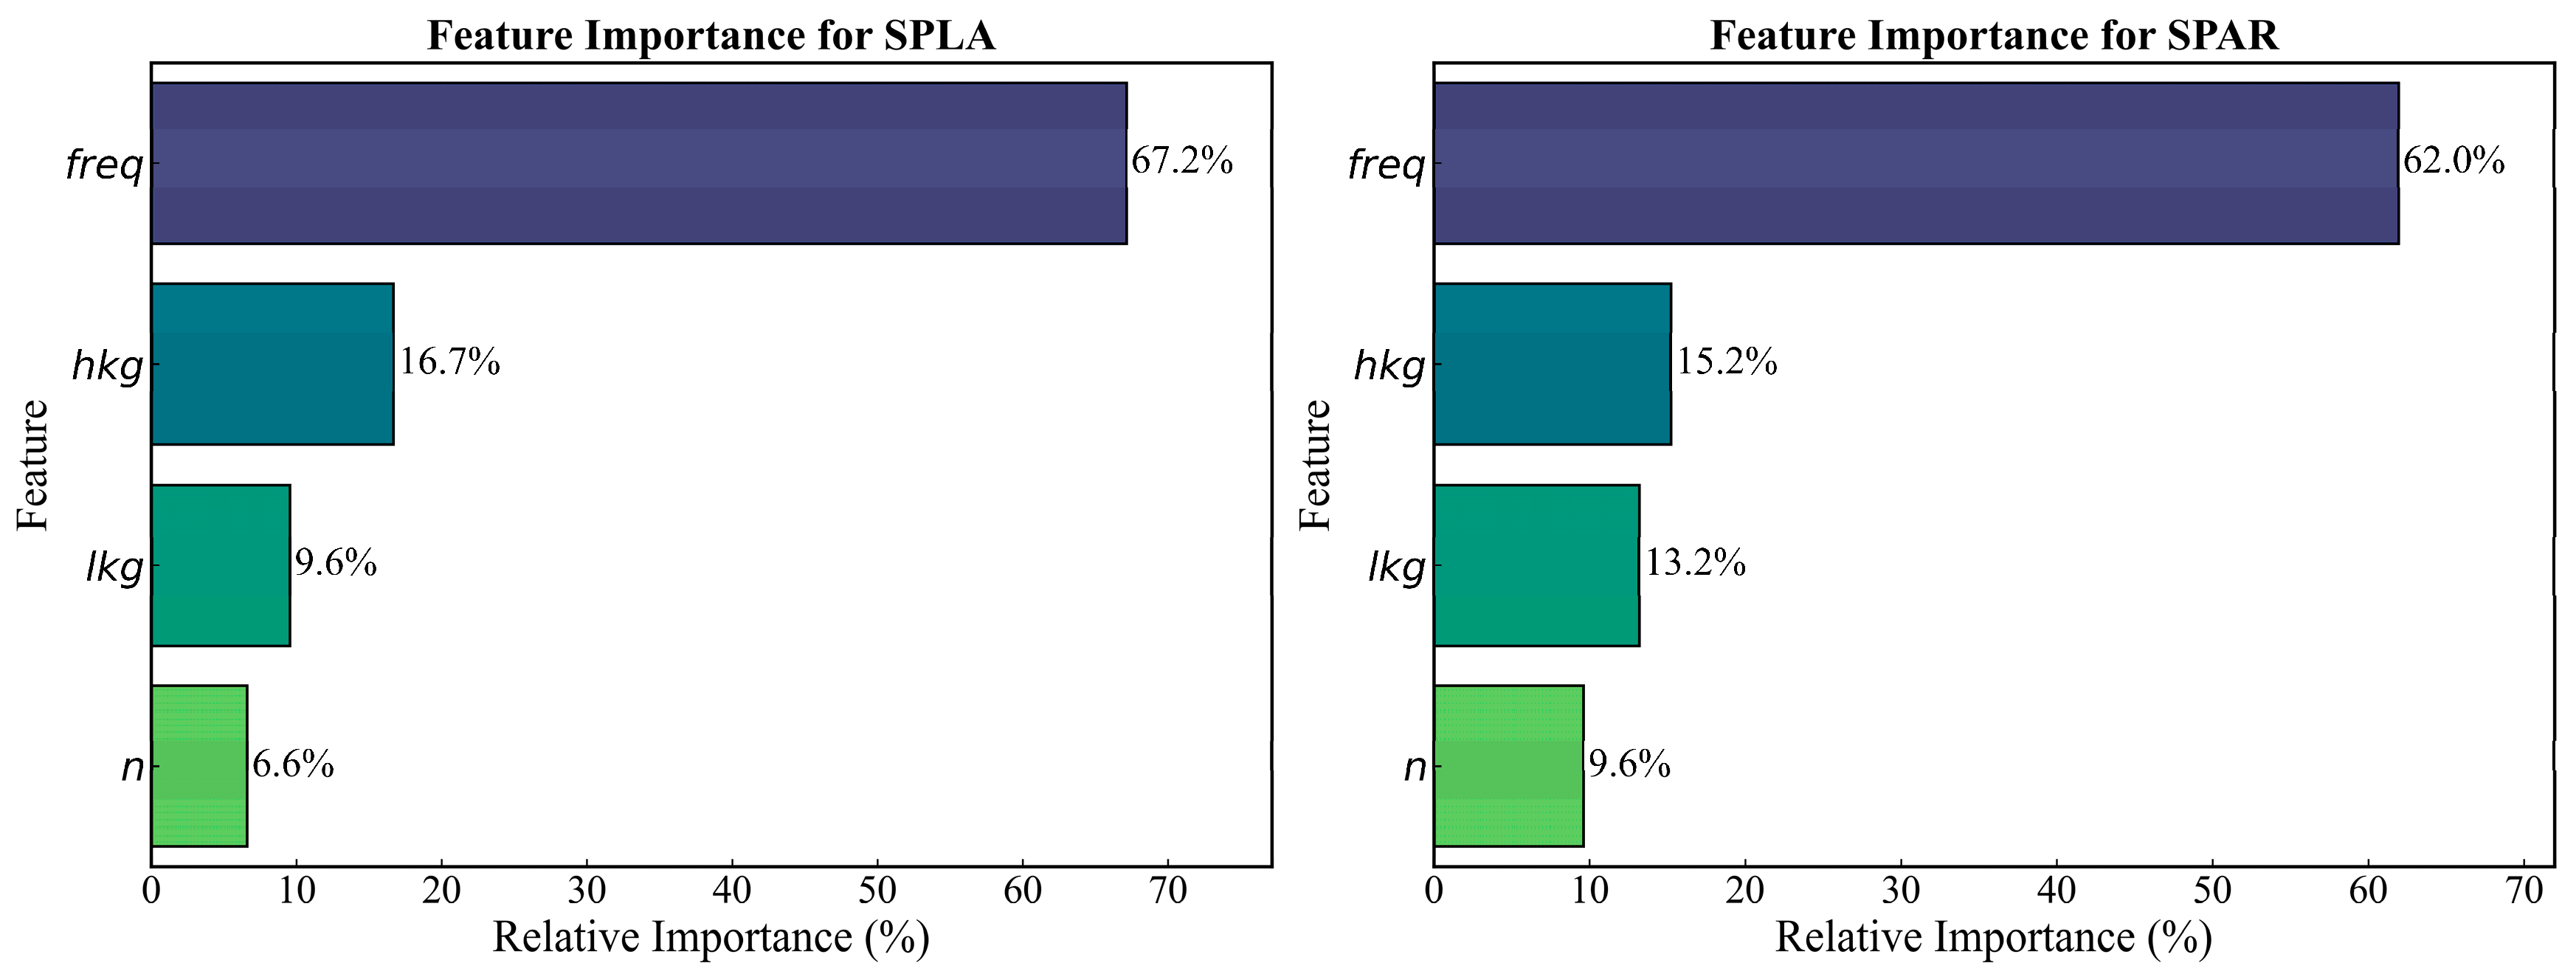
To further clarify the influence of the input parameters on the prediction results of the LightGBM model, a feature importance analysis was performed. Feature importance is quantified by the frequency of parameter selection during decision tree splitting, reflecting the contribution of each input feature to prediction of the target variables [41].
As shown in Figure 13, the transmission frequency is the most critical parameter in both predictions, contributing 62.0% to the sound pressure amplitude ratio and 67.2% to the sound pressure level attenuation. This confirms that frequency is the most critical parameter affecting the acoustic transmission characteristics, i.e., high-frequency acoustic waves attenuate faster and have a more significant impact on transmission efficiency. The width hkg and thickness lkg of the oil tubing connection clamps are the next most influential, while the number of tubing cascades n contributes the least among the four parameters.
Figure 14 exhibits the parameter identification result plots and residual histograms for Model 1 and 2. As seen from the figure, most of the points are distributed near the reference line (red dashed line), indicating that there is a strong linear relationship between the predicted and actual values. The data points are close to the diagonal line, indicating that the model has good prediction accuracy. The scatter plot shows that the relationship between the actual values and the predicted values is closer, but some data points are away from the diagonal, indicating that the model’s prediction accuracy is slightly off in some cases. As seen from the histogram of the residuals of the model below, most of the residuals are concentrated around 0, indicating that the error between the predicted and actual values of the model is small. The model can accurately predict the sound pressure amplitude ratio in most cases, but there is still some error in extreme cases. Overall, the model performs well in predicting the sound pressure amplitude ratio and sound pressure level attenuation. The residual distributions and scatter plots show the high accuracy and robustness of the model.

3.2. Multi-Objective Optimization of Acoustic Transmission Parameters Based on NSGA-II

3.2.1. Principles of NSGA-II Algorithm

For acoustic transmission in the pipe string, it is usually desired to maximize the transmission distance of the acoustic signal and minimize the transmission attenuation by optimizing the structural parameters of the pipe string system and the transmission frequency. For this study, the transmission distance is determined by the number of tubing cascades n, i.e., it is hoped that n is as large as possible. It is also desired to have a large acoustic pressure amplitude ratio and small sound pressure level attenuation, both of which imply excellent acoustic transmission performance. The decision-making variables are the splice thickness, splice length, and transmission frequency. The objective function is set as:
f = f n max , f p max , f p r max , f d d B min
where the objective function f is the optimal value when simultaneously taking the max. number of cascades of tubing n , the max. transmitted acoustic pressure p , the max. amplitude ratio of the transmitted acoustic pressure p r , and the min. attenuation of the transmitted acoustic pressure d d B .
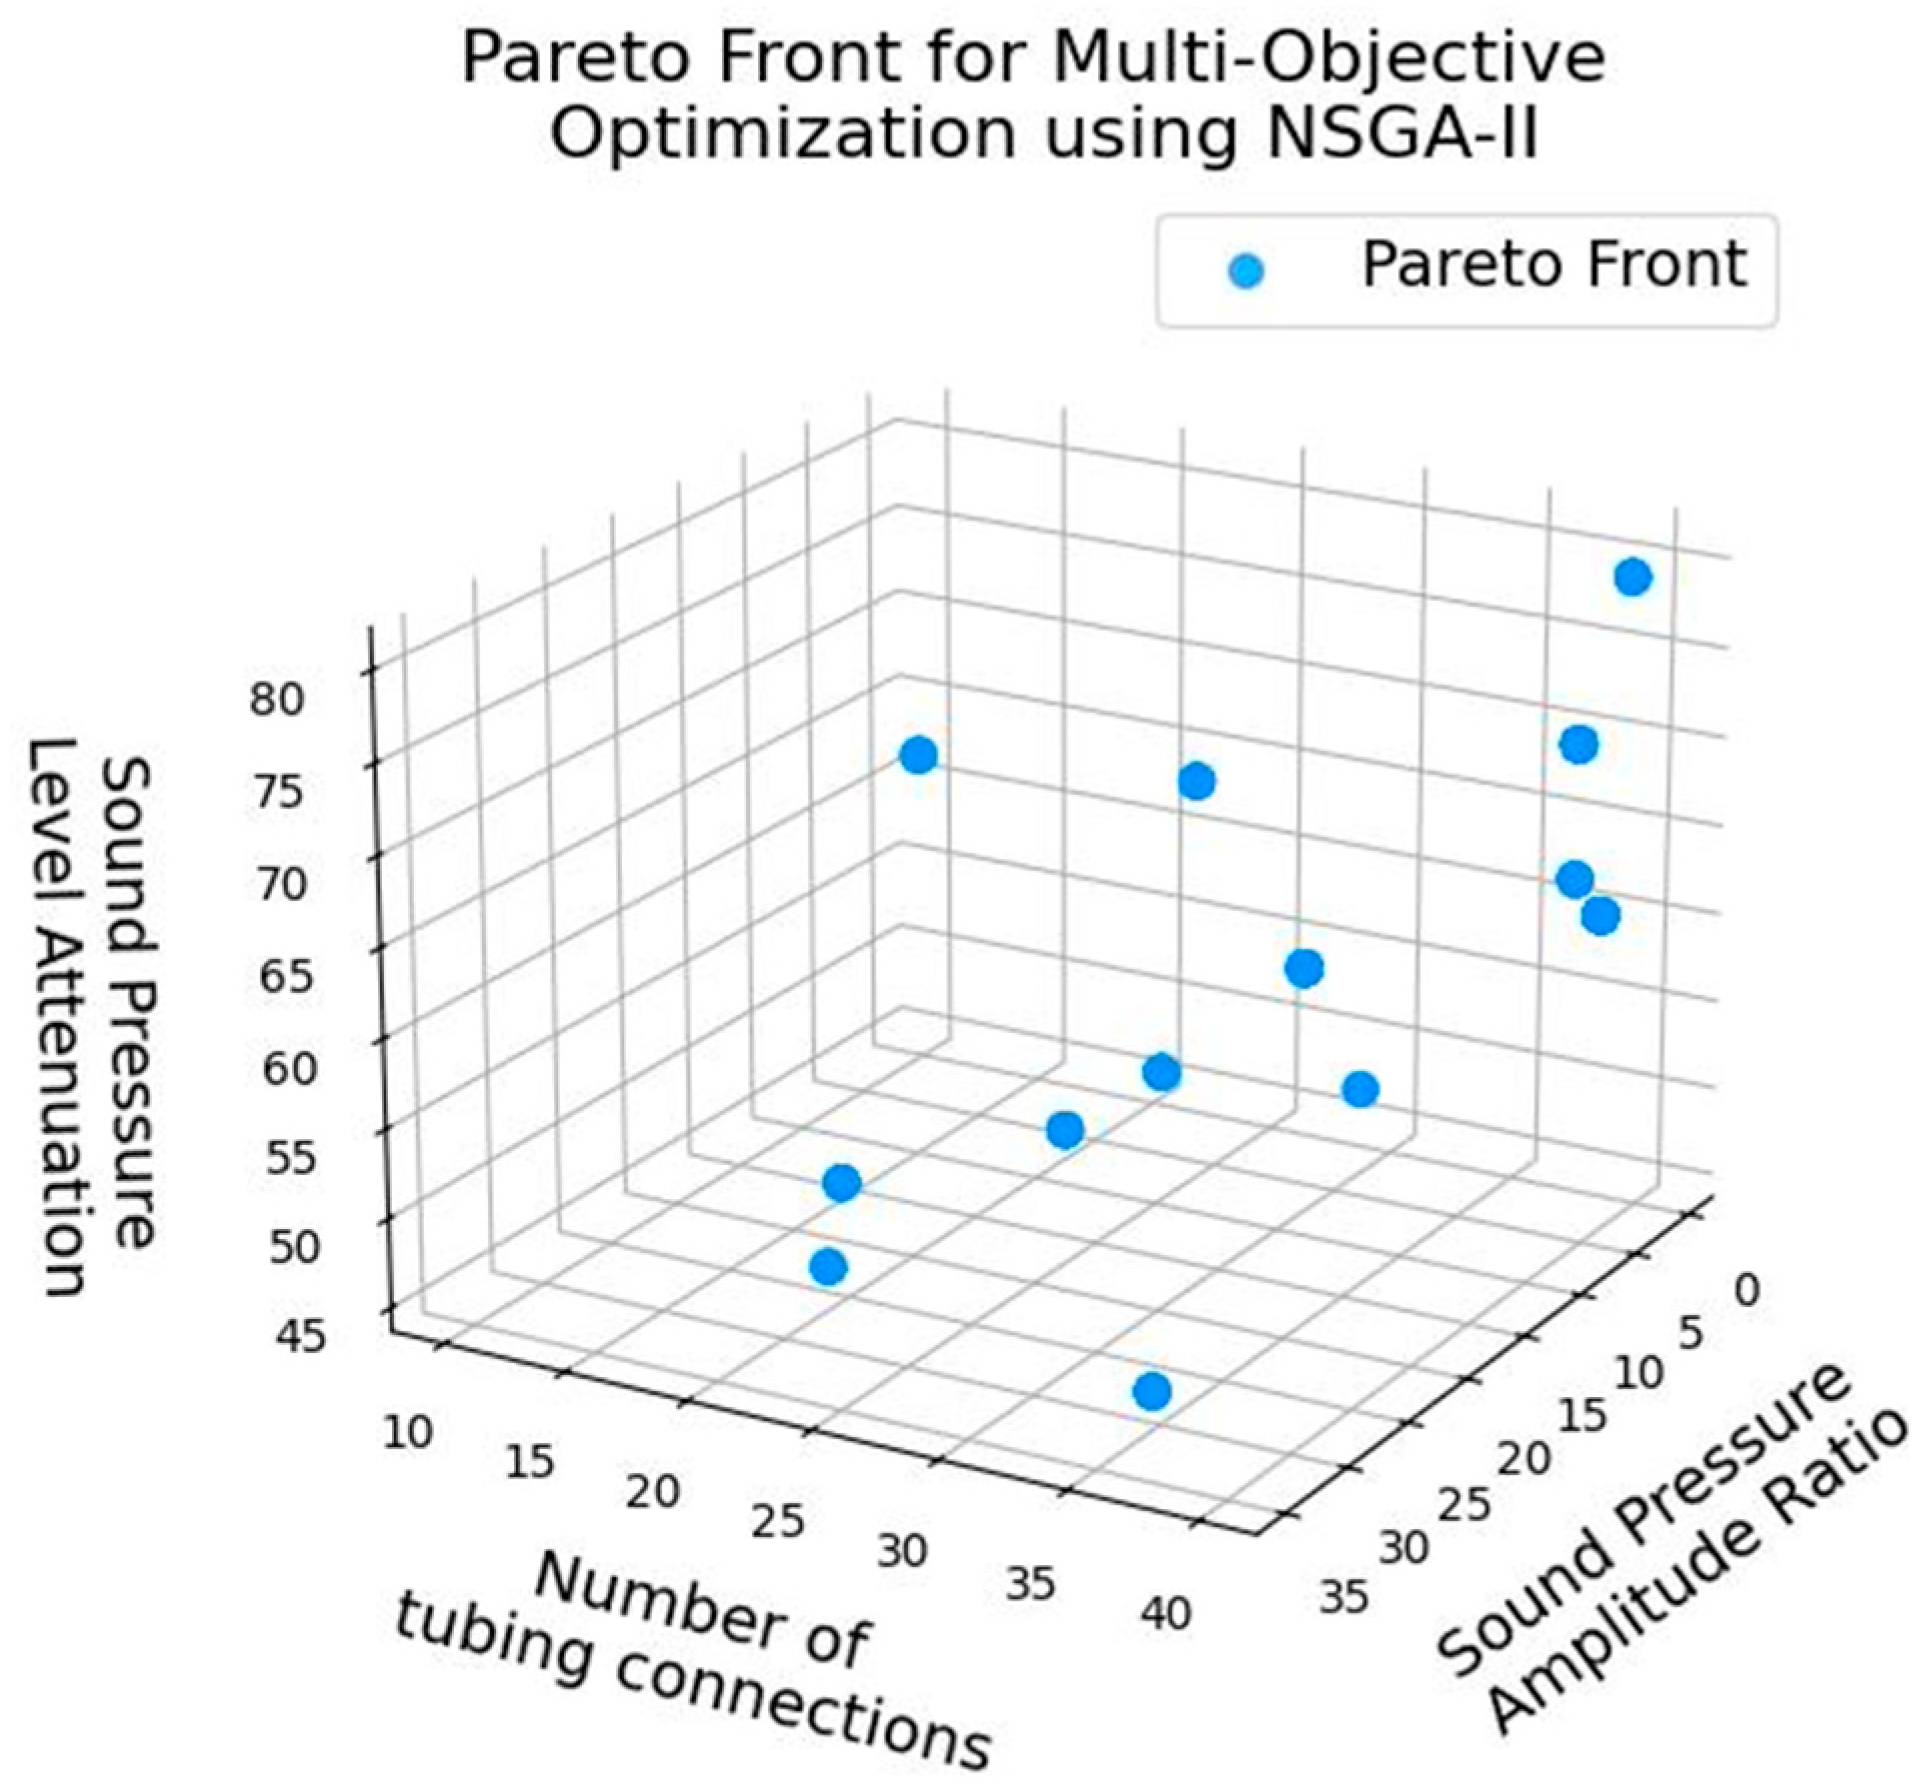
To achieve acoustic transmission over a long distance with minimum transmission attenuation, it is necessary to perform a multi-objective optimization of the acoustic transmission parameters to obtain the optimal parameter combinations of the pipe string system structure and transmission frequency. In this section, the acoustic transmission parameters are optimized using the NSGA-II algorithm [42], which is one of the more popular multi-objective genetic algorithms that reduce the complexity of the non-inferiority-ordered genetic algorithm. The Pareto front generated by the NSGA-II algorithm contains multiple discrete points, which can select the optimal combination of decision-making variables according to the objectives, providing various solutions for engineering practice. The NSGA-II algorithm implementation process is shown in Figure 15.
In the NSGA-II algorithm, non-dominated ordering, crowding degree, and elite strategy are the core elements. In the multi-objective optimization scenario of the acoustic transmission parameters of the pipe strings, the decision-making process closely revolves around these three core elements of the NSGA-II algorithm. First, the numerous combinations (solutions) of the acoustic transmission parameters of the pipe strings in the initial population are categorized by non-dominated sorting, distinguishing different non-dominated layers and determining which solutions are better balanced concerning the objectives of increasing the transmission distance and minimizing acoustic attenuation. Crowding is then utilized to regulate the diversity of the populations, ensuring that the selection of individuals into the next generation does not focus on parameter combinations in a certain localized region, but rather explores a wide range of possible parameter combinations to provide richer options for the decision-maker. Finally, the elite strategy ensures that the parameter combinations that perform well in each generation for acoustic transmission of pipe strings are passed on to the next generation, continuously improving the quality of the population and evolving the algorithm in a better direction. As the iterations proceed, the algorithm gradually converges to a set of Pareto-optimal solutions that are uniformly distributed and well balanced between the objectives of increasing transmission distance and reducing acoustic attenuation. The decision-maker can select the combination of acoustic transmission parameters from these Pareto-optimal solutions according to the actual needs, such as the degree of emphasis on the transmission distance, the acceptable range of acoustic attenuation, and so on, which best meets the actual engineering situation, and complete the final decision.

3.2.2. Analysis of Optimization Results

As seen in Figure 16, the points indicate the Pareto-optimal solution under different trade-offs. The horizontal coordinate indicates the number of tubing connections (maximization) for one of the objective functions, the vertical coordinate indicates the sound pressure amplitude ratio (maximization) for the second objective function, and the coordinates perpendicular to the plane represent the sound pressure level attenuation (minimization) of the objective function. In the multi-objective optimization scenario, given the long downhole pipe string, the acoustic signal transmission is limited by the need to set up the repeaters, which increase the system cost and interference—maximizing the transmission distance reduces the repeaters, reduces the complexity and cost of the system, and improves the stability of the signal. At the same time, the underground environment has many effects. The sound pressure amplitude ratio is small, making it difficult to identify the signal, and affects the judgment of the underground situation; so, maximizing the sound pressure amplitude ratio can ensure that the signal is recognizable. The sound pressure attenuation will cause the signal to be distorted, affecting the mining process control; so, minimizing the sound pressure attenuation is of great significance to ensure the safety and efficiency of the project.
The max. transmission distance of the repeater is taken as the benchmark, while the max. sound pressure amplitude ratio and the min. sound pressure attenuation level are set as the objective functions. Combined with the actual needs of the project, a specific decision-making scheme is determined. When the project focuses on maximizing the maximum transmission distance of the repeater, the recommended optimal combinations of the decision-making variables are as follows: [39, 1.33384361 m, 0.0107765441 m, 424.014161 Hz], [39, 1.37363838 m, 0.0117126040 m, 423.390743 Hz]. If the project focuses on maximizing the sound pressure amplitude ratio and minimizing the sound pressure attenuation at the same time, the recommended optimal combinations of decision-making variables are as follows: [20,1.18401383 m, 0.0119637991 m, 206.652169 Hz], [22, 1.13877376 m, 0.0108402904 m, 208.313793 Hz]. Using one of the optimal combinations of decision-making variables as a case study, e.g., [20,1.18401383 m, 0.0119637991 m, 206.652169 Hz], this set of data indicates that the number of pipe cascades is 20, the fixture width is 1.184 m, the thickness is 0.012 m, and the optimal transmission frequency is 206.652 Hz.

4. Conclusions and Outlook

4.1. Conclusions

In this paper, through numerical simulation and model prediction, the acoustic transmission characteristics of the pipe string system are investigated, the key influencing factors are identified, and the transmission parameters are optimized to achieve acoustic transmission over a longer distance and with lower attenuation in the pipe strings. The main conclusions of the study are as follows:
(1) Acoustic transmission attenuation characteristics: within the frequency range of 20–2000 Hz, when the acoustic wave propagates in the pipe string system, the amplitude attenuation caused by structural damping is positively correlated with the transmission distance, and the high-frequency acoustic wave attenuates more quickly. When the frequency exceeds 500 Hz, the sound pressure amplitude ratio is lower than 0.4; above 1500 Hz, the attenuation is stabilized at more than 90%.
(2) Effects of structural parameters of the pipe strings: the thickness of the joint has a weak effect on transmission, and increase in length will improve the characteristic frequency but aggravate sound pressure attenuation.
(3) Model prediction and optimization: The R2 scores for the prediction of the sound pressure amplitude ratio and the acoustic attenuation are 88.79% and 85.08%, respectively, which can effectively capture the data features. The NSGA-II algorithm optimizes and obtains the optimal parameter combinations (n, hkg, lkg, freq) for the maximum transmission distance, maximum sound pressure amplitude ratio, and minimum attenuation, providing references for on-site applications.
The study’s findings offer practical guidance for hydrate test production—optimized transmission frequencies can inform acoustic generator settings to reduce repeaters and costs, while joint parameter optimizations can enhance completion string design and signal stability. Though simulation-based, the results align with on-site observations in the South China Sea, such as faster high-frequency attenuation, supporting the model’s validity. A key limitation is the lack of direct field data on multi-layer completion acoustic transmission, with future validation planned via lab experiments and on-site data comparison.

4.2. Outlook

Current limitations include unconsidered pipe defects, cement rings, and environmental parameters, along with potential errors from simplified gas–water mixture modeling.
Future work will be carried out as follows:
(1) Integration of parametric defect models and conducting experiments on defective prototypes to quantify their impact.
(2) Refining the gas–water mixture simulations via multiphase CFD with experimental calibration of the acoustic parameters.
(3) Extension of the model to include temperature/pressure-dependent material properties and multicomponent fluid characteristics for dynamic downhole simulation.

Supplementary Materials

The following supporting information can be downloaded at: https://www.mdpi.com/article/10.3390/app15169174/s1.

Author Contributions

Conceptualization, B.X. and R.Q.; Data curation, G.Y.; Formal analysis, X.H.; Methodology, H.C. and X.H.; Project administration, J.G.; Software, X.H.; Writing—original draft, X.H. All authors have read and agreed to the published version of the manuscript.

Funding

This research was funded by the Open Research Project of the Innovation Base for Automatic and Intelligent Drilling Equipment, Geological Society of China (PY202401, PY202402).

Data Availability Statement

The original contributions presented in this study are included in the Supplementary Material. Further inquiries can be directed to the corresponding authors.

Acknowledgments

We thank QiuPing Lu and YanJiang Yu from the Guangzhou Marine Geological Survey for their contributions to this study. Lu provided critical support in data curation and analysis, ensuring the accuracy of the numerical simulation results. Yu offered valuable guidance in the formal analysis of the acoustic transmission characteristics, enhancing the scientific validity of the research methods. Although not listed as authors, their work was crucial to this study. We also thank all members of the research team for their collaboration.

Conflicts of Interest

The authors declare no conflicts of interest.

Nomenclature

T L Transmission loss (ratio of sound pressure amplitude at the exit to that at the incident end)
p o u t Sound pressure at the outlet
p i n Sound pressure at the incident side
T W Oil tubing displacement ratio (ratio of displacement at the outlet end of the tubing to that at the incident end)
W o u t Displacement of the outlet end of the oil tubing
W i n Displacement of the incident end of the oil tubing
d w Sound pressure attenuation inside the oil tubing
ρ m Density of gas–water compounds
ρ l Density of liquids
ρ g Density of gases
φ Gas volume fraction
c m Velocity of sound for gas–water compounds
c l Velocity of sound in liquids
c g Speed of sound of gases
μ m Viscosity of gas–water compounds
μ l Viscosity of the liquid
μ g Viscosity of the gas
L p Sound pressure level in decibels (dB)
x i The eigenvector of the first sample
y i Corresponding tags
y ^ i Value predicted by the model
y ^ i ( m 1 ) Predictions from the model for the front wheel
p m The optimal segmentation point found in the m-th iteration
f m Features used for optimal segmentation in the m-th iteration
v m The value is segmented against the feature in the first iteration
a r c min ( p , f , m ) Denoting the value of the min. loss function
L Loss function, which measures the difference between the predicted value and the actual value
T m 1 X Denoting the model prediction in the first iteration
s p l i t ( p , f , v ) Denoting the operation of the data segmentation using features and values at points
s p l i t ( p m , f m , v m ) The operation of segmentation with the best segmentation point, feature, and segmentation value found in the first iteration

References

  1. Tong, X.; Zhang, G.; Wang, Z.; Wen, Z.; Tain, Z.; Wang, H.; Feng, M.A.; Wu, Y. Distribution and potential of global oil and gas resources. Pet. Explor. Dev. 2018, 45, 779–789. [Google Scholar] [CrossRef]
  2. Zhang, C.W.; Zhou, X.G.; Qu, X.C.; Hu, G.F. Transmission design based on sonic drilling parameter. Appl. Mech. Mater. 2014, 528, 328–333. [Google Scholar] [CrossRef]
  3. Bouldin, B.; Alshmakhy, A.; Bazuhair, A.K.; Alzaabi, M.H.; Fellinghaug, J.A. A Review of Downhole Wireless Technologies and Improvements. In Proceedings of the Abu Dhabi International Petroleum Exhibition and Conference, Abu Dhabi, United Arab Emirates, 15–18 November 2021; SPE: Richardson, TX, USA, 2021. [Google Scholar]
  4. Wang, Y.; Guang, Z. The new underground positioning system. Acta Pet. Sin. 2002, 23, 77. [Google Scholar]
  5. Drumheller, D.S.; Kuszmaul, S.S. Acoustic Telemetry; Sandia National Laboratories (SNL): Albuquerque, NM, USA; Livermore, CA, USA, 2003. [Google Scholar]
  6. Gao, L.; Finley, D.; Gardner, W.; Robbins, C.; Linyaev, E.; Moore, J.; Memarzadeh, M.; Johnson, D. Acoustic telemetry can deliver more real-time downhole data in underbalanced drilling operations. In Proceedings of the SPE/IADC Drilling Conference and Exhibition, Mumbai, India, 16–18 October 2006; SPE: Richardson, TX, USA, 2006. [Google Scholar]
  7. Gao, L.; Gardner, W.; Robbins, C.; Memarzadeh, M.; Johnson, D. Limits on data communication along the drill string using acoustic wave. SPE Reserv. Eval. Eng. 2008, 11, 141–146. [Google Scholar] [CrossRef]
  8. Filoux, E.; Levassort, F.; Callé, S.; Certon, D.; Lethiecq, M. P2I-9 Modeling of Axisymetrical Transducer Configurations Based on Pseudospectral/Finite-Difference Time-Domain Method. In Proceedings of the 2007 IEEE Ultrasonics Symposium Proceedings, New York, NY, USA, 28–31 October 2007; IEEE: Piscataway, NJ, USA, 2007. [Google Scholar]
  9. Ma, H.; Wang, Y. Well-log acoustic velocity prediction based on relevance vector machine. In Proceedings of the 2009 Fifth International Conference on Natural Computation, Tianjian, China, 14–16 August 2009; IEEE: Piscataway, NJ, USA, 2009. [Google Scholar]
  10. Che, X.; Qiao, W.; Ju, X.; Lu, J.; Wang, R. Numerical simulations of the reflected P-wave amplitude in azimuthal acoustic reflection logging. In Proceedings of the 2015 8th International Congress on Image and Signal Processing (CISP), Shenyang, China, 14–16 October 2015; IEEE: Piscataway, NJ, USA, 2015. [Google Scholar]
  11. Hawthorn, A.; Aguilar, S. New wireless acoustic telemetry system allows real-time downhole data transmission through regular drillpipe. In Proceedings of the SPE Annual Technical Conference and Exhibition? San Antonio, TX, USA, 9–11 October 2017; SPE: Richardson, TX, USA, 2017. [Google Scholar]
  12. Liu, X.; Wu, J.; Qiao, H.; Zhao, J.; Li, C.; Zhang, Y.; Wan, L. The real-time acquisition and analysis software system for laser-induced plasma acoustic wave signal. Opto-Electron. Eng. 2019, 46, 180534-1–180534-9. [Google Scholar]
  13. Ellmauthaler, A.; Seabrook, B.C.; Wilson, G.A.; Maida, J.; Bush, J.; Leblanc, M.; Dupree, J.; Uribe, M. Distributed acoustic sensing of subsea wells. Lead. Edge 2020, 39, 801–807. [Google Scholar] [CrossRef]
  14. Bachman, H.; Chen, C.; Rufo, J.; Zhao, S.; Yang, S.; Tian, Z.; Nama, N.; Huang, P.; Huang, T.J. An acoustofluidic device for efficient mixing over a wide range of flow rates. Lab. Chip 2020, 20, 1238–1248. [Google Scholar] [CrossRef] [PubMed]
  15. Ali, M.F.; Jayakody, D.N.K.; Chursin, Y.A.; Affes, S.; Dmitry, S. Recent advances and future directions on underwater wireless communications. Arch. Comput. Method. Eng. 2020, 27, 1379–1412. [Google Scholar] [CrossRef]
  16. Gao, N.; Lu, K. An underwater metamaterial for broadband acoustic absorption at low frequency. Appl. Acoust. 2020, 169, 107500. [Google Scholar] [CrossRef]
  17. Marin, J.M.; Ashry, I.; Alkhazragi, O.; Trichili, A.; Khee Ng, T.; Ooi, B.S. Simultaneous distributed acoustic sensing and communication over a two-mode fiber. Opt. Lett. 2022, 47, 6321–6324. [Google Scholar] [CrossRef] [PubMed]
  18. Zheng, Z.; Geng, Y. Wireless Communication System for Drilling Based on OFDM Using Acoustic Wave. In Proceedings of the International Field Exploration and Development Conference, Wuhan, China, 19–21 September 2022; Springer: Berlin/Heidelberg, Germany, 2022. [Google Scholar]
  19. Wang, C.; Qiao, W.; Zhang, W. Using transfer matrix method to study the acoustic property of drill strings. In Proceedings of the 2006 IEEE International Symposium on Signal Processing and Information Technology, Vancouver, BC, Canada, 27–30 August 2006; IEEE: Piscataway, NJ, USA, 2006. [Google Scholar]
  20. Shen, Y.Z.; Sheng, L.L. Transmission characteristics of the drilling fluid pressure quadrature phase shift keying signal along a directional wellbore. Acta Pet. Sin. 2011, 32, 340. [Google Scholar]
  21. Wei, Z.; Yibing, S.; Yanjun, L. Design of acoustic wireless remote transmission system for logging-while-drilling data. In Proceedings of the 2013 IEEE 11th International Conference on Electronic Measurement & Instruments, Harbin, China, 16–19 August 2013; IEEE: Piscataway, NJ, USA, 2013. [Google Scholar]
  22. Hou, Y.; Zhou, R.; Long, X.; Liu, P.; Fu, Y. The design and simulation of new downhole vibration device about acoustic oil recovery technology. Petroleum 2015, 1, 257–263. [Google Scholar] [CrossRef]
  23. Perez-Arancibia, C.; Godoy, E.; Duran, M. Modeling and simulation of an acoustic well stimulation method. Wave Motion 2018, 77, 214–228. [Google Scholar] [CrossRef]
  24. Bai, H.; Lin, Q.; Wang, C. Acoustic Communication Signal Recognition Method Based on Discrete Signal Correlation. J. Liaoning Univ. Pet. Chem. Technol. 2021, 41, 87. [Google Scholar]
  25. Bai, H.; Wang, C.; Lin, Q.; Zhang, L. Acoustic Attenuation Characteristics of Remote Wireless Communication in Oil Wells. J. Liaoning Univ. Pet. Chem. Technol. 2022, 42, 79. [Google Scholar]
  26. Paillet, F.L.; Cheng, C.H. Acoustic Waves in Boreholes; CRC Press: Boca Raton, FL, USA, 2023. [Google Scholar]
  27. Chiantello, D.A. Acoustic Modelling, Data Augmentation and Feature Extraction for In-Pipe Machine Learning Applications; Manchester Metropolitan University: Manchester, UK, 2023. [Google Scholar]
  28. Ullah, N.; Ahmed, Z.; Kim, J. Pipeline leakage detection using acoustic emission and machine learning algorithms. Sensors 2023, 23, 3226. [Google Scholar] [CrossRef] [PubMed]
  29. Lu, Q.; Yu, Y.; Wen-wei, X.; Liang, J.; Lu, J.; Xu, B.; Shi, H.; Yu, H.; Qin, R.; Li, X. Design and feasibility analysis of a new completion monitoring technical scheme for natural gas hydrate production tests. China Geol. 2023, 6, 466–475. [Google Scholar] [CrossRef]
  30. Gutierrez-Estevez, M.A.; Krüger, U.; Krueger, K.A.; Manolakis, K.; Jungnickel, V. Acoustic channel model for adaptive downhole communication over deep drill strings. In Proceedings of the 2013 IEEE International Conference on Acoustics, Speech and Signal Processing, Vancouver, BC, Canada, 26–31 May 2013; IEEE: Piscataway, NJ, USA, 2013; pp. 4883–4887. [Google Scholar]
  31. Ye, J.; Qin, X.; Xie, W.; Lu, H.; Ma, B.; Qiu, H.; Liang, J.; Lu, J.; Kuang, Z.; Lu, C. The second natural gas hydrate production test in the South China Sea. China Geol. 2020, 3, 197–209. [Google Scholar] [CrossRef]
  32. Sojahrood, A.J.; Li, Q.; Haghi, H.; Karshafian, R.; Porter, T.M.; Kolios, M.C. Probing the pressure dependence of sound speed and attenuation in bubbly media: Experimental observations, a theoretical model and numerical calculations. Ultrason. Sonochem 2023, 95, 106319. [Google Scholar] [CrossRef]
  33. Xin, L.I.; Weihao, L.I.; Jian, S.; Qiang, L.I.; Shaoping, W. Pipelines vibration analysis and control based on clamps’ locations optimization of multi-pump system. Chin. J. Aeronaut. 2022, 35, 352–366. [Google Scholar] [CrossRef]
  34. Švec, J.G.; Granqvist, S. Tutorial and guidelines on measurement of sound pressure level in voice and speech. J. Speech Lang. Hear. Res. 2018, 61, 441–461. [Google Scholar] [CrossRef] [PubMed]
  35. Ju, Y.; Sun, G.; Chen, Q.; Zhang, M.; Zhu, H.; Rehman, M.U. A model combining convolutional neural network and LightGBM algorithm for ultra-short-term wind power forecasting. IEEE Access 2019, 7, 28309–28318. [Google Scholar] [CrossRef]
  36. Ke, G.; Meng, Q.; Finley, T.; Wang, T.; Chen, W.; Ma, W.; Ye, Q.; Liu, T. Lightgbm: A highly efficient gradient boosting decision tree. Adv. Neural Inf. Process. Syst. 2017, 30, 52. [Google Scholar]
  37. Kadiyala, A.; Kumar, A. Applications of python to evaluate the performance of decision tree-based boosting algorithms. Environ. Prog. Sustain. Energy 2018, 37, 618–623. [Google Scholar] [CrossRef]
  38. Gurung, R.B.; Lindgren, T.; Boström, H. Learning decision trees from histogram data using multiple subsets of bins. In Proceedings of the The Twenty-Ninth International Flairs Conference, Key Largo, FL, USA, 16–18 May 2016. [Google Scholar]
  39. Ye, J. A faster drop-in implementation for leaf-wise exact greedy induction of decision tree using pre-sorted deque. arXiv 2017, arXiv:1712.06989. [Google Scholar]
  40. Li, Z.; Yao, X.; Liu, Z.; Zhang, J. Feature selection algorithm based on LightGBM. J. Northeast. Univ. 2021, 42, 1688. [Google Scholar]
  41. Afanaseva, O.; Bezyukov, O.; Pervukhin, D.; Tukeev, D. Experimental study results processing method for the marine diesel engines vibration activity caused by the cylinder-piston group operations. Inventions 2023, 8, 71. [Google Scholar] [CrossRef]
  42. Verma, S.; Pant, M.; Snasel, V. A comprehensive review on NSGA-II for multi-objective combinatorial optimization problems. IEEE Access 2021, 9, 57757–57791. [Google Scholar] [CrossRef]
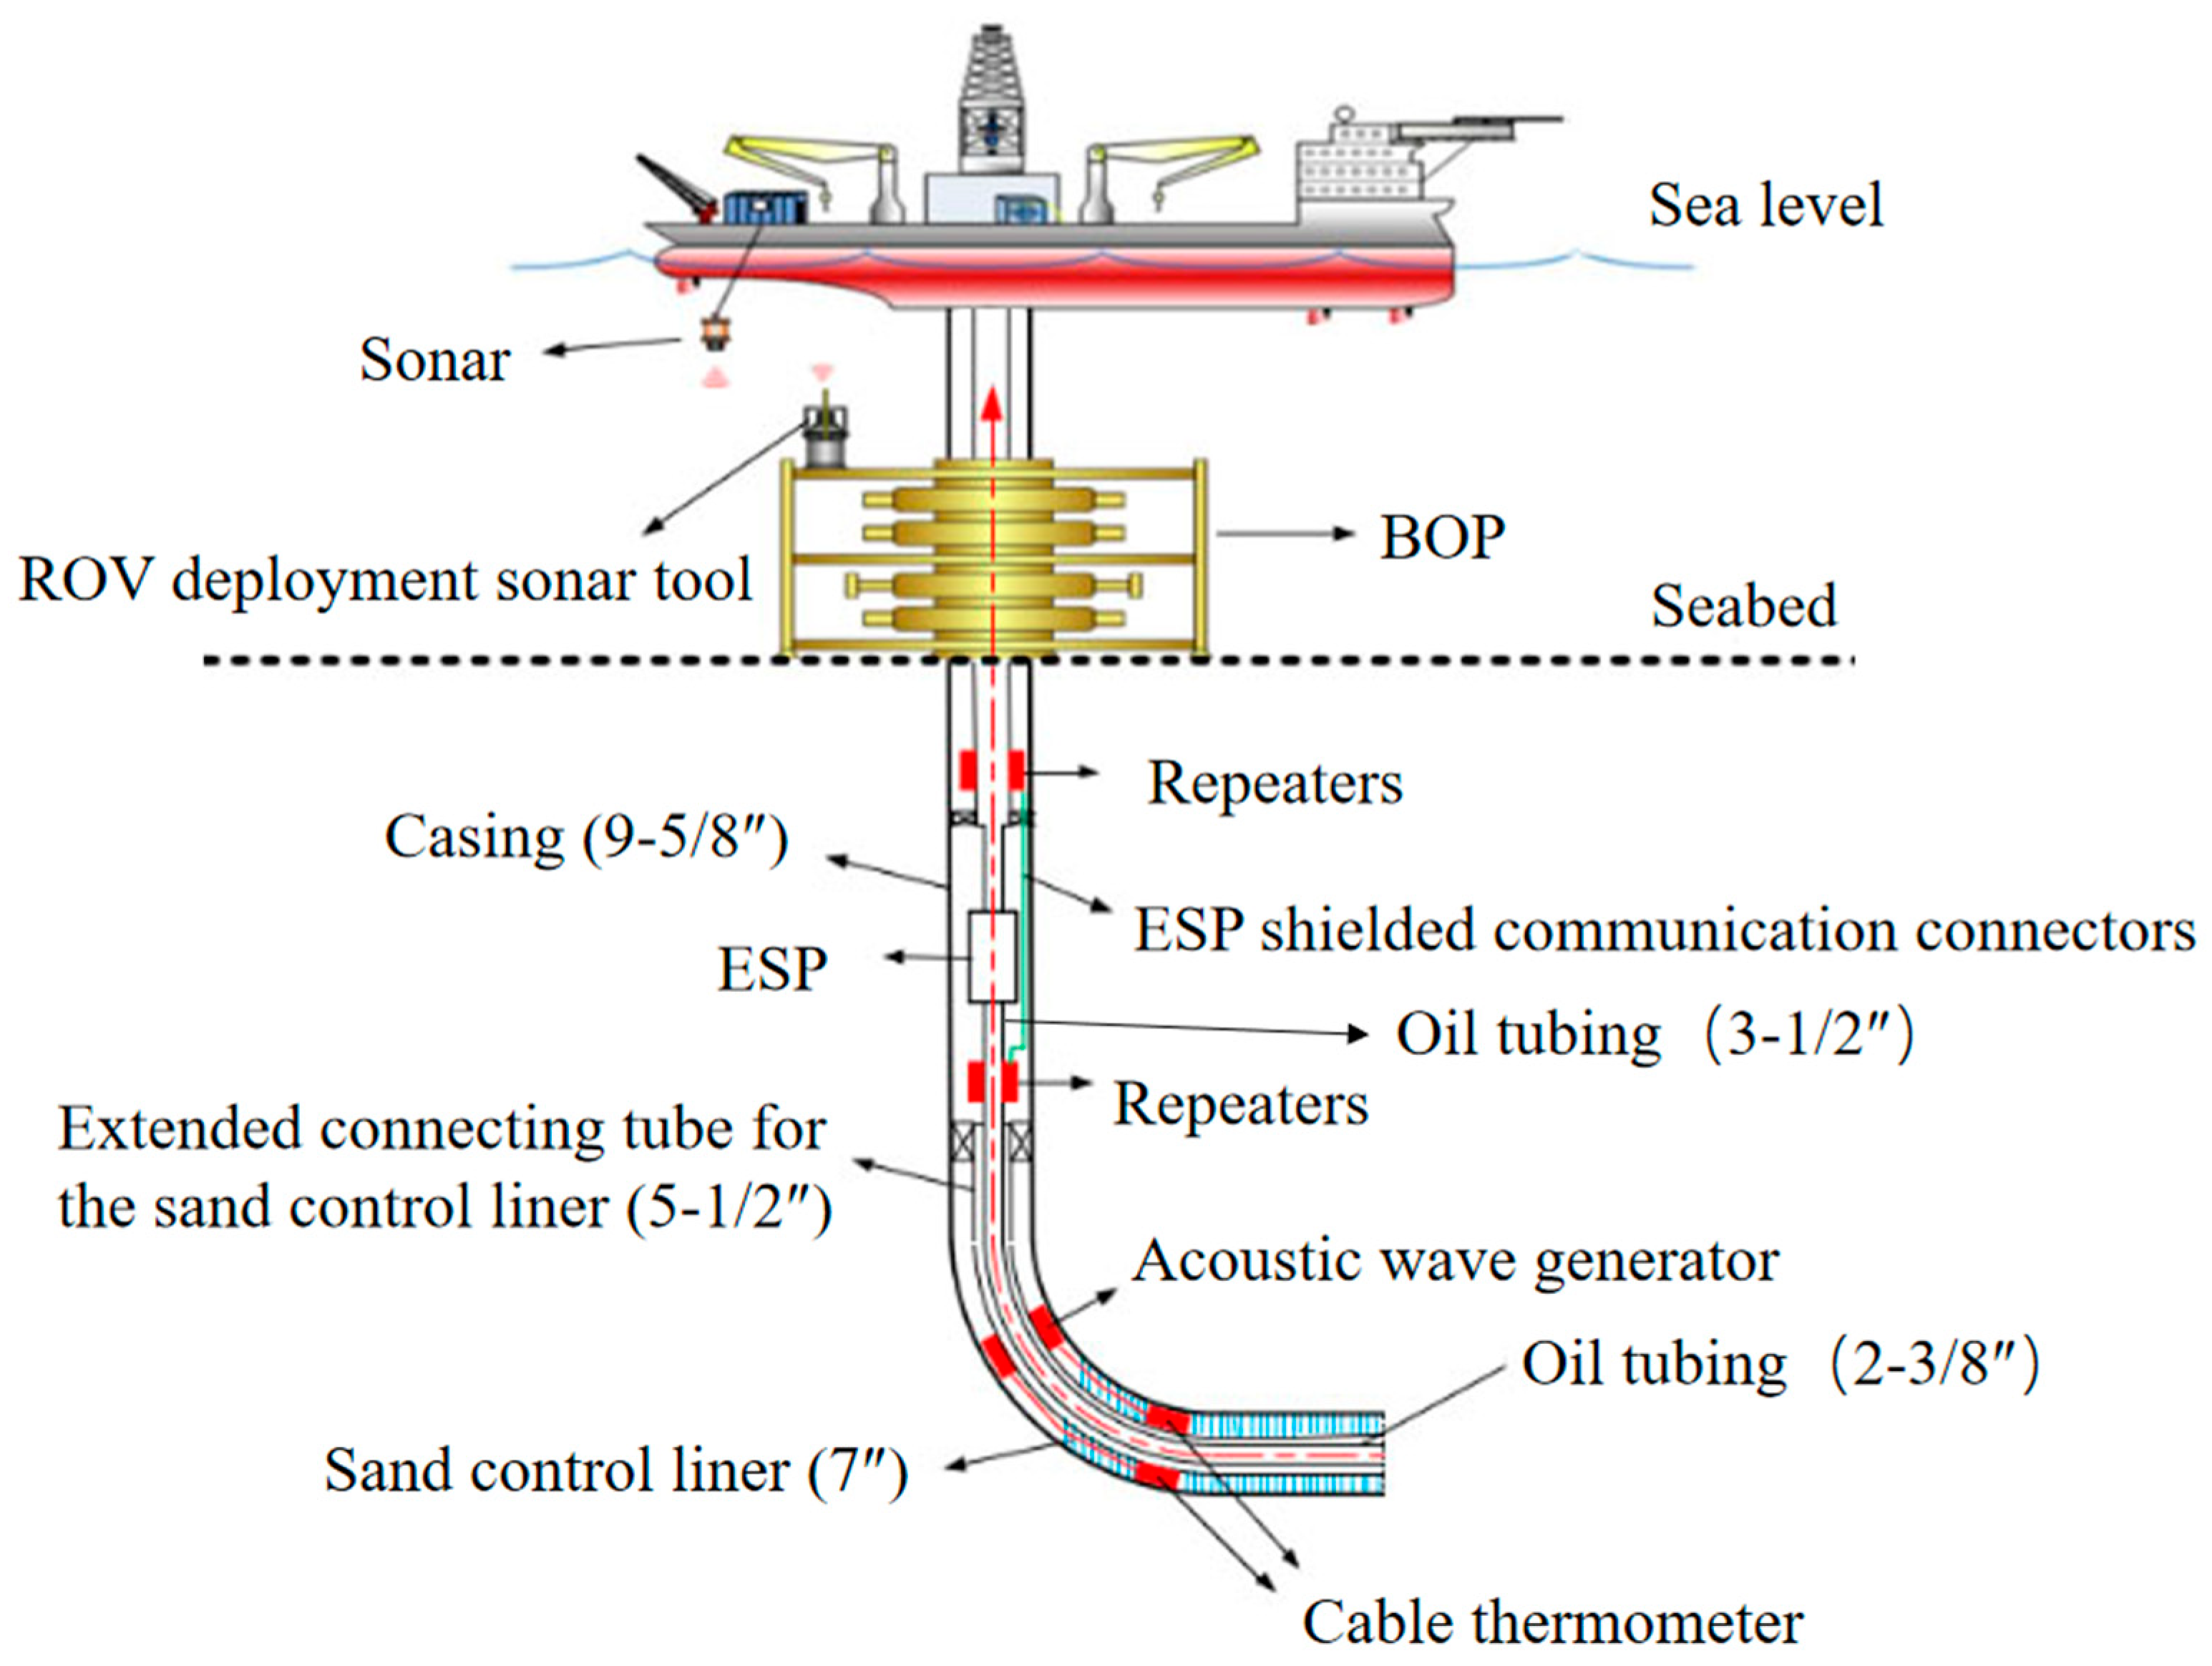
Figure 1. Schematic diagram of acoustic signal transmission for monitoring completion of gas hydrate test wells.
Applsci 15 09174 g001
Figure 2. (a) Simplified model of string system and medium setting; (b) Connection sizes at oil tubing clamp.
Applsci 15 09174 g002
Figure 3. (a) Encrypted grid at the tubing clamp; (b) Mapped grid in the remaining area.
Applsci 15 09174 g003
Figure 4. Cloud and line plots of sound pressure at the incident and exit end at different frequencies: (a) incident end (100 Hz); (b) exit end (100 Hz); (c) sound pressure at different transmission distances (100 Hz); (d) incident end (500 Hz); (e) exit end (500 Hz); (f) sound pressure at different transmission distances (500 Hz); (g) incident end (2000 Hz); (h) exit end (2000 Hz); (i) sound pressure at different transmission distances (2000 Hz).
Applsci 15 09174 g004
Figure 5. Cloud and line plots of sound pressure levels at the incident and exit end at different frequencies: (a) incident end (100 Hz); (b) exit end (100 Hz); (c) sound pressure level at different transmission distances (100 Hz); (d) incident end (500 Hz); (e) exit end (500 Hz); (f) sound pressure levels at different transmission distances (500 Hz); (g) incident end (2000 Hz); (h) exit end (2000 Hz); (i) sound pressure levels at different transmission distances (2000 Hz).
Applsci 15 09174 g005
Figure 6. (a) Sound pressure amplitude ratio curve; (b) Displacement ratio curve of oil tubing; (c) Sound pressure attenuation curve of oil tubing.
Applsci 15 09174 g006
Figure 7. Sound pressure amplitude ratio at different frequencies (0–2000 Hz).
Applsci 15 09174 g007
Figure 8. Sound pressure amplitude ratio at different frequencies (0–500 Hz).
Applsci 15 09174 g008
Figure 9. Sound pressure amplitude ratio curves in different splice thicknesses.
Applsci 15 09174 g009
Figure 10. Sound pressure amplitude ratio curves in different splice lengths.
Applsci 15 09174 g010
Figure 13. Feature importance of input parameters for LightGBM models.
Applsci 15 09174 g013
Figure 14. (a) Plot of parameter identification results for Model 1. (b) Residual histogram for Model 1. (c) Plot of parameter identification results for Model 2. (d) Residual histogram for Model 2.
Applsci 15 09174 g014
Figure 15. Algorithm flowchart.
Applsci 15 09174 g015
Figure 16. Optimization results.
Applsci 15 09174 g016
Table 1. Comparison of previous and current studies on acoustic transmission of pipe strings.
Comparison DimensionPrevious StudiesCurrent Studies
Research orientationAcoustic transmission of periodic/single-layer oil pipesAcoustic transmission of multi-layer pipe strings in hydrate trial production
Structural complexitySingle-layer pipe simple modelMulti-layer pipe-fluid coupling model
Research methodTheoretical analysis + simple simulationCOMSOL (Version 6.3) simulation + LightGBM prediction + NSGA-II optimization
Optimization objectiveNo clear multi-objective optimizationMax transmission distance, sound pressure ratio, min attenuation
Application scenarioConventional oil and gas downhole monitoringNatural gas hydrate trial production
Innovation summary Focus on theoretical derivation and single simulation [30]Construct a multi-layer pipe-fluid coupled acoustic model; establish a “simulation-LightGBM prediction-NSGA-II optimization” closed-loop framework
Table 2. Setting of material properties.
Material properties of structural domainsStructural steel
Isotropic structured loss factor (1)0.04
Density (kg/m3)7850
Young’s modulus (GPa)210
Poisson’s ratio (1)0.27
Material properties of fluid domainsWaterGas–water compound
Intrinsic viscosity (mPa-s)0.60.4
Dynamic viscosity (mPa-s)0.80.5
Density (kg/m3)1020600
Speed of sound (m/s)1500340
Table 3. Definition and range of values of parameter variables [33].
ParametricRealmStep IntervalParameter Description
n10–50 (root)10 (root)Number of tubing cascades
lkg4–12 (mm)2 (mm)Thickness of oil tubing connection clamps
hkg0.2–1.4 (m)0.2 (m)Width of oil tubing connection clamps
freq20–2000 (Hz)10 (Hz)source frequency
Table 4. Model evaluation metric and LightGBM algorithm parameter settings for identification of Model 1 and 2.
Indicator/ParameterModel 1Model 2
Model evaluation metric
R2 (%)88.7985.08
RMSE (dB)0.04734.3955
LightGBM algorithm
parameters
colsample_bytree[0.6, 0.1, 1.0][0.6, 0.1, 1.0]
learning_rate[0.005, 0.005, 0.15][0.005, 0.005, 0.15]
max_depth[5, 5, 25][5, 5, 25]
n_estimators[200, 200, 1000][200, 200, 1000]
num_leaves[20, 20, 60][20, 20, 60]
subsample[0.6, 0.1, 1.0][0.6, 0.1, 1.0]
Extraction of input features (dataset)hkg, lkg, n, freqhkg, lkg, n, freq
Target variable (validation set)Sound pressure amplitude ratioSound pressure level attenuation
Disclaimer/Publisher’s Note: The statements, opinions and data contained in all publications are solely those of the individual author(s) and contributor(s) and not of MDPI and/or the editor(s). MDPI and/or the editor(s) disclaim responsibility for any injury to people or property resulting from any ideas, methods, instructions or products referred to in the content.