1. Introduction
Remanufacturing is an End-of-Life strategy that is a key element of the circular economy in industrial countries [
1]. The remanufacturing process enables the reconditioning and reuse of parts from used products at the end of their useful life, providing them with completely new life cycles. Thereby, compared to the production of new parts, up to 90% of energy and 55% of material can be saved [
2].
According to Steinhilper, the remanufacturing process contains five sequential steps: Product disassembly, cleaning, inspection and sorting, reconditioning and/or replenishment, and reassembly [
3]. In the inspection and sorting step, the single parts of the disassembled product are examined and sorted according to their reusability in the succeeding process. Depending on its type and condition, the part could be sorted as “directly reusable”, “reusable after reconditioning”, or “not reusable” [
3]. Usually, low-value parts that are not directly reusable and wear parts will be discarded from the process and fed to a recycling process.
In general, the decision on the reusability of a part is carried out manually based on a worker’s expert knowledge [
4]. However, given the increasing number of used products and product variants, an automated decision-making process is required [
5,
6]. Recent automation approaches have increasingly turned to Deep Learning (DL)-based vision systems [
4,
7,
8]. Nevertheless, training such supervised approaches requires large, diverse datasets that capture all available part variants across various conditions.
Creating these datasets is challenging, particularly due to the need for extensive physical resources. Specifically, access to large quantities of returned parts across all relevant conditions and classes is needed. In some cases, this may involve binary classification (e.g., reusable vs. recyclable); however, other remanufacturing contexts may require more granular distinctions, such as those concerning parts that are directly reusable, reusable after reconditioning, or recyclable. Regardless of the classification scheme, collecting sufficient examples, particularly of defective or rarely occurring part types, is both costly and time-intensive for frequently processed parts, and it is often infeasible for uncommon remanufacturing parts [
9].
Uncommon or exotic remanufacturing parts emerge due to several distinct circumstances. One key factor is core complexity, which increases throughout the product life cycle. A single automotive part may exist in numerous revision levels due to continuous technical and design modifications, resulting in a broad range of part numbers that must be distinguished and managed effectively [
10]. In addition, core management introduces further uncertainty. It is not guaranteed that all parts produced will return after the usage phase. For example, a core may never enter the reverse supply chain (e.g., when it is discarded by the user or retained for other purposes), or it may become untraceable or unavailable within the reverse logistics process (e.g., due to issues like labeling errors or insufficient tracking systems) [
10]. Even when cores do return, they do so irregularly and unpredictably, influenced by varying usage intensities, failure rates, and consumer behavior, which together disrupt the predictability of supply [
11]. Furthermore, parts from car models that are no longer in production, such as vintage vehicles, become increasingly rare as the number of remaining vehicles diminishes. Similarly, parts from newly introduced models may also be scarce during the early stages of their product life cycle, as production scale-up delays the availability of returned cores at remanufacturing facilities. These challenges collectively result in a high degree of variability and scarcity in available parts. As a consequence of this scarcity, training datasets used in DL applications for used part classification are often imbalanced, with certain classes (e.g., defective parts) being significantly underrepresented, ultimately degrading the performance of DL classifiers [
12]. In our work, we address the problem of data scarcity in remanufacturing with the help of Data-Efficient Generative Adversarial Networks (DE-GANs).
2. Related Works
This section provides an overview of DE-GANs and their role in addressing the challenges associated with limited and imbalanced datasets. The following paragraphs present key developments in Generative Adversarial Network (GAN) architectures, data augmentation approaches, regularization methods, and lightweight model designs.
GAN-based data augmentation has shown promising results in overcoming the restrictions of limited and imbalanced real-world datasets [
13,
14,
15]. GANs learn a probabilistic model of a given distribution of data and then use this model to generate new samples [
16]. The original GAN consists of two neural networks trained in an adversarial manner: a generator network and a discriminator network [
16]. The generator network generates synthetic images, and the discriminator network evaluates the quality of the generated images by trying to distinguish between real and synthesized images. Recently, several GAN architectures have been developed and used for the augmentation of high-quality image data. The areas of application are numerous and include medical technology [
17,
18], production [
19], and agriculture [
20], among others. Despite their success, GANs suffer from unstable, sensitive training, mode collapse, mode mixture, and a dependence on large training datasets [
21]. When training data are scarce, DE-GANs offer a solution to stabilize the training process and deliver realistic images by distribution optimization. Li et al. provided a comprehensive explanation of DE-GANs and highlighted that the decline in performance stems from the discrepancy between data distributions, causing a degradation of the DE-GAN [
22]. Yang et al. expanded upon the foundational work by Li et al. [
22] on DE-GANs [
23]. They broadened the analysis to include conditional generative models and one-shot image synthesis tasks, which were not addressed by Li et al. Furthermore, Yang et al. updated the discourse by integrating the recent advancements and inversion techniques which have emerged since Li et al.’s publication. Their survey also provided a detailed comparison of design concepts and method characteristics across different approaches, emphasizing practical applications and identifying technical limitations for future research. Understanding the limitations of DE-GANs helps to categorize various existing methods, based on distribution optimization, into data selection [
24,
25,
26], knowledge sharing [
27,
28,
29,
30,
31,
32,
33,
34,
35,
36,
37,
38], and DE-GAN optimization approaches [
22]. Data selection approaches focus on minimizing the data gap between the distribution of the limited training dataset and the distribution of the entire target dataset by applying sampling strategies [
22]. Knowledge sharing and DE-GAN optimization approaches target minimizing the existing empirical gap between the generated distribution after the training process and the empirical distribution of the training samples by utilizing additional prior knowledge or optimized frameworks [
22].
DE-GAN optimization approaches challenge the risks of overfitting the discriminator and the imbalance between the latent and data spaces due to limited training data by utilizing data augmentation, regularization, and simple, efficient model architectures [
22].
Recent
data augmentation approaches focus on mitigating the problem of overfitting in discriminators by augmenting both real and synthetic samples using spatial and visual transformations [
39,
40,
41,
42,
43]. Spatial transformations, such as zooming, cutout, and translation, manipulate the image itself, while visual transformations, such as brightness and coloring, change how the image appears [
22]. It is hypothesized that spatial transformations can improve the performance of DE-GANs more than visual transformations [
22]. The most common approaches are Adaptive Discriminator Augmentation (ADA), Adaptive Pseudo Augmentation (APA), and Differentiable Augmentation (DA) [
42]. ADA [
39] modulates the intensity of data augmentation, whereas APA [
40] selects generated images to augment real data when the discriminator is overfitting during training. Adaptive Feature Interpolation (AFI), presented by Dai et al. [
44], introduces an implicit data augmentation technique that enhances stable training and high-quality sample synthesis without label information. AFI employs the discriminator as a metric embedding of the real data manifold to execute unsupervised, feature-level sample interpolation. Jeong et al. proposed ContraD [
45], a Contrastive Discriminator framework that integrates contrastive learning into the training process of GAN discriminators. Rather than directly optimizing the discriminator for the GAN loss, ContraD derives a contrastive representation from augmentations and (real or generated) samples. This representation is then used by a two-layer network to function as the actual discriminator. To make the discriminator less sensitive towards the invariance caused by data augmentation, Hou et al. developed an augmentation-aware discriminator (AugSelf-GAN), which predicts the parameters of an augmentation applied to the input image [
46]. Huang et al.’s MaskedGAN [
47] presents a robust image generation approach that excels with limited training data by randomly masking out portions of image information to facilitate effective GAN training. This method employs two masking strategies: shifted spatial masking, which applies random shifts in the spatial dimensions, and balanced spectral masking, which masks certain spectral bands with self-adaptive probabilities.
Regularization approaches aim to enhance generalization in DE-GANs by incorporating priors or additional supervision tasks [
48]. For instance, Tseng et al. proposed an anchor-based regularization term to mitigate discriminator overfitting, forcing the discriminator to mix predictions of real and synthetic images rather than differentiating them [
49]. Similarly, Fang et al. introduced the Discriminator Gradient Gap-Regularized GAN (DigGAN) [
50]. DigGAN augments existing GANs by narrowing the gap between the norm of the gradient of a discriminator’s prediction for real images and generated samples, thus aiding in avoiding detrimental attractors within the GAN loss landscape. Expanding on the idea of regularized representation spaces, Yang, M. et al. proposed ProtoGAN [
51], a method that incorporates a metric-learning-based prototype mechanism that aligns the prototypes and features of real and generated images in the embedding space to enhance the fidelity of the generated images. The authors also included a variance term in the objective function to promote synthesis diversity. To encourage robustness across varying styles, Kim et al. [
52] suggested Feature Statistics Mixing Regularization (FSMR), where the features of an original image and a reference image are mixed in the feature space to produce images in new styles. Likewise, Pengwei [
53] proposed Latent Feature Maximization (LFM) to improve diversity in the latent space by enforcing orthogonality between latent vectors, measured via dot–product constraints. In a different direction, Yang, C. et al. proposed InsGen, a contrastive-learning-based framework that extends the discriminator’s role beyond binary real/fake classification [
54]. It introduces instance discrimination, compelling the discriminator to distinguish between individual image instances. This additional supervision promotes the learning of fine-grained, instance-aware features and implicitly encourages a more structured and diverse latent representation. Complementing this perspective, Kong et al. [
55] addressed the imbalance between latent and data spaces by introducing a regularization strategy based on latent space interpolation. By sampling interpolation coefficients and generating anchor points between latent vectors, their method encourages smooth transitions in the generative mapping. While no explicit constraint is applied directly on the latent space, this strategy implicitly regularizes its structure by enforcing semantic consistency across interpolated samples.
The
model architecture significantly influences the performance and stability of GANs [
56]. Style-based [
57,
58] and progressively growing [
59] architectures have gained much attention in research, but they are prone to overfitting in limited data settings due to their large number of parameters [
23]. To address this limitation, lightweight DE-GAN architectures have been proposed. For instance, Liu et al. [
60] introduced FastGAN, which employs a skip-layer channel-wise excitation module and a self-supervised discriminator trained as a feature encoder. This architecture demonstrates superior performance and faster convergence compared to StyleGAN2 under constrained data settings. In a complementary direction, Li et al. [
61] proposed the Memory Concept Attention (MoCA) module, which enhances the generator with a memory-based attention mechanism guided by prototypes obtained through momentum online clustering. Beyond architectural simplification, some works explore alternative representations of the input data. Yang et al. [
62] presented FreGAN, a frequency-aware framework that incorporates both a frequency-aware discriminator and a high-frequency alignment module. These components explicitly model and inject frequency domain representations into the generation process and help stabilize training. Also addressing discriminator overfitting, Cui et al. [
63] introduced Generative Co-training (GenCo), a framework that employs multiple complementary discriminators to provide diverse supervision. This approach enables the generator to learn more robust and generalized representations. In contrast to Cui’s strategy of increasing discriminator diversity, Yang et al. [
64] proposed DynamicD, which dynamically adjusts the discriminator’s capacity throughout training. By progressively increasing or decreasing model capacity depending on data availability, DynamicD improves generalization while maintaining training efficiency. Building on the goal of improving parameter efficiency under limited data, some works move beyond fixed architectures by discovering or leveraging sparse yet effective subnetworks. Chen et al. [
65] introduced a two-stage framework based on the lottery ticket hypothesis, which identifies highly sparse and independently trainable subnetworks—referred to as GAN lottery tickets—from larger models. These subnetworks, once retrained on the same dataset, can match or even outperform their dense counterparts while reducing computational overhead. Similarly, Shi et al. [
66] proposed AutoInfoGAN, which combines neural architecture search (NAS) with contrastive representation learning. By using reinforcement learning and unsupervised contrastive loss, AutoInfoGAN autonomously discovers compact and performant architecture configurations without manual tuning. In a similar vein, Saxena et al. [
67] introduced Re-GAN, which dynamically prunes and regrows network connections during training. This continual architectural reconfiguration regularizes the GAN and avoids the costly train–prune–retrain cycles associated with conventional lottery ticket approaches.
3. Research Gap
Recent advances in DE-GANs have demonstrated promising results in generating high-quality images under limited data conditions. Despite this progress, their applicability to remanufacturing, particularly for the purpose of generating synthetic training data to support the classification of used industrial parts, remains largely unexplored.
Approaches for generating synthetic training data in remanufacturing often rely on 3D model rendering [
68,
69,
70,
71] or manual augmentation (e.g., pasting defects into images of non-defective parts) [
72], both of which are resource-intensive and impractical for many real-world reverse supply chains, where 3D models of parts are rarely available. To date, the only generative model that has been explored within the broader remanufacturing context is the standard Deep Convolutional Generative Adversarial Network (DCGAN), as investigated by Gao et al. [
12], who used solely 2D images as the input to generate data for classifying used gears with different defect types. However, DCGAN was not developed for low-data regimes, making it prone to overfitting and unstable training. To compensate for the limited training data, Gao et al. applied Random Oversampling (ROS), expanding the dataset from 50 to 200 images by repeatedly duplicating samples across categories. This strategy, while increasing sample count, introduces the risk of overfitting and compromises model generalizability [
73]. Moreover, their evaluation relied largely on synthetically generated test data, which may not provide a reliable indication of real-world performance. Their study also focused on a single part type across five defect conditions, with images sharing similar properties such as color, size, and point-of-view [
12].
In a broader evaluation context, Li et al. conducted a comprehensive review of DE-GAN approaches, which had been evaluated on datasets like FFHQ-5K, FFHQ-1K, and CIFAR-10 [
22]. While their work provides valuable insights into the performance of DE-GANs under low-data regimes, it does not extend to domain-specific contexts such as remanufacturing. The unique challenges posed by industrial parts, including variability caused by wear, the presence of heterogeneous materials, and inconsistent visual conditions, are not addressed in prior work.
In contrast, our dataset includes 36 parts varying in material (plastic and some contain metal bearings), size, shape, and color. Image acquisition was intentionally performed under varied perspectives, lighting conditions, and distances between the object and the lens to simulate the heterogeneity encountered in real remanufacturing environments. Contrary to the approach of Gao et al., we did not use ROS and Traditional Data Enhancement [
12]. To the best of our knowledge, no prior study has systematically investigated the application of DE-GANs for generating synthetic images of used parts with real-world defects and evaluating their usefulness for downstream classification tasks in remanufacturing. Our study addresses this gap and makes the following contributions:
Application of DE-GANs in remanufacturing: We investigate the effectiveness of optimized DE-GANs against the State-of-the-Art (SOTA) DCGAN in generating realistic images of defective and non-defective parts under limited data conditions. To our knowledge, this represents the first evaluation of DE-GANs in this specific domain.
Use of a diverse, real-world dataset: Our dataset includes parts with different material properties, geometries and wear patterns. The images were captured under varying conditions, including changes in lighting, object orientation, and distance, to reflect the complexity of real industrial settings.
Avoidance of oversampling and synthetic evaluation bias: Unlike Gao et al., we do not use ROS or rely on synthetic test sets. Instead, we assess model performance using a test set comprising solely real images, allowing for a more reliable evaluation of classification performance.
Analysis of synthetic data utility for downstream tasks: We assess the applicability of DE-GAN-generated images for training classifiers that predict the reusability of used parts and investigate the impact of different real-to-synthetic data ratios on classification accuracy.
Our work focuses on whether optimized DE-GANs are more effective in generating accurate synthetic images of defective and non-defective parts with limited training data compared to the SOTA DCGAN approach. In this context, we limited our study to the evaluation of optimized DE-GAN frameworks, whereas knowledge sharing and data selection approaches are outside the scope of this paper.
4. Materials and Methods
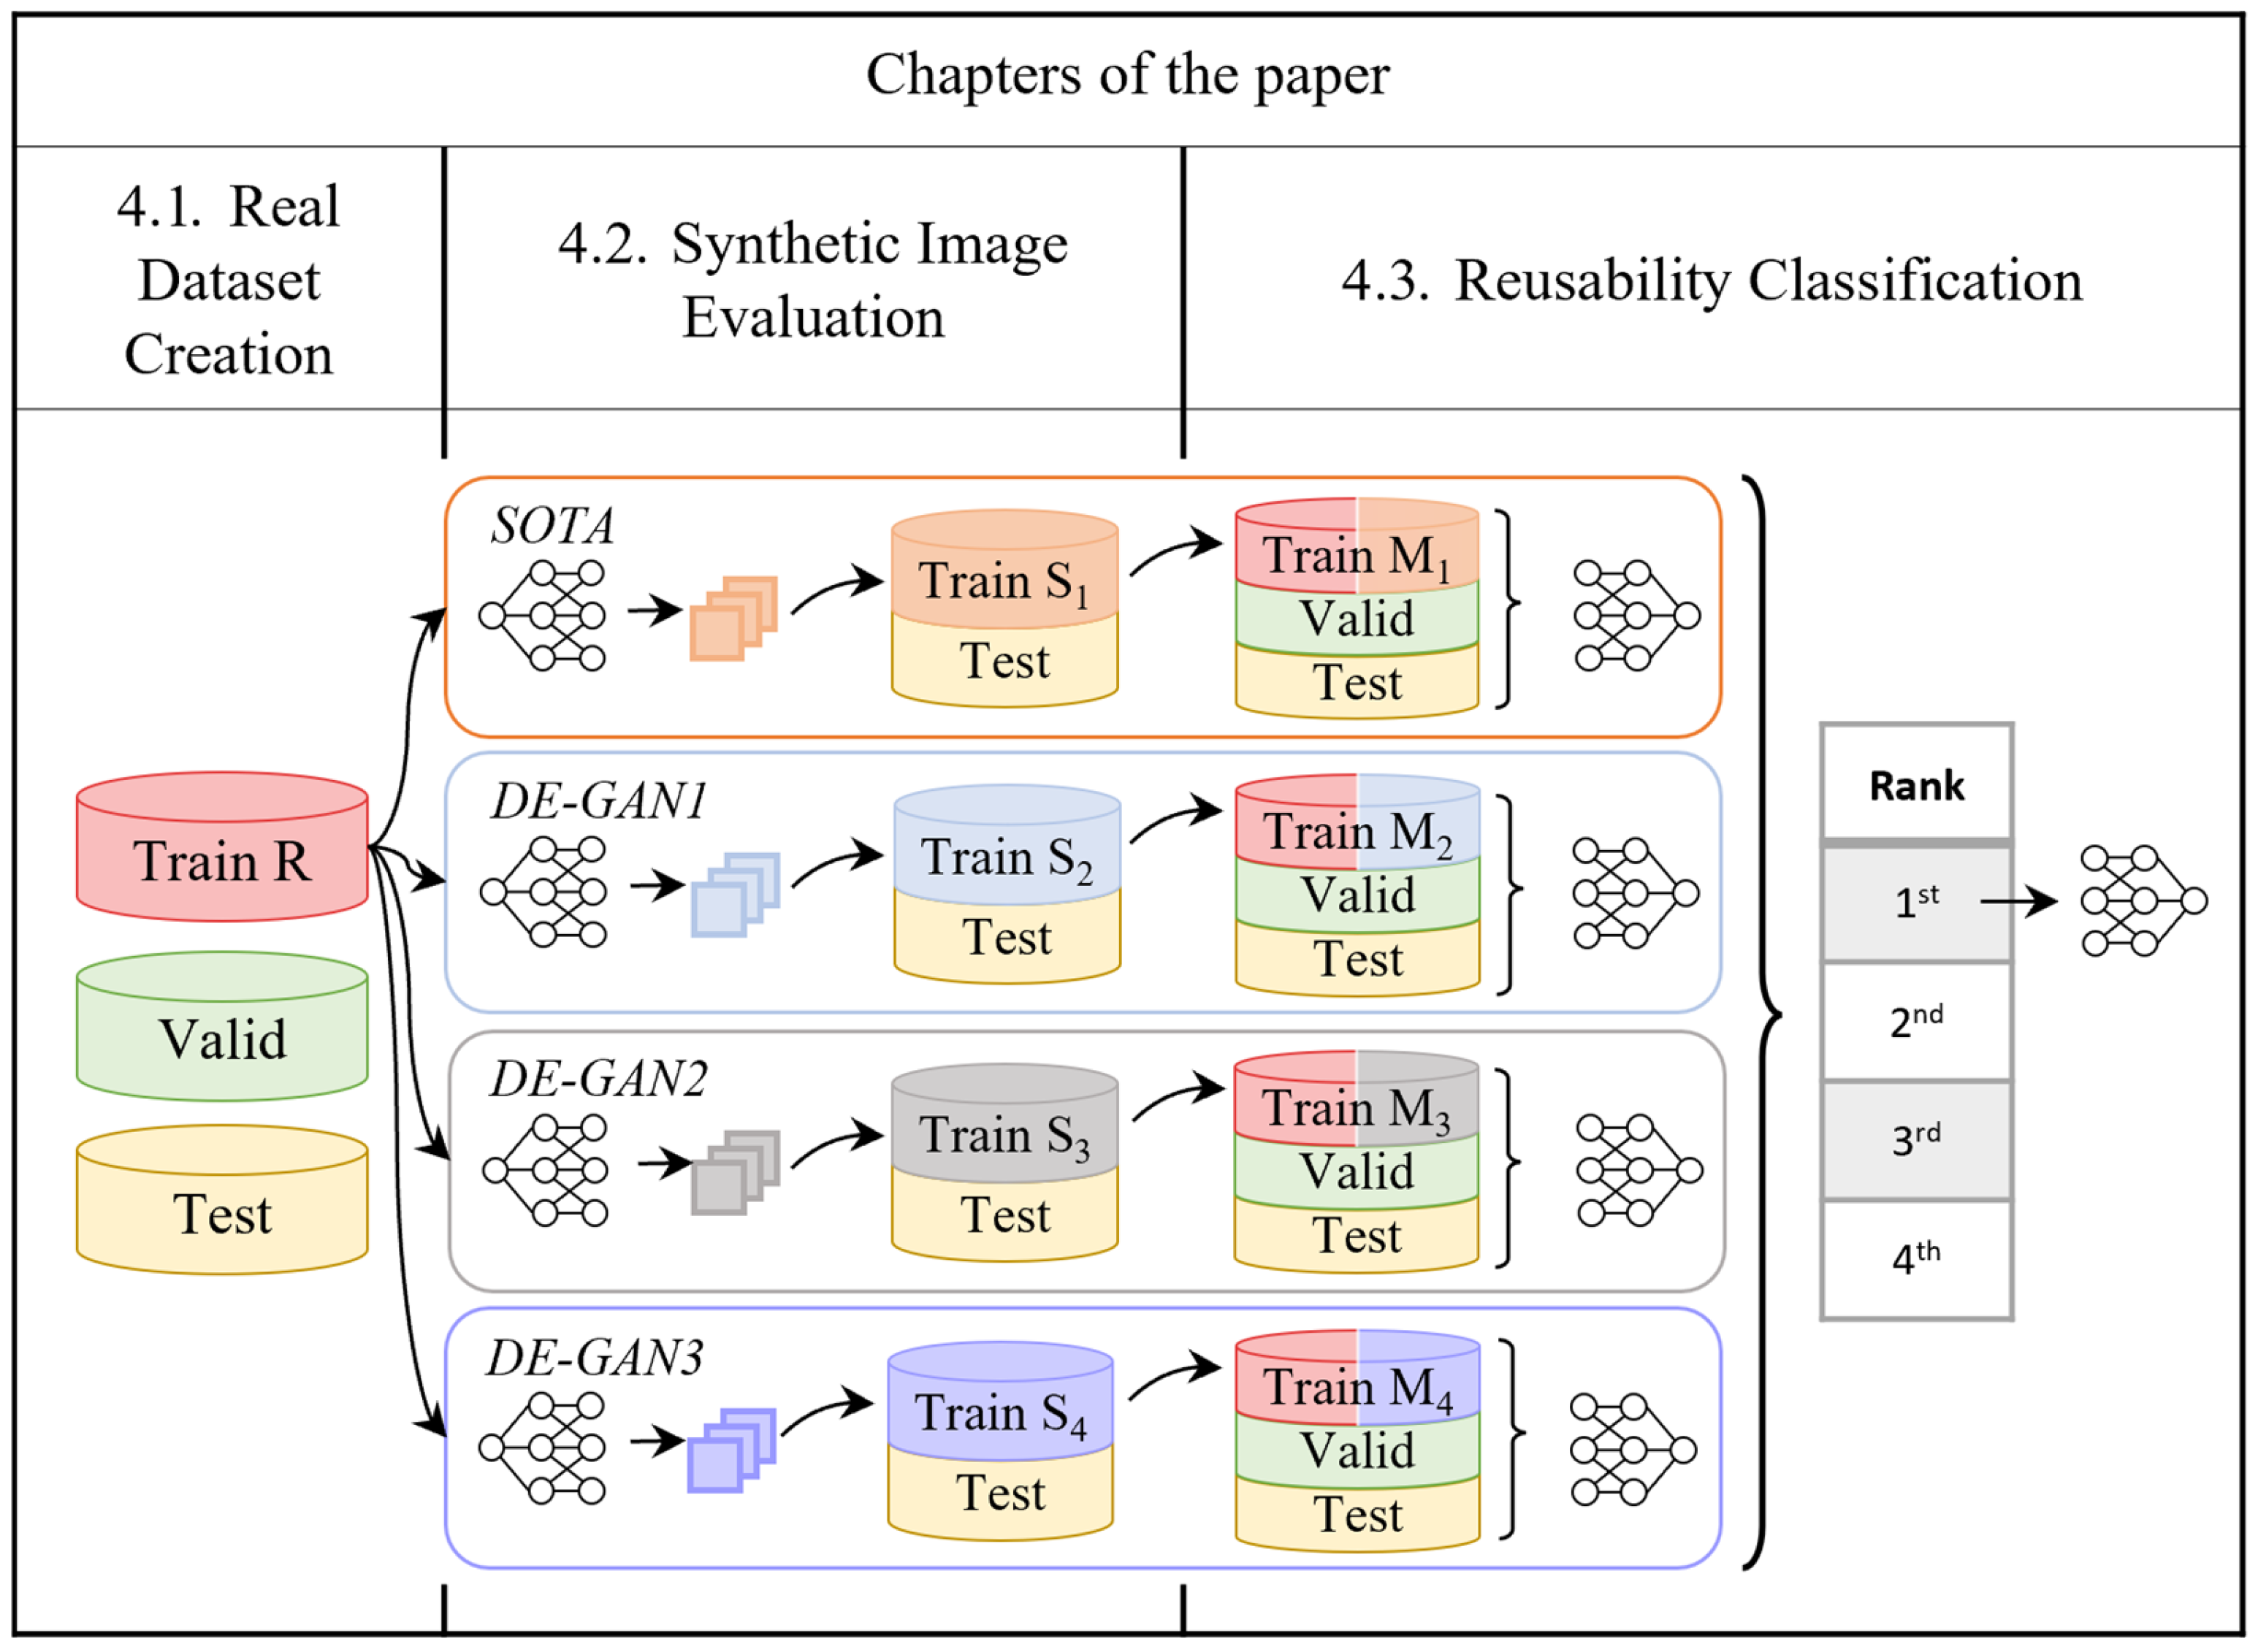
To assess whether synthetic images improve reusability classification, we followed the three-step approach shown in
Figure 1: First, we created a real image dataset, which was then split in a stratified manner into a real training dataset (“Train R”), a real validation dataset (“Valid”), and a test dataset (“Test”). Second, we trained one baseline GAN (SOTA DCGAN) and the three most promising DE-GANs to synthesize additional training data. The synthetic training data (“Train S
n”) were first visually inspected and then evaluated on quality metrics using the real test dataset (“Test”) as reference. Next, we formed mixed training datasets (“Train M
n”) at predefined ratios of real and synthetic data. For every generative model and ratio, we trained ResNet18 classifiers on the mixed training set (“Train M
n”), while monitoring convergence on the real validation dataset (“Valid”). After training, we evaluated all classifiers on the held-out real test dataset (“Test”) and used these test results to identify the best-performing combination of generative model and real-to-synthetic ratio. Then, we optimized the hyperparameters of the ResNet18 classifiers by using the mixed training dataset (“Train M
n”) of the best-performing combination (Real-to-synthetic ratio and GAN-model) for training and the real validation dataset (“Valid”) for monitoring. Finally, the optimized classifiers’ performance was assessed and reported using quality metrics on the real test dataset (“Test”).
4.1. Real Dataset Creation
This study utilizes a dataset of gears previously used in electric bicycle motors, sourced from the completed “AddRE-Mo” project (
https://www.addre-mo.de/, accessed on 1 September 2025). As a part of our current research project, ‘Versatile-KI’, we are employing this dataset to continue testing methods. The gears in the dataset vary in size, color, wear patterns, and material properties, consisting of different types of plastics. Some gears include metal bearings, while others do not feature any bearings at all. To better simulate real-world conditions, we captured images from various perspectives, lighting conditions, and distances between the camera and the object. Although all images were taken against the same background, we adjusted the camera settings based on the gear colors, which range from bright yellow to almost black. These adjustments were necessary to prevent over-exposure and under-exposure, causing the background appearance to vary across images. The darker the gear, the brighter the background appears and vice versa. This methodological approach was chosen to evaluate the practical suitability of DE-GAN optimization techniques.
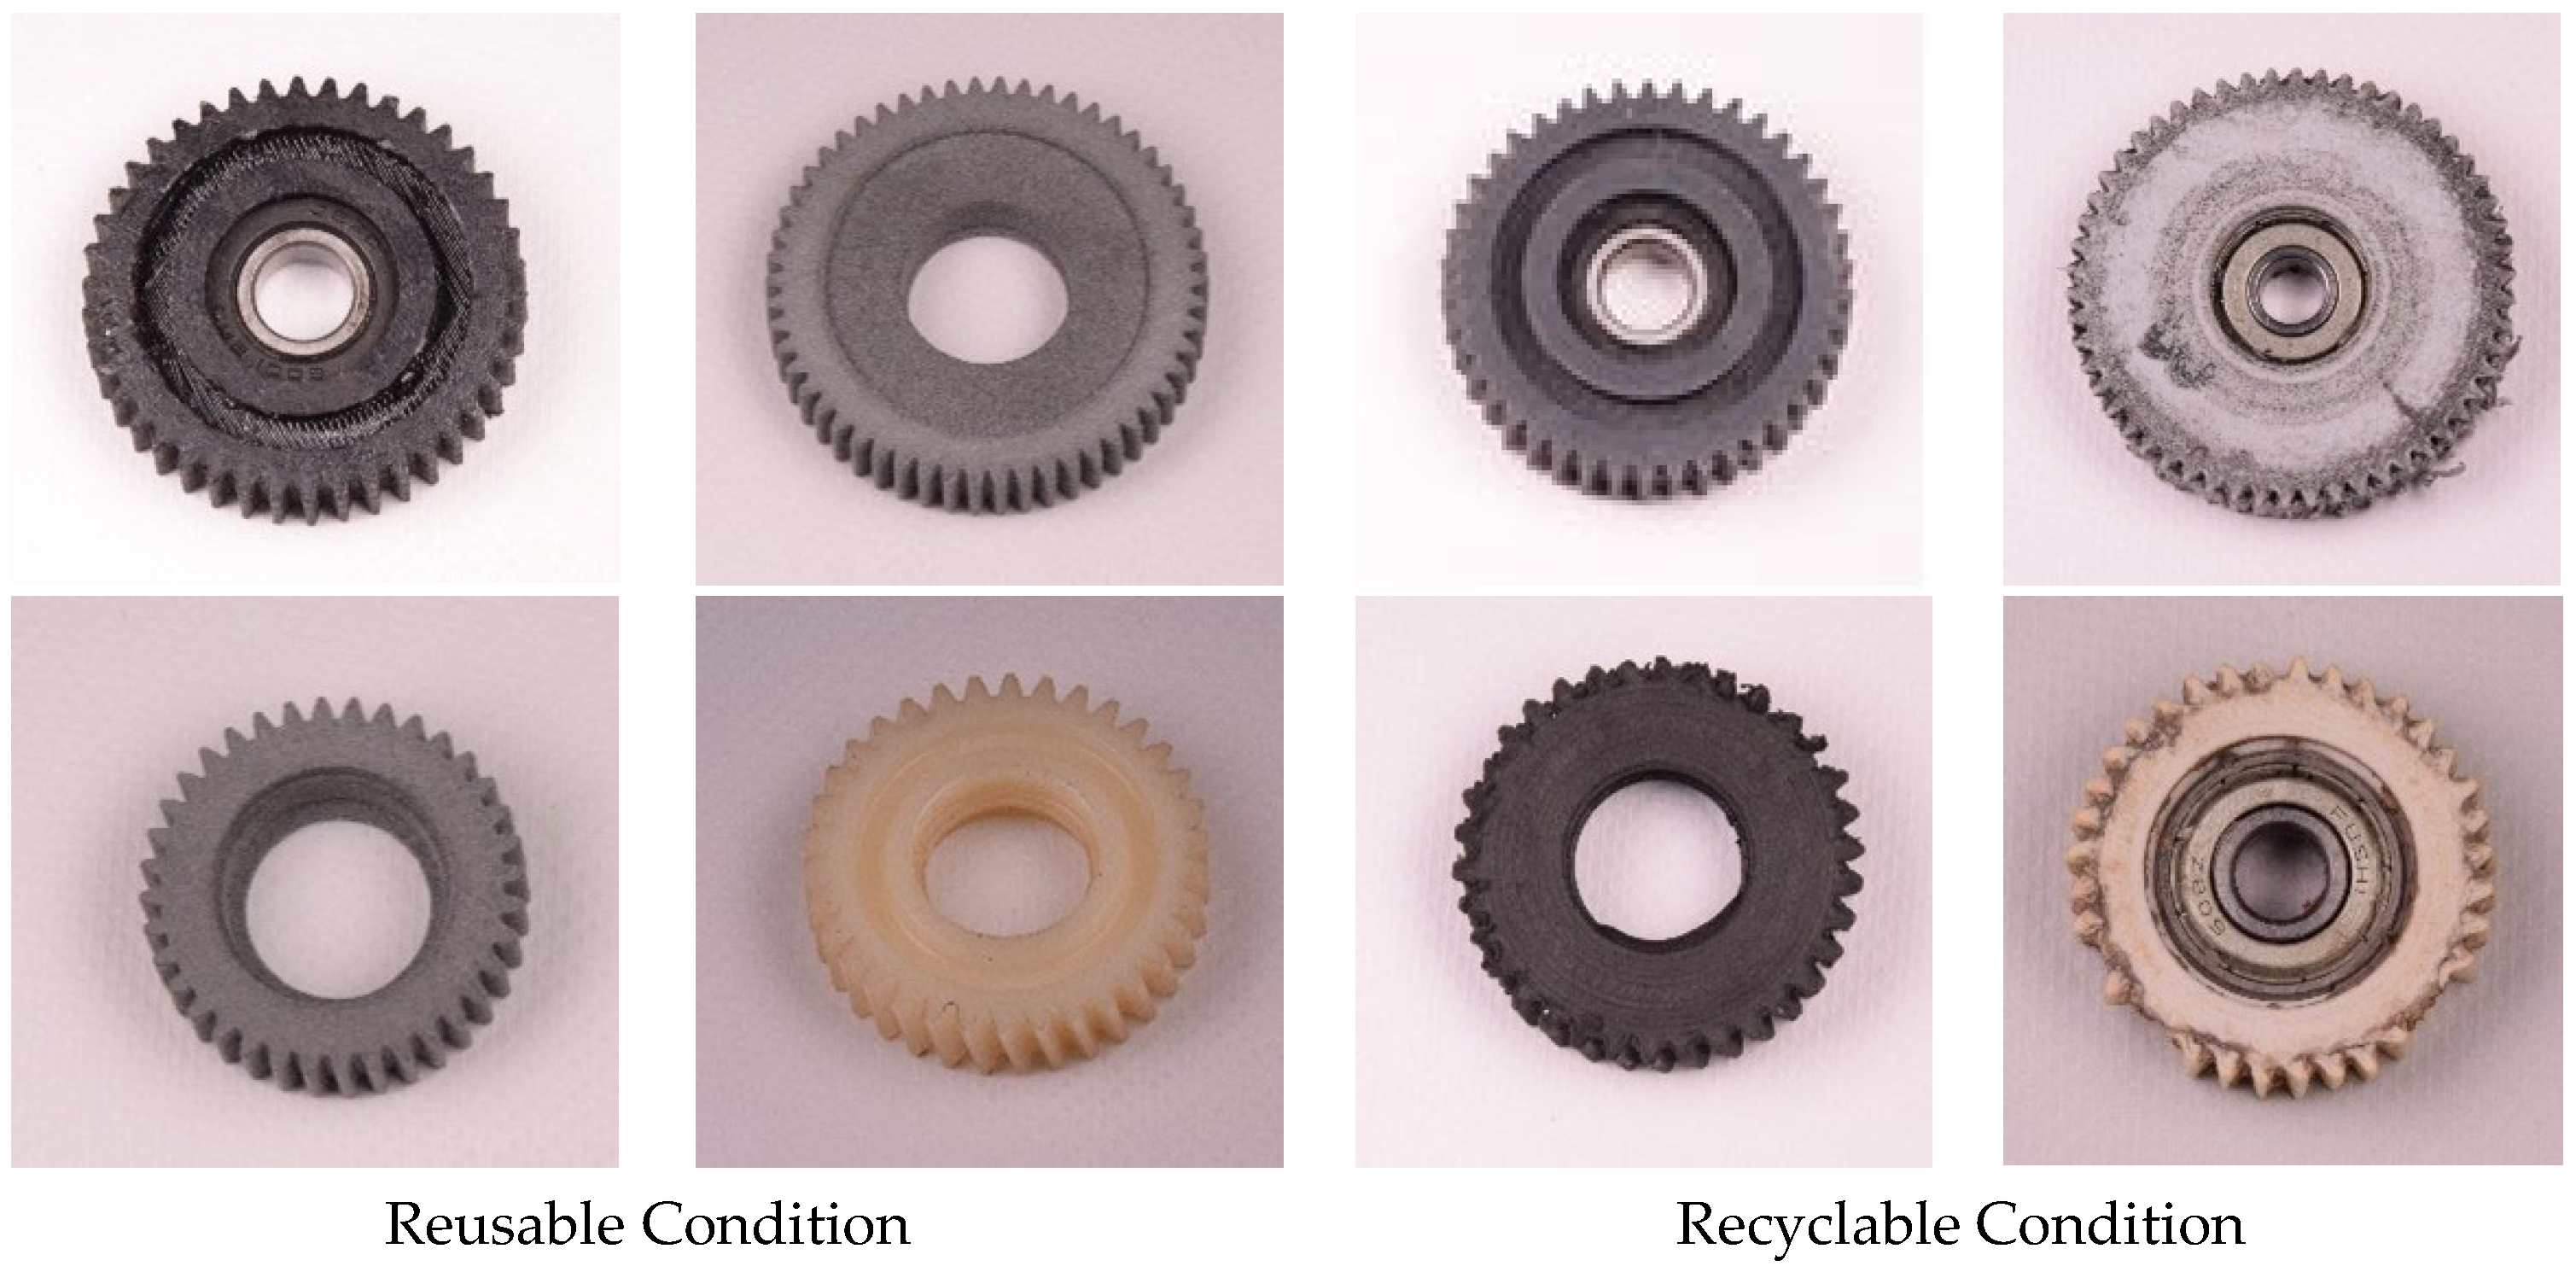
A remanufacturing expert conducted the data labeling process, based on the gears’ wear and tear, which varied depending on their usage in the electric bicycle motors and their inherent durability. Gears with partially or completely sheared gear teeth, deformed gear teeth, or broken gears were classified as recyclable, while gears without signs of wear and tear were classified as reusable, as shown in
Figure 2. While some defects, such as completely sheared gear teeth, were easily identifiable, others, like deformed gear teeth, were not as easily detectable.
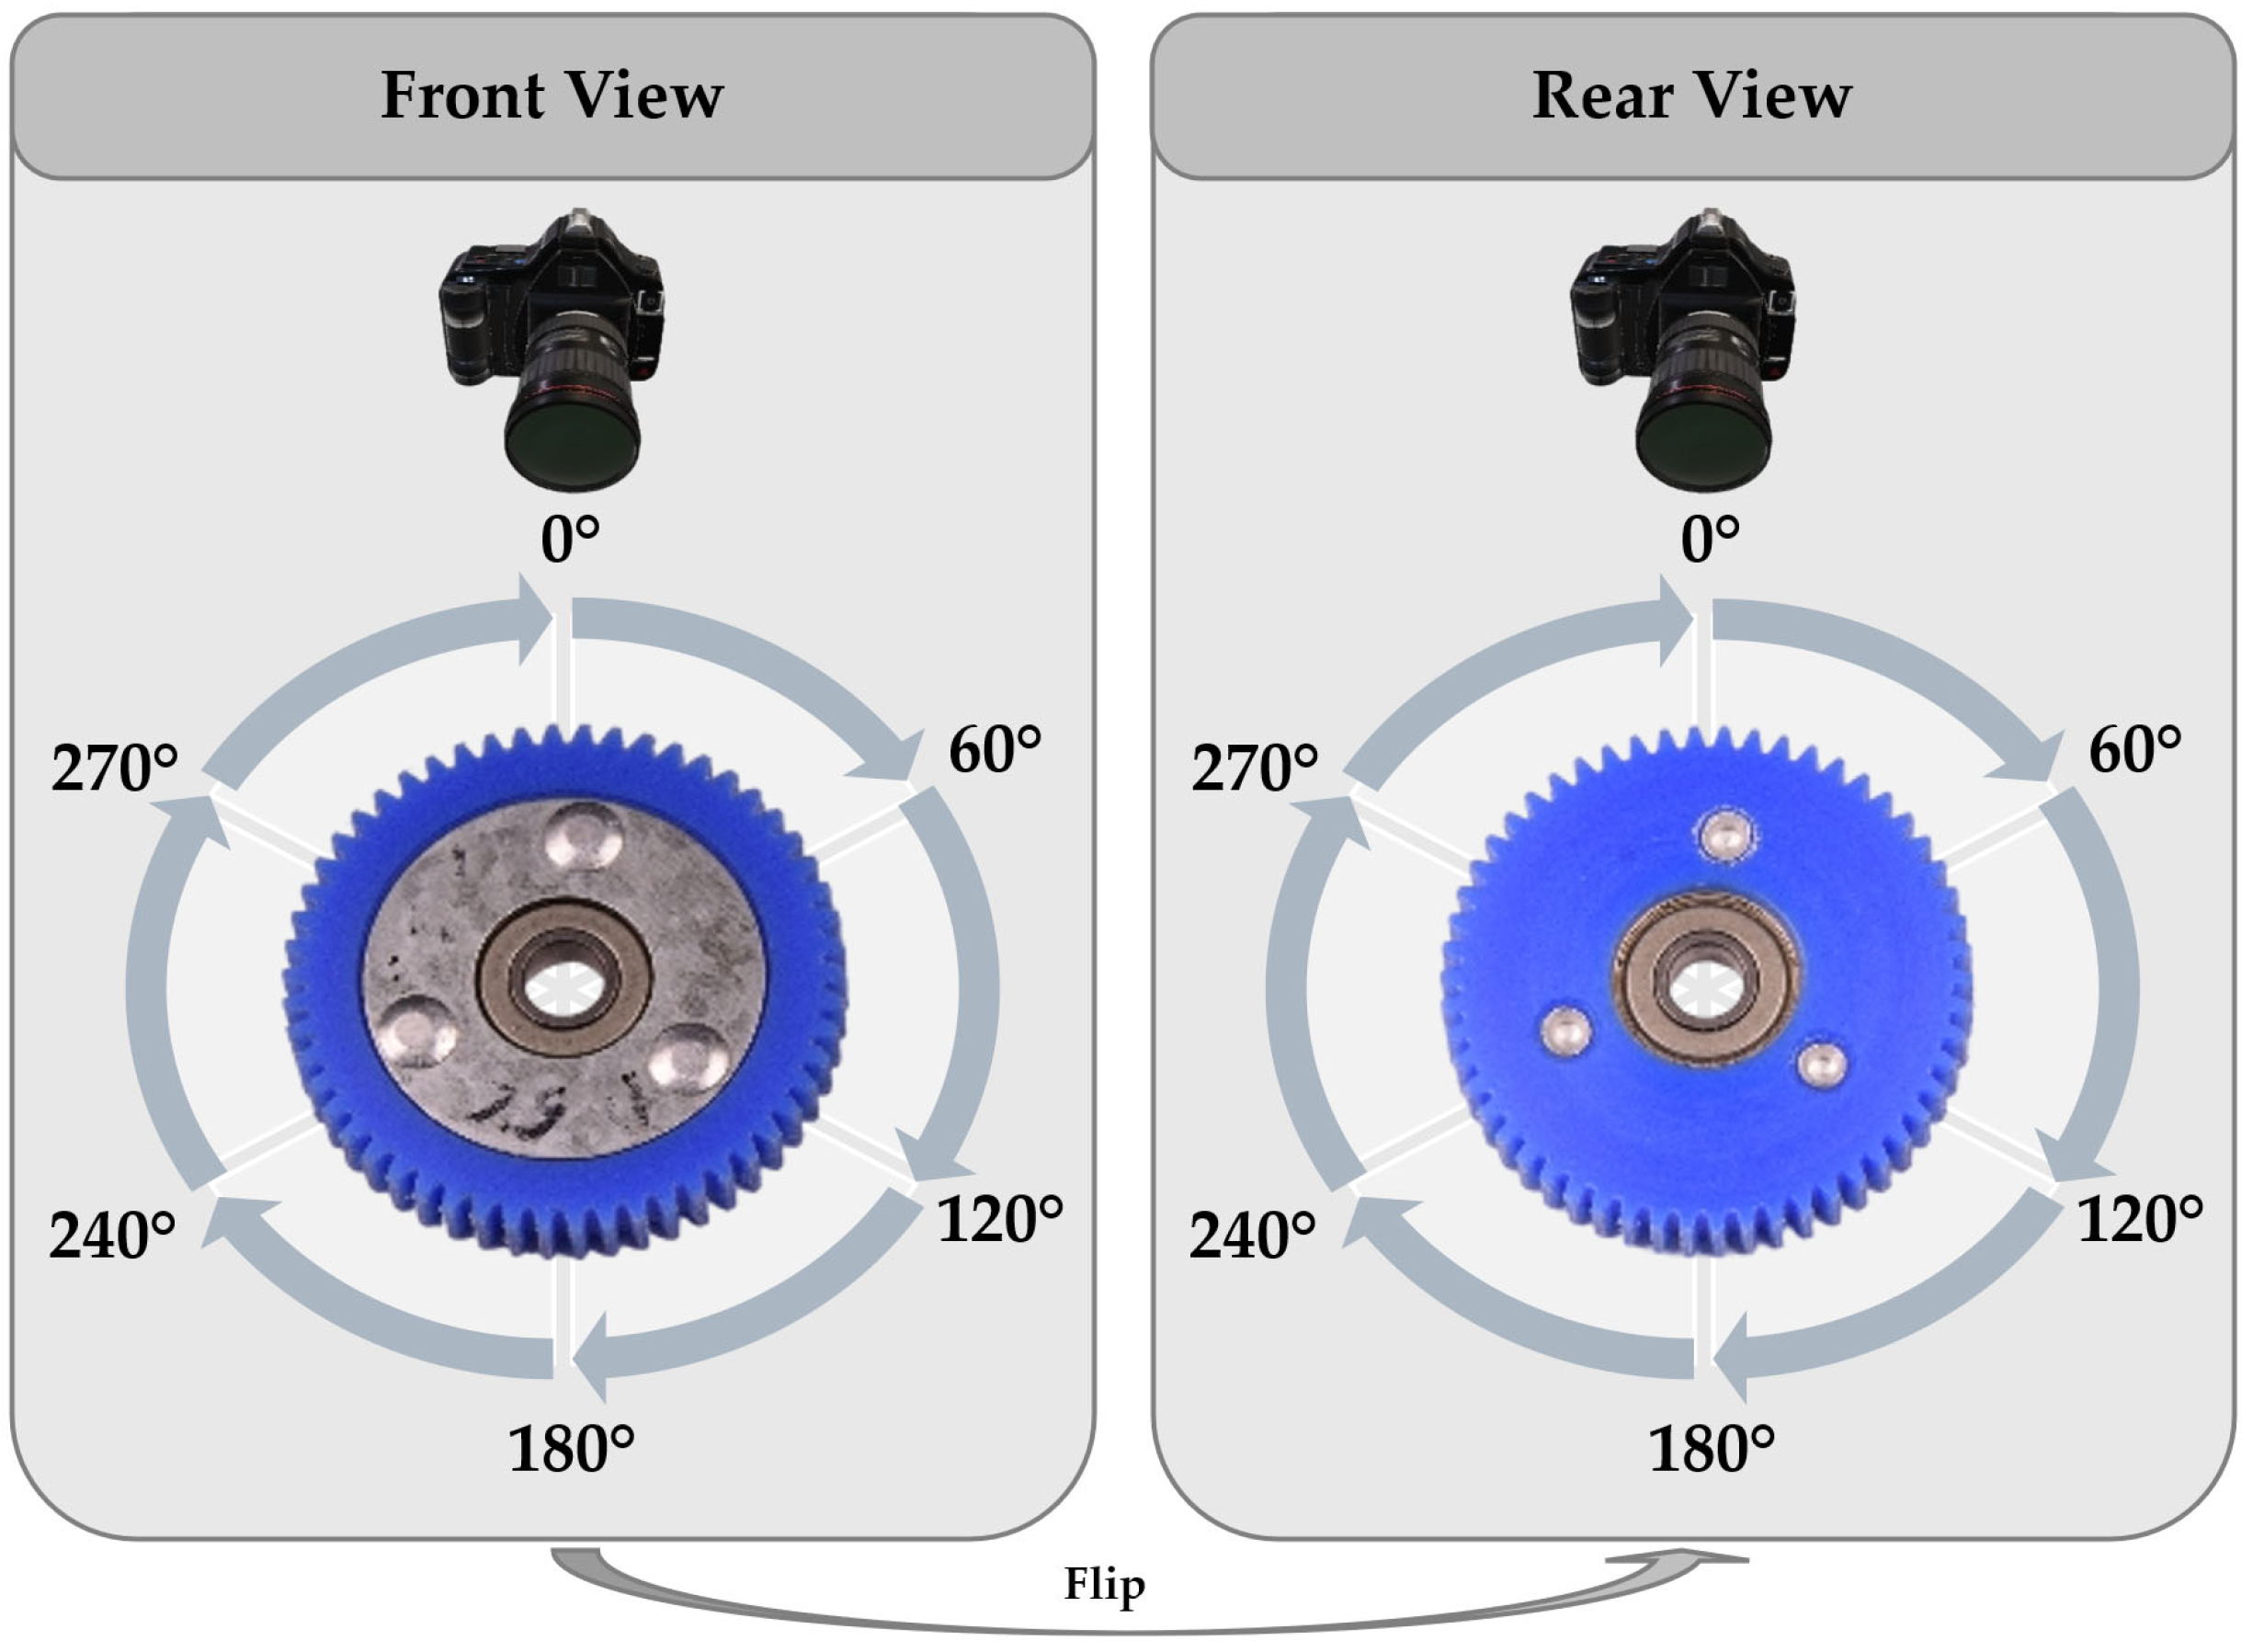
We utilized a Nikon D5300 camera (Nikon Corporation, Tokyo, Japan) equipped with an AF-S Nikkor 18–105 mm lens (Nikon Corporation, Tokyo, Japan), complemented by two Aputure Amaran Tri-8C lights with EZ-Box II (Aputure, Los Angeles, CA, USA), to capture the images (
Figure 3). Choosing this consumer-grade hardware was strategic: It allows for core sorting activities to be conducted off-site, such as in repair shops, thus minimizing transportation costs. This setup offers substantial advantages as it is cost-effective, widely available, and user-friendly, even for those with limited technical expertise. For our imaging process, we captured images of 18 gears classified as reusable and another 18 classified as recyclable.
Each gear was rotated to capture six different images from varying angles. Afterward, each gear was flipped and another six images were taken, ensuring comprehensive coverage of the gear’s condition. Since the native resolution of the Nikon D5300 is 6000 × 4000 pixels, preprocessing was necessary to prepare the images for input into the GAN models. Each image was center-cropped to a square resolution of 4000 × 4000 pixels, resized to 128 × 128 pixels, transformed into a tensor, and normalized. As outlined in
Table 1, the resulting dataset was equally divided into training, testing, and validation subsets for each gear condition, diverging from conventional data splits such as 80:10:10. This customized distribution was intentionally selected to ensure robustness and reliability of the results, given the limited dataset size.
4.2. Synthetic Image Evaluation
Synthetic images were generated using optimized DE-GAN approaches to enhance the real training datasets. To identify the most effective optimized DE-GAN approaches that had already been tested on small datasets, we conducted a literature review. Unfortunately, not all developed approaches have been tested on the same small datasets, complicating comparisons within an optimized DE-GAN category. Therefore, we decided to focus our review only on DE-GAN approaches evaluated on widely used small-scale image datasets, specifically Flickr-Faces-HQ (FFHQ; FFHQ-5K and FFHQ-1K) and the Canadian Institute for Advanced Research 10-class dataset (CIFAR-10). Any optimized DE-GAN approach that had not been tested on at least one of the reference datasets was excluded from our analysis.
For each DE-GAN optimization category (model architecture, data augmentation, regularization), we selected the best optimized DE-GAN implementation based on the Fréchet Inception Distance (FID) scores obtained from the literature (see
Table 2).
The three top-performing optimized DE-GAN approaches were FastGAN (
https://github.com/odegeasslbc/FastGAN-pytorch (accessed on 1 September 2025)), StyleGAN2 + ADA + APA (hereafter referred to as APA;
https://github.com/EndlessSora/DeceiveD (accessed on 1 September 2025)), and StyleGAN2 + ADA + InsGen (hereafter referred to as InsGen;
https://github.com/genforce/insgen (accessed on 1 September 2025)). We implemented and tested these optimized DE-GAN approaches alongside the SOTA approach by Gao et al. [
12] to compare their benefits. Our implementation differed from the original DCGAN implementation of Radford et al. [
74] by including an additional layer in both the discriminator and generator to achieve an output image size of 128 × 128 pixels.
We utilized the PyTorch (
https://pytorch.org/ (accessed on 1 September 2025)) framework for training, evaluating, and inferencing the GAN-models on an Nvidia Tesla T4 GPU (NVIDIA Corporation, Santa Clara, CA, USA) with 16 GB of memory. The performance of the synthetic image generators was assessed using FID and Inception Score (IS). The FID metric measures the distance between two distributions in a common feature space by comparing their mean vectors (
μy,
μŷ) and covariance matrices (
Covy,y,
Covŷ,ŷ) [
75]. To obtain these statistical properties, we generated embeddings for each image in the dataset using the feature-extraction layers of an ImageNet pre-trained Inception-v3 network. These embeddings are high-dimensional representations that encode the visual features of each image. By aggregating all image embeddings from a dataset, we form the dataset’s distribution.
To calculate the distance between distributions (i.e., between the real and each synthetic dataset’s distributions), we used the Fréchet Distance (see Equation (1)), also known as the Wasserstein-2 distance. This involves calculating the squared magnitude of the difference between the mean vectors and adding the trace of the covariance matrices [
75], where the trace (
Tr) is the sum of the diagonal elements of each matrix. A smaller FID value indicates a smaller distance between the distributions [
76], suggesting that the synthetic images more closely resemble the real images.
The IS is calculated using an ImageNet pre-trained Inception-v3 network and takes into account both the quality (measured by the cross-entropy
H(y|x) of
p(y|x)) and diversity (measured by the cross-entropy
H(y) of
p(y)) of the images, with higher IS values indicating better generator
(G) models [
77]. In Equation (2),
x denotes the generated image,
y refers to the predicted label assigned by the Inception model,
p(y|x) is the probability distribution of the generated image belonging to different classes and
p(y) is the marginal class distribution [
12]:
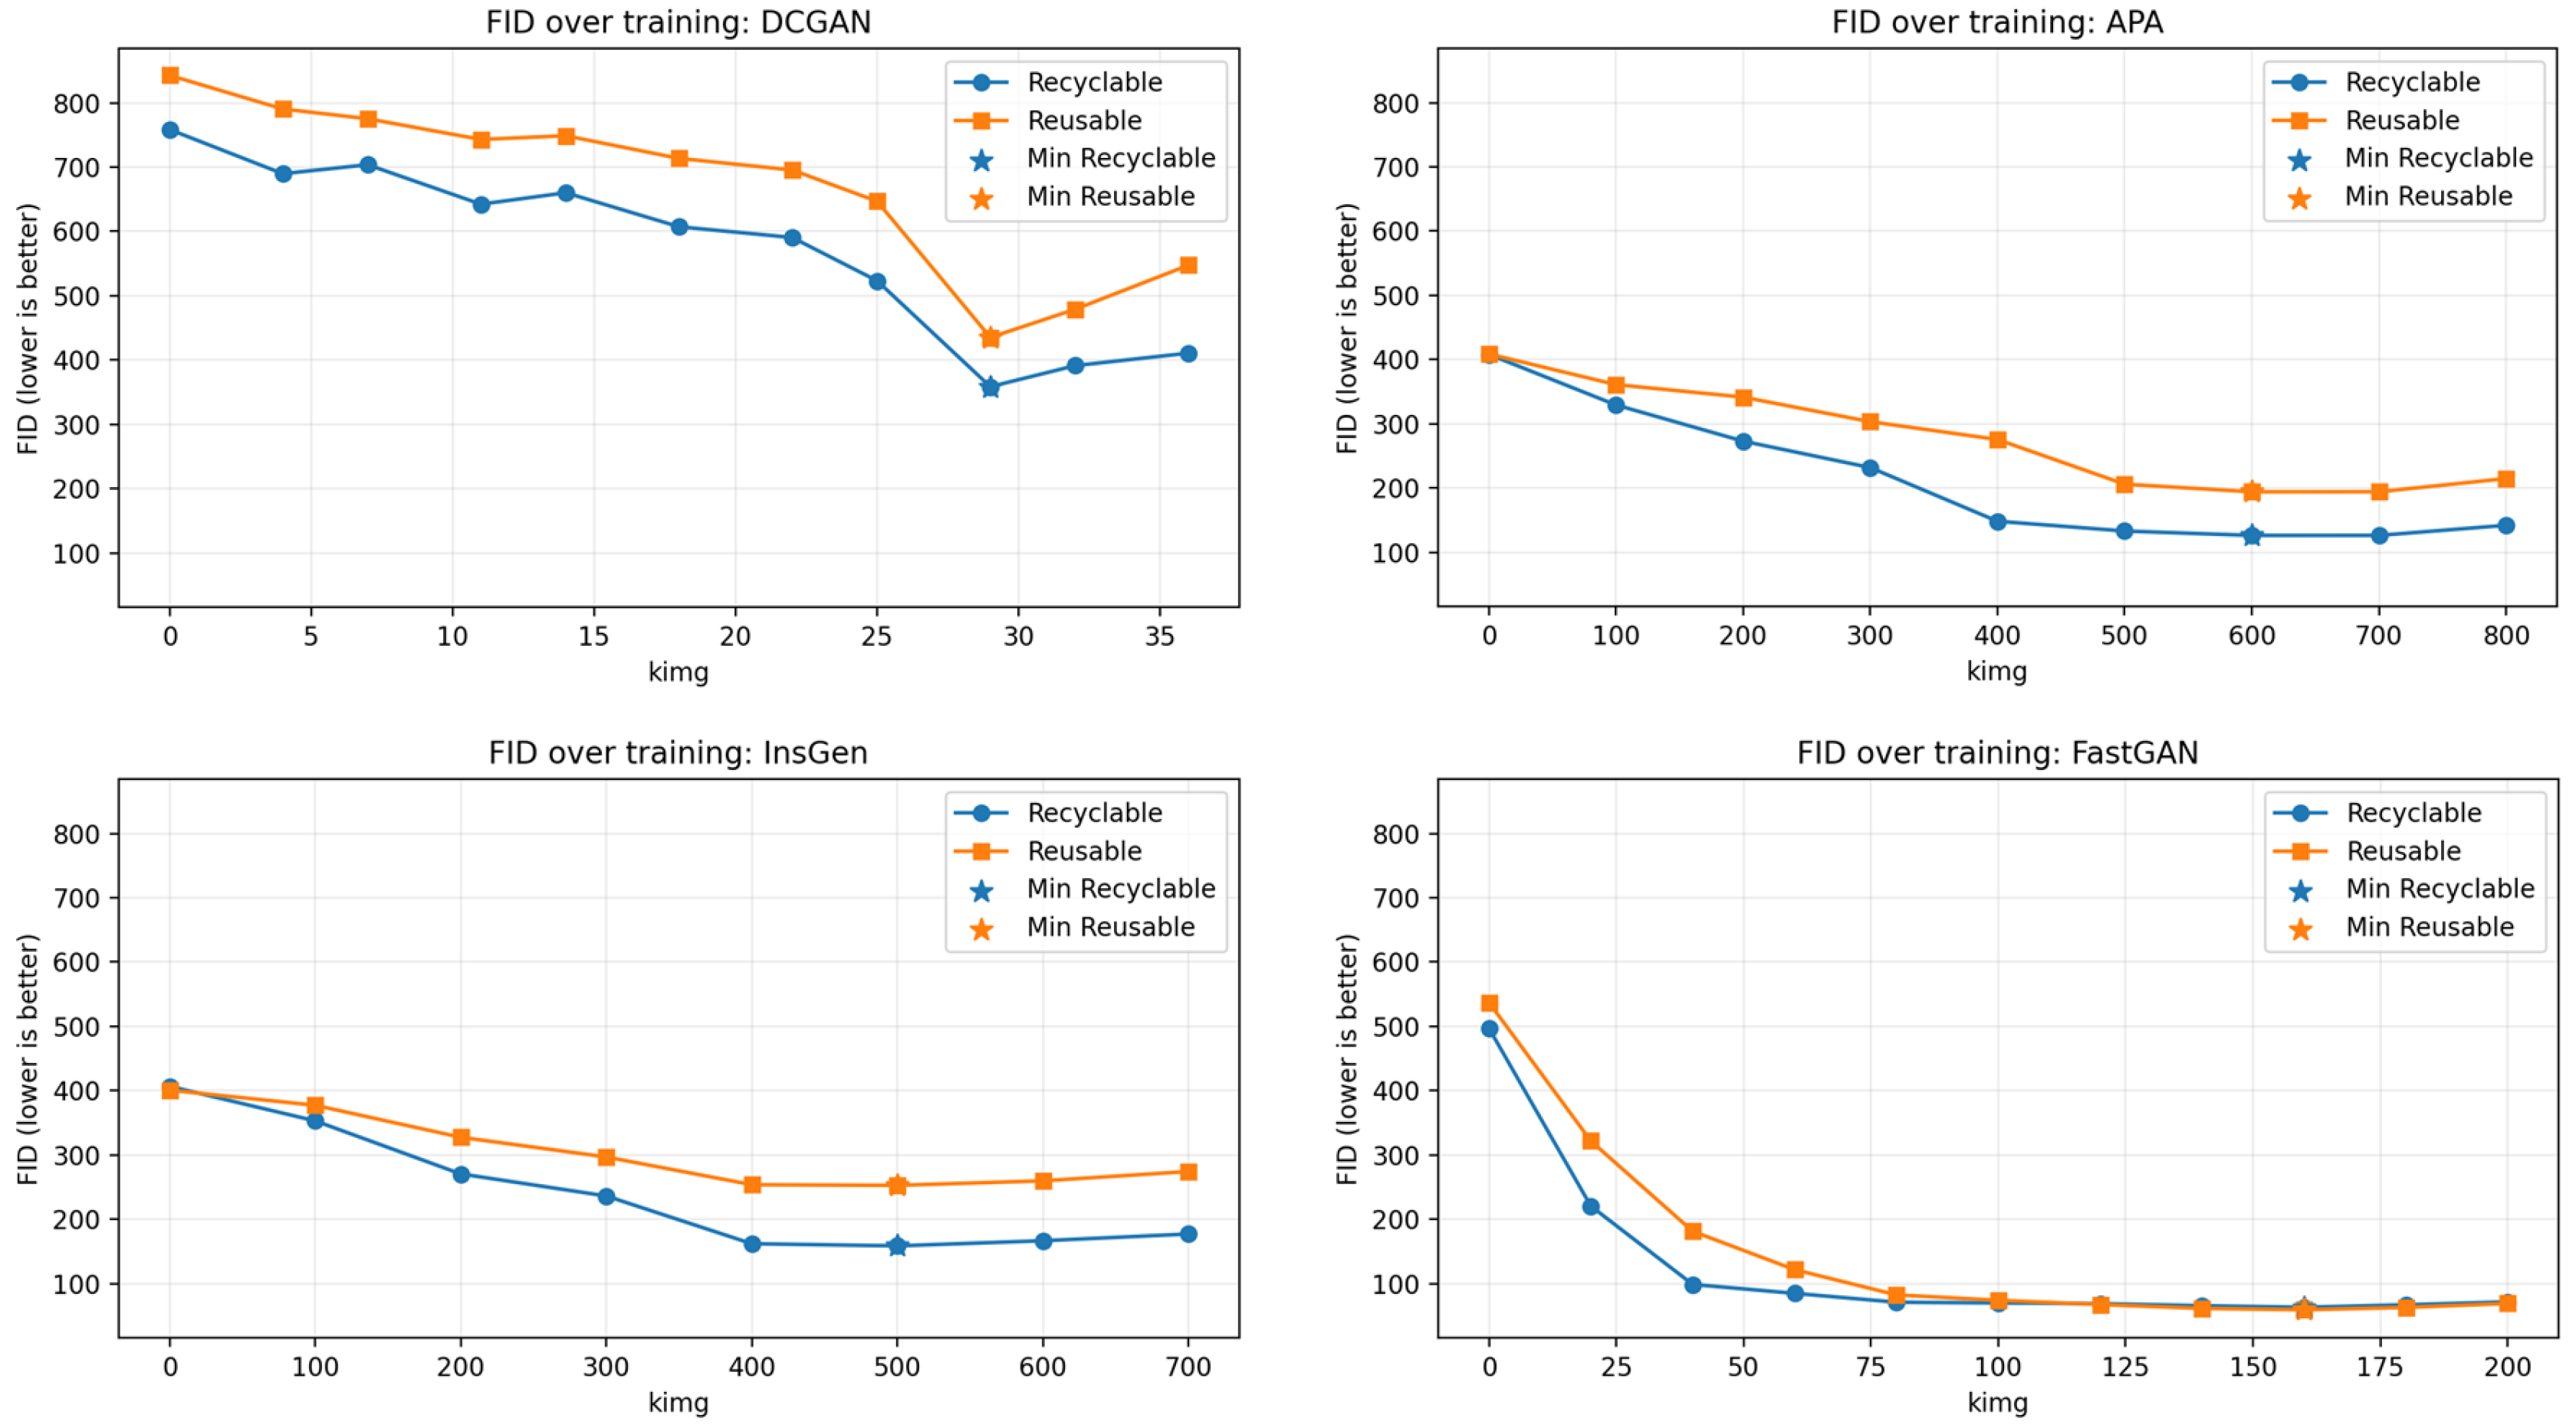
To relate these metrics to training progress in a model-agnostic manner, we monitored class-wise FID over training and normalized progress to thousands of images shown to the discriminator (kimg). For StyleGAN2-based models (APA, InsGen), the snapshot identifier equals the same kimg count and for DCGAN and FastGAN we converted epochs and iterations to the equivalent kimg. We followed a milestone-based schedule realized as independent runs. Each model was freshly initialized and trained to a prescribed kimg milestone and then evaluated. We advanced to the next higher milestone only while the class-wise FID improved. Once the class-wise FID failed to improve across two successive milestones, we considered training converged, and we selected the final model at the milestone where both classes reached their respective minima. In our experiments, the class-wise minima coincided for each model, so no trade-off between classes was required. No single run was interrupted by an online rule, and no snapshot ensembling was applied.
As a qualitative corroboration of convergence, we reviewed representative samples at each milestone, and a remanufacturing expert judged whether perceived realism increased or decreased across milestones. As a complementary metric, we computed the IS only at the FID-selected milestone for each model to summarize sample quality and diversity at the chosen checkpoint, and we did not use IS to guide training.
4.3. Reusability Classification
While the FID score and IS are established metrics for assessing the quality and diversity of synthetic images, they do not directly quantify the utility of such images for improving classifier performance in remanufacturing tasks. These metrics are not designed to evaluate the contribution of individual images or an entire synthetic dataset to classifier performance [
78]. For instance, a synthetic dataset may achieve an exceptionally low (i.e., very good) FID value by closely matching the distribution of the real dataset, without necessarily improving classifier training. A practical example of this is duplicating a real dataset to form a synthetic one: While the FID between these two datasets would be extremely low due to identical distributions, using this duplicated data for training could potentially degrade classifier performance, similar to the effects of Random Oversampling.
To address this limitation, we enriched the existing real training dataset with images generated by optimized DE-GAN approaches (see
Figure 1). We then trained ResNet18 [
79] classifiers using synthetic data from three optimized DE-GANs and the SOTA DCGAN at various real-to-synthetic ratios (see
Table 3). Building on the approach of Zhou et al. [
80], we examined the effects of [2:1], [1:1], and [1:2] real-to-synthetic ratios. Additionally, we chose to compare each partially synthetic training dataset with a dataset consisting solely of real images. In total, we considered 13 experimental configurations, comprising each GAN variant at each real-to-synthetic ratio as well as the real data’s baseline. For each configuration, we trained five independent ResNet18 classifiers, resulting in 65 trained models overall. We reported classification results as mean ± standard deviation (SD) across these five runs and evaluated the statistical significance of observed accuracy differences using Welch’s two-sample, two-tailed t-test (assuming unequal variances), with a significance threshold of
p < 0.05. All comparisons were made relative to the real-data-only baseline.
After evaluating all trained ResNet18 classifiers on the real test dataset, we identified the generative model and the real-to-synthetic ratio that yielded the highest mean test accuracy with statistically significant improvement. We then performed a full factorial grid search to optimize the ResNet18 hyperparameters using synthetic data from this best-performing GAN at its optimal real-to-synthetic ratio. The grid comprised learning rates {5 × 10
−5, 1 × 10
−4, 3 × 10
−4}, batch sizes {8, 16, 32}, and epochs {5, 10}, yielding 18 configurations (cases) in total. For each configuration, we trained five independent classifiers, resulting in a total of 90 trained classifiers. The training process was monitored on the validation dataset, while for the final testing of all classifiers, the fixed test dataset containing only real images was used. The reported accuracy, F1-score, recall, and precision were stated as mean ± SD across the five independent classifiers for each hyperparameter combination (case). We chose grid search rather than random or Bayesian optimization because the search space was low-dimensional and bounded, computational cost was modest, and interpretability was essential [
81]. The selected ranges follow common practice in small-data image classification [
82].
5. Results
This section presents the findings of our research. The evaluation process begins with an analysis of synthetic images using established evaluation metrics (
Section 5.1), followed by assessing the impact of incorporating synthetic images on the classification performance (
Section 5.2).
5.1. Evaluation of Synthetic Images on Evaluation Metrics
We utilized optimized DE-GANs and the SOTA DCGAN to generate additional synthetic images of gears, creating 144 synthetic training images per class with each GAN. The resolution of the synthesized images varied depending on the generative model (see
Table 4).
While DCGAN, APA, and InsGen produced images at 128 × 128 pixels, FastGAN generated images at 512 × 512 pixels. To ensure consistency and comparability across the different models, we standardized all images to a resolution of 128 × 128 pixels post-generation. Although Gao et al. employed a resolution of 224 × 224 pixels in their study [
12], we opted for the lower resolution of 128 × 128 pixels to mitigate the risk of instabilities known to occur during the training of DCGAN. These instabilities are exacerbated when additional layers are required to reach higher output resolutions, as the original DCGAN implementation was designed to output images of 64 × 64 pixels [
74].
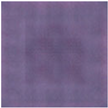
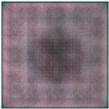
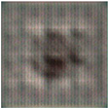
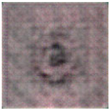
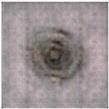
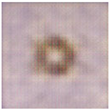
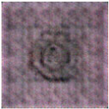
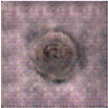
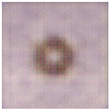
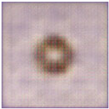
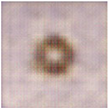
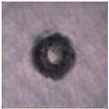
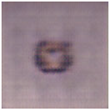
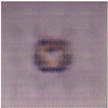
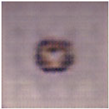
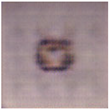
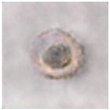
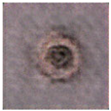
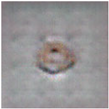
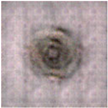
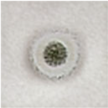
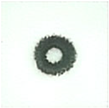
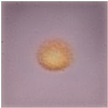
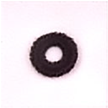
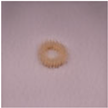
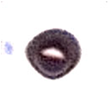
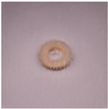
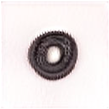
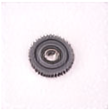
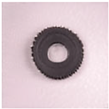
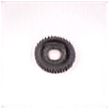
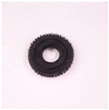
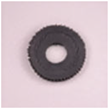
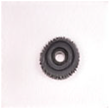
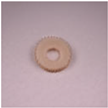
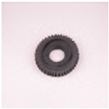
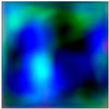
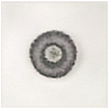
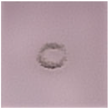
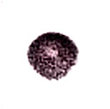
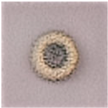
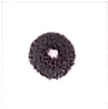
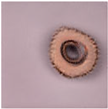
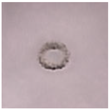
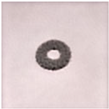
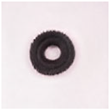
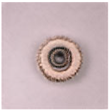
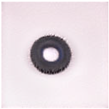
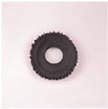
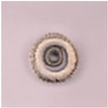
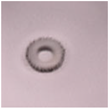
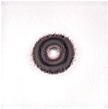
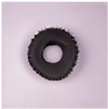
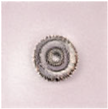
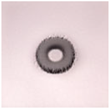
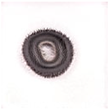
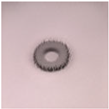
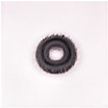
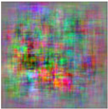
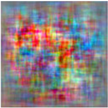
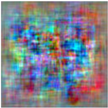
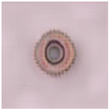
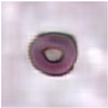
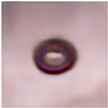
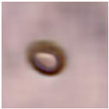
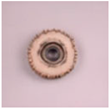
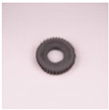
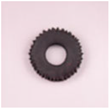
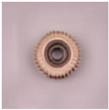
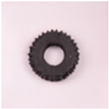
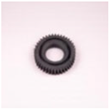
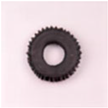
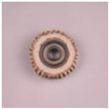
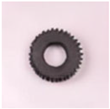
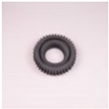
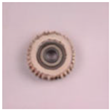
Despite this standardization, the quality of the generated images varied across different models. For example, synthetic images generated by the DCGAN approach in a recyclable condition (
Table 4: D5–D8) appeared blurred compared to real images of the same class (
Table 4: R5–R8). Despite this blurriness, signs of wear and tear were visible in three of the four synthetic images (
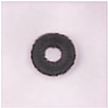
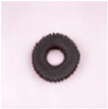
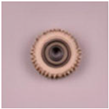
Table 4: D5, D6, D8). In contrast, the synthetic images generated by the DCGAN in reusable condition (
Table 4: D1–D4) were of such low quality that the gears were not easily discernible, even after 400 epochs of training. Furthermore, most of the generated images shared similar characteristics in terms of colors and shapes, which may indicate the occurrence of mode collapse. This issue will be explored in greater depth in the discussion presented in
Section 6.1.
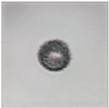
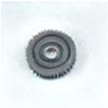
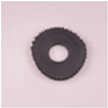
In contrast to DCGAN, the optimized DE-GAN approaches (
Table 4: A1–A8, I1–I8, F1–F8) generated higher-quality gear images for both conditions. Both APA and FastGAN could even generate gears that had never existed in the original real training dataset. For instance, both models created white gears (
Table 4: F3, A3) in reusable conditions, even though no white gear existed in the original real training dataset. FastGAN even created an image of a dark-grey gear in a reusable condition where the bearing is missing (
Table 4: F1), although such a gear never existed in the original training dataset.
We could not clearly determine whether the optimized DE-GANs generated fine-grade wear patterns based on the optical characterization of the generated images. This is due to the low resolution of the generated images, which made it difficult to see minor signs of wear and tear. Only the FastGAN-generated image in
Table 4, F8, showed clear signs of wear and tear. Additionally, we noticed that most of the generated images showed signs of distortion in varying degrees. While the images of FastGAN (
Table 4, F6, F7) and APA (
Table 4, A2, A6, A8) were only slightly affected by distortion, the images of InsGen were heavily distorted, with the generated bearing off-center (
Table 4, I8) or the generated bearing and gear appearing squeezed (
Table 4, I6).
To evaluate the quality and diversity of generated images further, we utilized FID and IS metrics (see
Table 5). Ideally, a high IS reflects a generator’s ability to produce diverse and distinct images, while a low FID is desirable, as it signifies a closer statistical similarity between the distributions of generated images and real images.
At the FID-selected milestones, APA achieved the highest IS among all approaches, outperforming all optimized DE-GAN approaches as well as the DCGAN model. Notably, the IS values varied not only between models but also between classes. Unlike DCGAN, all DE-GANs yielded slightly higher IS values for the reusable class than for the recyclable class. IS was computed only at the FID-selected milestone (
Section 4.2) and is reported as a complementary summary of sample quality and diversity.
The FID scores showed remarkable variation among different GAN models. DCGAN performed the poorest, with FID scores of 358.50 for the recyclable class and 435.08 for the reusable class. In contrast, the best-performing model, FastGAN, achieved FID scores of 63.04 for the recyclable class and 59.07 for the reusable class. Notably, the FID scores for the InsGen model exhibited a difference between the two classes, with scores of 158.53 for the recyclable class and 252.64 for the reusable class. In general, most models (DCGAN, APA, InsGen) achieved better FID scores for the recyclable class than for the reusable class, indicating that these models were more effective at generating high-quality images of gears with wear and tear (recyclable condition) compared to those without (reusable condition). However, only the FastGAN model attained a superior FID score for the reusable class (59.07) compared to the recyclable class (63.04). Despite slightly lower performance for the recyclable class, the overall results of the FastGAN model were still better than those of the second-best model, APA (recyclable: 126.20, reusable: 194.03).
5.2. Using Synthetic Images for Reusability Classification
The mean test accuracies of the ResNet18 classifiers, trained on real and partial synthetic training datasets, monitored on the validation dataset, and tested on the real test dataset, are presented in
Table 6. To ensure the validity of the results, five runs were conducted for each real-to-synthetic ratio and model, using the same training data. The classifiers trained solely on real data attained a mean test accuracy of 72% (SD 4%).
Notably, incorporating synthetic data from DCGAN did not result in a statistically significant improvement for any of the examined real-to-synthetic ratios. Specifically, for real-to-synthetic ratios of [2:1] (
p = 0.667), [1:1] (
p = 0.178), and [1:2] (
p = 0.074), no statistically significant differences were observed compared to the real-data-only baseline (see
Table 6). In fact, the mean classification accuracies tended to decrease as the proportion of synthetic data increased.
In contrast, the use of APA-generated synthetic data led to consistently higher mean accuracies across all real-to-synthetic ratios tested. All observed improvements were statistically significant compared to the real-only baseline: 81% (SD 6%, p = 0.030) for a [2:1] ratio, 80% (SD 4%, p = 0.019) for a [1:1] ratio, and 84% (SD 6%, p = 0.009) for a [1:2] ratio of real-to-synthetic data. The best result for APA was observed at a [1:2] ratio. For InsGen, only the [1:2] real-to-synthetic ratio resulted in a statistically significant improvement compared to the baseline (81% ± 4%, p = 0.010). Although higher mean accuracies were observed for the [2:1] and [1:1] ratios (73% and 72%, respectively), these differences were not found to be statistically significant (p = 0.622 and p = 0.996). FastGAN yielded the greatest statistically validated improvements. At a real-to-synthetic ratio of [2:1], the mean accuracy was 85% (SD 5%, p = 0.003), and at a ratio of [1:1], the mean accuracy reached 87% (SD 3%, p < 0.001), both compared to 72% (SD 4%) for real-data-only training. For the [1:2] ratio, the accuracy dropped to 72% (SD 3%, p = 0.916), which was not statistically different from the baseline.
Across all generative models, the real-to-synthetic ratio at which mean accuracy peaked differed by approach. For FastGAN, the highest mean accuracy was observed at a [1:1] ratio of real-to-synthetic data, while performance declined at a [1:2] ratio. APA achieved its best result at [1:2] ratio and showed statistically significant improvements over the real-only baseline across all tested ratios. InsGen only achieved a statistically significant improvement at the [1:2] ratio, and DCGAN did not provide statistically significant improvements at any ratio.
These outcomes are consistent with generative quality metrics. In general, lower FID scores (see
Table 5) align with higher mean classification accuracies and the presence of statistically significant improvements. Specifically, DCGAN produced the highest FID scores (358.5 for recyclable and 435.08 for reusable) and did not yield significant gains in classification accuracy (71% ± 5%,
p = 0.667). InsGen exhibited the second-highest FID scores (158.53 and 252.64) and reached 81% ± 4% (
p = 0.010) accuracy only at the [1:2] real-to-synthetic ratio. APA achieved the second-best FID scores (126.2 and 194.03) and a maximum mean classification accuracy of 84% ± 6% (
p = 0.009). FastGAN had the best FID scores (63.04 and 59.07) and the highest mean classification accuracy (87% ± 3%,
p < 0.001) at the [1:1] ratio. However, in our setting, the IS metric, as used by Gao et al. [
12], did not deliver meaningful results in this study (
Table 5).
To further improve the best-performing ResNet18 classifier, we conducted hyperparameter optimization by varying the number of training epochs, learning rate, and batch size (see
Table 7).
The best accuracy values and F1-scores were achieved in cases 17 (94% ± 3% and 94% ± 2%) and 18 (94% ± 3% and 94% ± 4%), both with 10 epochs and a learning rate of 0.00005, but with batch sizes of 32 and 16, respectively. Specifically, a batch size of 16 (case 18) yielded a precision of 98% ± 2% and a recall of 91% ± 7%, whereas a batch size of 32 (case 17) resulted in a precision of 93% ± 7% and a recall of 95% ± 4%.
In our use case, ensuring that the classified gears are truly in reusable condition is critical. Hence, having a higher precision value is crucial for minimizing the chance of false positives, i.e., identifying a used part as reusable when it is not. A false positive in this scenario could lead to significant problems, such as the failure of a remanufactured product. Consequently, we selected the classifier from case 18, which was trained with a batch size of 16 and achieved a precision of 98% ± 2% on our real test dataset, as our best model.
6. Discussion
This section provides a structured interpretation of the experimental results. We first analyze how architectural differences across GAN models influence image quality (
Section 6.1), followed by an evaluation of Inception Scores in the context of domain-specific challenges (
Section 6.2). We then examine the impact of real-to-synthetic data ratios on classifier performance (
Section 6.3) and discuss the phenomenon of mode invention (
Section 6.4). Finally, we outline the practical implications for remanufacturing (
Section 6.5) and address key limitations and future research directions (
Section 6.6).
6.1. Architectural Influences on Image Quality
The
DCGAN images displayed noticeable blurriness and low image quality, particularly in the reusable class, as detailed in
Table 4. This degradation was largely due to mode collapse, a substantial challenge in Generative Adversarial Networks, where the generator produces a limited variety of outputs [
83]. Specifically, in the SOTA DCGAN, the generator mapped diverse input values to a restricted set of outputs within the data space. Consequently, this led to a marked reduction in the diversity of generated images, manifesting as repetitive features such as colors, textures, and object types. This phenomenon likely contributed to the lower (i.e., better) FID values observed in the recyclable class compared to the reusable class. Furthermore, when compared to other DE-GAN models, DCGAN demonstrated inferior IS and FID values (see
Table 5). We hypothesize that this discrepancy may be attributed to discriminator overfitting, likely induced by the additional layer and trainable parameters required to generate images of 128 × 128 pixels. This overfitting could lead to a lack of stability and convergence in the DCGAN approach, impacting its overall performance.
The similar FID values observed between
APA and InsGen (see
Table 5), both utilizing the StyleGAN2 + ADA baseline model, suggest that their shared baseline model substantially contributes to their comparable performance. StyleGAN2 introduced several architectural enhancements over its predecessor, StyleGAN1, to address observed limitations like phase artifacts [
58]. For example, the generator was changed from a Progressive Growing GAN (ProGAN)-based architecture to a more advanced configuration inspired by ResNets’ residual connections and the Multi-Scale Gradients GAN (MSG-GAN). The MSG-GAN architecture facilitates skip connections between the generator and discriminator at matching resolutions, allowing gradients to flow at multiple scales [
84]. This architectural refinement ensures substantial overlap between the real and synthetic distributions, enabling the discriminator to provide gradients with valuable information to the generator [
84]. Correspondingly, experiments conducted by the authors of MSG-GAN [
84] demonstrated a substantial improvement in FID score over the basic DCGAN architecture, aligning with our research findings and indicating the efficiency of the MSG-GAN approach.
Although APA and InsGen exhibit highly similar FID values, subtle differences were observed, especially between the recyclable and reusable classes (see
Table 5). These differences could potentially be attributed to their distinct augmentation terms. Both DE-GAN models utilize the StyleGAN2 architecture with the additional augmentation term “ADA”, which enhances discriminator stability by increasing invariance to semantic-preserving distortions. We hypothesize that, by using non-leaking augmentations like cutout, contrast, brightness, and saturation, the discriminator could detect the class-determining features more easily. Thus, the discriminator can pass more valuable information to the generator, which it can use to generate realistic-looking wear and tear, especially in the recyclable class. In contrast to InsGen, APA incorporates an additional “Adaptive Pseudo Augmentation” term, which augments the real data distribution with generated images adaptively so that the discriminator will not get over-confident (i.e., overfits) during training [
36]. Consequently, APA can converge further towards the real data distribution, resulting in a decrease in the FID between the real and synthetic distributions.
In addition to the improved FID values, the APA augmentation term also mitigates the effects of image distortions and misplaced features. In our research, images generated by InsGen exhibited substantial distortions compared to those generated by APA (see
Table 4). Similar observations were reported by the authors of APA, who found that additional augmentation or regularization terms, such as ADA or APA, led to improved visual quality compared to a plain StyleGAN2 model [
40]. Notably, models incorporating the APA term achieved comparable or even superior visual quality compared to those with LC-regularization or ADA terms. These findings align with our research and corroborate the existing literature, as displayed in
Table 2.
FastGAN outperformed other models in terms of FID values, as indicated in
Table 5. This superior performance can be attributed to several key architectural features of FastGAN. Firstly, FastGAN relies on skip layer excitation modules, akin to the skip connections found in residual blocks of ResNets, enhancing model stability, particularly when generating high-resolution images. Additionally, FastGAN employs a self-supervised discriminator, which provides robust regularization, further enhancing stability during training. Moreover, the architectural differences between FastGAN and StyleGAN2 contribute to its superior performance. FastGAN is smaller and has fewer trainable parameters compared to StyleGAN2, with approximately 44 million parameters for a resolution of 1024 × 1024 compared to approximately 109 million parameters for StyleGAN2 at the same resolution [
60]. This efficiency translates to quicker convergence during training, enabling FastGAN to achieve superior results in data-scarce settings [
60]. Interestingly, FastGAN exhibited better FID values in the reusable class compared to the recyclable class, unlike StyleGAN2-based variants such as APA and InsGen (see
Table 5). Unlike these variants, FastGAN does not incorporate an augmentation term [
60], whereas APA utilizes both APA and ADA [
40], and InsGen employs ADA alone (refer to
Table 2) [
54]. This difference leads us to hypothesize that augmentation terms play a crucial role in synthesizing heavy wear and tear appearances characteristic of the recyclable class. The absence of such terms in FastGAN may explain its comparatively lower performance in generating images representative of this class.
6.2. Inception Score Metrics
In evaluating the IS metrics, the APA model exhibited the highest IS values. However, the differences in IS values among the other generative models were minimal, as depicted in
Table 5. Notably, all GAN models in our experiments demonstrated relatively low and similar IS values, considering that the IS ranges from 1 to 1000. It is important to note that the IS values achieved in our study were comparable to those reported in the SOTA DCGAN approach by Gao et al. [
12], which recorded an IS range of 1.951 to 1.982. The maximum IS value corresponds to the number of classes on which the underlying Inception-v3 network is trained (1000) [
85]. Given that electric bicycle gears are not a class in the pre-trained version of the network, low IS values for our dataset were anticipated. Moreover, objects with wear and tear characteristics, such as those in the recyclable class, are likely underrepresented in the classes of the pre-trained Inception-v3 network. This imbalance could explain the higher IS values observed in the reusable class across all DE-GAN models compared to the recyclable class. In contrast, the DCGAN model exhibited better IS values for the recyclable class than for the reusable class. This discrepancy may be attributed to mode collapse in the reusable class, leading to unexpected IS values.
6.3. Real-to-Synthetic Ratio
The analysis of the real-to-synthetic ratios provided important insights into the performance of the classifiers trained with synthetic data generated by FastGAN, APA, InsGen, and SOTA DCGAN. As shown in
Table 6, the highest mean classification accuracy was achieved when training the ResNet18 classifier on an equal share of FastGAN generated and real data, representing a statistically significant improvement over the real-data-only baseline (
p < 0.001). However, increasing the proportion of synthetic data beyond this ratio did not lead to additional statistically significant gains; in some cases, it caused the mean accuracy to decline.
We hypothesize that this superior performance at a [1:1] ratio may be related to FastGAN’s ability to generate data with low FID values (see
Table 5), indicating a close resemblance between the synthetic and real distributions. Sampling synthetic data within the existing data clusters increased the diversity of the training dataset, which led to improved classification accuracy [
17]. However, the capacity of generative models to create diverse new data points diminishes beyond a certain threshold, leading to synthesized samples that closely resemble existing data points, which could potentially result in overfitting [
86].
The correlation between the FID values of synthetic datasets (see
Table 5) and the required amount of synthetic data to achieve specific classification accuracies (see
Table 6) indicates that lower FID values are associated with a smaller proportion of synthetic data needed to reach comparable accuracy levels. This observation could explain why the FastGAN-trained classifier peaked at a [1:1] real-to-synthetic ratio, whereas the APA- and InsGen-trained classifiers peaked at a [1:2] ratio (see
Table 6). In contrast, classifiers trained with data generated by DCGAN did not surpass the performance of classifiers trained solely on real images. This discrepancy is likely due to the substantially different distribution of generated data compared to real data, characterized by a high FID value indicative of noisy and blurred data. Additionally, mode collapse in the reusable condition resulted in a lack of diversity in the synthetic training dataset, further hindering the performance of DCGAN-trained classifiers.
Consistent with our findings, Zhou et al. conducted a similar investigation on real-to-synthetic ratios using various GAN models, including FastGAN and an auxiliary classifier GAN (ACGAN), to generate additional synthetic images for training tomato leaf classifiers [
80]. In their research, regardless of the chosen classifier, optimal results were achieved with an equal amount of real and synthetic data at a [1:1] ratio. Beyond this ratio, the accuracy of trained classifiers decreased [
80].
6.4. Mode Invention
The process of generating non-existent objects by APA and FastGAN unveiled an intriguing capability of these models to create novel entities that were not present in the original dataset. This phenomenon, known as “mode invention”, occurs when models not only extrapolate new variations within the data space but also over-represent outliers, creating images that depict rare or extreme cases not typically observed in the real training data [
87]. Specifically, both APA and FastGAN have successfully generated gears that were absent from the initial dataset, exemplifying this unique capability. Mode invention can be particularly advantageous when models are encouraged to explore and expand the diversity of generated outputs beyond the confines of the training data. However, it may also result in the generation of atypical, outlier characteristics.
This remarkable ability can be attributed to the effectiveness of both models in disentangling style and content, achieved through similar techniques. While StyleGAN2 relies on a revised Ada-In architecture, where modifications are made solely to the standard deviation and not the mean of the feature maps [
58], FastGAN utilizes skip-layer excitation (SLE) modules with channel-wise multiplication. According to the authors of the FastGAN paper [
60], SLE modules closely resemble the Ada-In architecture. As such, we hypothesize that the striking similarity observed in the generation results of APA and FastGAN could be attributed to their highly similar style modulation architectures.
6.5. Practical Implications of the Findings
The findings of this study have substantial practical implications for the remanufacturing industry, particularly in sectors characterized by both high product volumes and broad product variation, such as the automotive sector. In the European car remanufacturing industry, it is estimated that more than 27 million cores are inspected every year [
88]. This classification process, traditionally performed manually, is prone to errors due to product-specific inspection criteria and the subjective assessments of inspectors. The variability and errors associated with human judgment in determining whether a part is suitable for remanufacturing can lead to considerable costs, with error rates typically ranging between 5 and 30% [
89].
As increasing quantities of cores are expected in the future and demographic change is leading to a shortage of skilled workers, there is an urgent need to automate the classification process. With our work, we have demonstrated a promising solution by using generative models such as FastGAN to utilize synthetic images to improve classification accuracy. Using FastGAN with a [1:1] ratio of real-to-synthetic data allows an increase in accuracy to 87% ± 3% compared to using only real images (
p < 0.001), which only produced an accuracy of 72% ± 4%. By further optimizing the hyperparameters, it is even possible to achieve accuracies of up to 94% ± 3% (see
Table 7). This improvement can translate into reduced error costs and the improved overall efficiency of the inspection and sorting processes.
From an implementation perspective, the approach requires only a modest extension of the current practices. A real image dataset can be created using existing vision systems, such as a shop floor camera station. Subsequently, a DE-GAN model (e.g., FastGAN) must be implemented and trained using either cloud infrastructure or in-house computational resources (e.g., GPU cluster). Once trained, the DE-GAN can automatically generate synthetic images, which can be integrated into the training pipeline of the classification model. The final classification model can then be validated and deployed on an existing camera station with minimal adjustments. While some initial setup and supervision are required, the ongoing generation and integration of synthetic data can be largely automated.
In our setting, the additional implementation effort is moderate, particularly when considered alongside the substantial gains in classification accuracy. Furthermore, automating the classification process optimizes resource utilization and minimizes waste, making it more efficient and scalable. This transition from manual to automated classification can improve consistency in decision making regarding the reusability of parts, regardless of the volume or complexity of used parts. The application of generative models and Deep Learning in remanufacturing thus holds the promise of transforming the industry by enhancing accuracy, reducing costs, and improving overall efficiency in part classification.
6.6. Limitations and Generalizability
Our study has effectively demonstrated the capabilities of DE-GANs in generating synthetic training data, specifically focusing on a dataset comprising gears. The results provide a robust foundation for future research. However, to broaden the applicability of this approach and deepen our understanding, it would be beneficial to expand our investigations to include objects with more complex geometries or reflective surfaces. The experimental design was specifically tailored to meet the operational challenges faced by remanufacturing companies, which require robust classification capabilities in dynamic environments. We introduced diverse camera angles to simulate real-world scenarios, resulting in slight image distortions in the initial dataset. These distortions, replicated to varying degrees by the DE-GAN models—with minimal impact in APA and FastGAN and more substantially in InsGen—offer crucial insights into the models’ adaptability. Future studies could explore a more controlled dataset, with images strictly from top, bottom, and side views to minimize camera angle variations and distortions, offering a different perspective on the models’ performance in less complex visual conditions.
A key methodological choice in this study was the use of a [1:1:1] data split for training, validation, and testing (
Section 4.1 and
Table 1). This decision was motivated by the need to ensure the robustness and reliability of our findings for scientific validation, particularly given the limited size of the available dataset. Nevertheless, alternative data splitting strategies are common in both academic research and industrial practice. In industrial deployment scenarios, maximizing the size of the training set, potentially at the expense of smaller validation and test sets, is often preferable in aiming to achieve the highest possible model performance. Thus, the [1:1:1] data split employed in this work should be regarded as a methodological choice aiming to improve scientific rigor under data scarcity, rather than a general recommendation for all applications. Future studies could systematically investigate the impact of alternative split ratios on model performance and generalizability.
Additionally, in our current experimental setup, images were used in their entirety without prior segmentation of the gears. As a result, the background was inherently included in both the generative and classification processes. Although the background is not expected to carry semantically relevant information for determining part reusability or recyclability, its presence may inadvertently introduce noise or confounding features, potentially influencing model performance. Future investigations could examine the impact of isolating the gears through image segmentation techniques prior to training. Comparing results obtained from segmented versus non-segmented image datasets may help to quantify the influence of background information on both synthetic image quality and downstream classification accuracy.
In terms of model exploration, the usage of the ResNet18 classifier provided valuable initial insights. Expanding the scope to include various depths (e.g., ResNet34, ResNet50, ResNet101, ResNet152) and innovative models (e.g., ResNeXt, EfficientNet, Vision Transformer) could further substantiate and potentially expand these findings. Additionally, examining other generative models, such as Diffusion Models, may uncover new possibilities for enhancing synthetic data generation.
Regarding hyperparameters, the choice of an image resolution of 128 × 128 pixels was dictated by stability issues observed with the SOTA DCGAN. Experimenting with higher resolutions could provide deeper insights into the impact of these factors on model performance and output quality.
Finally, our evaluation predominantly utilized FID and IS metrics. However, we did not perform statistical validation for these metrics. Statistical significance testing in this study was limited to differences in classification accuracy between models trained with synthetic data from different GAN variants and the real-data-only baseline. For other aspects, such as the results from hyperparameter optimization, we reported mean accuracies but did not formally test for statistical significance between different hyperparameter settings. Thus, while we report statistically significant improvements in accuracy for certain model comparisons, other evaluation results (including FID, IS, qualitative assessments, and hyperparameter optimization) are based solely on descriptive statistics. To augment the depth and breadth of our assessments concerning image fidelity, diversity, and generalizability, incorporating a broader range of metrics would be advantageous. Specifically, sample-level metrics like those described in ‘How Faithful is your Synthetic Data?’ by Alaa et al. [
87] could remarkably enhance the comprehensiveness of future assessments.
7. Conclusions and Outlook
Our study aimed to investigate the applicability of generative models in classifying the reusability of parts for remanufacturing. We followed a three-step approach, starting with creating a real dataset consisting of used gears from bicycle motors in two conditions: reusable and recyclable. We then evaluated synthetic images generated by three optimized DE-GANs and the SOTA DCGAN approach using the FID and IS metrics. Finally, we enriched the real training dataset by generating images using DE-GANs and the DCGAN in three different real-to-synthetic ratios. Afterward, we evaluated the trained ResNet18 classifiers, identified the best model, and executed a hyperparameter optimization.
Our findings show that augmenting the real training dataset with synthetic images generated by DE-GANs can lead to substantial, statistically validated improvements in classification accuracy, depending on both the choice of generative model and the real-to-synthetic ratio. Among the DE-GANs, FastGAN was the top-performing model. The use of FastGAN-generated synthetic data for ResNet18 classifier training significantly increased the mean classification accuracy from 72% ± 4% (real-data-only baseline) to 85% ± 5% at a [2:1] real-to-synthetic ratio (p = 0.003) and 87% ± 3% (p < 0.001) at a [1:1] ratio. Hyperparameter optimization further improved the mean classification accuracy to 94% ± 3%, although we did not statistically assess differences between hyperparameter settings. APA-generated synthetic data also resulted in statistically significant accuracy improvements compared to the baseline, with accuracies of 81% ± 6% at a [2:1] real-to-synthetic ratio (p = 0.030), 80% ± 4% (p = 0.019) at a [1:1] ratio, and 84% ± 6% at a [1:2] ratio (p = 0.009). InsGen-generated data yielded a statistically significant improvement only at a [1:2] ratio, achieving 81% ± 4% accuracy (p = 0.010), while other ratios did not show significant effects. In contrast, including DCGAN-generated synthetic data did not yield statistically significant changes in accuracy, with values of 71% ± 5% at a [2:1] ratio (p = 0.667), 66% ± 8% at a [1:1] ratio (p = 0.178), and 61% ± 10% at a [1:2] ratio (p = 0.074) compared to the real-data-only baseline.
Interestingly, although the calculated IS of the different GAN models were similar, the FID metric showed meaningful differences. These differences were highlighted by evaluating the test accuracy of the different trained classifiers. In contrast to IS, which was used by Gao et al. [
12], the FID score seems to generate more meaningful results to clarify whether current generative models can synthesize realistic images of used parts and their appearance, including wear and defects.
Overall, our study shows that using FastGAN-generated training data significantly improved the classification accuracy of ResNet18 classifiers for identifying reusable gears. Further research could explore the potential of other DE-GAN approaches, including knowledge sharing or data selection techniques, in addition to the optimized DE-GAN models used in this study. Moreover, alternative generative models like Diffusion Models, variational autoencoders, or mixed/stacked architectures could be investigated to determine their effectiveness in enhancing classification accuracy and generating realistic images to classify the reusability of parts for remanufacturing.



















































 (R1)
(R1) (R2)
(R2) (R3)
(R3) (R4)
(R4) (R5)
(R5) (R6)
(R6) (R7)
(R7) (R8)
(R8) (D1)
(D1) (D2)
(D2) (D3)
(D3) (D4)
(D4) (D5)
(D5) (D6)
(D6) (D7)
(D7) (D8)
(D8) (A1)
(A1) (A2)
(A2) (A3)
(A3) (A4)
(A4) (A5)
(A5) (A6)
(A6) (A7)
(A7) (A8)
(A8) (I1)
(I1) (I2)
(I2) (I3)
(I3) (I4)
(I4) (I5)
(I5) (I6)
(I6) (I7)
(I7) (I8)
(I8) (F1)
(F1) (F2)
(F2) (F3)
(F3) (F4)
(F4) (F5)
(F5) (F6)
(F6) (F7)
(F7) (F8)
(F8)


