Article

Critical Cluster Mining and Optimal Allocation for Power Grid Projects Based on Complex Networks and Multidimensional Metrics

1
State Grid Xinjiang Economic Research Institute, Urumqi 830002, China
2
School of Economics and Management, Beijing Jiaotong University, Beijing 100044, China
3
State Grid Economic and Technological Research Institute Co., Ltd., Beijing 102209, China
*
Author to whom correspondence should be addressed.
Appl. Sci. 2025, 15(16), 9166; https://doi.org/10.3390/app15169166 (registering DOI)
Submission received: 13 July 2025 / Revised: 13 August 2025 / Accepted: 18 August 2025 / Published: 20 August 2025

Abstract

With the increasing complexity of grid project systems, it is difficult for an individual project management perspective to meet the macro management needs of the project, unapplicable to overall project layout management. However, the current grid project portfolio management (PPM) configuration lacks systematic methodological support, and the synergistic relationships between projects in terms of resources, strategy, and other aspects have not been effectively utilized, making it difficult to optimize the effectiveness of management and investment schemes. Therefore, in this paper, we propose a method called CNMI-PGPC, which combines complex networks and multidimensional indicators to explore the correlations among grid projects, deeply mines the key grid project clusters and the optimal allocation strategy, and is devoted to improving the comprehensive efficiency of grid projects. The methodology was validated on data derived from the Grid Multi-Category Reserve Project (including grid infrastructure, production technology improvement, and grid digitization). The results show that the proposed method can effectively provide a scientific basis for configuring and managing grid projects, support the preferential decision-making tasks of projects, and optimize the layouts of grid projects. We shift from single-project optimization to global synergy, quantify the comprehensive benefits of the project team in terms of economics, strategy, and other dimensions, bridge the gap between the previous individual project assessment perspectives, and provide a systematic decision-making basis for grid project portfolio planning.

1. Introduction

In the field of project management, effective and scientific project planning always occupies a central position [1], with project selection decisions constituting a key aspect of the project planning paradigm. With the continuous growth exhibited by electricity demand [2] and the implementation of key strategies such as new power systems [3] and power digitization [4], grid project systems have become increasingly large and complex. In this context, the question of how to carry out project selection and ranking on a limited investment scale [5] to achieve all-around investment effectiveness and management effectiveness optimization [6] has become a key issue.
As shown in Figure 1, in grid enterprises, most project management practices are focused on individual projects presently. They all ignore the interproject correlations and their synergistic benefits [7], which leads to inefficient project layout fragmentation [8] and makes it difficult to realize strategic objectives. Although the individual project elements contained in a grid project system are relatively independent of each other, 80% of the projects in a complex collaborative environment have multiple associative relationships [9,10]. Such intricate interrelationships promote the formation of “project clusters”, which are collections of multiple projects that are closely linked in terms of their strategies, technologies, and resources [11]. Clusters occupy a higher project management perspective level than individual projects do, such as a macro strategic perspective, but significantly increase the complexity of the management process.
In light of the above, and using a “project association relationship” as a breakthrough point, we adopt a cluster perspective to achieve collaborative evaluation and prioritization configuration of power grid projects. Project portfolio management (PPM) provides us with a systematic solution for achieving a cluster perspective transformation. PPM refers to the combination and management of project portfolios targeting specific objectives, the most common of which is project portfolio management aimed at strategic or investment objectives. However, traditional portfolio studies still rely on the performance of individual projects within the target portfolio for selection purposes, ignoring the potential synergistic value of project linkages [12], and the assessment dimensions of projects are relatively homogeneous [13]. For example, project appraisal and selection were initially carried out only to obtain economic benefits [14], while ignoring the strategic and managerial benefits of the project. After this limitation was realized, modern project portfolio research began to take multidimensional objectives and project relevance into consideration [15], and methods such as multiobjective optimization models [16] and system dynamics [17] have been used to develop project cluster evaluation and selection techniques. Nevertheless, owing to methodological limitations and a lack of managerial perspective shifts [18], the characteristics of project clusters are still not adequately considered, which negatively impacts the accuracy and effectiveness of portfolio selection decisions [19].
Thus, grounded in the characteristics of grid projects, a key cluster mining and optimal allocation method for grid projects is proposed in our study based on complex networks and multidimensional indices. This approach initially completes the project cluster selection and ranking task by constructing a complex network of grid projects through a multidimensional project association relationship analysis and a subsequent feature analysis, with the latter fully considering the observed project association relationships. A multidimensional indicator evaluation system based on the characteristics of project clusters is constructed to assess the management and investment effectiveness that can be obtained for individual projects and clusters and to further optimize project portfolios. The main contributions of this work are as follows:
(1)
A project association network is constructed through semantic, geographic, and strategic multidimensional association analysis and the development of fusion strategies. Based on the community detection method, the preliminary preferences of project clusters are successfully realized, which improves upon the single perspective of individual projects and makes up for the existing deficiencies of project management.
(2)
An innovative project-cluster-oriented multidimensional evaluation system is proposed that can scientifically and comprehensively assess the management and investment benefits of project clusters, support the configuration optimization of project clusters, provide a quantitative basis for project decision-making, and enhance the scientific nature of project management.
Compared with existing project management research, this study is more relevant to the power sector and provides a management perspective ranging from macro to micro levels, making it more suitable for strategy-oriented project management.
The rest of the paper is organized as follows. Section 2 summarizes related work on technologies and methods for project clusters and our contributions. Section 3 presents the CNMI-PGPC methodology that is employed to support the construction, fusion, cluster detection, and evaluation processes of complex association networks for projects. Section 4 describes our dataset and the case validation process. Section 5 presents the conclusions of this paper and highlights its limitations and future research directions.

2. Related Work

This section provides a theoretical foundation and practical reference for the study while supporting the formulation and validation of the research questions addressed in this paper.
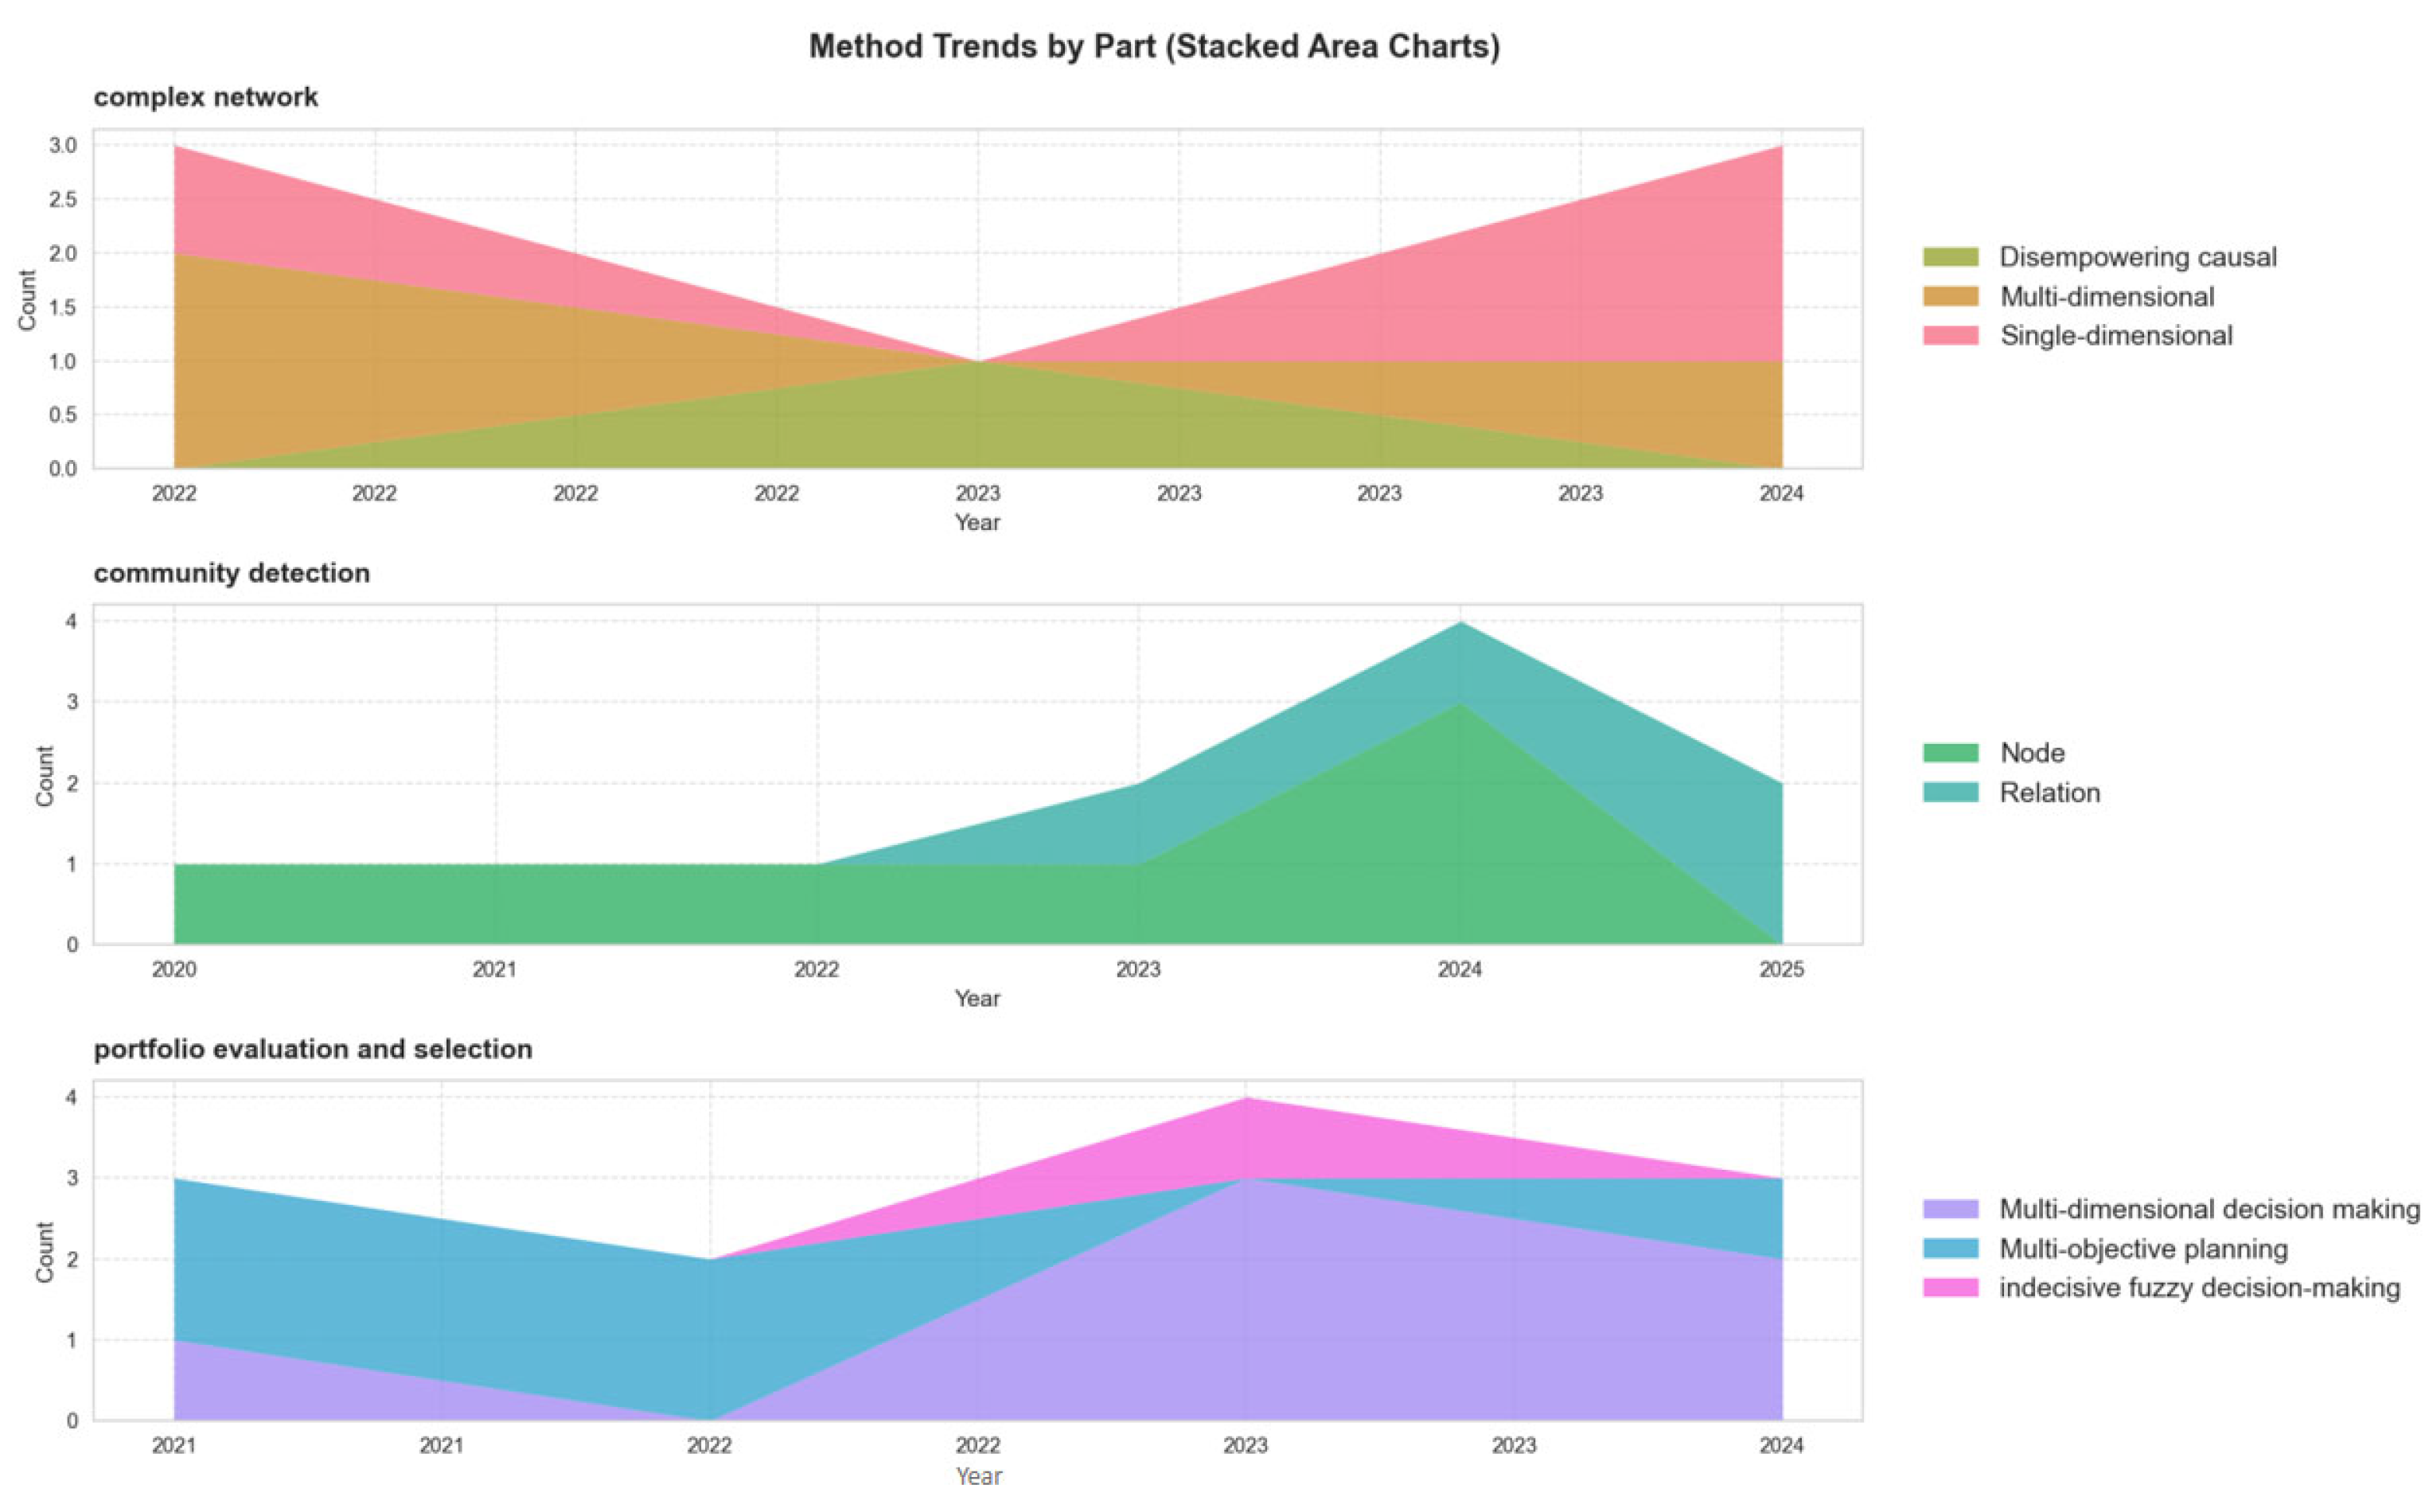
Given the comprehensive nature of this study, we conducted a review of research in the fields of complex networks, community detection, and project portfolio management to explore the limitations of the existing literature and further clarify the research questions. Figure 2 shows a comprehensive overview of the relevant literature. It can be observed that, in recent years, complex networks have mostly focused on a single dimension, rather than comprehensive thinking across multiple dimensions. Research related to community detection and project portfolio management has increased, but there is little research combining the two methods for project management.

2.1. Complex Networks

Complex network theory has been widely applied in many fields, such as medicine [20,21], risk management [22,23,24], and socioeconomics [25,26,27], with the aim of revealing underlying structures and regularity in the real world [28]. As the core elements of complex networks, nodes and relationships directly determine the topologies of the networks and their functional characteristics [29]. Currently, the methods for constructing complex networks are gradually evolving from single-dimension techniques to multidimensional approaches to more comprehensively reflect the complexity of real systems [30].
When confronting real problems in multiple domains, most researchers still use a single dimension to measure relationships in complex networks. For example, Olgun and Ozkaynak [20] measured the single connections (numbers of repetitions) between electroencephalogram (EEG) signals to construct relationships for complex network nodes. Moussa and El-Dakhakhni [22] assessed the dependencies between contractors on the basis of their mutual workdays. Li [24] mined accident connections to construct a powerless network for supporting risk management and decision-making. Li’s study used a single dimension to construct a complex network, but this approach may overlook important scenario information and limit the ability of the developed network to explain complex phenomena. To overcome the single dimension limitation, researchers have started to explore multidimensional complex network construction methods. For example, Wang [21] comprehensively considered the prevalence, severity, and complexity of multimorbidity scenarios to multidimensionally measure the cumulative risk of multiple morbidities. Multidimensional relational considerations make complex networks able to more comprehensively reveal real-world phenomena and increase the accuracy of decision analyses.
However, dimensionality constraints and data access challenges make multidimensional construction tasks difficult, and the use of too many dimensions may reduce the interpretability and usefulness of the constructed model. Therefore, to strike a balance between dimension selection and model utility, Huang and Liu [26] adopted multiscale relational analysis to construct dynamic relationships and studied the evolution of the relationship between global oil prices and the overall price level in China, which enhanced the timeliness and dynamics of the model.
Complex network construction is a key method for identifying and representing entity relationships. Regarding further network analysis and community mining tasks, community detection is an important tool for revealing the modular structure of a network [31]. In 2002, Girvan and Newman [32] provided the first systematic definition of community detection, explicitly stating that the original purpose of community detection was to target multiple types of networks, not just social networks. At present, community detection methods rely mainly on nodes and their interrelationships to discover the closely connected core areas in a network. The identification of core nodes is often the first step in community detection tasks. Metrics such as degree centrality [33,34] and median centrality [35] have become key considerations for the selection of community center nodes. For more comprehensive analyses, researchers have begun to apply richer node feature representations to increase the accuracy of community detection. Zhao [36] selected the center node by combining three centrality metrics, namely the H-index, LSI, and NGC, through voting to improve the robustness of community detection. Sheykhzadeh [37] evaluated the importance of nodes through a newly proposed IMP index, selecting the top-ranked nodes as the core of the community. To further enrich node feature considerations, Zhang [38] utilized graph neural network node embedding representations in combination with node influence information to perform dynamic community detection. The selection of the community core determines the quality of community delineation.
Currently, the existing complex network research lacks applications in the field of PPM. In our research, we apply complex networks to represent the multidimensional associative relationships among projects. We also developed a complex network integration method that integrates semantic, strategic, and geographic project association networks.

2.2. Community Detection

The multidimensional association tightness and cluster structure characteristics of the target projects should be considered in addition to the core nodes when mining key project clusters [39] to ensure that the mined project clusters can truly reflect the interactions between projects. In the existing community detection studies, researchers measured community quality through methods such as dominance relations and attractiveness to achieve very tight community segmentation. Dominance relations are mostly used for comparing and selecting better communities. Ni et al. [40] used dominance relationships to define community quality for static networks, optimizing the community segmentation process by maximizing internal edges and minimizing external edges. However, the limitation of static networks is that they cannot reflect the evolution trends of network structures over time. To overcome this shortcoming, Ni [41] again proposed community optimization algorithms for dynamic networks, introducing a time factor to obtain better communities. The dominance relation approach is usually a comparative optimization process that is implemented after the initial community delineation step, which may lead to a potential local optimality problem. The attractiveness model fundamentally avoids this drawback by determining community affiliations based on the ‘attraction’ between other nodes and the core of the community to ensure a rational node allocation scheme. Akachar [42] and Wu [43] both detected communities through attraction models, where Akachar [42] selected high-centrality nodes and the largest clusters as community leaders and then expanded the community based on the attraction criterion. Wu [43] extracted information about the structure of the target network through the transfer probability matrix of the Markov chain and then expanded it based on the graph attraction mechanism of the community.
Community detection techniques can effectively identify key project clusters by analyzing key nodes and relationships in complex networks, thereby improving project management efficiency.

2.3. Project Portfolio Evaluation and Selection

In the field of PPM, project portfolio selection decisions constitute a key research topic. Recent studies have involved selecting the optimal project portfolios by means of techniques such as multiobjective planning [16,44,45] multi-indicator/criteria evaluations [46,47,48], and fuzzy decision-making [49]. Moreover, the environmental [45], financial [46], and strategic [50,51] dimensions have become common multidimensional objectives for project portfolio decision-making when evaluating and selecting project portfolios across industries. With respect to setting specific evaluation indices/criteria, specific synergistic scenarios need to be fully considered [47] to optimally configure the target project portfolio. For example, for urban road infrastructure projects, Piñones [52] proposed a multi-criterion evaluation model based on hierarchical analysis to construct a system of criteria covering resource recycling, social value creation, and economic performance for selecting project portfolios in line with sustainable development. For transportation infrastructure investment projects, Pilat combined a utility design index [53] with a linear programming model to achieve project portfolio optimization. The introduction of scenario factors makes the evaluation and decision-making tasks related to project portfolios closer to reality and improves the science and feasibility of decision-making. However, the utility of project portfolio benefits is somewhat limited by the singularity of methodological choices and the lack of adaptability of some studies to complex and changing environments. To address this problem, Ramedani [54] developed a two-stage project portfolio decision-making methodology for complex environments to achieve a coordinated balance between project portfolios in terms of micro-evaluations and macro-objectives.
In summary, the existing studies related to project portfolio evaluation and selection have clarified the key decision-making elements at macro- and micro-multidimensional levels; however, due to the limited perspective, effective links between the two levels have not been established. For this reason, complex network theory was adopted in this study to construct a strategic and geographical multidimensional project association network, and the macro orientation of the project portfolio was initially established. The project portfolio evaluation process involved the evaluation dimensions of economics, timeliness, and stability, and micro indicators were set in combination with grid business scenarios to realize the scientific selection of project portfolios.

3. Method

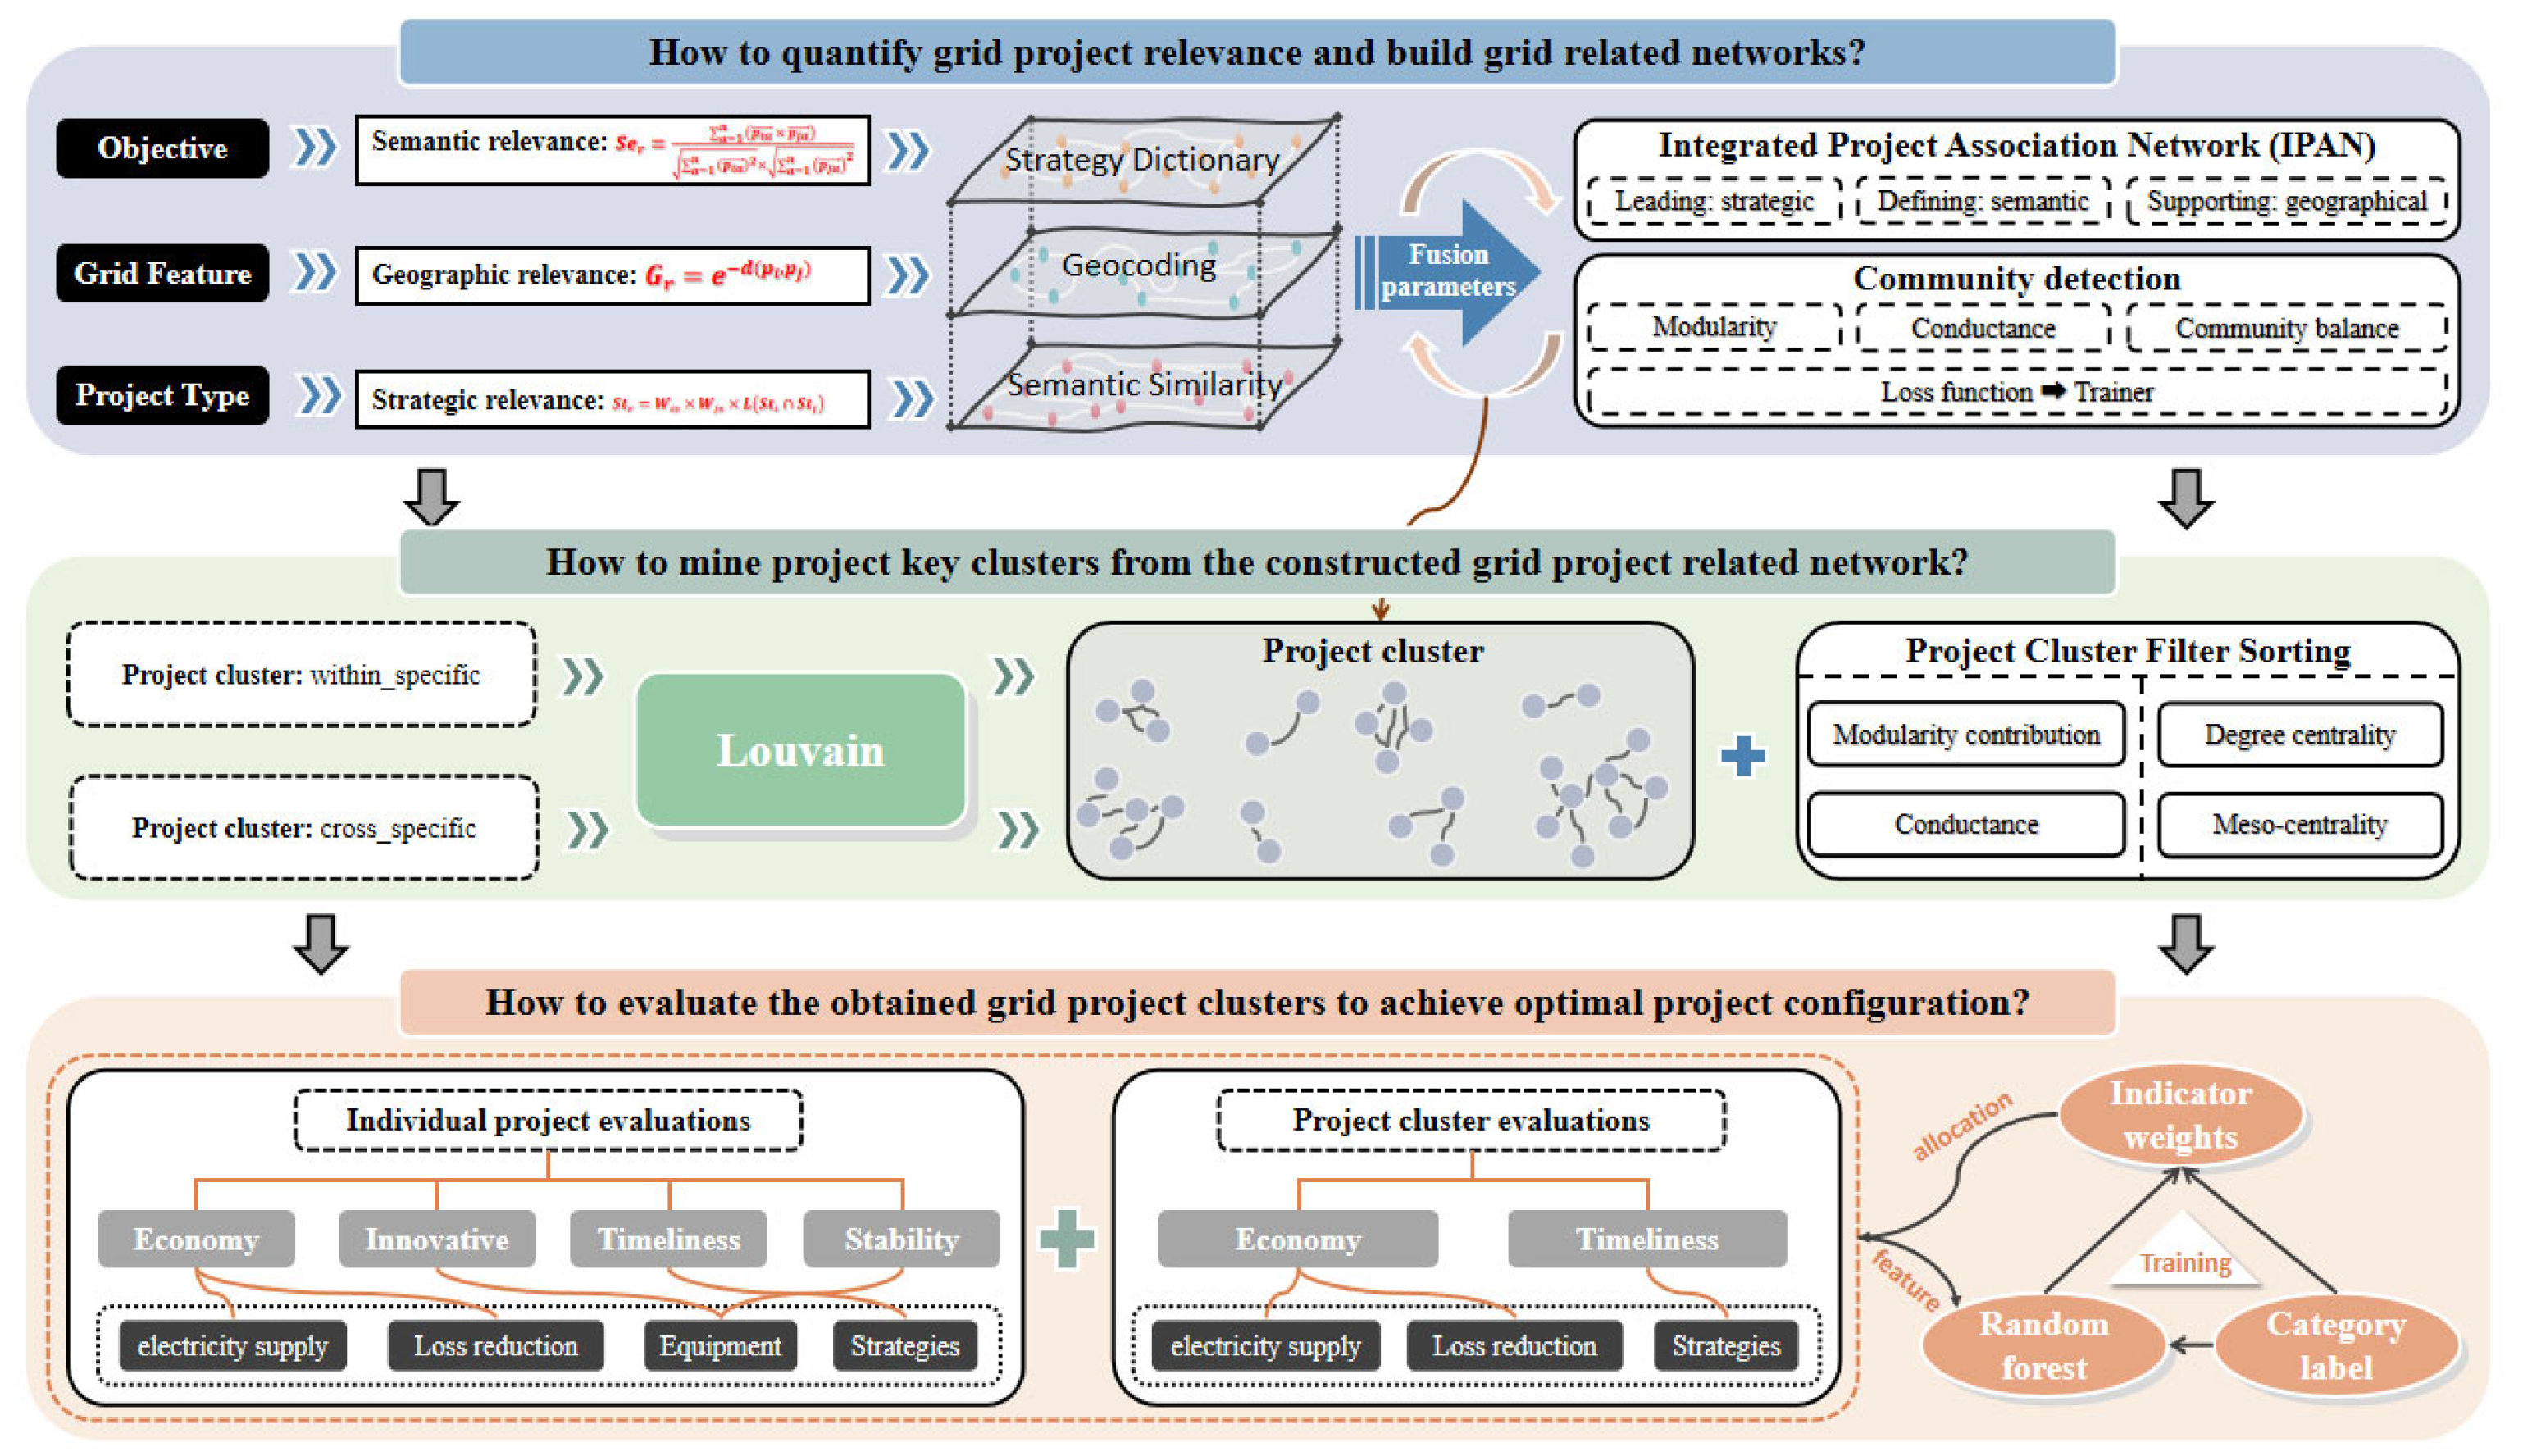
In this study, a preferential allocation method for power grid project clusters (CNMI-PGPC) is proposed on the basis of complex network theory and multidimensional indicators. The general framework of this method is shown in Figure 3.
In response to existing research methods, we combine complex network and PPM theories to optimize project management efficiency. Complex network theory can effectively portray the complex relationships and interdependence between grid projects. Moreover, a multidimensional indicator analysis can be used to comprehensively assess the multifaceted characteristics of a project, thus providing strong support for the scientific management and optimal configuration of grid projects. The proposed methodology addresses the following three core questions. First, how can the correlations between grid projects be quantified and a grid project cluster network be constructed? Second, how can the key clusters of projects be identified from the constructed grid project cluster network? Third, how can the quality and effectiveness of the acquired cluster of grid projects be evaluated to support project prioritization configuration to maximize benefits?

3.1. Question Definition

In grid project management tasks, interproject correlations should be regarded as the key basis for optimizing the effectiveness of project management. On the basis of the above literature analysis, it is evident that, in the field of project portfolio decision-making, strategic synergy and project synergy constitute the basic elements of project portfolios. This scheme optimizes the effectiveness of portfolios at the macro level and ensures that project management is aligned with the fundamental strategic orientation of the enterprise.
Based on the above considerations, strategic positioning was taken as the dominant dimension in this study, and, considering the characteristics of the wide geographical distribution of power grid projects, geographic association was applied to measure the efficiency of collaborative project management as an auxiliary dimension for project cluster identification.
Moreover, to address the problem of category management differences between the grid projects, we constructed a semantic association dimension to assist in identifying project clusters within-category and cross-category, with the aim of supporting the diverse needs of grid project management. Therefore, a single project was taken as a network node in this study. The interrelationships among the nodes were identified through strategic, geographic, and semantic multidimensional correlation analyses, and corresponding weights were assigned. On this basis, a project association network model was constructed to reveal the strengths of the associations between projects, which in turn provide support for the identification and mining of key project clusters.
Therefore, research question (1) in the preceding text was addressed by targeting the power grid project set P = {p1,p2, …,pn}, confirming the project affiliation relationships from strategic, geographic, and semantic perspectives in turn, and obtaining the strategic affiliation relationship edge set Est = {est1,est2, …, estm}, the geographic relationship edge set Eg = {eg1, eg2, …, egc}, and the edge set of the semantic associations between projects Ese = {ese1, ese2, …, esek} to construct complex association networks G(P, Est), G(P, Eg), and G(P, Ese), respectively. In addition, network fusion was performed to obtain the integrated association network G(P, M). To answer research question (2), on the basis of the constructed network, project clusters Ci = {pi1, pi2, …, pij} were subsequently detected. Finally, to address research question (3), projects were prioritized using multidimensional assessment metrics, and the optimal project configuration R = {pij|Ci ranked sequentially by their cluster priority scores, and pij within the group ranked sequentially by the individual project priority scores} was found.

3.2. Complex Network Construction and Fusion

This part further refines the process of constructing the complex network of project associations. First, for project instances pi and pj, their strategic relationship is calculated as follows:
E s t ( i , j ) = W i s × W j s × L s t p i p j
where the strength of the project strategy association between project instances pi and pj is denoted by Est(i, j). Wis and Wjs denote the strategy scores of pi and pj, respectively, which are calculated on the basis of the strategy dictionary matching technique. Lst(pi ∩ pj) represents the degree of strategic overlap between pi and pj for measuring the association between the two projects in terms of their strategic content.
Then, for project instances pi and pj, their strategic relationship is calculated as follows:
E g ( i , j ) = e ( d ( p i , p j ) )
In the above formula, Eg(i, j) denotes the strength of the geographic association between project instances pi and pj, and d(pi, pj) describes the geographic distance between projects pi and pj, where geocoding techniques are required to enable parameter computations. The use of a negative exponential function ensures that the greater the geographical distance, the weaker the association between the compared items.
Finally, for project instances pi and pj, their semantic association is calculated as follows:
E s e ( i , j ) = a = 1 n p i a × p j a a = 1 n p i a 2 × a = 1 n p j a 2
The semantic relatedness of item names was analyzed in this study using semantic vector computations, and the results were quantitatively evaluated using the cosine similarity algorithm. In the formula, Eg(i, j) describes the strength of the semantic association between project instances pi and pj, and pia and pja represent the ath components of the text vectors of the project names of pi and pj, respectively. Performing matching based on the semantic similarity of project names can effectively identify grid projects belonging to the same category.
Given the variability exhibited by the analyses and assessments of different dimensions, the threshold settings for each dimension must be individualized to rationally construct a network of associations between items. Therefore, the convergence of multidimensional project linkage networks requires the dimensional linkage scales to be harmonized to ensure their comparability.
On this basis, we encapsulated the three association dimensions of strategies, geography, and semantics and realized the fusion of multidimensional project association networks based on “Strategy-led, Geography-assisted, and Semantic-boundary” (St-G-Se) principles to construct an integrated project association network (IPAN), that is, G(P, M). In the integration of project-related networks, St-G-Se refers to the fact that we use strategic relationships as the primary dimension and geographical relationships as the secondary dimension for weighting, confirm the integrated project relationships, and then use the semantic dimension as the basis for judgment to divide networks into same-category networks and cross-category project networks.
According to the fusion principle, we designed the parameter w_f, which is defined as the degree of weakening exhibited by the geographic dimension relative to the association strength of the strategic dimension. Moreover, the scope of same-category and cross-category networks is defined via semantic dimensions. In this case, the methodology used to fuse the IPAN with projects within a specific area is as follows:
M = M s t × ( 1 w _ f ) ,           M g = 0   and   M s t > 0     0 ,                   M s e = 0 M s t + w _ f M g ,           M s t = 0   and   M g > 0 M s t ,                 otherwise
Mst, Mg, and Mse are the normalized results obtained for the association matrix after performing strategic, geographic, and semantic filtering, respectively, to ensure that the association strengths of different dimensions are on the same scale. In addition, according to the association of each dimension, following the principle of network fusion, w_f is used to weight the dimensions. Similarly, the IPAN for cross-category projects discards the semantic association dimension, and the resulting the fusion formula is as follows:
M = M s t × ( 1 w _ f ) ,           M g = 0   and   M s t > 0     M s t + w _ f M g ,           M s t = 0   and   M g > 0 M s t ,                 otherwise
The parameter w_f in the network fusion formulae (4) and (5) is determined by combining expert experience and model training, where expert experience determines the limiting range of this parameter to ensure the dominance of the strategic dimension. The model training process, on the other hand, is oriented toward the optimization of the mining results of the clusters, and the loss function is constructed on the basis of evaluation indices, including modularity [55], conductance [56], and the community balance level of community detection. Training iterations involving the parameter w_f are carried out to arrive at the strategic, geographic, and semantic dimensions of the network fusion parameter.
The modularity metric is used to measure the closeness of the community structure into which the network is divided, whereas the conductivity metric applies the ratio of the relationships pointing to the outside of the community to the total number of relationships in the specified community to assess the quality of the community detection results. Both of these metrics are calculated using the following formula:
M o d u l a r i t y = 1 2 m i , j M i j d i d j 2 m δ C i , C j
where Modularity is the degree of community modularity, m is the total number of edges contained in the IPAN, Mij represents the elements of the fused network neighborhood matrix, di and dj represent the degrees of the nodes, and δ (Ci, Cj) is an indicator function that is 1 if nodes i and j are in the same community and 0 otherwise.
C o n d u c t a n c e = 1 C c C c u t ( c , c ¯ ) m i n ( v o l c , v o l ( c ¯ ) )
Equation (7) is the formula for conductance. C is the set of project clusters included in the IPAN, |C| is the total number of communities in the network, cut(c, c ¯ ) is the sum of the edge weights of community c and the external ones, and vol(c) and vol( c ¯ ) are the sums of the degrees of the internal and external nodes of community c, respectively.
In addition, in view of the applicability of the results, a Community Balance community size indicator was constructed in this study to maintain a balanced project cluster size and facilitate the efficient management of grid project clusters. The number of nodes in the project network is defined as N, and the formula for calculating the Community Balance metric is as follows:
B a l a n c e = 1 C c C c N C 2
Based on the comprehensive consideration of the above three indicators, a loss function was constructed in this study, as shown in Equation (9), where λ is the weight of the community size equilibrium and takes a value of 0.1. The optimization of the network fusion process is achieved by transforming the determination of the w_f parameter into the problem of minimizing the objective function L.
L = M o d u l a r i t y + C o n d u c t a n c e + λ B a l a n c e

3.3. Project Cluster Mining

We applied a community detection algorithm to identify clusters of grid projects and traverse and analyze the nodes and their associated features in the IPAN to help find tight community structures that reveal the potential synergistic relationships between grid projects. The Louvain algorithm [55] is a community discovery technique based on modularity optimization and was selected in this study to identify project clusters and prevent network fusion parameters from being the only influences on the quality of the community detection results. The algorithm is divided into two main stages: a local optimization stage and a network reconstruction stage.
(1)
Local optimization phase: The algorithm starts from each node and attempts to move it to an adjacent community, calculating the ΔModularity (change in modularity). If the modularity increases after the move, the node is moved into the corresponding community, and this process is repeated until the modularity can no longer be improved.
(2)
Network reconstruction phase: Each community is treated as a node, and the weights of the edges connecting communities are the sum of the weights of the edges within the community, forming a new network. The local optimization phase is repeated on the new network until the modularity no longer changes, ultimately yielding the community partitioning results.
The ultimate goal of the grid reservation stage is to preplan and lay out the funds and project resources to ensure efficient operations and resource deployment during the project execution stage, thus attaining an optimal cost–benefit ratio. Therefore, the project clusters need to be comprehensively and meticulously screened and evaluated during the reservation phase to ensure that the final integrated cluster management scheme can have a positive effect on the investment efficiency and management efficiency of the target company and can support project prioritization decisions. The other aim of this part is to preliminarily rank the project clusters on the basis of their structural characteristics, combining modularity contributions and conductance to assess the quality of individual project clusters. Moreover, we applied degree centrality and meso-centrality metrics to assess the centrality of the project nodes within the community, where degree centrality measures the projects in the community that have many direct connections with other projects, which may represent the priority status of each project in the cluster and can further support the prioritization of projects within the cluster. Median centrality helps to locate “bridge” projects connecting different clusters, indicating the linkages between different project clusters, which can help us adjust the structural layout of the clusters.

3.4. Project Cluster Evaluation

To further optimize the internal and external project cluster allocations, based on the grid enterprise’s “XX Category Project Depth Provisions” and “XX Category Project Economic and Financial Compliance Evaluation and Other Documents”, a multidimensional evaluation index system was constructed at the individual and cluster levels, covering key dimensions such as economics, timeliness, innovation, and stability, to comprehensively pre-evaluate the quality of the projects and the overall benefits they will bring, adjust the priority of the reserved projects for inclusion in the plan, and ensure that the efficiency of the investment is maximized.
Table 1 lists the key indicators and their types for each evaluation dimension. To enhance the operability and scientific rigor of the evaluation system, a project classification label system was constructed based on the current status of the implementation of the reserve project pool of power grid enterprises, in which the category of “should be included in the plan” is assigned a code of 0, and the category of “should not be included in the plan” is assigned a code of 1. This plan refers to the project implementation plan for enterprises. Projects that have been approved but have been delayed for a long time without being implemented are referred to as classification 0. On the basis of the classification labels of the projects and the scores of the key indices, classification training is carried out via Random Forest [57] to optimize the weight allocation scheme of the index system, thus ensuring the accuracy and objectivity of the project cluster evaluation.
As shown in Table 1, this study is focused on the equipment and strategy dimensions to assess the individual projects and clusters from all perspectives. Moreover, combining the business characteristics of the electric power industry, the benefits of the economic dimension are specified in two directions, namely the power supply and the loss reduction rate, to achieve accurate analysis and evaluation effects. A detailed description of the indicators listed in Table 1 is shown in Appendix A.

4. Data Validation

Section 3 of the methodological framework is generally applicable to the field of project management, but, due to the specialized nature of the dimensions and indicators, the complete methodology is only applicable to power projects. In this section, we apply power project data to validate the methodology. Three categories of projects (grid infrastructure, production technology reform, and grid digitalization) were selected as the case study objects, and a multidimensional project association network was constructed to mine the key project clusters and evaluate and optimize their configuration.
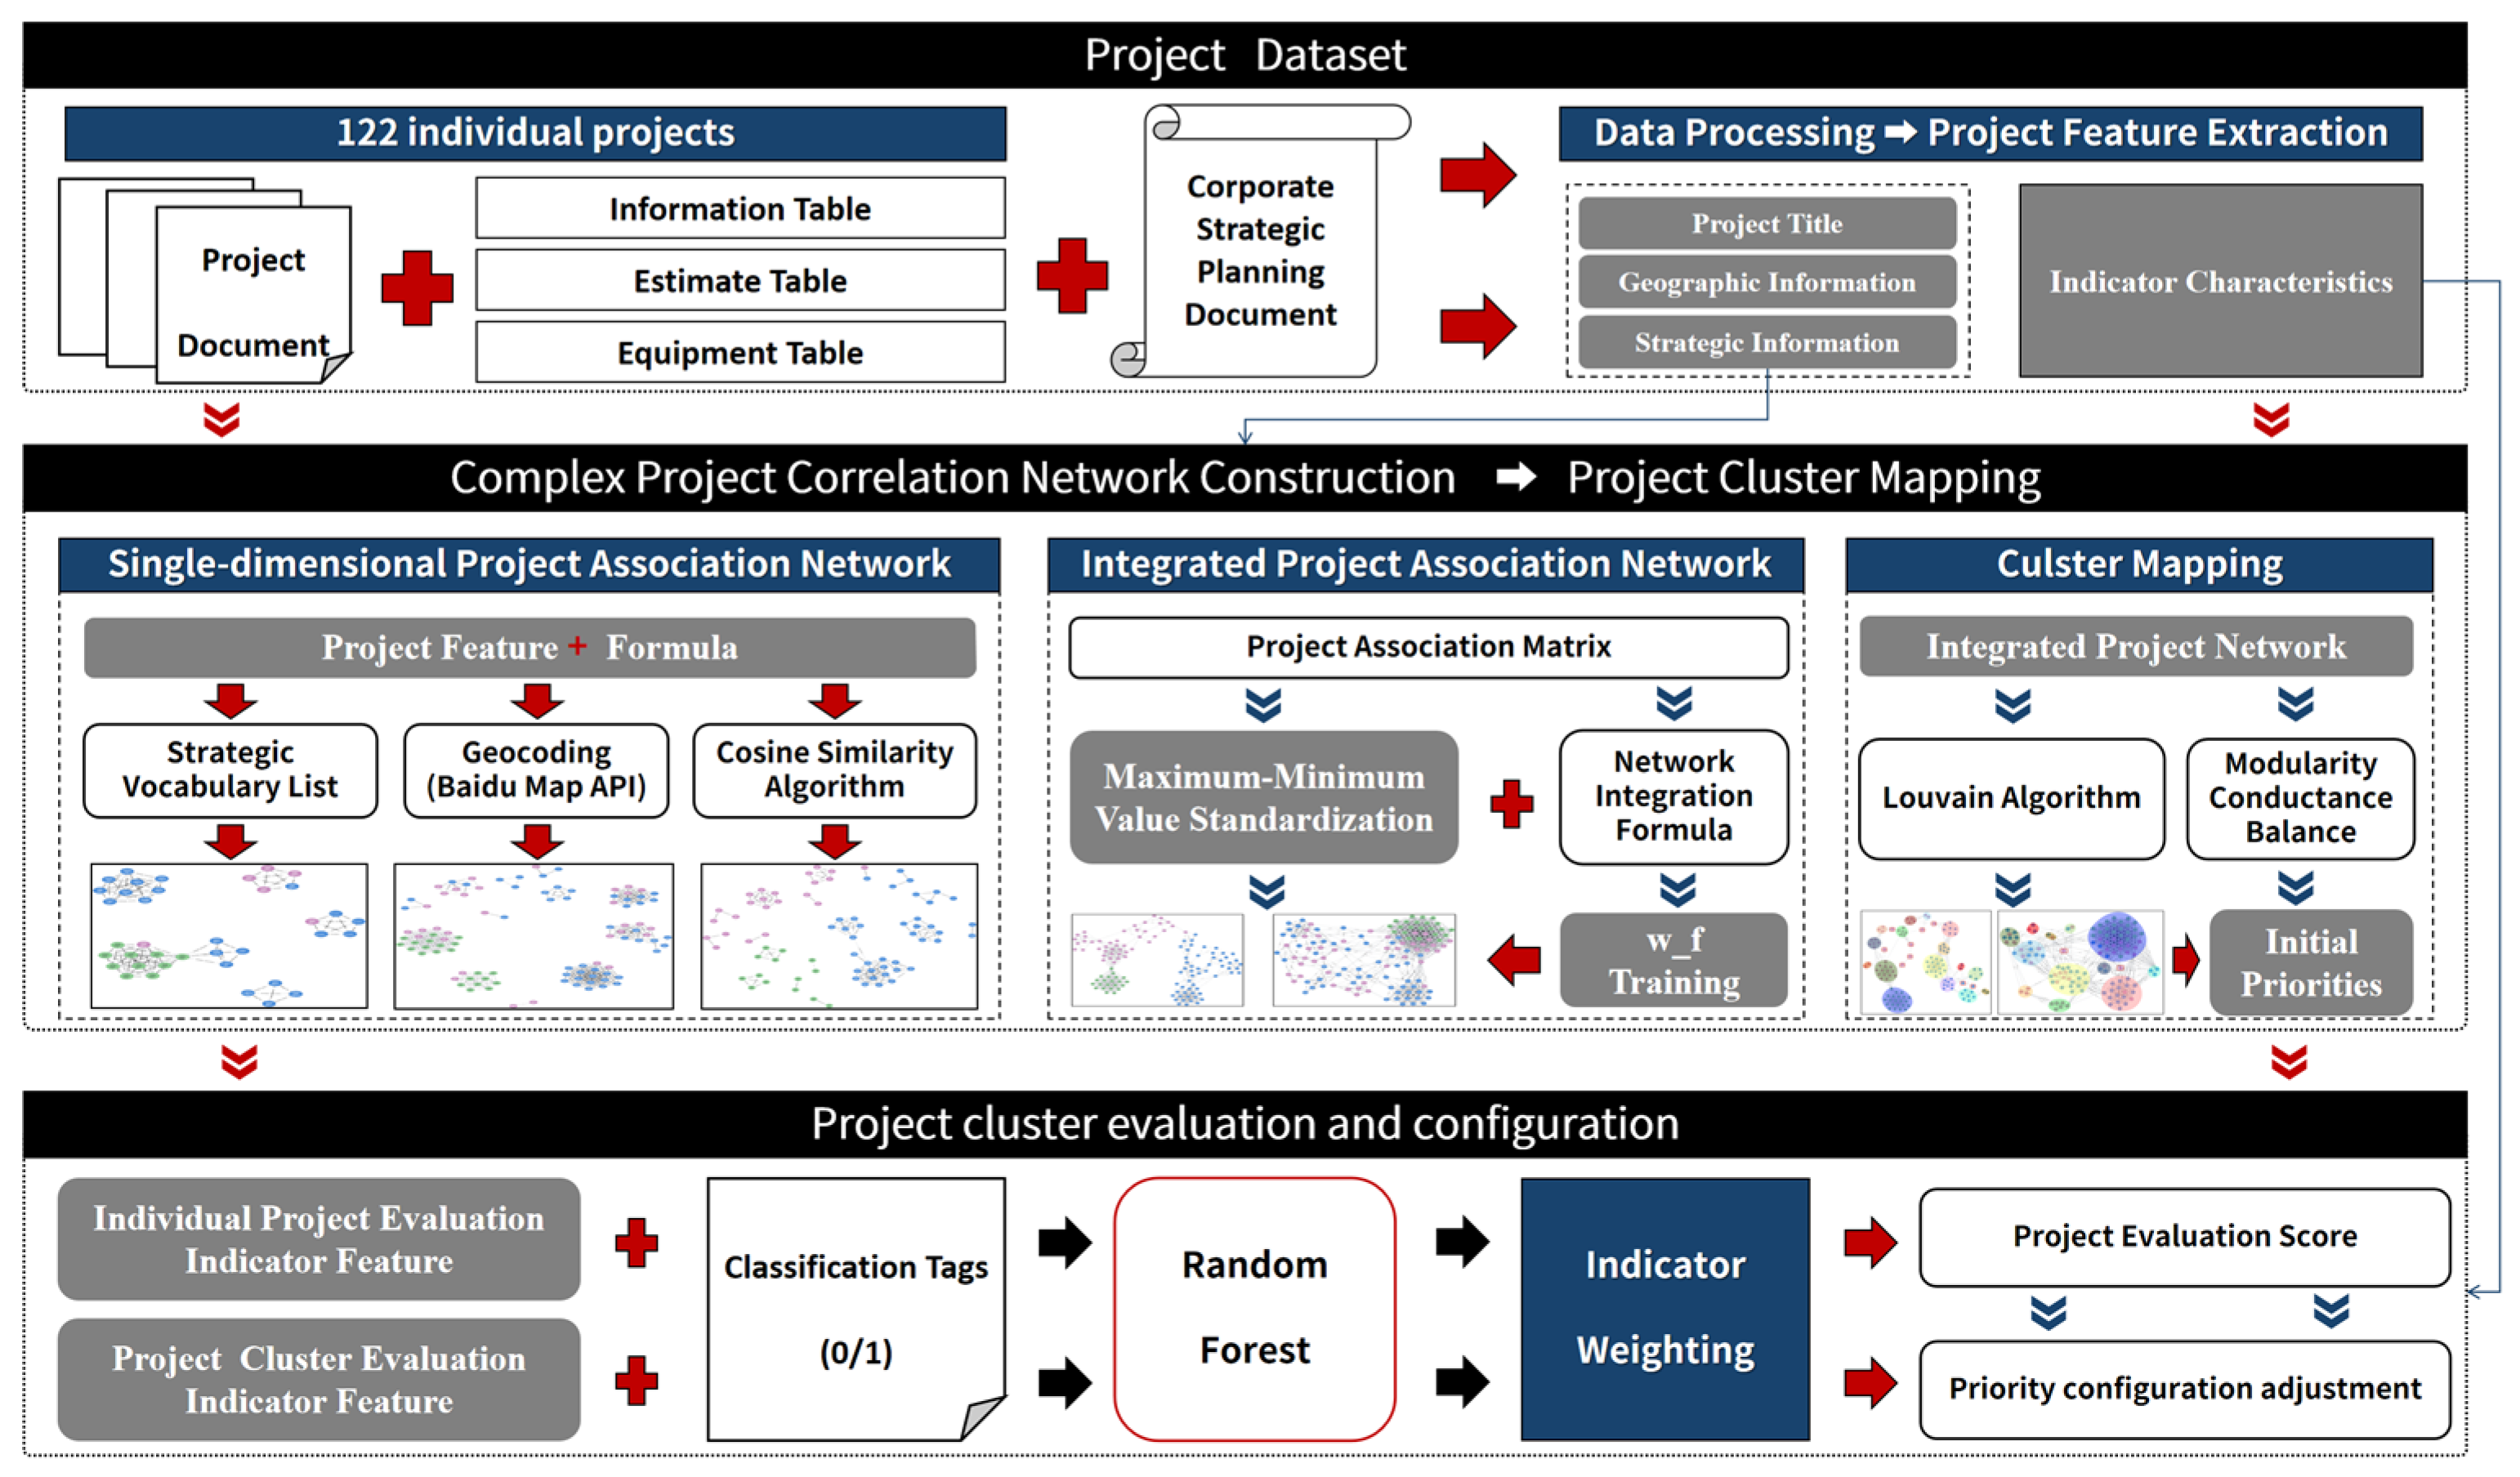
Grid infrastructure refers to projects related to the construction of new infrastructure in a grid, including multiple voltage levels. Production technology improvement refers to grid equipment renovations. Grid digitalization, as its name suggests, is a grid-related digitalization and intelligence upgrading project that is aimed at improving the operational efficiency and intelligence of the grid through the application of modern information technology. All three projects are important cost-type projects for grid companies. Figure 4 shows the data verification process.

4.1. Dataset

We independently constructed datasets based on project management and corresponding data provided by partner companies, for a total of 122 individual projects. The data was provided by multiple provincial companies of the State Grid Corporation of China, which operate under a regional responsibility system. The projects exhibit regional differences, which facilitates model generalization.
Specifically, the application data covers project feasibility studies, estimates, and regional power supply and loss reduction information, with each report containing an average of 100 pages of content. On the basis of this data, we extracted key information such as the name, category, geographic location, and content of each project to support the construction of the IPAN. Notably, the project names follow a specific naming convention, such as ‘company’ + ‘geographic location’ + ‘project type’, so the project location information was obtained through secondary data extraction. Due to data confidentiality, the complete dataset cannot be displayed.
In addition, based on the evaluation indicator system and project data, the corresponding indicator calculation elements were extracted, and an evaluation result dataset was constructed for each project and its corresponding cluster. The scale of the individual project evaluation dataset was 122∗16, i.e., 122 projects and 16 evaluation indicators. The size of the project cluster evaluation dataset was 36∗6, which provides data support for optimizing the configuration of the project clusters.

4.2. Complex Project Correlation Network Construction

According to the formula for calculating the relationships among the three association dimensions of strategies, geography, and semantics, the relevant parameters were obtained for calculation purposes, and the multidimensional project association network was established. For the strategic dimension, we constructed a strategic vocabulary list on the basis of the strategic planning documents provided by the partner companies (Table 2), identified the strategic content included in the project content through the dictionary matching method, and initially obtained the strategic scores Wis and Wjs for projects pi and pj, respectively.
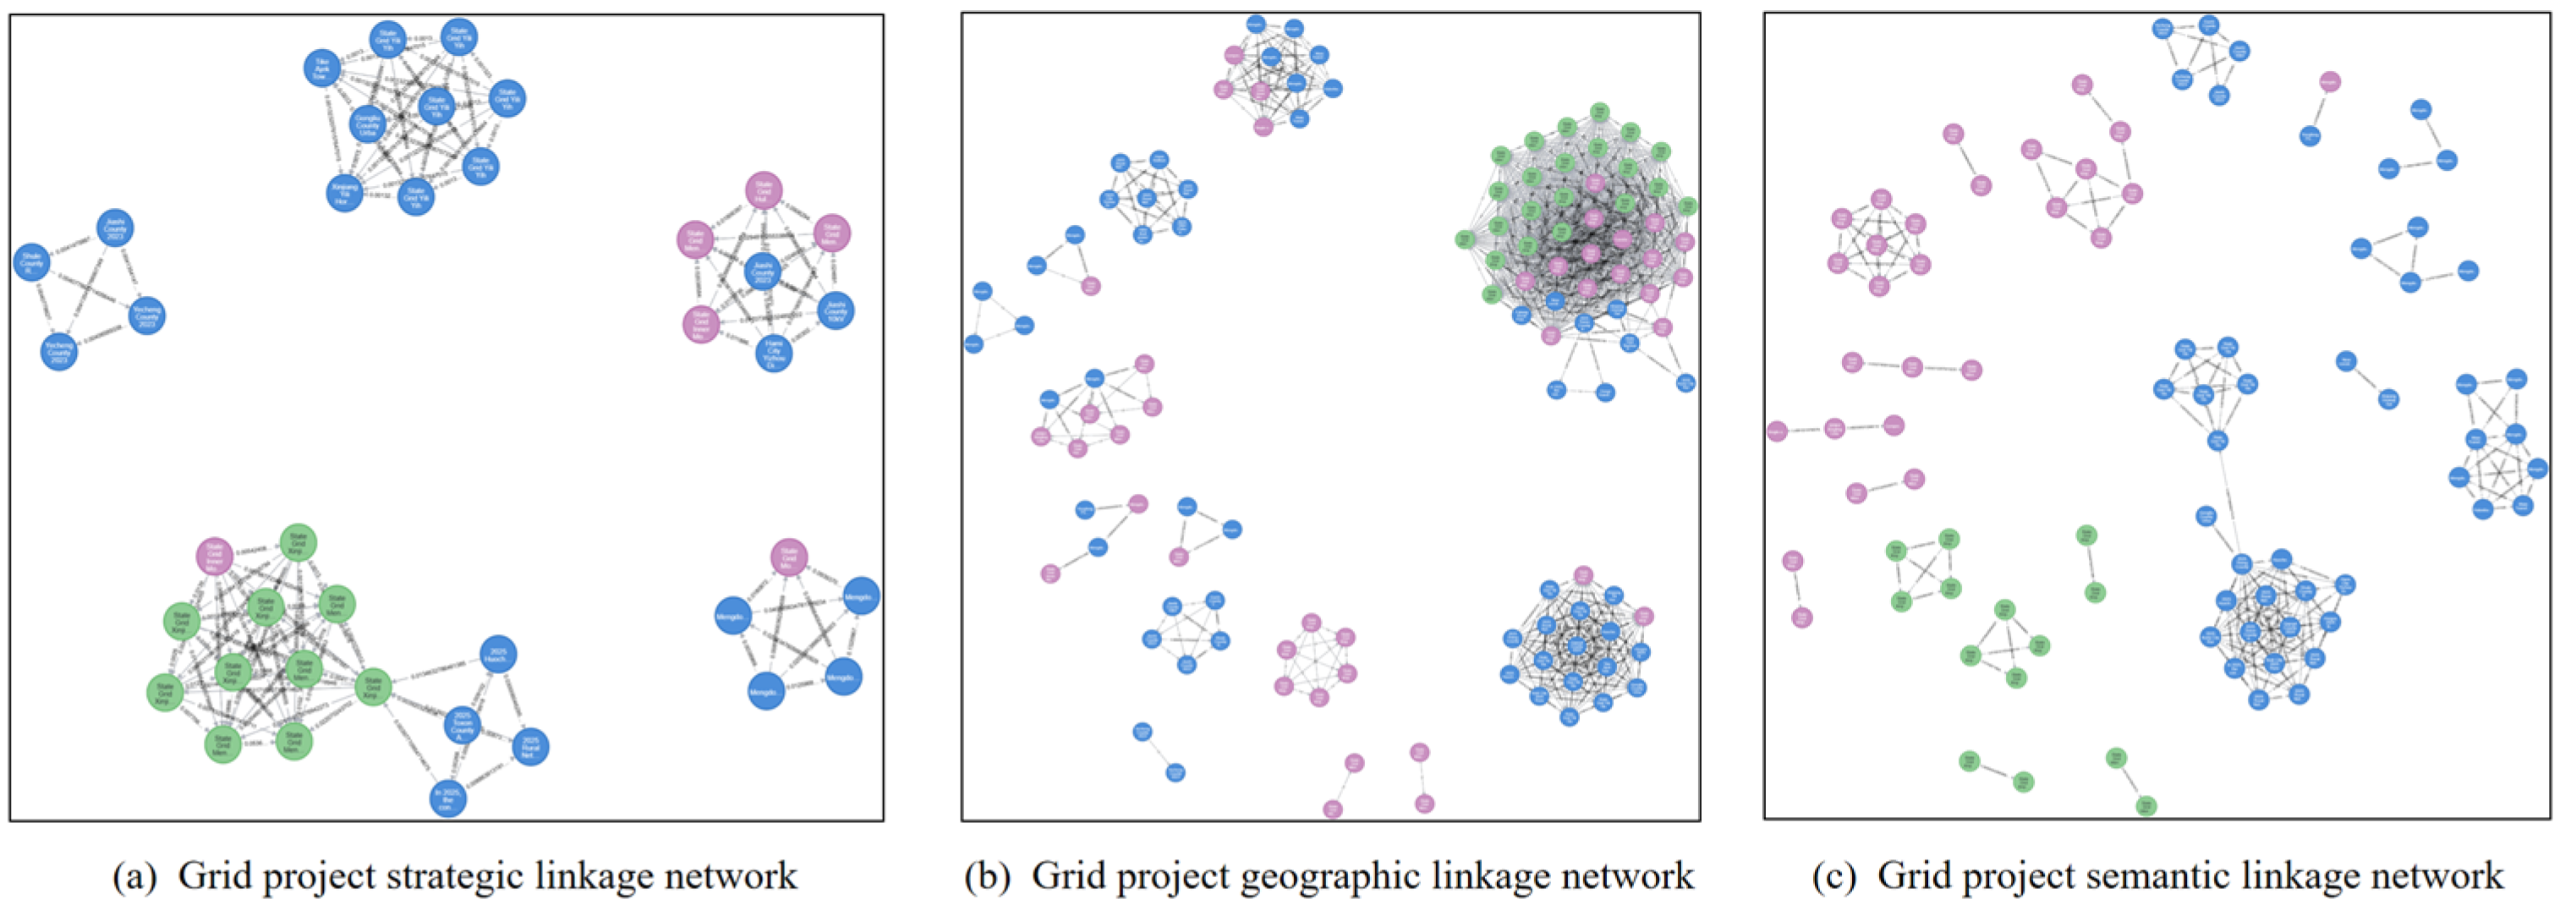
Moreover, on the basis of the strategic content obtained from the matching process, we carried out interproject matching again, derived the degree of strategic overlap between the projects Lst (pi∩pj), and then calculated the strength of the strategic linkage. Appendix B.1 shows the logic of network construction. A comprehensive calculation was used to obtain the grid project strategy association strength, thus producing a grid project strategy association internetwork, as shown in Figure 5a.
For geographic associations, the Baidu Map open application programming interface (API) was used to perform the geocoding task on the basis of the geographic location information on the acquired projects, and then the geographic coordinates and geographic distances between the projects were calculated. The Baidu Map (http://api.map.baidu.com) open API is a map service tool provided to developers that supports map display, search, positioning, and other functions and is suitable for a variety of development scenarios. Among these, the geocoding service can convert addresses to and from latitude and longitude, making it easier for developers to process location information. Through normalization, the geographic distance matrix d(pi, pj) was obtained, and the geographic project correlation matrix was calculated according to Formula (2), followed by the use of threshold screening to optimize the results. Figure 5b shows the obtained grid project geoassociation network. Figure 5c shows the item semantic association network, the association matrix of which was computed by the cosine similarity algorithm for the item name participle vectors and further processed by threshold filtering. Notably, the thresholds for both the geographic and semantic dimensions were manually set and adjusted several times to arrive at the desired association results displayed in Figure 5. Specifically, the geographic-dimension screening range was [0.96, 1] because of the wider geographical scope of the project. The semantic dimension, on the other hand, considers some of the similarity influencing factors, such as the voltage level and project company, and the screening range is [0.4, 1]. The different colors in Figure 5 represent each of the three grid project categories.
In view of the variability exhibited by the screening threshold settings of the three single-dimensional association networks, we personalized the adjacency matrix of the three networks to eliminate the scale differences between the data, ensuring that the dimensional data was fused and analyzed under a unified standard.
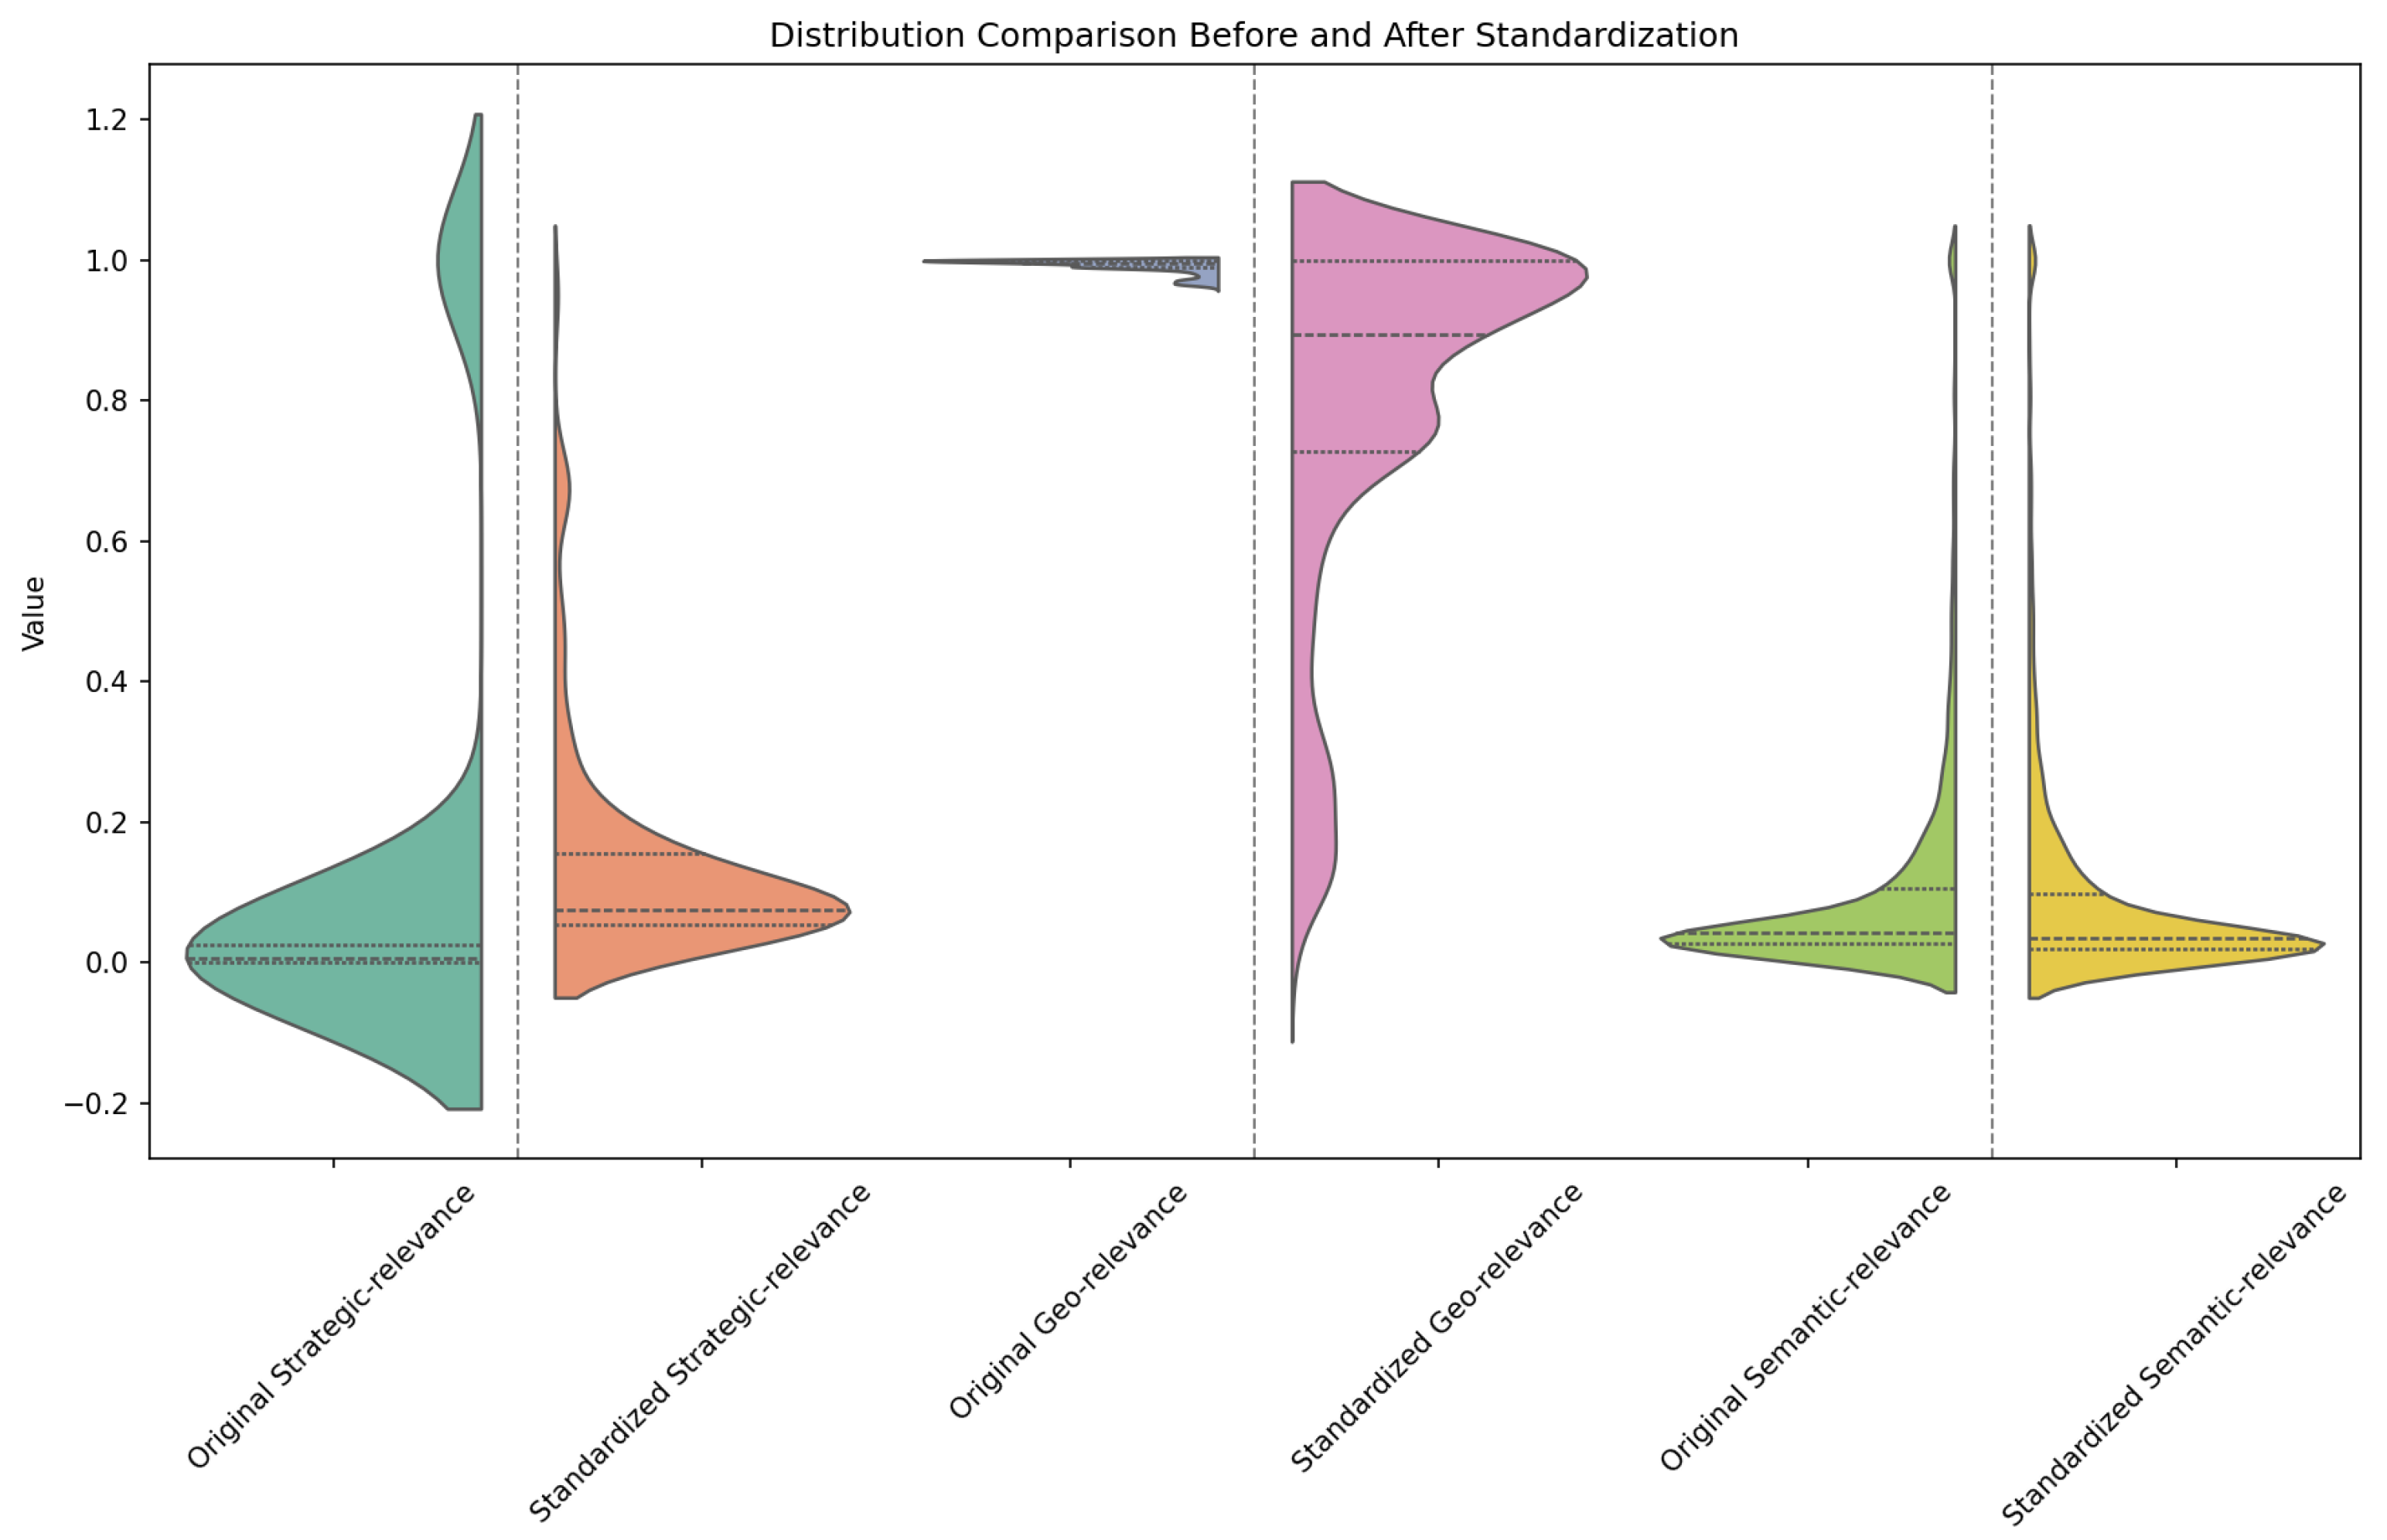
Specifically, the maximum–minimum value standardization method was applied in this study to map the data with different dimensions to a uniform value interval. Moreover, the weights and deviation coefficients of the data normalization process were set for the characteristics of the adjacency matrix of each dimension to ensure that the project relevance of each dimension was uniformly distributed in the interval [0, 1], thus effectively reflecting the relevance strength of the project dimensions and avoiding the problem of vanishing relationship edges. Figure 6 shows a comparison between the correlation distributions contained in the adjacency matrix before and after performing normalization.
As shown in Figure 6, the adjacency matrices of the two association dimensions (strategies and geography) clearly show a more uniform distribution characteristic after undergoing standardization. For the semantic dimension, owing to the threshold screening conducted during the construction of the unidimensional network, there was not much difference between the distributions of the adjacency matrix before and after performing standardization, but the connection strengths between some nodes could still be adjusted.
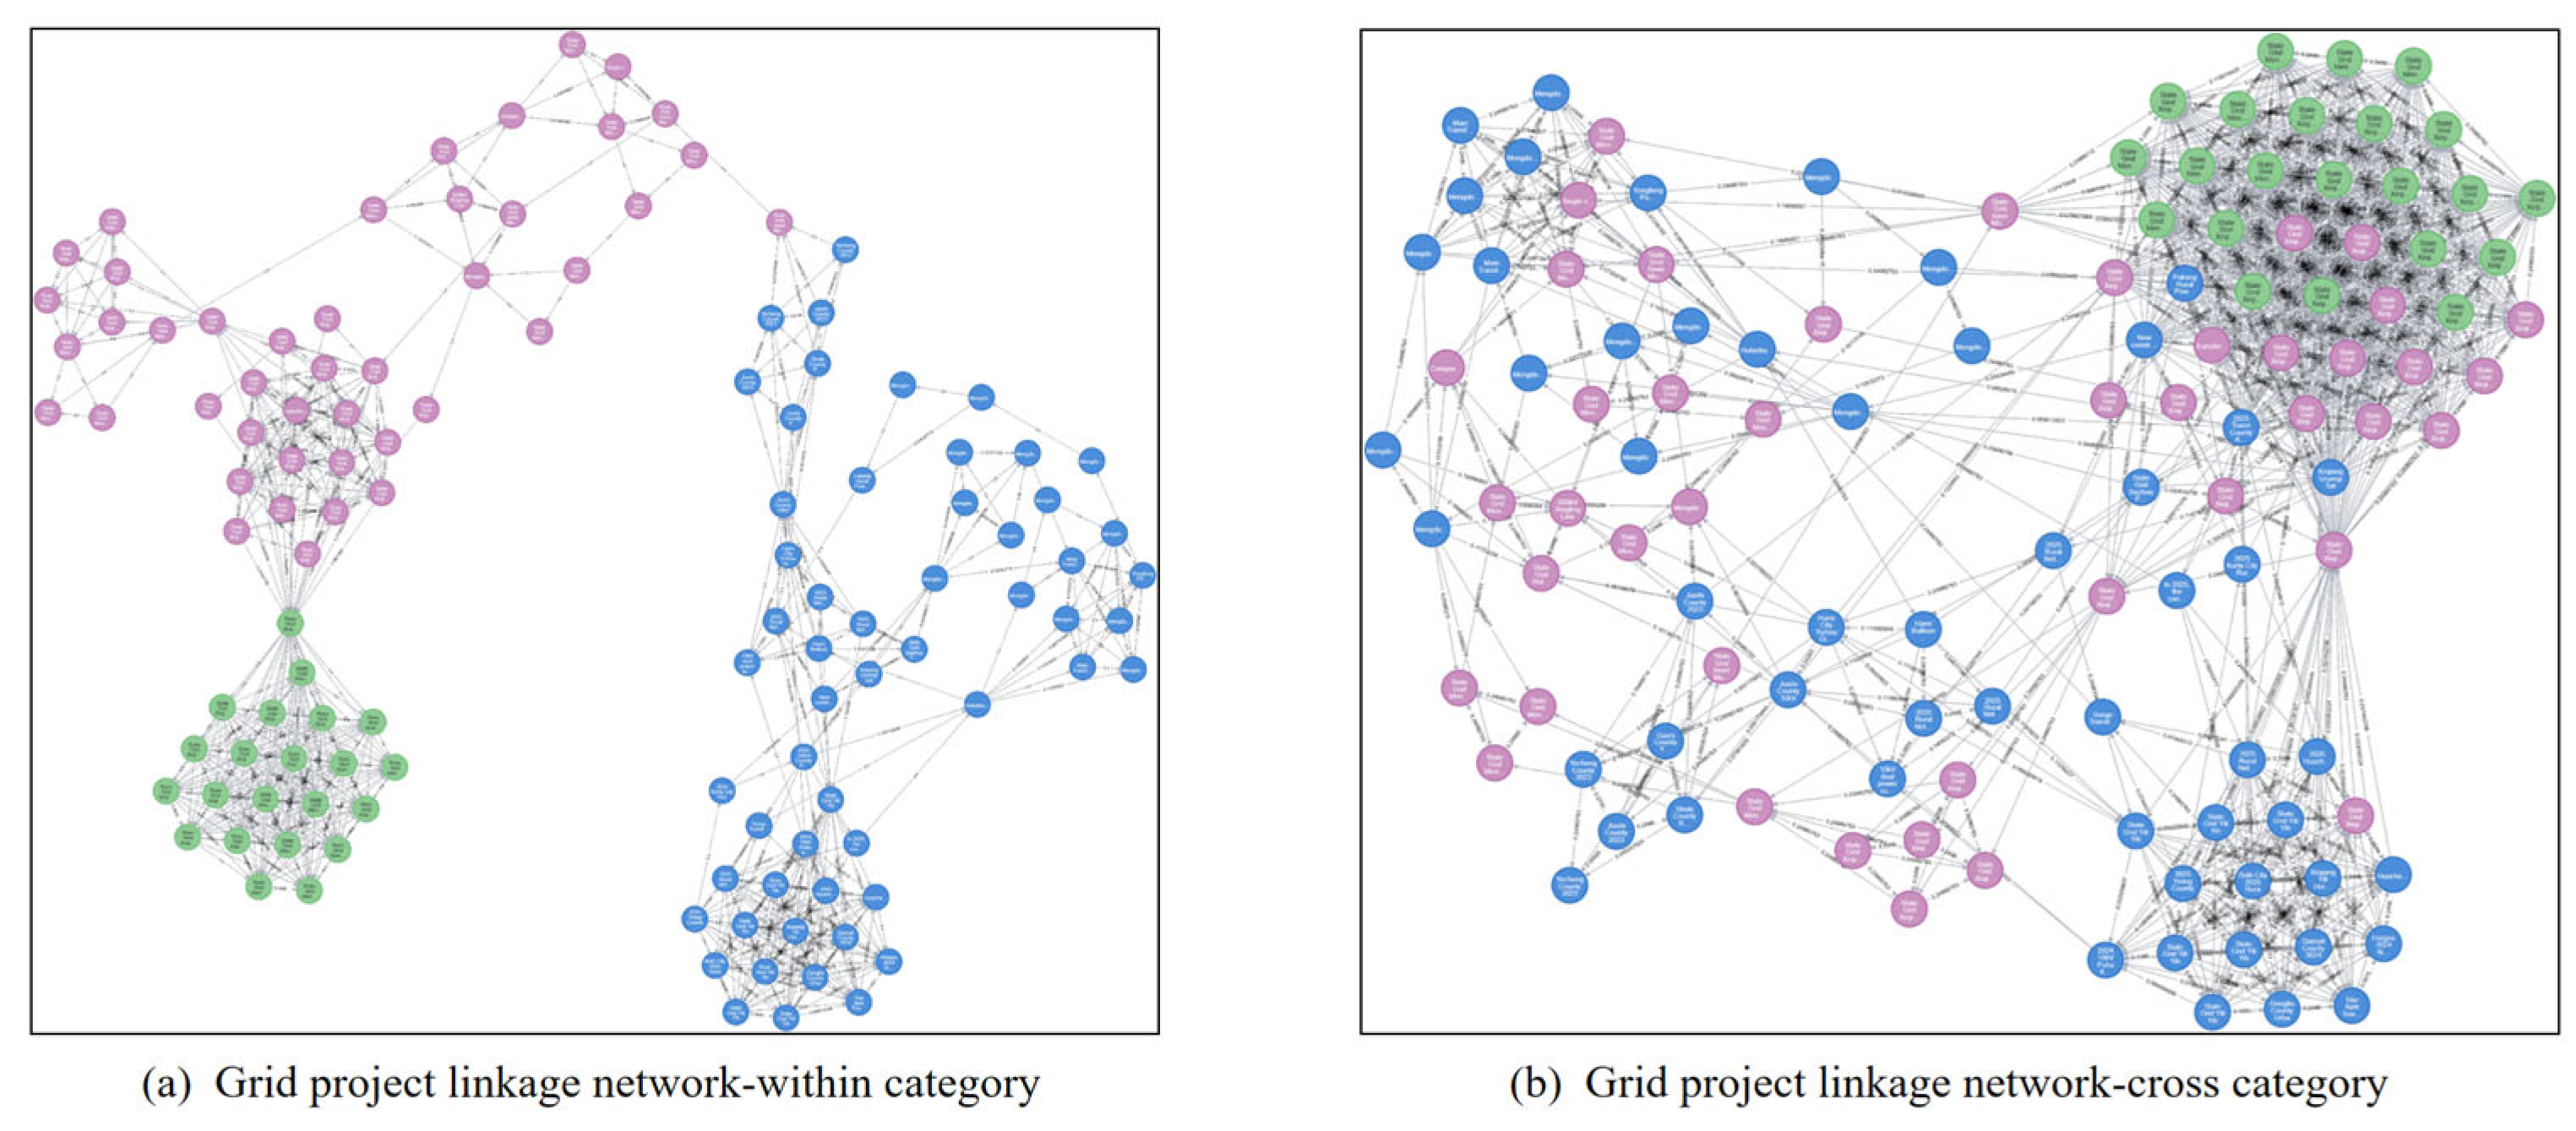
Using the normalized adjacency matrix as the input, we constructed and integrated the network based on the pseudocode logic in Appendix B.1, obtaining the results shown in Figure 7.
Figure 7a depicts the results of the network fusion process applied to the strategic, geographic, and semantic dimensions of the IPAN within the same category. Figure 7b, on the other hand, depicts the results of the network fusion process applied to the strategic and geographical dimensions, without category boundaries, to construct an IPAN across categories. During the process of network fusion, we initially set the range of the network fusion parameter w_f to [0.2, 0.4] to ensure the implementation of the “strategy-led, geography-assisted, semantic boundary” principle. Moreover, the Louvain algorithm was used for community detection, and the gradient descent algorithm was applied to optimize the network fusion parameter w_f through the loss function L in a continuous iterative process so that the optimal network fusion parameters for the within-category and cross-category settings were 0.4000 and 0.2498, respectively. This completed the procedure for constructing the IPAN shown in Figure 7.

4.3. Project Cluster Mapping

The Louvain algorithm traverses the nodes in the IPAN and moves the nodes to their corresponding communities on the basis of the modularity gain principle (the code logic is shown in Appendix B.2). We adopted this algorithm to obtain community detection results for the optimal same-category and cross-category IPANs by training based on the network fusion parameter w_f, as detailed in Figure 8.
The results show that the Louvain algorithm successfully mined tightly structured project clusters from both the same-category and cross-category IPANs and can support both within-category management and cross-category coordination schemes for grid project management scenarios. Figure 8a shows the distribution of the project clusters in the same category, and Figure 8b shows the distribution of the project clusters in different categories.
The node colors represent specific projects, and the node shading colors represent the clusters to which they belong. As shown in the figure, the existence of a single project cluster pattern suggests that some projects are significantly independent and have fewer interactions with the external projects.
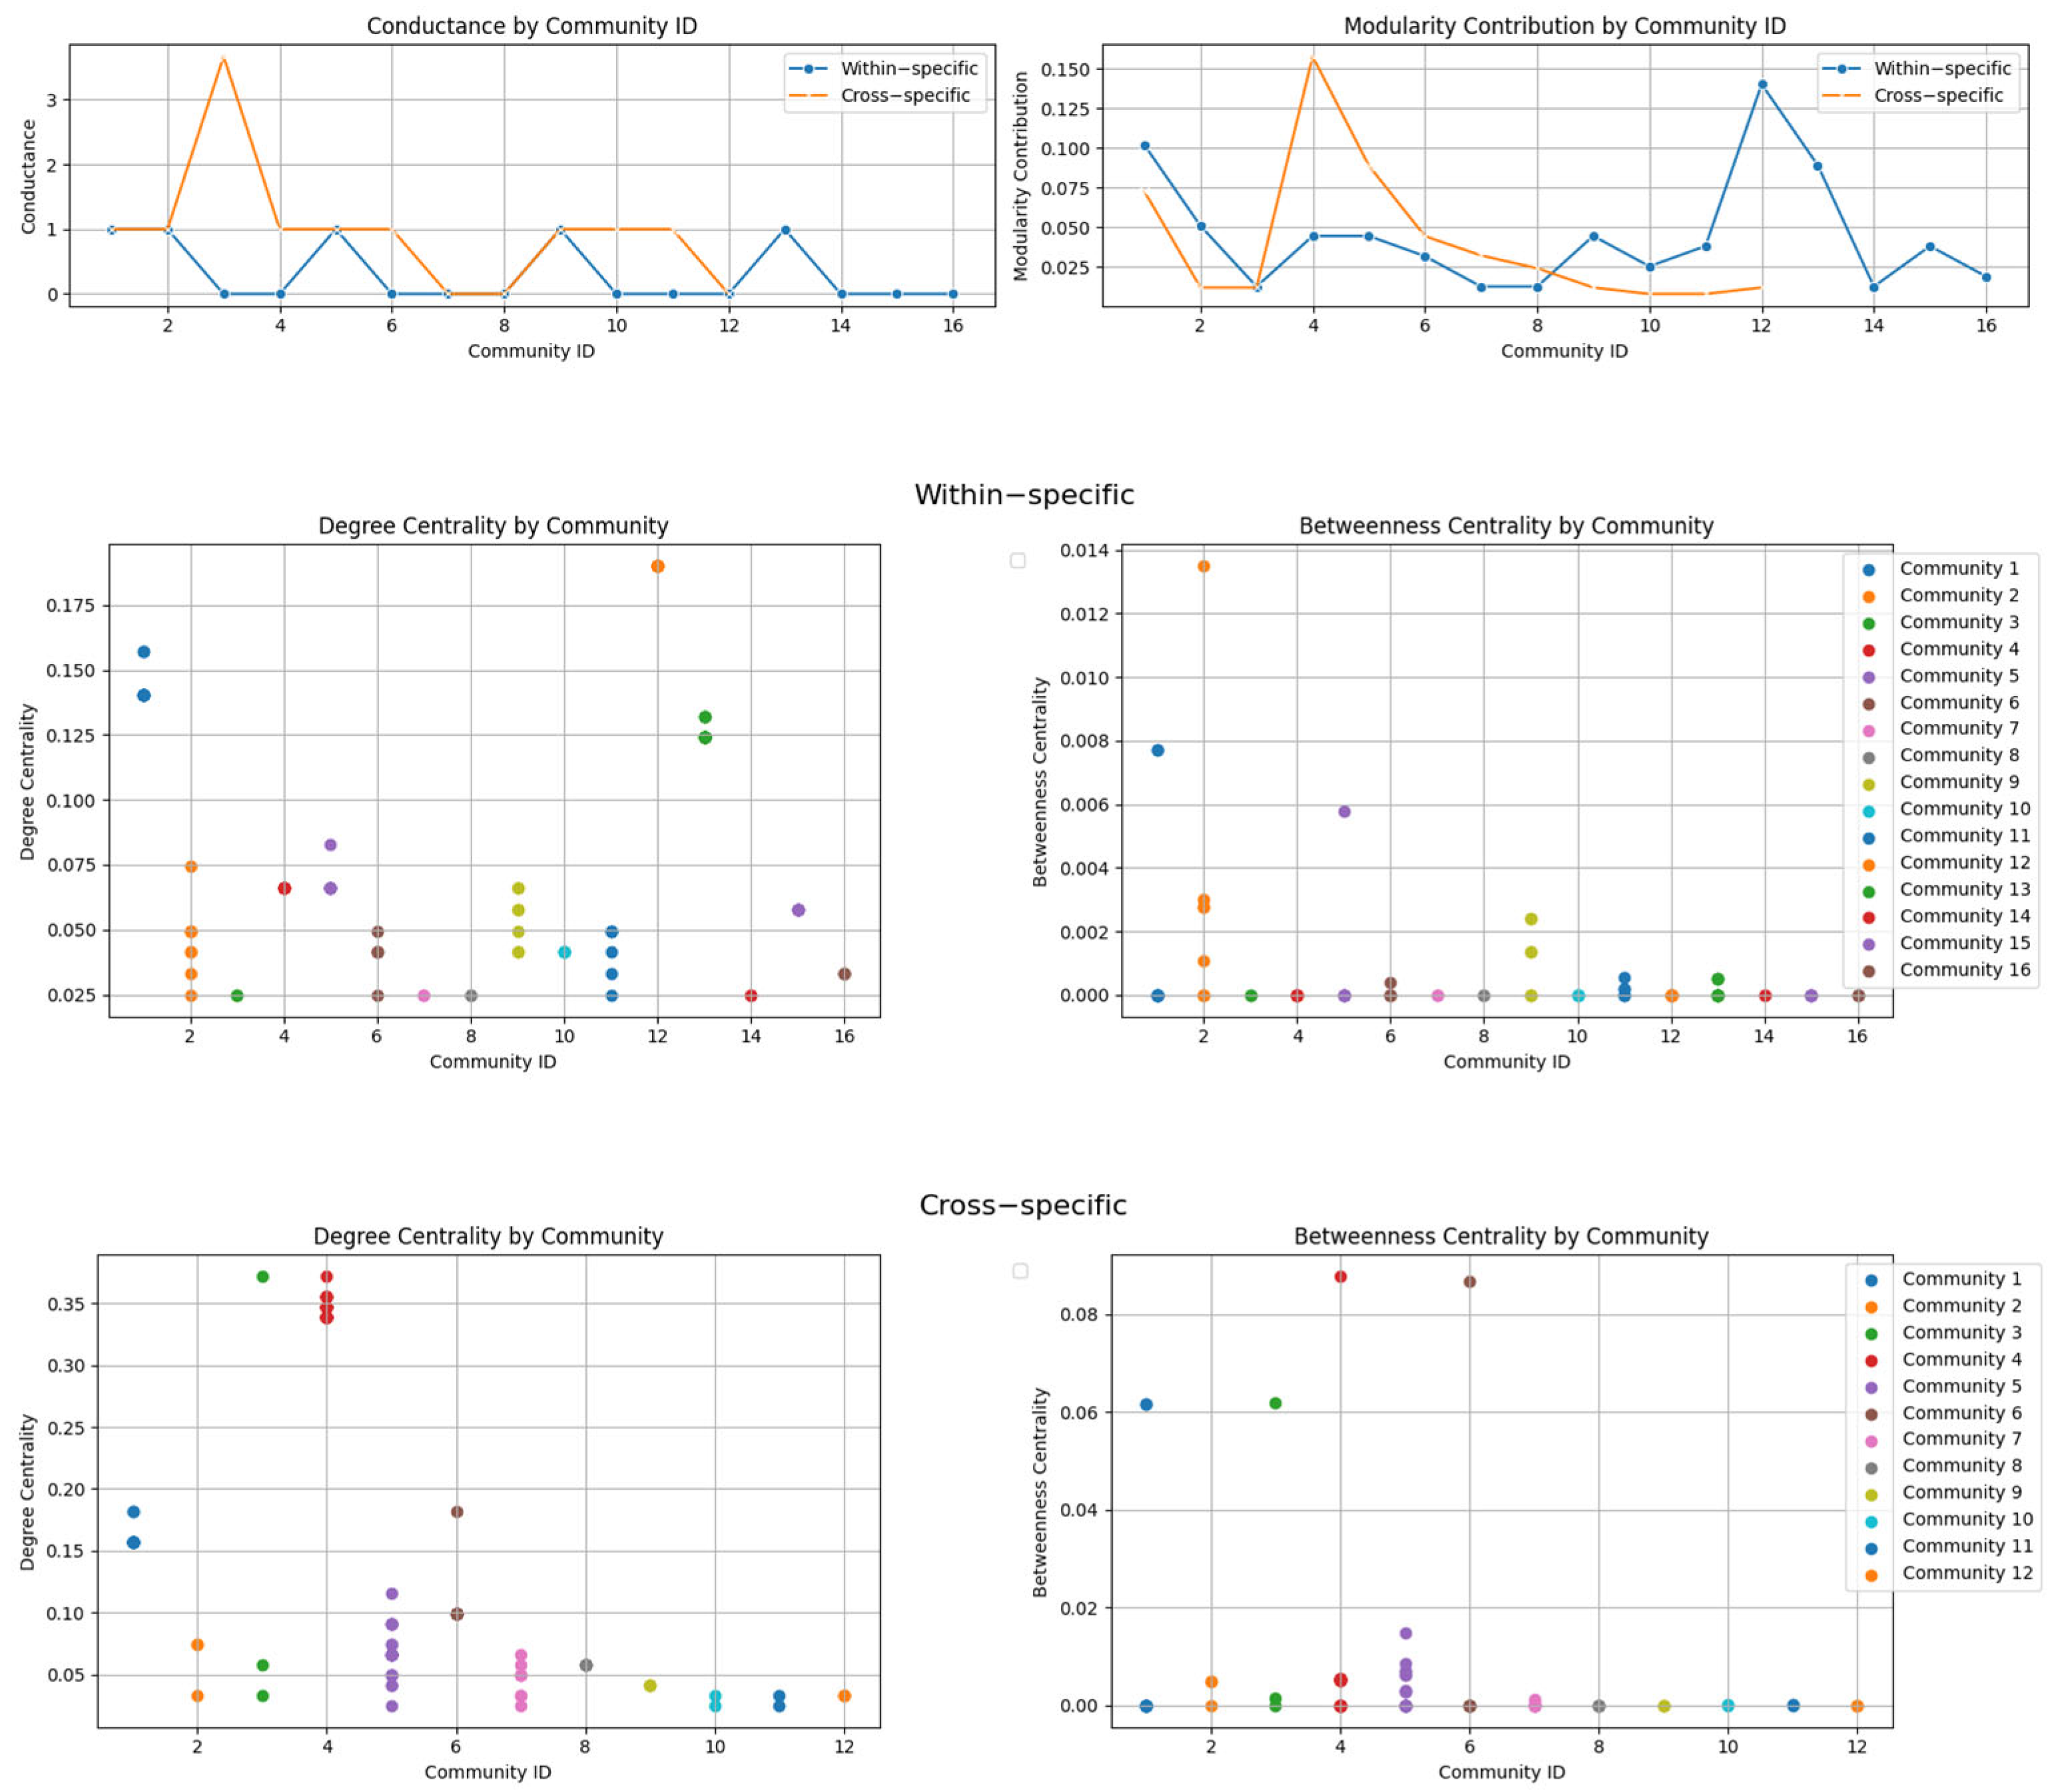
These findings suggest that these projects need to be managed independently by people with specialist knowledge to ensure the effectiveness of investment and management. At this stage, we chose to exclude such communities and focus our research on the relevant projects at the cluster level. Stand-alone individual projects then rely on subsequent project evaluations to prioritize their configuration. This resulted in a total of 16 clusters of similar projects and 12 clusters of cross-category projects. Through an in-depth analysis of these clusters, we identified two types of cluster patterns. First, compact clusters, where there is a clear central project node, are more frequent in groups of similar projects. The second type includes decentralized clusters, with balanced connections between project nodes, and the dominant project cannot be determined. To further explore the structural characteristics of the clusters, we quantitatively analyzed the conductivity of each community and its contribution to the overall modularity of the network based on the output of the community detection algorithm, thus assessing the quality of each project cluster and initially ranking the project clusters. Moreover, the distribution and ordering issues within project clusters are also critical. We applied two types of centrality indicators, degree centrality and median centrality, to assess the internal structure of each community and its influence and to guide the layout strategy for the projects within the clusters.
The calculation results of the above assessment indicators are shown in Figure 9, and the cluster characteristics of within-category project cluster 12 and cross-category project cluster 4 exhibit clear superiority. By observing the performance in terms of the node degree centrality and connection centrality indicators within the cluster, we can see that the cluster model generally presents compact characteristics, and the existence of dominant nodes within it supports the internal configuration of the project clusters. On the basis of the above results, we ranked the priorities of the project clusters and their subprojects (individual projects within the cluster) and reached the optimal configuration for the project clusters. Table 3 shows the adjusted project cluster priorities and the internal project layout.
The data characteristics of the subprojects shown in parentheses in Table 3 illustrate that these subprojects are based on degree centrality and meso-centrality assessments and temporarily belong to the same priority class. In addition, clusters consisting of a single project were screened out at this stage and reconsidered in the subsequent project evaluation sessions.

4.4. Project Cluster Evaluation and Configuration

For the internal and external configurations of the project clusters, the multidimensional evaluation system was applied at both the individual and cluster levels to conduct a comprehensive assessment of the project clusters and the individual projects within them, and the results of the evaluation of the structure of the clusters were used to generate the final priority allocation plan for reserve projects.
Based on the project feasibility studies, we constructed evaluation indicator matrices for the individual projects, the clusters within-category, and the clusters cross-category. The individual projects are labeled according to whether they are projects that have been in “reserve for a long time but not included in the program”.
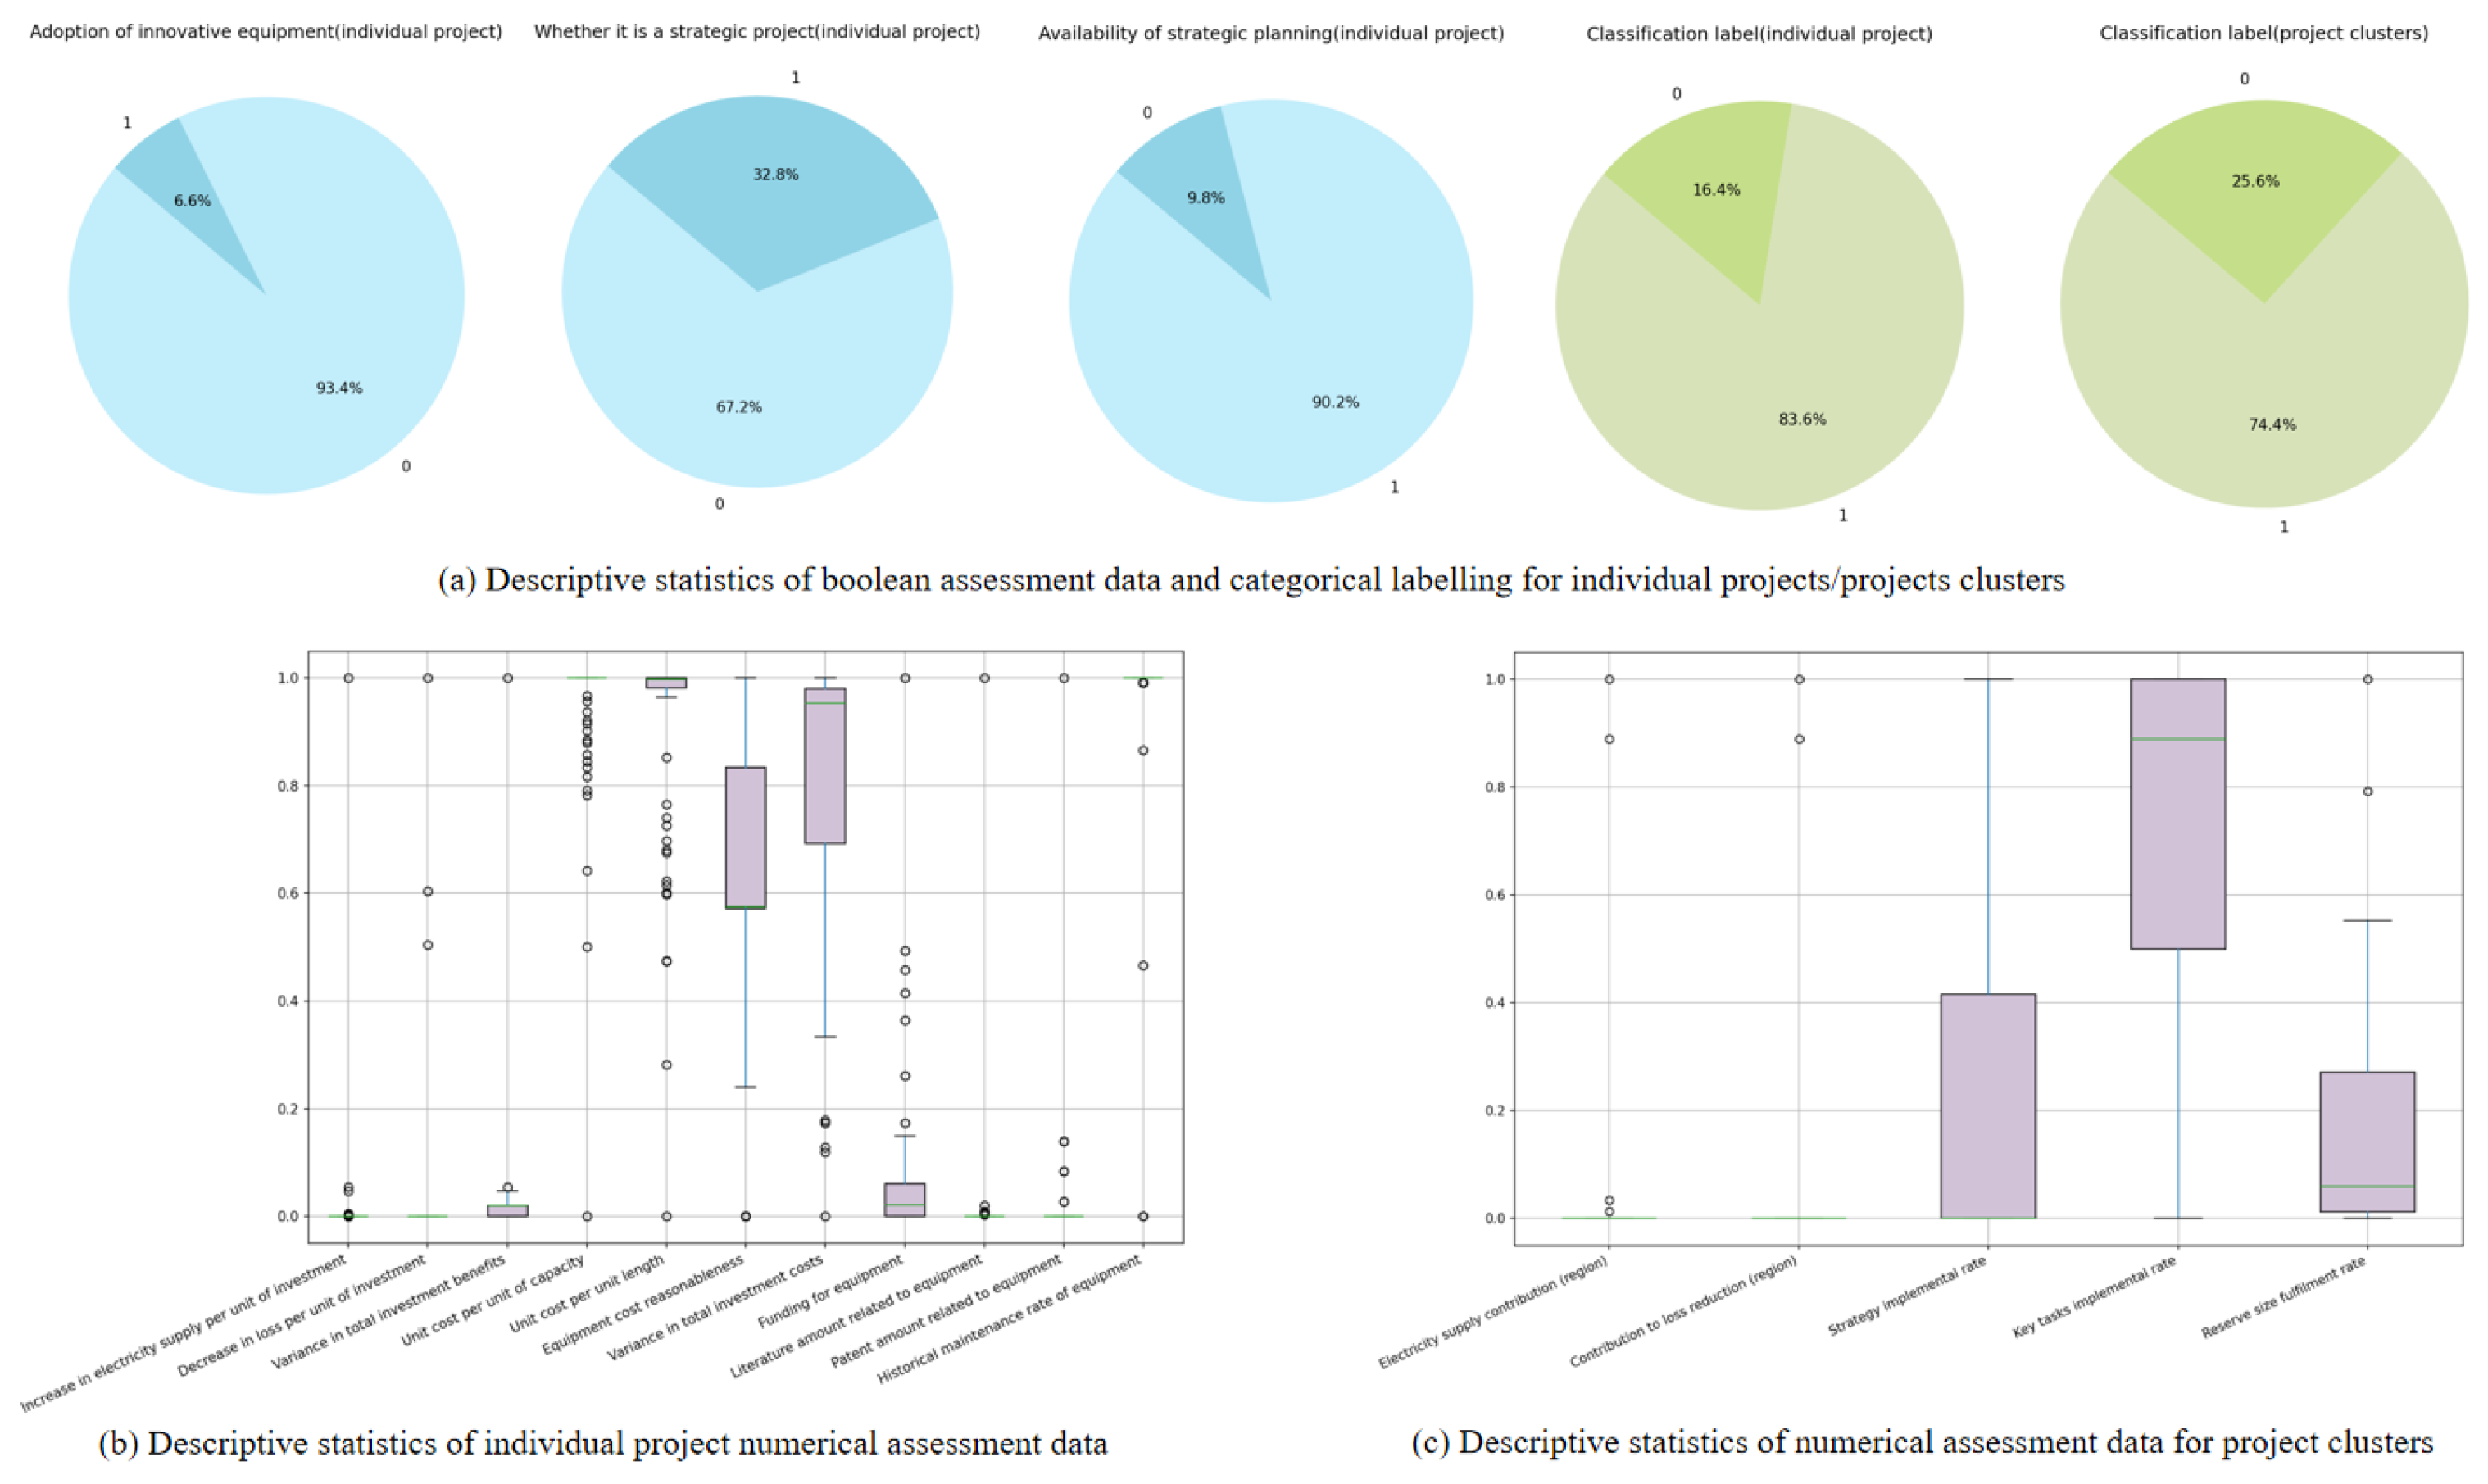
Clusters were further classified into two labels, namely “should be included in the plan” and “should not be included in the plan”, depending on whether they contained individual projects in reserve that had not been included in the plan for a long period of time. Figure 10 presents the descriptive statistical analysis characteristics of the training samples of the individual and cluster evaluation systems after the standardization process.
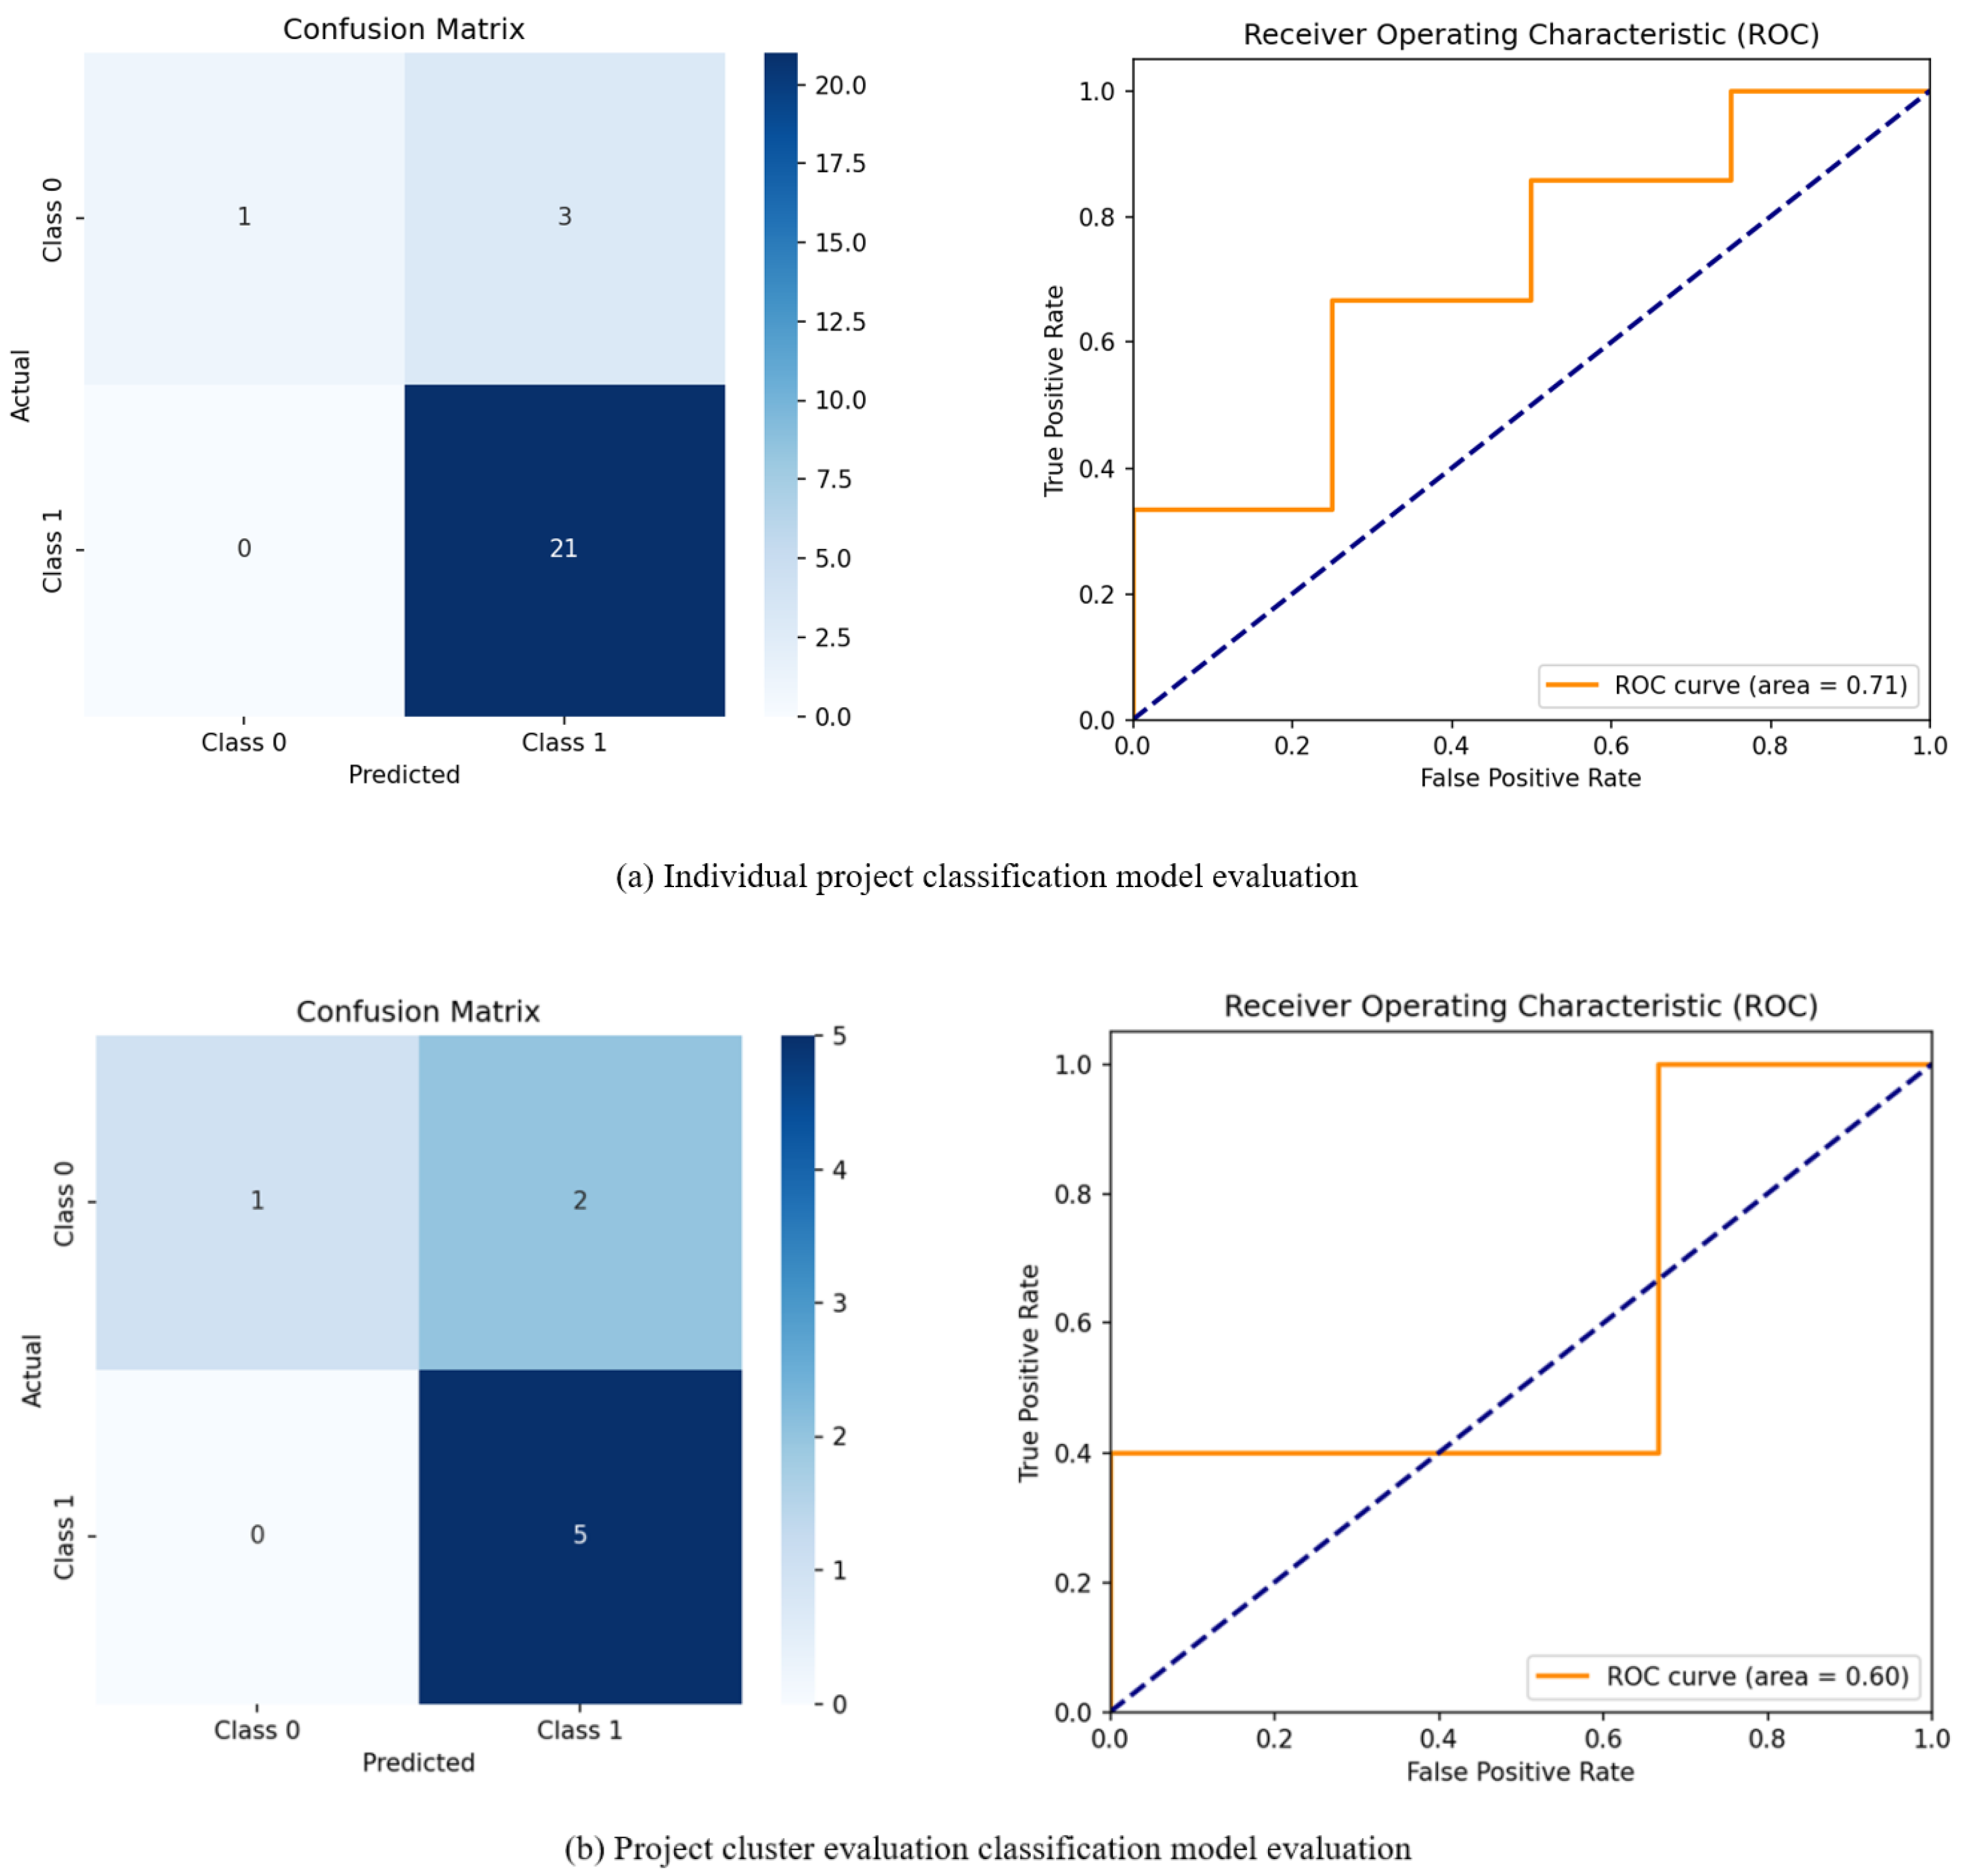
On this basis, the random forest algorithm was used to weight the indicators of the multidimensional evaluation system at the individual and cluster levels to achieve an accurate quantitative analysis of the project characteristics. The specific settings for the random forest classifier were as follows: 500 decision trees were used for modeling, and a random seed was fixed to ensure reproducible results. The algorithm used the Gini coefficient as the criterion for node splitting. No depth limit was set for each decision tree, allowing it to grow fully until all leaf nodes reached an optimal state. When constructing each tree, samples were drawn from the training set using resampling with replacement, and, at each node split, the square root of the total number of features was automatically selected for optimal partitioning. The test confusion matrix and receiver operating characteristic (ROC) curve produced by the model after training are shown in Figure 11.
In this study, the accuracy of individual item classification was 88%, and the accuracy of cluster item classification was 75%. The weights of the indicators of each dimension were determined based on the importance of the characteristics revealed by the classification model, and the results are shown in Table 4.
Given the nature of capital, investment costs are the most important evaluation factor for individuals and clusters in grid infrastructure, production technology improvement, and grid digitalization projects. Moreover, innovativeness can be one of the key considerations involved in the project selection process.
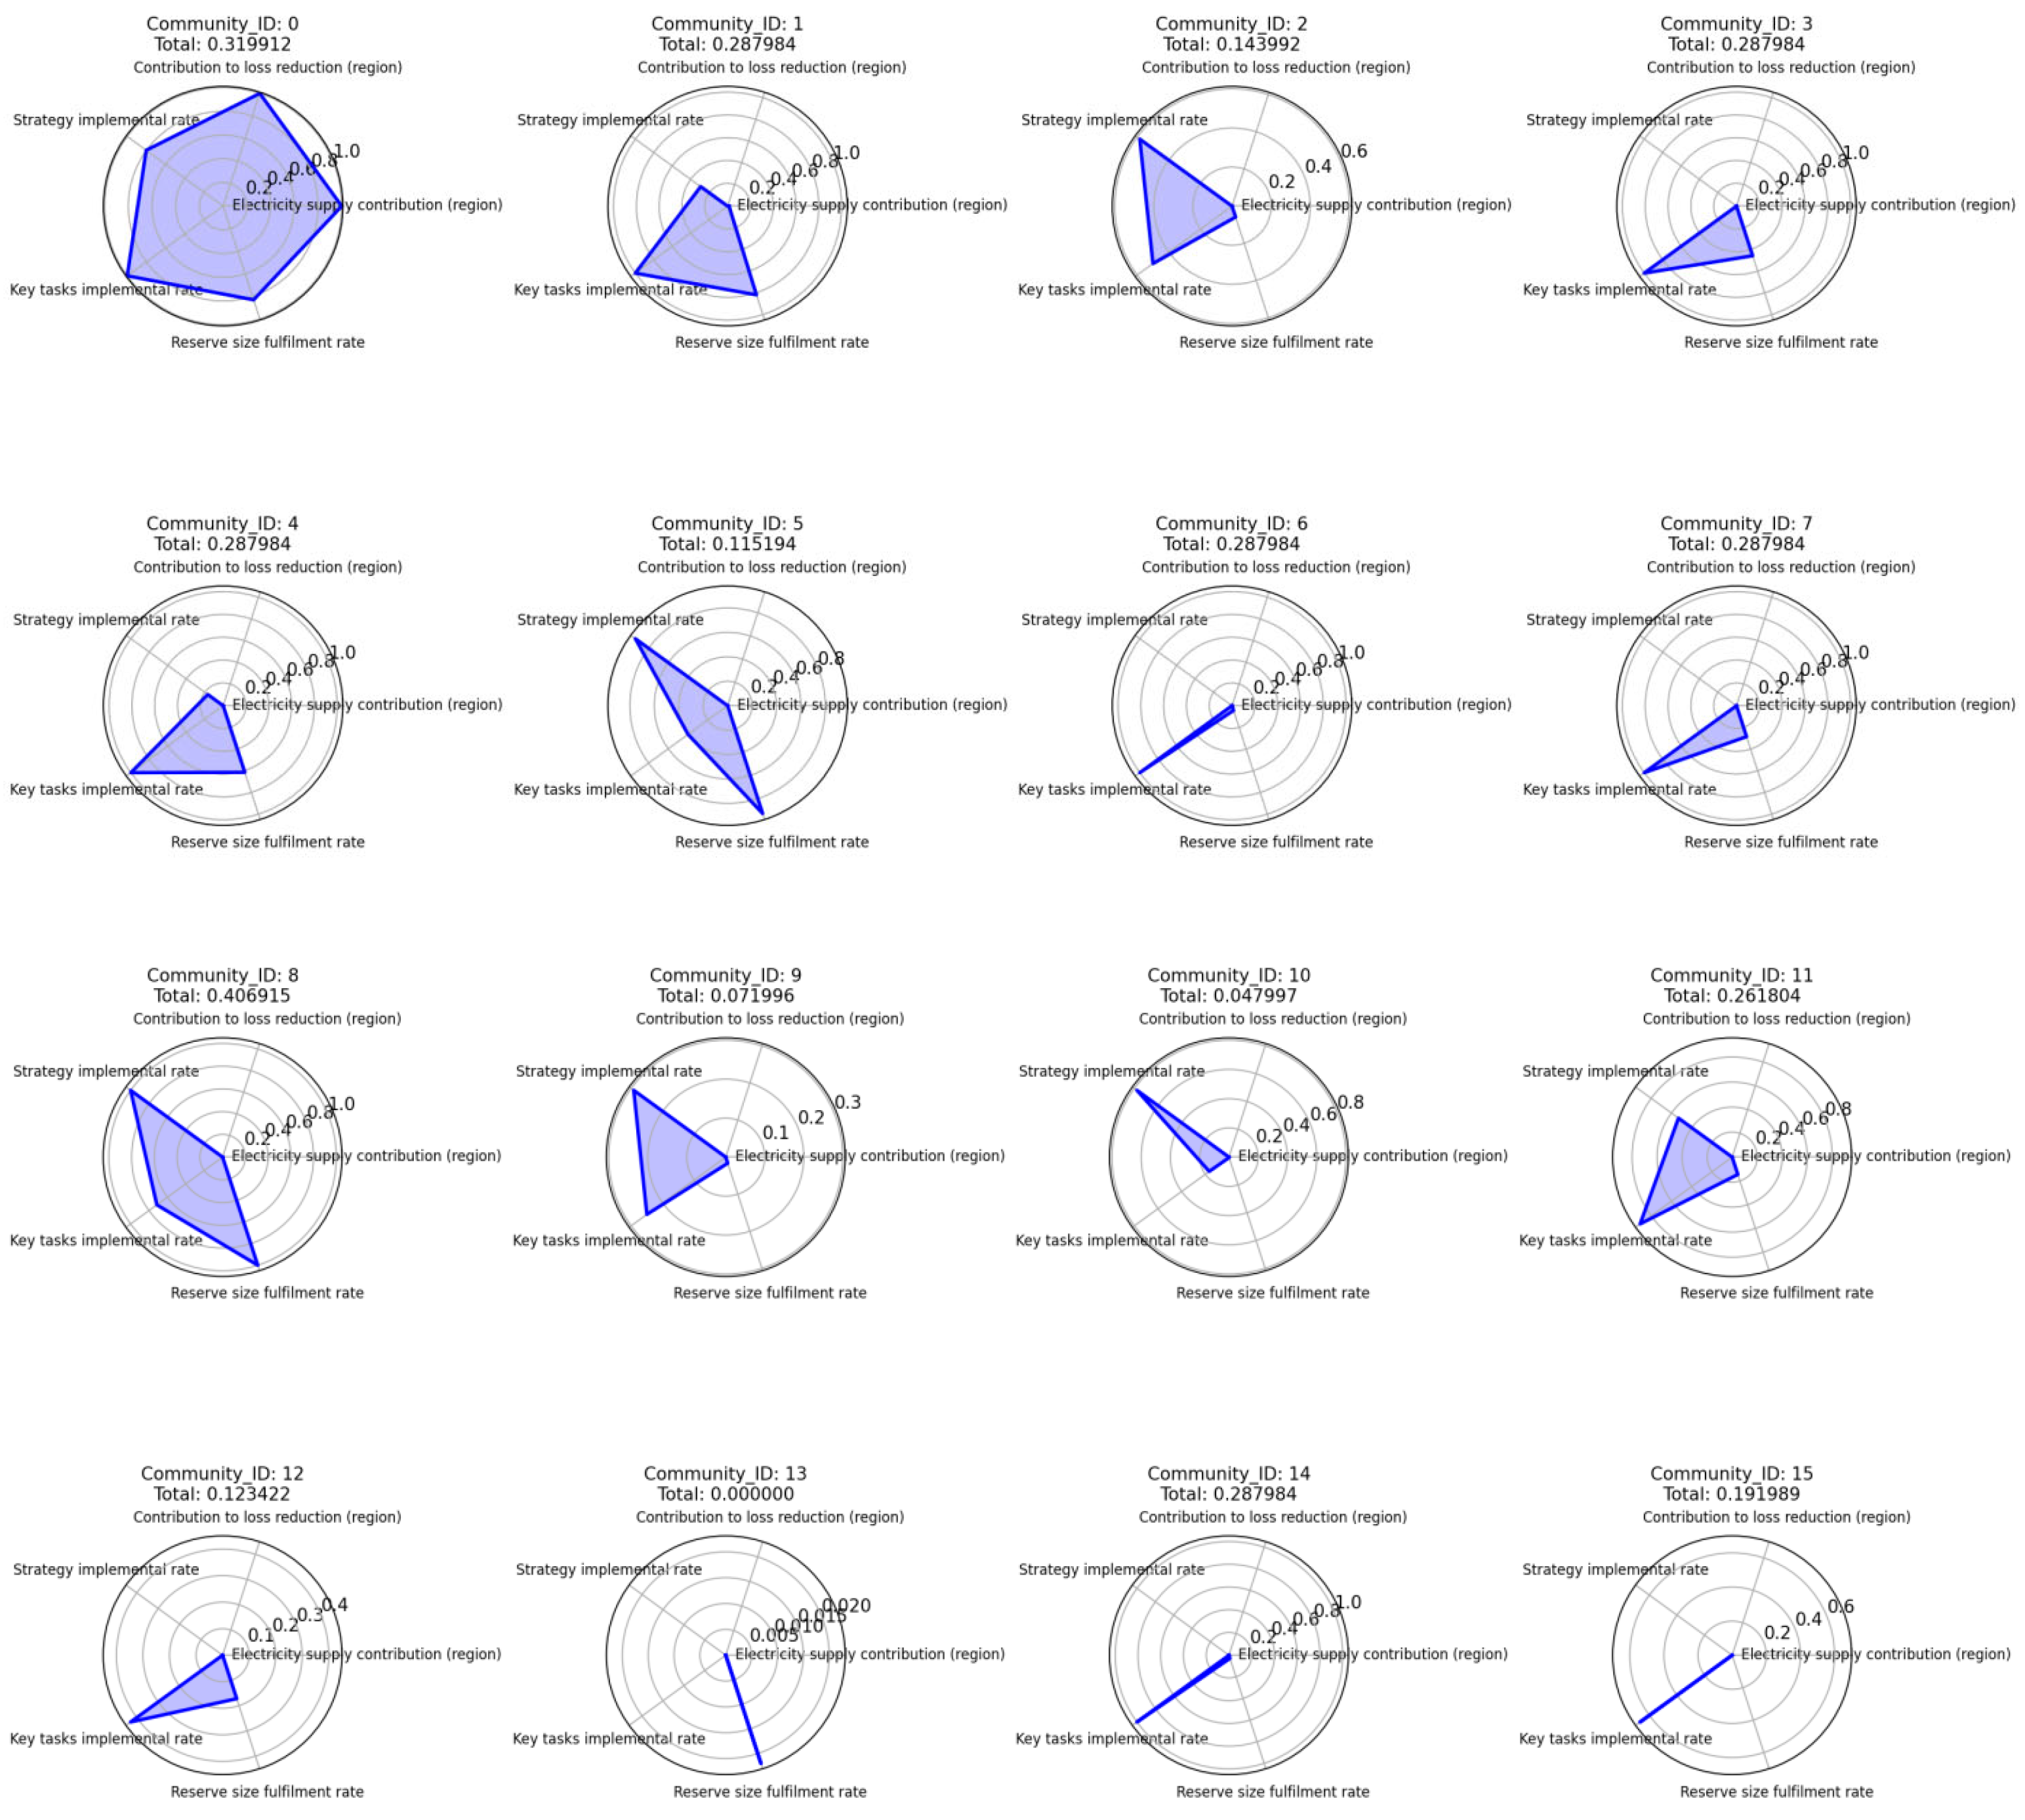
By combining the indicator data and their weights, we can obtain a composite score for each project cluster and its subprojects. For example, Figure 12 illustrates the combined evaluation results obtained for clusters in the same category.
Based on the comprehensive scores of the project clusters and their subprojects, we adjusted the project configuration in Table 3 again and took the independent individual projects into account so that we could obtain the final reserve project configuration, as shown in Table 5. The individual projects without “Community IDs” are independent individual projects.
In summary, we used mathematical formulas combined with Python (python 3.10) algorithms to create a network of multidimensional relationships between internship projects based on strategy, geography, and semantics. We then used community detection algorithms to identify comprehensive project clusters through network integration, obtaining project portfolio results and structural characteristics. Based on this, we used multidimensional evaluation indicators and historical classification characteristics as the input to a random forest algorithm in order to optimize the project configuration and achieve the optimal project management layout.
After verification, the project configuration results of this method, prioritizing the cluster perspective, effectively screened for the optimal project cluster, mainly reflected in the optimal cluster feature score and benefit score. For example, in cluster 1, project 114 is the project that provides the optimal benefit, and other projects also rank among the top projects in the sample. However, when looking at individual projects from a cluster perspective, there are cases where projects with poor performance are given higher priority within the cluster but are often placed at the bottom of the cluster’s internal configuration, such as projects 54 and 55 in cluster 8. This result is beneficial for the macro-level coordination and planning of projects and also provides decision-making references for the micro-level planning of individual projects.

5. Conclusions

In this study, a method for mining, evaluating, and configuring grid reserve project clusters is proposed on the basis of complex network theory and multidimensional metric analysis techniques. This method contributes a set of systematic methodologies for performing management and investment decision-making in the grid project reserve phase, improving the scientific rigor and precision of the grid project reserve phase and supporting the optimization of both management and investment efficiency.
However, limitations remain. The data used in this research suffers from a small sample size and an uneven distribution of positive and negative samples, which can lead to limited accuracy when allocating the weights of evaluation indices. The data collection and processing procedures must be further optimized to increase the diversity and representativeness of the samples. In addition, a bias is present in the dimensions of the project association network and the project evaluation system, which ensures a good fit with the actual business; however, their comprehensiveness needs to be further improved.
To address these limitations, in the future, we will expand the sample size and optimize the sample layout to balance the distributions of positive and negative samples, thus improving the accuracy of the weights allocated to the evaluation indicators. We will also extend the cutoff dimensions of the project linkage and evaluation stages to reflect the complexity of the project clusters in a more comprehensive way and increase the applicability and universality of the developed methodology.

Author Contributions

Conceptualization, S.C. and M.L.; methodology, S.C., M.L. and W.M.; software, S.C.; validation, S.C., W.M. and H.Z.; formal analysis, X.J.; investigation, X.J. and M.L.; resources, M.L. and X.J.; data curation, S.C. and H.Z.; writing—original draft preparation, S.C.; writing—review and editing, S.C. and W.M.; visualization, S.C. and W.M.; supervision, M.L. and X.J.; project administration, M.L. and X.J.; funding acquisition, M.L. All authors have read and agreed to the published version of the manuscript.

Funding

This work and the APC was supported by State Grid Xinjiang Electric Power Technology Project Fund (State Grid Xinjiang Electric Power Technology Project ID: B330JY250006; Project Name: Research on the Relationship between Strategic Planning Project Plan Value Decomposition Mechanism and Project Time Space Topology under the Background of New Power System).

Data Availability Statement

The datasets presented in this article are not readily available because industry confidentiality requirements.

Conflicts of Interest

Author Xianing Jin was employed by the company State Grid Economic and Technological Research Institute Co., Ltd. The remaining authors declare that the research was conducted in the absence of any commercial or financial relationships that could be construed as a potential conflict of interest.

Appendix A

This section provides a detailed introduction to each indicator in Table 1, clarifying the project evaluation indicator system applied in this paper.
(1) Increase in the electricity supply per unit of investment
This indicator reflects the level of incremental power supply benefits brought about by a single project unit investment and is calculated mainly by applying the budgeted incremental power supply De and the total project investment IT after the project is put into operation:
B 1 = D e / I T
(2) Decrease in the loss per unit of investment
This indicator is used to explain the level of loss reduction achieved per unit of investment in the project, the main parameters of which are the expected loss reduction rate Le and the total investment in the project IT:
B 2 = L e / I T
(3) Variance in the total investment benefits
Through the two aspects of the power supply and loss reduction, the investment efficiency level of a project is reflected by the comprehensive nature of the economic benefits of individual projects:
B 3 = i = 1 2 B i B i S
(4) Unit cost per unit of capacity
The unit cost of an individual project is calculated using the energy storage capacity Ce:
C 1 = I T / C e
(5) Unit cost per unit of capacity
This metric reflects the construction/rehabilitation funds spent per unit length of the line involved in an individual project, with the main parameter L being the length of the line:
C 2 = I T / L
(6) Equipment cost reasonableness
This indicator mainly examines the reasonableness of the investment in the equipment of individual projects, and the main parameter S is the general level of equipment investment corresponding to each category, which is used to assess the cost of investment in project equipment IE:
C 3 = I E / I T S
(7) Variance in the total investment costs
This metric is used to assess the reasonableness of the total investment scale of individual projects, and the main parameter IS is the general level of total investment corresponding to each category:
C 4 = I T I S
(8) Adoption of innovative equipment
The innovative dimension indicator I1, which judges whether an individual project uses innovative equipment, is Boolean and takes a value of 1 for adoption and 0 for nonadoption. The innovativeness of equipment is judged by the internal innovative equipment catalog file of the grid enterprise.
(9) Adoption of innovative equipment
Grid projects are often large in scale and involve many devices. This indicator is used to further assess the proportion of innovative equipment used in individual projects on the basis of I1. The parameters for the calculation step include the total number of pieces of equipment in the project NE and the number of innovative pieces of equipment NI:
I 2 = N I / N E
(10) Funding for equipment
This indicator is intended to capture the extent of funding for innovative research and the development of equipment for individual projects and is characterized by an indirect mapping of the equipment investment IE due to data availability limitations:
I 3 = I E
(11) Amount of literature related to equipment
For the innovative devices that are mainly used in individual projects, the number of documents related to them, NL, is applied to illustrate their specific level of innovation. NL is derived mainly from data crawling:
I 4 = N L
(12) Number of patents related to equipment
Similarly, this indicator applies the number of relevant patents NP to indicate the level of device innovation:
I 5 = N P
(13) Whether it is a strategic project
This Boolean indicator T1 is used to judge whether a project is a strategic task related to the grid, which earns a value of 1, and the value is 0 otherwise.
(14) Availability of strategic planning
This metric builds on T1 to determine whether the target project can fulfill its mandate within the planning period of the corresponding strategy. It is a Boolean variable and can take a value of 1 or 0.
(15) Historical maintenance rate of equipment
This metric is used to assess the stability of individual projects by cutting through the equipment perspective and applying the historical number of repairs Nr and the number of applications Na of the major project equipment to calculate its historical repair rate:
S 1 = N r / N a
(16) Electricity supply contribution (region)
For the economic assessment indicators of project clusters, the combined contribution of the project clusters to the increase in electricity supply to the region is calculated by adapting the geographic linkage dimension:
B 1 C = ( D e / D r ) N c
where Dr is the amount of electricity supplied in the previous period in the area of the single projects within the cluster and Nc is the number of projects within the cluster.
(17) Contribution to the loss reduction (region)
Similarly, this indicator assesses the regional loss reduction contributions of project clusters. In the formula, Lr is the regional line loss rate corresponding to single projects within the cluster for the prior period:
B 2 C = ( L e / L r ) N c
(18) Strategy implementation rate
Ns, the number of strategic projects in the cluster, is applied to assess the implementation of the strategy in the project cluster:
T 1 C = N s N c
(19) Key task implementation rate
This metric calculates the number of priority-direction projects Nk within the cluster based on the priority-direction labeling system of the grid enterprise and evaluates the implementation rate of the priority direction of the project cluster:
T 2 C = N k N c
(20) Reserve size fulfillment rate
For the objective of optimizing the effectiveness of the investment, the investment scaling implementation rate of the project clusters is evaluated:
T 3 C = I c I t
Ic is the number of strategic mission items contained in the cluster. It represents the total amount of reserve planning performed at this stage.
For the assessment indicators of cost and variance described in the previous section, we transformed them into positive indicators by assigning them a negative sign to facilitate the allocation of subsequent indicator weights.

Appendix B

Appendix B.1

This section shows the pseudocode for the network construction and integration described in Section 4.
Table A1. Network construction and integration pseudocode.
Network Construction and Integration Pseudocode
// ======================
// SINGLE-DIMENSIONAL NETWORK CONSTRUCTION
// ======================

// MODULE 1: SEMANTIC NETWORK CONSTRUCTION
PROCEDURE build_semantic_network(csv_path, neo4j_config)
      // Input Processing
      df ← LOAD_CSV(csv_path)
      project_names ← EXTRACT_COLUMN(df, 'project_names')
      
      // Text Processing
      tokenized_texts ← APPLY(jieba.cut, project_names)
      tfidf_matrix ← TFIDF_VECTORIZER(tokenized_texts)
      
      // Similarity Calculation
      similarity_matrix ← COSINE_SIMILARITY(tfidf_matrix)
      EXPORT_TO_EXCEL(similarity_matrix, 'semantic_relevance.xlsx')
      
      // Graph Construction
      WITH neo4j_driver(neo4j_config) AS driver:
            driver.EXECUTE(create_nodes, df)
            driver.EXECUTE(create_relationships, similarity_matrix, threshold=0.4)
END PROCEDURE

// MODULE 2: GEOGRAPHIC NETWORK CONSTRUCTION
PROCEDURE build_geographic_network(csv_path, neo4j_config)
      // Data Loading
      df ← LOAD_CSV(csv_path)
      projects ← EXTRACT_COLUMN(df, 'project_names')
      addresses ← EXTRACT_COLUMN(df, 'addresses')
      
      // Geocoding
      coordinates ← MAP(geocode, addresses)
      
      // Distance Calculation
      distance_matrix ← PAIRWISE(haversine_distance, coordinates)
      normalized_distances ← NORMALIZE(distance_matrix)
      relevance_matrix ← APPLY(exp(-x), normalized_distances)
      
      // Graph Construction
      WITH neo4j_driver(neo4j_config) AS driver:
            driver.EXECUTE(create_nodes, df)
            driver.EXECUTE(create_relationships, relevance_matrix, threshold=0.96)
END PROCEDURE

// MODULE 3: STRATEGIC NETWORK CONSTRUCTION
PROCEDURE build_strategic_network(projects_csv, keywords_csv, neo4j_config)
      // Data Preparation
      projects_df ← LOAD_CSV(projects_csv)
      keywords ← LOAD_CSV(keywords_csv)
      
      // Feature Engineering
      tokenized_docs ← APPLY(jieba.cut, projects_df['construction_objectives'])
      tfidf_matrix, vectorizer ← TFIDF_VECTORIZER(tokenized_docs)
      
      // Strategic Relevance
      keyword_similarity ← COSINE_SIMILARITY(tfidf_matrix, vectorizer.transform(keywords))
      strategic_similarity ← MATRIX_PRODUCT(keyword_similarity, keyword_similarity.T)
      
      // Graph Construction
      WITH neo4j_driver(neo4j_config) AS driver:
            driver.EXECUTE(create_nodes, projects_df)
            driver.EXECUTE(create_relationships, strategic_similarity)
END PROCEDURE

// MODULE 4: NETWORK FUSION & COMMUNITY DETECTION
PROCEDURE fused_community_detection(semantic_matrix, geo_matrix, strategic_matrix, num_communities)
      // Tensor Initialization
      M_sem ← LOAD_MATRIX(semantic_matrix)
      M_geo ← LOAD_MATRIX(geo_matrix)
      M_str ← LOAD_MATRIX(strategic_matrix)
      
      // Fusion Model
      w_f ← LEARNABLE_PARAMETER(0.3, bounds=[0.2,0.4])
      
      // Optimization Loop
      FOR epoch IN 1..100:
            // Network Fusion
            fused_adj ← FUSION_FORMULA(M_sem, M_geo, M_str, w_f)
            
            // Community Detection
            graph ← CREATE_GRAPH(fused_adj)
            communities ← DETECT_COMMUNITIES(graph, num_communities)
            
            // Quality Metrics
            modularity ← CALCULATE_MODULARITY(graph, communities)
            conductance ← CALCULATE_CONDUCTANCE(graph, communities)
            
            // Parameter Update
            LOSS ← -modularity + conductance
            UPDATE(w_f, LOSS)
      
      RETURN w_f, communities
END PROCEDURE

// ======================
// SUPPORTING FUNCTIONS
// ======================

FUNCTION create_nodes(tx, df):
      FOR i, (name, category, label) IN ENUMERATE(df):
            translated ← TRANSLATE([name, category, label])
            NODE_TYPE ← CASE category:
                  'grid_Infrastructure' → 'Grid_Infrastructure'
                  'production_technology_improvement' → 'Tech_Upgrade'
                  'grid_digitization' → 'Grid_Digitization'
            tx.RUN("CREATE (n:{NODE_TYPE} {id: $id, name: $name, ...})", translated)

FUNCTION create_relationships(tx, matrix, threshold):
      FOR i,j IN MATRIX_INDICES(matrix):
            IF matrix[i,j] > threshold AND i < j:
                  tx.RUN("""
                        MATCH (a), (b)
                        WHERE a.id = $src AND b.id = $dst
                        CREATE (a)-[:REL_TYPE {weight: $w}]->(b)
                        """, params)

FUNCTION fusion_formula(M1, M2, M3, alpha):
      // Implements the conditional fusion logic
      RETURN FUSED_MATRIX

Appendix B.2

This appendix provides the code discovered by the project cluster to supplement the experimental details.
Table A2. Project cluster detection and evaluation pseudocode.
Project Cluster Detection and Evaluation Pseudocode
// =============================================
// COMMUNITY ANALYSIS MODULE - PSEUDOCODE
// =============================================

// DATA LOADING PROCEDURE
PROCEDURE load_data(adjacency_csv, community_csv)
      TRY:
            // Load and validate adjacency matrix
            adj_df ← READ_CSV(adjacency_csv, index_col=0)
            IF HAS_MISSING_VALUES(adj_df.values):
                  RAISE ERROR("Missing values detected")
            IF NOT IS_NUMERIC(adj_df.values):
                  RAISE ERROR("Non-numeric data found")
            
            // Load community assignments
            comm_df ← READ_CSV(community_csv)
            communities ← GROUP_BY(comm_df, "Community")["NodeID"].AGGREGATE(list)
            
            RETURN adj_df.values, communities
      EXCEPT ERROR AS e:
            LOG_ERROR(e)
            TERMINATE
END PROCEDURE

// NETWORK METRICS CALCULATION
FUNCTION calculate_modularity(graph G, community_list C)
      m ← NUMBER_OF_EDGES(G)
      Q ← 0
      
      FOR EACH community IN C:
            subG ← INDUCED_SUBGRAPH(G, community)
            e ← NUMBER_OF_EDGES(subG)
            total_degree ← SUM(DEGREE(G, node) FOR node IN community)
            s ← total_degree / (2*m)
            Q ← Q + (e/m) - s^2
      
      RETURN Q
END FUNCTION

FUNCTION calculate_conductance(graph G, community_list C)
      conductance_values ← []
      
      FOR EACH community IN C:
            subG ← INDUCED_SUBGRAPH(G, community)
            internal_edges ← NUMBER_OF_EDGES(subG)
            boundary_edges ← SUM(DEGREE(G, node) FOR node IN community) - 2*internal_edges
            
            denominator ← MIN(2*internal_edges, boundary_edges)
            IF denominator == 0:
                  conductance ← 0.0
            ELSE:
                  conductance ← boundary_edges / denominator
            
            APPEND(conductance_values, conductance)
      
      RETURN conductance_values
END FUNCTION

// COMMUNITY STRUCTURE ANALYSIS
FUNCTION analyze_community_structure(community_list C)
      sizes ← [LENGTH(comm) FOR comm IN C]
      balance ← STANDARD_DEVIATION(sizes) / MEAN(sizes)
      RETURN sizes, balance
END FUNCTION

FUNCTION compute_centrality_metrics(graph G, community_list C)
      degree_cent ← DEGREE_CENTRALITY(G)
      betweenness_cent ← BETWEENNESS_CENTRALITY(G)
      
      centrality_results ← NEW_DICTIONARY()
      
      FOR i, comm IN ENUMERATE(C):
            centrality_results[i] ← NEW_DICTIONARY()
            FOR node IN comm:
                  centrality_results[i][node] ← {
                        "degree": degree_cent[node],
                        "betweenness": betweenness_cent[node]
                  }
      
      RETURN centrality_results
END FUNCTION

// MAIN ANALYSIS WORKFLOW
PROCEDURE main(adjacency_file, community_file, output_file)
      // Data ingestion
      adj_matrix, communities ← load_data(adjacency_file, community_file)
      G ← CONVERT_TO_GRAPH(adj_matrix)
      
      // Metric computation
      modularity ← calculate_modularity(G, communities)
      conductance ← calculate_conductance(G, communities)
      sizes, balance ← analyze_community_structure(communities)
      centralities ← compute_centrality_metrics(G, communities)
      
      // Results compilation
      results ← []
      FOR i, comm IN ENUMERATE(communities):
            results.APPEND({
                  "CommunityID": i+1,
                  "Size": LENGTH(comm),
                  "Conductance": conductance[i],
                  "ModularityContribution": (LENGTH(comm)/NUMBER_OF_NODES(G)) * modularity,
                  "Nodes": comm,
                  "Centralities": centralities[i]
            })
      
      // Output generation
      results_df ← CREATE_DATAFRAME(results)
      results_df["OverallModularity"] ← modularity
      results_df["CommunityBalance"] ← balance
      EXPORT_TO_CSV(results_df, output_file)
END PROCEDURE

// EXECUTION EXAMPLE
IF RUN_AS_MAIN_PROGRAM:
      adj_path ← "path/to/adjacency_matrix.csv"
      comm_path ← "path/to/community_assignments.csv"
      out_path ← "path/to/output_analysis.csv"
      
      main(adj_path, comm_path, out_path)
END IF

References

  1. Seager, G.C. The planning of key fundamentals used in the development of a beneficial project plan. J. Contemp. Manag. 2005, 2, 114–127. [Google Scholar]
  2. Al-Sumaiti, A.S.; Salama, M.M.A.; Konda, S.R.; Kavousi-Fard, A. A Guided Procedure for Governance Institutions to Regulate Funding Requirements of Solar PV Projects. IEEE Access 2019, 7, 54203–54217. [Google Scholar] [CrossRef]
  3. Xie, H.; Jiang, M.; Zhang, D.; Goh, H.H.; Ahmad, T.; Liu, H.; Liu, T.; Wang, S.; Wu, T. IntelliSense technology in the new power systems. Renew. Sustain. Energy Rev. 2023, 177, 113229. [Google Scholar] [CrossRef]
  4. Heymann, F.; Milojevic, T.; Covatariu, A.; Verma, P. Digitalization in decarbonizing electricity systems-Phenomena, regional aspects, stakeholders, use cases, challenges and policy options. Energy 2023, 262, 125521. [Google Scholar] [CrossRef]
  5. Haque, K.; Mishra, S.; Golias, M.M. Multi-period transportation network investment decision making and policy implications using econometric framework. Res. Transp. Econ. 2021, 89, 101109. [Google Scholar] [CrossRef]
  6. Zwikael, O.; Meredith, J. Evaluating the Success of a Project and the Performance of Its Leaders. IEEE Trans. Eng. Manag. 2021, 68, 1745–1757. [Google Scholar] [CrossRef]
  7. Shen, Z.; Li, X. An extended model of dynamic project portfolio selection problem considering synergies between projects. Comput. Ind. Eng. 2023, 179, 109175. [Google Scholar] [CrossRef]
  8. Bob-Milliar, G.K.; Alagidede, I.P. Fragmentation of Projects and the Symbolism of Development Aid in Northern Ghana. Voluntas 2024, 35, 1143–1153. [Google Scholar] [CrossRef]
  9. Carminati, L.; Pirola, F.; Lagorio, A.; Cimini, C.; Jurczuk, A.; Boucher, X. Skills, Technical and Organizational Support Needed for Collaborative Networks 5.0. In Navigating Unpredictability: Collaborative Networks in Non-Linear Worlds; Springer International Publishing Ag: Cham, Switzerland, 2024; Volume 726, pp. 380–396. [Google Scholar]
  10. Killen, C.P.; Kjaer, C. Understanding project interdependencies: The role of visual representation, culture and process. Int. J. Proj. Manag. 2012, 30, 554–566. [Google Scholar] [CrossRef]
  11. Benissa, T.; Patil, A. Drivers for Clustering and Inter-Project Collaboration—A Case of Horizon Europe Projects. Adm. Sci. 2024, 14, 104. [Google Scholar] [CrossRef]
  12. Martinsuo, M. Project portfolio management in practice and in context. Int. J. Proj. Manag. 2013, 31, 794–803. [Google Scholar] [CrossRef]
  13. Davis, K. Different stakeholder groups and their perceptions of project success. Int. J. Proj. Manag. 2014, 32, 189–201. [Google Scholar] [CrossRef]
  14. Kudratova, S.; Huang, X.; Kudratov, K.; Qudratov, S. Corporate sustainability and stakeholder value trade-offs in project selection through optimization modeling: Application of investment banking. Corp. Soc. Responsib. Environ. Manag. 2020, 27, 815–824. [Google Scholar] [CrossRef]
  15. Harrison, K.R.; Elsayed, S.M.; Weir, T.; Garanovich, I.L.; Boswell, S.G.; Sarker, R.A. A Novel Multi-Objective Project Portfolio Selection and Scheduling Problem. In Proceedings of the 2022 IEEE Symposium Series on Computational Intelligence 2022, Singapore, 4–7 December 2022; pp. 480–487. [Google Scholar]
  16. Zhai, S.-L.; Wu, X.-L.; Wang, S.-Y.; Zhao, T. Application of Interaction Effect Multichoice Goal Programming in Project Portfolio Analysis. Math. Probl. Eng. 2021, 2021, 1863632. [Google Scholar] [CrossRef]
  17. Bai, L.; Bai, J.; An, M. A methodology for strategy-oriented project portfolio selection taking dynamic synergy into considerations. Alex. Eng. J. 2022, 61, 6357–6369. [Google Scholar] [CrossRef]
  18. Loperfido, N.; Shushi, T. Optimal Portfolio Projections for Skew-Elliptically Distributed Portfolio Returns. J. Optim. Theory Appl. 2023, 199, 143–166. [Google Scholar] [CrossRef]
  19. Lukas, C.; Neubert, M.-F.; Schöndube, J.R. Exploring decision-making: Experimental observations on project selection and the impact of justification pressure. J. Manag. Gov. 2024, 29, 735–775. [Google Scholar] [CrossRef]
  20. Olgun, N.; Ozkaynak, E. A novel approach to detecting epileptic patients: Complex network-based EEG classification. J. Complex Netw. 2024, 12, cnae044. [Google Scholar] [CrossRef]
  21. Wang, X. What can we learn from multimorbidity? A deep dive from its risk patterns to the corresponding patient profiles. Decis. Support Syst. 2024, 186, 114313. [Google Scholar] [CrossRef]
  22. Moussa, A.; El-Dakhakhni, W. Managing Interdependence-Induced Systemic Risks in Infrastructure Projects. J. Manag. Eng. 2022, 38, 04022048. [Google Scholar] [CrossRef]
  23. Feng, J.R.; Zhao, M.; Yu, G.; Zhang, J.; Lu, S. Dynamic risk analysis of accidents chain and system protection strategy based on complex network and node structure importance. Reliab. Eng. Syst. Saf. 2023, 238, 109413. [Google Scholar] [CrossRef]
  24. Li, X.; Ning, X.; Ma, J.; Han, Z. Investigating the Evolution Path of Urban Natural Gas Pipeline Accidents Using a Complex Network Approach. Asce-Asme J. Risk Uncertain. Eng. Syst. Part A-Civ. Eng. 2024, 10, 06024005. [Google Scholar] [CrossRef]
  25. Lan, Z.; Chen, X.; Liu, Y.; Chen, D.; Li, W. Complex Network Construction and Pattern Recognition of China’s Provincial Low-Carbon Economic Development with Long Time Series: Based on the Detailed Spatial Relationship. Pol. J. Environ. Stud. 2022, 31, 2131–2148. [Google Scholar] [CrossRef]
  26. Huang, X.; Liu, X. The time-frequency evolution of multidimensional relations between global oil prices and China’s general price level. Energy 2022, 244, 122579. [Google Scholar] [CrossRef]
  27. Jiang, X.; Xie, Y. Investigation of Urban–Canal–Rural Integration Characteristics Based on Multidimensional Connectivity Network Analysis: A Case Study of the Canal in Jiangsu Province, China. J. Urban Plan. Dev. 2024, 150, 04024049. [Google Scholar] [CrossRef]
  28. Ding, J.; Zheng, Y.; Wang, H.; Cannistraci, C.V.; Gao, J.; Li, Y.; Shi, C. Artificial Intelligence for Complex Network: Potential, Methodology and Application. In Companion Proceedings of the ACM on Web Conference 2025; Association for Computing Machinery: New York, NY, USA, 2024; pp. 5–8. [Google Scholar]
  29. Peng, N.; Zhu, X.; Liu, Y.; Nie, B.; Cui, Y.; Geng, Q.; Yu, C. Complex network dynamics of the topological structure in a geochemical field from the Nanling area in South China. Sci. Rep. 2020, 10, 19826. [Google Scholar] [CrossRef]
  30. Wang, J.; Zhang, Y.-J.; Xu, C.; Li, J.; Sun, J.; Xie, J.; Feng, L.; Zhou, T.; Hu, Y. Reconstructing the evolution history of networked complex systems. Nat. Commun. 2024, 15, 2849. [Google Scholar] [CrossRef]
  31. Li, J.; Lai, S.; Shuai, Z.; Tan, Y.; Jia, Y.; Yu, M.; Song, Z.; Peng, X.; Xu, Z.; Ni, Y.; et al. A comprehensive review of community detection in graphs. Neurocomputing 2024, 600, 128169. [Google Scholar] [CrossRef]
  32. Girvan, M.; Newman, M.E.J. Community structure in social and biological networks. Proc. Natl. Acad. Sci. USA 2002, 99, 7821–7826. [Google Scholar] [CrossRef] [PubMed]
  33. Zarezade, M.; Nourani, E.; Bouyer, A. Community Detection using a New Node Scoring and Synchronous Label Updating of Boundary Nodes in Social Networks. J. Ai Data Min. 2020, 8, 201–212. [Google Scholar]
  34. Zhang, W.; Shang, R.; Jiao, L. Large-scale community detection based on core node and layer-by-layer label propagation. Inf. Sci. 2023, 632, 1–18. [Google Scholar] [CrossRef]
  35. Yao, J.; Liu, B. Community-Detection Method of Complex Network Based on Node Influence Analysis. Symmetry 2024, 16, 754. [Google Scholar] [CrossRef]
  36. Zhao, Z.; Zhang, N.; Xie, J.; Hu, A.; Liu, X.; Yan, R.; Wan, L.; Sun, Y. Detecting network communities based on central node selection and expansion. Chaos Solitons Fractals 2024, 188, 115482. [Google Scholar] [CrossRef]
  37. Sheykhzadeh, J.; Zarei, B.; Soleimanian Gharehchopogh, F. Community Detection in Social Networks Using a Local Approach Based on Node Ranking. IEEE Access 2024, 12, 92892–92905. [Google Scholar] [CrossRef]
  38. Zhang, B.; Mi, Y.; Zhang, L.; Zhang, Y.; Li, M.; Zhai, Q.; Li, M. Dynamic Community Detection Method of a Social Network Based on Node Embedding Representation. Mathematics 2022, 10, 4738. [Google Scholar] [CrossRef]
  39. Jeon, H.; Ko, H.-K.; Jo, J.; Kim, Y.; Seo, J. Measuring and Explaining the Inter-Cluster Reliability of Multidimensional Projections. IEEE Trans. Vis. Comput. Graph. 2022, 28, 551–561. [Google Scholar] [CrossRef]
  40. Ni, L.; Xu, H.; Zhang, Y.; Luo, W. Spatial-Aware Local Community Detection Guided by Dominance Relation. IEEE Trans. Comput. Soc. Syst. 2023, 10, 686–699. [Google Scholar] [CrossRef]
  41. Ni, L.; Li, Q.; Zhang, Y.; Luo, W.; Sheng, V.S. LSADEN: Local Spatial-Aware Community Detection in Evolving Geo-Social Networks. IEEE Trans. Knowl. Data Eng. 2024, 36, 3265–3280. [Google Scholar] [CrossRef]
  42. Akachar, E.; Bougteb, Y.; Ouhbi, B.; Frikh, B. LeaDCD: Leadership concept-based method for community detection in social networks. Inf. Sci. 2025, 686, 121341. [Google Scholar] [CrossRef]
  43. Wu, X.; Teng, D.; Zhang, H.; Hu, J.; Quan, Y.; Miao, Q.; Sun, P.G. Graph reconstruction and attraction method for community detection. Appl. Intell. 2025, 55, 357. [Google Scholar] [CrossRef]
  44. Mohagheghi, V.; Mousavi, S.M. A new multi-period optimization model for resilient-sustainable project portfolio evaluation under interval-valued Pythagorean fuzzy sets with a case study. Int. J. Mach. Learn. Cybern. 2021, 12, 3541–3560. [Google Scholar] [CrossRef]
  45. Zarjou, M.; Khalilzadeh, M. Optimal project portfolio selection with reinvestment strategy considering sustainability in an uncertain environment: A multi-objective optimization approach. Kybernetes 2022, 51, 2437–2460. [Google Scholar] [CrossRef]
  46. Alexandrova, M. Evaluation of Project Portfolio Management Performance: Long and Short-Term Perspective. Hradec Econ. Days 2021, 11, 11–21. [Google Scholar]
  47. Bai, L.; Qu, X.; Liu, J.; Han, X. Analysis of factors influencing project portfolio benefits with synergy considerations. Eng. Constr. Archit. Manag. 2023, 30, 2691–2715. [Google Scholar] [CrossRef]
  48. Zaidouni, A.; Idrissi, M.A.J.; Bellabdaoui, A. Towards a Methodological Approach for Intelligent IS/IT Project Portfolio Dashboard. In International Conference on Digital Technologies and Applications; Springer Nature: Cham, Switzerland, 2024; Volume 1099, pp. 326–335. [Google Scholar]
  49. Qian, L.; Dou, Y.; Gong, C.; Xu, X.; Tan, Y. Project Group Program Generation and Decision Making Method Integrating Coupling Network and Hesitant Fuzzy. Mathematics 2023, 11, 4010. [Google Scholar] [CrossRef]
  50. ForouzeshNejad, A. A hybrid data-driven model for project portfolio selection problem based on sustainability and strategic dimensions: A case study of the telecommunication industry. Soft Comput. 2023, 28, 2409–2429. [Google Scholar] [CrossRef]
  51. Han, R.; Li, X.; Shen, Z.; Jia, D. A framework of robust project portfolio selection problem under strategic objectives considering the risk propagation. Eng. Constr. Archit. Manag. 2023, 31, 4872–4896. [Google Scholar] [CrossRef]
  52. Pinones, P.; Derpich, I.; Venegas, R. Circular Economy 4.0 Evaluation Model for Urban Road Infrastructure Projects, Ciroad. Sustainability 2023, 15, 3205. [Google Scholar] [CrossRef]
  53. Pilat, D.; Jecmen, K.; Teichmann, D.; Mertlova, O. Transport Infrastructure Investment Project Portfolio Optimization Using a Cascade Approach to Solving the Min-Max Problem. In Proceedings of the 40th International Conference Mathematical Methods in Economics 2022, Jihlava, Czech Republic, 7–9 September 2022; pp. 280–285. [Google Scholar]
  54. Ramedani, A.M.; Mehrabian, A.; Didehkhani, H. A two-stage sustainable uncertain multi-objective portfolio selection and scheduling considering conflicting criteria. Eng. Appl. Artif. Intell. 2024, 132, 107942. [Google Scholar] [CrossRef]
  55. Blondel, V.D.; Guillaume, J.-L.; Lambiotte, R.; Lefebvre, E. Fast unfolding of communities in large networks. J. Stat. Mech.-Theory Exp. 2008, 10, P10008. [Google Scholar] [CrossRef]
  56. Leskovec, J.; Lang, K.J.; Mahoney, M.W. Empirical comparison of algorithms for network community detection. arXiv 2010, arXiv:1004.3539. [Google Scholar] [CrossRef]
  57. LeCun, Y.; Bengio, Y.; Hinton, G. Deep learning. Nature 2015, 521, 436–444. [Google Scholar] [CrossRef] [PubMed]
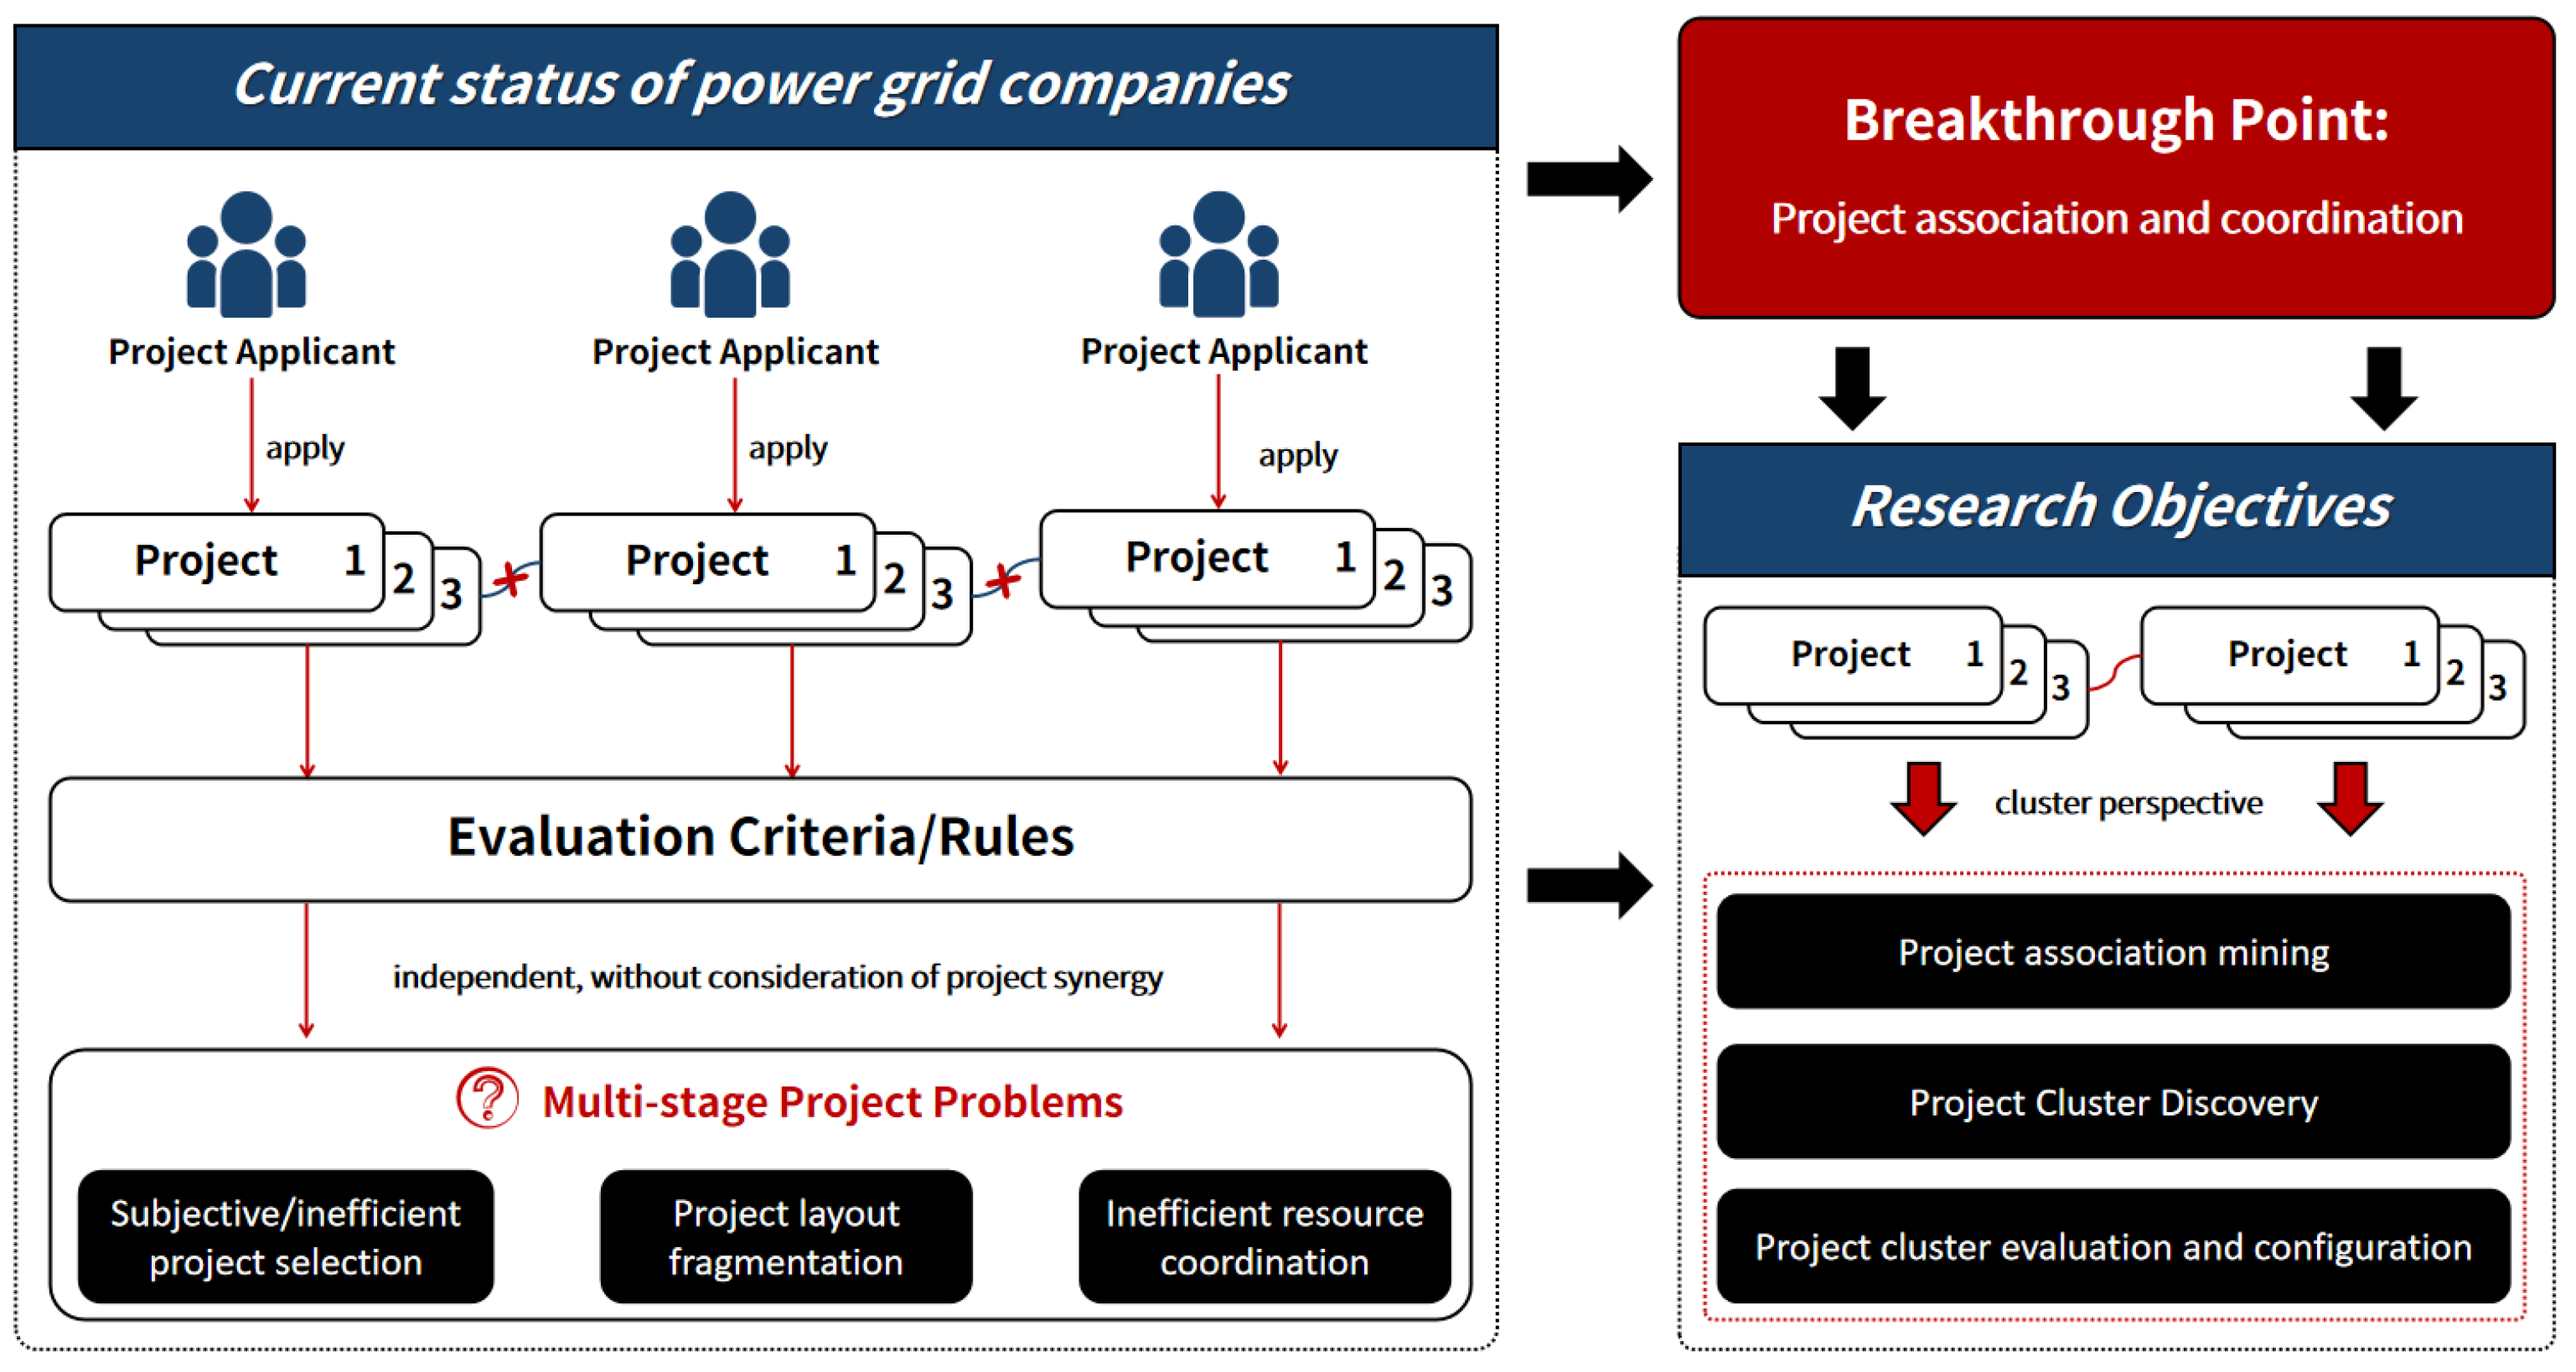
Figure 1. Research background.
Applsci 15 09166 g001
Figure 2. Visualization of the relevant literature.
Applsci 15 09166 g002
Figure 3. The proposed grid cluster management approach.
Applsci 15 09166 g003
Figure 4. Data validation conceptual diagram.
Applsci 15 09166 g004
Figure 5. Unidimensional project association network.
Applsci 15 09166 g005
Figure 6. Comparison between the correlation distributions contained in the adjacency matrix before and after performing standardization.
Applsci 15 09166 g006
Figure 7. Integrated network of multidimensional links for grid projects.
Applsci 15 09166 g007
Figure 8. Community testing results. The red rectangle indicates a single project with no cluster association.
Applsci 15 09166 g008
Figure 9. Quality assessment results obtained for project clusters.
Applsci 15 09166 g009
Figure 10. Descriptive statistical analysis of the data.
Applsci 15 09166 g010
Figure 11. Evaluation results of random forest classification models.
Applsci 15 09166 g011
Figure 12. Results of the integrated assessment of the clusters belonging to the same category.
Applsci 15 09166 g012
Table 1. Multidimensional individual and cluster evaluation system for power grid projects.
ObjectDimensionLevel-1 MetricsLevel 2-MetricsType
Single projectEconomicsBenefitIncrease in the electricity supply per unit of investmentnumeric
Decrease in the loss per unit of investmentnumeric
Variance in the total investment benefitsnumeric
CostUnit cost per unit of capacitynumeric
Unit cost per unit lengthnumeric
Equipment cost reasonablenessnumeric
Variance in the total investment costnumeric
InnovationEquipment innovationAdoption of innovative equipmentBoolean
Weight of innovative equipmentnumeric
Funding for equipmentnumeric
Amount of literature related to equipmentnumeric
Number of patents related to equipmentnumeric
TimelinessStrategic timelinessWhether it is a strategic projectBoolean
Availability of strategic planningBoolean
StabilityEquipment stabilityHistorical maintenance rate of equipmentnumeric
Project clusterEconomicsBenefitElectricity supply contribution (region)numeric
Contribution to loss reduction (region)numeric
TimelinessStrategic timelinessStrategy implementation ratenumeric
Timeliness of reserve planningKey task implementation ratenumeric
Reserve size fulfillment ratenumeric
Table 2. Project strategy glossary (partial).
Strategic Vocabulary
Project Attack
Qinghai Huatugou Tong Construction
Qinghai Huatugou
Reducing Power Losses
Aral, Bachu, and other 750 kV projects
Finance
Hami North-Chongqing UHV Tributary Supporting Power Delivery
Major scientific research project research and development
Major science and technology public relations
Table 3. Project layout for project cluster prioritization (within-category).
Community ID
(Postsorting)
Subproject ID
(Postsorting)
11(101~121)
04, (0, 6, 7, 35, 36, 38~46)
12(62, 94, 96), (59, 61, 62, 66, 67, 92, 93, 95, 97~99)
3(8, 20, 23~27)
14(68, 70~74)
12, (13, 14), 3, 12, 32, 7, 1
8(49, 52), (51, 53), 50, (54, 55)
1288, (78, 79), 58, 80, 87
434, (9~11, 33, 47, 48)
515, (16~18), 19
957, (81~83)
15(74~76)
2(84, 85)
6(21, 22)
7(30, 31)
13(64, 65)
Table 4. Project layout for project cluster prioritization adjusted based on evaluation results (within-category).
ObjectDimensionWeights (Dimensions)Level 1 MetricsWeights (Level 1)Level 2 MetricsWeights (Level 2)
Single projectEconomics0.73Benefit0.05Increase in the electricity supply per unit of investment0.02
Decrease in the loss per unit of investment0.00
Variance in the total investment benefits0.04
Cost0.68Unit cost per unit of capacity0.04
Unit cost per unit length0.18
Equipment cost reasonableness0.16
Variance in the total investment cost0.30
Innovation0.14Equipment innovation0.14Adoption of innovative equipment0.00
Weight of innovative equipment0.00
Funding for equipment0.14
Amount of literature related to equipment0.00
Number of patents related to equipment0.00
Timeliness0.06Strategic timeliness0.06Whether it is a strategic project0.05
Availability of strategic planning0.01
Stability0.07Equipment stability0.07Historical maintenance rate of equipment0.07
Project clusterEconomics0.03Benefit0.03Electricity supply contribution (region)0.02
Contribution to loss reduction (region)0.01
Timeliness0.97Strategic timeliness0.20Strategy implementation rate0.20
Timeliness of reserve planning0.77Key task implementation rate0.29
Reserve size fulfillment rate0.48
Table 5. Adjusted project layout for project cluster prioritization (within-category).
Community ID
(Postsorting)
Subproject ID
(Postsorting)
11(101~121)
04, (0, 6, 7, 35, 36, 38~46)
12(62, 94, 96), (59, 61, 62, 66, 67, 92, 93, 95, 97~99)
3(8, 20, 23~27)
14(68, 70~74)
12, (13, 14), 3, 12, 32, 7, 1
8(49, 52), (51, 53), 50, (54, 55)
1288, (78, 79), 58, 80, 87
434, (9~11, 33, 47, 48)
515, (16~18), 19
957, (81~83)
15(74~76)
2(84, 85)
6(21, 22)
7(30, 31)
13(64, 65)
Disclaimer/Publisher’s Note: The statements, opinions and data contained in all publications are solely those of the individual author(s) and contributor(s) and not of MDPI and/or the editor(s). MDPI and/or the editor(s) disclaim responsibility for any injury to people or property resulting from any ideas, methods, instructions or products referred to in the content.