1. Introduction
The void ratio, defined as the ratio of pore volume to solid particle volume in soil (denoted by
e), serves as a fundamental index for characterizing soil structural geometry. Its magnitude directly influences critical physical and mechanical properties, including permeability, compressibility, and shear strength, which are pivotal for evaluating soil density, calculating compression coefficients, and assessing bearing capacity [
1,
2]. Consequently, this parameter is indispensable in geotechnical engineering design, geological disaster mitigation, and subsurface characterization. There are two important concepts to note: void ratio and effective void ratio. The former includes all open pores, while the latter refers only to those interconnected pores. What is studied in this paper is the total void ratio.
Quantifying in situ void ratios traditionally requires undisturbed soil sampling and laboratory testing [
3]. Techniques such as thin-walled push tubes, piston samplers, or block sampling are employed to preserve soil fabric; however, even advanced methods like controlled piston sampling struggle to eliminate disturbances during transportation, often compromising data reliability [
4,
5]. In situ testing circumvents these limitations inherently. Currently, there are numerous in situ testing methods for void ratio, including mercury intrusion porosimetry, gas adsorption, neutron method, and electrical logging. However, the pore size measurement methods are costly and complex to operate, with high requirements for equipment and testers. The electrical logging method has high environmental requirements. The piezocone penetration test (CPTu), renowned for its operational simplicity, high efficiency, and precision, has emerged as a leading method in geotechnical site investigations [
6,
7].
CPTu-derived parameters—including cone tip resistance (), sleeve friction (), and pore water pressure (u)—enable empirical estimation of in situ void ratios. Advanced systems further integrate measurements such as shear wave velocity () and resistivity, enhancing predictive capabilities. By correlating penetrometer data with fundamental soil physics, CPTu offers a non-destructive alternative to traditional sampling, facilitating rapid assessment of subsurface conditions in applications ranging from foundation design to landslide risk analysis.
Recent studies on void ratio have significantly advanced our understanding of soil behavior. The Cambridge model theoretically establishes a one-to-one correlation between void ratio (
e) and stress state in clay under specific conditions, particularly describing the relationship between normally consolidated void ratio and critical state stress [
8,
9]. However, due to inherent soil heterogeneity, direct determination of Cambridge model parameters via in situ testing remains challenging, limiting its applicability for in situ void ratio assessment. The prevailing in situ prediction approach involves constructing empirical relationships between macroscopic soil properties and void ratio through database-driven modeling. For example, researchers have developed databases to correlate void ratio with hydraulic conductivity, capitalizing on the general trend that higher porosity enhances permeability [
10]. This correlation, however, is not universal and is modulated by multiple factors. In fine-grained soils, a significant portion of pore space is occupied by bound water adsorbed on particle surfaces, creating isolated pores that do not contribute to fluid flow. Additionally, the small, densely packed pores in cohesive soils form less efficient seepage pathways compared to the larger interconnected pores in sandy soils, often leading to inverse permeability–void ratio relationships between soil types [
11]. Beyond permeability, shear wave velocity (
) and compression index (
) have also emerged as viable predictors of void ratio. Complementing these property-based methods, semi-empirical models integrating in situ test data with laboratory-measured void ratios have been developed, offering robust predictive frameworks for field applications.
In existing research, the determination of the traditional void ratio relies on undisturbed soil sampling and laboratory tests. It is prone to data distortion due to soil sample disturbance, and it is difficult to achieve efficient acquisition of continuous profiles. Meanwhile, the existing prediction models based on in situ test parameters are mostly developed for homogeneous soils, and their applicability and accuracy are limited under complex geological conditions. Especially in special regions like the Yellow River Delta, the uniqueness of the soil structure further aggravates the difficulty of accurately predicting the void ratio. Based on this, this study takes the pore pressure static penetration (CPTu) technology as the core. By establishing a semi-empirical correlation model between CPTu parameters and the void ratio and combining with regional data calibration, it aims to solve the problems of low efficiency, great influence of disturbance of traditional methods, and insufficient regional adaptability of existing models. It provides a reliable method for the in situ and efficient prediction of the soil void ratio in the study area and under similar geological conditions. Its results are helpful to improve the accuracy and economy of geotechnical engineering investigations.
2. Applicability Evaluation of Void Ratio Prediction Model
Table 1 summarizes representative empirical and semi-empirical models for void ratio prediction. While previous studies have validated the accuracy of these proposed models using robust datasets, the inherent heterogeneity and complexity of soil properties introduce fundamental challenges in generalizing such models to site-specific conditions.
The data in this paper are derived from in situ tests and laboratory measurements of soil samples collected across the Yellow River Delta. Sampling sites include Dawangbei (E118.44°, N38.11°) in the northwestern delta, Dongying Port (E118.95°, N38.08°) in the eastern region, Xintan (E119.2°, N37.8°) in the southeastern periphery, and Guanli Port (E118.93°, N37.36°) in the southern sector. As illustrated in
Figure 1, the Yellow River sedimentary strata predominantly comprise silt, clay, and intermixed silty clay layers, classified as low-liquid-limit silt and low-liquid-limit clay per Chinese geotechnical standards. Detailed test results are tabulated in
Table 2. Among them, the cone tip resistance and friction ratio are obtained through data processing of in situ static cone penetration tests, while the void ratio and permeability coefficient are obtained through laboratory tests on in situ samples. The single-hole method is used to determine the shear wave velocity of sediments at different depths in each study area. Single-hole wave velocity tests are conducted in each borehole using a comprehensive engineering vibration measuring instrument, with horizontal hammer impact as the vibration source, and the tests are carried out layer by layer upward along the borehole. The four-level method is adopted to perform resistivity testing on the apparent pores in the four study areas.
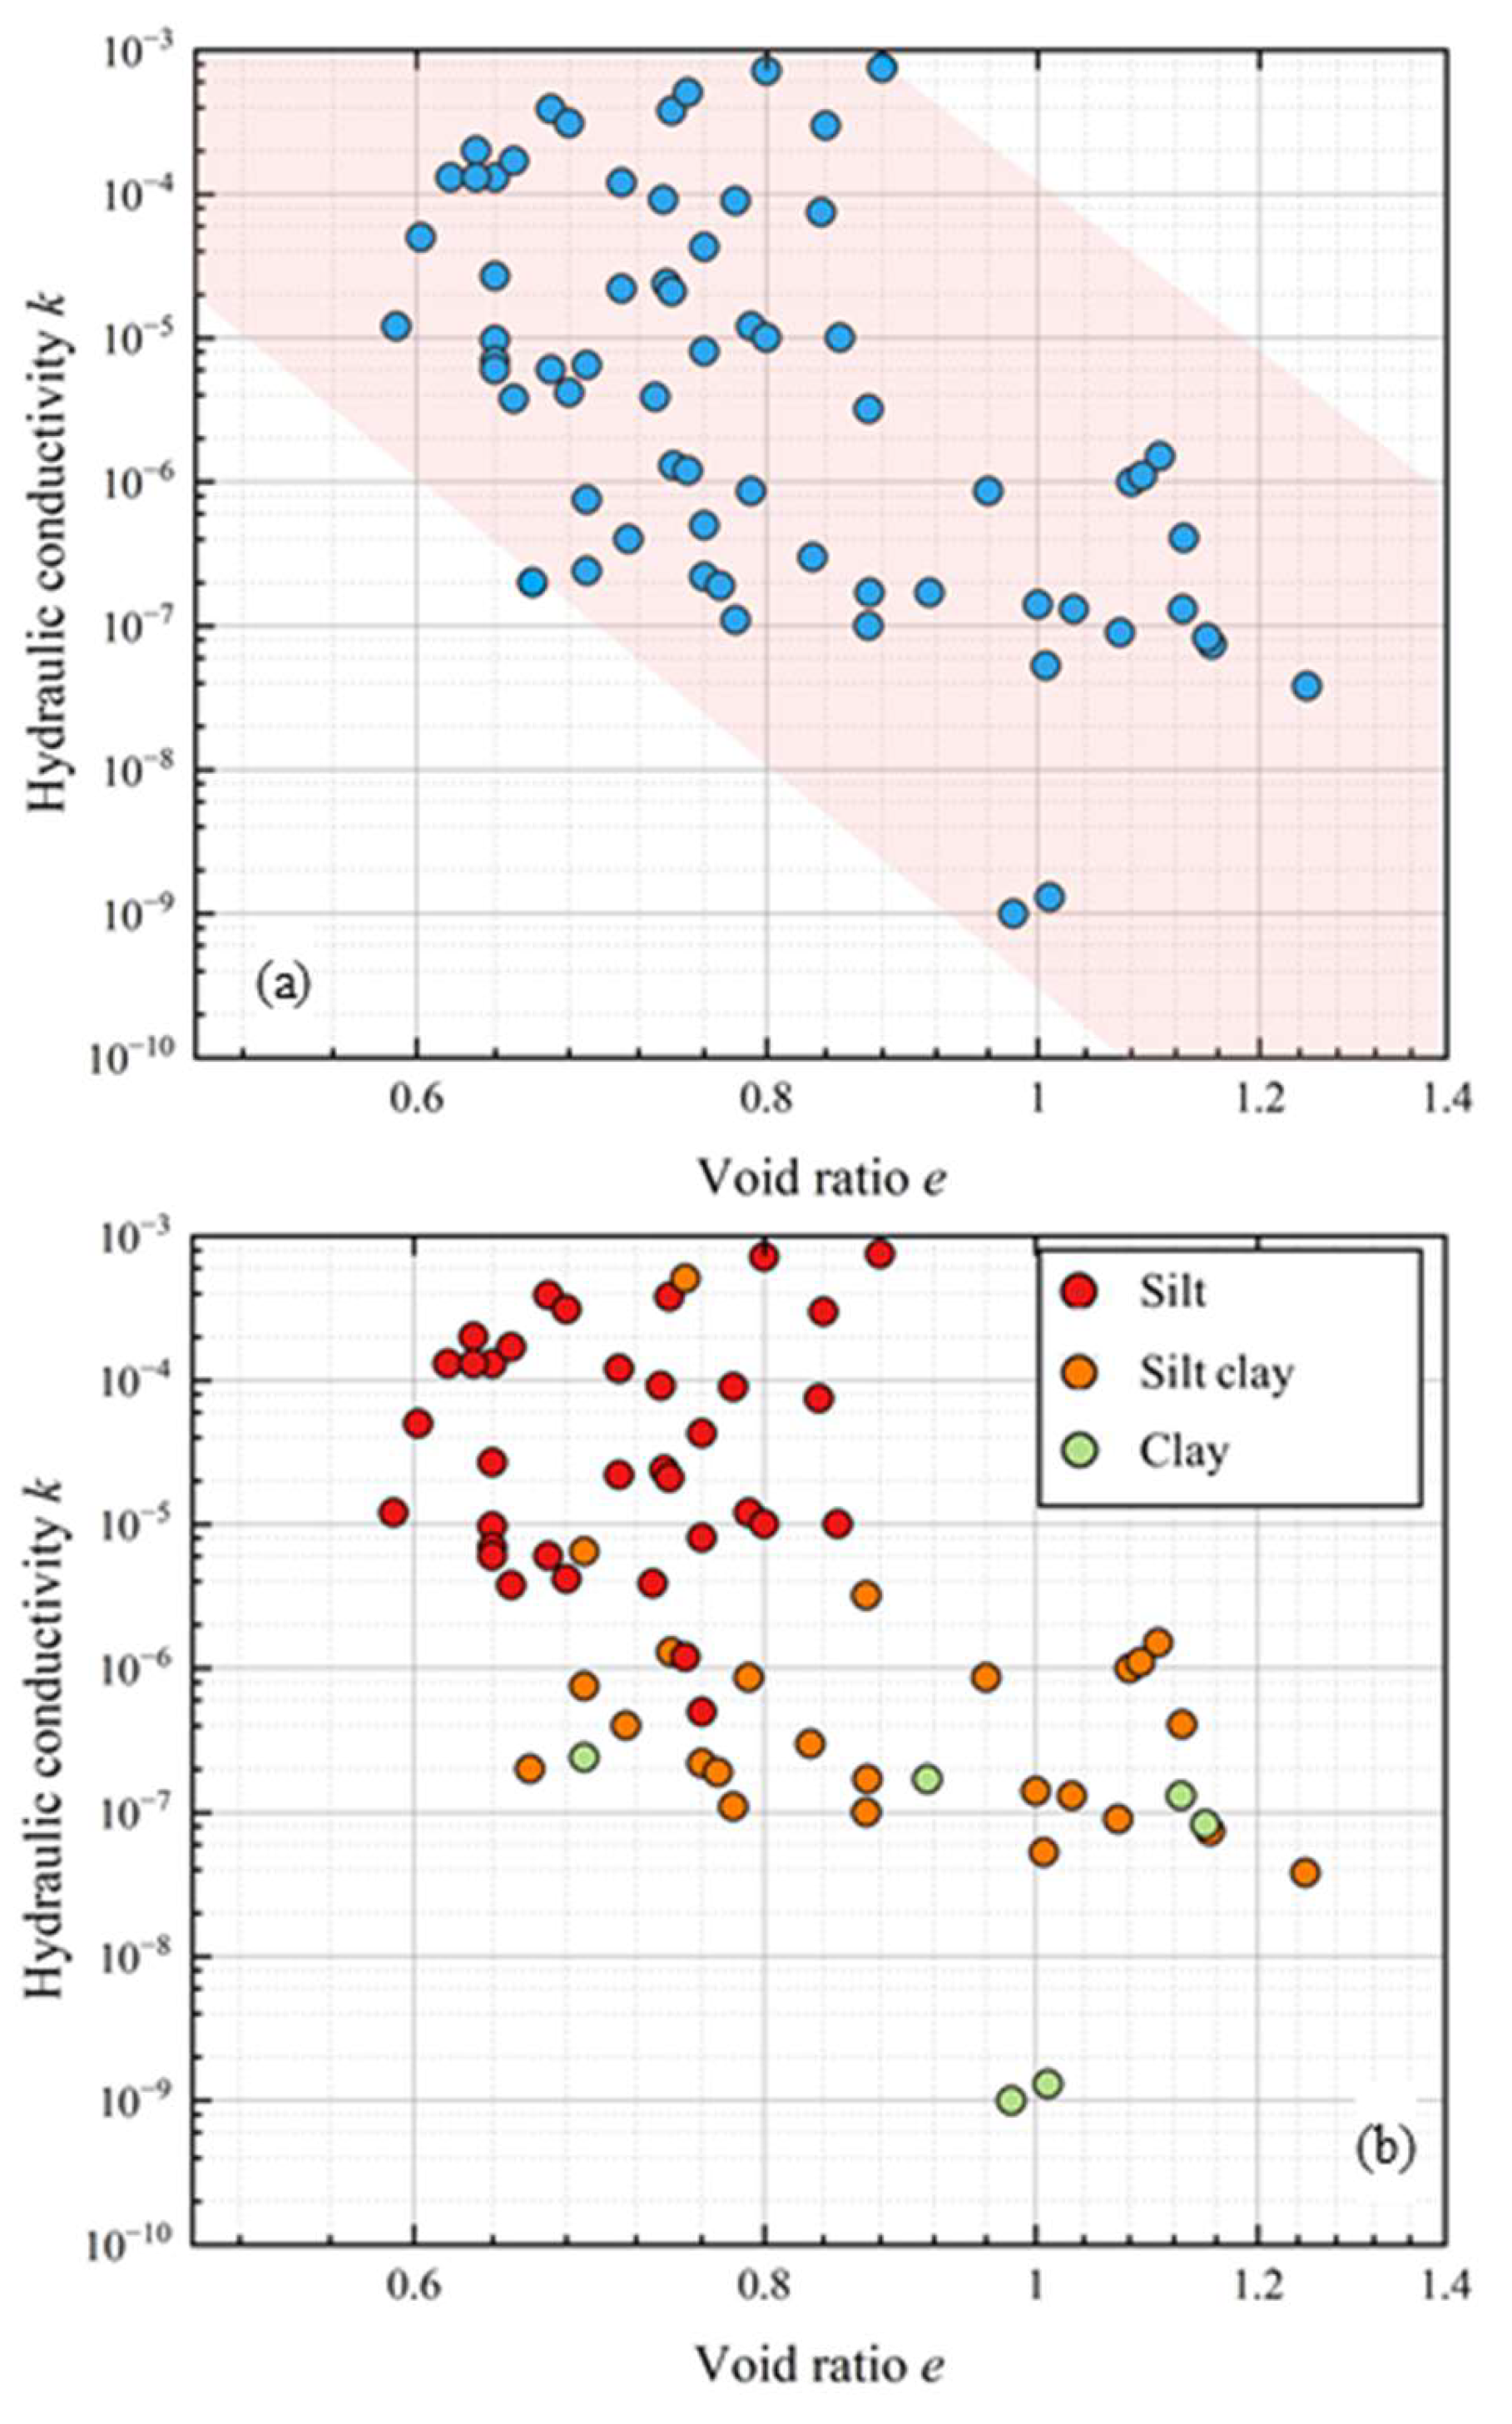
As a typical case, the relationship between void ratio and hydraulic conductivity is examined herein. Correlation analysis results are plotted in
Figure 2, revealing a distinct negative trend between hydraulic conductivity and void ratio for most datasets. The fitted curve approximates the functional form of Equation (1), originally proposed by Babaoğlu and Simms [
12], though with an inverse trend. Notably, data points from the Yellow River Estuary cluster in the left region of the plot, corresponding to soils with relatively low void ratios but unexpectedly high hydraulic conductivities. Despite minor variations in void ratio, significant variability in hydraulic conductivity is observed, accompanied by a low coefficient of determination (
) that indicates a weak empirical correlation.
Figure 2b is the result of
Figure 2a after color mapping by soil type. As can be seen from the figure, silt is mainly distributed in areas with smaller void ratios, while clay is concentrated in areas with larger void ratios; the hydraulic conductivity in descending order is silt, silty clay, and clay, and this experimental result is consistent with the general law.
For clay, the number of particles per unit volume is much larger than that of silt and sand, and the cumulative total volume of a large number of micropores significantly increases the pore volume; at the same time, clay particles are mostly flaky and flat clay minerals, which tend to form flocculent or honeycomb structures, making it difficult to fill the gaps between particles. Moreover, clay minerals have strong hydrophilicity, and the water film adsorbed on their surface will further expand the pore space. In addition, the immobile water in cohesive soil (mainly including adsorbed water on mineral surfaces, bound water in clay interlayers, and water in closed pores, etc.) cannot participate in seepage due to the restriction of soil particle surface forces or pore structure, a phenomenon that has been mentioned in the study by Ren et al. The combined effect of the above factors leads to the negative correlation between hydraulic conductivity and void ratio in
Figure 2.
The predictive framework outlined in Equation (2) is derived from the Kozeny–Carman equation, which establishes the relationship between hydraulic conductivity (k) and void ratio (
e) by substituting the specific surface area with soil-specific parameters such as plasticity index (
) or liquidity index (
). Early adaptations of this approach by Samarasinghe et al. [
16] and Carer & Beckman [
17] tailored the equation to different soil textures, while Babaoğlu and Simms [
12] further refined it into three distinct predictive models.
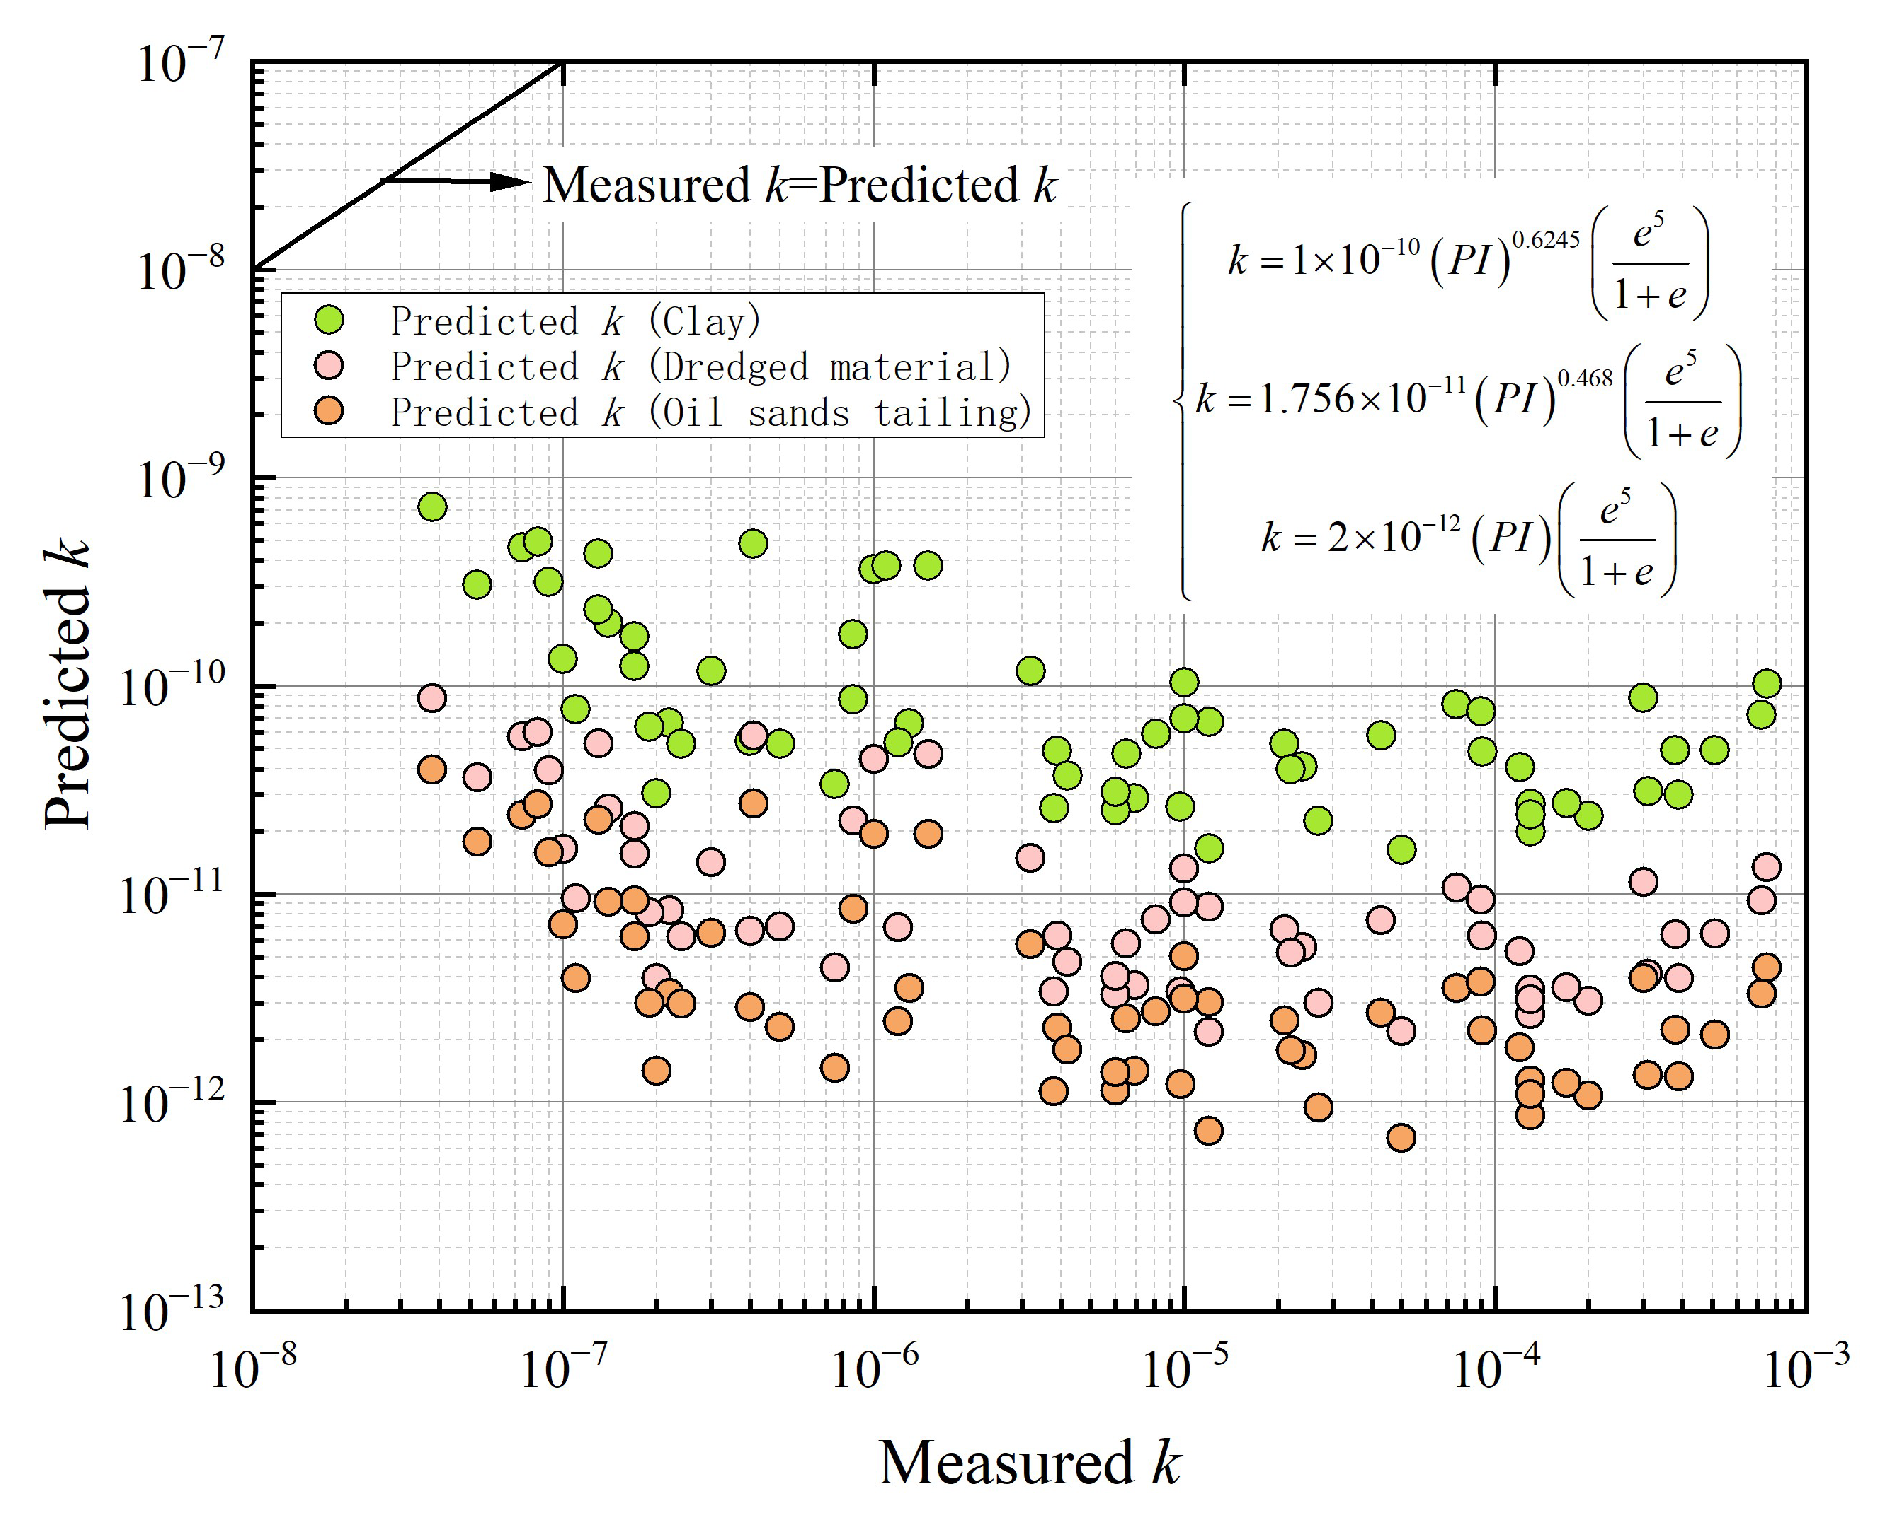
Figure 3 visually compares the performance of these models, with
Table 1 presenting only one variant of Equation (2) for brevity. Empirical validation reveals that hydraulic conductivity values inverted from Equation (2) consistently underestimate field measurements, exhibiting a weak negative correlation with observed data. This systematic bias is attributed to two key factors:
Narrow Void Ratio Range: The measured void ratios span a limited interval (0.5–1.5), whereas corresponding
k-values vary over several orders of magnitude (
). The logarithmic structure of Equation (2) dampens sensitivity to minor
e-variations within this range. Contrasting Trends: The observed
k–
e relationship in field data diverges from the model’s theoretical prediction, particularly in soils with complex pore structures (e.g., clayey silts). This discrepancy arises from the Kozeny–Carman equation’s assumption of idealized capillary flow, which inadequately captures tortuosity and particle arrangement effects. Practical applications necessitate careful consideration of soil-specific properties, such as grain size distribution and mineralogy, which modulate pore connectivity and fluid flow mechanisms. For a comprehensive review of alternative
k–
e correlations, refer to the appendix of Babaoğlu and Simms [
12].
Moon et al. [
13] developed a semi-empirical void ratio (
e)–shear wave velocity (
) prediction model building on Mayne et al. [
18] and their proprietary dataset. That is Equation (3). Among them, parameter
a is a material parameter representing the comprehensive effects such as stress dependence, soil structure and fabric. In Moon’s research, the ideal scenario is to decompose it into stress components and structural components. However, due to the complexity in determining the structural components, the study adopts an overall simplification method and regards it as a comprehensive parameter. Its value is determined to be 215.64 through regression analysis of a large amount of data. Parameter
b, as an exponent, is used to control the sensitivity of shear wave velocity to void ratio, with a value of −1.043. Parameter
c is an empirical fitting parameter, which is used to construct a generalized void ratio function. The study finds that its value range is between −1.0 and 1.0. Through regression analysis, it is concluded that the data fitting curve is the best when
c = 0.1, but the improvement is not significant compared with
c = 0. Therefore, for the sake of simplifying the application, c = 0. As shown in
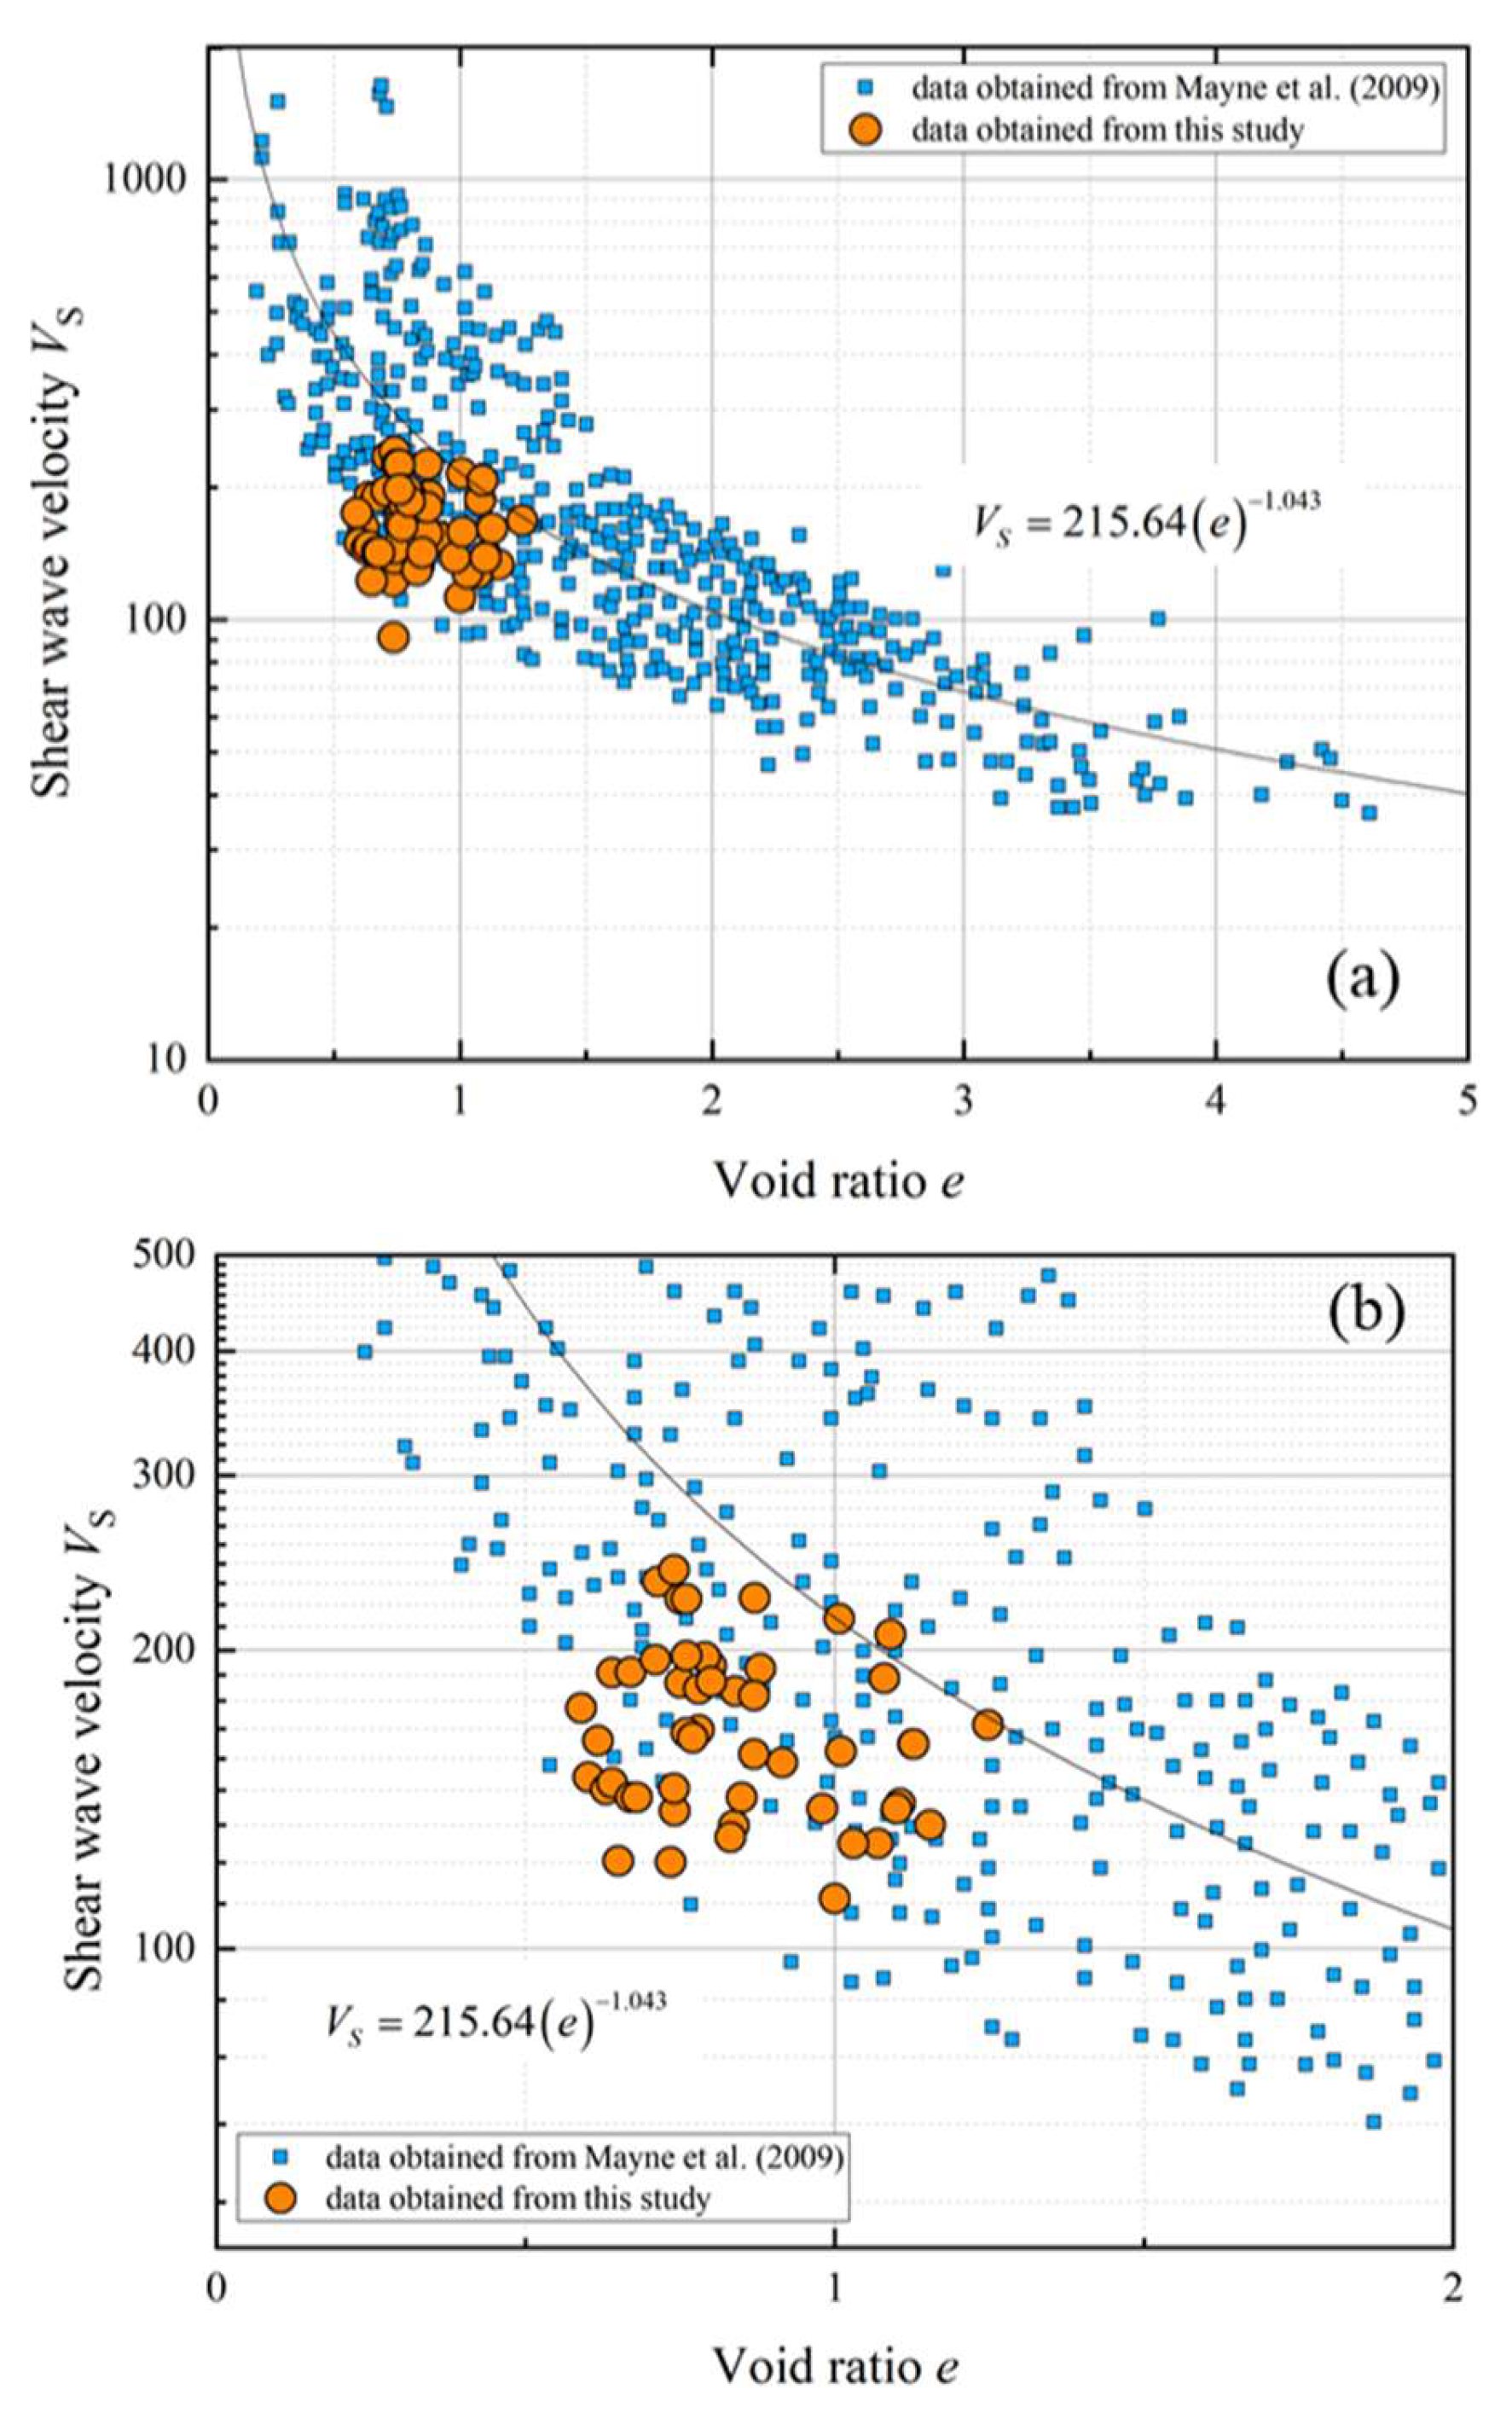
Figure 4 (adapted from Moon et al. [
13]), the figure illustrates a clear power law relationship between
e and
. The orange data points represent in situ measurements from the Yellow River estuary in this study, which align consistently with the broader dataset compiled by Moon et al., albeit falling within the lower range of the fitted curve. This consistency indirectly validates the robustness of Moon et al.’s framework.
Notably, the
-
e power law observed in
Figure 4 applies to a macro-scale void ratio range (0–5), which exceeds typical values encountered in practical engineering. For instance, the Yellow River Estuary data exclusively occupy a narrow
e-interval (0.5–1.5). Zooming into this sub-range reveals minimal variation in
despite measurable changes in
e, highlighting fundamental limitations in directly predicting
e from
at high precision. While this macro-scale correlation offers theoretical insights, Moon et al. [
13] successfully leveraged the
-
e relationship to develop semi-empirical models for estimating soil unit weight, yielding promising results. These findings underscore the dual utility of such correlations: broad-scale trend analysis versus context-specific parameterization.
Under identical conditions, the resistance to current propagation in air is significantly greater than that in soil. Variations in void ratio alter the proportion of soil gas-to-solid phases, thereby influencing material resistivity to varying degrees. Leveraging this principle, several studies have explored resistivity-based void ratio estimation [
19,
20]. For the Yellow River Estuary dataset, the resistivity–void ratio distribution mirrors the trend in
Figure 4 and is therefore not replotted herein. Within the void ratio range of 0.5–1.5, resistivity values span 4.79–19.21 Ω·m with significant scatter, indicating poor empirical correlation.
Shear wave velocity and resistivity in soils are influenced by multiple interrelated factors, including pore geometry, saturation, soil fabric, particle mineralogy, stress history, and pore fluid chemistry. Unlike controlled laboratory environments, field measurements inherently reflect the combined impact of these complex variables, rendering data scatter inevitable rather than unexpected.
So far, several semi-empirical prediction methods for void ratio based on CPTu have been proposed, as demonstrated in the studies by Koster et al. [
15] and Priyam Mishra & Pradipta Chakrabortty [
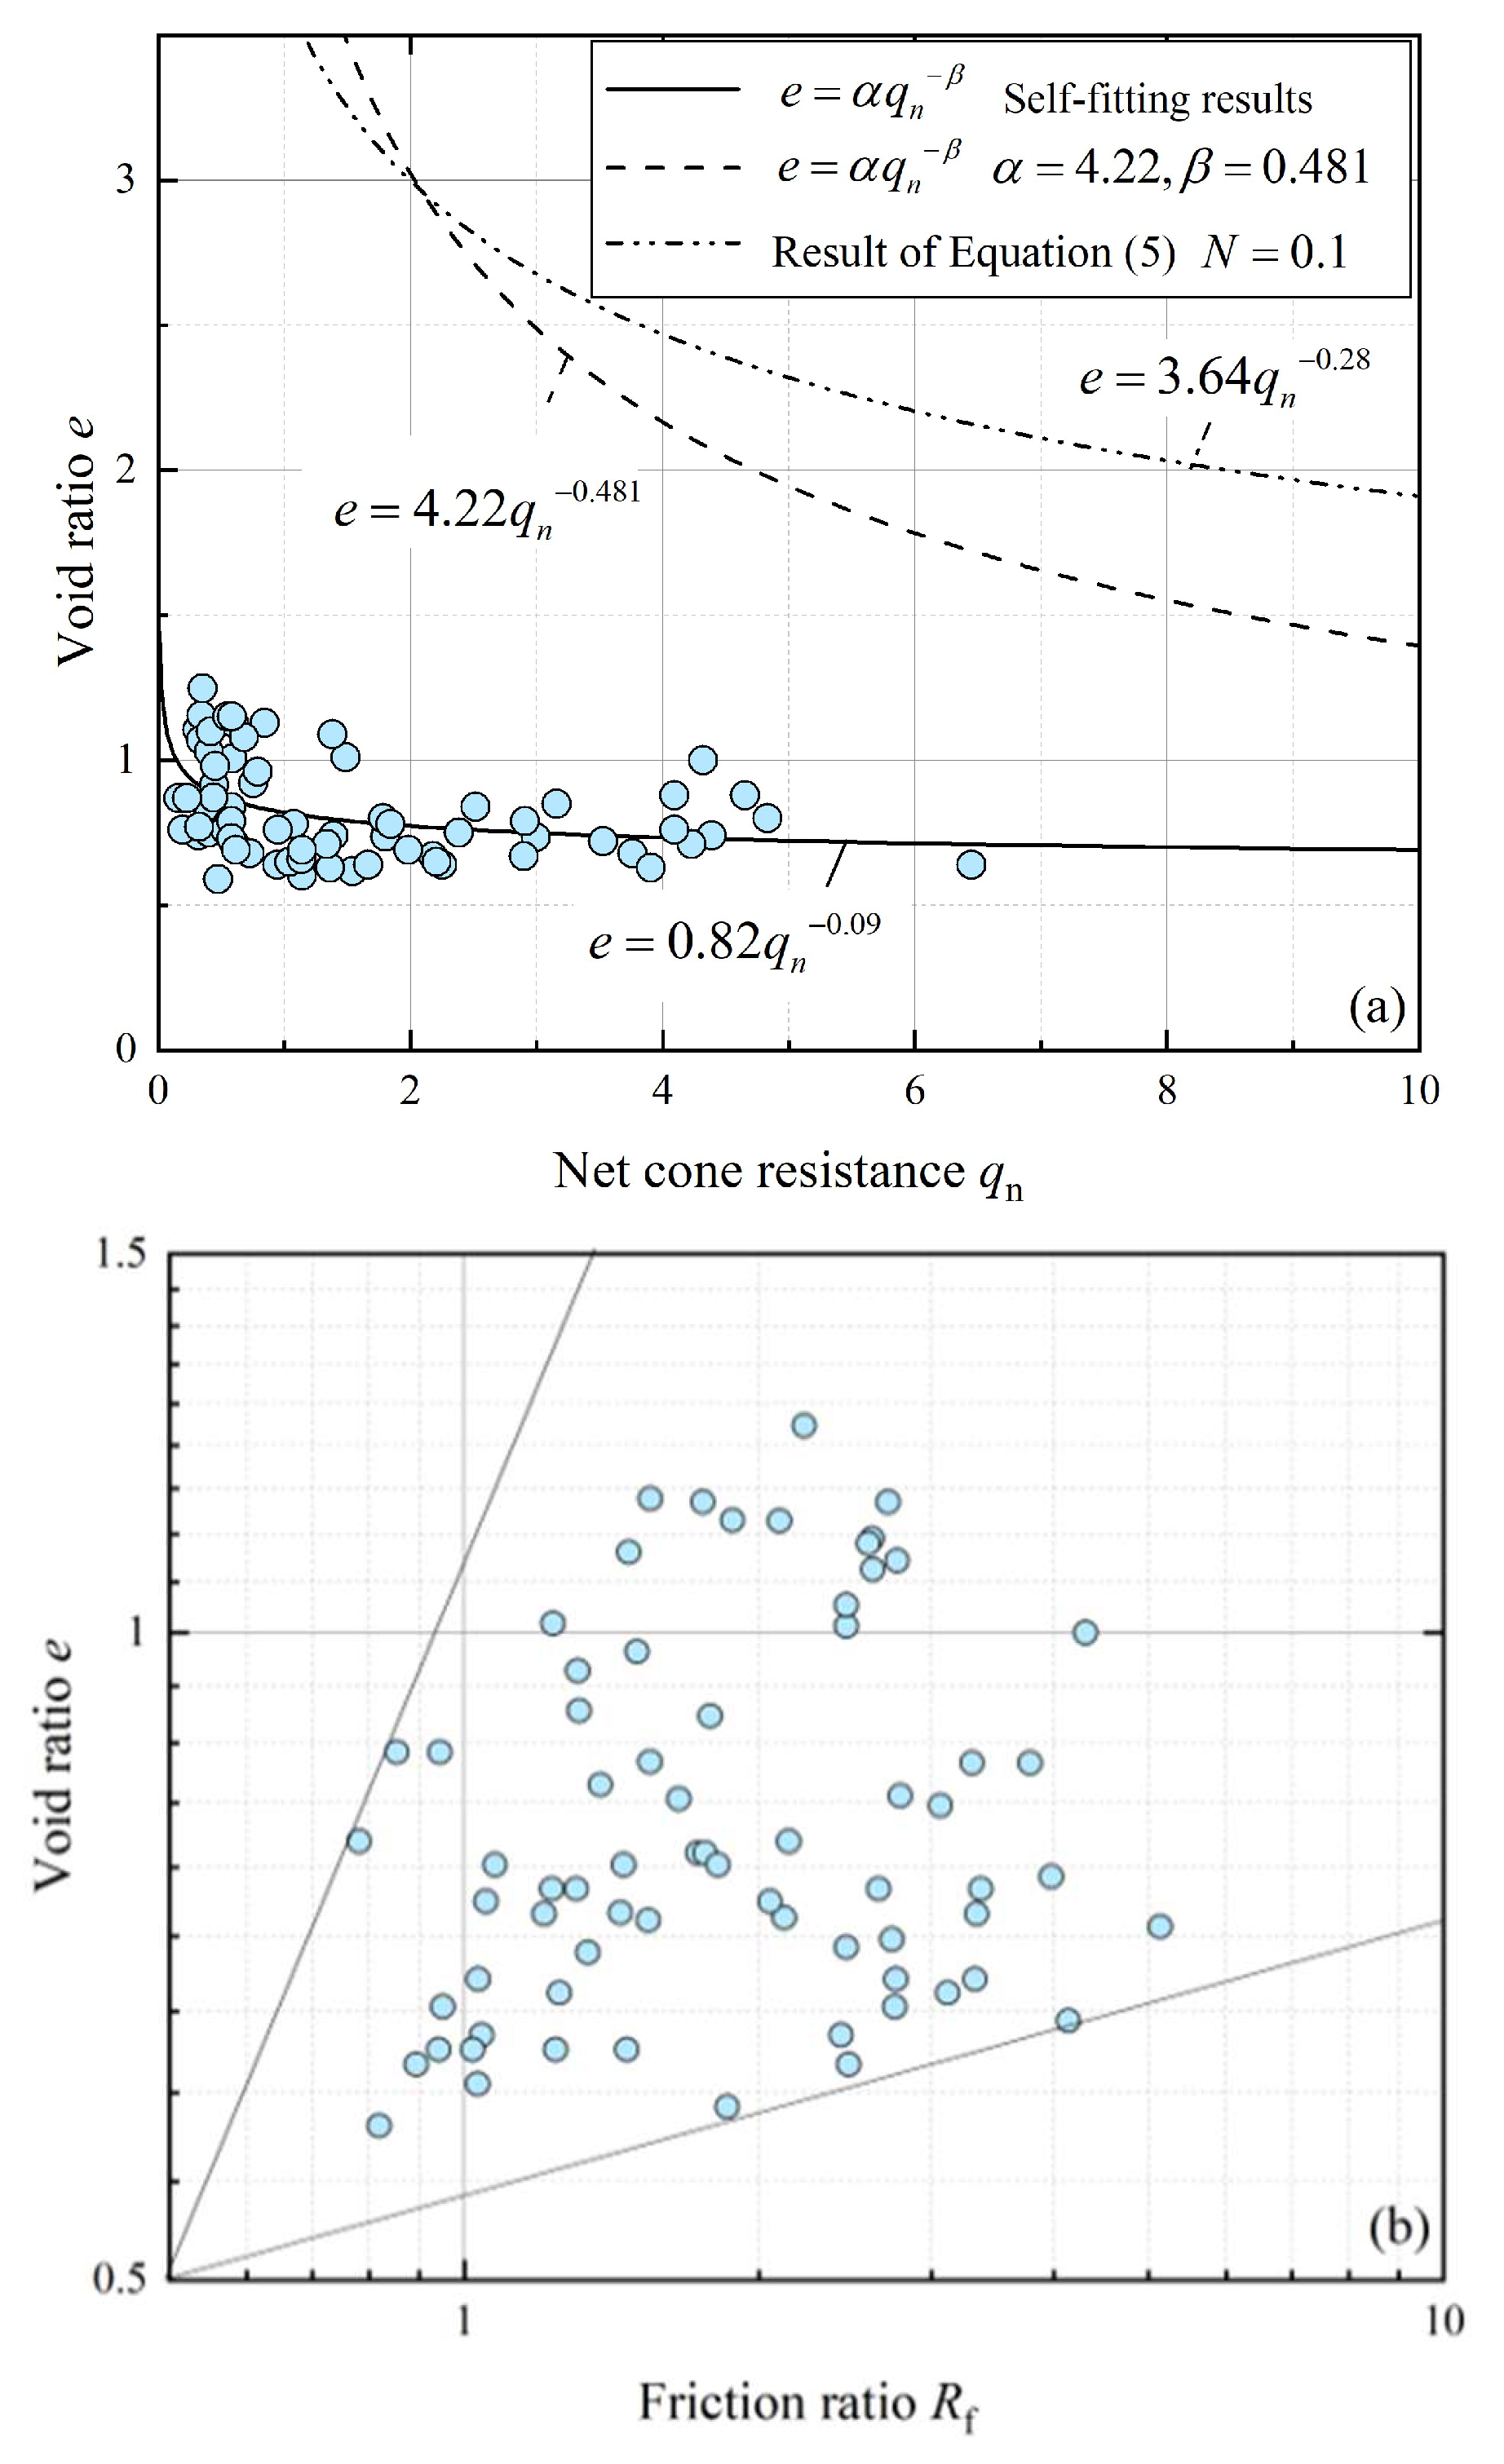
14]. To characterize the general relationship between CPTu results and void ratio in the Yellow River Estuary, void ratios derived from laboratory tests are plotted against field CPTu data from boreholes in
Figure 5.
Figure 5a illustrates a weak correlation between net cone resistance and void ratio, with data points distributed approximately horizontally. The curve in
Figure 5a represents Koster et al.’s void ratio prediction model for peat soil, plotted using coefficients provided in the original study. The model establishes a power-law relationship between void ratio and net cone resistance, where the coefficient in Equation (5) is a function of organic matter content. In the formulas of the article,
N represents the organic matter content of peat and is a dimensionless parameter. Its value is related to the proportion of organic matter in peat. The article divides the organic matter content into several levels for research, including categories such as <40%, 40–60%, 60–80% and >80%. The specific value of
N is determined based on these actually measured proportions of organic matter content. For example, when the organic matter content of peat is 60%,
N can be 0.6. The discrepancies observed in the figure may stem from the absence of organic matter content measurements in this study, which limits the ability to fully validate the accuracy of Equation (5). It is important to note that soil organic matter content typically requires laboratory testing, implying that cone tip resistance corrected for organic matter content is challenging to implement in practical engineering for void ratio prediction. In contrast to the nearly random distribution in
Figure 5a,
Figure 5b shows a weak positive correlation between friction ratio and void ratio. Nevertheless, neither relationship is robust enough for direct void ratio prediction in the Yellow River Estuary.
In the realm of void ratio prediction, Priyam Mishra and Pradipta Chakrabortty [
14] proposed another CPTu-based void ratio prediction model, introducing the concept of the factorial void ratio. The factorial void ratio is expressed as
. The model links four parameters—normalized cone resistance (
), soil behavior type index (
), void ratio (
e), and correction factor (
n)—through elementary functions.
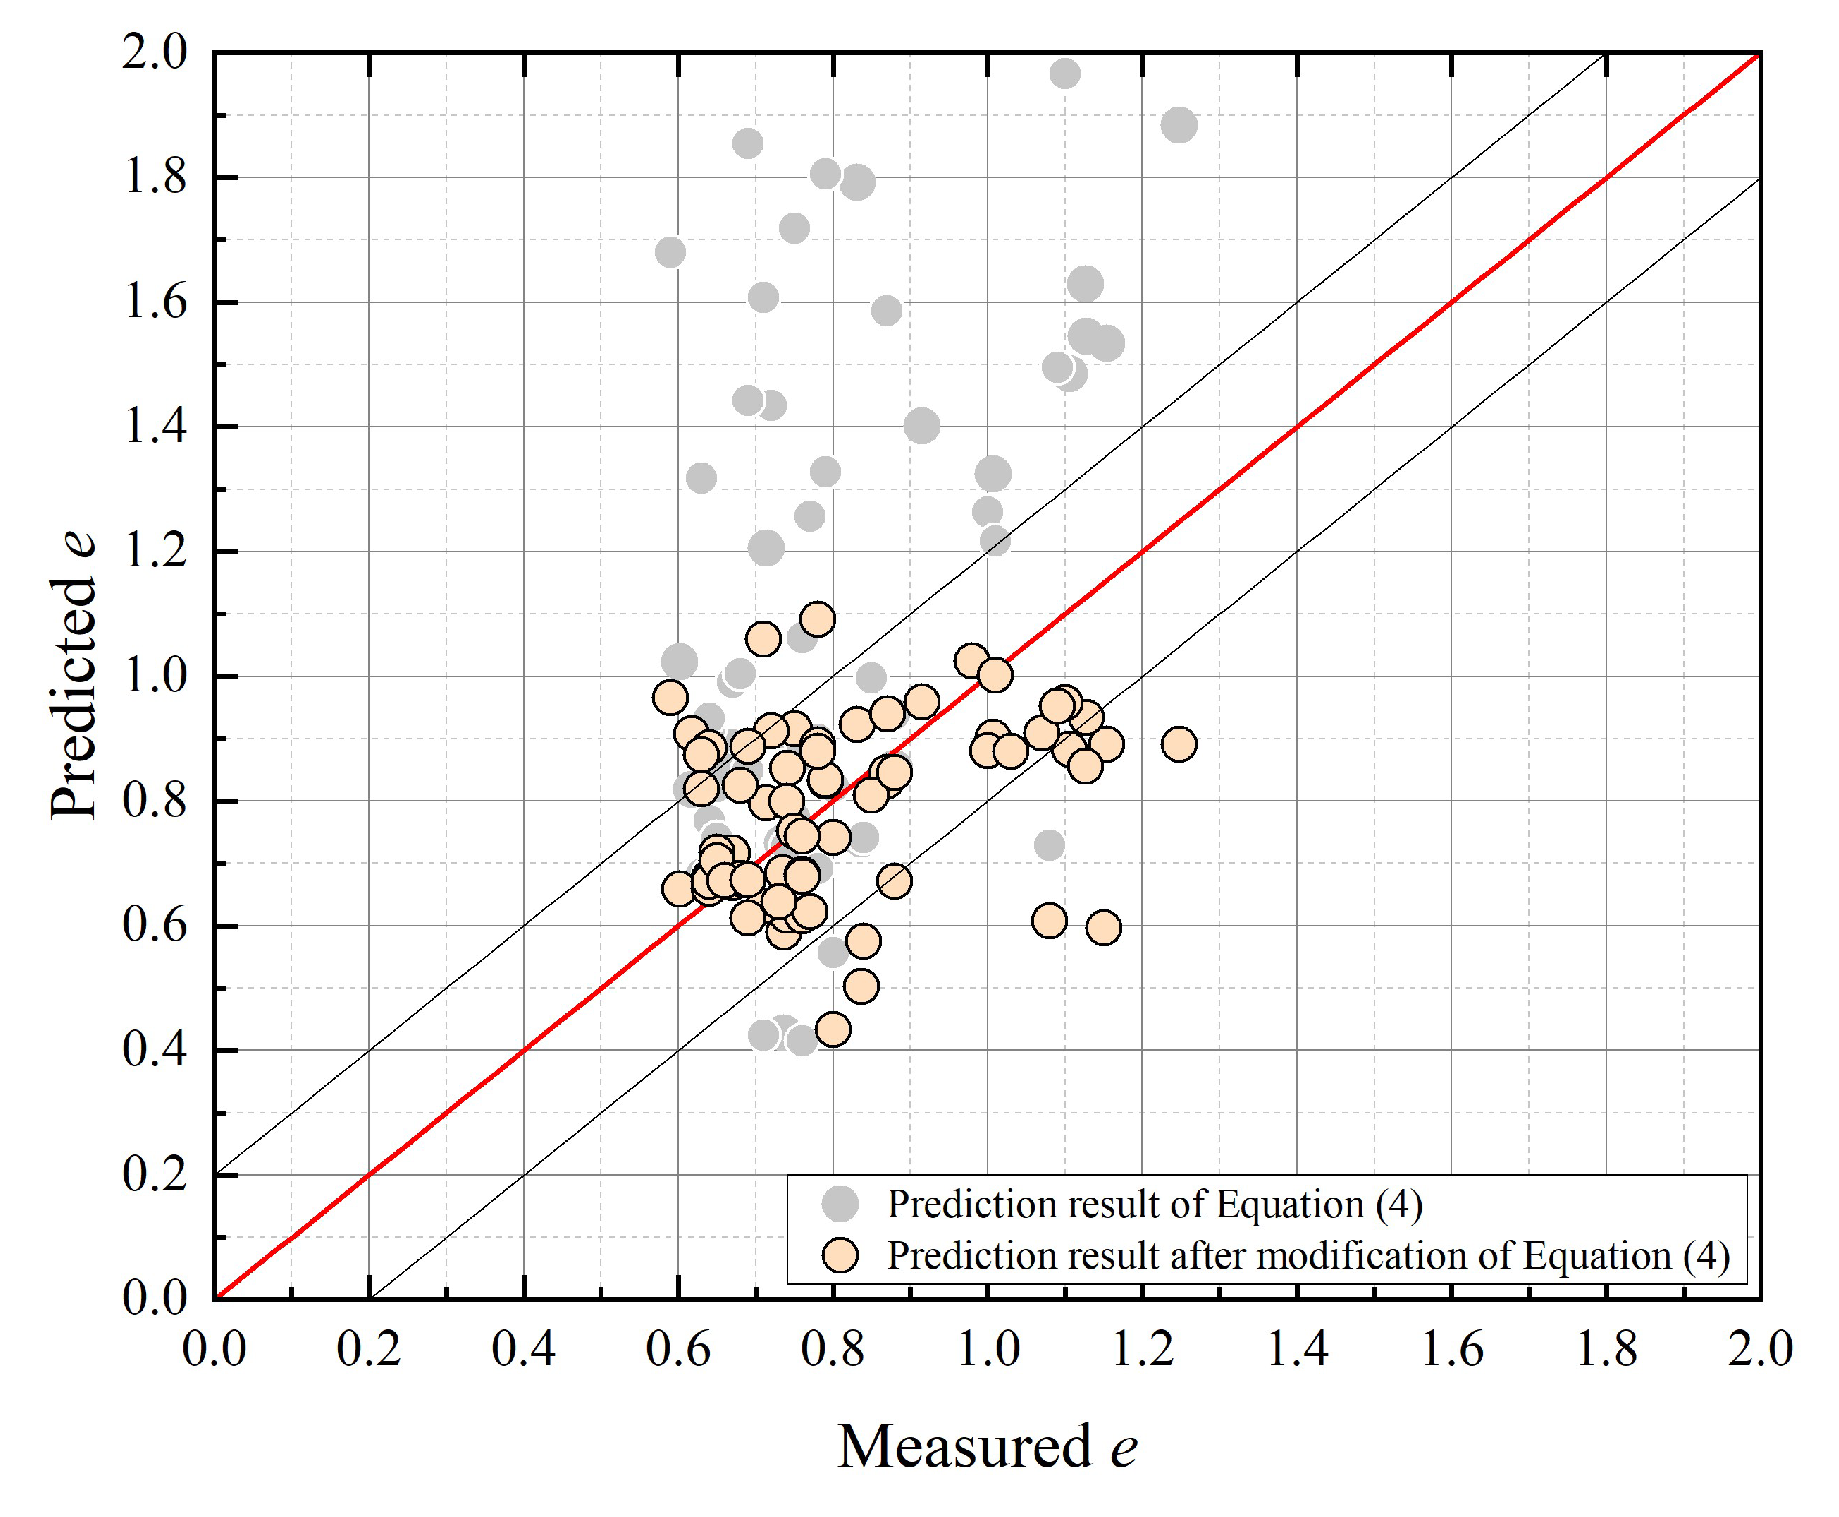
Without altering the model structure, adjusting the model coefficients achieves satisfactory prediction performance with the Yellow River Estuary dataset, demonstrating the feasibility of void ratio prediction using CPTu parameters. The predictive effects of Equation (4) before and after coefficient adjustment are compared in
Figure 6.
The coefficients in Equations (4) and (5) are both determined through regression analysis. Specifically, Equation (4) is derived based on the soil conditions of the quaternary alluvial layers at the Patna campus of the Indian Institute of Technology, while Equation (5) is derived from the results of static cone penetration tests in the coastal delta region of the Netherlands. Mishra and Chakrabortty point out that due to significant differences in soil properties, these coefficients may vary significantly under different geological conditions, soil types, or sedimentary environments. Therefore, if Equation (4) is to be applied to other regions, the coefficients need to be recalibrated with local test data to ensure the accuracy of the prediction results. Koster et al. modified the coefficients of Equation (5) by introducing the organic matter content parameter N. However, studies on Equation (5) have found that as the organic matter content increases, the fitting curve of Equation (5) rotates clockwise, failing to match the measured data in the Yellow River Estuary. In view of this, this paper only retains the form of the equations, while making targeted adjustments to the coefficients of Equations (4) and (5).
In summary, due to varying applicability conditions across models, existing void ratio prediction frameworks exhibit significant discrepancies when applied to the Yellow River Delta region. Resistivity-based correlations show the poorest performance, followed by permeability coefficient models—data in this study even contradict the mainstream positive trend. Single CPTu parameters also demonstrate weak correlations with void ratio, rendering them unsuitable for direct in situ prediction. While shear wave velocity exhibits a clear macro-scale correlation with void ratio, pronounced data scatter within narrow e-ranges limits its utility for fine-scale predictions.
Among these, the void ratio model proposed by Mishra & Chakrabortty [
14] demonstrates the best adaptability. By recalibrating model coefficients—without altering its structural framework—satisfactory prediction accuracy is achieved for the Yellow River Delta dataset, enabling preliminary void ratio assessments in this region. However, the lack of a systematic methodology for coefficient determination remains a critical challenge requiring further investigation.
3. Three-Phase Relationship of Soil
In soil mechanics, the three-phase system of soil serves as a foundational framework for establishing relationships between void ratio and other soil properties. One fundamental correlation is that between soil unit weight and void ratio, which can be mathematically expressed as:
Among them, is the specific gravity of soil particles, is the degree of saturation of soil, and is the unit weight of water.
The porosity, void ratio, and dry density of soil are highly correlated, which has been widely confirmed by previous studies. Naturally, this correlation is also widely used for on-site prediction of soil void ratio. In soil mechanics, dry density can be related through Equation (7):
The relevant data of this paper are plotted in
Figure 7. It shows the relationship between soil dry density and void ratio in the Yellow River Delta, with data points covering Dawangbei, Dongying Port, Xintan, and Guangli Port. The results are consistent with the conclusions of previous studies. There is an approximately linear relationship between void ratio and dry density, and the fitted Equation (8) is as follows:
Figure 7 shows the fitting results, with close alignment of data points with the fitted line, indicating minimal scatter. The negligible influence of sampling location on this linear relationship underscores its robustness. Such consistency highlights the potential for void ratio estimation using this correlation. Leveraging the robust relationship depicted in
Figure 7, integrating an in situ soil density prediction method could facilitate the development of a novel void ratio estimation framework. From a conservative perspective, this linear model is deemed applicable to the Yellow River Delta region.
Notably, unlike the equations in soil mechanics, the linear relationship between void ratio and dry density depicted by the fitted curve in
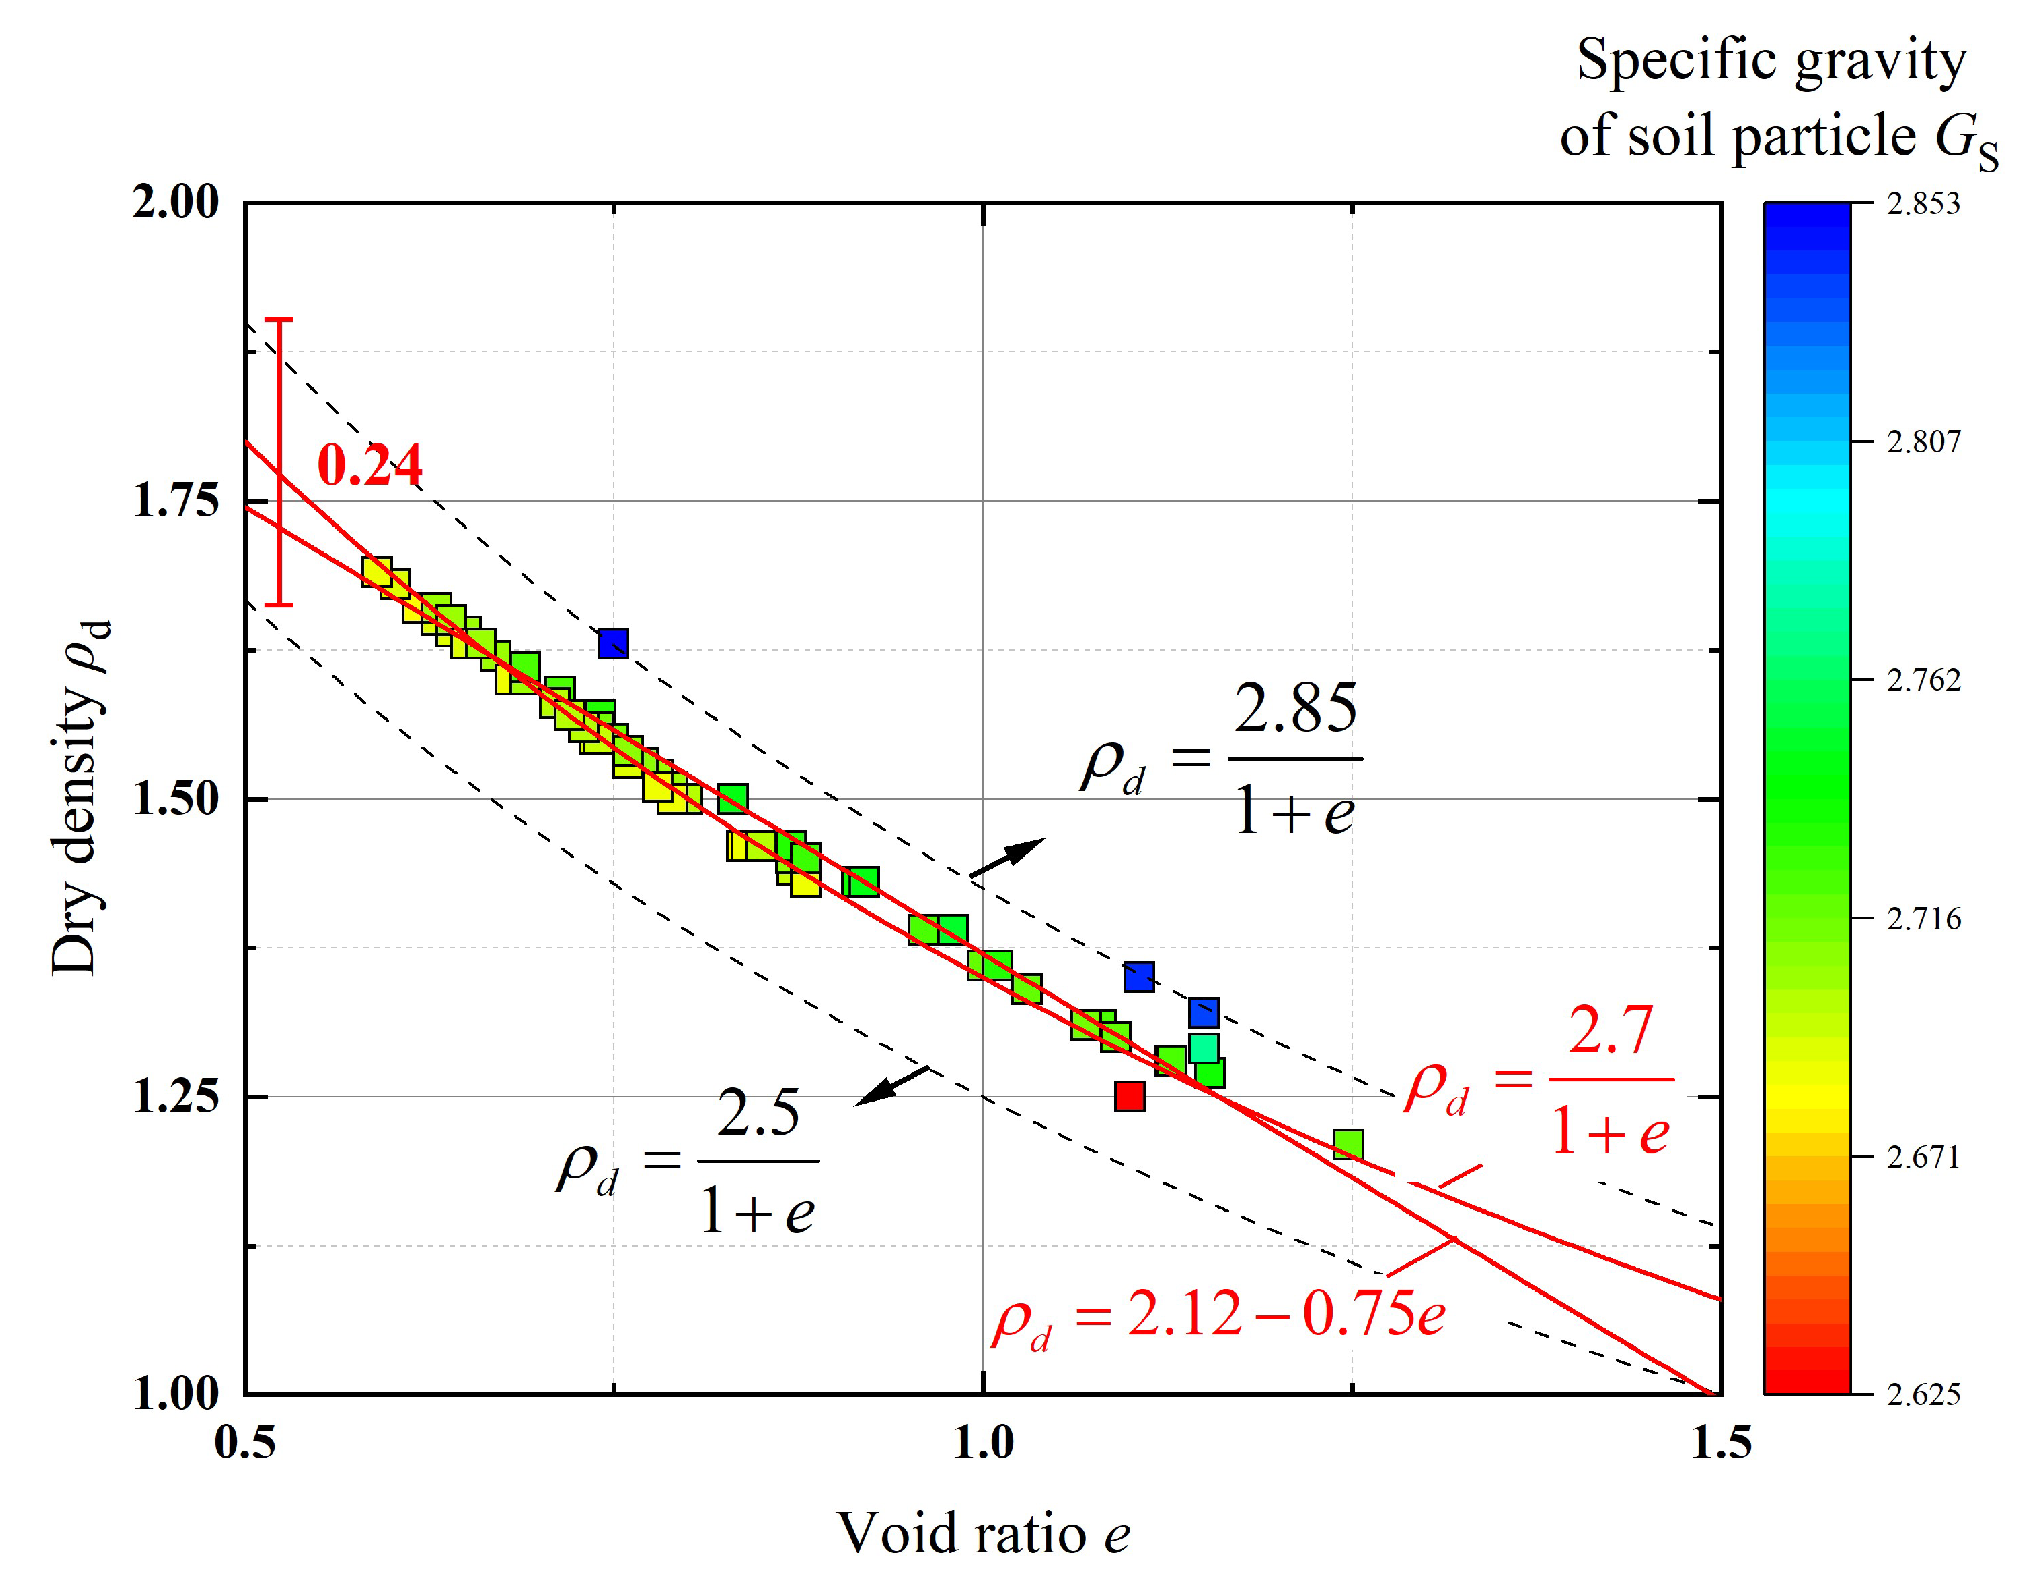
Figure 7 neglects the influence of soil particle specific gravity. By assigning different values to Equation (7) and plotting the corresponding theoretical curves, while adding a
-color-coded layer to the data points in
Figure 7,
Figure 8 is generated to visually illustrate the impact of
. As shown in
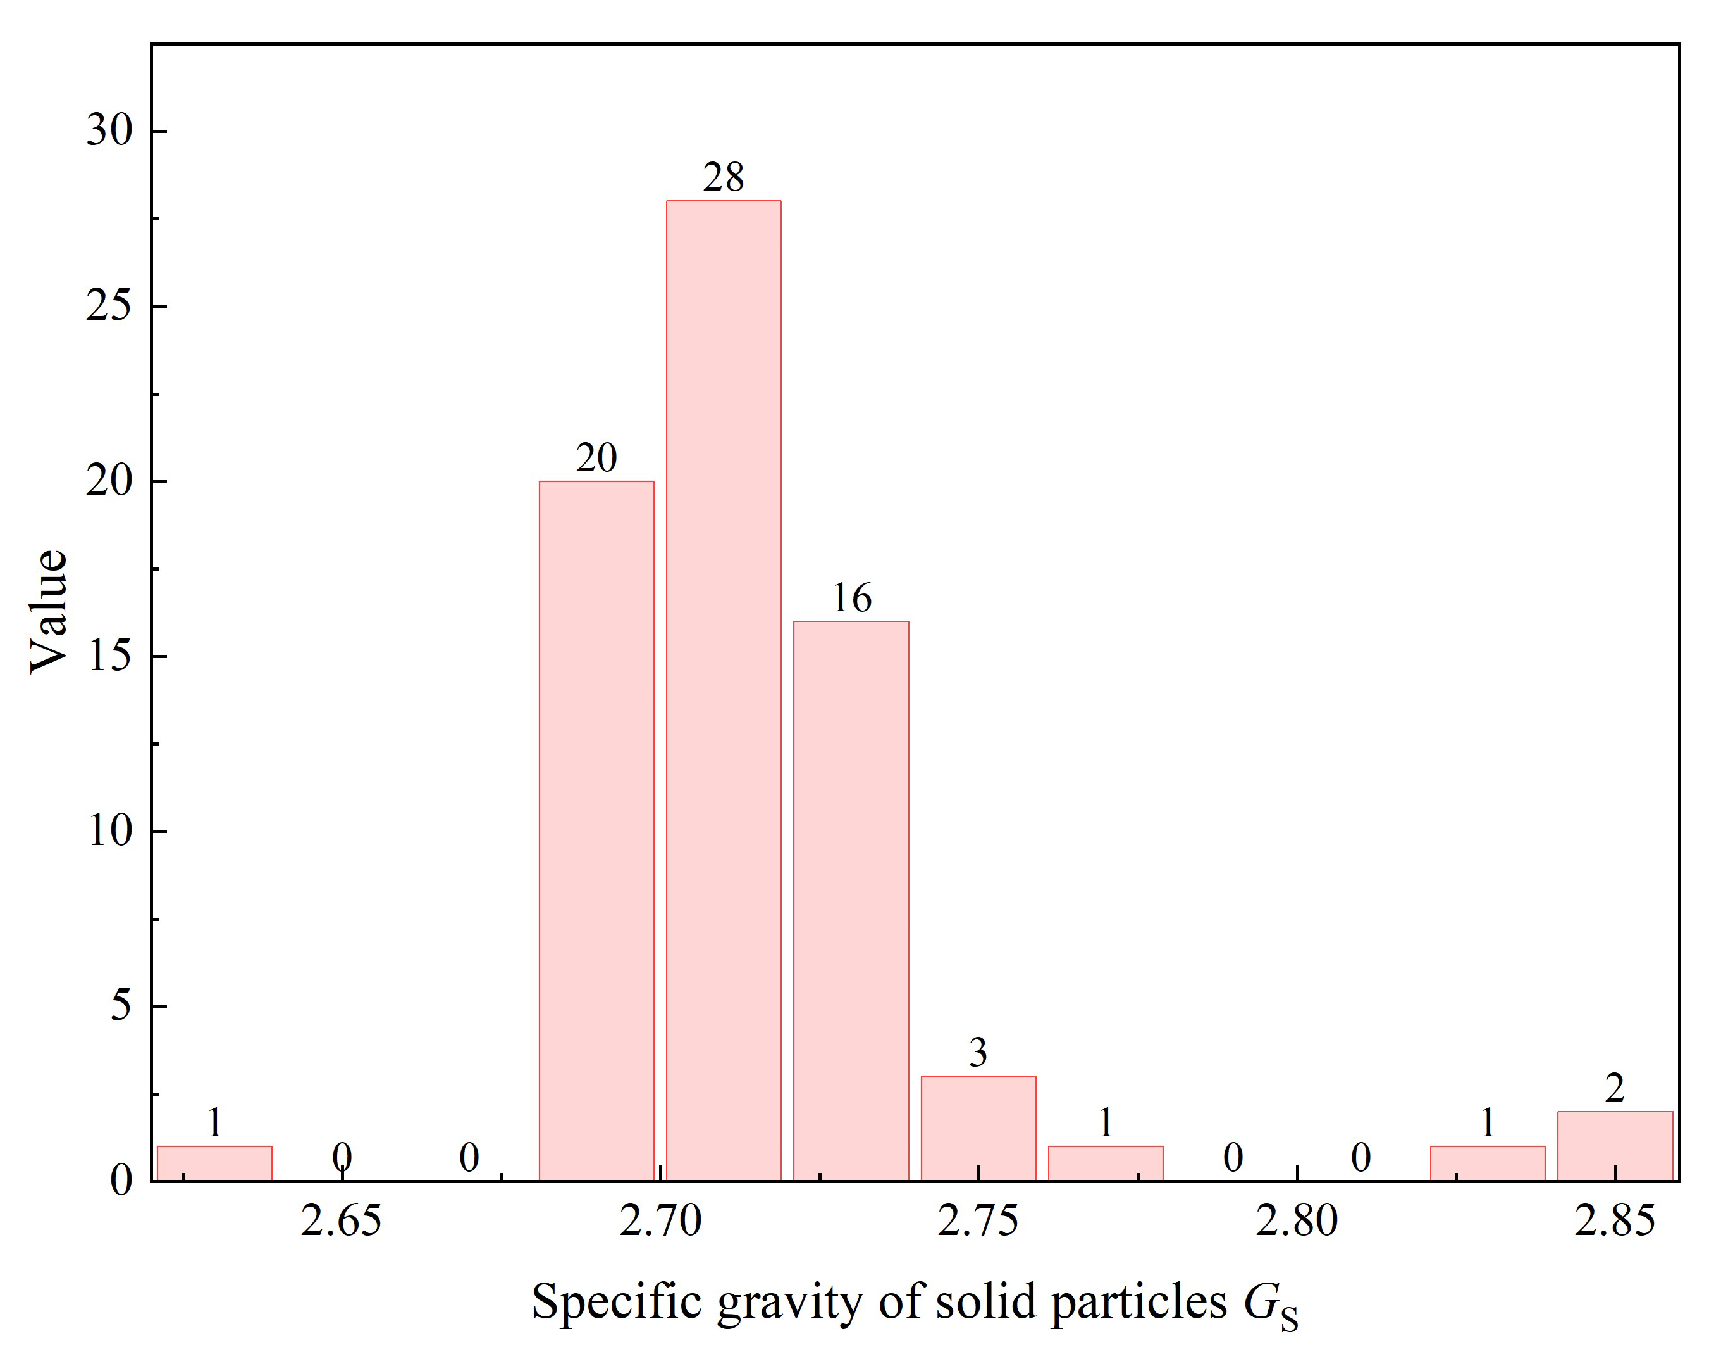
Figure 8, most measurement points exhibit a soil particle specific gravity of approximately 2.7, which aligns with the intersection point of the fitted line. The specific distribution of
at the Yellow River Estuary measurement sites is presented in
Figure 9. The emergence of this linear segment can be attributed to two factors: (1) the
values at the measurement points show negligible differences, allowing their influence to be approximated as a constant; (2) the limited range of void ratio data at the measurement points dampens the curvature of the theoretical relationship between void ratio and dry density, making the nonlinear effects of
less apparent. This is further evidenced by the near coincidence between the linear fitting result and the curve of Equation (7) in
Figure 8.
Under specific conditions, this linear relationship can be leveraged to efficiently and accurately calculate soil density or void ratio. However, the greater the deviation from this linear relationship, the larger the error in the predicted void ratio. In practice, it is necessary to combine actual measurement results to calculate the slope and intercept of the line, which presents certain limitations. Directly applying the three-phase relationship in soil mechanics to solve for void ratio is a simpler approach.
Soil density, analogous to soil unit weight, can be predicted via in situ testing. Since the development of CPT research, numerous semi-empirical correlations have been established between CPT parameters and geotechnical properties, including soil unit weight. A widely adopted CPT-based correlation for soil unit weight was proposed by Robertson et al. [
21] in 2010, as presented in Equation (9):
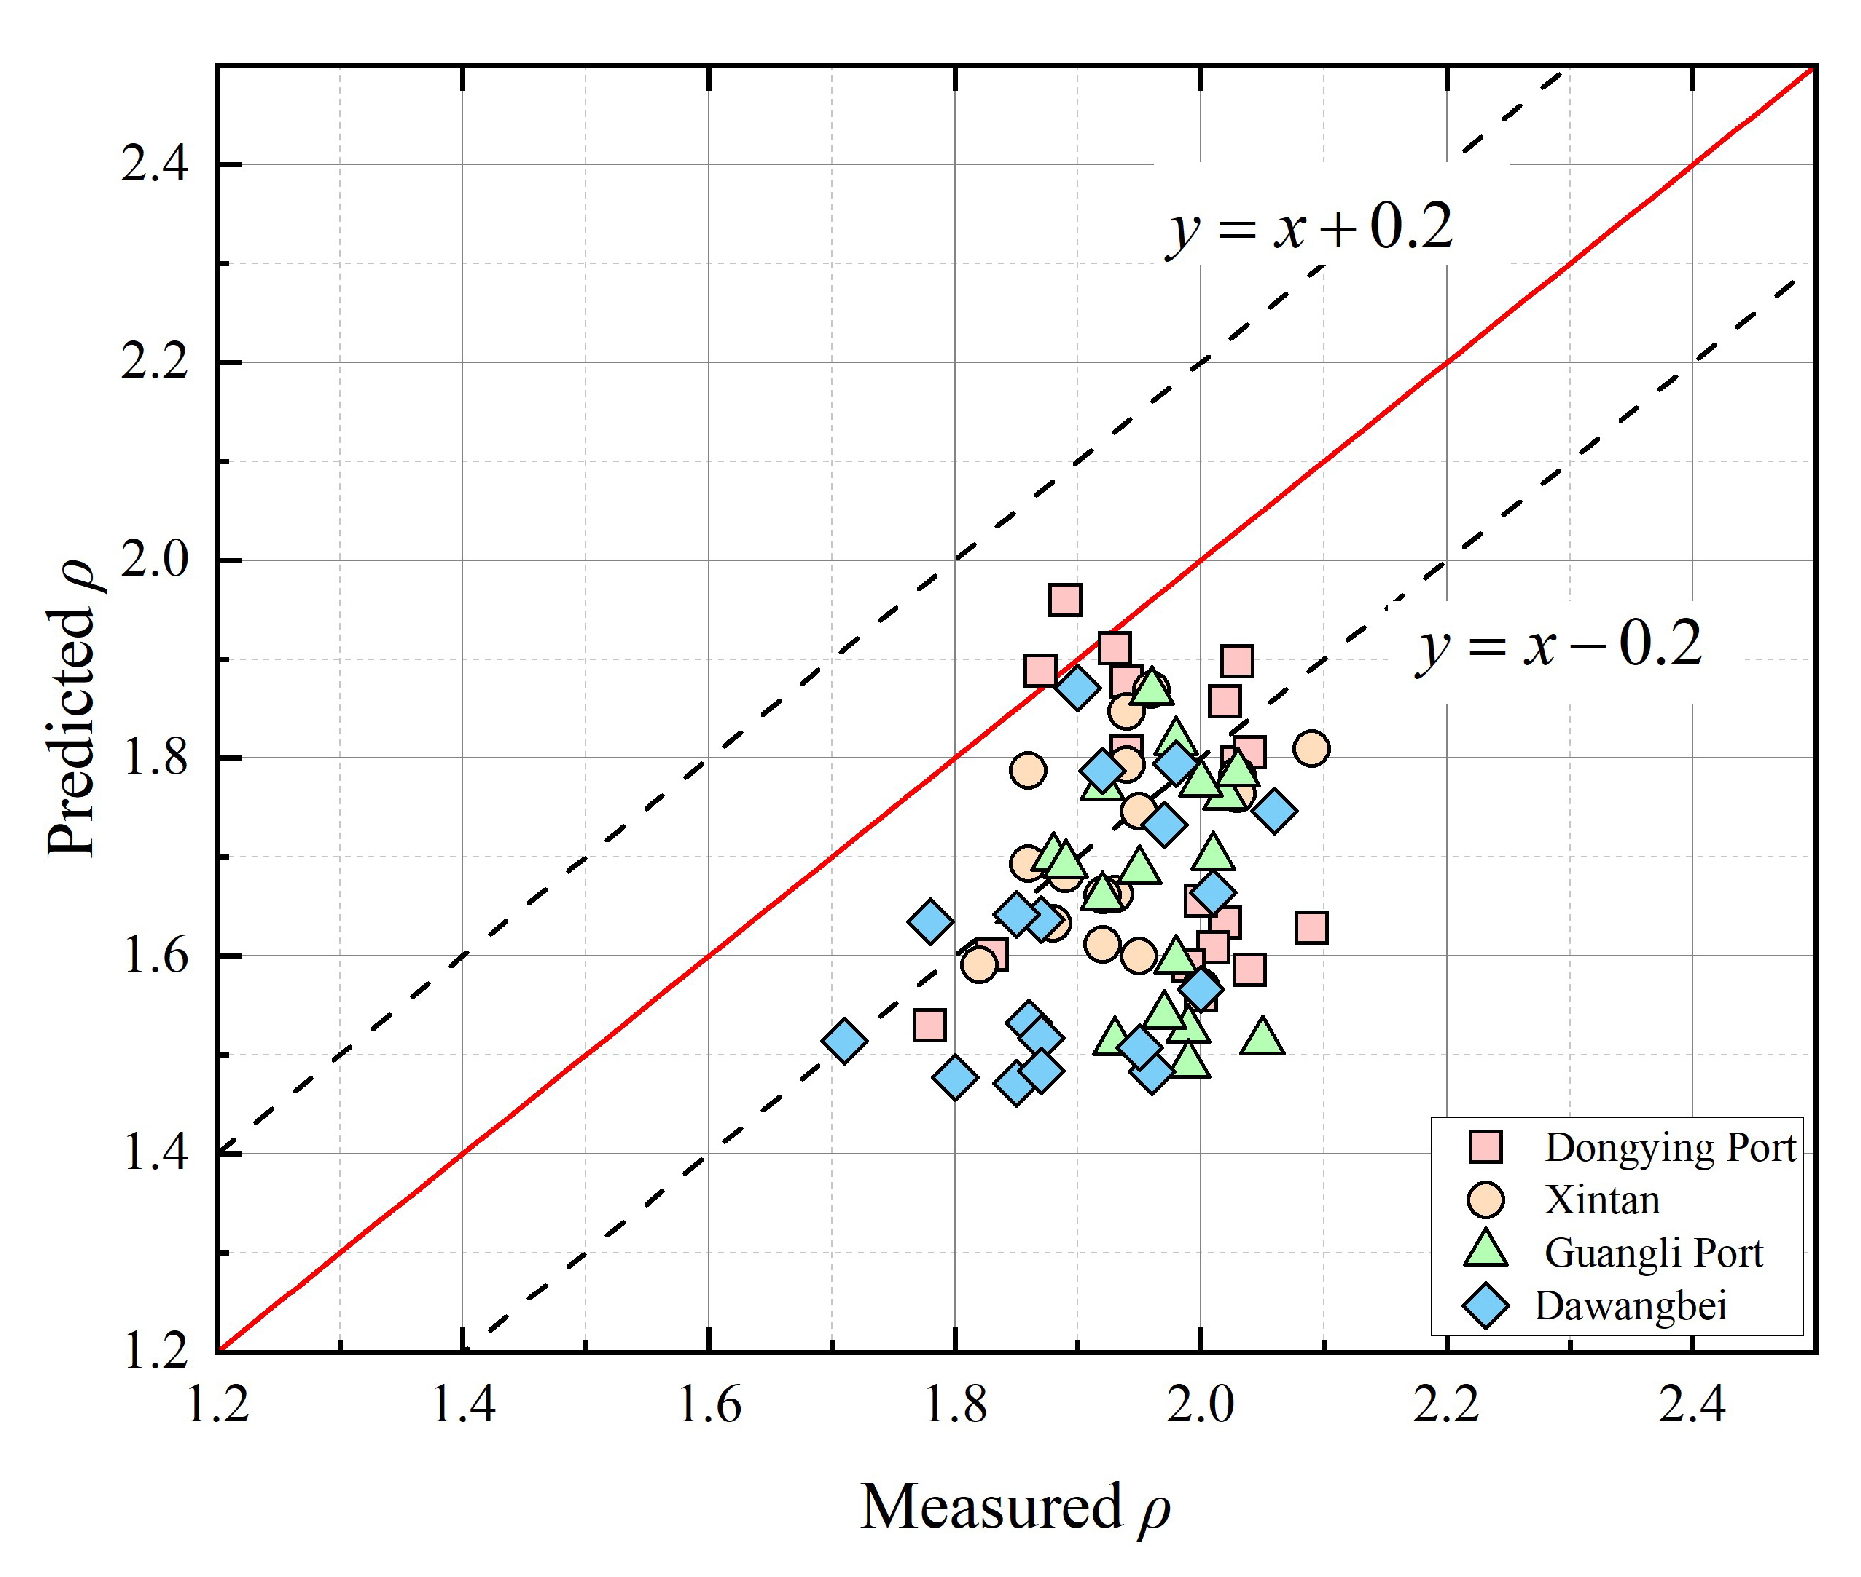
The applicability of Equation (9) was verified using data from the Yellow River Delta. The prediction results for the four drilling locations are plotted separately in
Figure 10. The results generally fall below the 45° line, indicating underestimation, with a maximum deviation of 0.538. The greater the actual soil density, the worse the prediction. Notably, the most significant deviations occur in the drilling data from Dawangbei and Guanli Port.
Combining Equations (6) and (9), an effective method for predicting void ratio using CPTu can be developed, leveraging established relationships between CPTu results and geotechnical parameters:
4. Feasibility Verification
To evaluate the applicability of Equation (10), this study collates a diverse dataset comprising estuarine sediments from the Pearl River Delta [
22], Sabah Power Station marine clays [
23], Nanjing Yangtze River floodplain deposits [
24], Lake Taihu lacustrine soils [
25], Busan marine clays [
26], and Sakarya River alluvium [
27]. Predominantly lacustrine and marine clays, these deposits exhibit measured saturations >90%, with natural densities closely approximating saturated values. For analytical simplicity, a saturation level of 1.0 is assumed for all data points. Soil particle specific gravity is standardized at
, consistent with the calibration framework of Robertson et al. [
21].
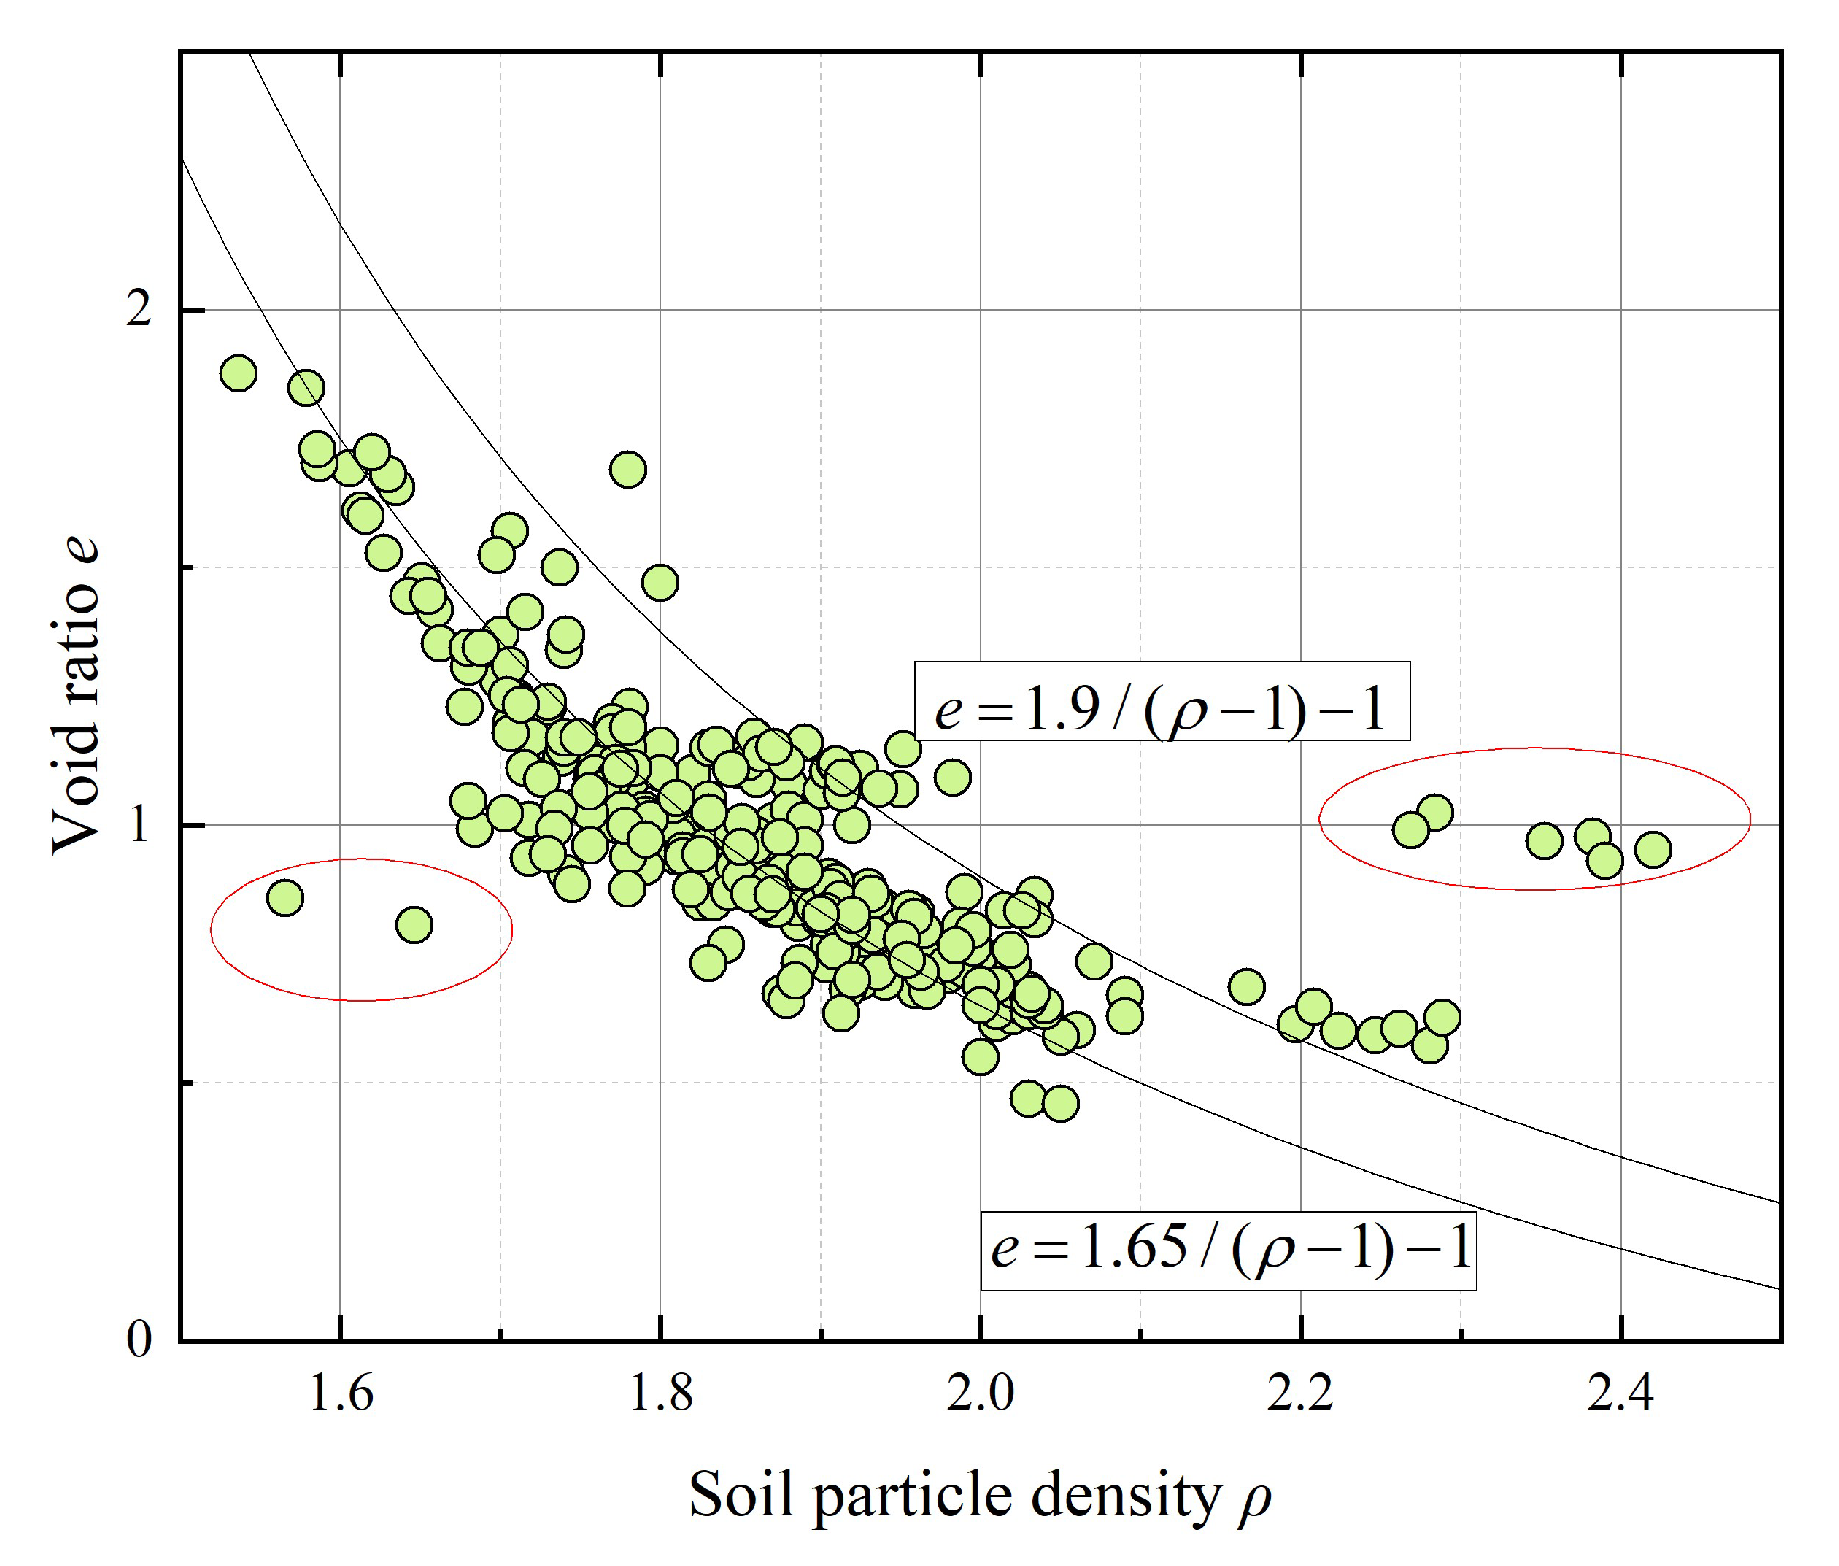
To assess data validity, measured void ratio and soil density values from the literature are plotted in
Figure 11, alongside the theoretical curve derived from Equation (10) with
assigned. Data from Tong et al. [
24] are excluded owing to missing soil density measurements. Notably, certain data points exhibit significant deviations from the classical soil mechanics relationship. Given that soil particle specific gravity typically ranges between 2.60 and 2.70, data within the red-circled region are identified as severe outliers. These discrepancies may stem from soil property heterogeneities, measurement errors, or sampling inconsistencies. Outlier data will be excluded in subsequent analyses to ensure calibration accuracy.
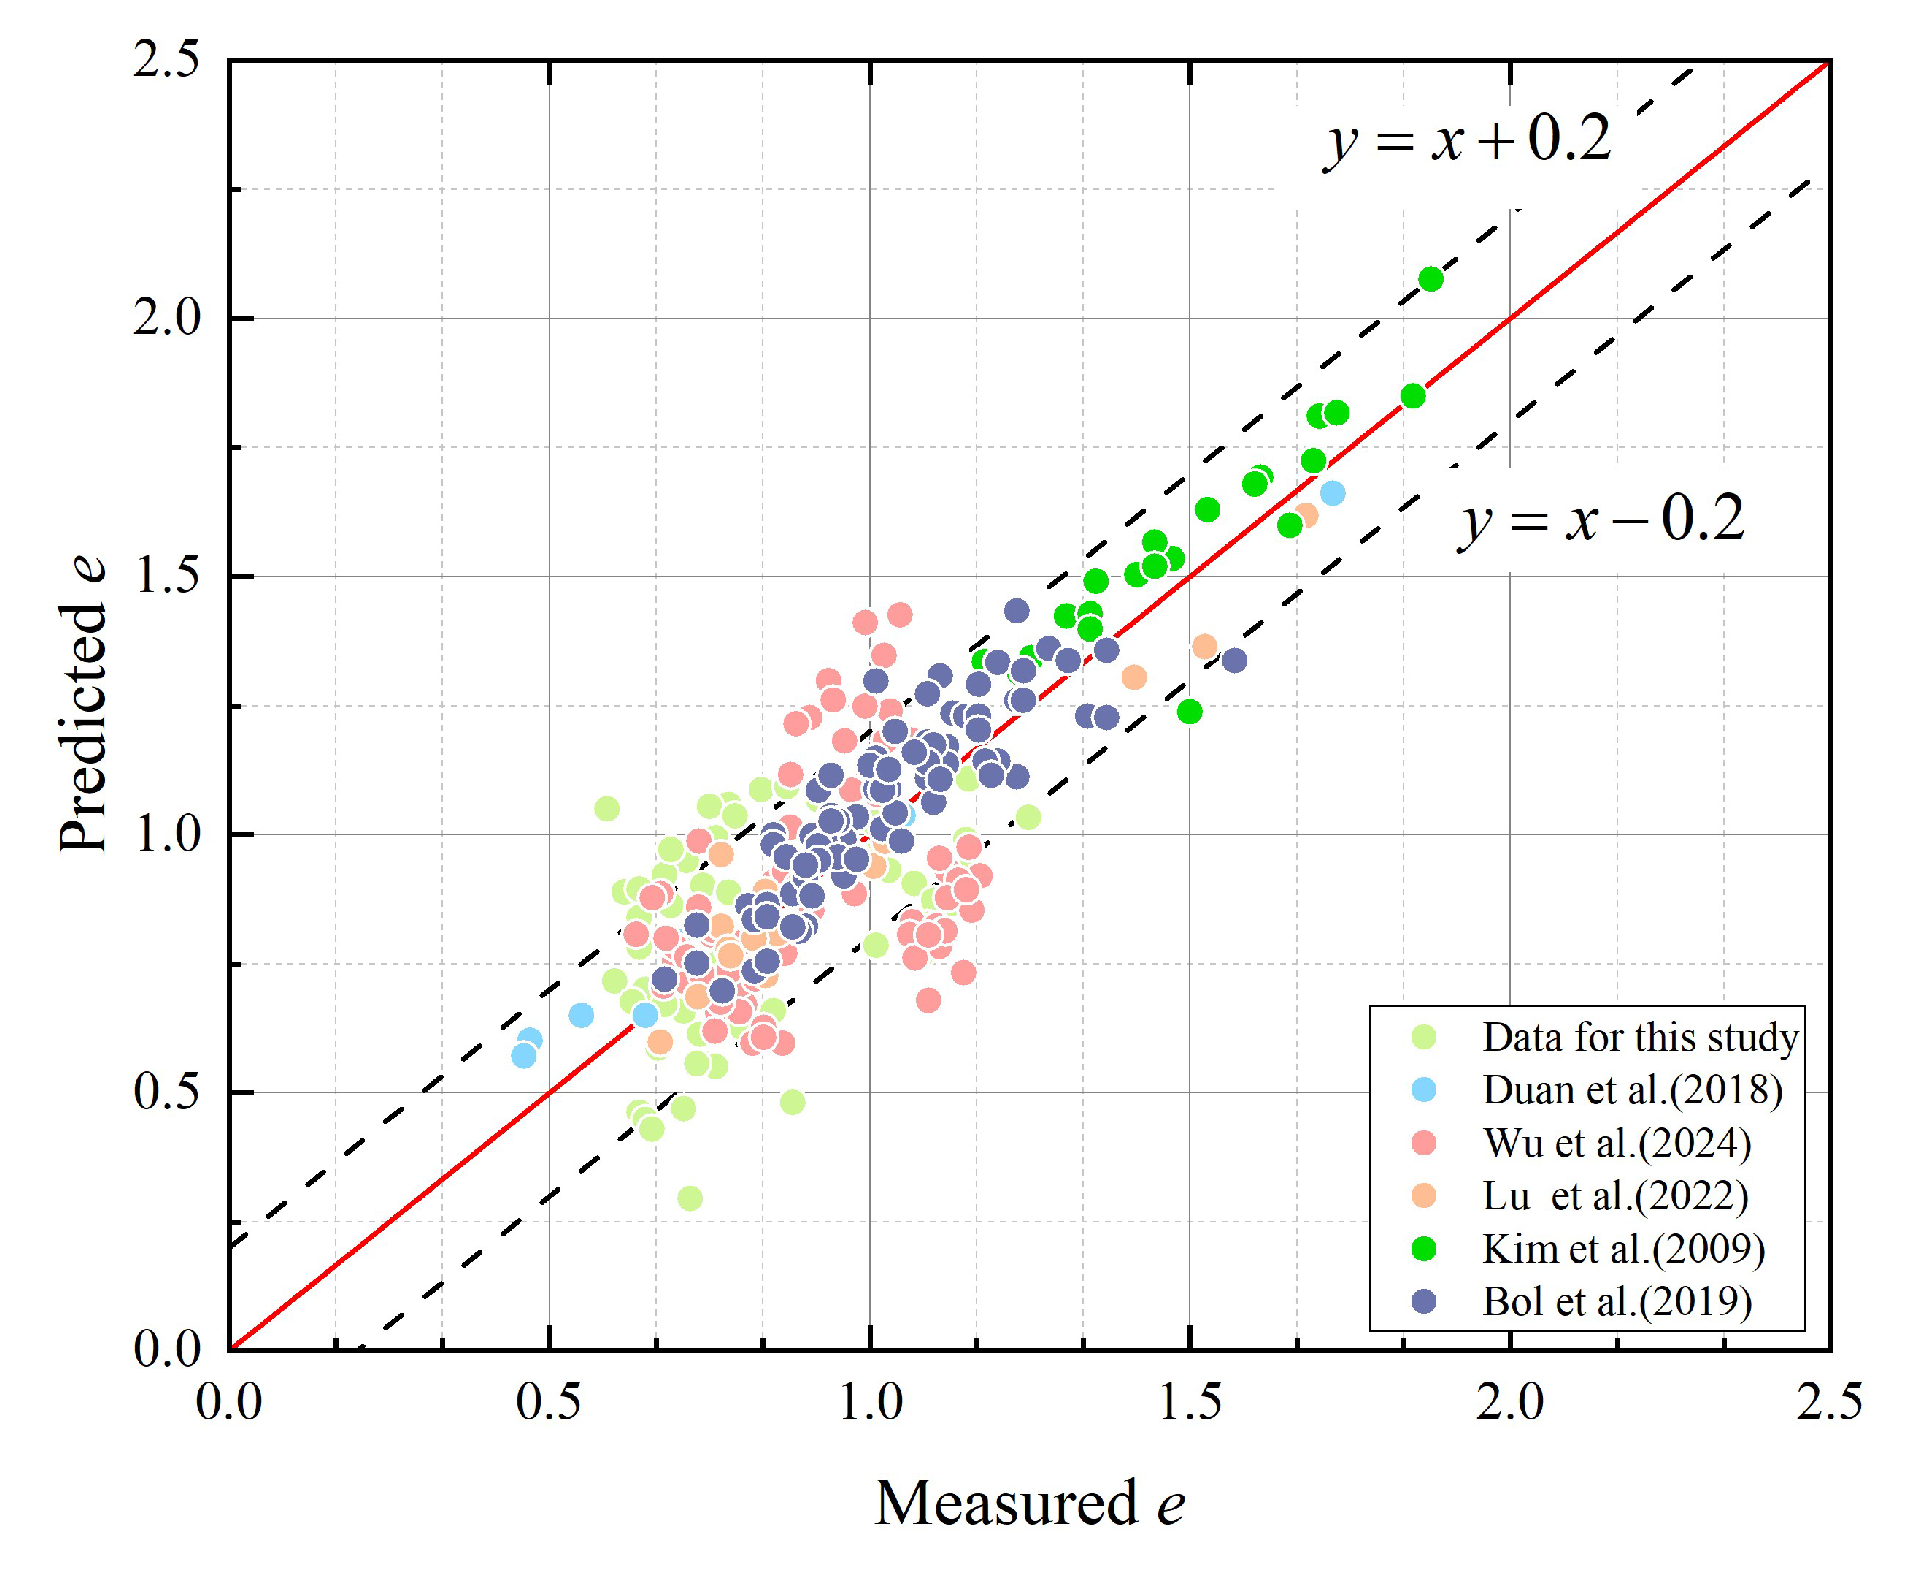
Under the assumption of accurate soil density prediction, measured soil density data were input into Equation (10) to estimate void ratio, yielding the results plotted in
Figure 12. Data points cluster closely around the 45° identity line, indicating that void ratio prediction errors for most datasets lie within the ±0.2 error band. Notable discrepancies between measured and predicted values are predominantly observed in Sabah wind farm data. This suggests that with soil particle specific gravity fixed at 2.65, precise soil density measurements enable reliable void ratio predictions. Given the established accuracy of Equation (6), this further validates the feasibility of indirectly predicting void ratio via in situ soil density measurements.
Robertson’s soil density prediction model was applied to the current data to verify its applicability. The prediction results are plotted in
Figure 13. The overall prediction error is within the range of ±0.2, except for the data from the Yellow River Estuary and the Sabah wind farm. Robertson’s prediction model tends to underestimate the soil density in both the Yellow River Estuary data and the Sabah wind farm. It is worth noting that Robertson pointed out that the prediction accuracy of Equation (9) is affected by the specific gravity of soil particles. When the specific gravity is known, the prediction value can be corrected using Equation (11):
It is evident that some of the corrected results are closer to reality. This also indicates that Robertson’s [
21] prediction model indeed has its limitations and cannot accurately predict soil density in some cases. From
Figure 13, it seems that this uncertainty becomes more pronounced as the actual soil density increases.
Beyond Robertson’s correlation [
21], Mayne has developed a series of semi-empirical frameworks for soil unit weight (
) prediction, which indirectly enable void ratio estimation. In 2007, Mayne [
28] established that shear wave velocity (
) is primarily governed by void ratio and effective stress state, proposing that saturated unit weight (
) could be approximated using normalized
—a foundation for Equation (9). Subsequently, Mayne [
29] integrated
-CPTu correlations to derive a
-prediction model incorporating CPTu parameters: cone tip resistance (
), sleeve friction (
), overburden stress (
), effective stress (
), and pore pressure ratio (
). The normalized pore pressure ratio is the difference in measured and equilibrium pore pressures, normalized with respect to the net cone resistance. In 2012, he introduced a depth-normalized
-based correlation for direct
prediction, followed by a simplified
-only model in 2014 [
30]. Validation against this study’s dataset reveals that these models offer no significant predictive advantages over Equation (9) in terms of accuracy. Notably, Robertson’s framework demonstrates comparable precision with fewer input parameters. Thus, Equation (9) is retained for soil density prediction in this work.
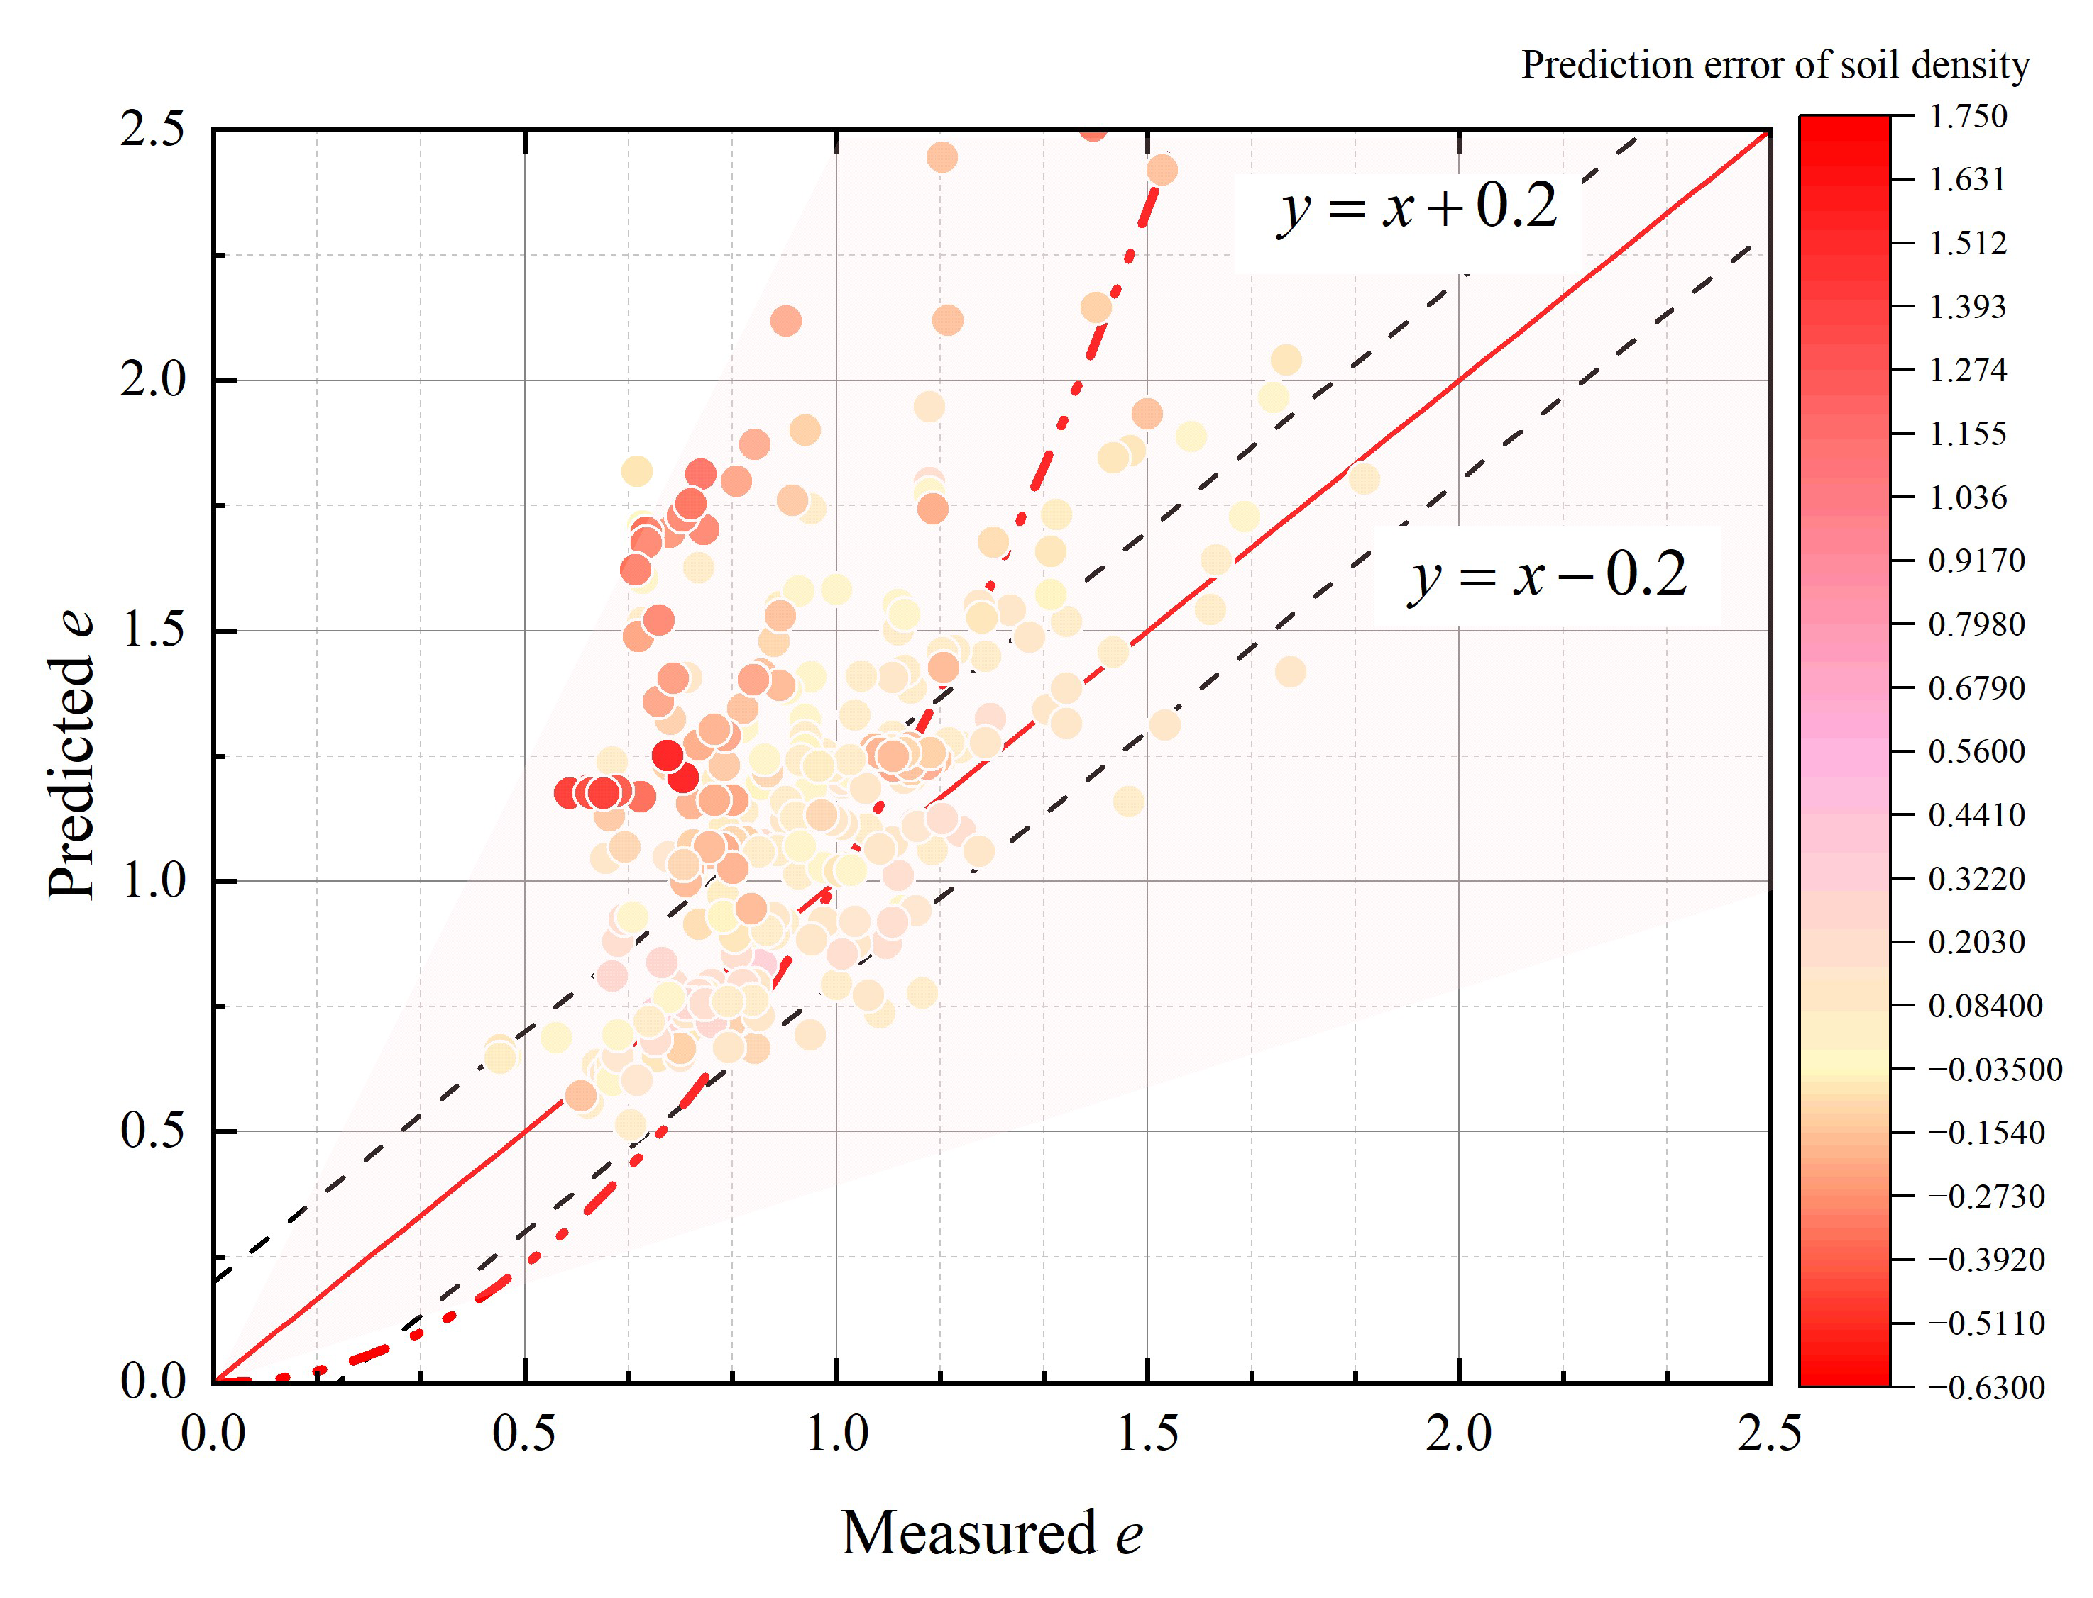
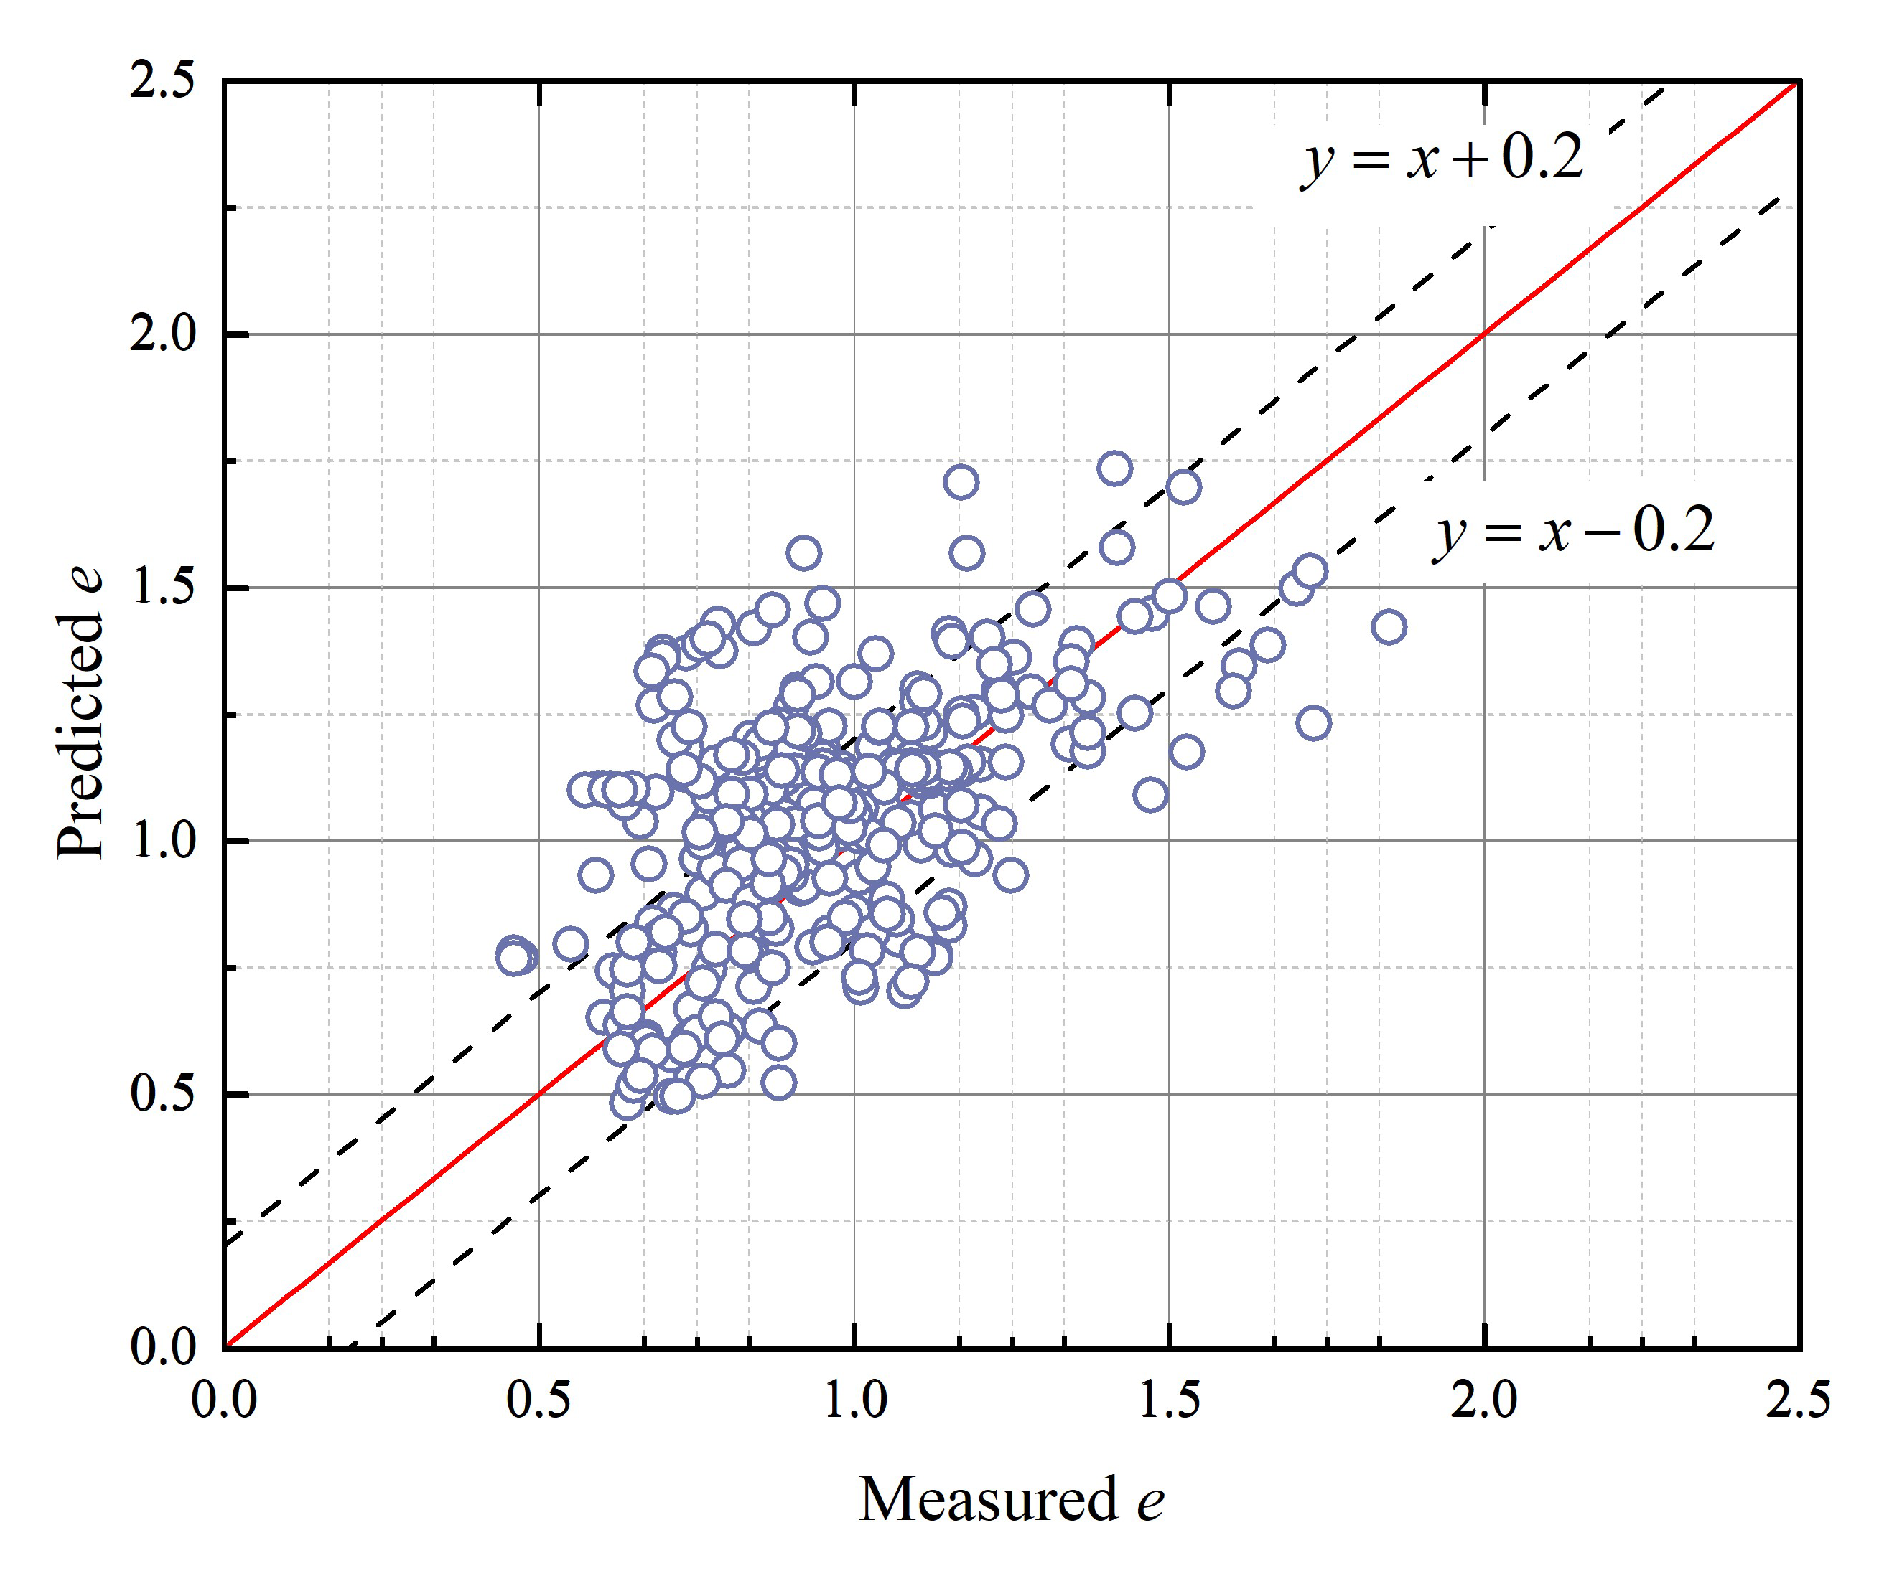
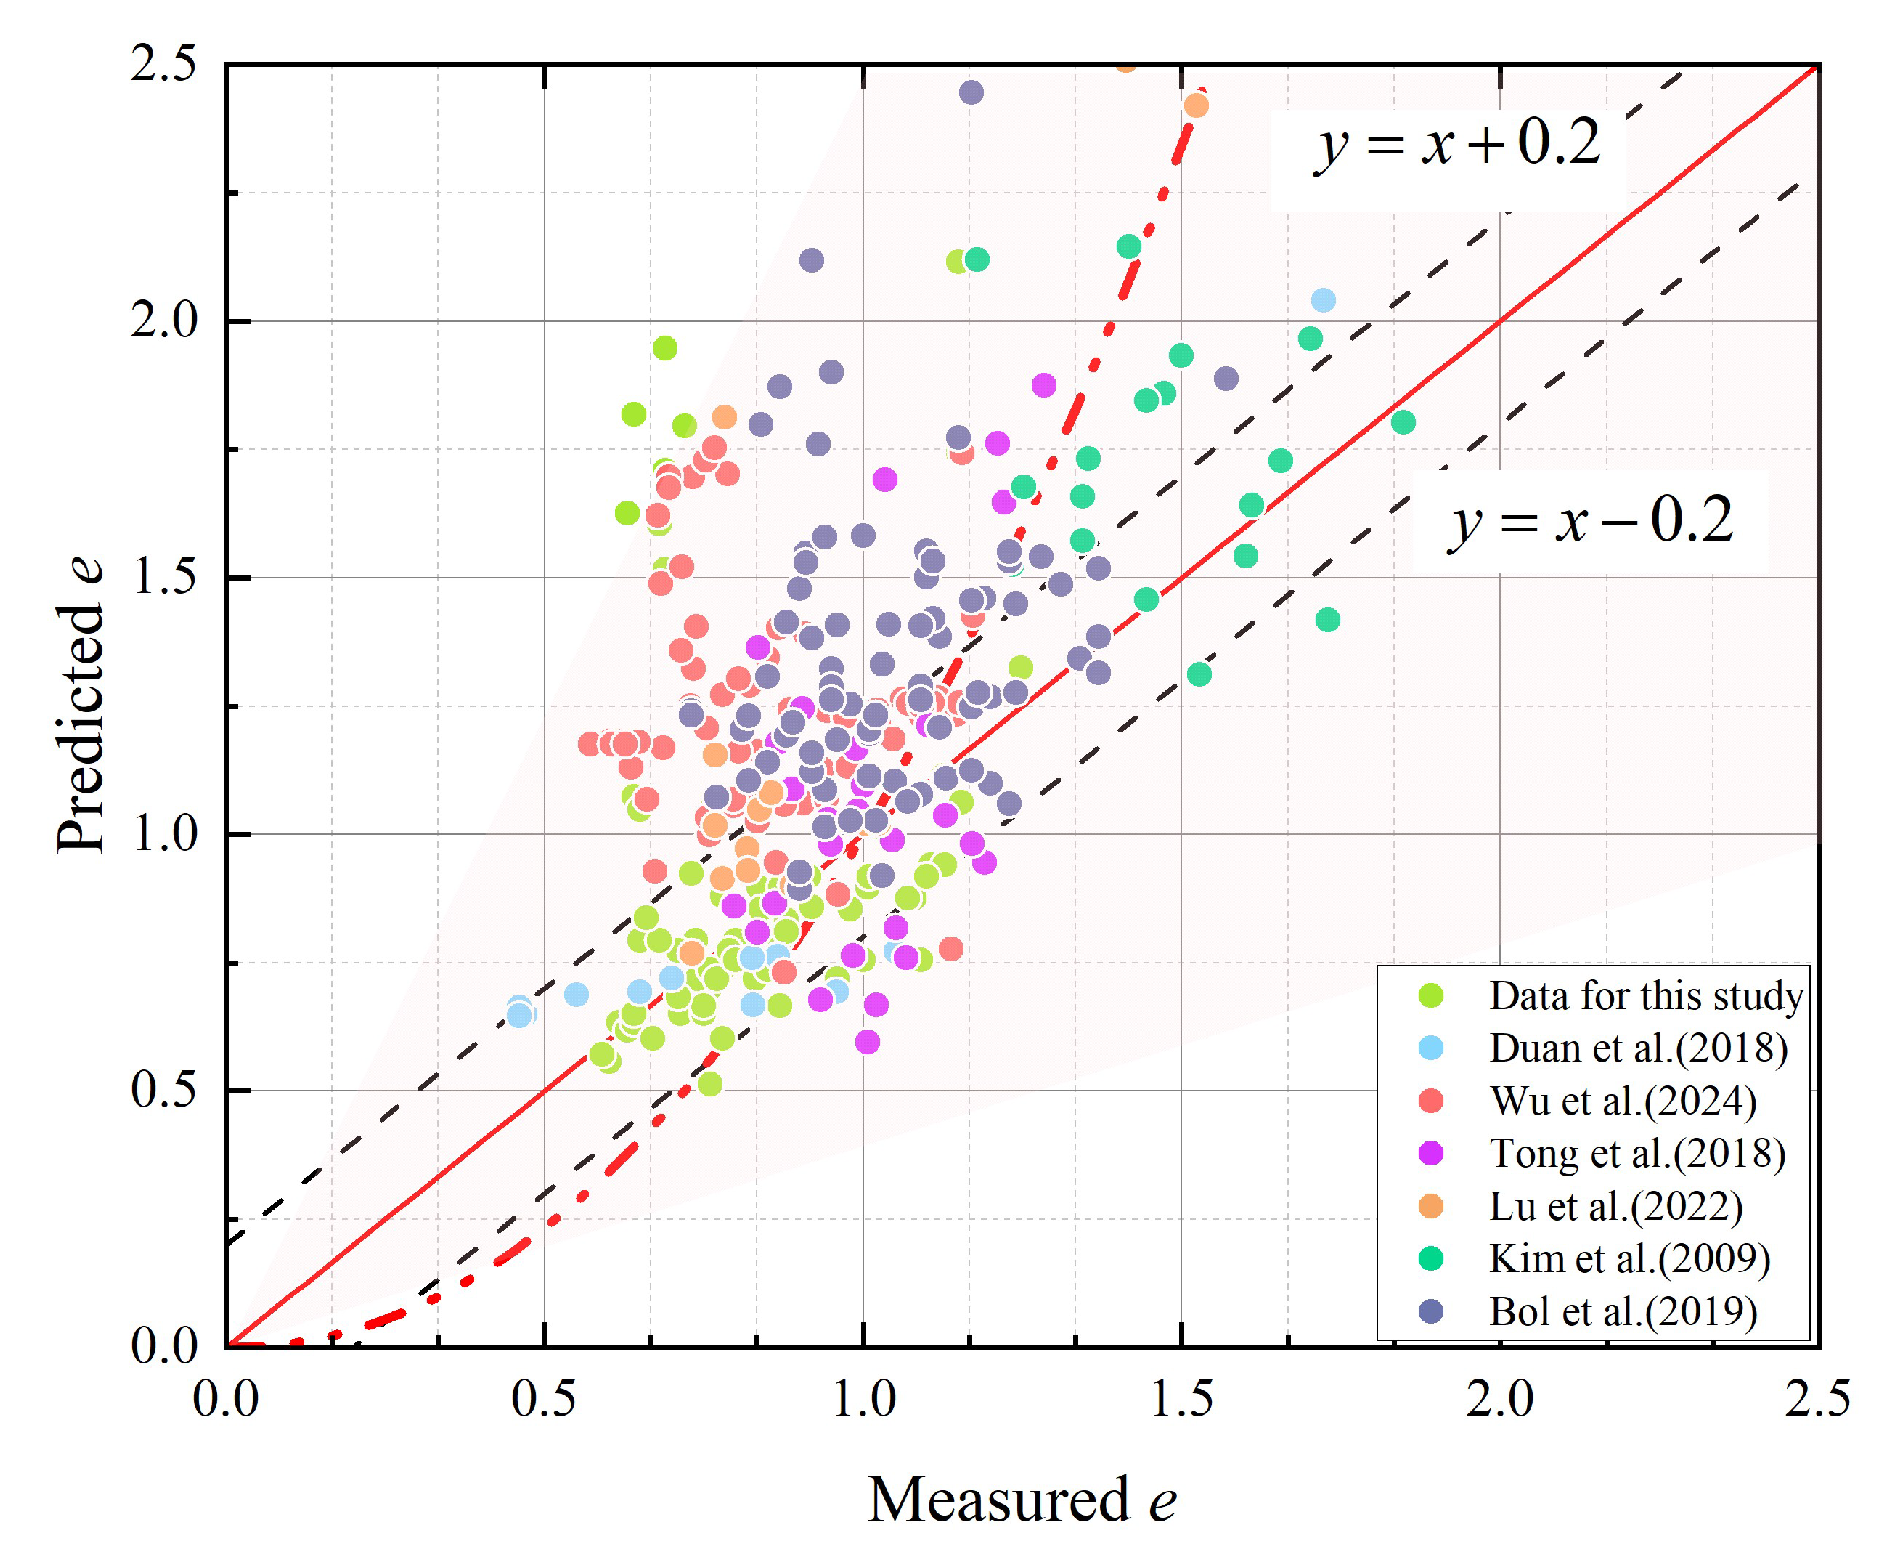
The results of substituting Robertson’s predicted soil density into Equation (10) are shown in
Figure 14. Compared with the accurate prediction results in
Figure 12, the prediction results in
Figure 14 exhibit strong dispersion. The prediction error increases with the increase in actual soil density. It can be observed that the error predominantly shows positive bias, with the void ratio predictions generally being overestimated. In contrast, instances where the predicted values are less than the measured values are relatively rare. Moreover, the degree of overestimation is significantly greater than that of underestimation. This error is related to the prediction accuracy of soil density; overestimated soil density predictions lead to underestimated void ratio predictions, and vice versa. A color map was added to
Figure 14 to account for the impact of soil density prediction errors, resulting in
Figure 15. Using the 45° line as a reference, it can be observed that points farther from the 45° line are represented by darker colors. Similarly to soil density predictions, the void ratio predictions for the Sabah wind farm are overestimated.
As indicated by Equation (6), the smaller the soil density, the larger the void ratio, and the steeper the curve slope. The change in void ratio produced by a unit change in soil density is also greater. Correspondingly, as soil density increases, the void ratio gradually decreases, and this decreasing trend becomes progressively more gradual. This explains why, in the absence of a clear positive or negative bias in soil density prediction errors, there is a significant difference in the positive and negative errors of void ratio predictions. Therefore, Equation (6) provides better prediction results for soils with higher soil density. Conversely, the prediction effectiveness diminishes as soil density decreases. Thus, artificially increasing the predicted soil density or reducing the final void ratio prediction can more accurately predict the in situ void ratio.
It is observed that these deviations exhibit a systematic trend, which can be leveraged to improve void ratio prediction accuracy through modification. By correcting this trend, Equation (12) is derived as follows:
The prediction results of Equation (12) are plotted in
Figure 16. It is evident that the overall prediction performance of void ratio has been significantly improved, with the predicted values closely aligning with the void ratio calculated from the actual soil density. Ultimately, a prediction method for estimating void ratio through soil density is established as follows:
In summary, parameter inversion based on CPTu remains a semi-empirical relationship. While CPTu results can predict various geotechnical parameters to aid in actual engineering construction, the semi-empirical nature of the prediction model inherently introduces uncertainty. Prediction methods established according to certain rules may not be applicable under specific conditions. For instance, diatomite, a typical structured soil, exhibits higher shear strength due to its unique internal structure. This structure often results in a porous and lightweight configuration, characterized by higher porosity and lower density [
31,
32]. Mayne also mentioned this inapplicability in his research. These soil types have special properties that may make the established relationships unable to accurately estimate their unit weights. Mayne suggested determining the unit weight of diatomaceous soils through undisturbed sampling combined with laboratory testing; although this method is more costly and time-consuming, it can reduce estimation errors caused by the particularity of the soil types. During the cone penetration test, when the probe traverses soil layers composed of structured soils, CPTu results tend to reflect larger values. This leads to an overestimation of soil density by Equation (10), ultimately causing the predicted void ratio to be significantly lower than the actual value. In geotechnical engineering, it is essential to assess the physical and mechanical properties of such soils based on their specific usage environments. Another example is organic soil, such as peat soil [
33,
34]. In terms of physical properties, peat soil typically has a higher water content and void ratio, and mechanically, it exhibits lower shear strength. Although this aligns with the prediction trend of Equation (10), as previously mentioned, the smaller the soil density, the greater the change in void ratio resulting from a unit change in soil density. This can potentially lead to significant prediction errors.
Given these considerations, in CPTu inversion studies for geotechnical engineering parameters, it is common to either exclude or separately consider such cases to make the overall patterns more evident.

