Article

Sensory Evaluation and Physicochemical Analysis of Beers with Old Sardinian Wheats

1
Porto Conte Ricerche Srl., S.P. 55 Km 8,400 Località Tramariglio, 07041 Alghero, Italy
2
Istituto di Chimica Biomolecolare, Consiglio Nazionale delle Ricerche, Trav. La Crucca 3, 07100 Sassari, Italy
*
Author to whom correspondence should be addressed.
These authors contributed equally to this work.
Appl. Sci. 2025, 15(16), 9138; https://doi.org/10.3390/app15169138
Submission received: 15 July 2025 / Revised: 14 August 2025 / Accepted: 18 August 2025 / Published: 19 August 2025
(This article belongs to the Special Issue Sensory Evaluation and Flavor Analysis in Food Science)

Abstract

The aim of the present study was to evaluate the acceptability, sensory profile, and physicochemical properties of craft beers produced with unmalted old Sardinian durum (Trigu Murru, Trigu Moru) and soft (Tricu Cossu, Trigu Denti de Cani) wheat varieties. Chemical analysis, by GC-MS, and sensory analysis conducted through a Check-All-That-Apply (CATA) questionnaire, modified Quantitative Descriptive Analysis (QDA), and an acceptability test were performed. The beer brewed with Tricu Cossu received the highest overall liking, characterized by pronounced honey aroma, sweet taste, and cereal notes, supported by a balanced volatile composition. Trigu Denti de Cani also achieved high acceptability, with a profile combining honey and cereal notes, moderate bitterness, and a clean finish. Trigu Murru presented intense cereal and honey notes but was penalized by lower scores in other sensory dimensions, leading to reduced consumer acceptance. Trigu Moru exhibited the lowest liking, dominated by bitter and astringent sensations, though potentially appealing to consumers seeking robust and intense flavor profiles. Multivariate analysis confirmed these sensory-based distinctions, linking each wheat variety to a specific volatile pattern and sensory identity. The multivariate analysis performed on the volatile compounds detected confirmed the differences found with the sensory analysis.

1. Introduction

Durum wheat (Triticum turgidum L. spp. durum) is a staple ingredient of the Mediterranean diet. It has a balanced content of carbohydrates, proteins, and energy and is rich in bioactive compounds and fiber components, which are known to have health benefits [1,2,3]; it is also the main ingredient of traditional and cereal-based baked foods and in recent years has seen increased interest in brewing [4,5,6].
Over the last decade, microbreweries have directed their attention towards locally sourced raw ingredients, particularly hops and cereals [7,8,9,10,11,12,13,14,15], as varying populations and growing environments can impact beer flavor [16]. The cultivation and the use of old wheat varieties has been revalued, also in order to contribute to biodiversity [17]. Old and ancient grains are chosen in diets and in traditional food and beverage production for their nutritional and sensorial profile [18,19,20]. Old durum and soft wheat varieties contain phytochemicals with antioxidant properties, such as phenolic compounds in various forms; fibers; vitamins of the B group; vitamin E; zinc; magnesium; potassium; iron; and phytoestrogens [21,22].
The “craft beer revolution” [23] has led to an increase in the use of cereals other than barley. The use of durum wheat and malted or unmalted cereals offers opportunities to meet the growing demand for distinctive beer styles, and also, old wheat varieties can be used as innovative ingredients [15,24,25].
Old durum and soft wheat constitute an appealing alternative for the marginal Mediterranean areas that are no longer cultivated and, being known for their environmental resilience, can help brewing sustainability. Expanding the potential uses of these local cultivars could help preserve and raise their value in cropping systems [15,26]. One way to encourage the use of these old grains and “give biodiversity a chance” would be to serve niche markets, including that of craft beers.
Consumers perceive craft beers as being of higher quality than mass-produced beers [27] and this is leading to a group of consumers skilled about beer [28,29]. These consumers also enjoy seeking new and complex flavors in their beers. Craft beers are seen as an experience, offering pleasure, social recognition, and a sense of identity that consumers do not usually associate with beer produced by industries [27,30]. Donadini et al. also found that a positive experience with craft beer increases the willingness to try other products and seek more information about the beer [31].
The Check-All-That-Apply (CATA) method and nine-point hedonic scales were used in the present study to investigate consumers’ perceptions and liking of beers made with unmalted durum and soft wheat kernels.
The aim of this study was the investigation of the chemical and sensorial profiles and the acceptability of beers obtained by unmalted old Sardinian durum (Trigu Murru, Trigu Moru) and soft (Trigu Denti de Cani, Tricu Cossu) wheat varieties. The old durum wheat variety Trigu Murru was among the landraces already present in Sardinia before 1925 [32]. Trigu Moru, Tricu Cossu, and Trigu Denti de Cani are all included in the Regional Repertoire of Agrobiodiversity established by the Sardinian Regional Council with the aim of protecting the biodiversity of its territory from an economic, scientific, cultural, and environmental perspective [33]. The soft varieties (Tricu Cossu and Trigu Denti de Cani) are used for bread and sweet production but have always represented a marginal part of wheat production in Sardinia [34].

2. Materials and Methods

2.1. Beer Production

Each beer was made in batches of 100 L in the pilot plant facility at Porto Conte Ricerche Srl (Alghero, Italy). The batches contained 76% commercial Pils malt (Weyermaan, Bamberg, Germany) and 24% of either Tricu Cossu unmalted soft wheat (C1); Trigu Murru unmalted durum wheat (C2); Trigu Denti de Cani unmalted soft wheat (C3); or Trigu Moru unmalted durum wheat (C4). The control batch contained 76% commercial Pils malt and 24% commercial wheat malt (X). Malts were ground in a two-roll mill spaced at 1 mm.
Mash-in was performed using 75 L of water added with 20 g of CaSO4 (Mr. Malt, Udine, Italy) and 10 g of CaCl2 (Mr. Malt, Udine, Italy). Mash-in was conducted at 64 °C for 60 min and then at 72 °C for 10 min and the mixture was finally kept for 10 min at 78 °C for mash-out. The first wort was transferred to a kettle and the spent grain was washed using water at 78 °C, bringing the wort to a final volume of 100 L. The wort was boiled for 60 min; Saaz hop (Mr. Malt, Udine, Italy) was added at the start of boiling for bittering at a final International Bitter Unit (IBU) of 40. The boiled wort was separated from the hot trub and then cooled at 18 °C. Wort fermentation was carried out using dry yeast US-05 (Fermentis, Marcq-en-Baroeul Cedex, France) at 15 °C.
At the end of fermentation, the temperature was lowered to 4 °C for two weeks in order to produce the matured beers. For each batch, approximately 80 L of fermented beer was obtained. Approximately 250 green bottles (33 cL) from each batch were added with 6 g/L of glucose (Uniglad Ingredienti, Grinzane Cavour, Italy) and 0.05 g/L of yeast F2 (Fermentis, Marcq-en-Baroeul Cedex, France) for bottle conditioning at 10 °C for 15 days (conditioned beer). Three technological replicates were performed for each experimental condition; 2 samples for chemical analysis and the samples used for sensorial analysis were randomly chosen from each batch between the conditioned bottles stored at 4 °C.

2.2. Standard Quality Attributes of Beers

Original extract (% w/w), real extract (% w/w), apparent extract (% w/w), the real degree of fermentation (RDF %), alcohol (% v/v), density (g/cm3), pH, and CO2 concentration (g/L) were measured with a DMA 4500 density meter (model PBA-B Generation M, Anton Paar, Graz, Austria). Color was measured spectrophotometrically at a wavelength of 430 nm using an Agilent Cary 60 spectrophotometer (Agilent, Santa Clara, CA, USA), according to the EBC 9.6 method [35]. To achieve a turbidity of less than 1 EBC, beer samples were filtered. A 10 mm glass cuvette was used to quantify the absorption.
Foam stability was measured with a NIBEM-TPH foam stability tester (Haffmans, Zeist, The Netherlands) according to the official Analytica EBC method 9.42.1 [36]. Analysis was performed at 20 °C by adding carbon dioxide to fill a standard glass with foam. The NIBEM-TPH tester calculates the time it takes for foam to collapse over a 30 mm distance.
The Total Polyphenol Content (TPC) of samples was determined using the Folin–Ciocalteu method with some modifications [37]. In detail, 0.1 mL of sample was added to 0.5 mL of diluted Folin–Ciocalteu reagent. After mixing, 1 mL of sodium carbonate solution (7.5% w/v) was added and the mixture were incubated for 30 min at 30 °C in the dark and analyzed spectrophotometrically at 760 nm (Agilent Cary 60 spectrophotometer—Agilent, Santa Clara, CA, USA). The results are expressed in mg Gallic Acid Equivalent (GAE) per L (GAE mg/L) of beer. All measurements were taken in duplicate for each sample.

2.3. Analysis of Beer Volatile Organic Compounds (VOCs)

A total of 5 mL of degassed sample was placed into 10 mL headspace vial with 1 g of NaCl (Sigma-Aldrich, St. Louis, MO, USA) and sealed with PTFE/silicone septa. Beer VOC composition was qualitatively evaluated by head-space solid phase microextraction (HS-SPME) followed by gas chromatography coupled with mass spectrometry (GC–MS) analysis. Prior to extraction the vials were incubated for 10 min at 60 °C. The extraction of VOCs was performed using Divinylbenzene/Carboxen/Polydimethylsiloxane (DVB-CAR-PDMS) fiber (Supelco, Bellefonte, PA, USA). The extraction time was fixed at 30 min, after which the sample was desorbed for 10 min at 250 °C with a split flow of 5 mL/min into the injector. The fiber was activated daily, following the manufacturers’ instructions. The sample was equilibrated under agitation during both the incubation and extraction process. The GC–MS analysis was carried out using a TRACE GC 1300 (Thermo Scientific, Hudson, NH, USA) equipped with an ISQ single quadrupole (Thermo Scientific, Hudson, NH, USA). The chromatographic separation was performed on a SLB-5ms capillary column (60 m × 0.25 mm × 0.25 μm film thickness) (Supelco, Bellefonte, PA, USA) with the following temperature program: it was held at 35 °C for 7 min, then increased to 200 °C at 3 °C/min and was held for 7 min, then increased to 250 °C at 5 °C/min, and finished at the highest temperature for 10 min. Helium was used as carrier gas, at a constant flow of 1 mL/min. A temperature of 250 °C was established for the transfer line and 270 °C for the ion source.
The quadrupole scan range was 30–250 amu, and ionization energy was set to 70 eV. The data were analyzed by the means of the Trace finder (Thermo Fisher Scientific, Hudson, NH, USA). A linear mixture of n-alkanes (C7–C30) was analyzed separately under the same chromatographic conditions to calculate the retention indexes. The identification of the components was performed by comparing their retention indexes with the built-in libraries or data from the literature and by matching their spectra on mass spectral libraries (NIST, 2008 software, Mass Spectral Search Program V.2.0d, Washington, DC, USA, version 2.2 June 2014) [38]. For positive identification, all Identity Spectrum Match factors exceeding 850 as produced by the NIST Identity Spectrum Search algorithm (NISTMS Search 2.0) were deemed appropriate. The peak areas of the gas chromatographic signals (AS) obtained from the integration using the Xcalibur 4.4 software (Thermo Fisher Scientific) were divided with the peak area of the internal standard (AIS). The obtained results were expressed as a relative percentage of the total sum of the AS/AIS gas chromatographic signals and compared to the peak areas present in mass spectral libraries (NIST).

2.4. Sensorial Analysis

Sensorial analysis was conducted in the Food Science Sensory Laboratory of Porto Conte Ricerche (Alghero, Italy), designed in accordance with ISO guidelines [39].

2.4.1. Quantitative Descriptive Analysis

Before conducting this study, all panelists provided informed consent to participate (Supplementary Material SM1). A modified Quantitative Descriptive Analysis (QDA) protocol was applied to assess the sensory characteristics of the beer samples [40]. QDA is a standardized sensory method in which trained panelists rate the perceived intensity of specific attributes. In the classical approach, an unstructured 10 cm line scale is often used; however, in this study, the methodology was adapted to fit the exploratory context and the nature of beers. The key modifications included a simplified attribute selection phase, a reduced panel size suitable for preliminary analysis, and the use of a structured 7-point scale, ranging from 1 (“not perceived”) to 7 (“very intense”). Panelists underwent training using reference standards and consensus definitions for each descriptor, which included aroma terms (e.g., honey smell, cereal smell, yeast smell), basic tastes (acid, sweet, bitter), mouthfeel attributes (viscous, astringent), and alcohol perception [41,42]. This adaptation of the QDA methodology is consistent with practices reported in the literature, which acknowledge the need for flexible panel sizes, simplified attribute sets, and structured scales in applied sensory research [43].
Prior to testing the samples, the panel members engaged in a group discussion to reach a consensus on the characteristics and descriptors of the reference beers, which were different from those under examination. Samples were prepared under identical conditions, standardized and presented in ISO Wine Tasting Glasses (21.5 cL); blind coding was applied using random three-digit codes, which were recorded and labeled accordingly. The prepared samples were served in glasses covered with a glass top pre-labeled with their respective codes at a temperature of (8 ± 2 °C) in an odor-free testing room.
The sensory profiles of the beers were determined using trained panelists (8 males, aged 45–60). The panelists involved in the beer descriptive analysis had, on average, 10 years of experience in sensory evaluation. The order of presentation was randomized across panelists and sessions. To quantify the intensity of the beer attributes, the panel used a seven-point horizontally oriented scale anchored at “not perceived at all” and “extremely intense” at the left and right ends, respectively. Judges were instructed to drink and swallow each sample and rate the intensity of each.
The sessions were conducted on the same day, with a minimum 2 h break between them. Assessors followed a standardized sequence: rinsing their mouths, chewing a cracker with their front teeth, rinsing again, and allowing a 2–3 min waiting period between samples to ensure full palate recovery. Presentation orders were systematically varied across assessors and replicates to balance the effects of serving order and carryover. The volume of each sample was restricted to 20 mL to ensure that the total alcohol intake during the session remained below 10 g of pure alcohol.
Assessors were instructed not to smoke, eat, or drink anything except water at least one hour before the tasting sessions. All subjects provided written informed consent before this study began.
The panel underwent orientation sessions before agreeing on the attributes to be evaluated. Reference standards were prepared and used during training sessions, with flavor reference standards purchased from Aroxa (Cara Technology, Leatherhead, Surrey, UK). All samples and reference solutions were prepared in a food-safe environment. Beer samples were evaluated blindly in triplicate to minimize potential biases and quantify the intensity of beer attributes.
To assess the panel performance and identify significant differences in their ratings, a three-way ANOVA (sample, panelist, and replicate) with interaction was applied to the attribute scores collected across three assessments. The panel performance was monitored during training to evaluate reproducibility and discriminatory ability, both individually and as a group. Panel performance was analyzed using PanelCheck (V1.4.2), following the workflow suggested by Tomic et al. [44]. The mixed three-way ANOVA model (sample, replicate, and panelist) was applied to all sensory attributes, and the corresponding interactions between factors were examined to determine their effects on panel performance. Tukey’s Honest Significant Difference (HSD) test was used to evaluate significant differences between samples for each attribute.

2.4.2. Consumer Study

In this study, the Check-All-That-Apply (CATA) method and nine-point hedonic scales were employed to investigate the perception of craft beers, derive a consumer profile, and assess consumer liking of the same beers. The CATA method consists of a structured questionnaire containing a variable number of terms or attributes, where consumers are asked to select all the attributes they perceive and consider applicable to the evaluated product. Previous studies have demonstrated the reproducibility of CATA results and their consistency with descriptive profiles generated by trained panels [45]. The CATA method is particularly suitable for this type of study, as it requires minimal instructions for panel members and is relatively easy to understand and implement. Additionally, it utilizes a simple and accessible sensory vocabulary for consumers [46].
Participants were recruited from among researchers, administrative staff, employees of companies incubated at the center, and customers of a well-known brewery, Hamelin (Sassari, Italy).
Two focus group sessions were conducted with ten expert craft beer technicians to identify the descriptors to be included in the CATA questionnaire. The responses provided during the focus groups were transcribed, with non-essential words removed, mention frequencies measured, synonymous terms grouped, and recurring themes and participant statements identified.
Participants (n = 76), aged between 28 and 65 years, were selected based on their craft beer consumption habits, interest in this study, availability to participate, absence of pregnancy or breastfeeding, and lack of allergies or sensitivities to beer (gluten). Consumers eligible for participation met the following criteria: (i) they liked beer and consumed it at least once a fortnight, (ii) they could list at least three beer styles, and (iii) they had an interest in trying new beers. Written informed consent was obtained from all participants (Supplementary Materials 2).
Seventy-six consumers (46 men and 30 women; mean age = 42.4 years) completed the CATA questionnaire, which included 20 sensory attribute terms related to craft beers. Following recruitment, the attribute lexicon was developed. Two sessions were then conducted to refine the initial attribute list using the CATA technique and group discussions. These sessions helped eliminate ambiguous and overlapping descriptors while highlighting the most relevant and discriminating attributes. Sensory attributes were randomized following the recommendations of Ares and Jaeger [47].
During testing, participants were asked to select as many attributes as they deemed appropriate to describe each sample. Samples were coded with three random digits and evaluated monadically by participants.

2.4.3. Consumer’s Preference and Attitude Toward Craft Beer Consumption

The hedonic survey of consumer acceptability was carried out using an acceptance test and a nine-point hedonic scale. Consumers rated the samples on a scale from 1 to 9, ranging from ‘extremely dislike’ to ‘extremely like’ [48].
A total of 124 subjects participated in the consumer study: 92 males and 32 females aged 32–60 years. They were asked to complete an anonymous questionnaire collecting demographic data (age, gender, education level) and specific food frequency information. All consumers were screened before participation, which was entirely voluntary. Furthermore, all participants provided written consent prior to the sensory evaluation.
The final products tested in this study were confirmed to be safe for consumption, and participants were given the option to withdraw from the study at any time without providing justification. Consumers received non-monetary compensation for their participation.
Ethical review and approval were waived for this study. In the relevant interstate standards, our research type does not require ethical approval. Our study was non-clinical, non-medical, and non-invasive; no health and no personal data were used. Only anonymous information and data concerning individual differences in perception of limited sensory characteristics were included (Supplementary Material SM3).

2.5. Statistical Analysis

Statistical analysis was performed using XLSTAT version 2023.1.4 (Lumivero statistical and data analysis solution, Paris, France). The panel’s performance was evaluated using PanelCheck (V1.4.2). A mixed three-way ANOVA model (sample, replicate, and panelist) was applied to all sensory attributes, and the corresponding interactions between factors were examined to assess their effects on panel performance. Tukey’s Honest Significant Difference (HSD) test was used to determine significant differences between samples for each attribute.
Statistical analyses of volatile compounds were performed in the Python 3.11 environment using dedicated libraries. Data were preliminary pre-processed by grouping and averaging replicate measurements (e.g., C1, C1) to obtain representative profiles. The data matrix was standardized using z-score normalization via the Standard Scaler module from the scikit-learn library. Principal Component Analysis (PCA) was applied using sklearn. decomposition to reduce dimensionality and explore the multivariate structure of the volatile compound dataset. Two principal components (PC1 and PC2) were retained for analysis and visualization, capturing the majority of variance within the dataset. A PCA biplot was constructed to jointly represent sample scores and variable loadings. Central horizontal and vertical axes were included in the biplot by plotting dashed lines at PC1 = 0 and PC2 = 0 to emphasize the coordinate origin. Sample points were labeled with their corresponding codes and visually represented as blue circles. Variable loadings were illustrated as black arrows originating from the center, each labeled with a numeric identifier corresponding to a compound legend.

3. Results

3.1. Characterization of Beers

The technological parameters of beers are reported in Table 1. Differences were observed between samples for all parameters except for RDF and pH (Table 1).
The Volatile Organic Compounds (VOCs) identified are reported in Table 2. C1 showed a higher concentration of esters and a lower concentration of carboxylic acids, whereas C2 showed a higher concentration of alcohols (Figure 1). Likewise, C3 and C4 showed a higher alcohol concentration, compared to X.
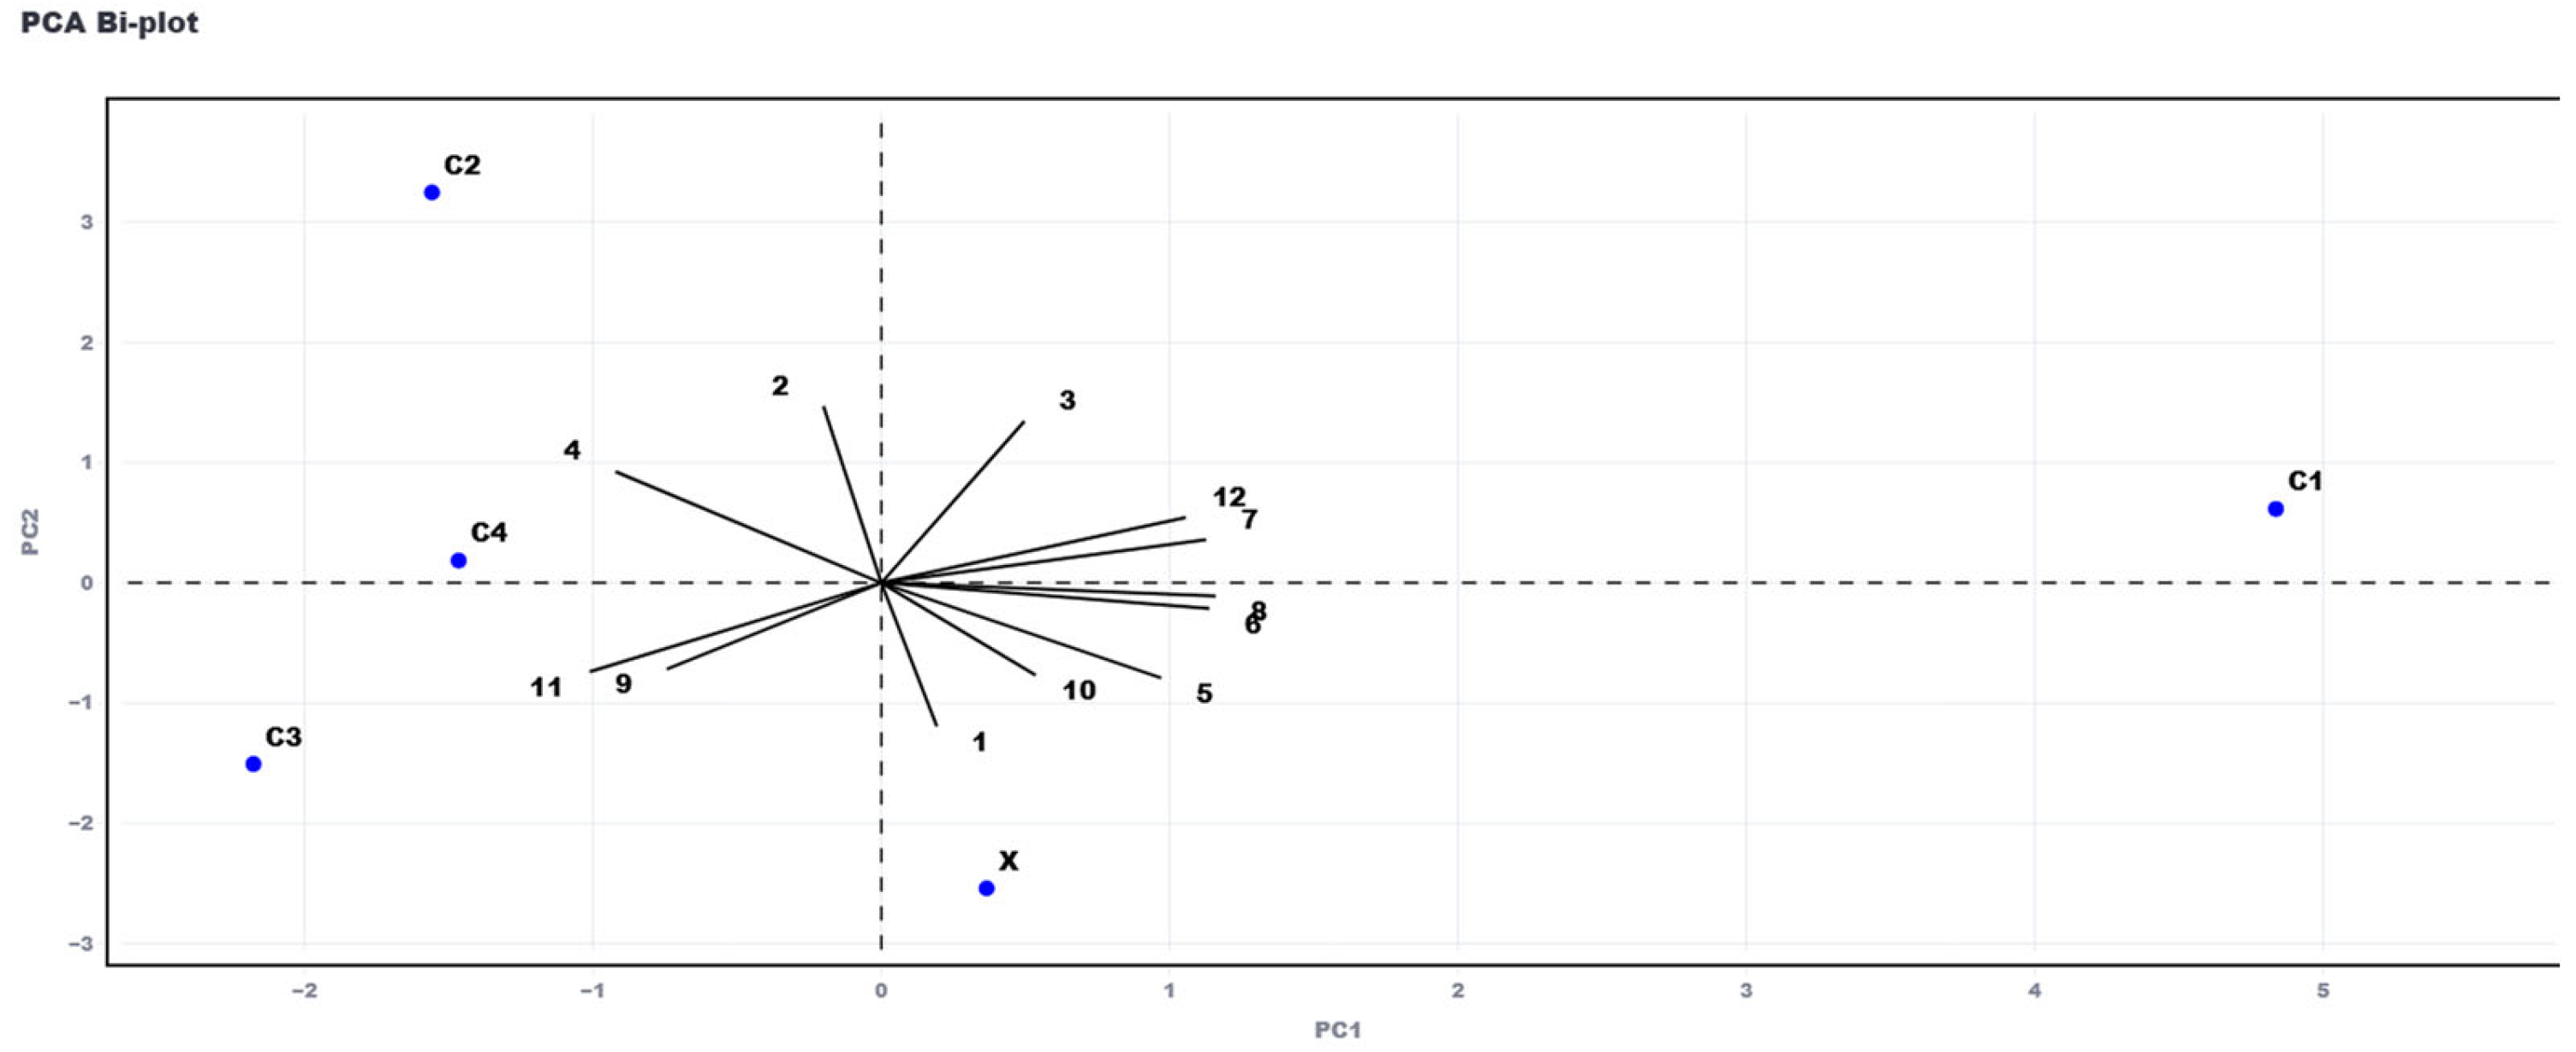
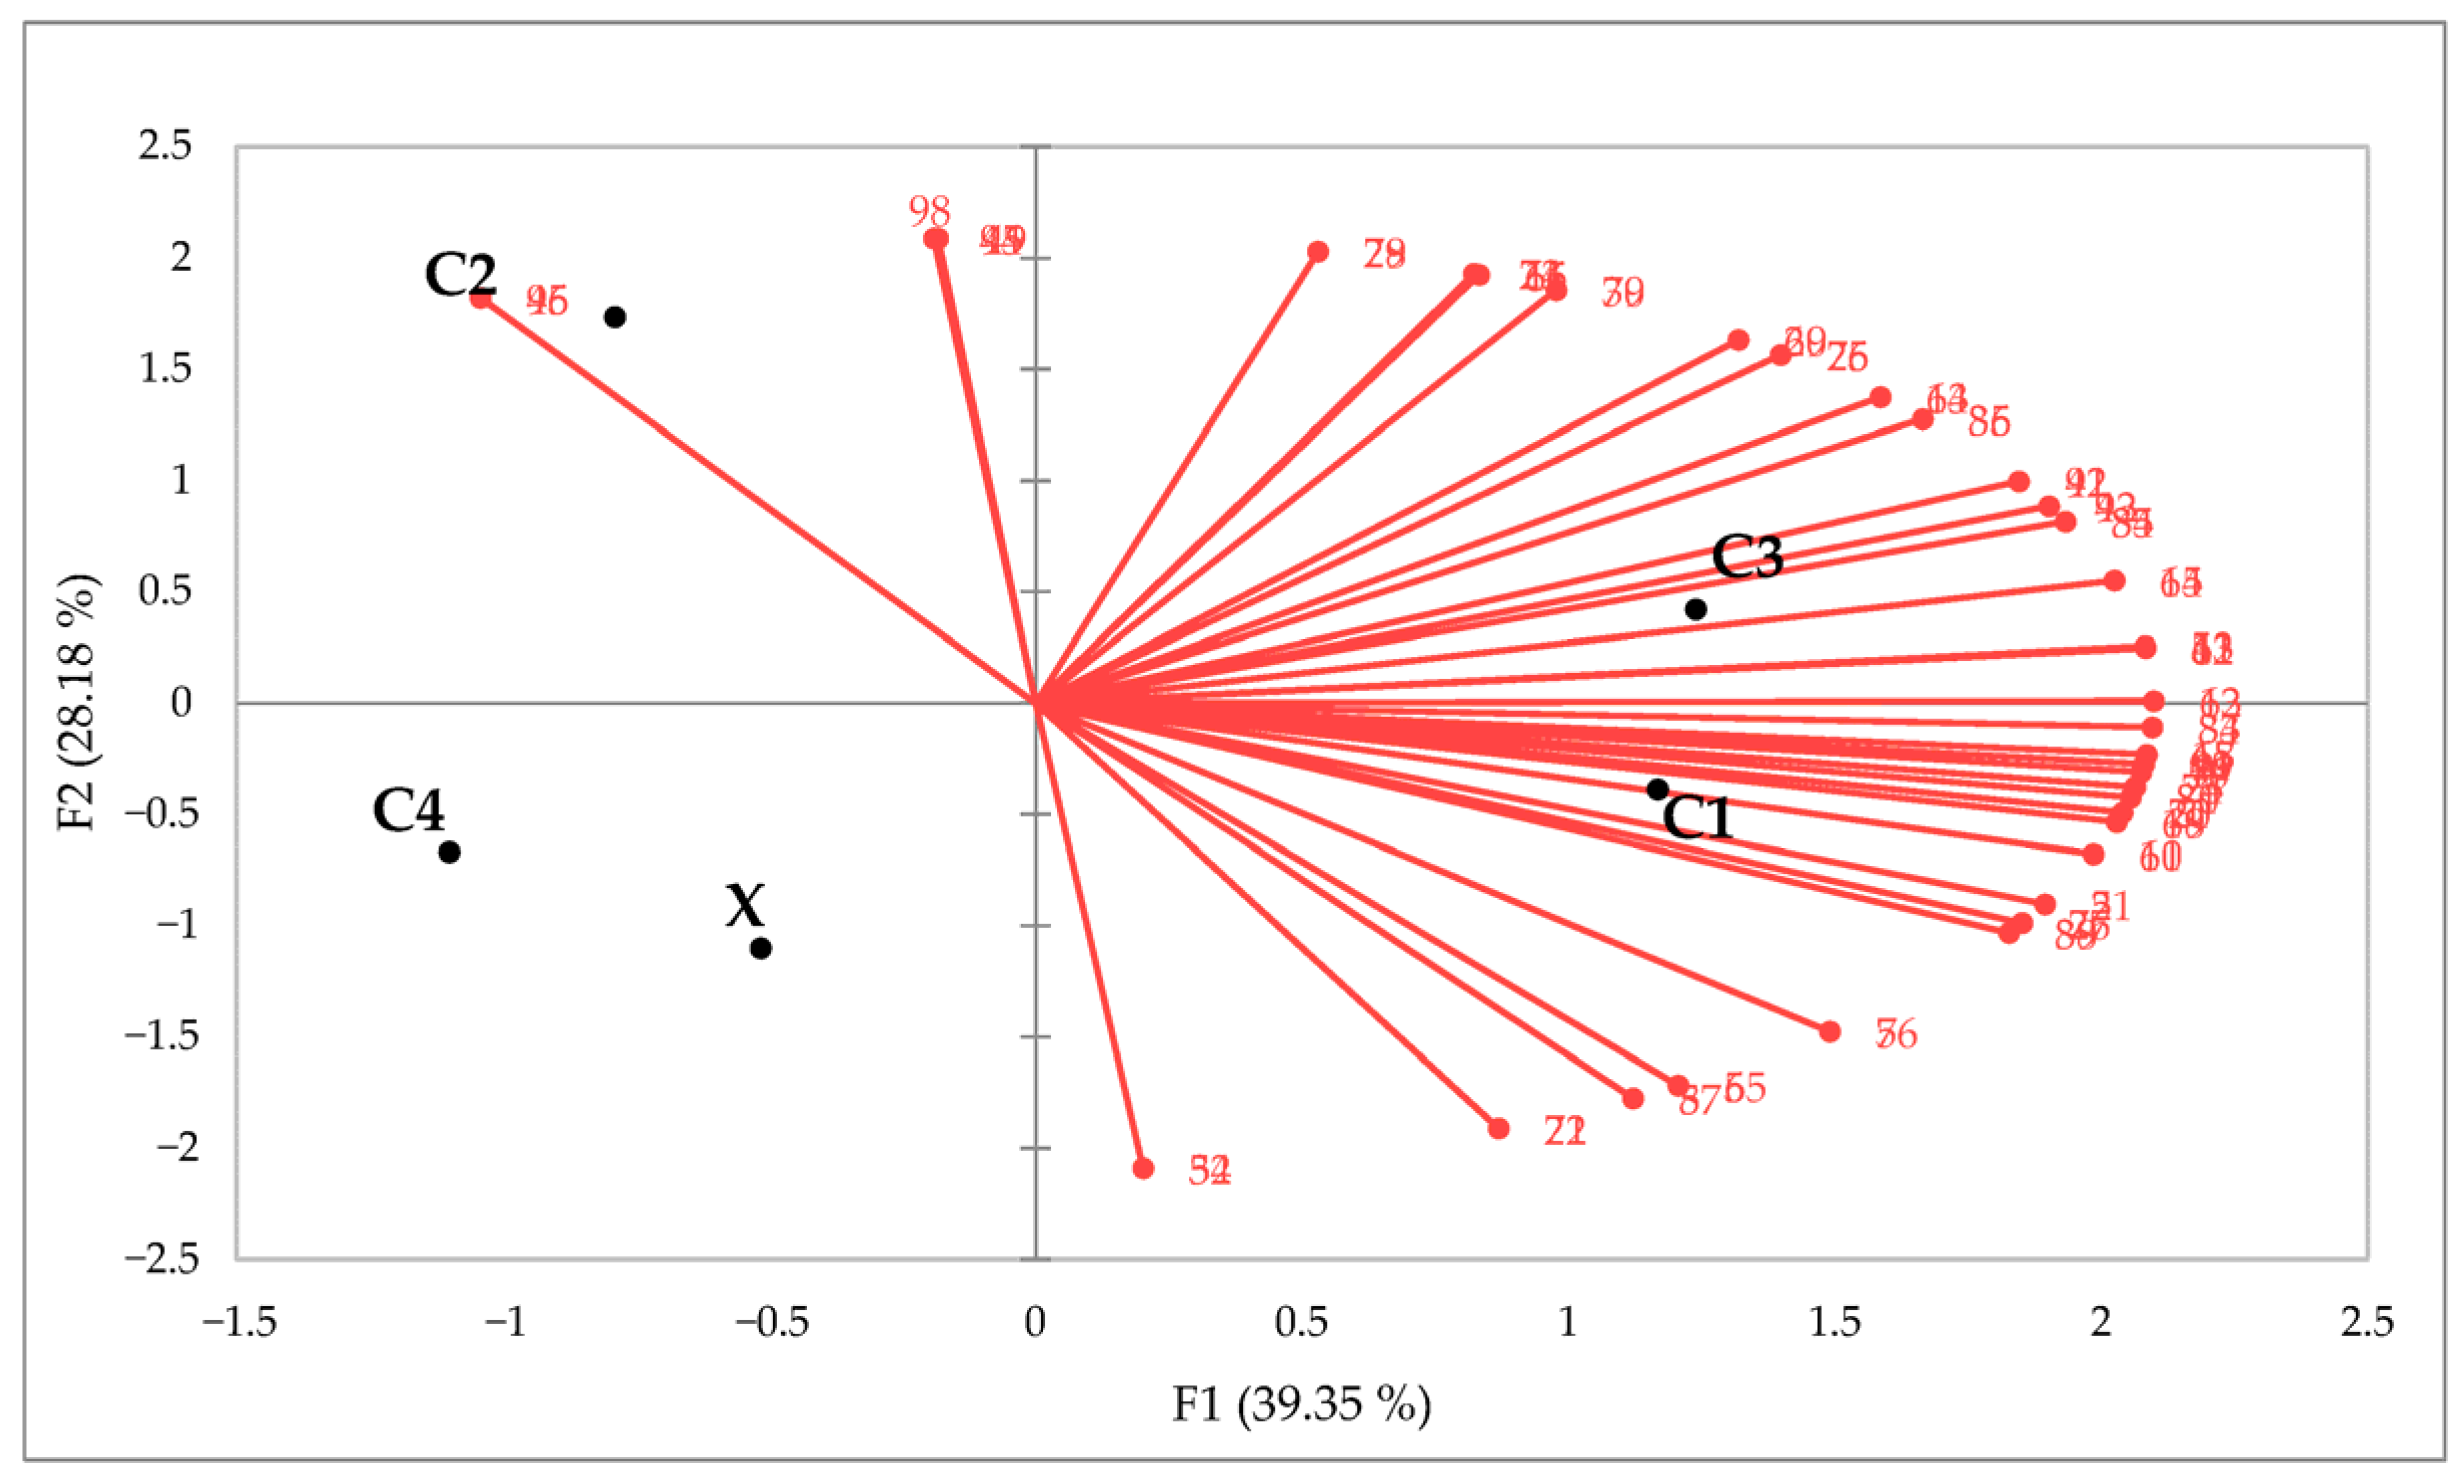
Principal Component Analysis (PCA) of the VOC dataset revealed clear sample differentiation along the first two principal components, which together accounted for a substantial proportion of total variance (PC1: 43.6%, PC2: 21.7%). As shown in Figure 2, the PCA biplot highlights distinct clustering of beer samples based on their volatile profiles.
Sample C1 is positioned on the positive side of both PC1 and PC2, indicating a unique aromatic signature compared to the other samples. In contrast, samples C2, C3, and C4 are located closer together along the negative PC1 axis, suggesting a shared compound profile characterized by lower intensity or diversity in key volatiles. The loadings of individual compounds, represented as black arrows, illustrate their relative contributions to the principal components. Notably, 2-phenylethan-1-ol (compound 4), ethyl hexanoate (compound 7), and phenethyl acetate (compound 9) contribute strongly to PC1, aligning with samples C4 and C1. These volatiles are likely markers of specific aromatic features, such as floral and fruity notes, distinguishing these samples from the others.

3.2. Sensorial Characterization

Sensory data were gathered from an eight-member trained panel (Quantitative Descriptive Analysis, QDA), a consumer Check-All-That-Apply (CATA) test (n = 76), hedonic liking scores (n = 124), and preference mapping.

3.2.1. Quantitative Descriptive Analysis

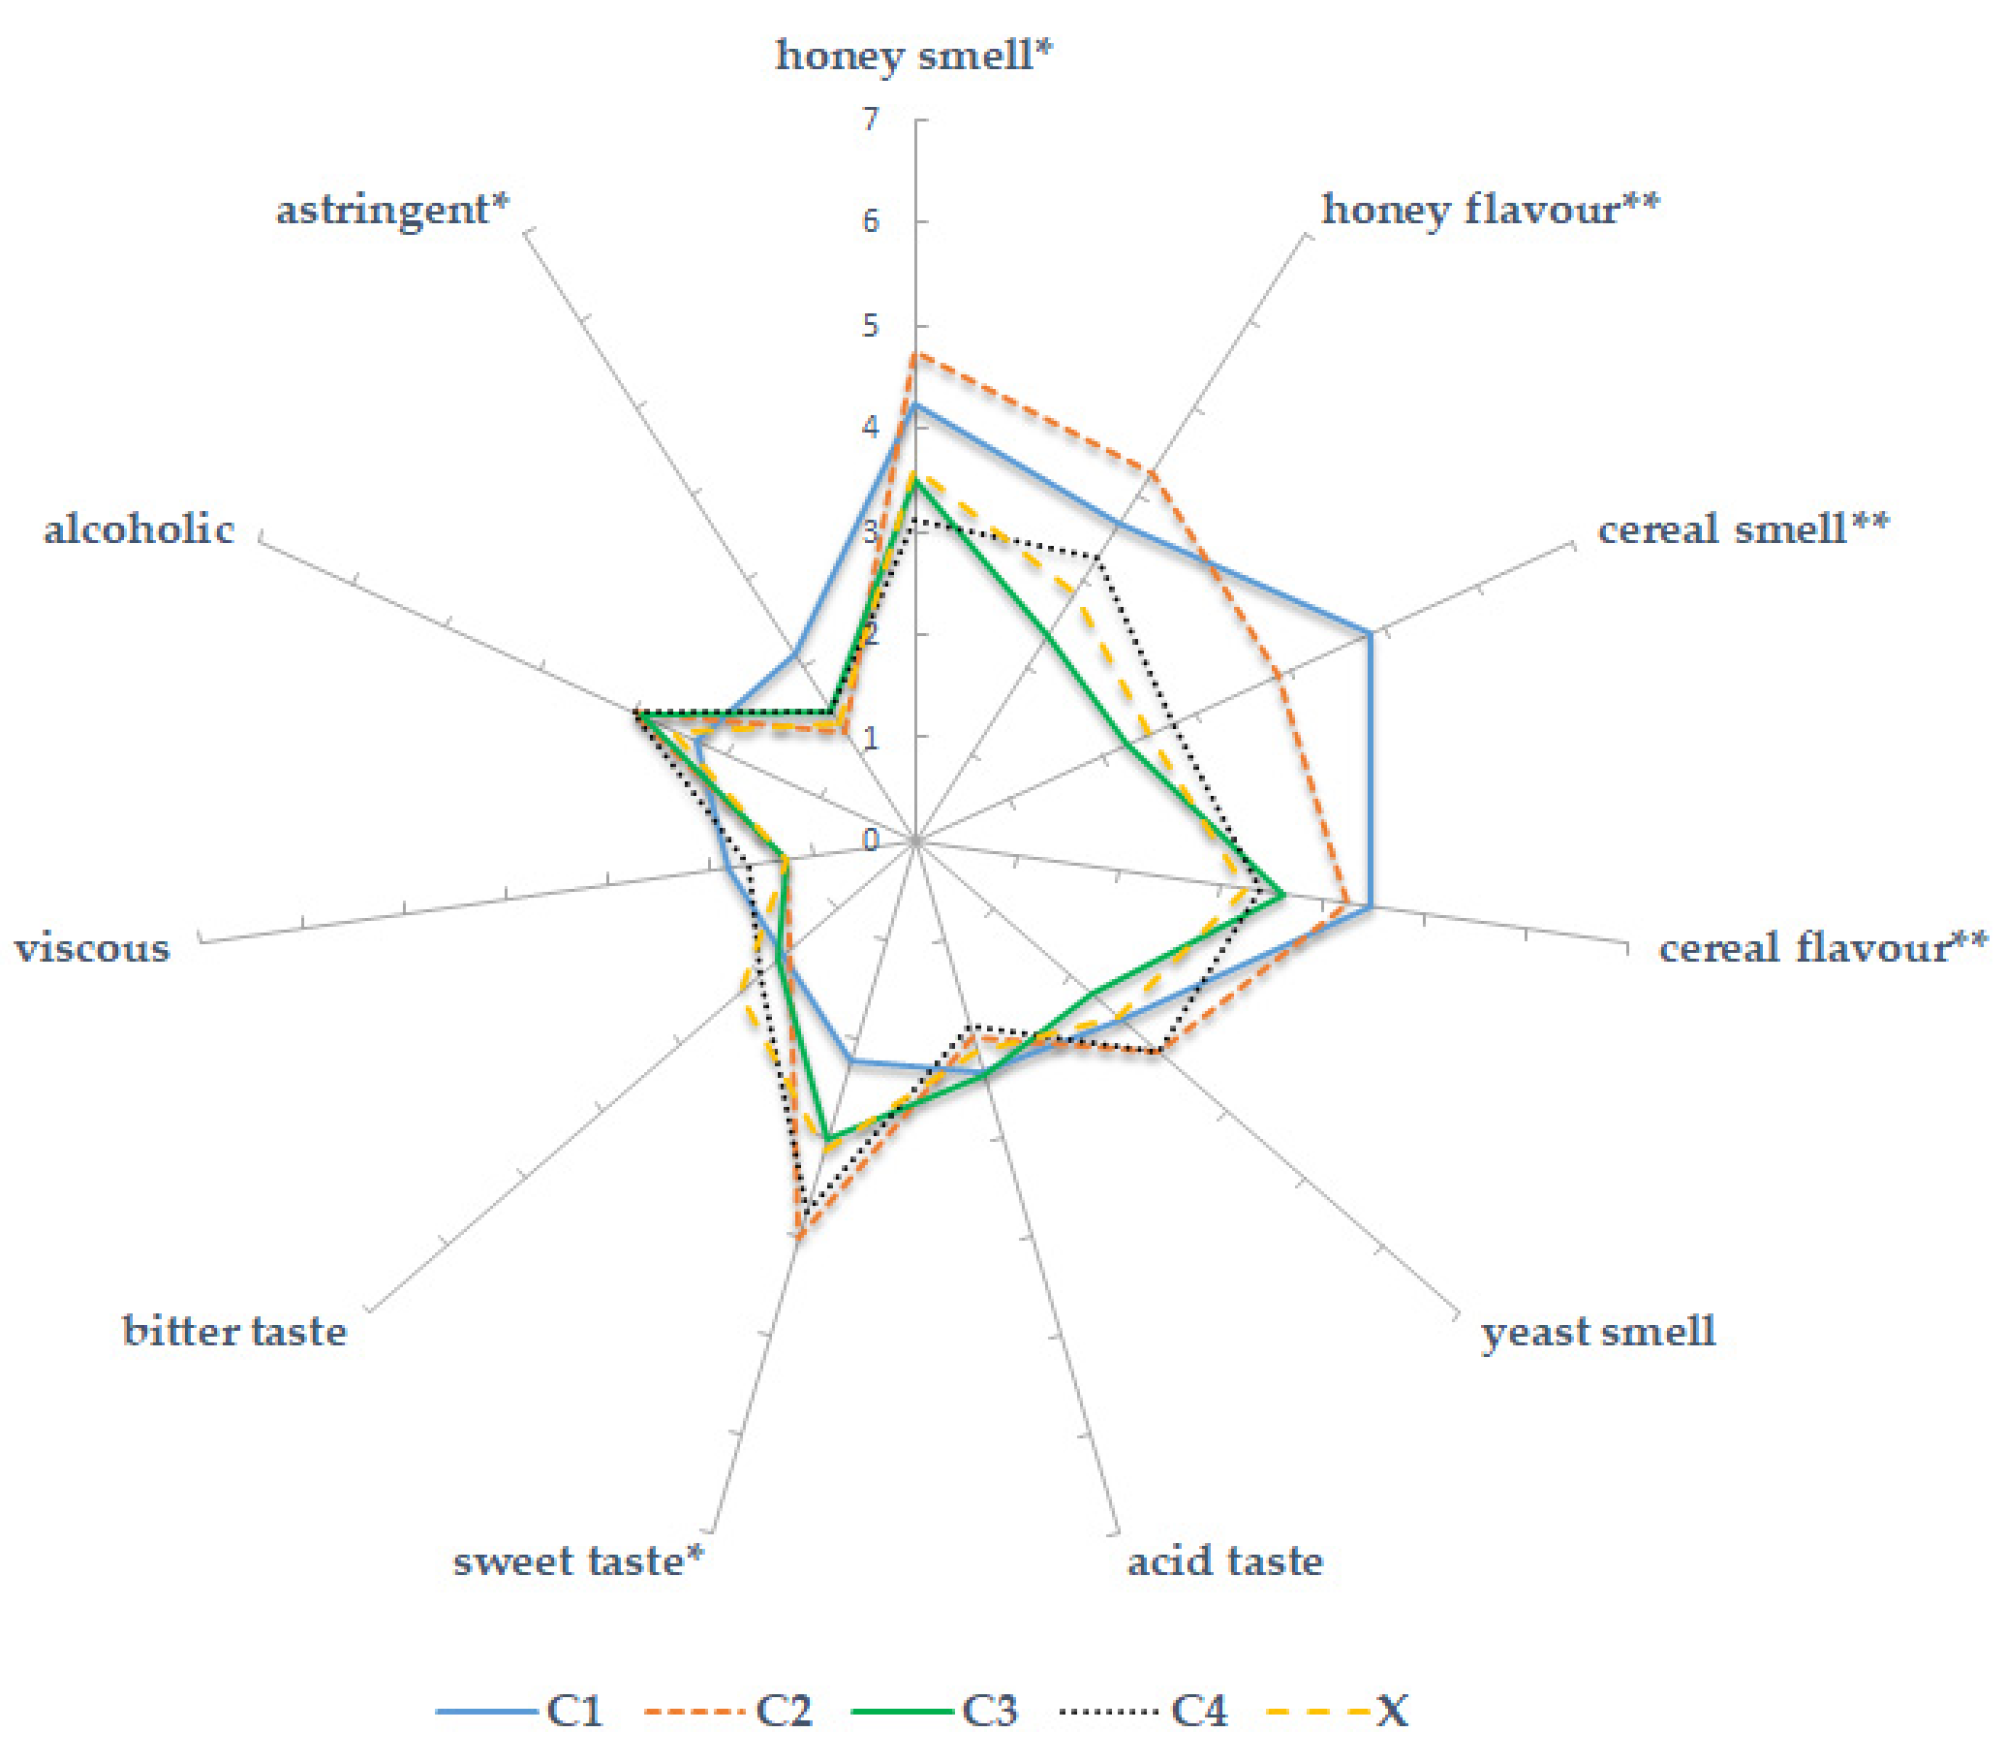
Figure 3 illustrates the sensory intensity scores attributed by trained panelists to the beers. C2 (Trigu Murru beer) stood out for intense honey aroma and flavor, as well as low astringency. C1 (Tricu Cossu beer) showed a high cereal aroma and a lightly higher astringency and lower sweet taste.
The control beer (X) was intermediate, with no significant standout attributes. ANOVA of the seven-point intensity scores revealed significant effects (p < 0.05) for honey odor/flavor (F = 10.21), cereal flavor (F = 8.57), and astringency (F = 51.13). Replicate and interaction terms were non-significant, confirming panel reliability.

3.2.2. Check-All-That-Apply Analysis

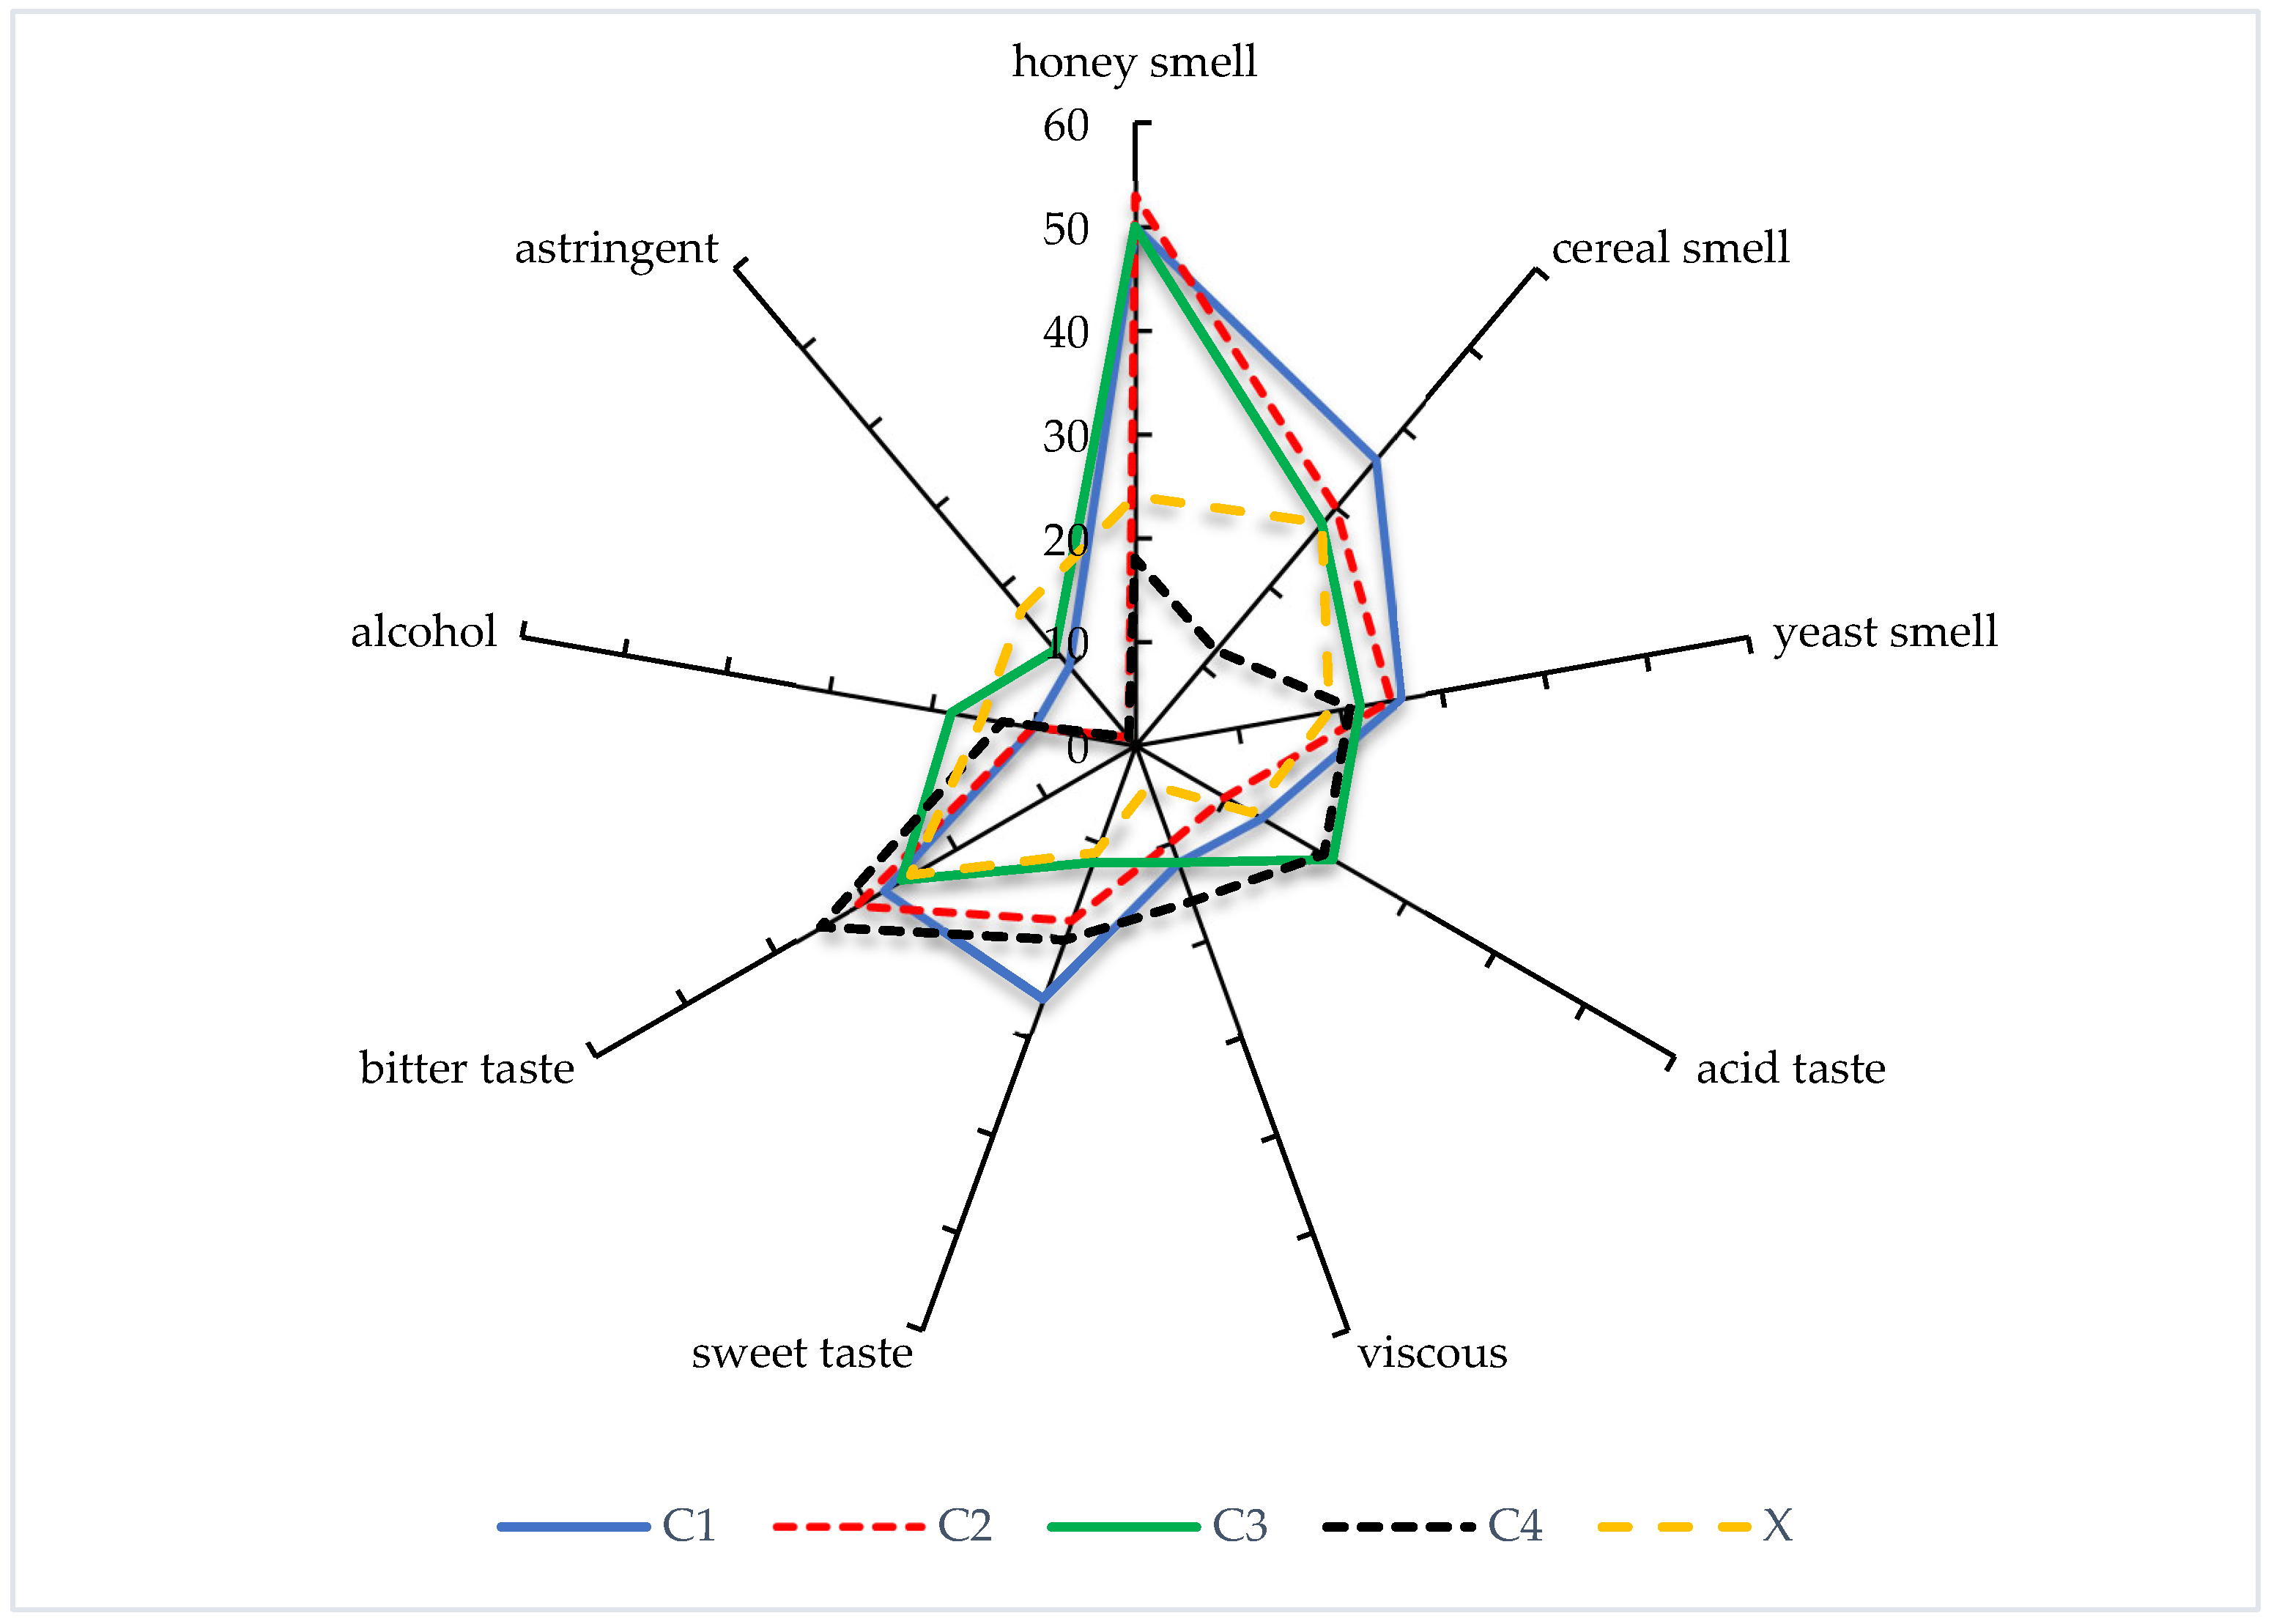
The CATA results based on consumer responses provide additional insight into perception frequency (Figure 4).
Figure 4 presents a radar plot summarizing the main sensory attributes associated with the analyzed beers based on CATA responses. Each axis in the radar chart corresponds to a sensory descriptor, and the magnitude indicates the frequency with which the descriptor was selected.
Selection-frequency analysis (McNemar–Bonferroni) of the attributes showed that honey smell and cereal smell were significantly (p < 0.01) more often associated with C1– C3 than with C4 and X (Table 3). Acid was a frequently selected taste for C3 and C4 and bitter for C2 C4, paralleling trained-panel bitterness scores. Sweet taste was linked mainly to C1 and C4, while astringency was more often chosen for X and C3. Among the aromatic descriptors, ‘honey smell’ was the most frequently associated with samples C1, C2, and C3, suggesting these beers were perceived as more aromatic and floral. In contrast, C4 and the control sample (X) received significantly fewer mentions, indicating a lack of this desirable aromatic note.
Similarly, ‘cereal smell’ was prominent in C1 and moderately present in C2 and C3, while C4 showed a marked absence of this descriptor, suggesting a reduced expression of raw grain character.
For taste attributes, ‘acid taste’ was more commonly associated with samples C3 and C4, indicating a sharper or more acidic flavor. ‘Sweet taste’ was reported most often in C1, possibly due to residual sugars or a malt-forward profile.
‘Astringent’ was less frequently cited in C2 and C4, pointing to a smoother mouthfeel and potentially lower levels of polyphenolic compounds. Conversely, X and C3 had higher astringency frequencies, suggesting a rougher, more drying sensation.
The descriptor ‘alcohol’ was most associated with sample X, indicating a noticeable alcoholic note possibly due to higher ethanol content or volatile aroma compounds. Samples C2 to C4 showed lower frequencies, implying better alcohol integration.
Finally, ‘viscous’ was more often reported for C3 and C4, suggesting a fuller mouthfeel or higher perceived body compared to the control sample.

3.2.3. Correspondence Analysis

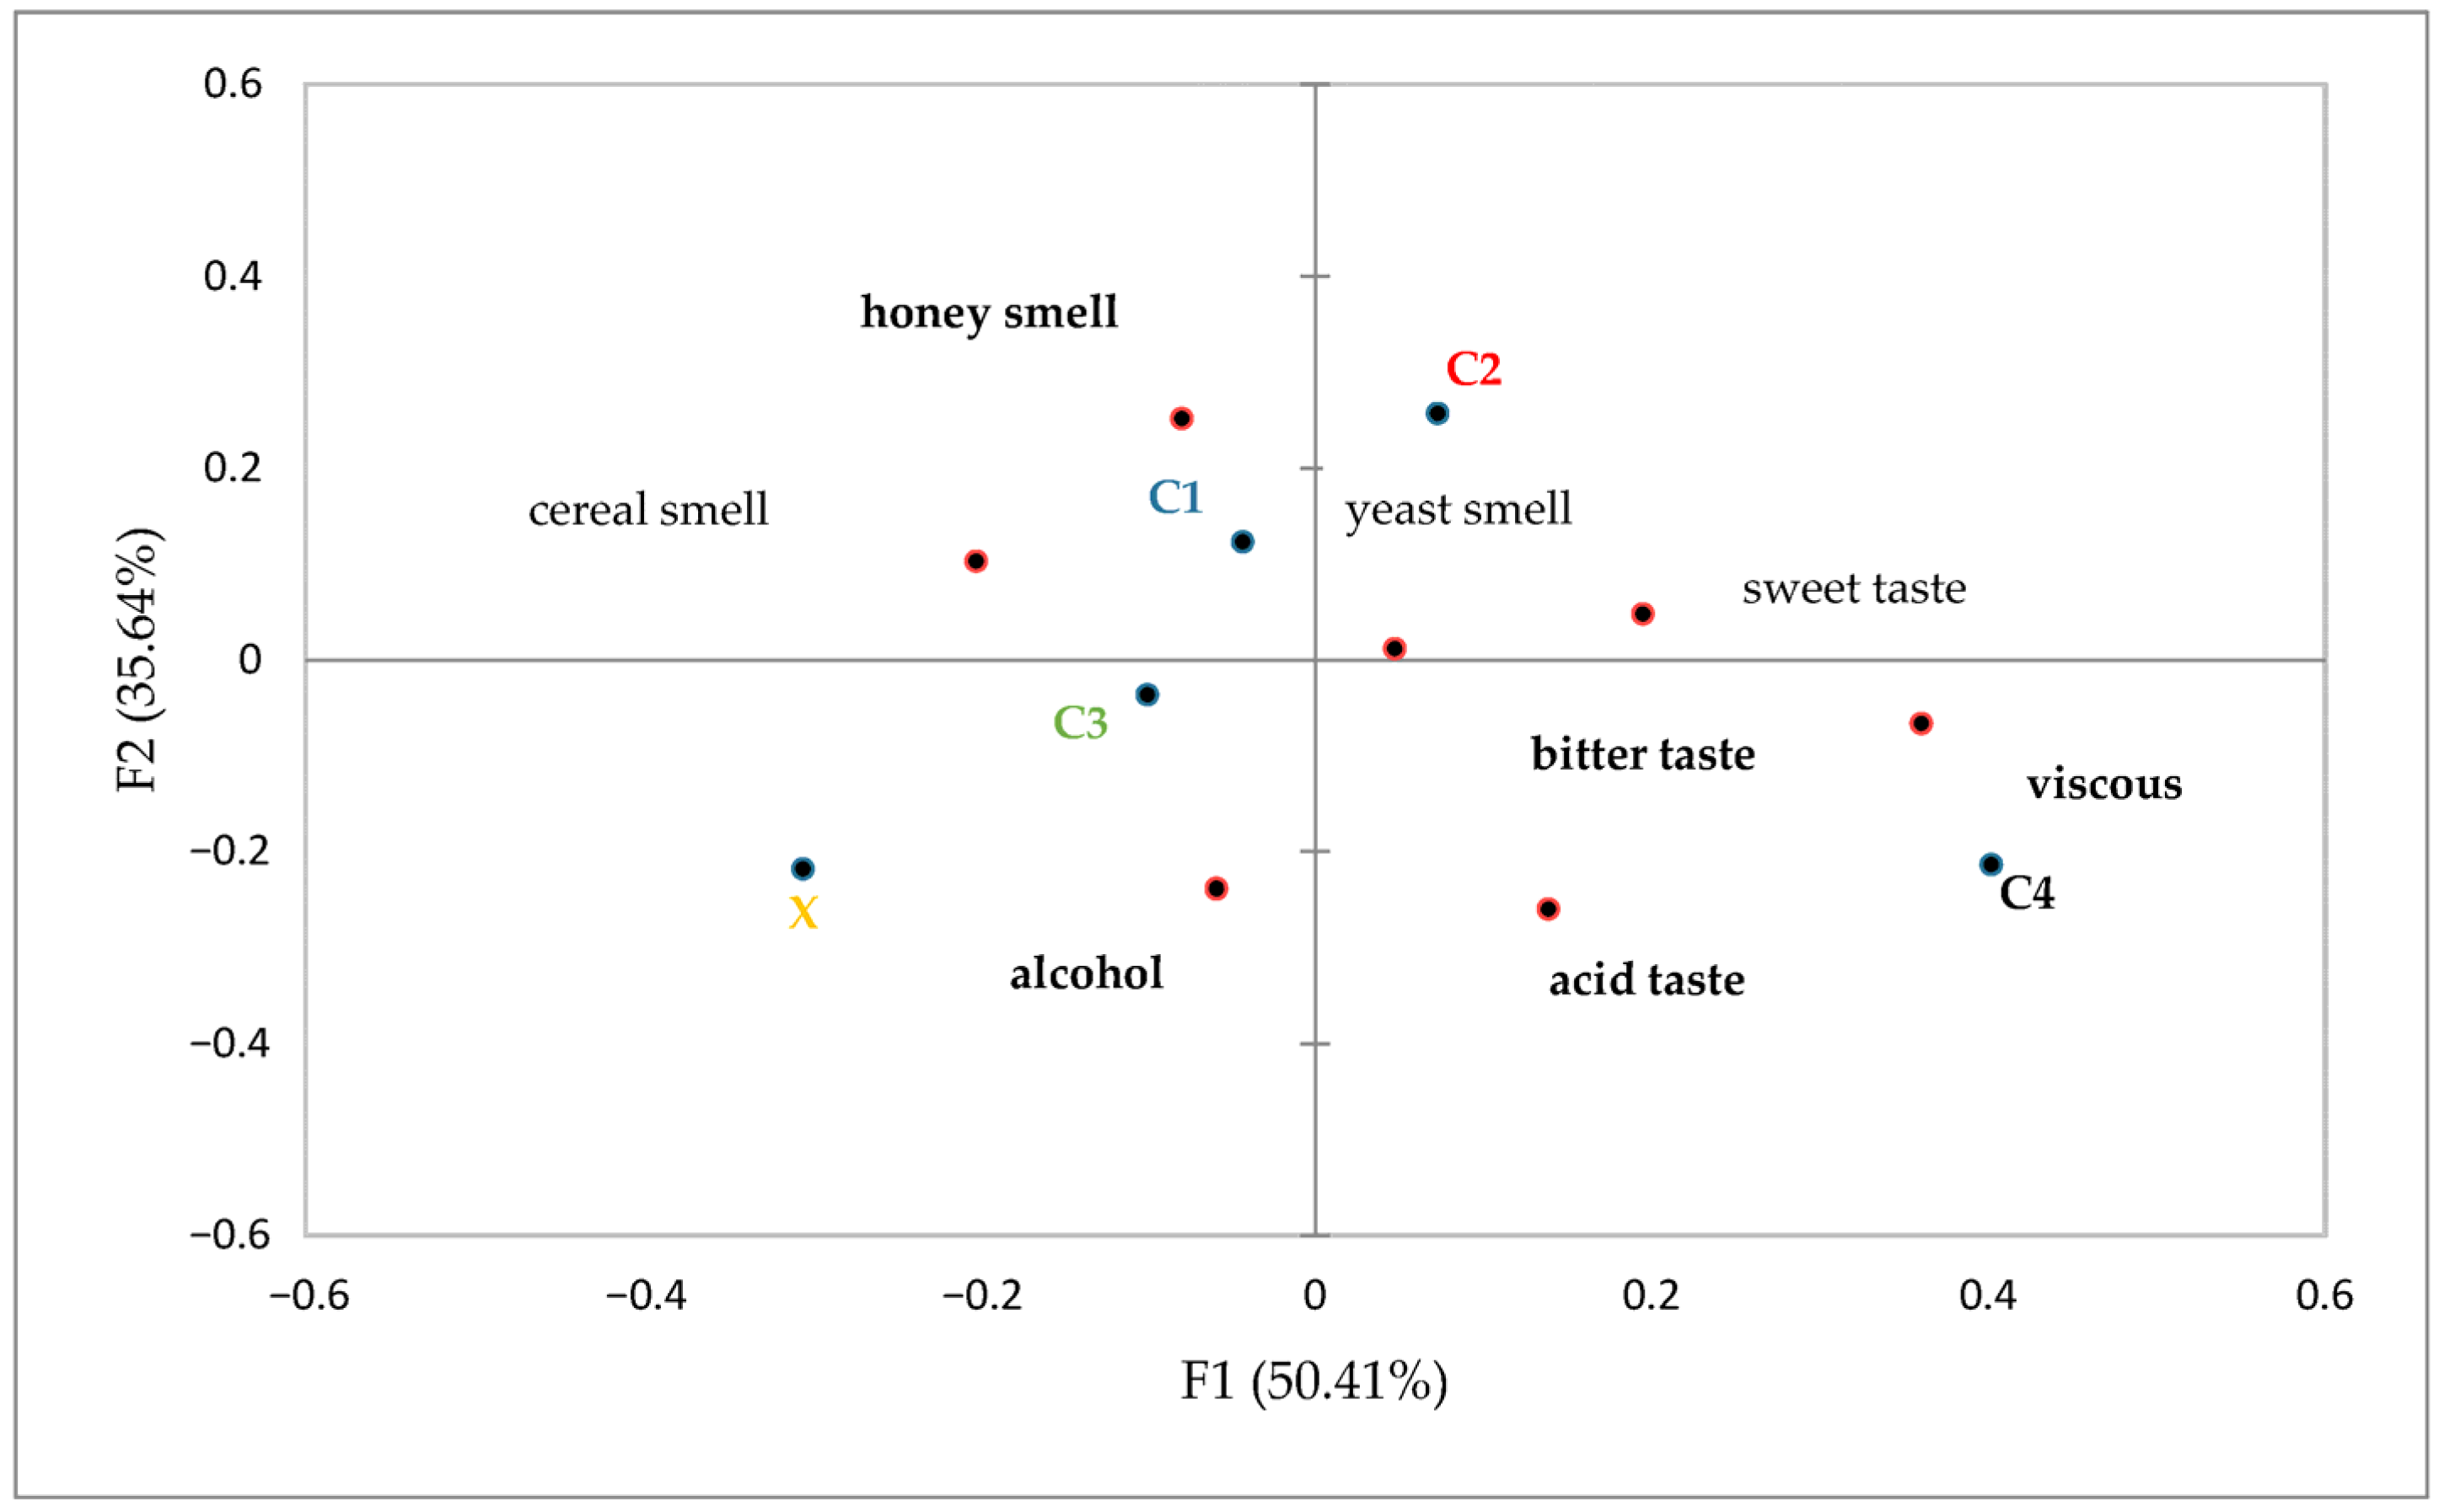
The correspondence analysis (CA), shown in Figure 5, explained over 86% of the total variance, reflecting strong discriminatory power of the sensory attributes across beer samples. Dimension 1 mainly distinguished C1 and C2 from C4 and X, driven by opposing descriptors such as “honey” and “cereal” versus “astringent” and “bitter”. Dimension 2 captured additional variance related to viscosity and alcohol perception.
C1 and C2 were located near descriptors like “honey smell”, “cereal flavor”, and “sweet taste”, attributes that tend to be positively perceived by consumers. This spatial proximity aligns with their generally higher liking scores in hedonic tests and internal preference mapping.
Interestingly, C3, although not closely associated with those specific sensory descriptors in the CA space, was also preferred by a majority of consumers, as shown in the internal preference mapping. This suggests that positive consumer perception of C3 may be influenced by a more neutral or balanced profile, or by the absence of undesirable attributes, rather than the strong presence of any particular flavor notes.
In contrast, C4 appeared negatively associated with sweetness- and honey-related terms and was more closely linked to bitter, astringent, and viscous attributes—factors that may have contributed to its lower acceptability in hedonic ratings.

3.2.4. Consumer Acceptance

Box plots were constructed for each beer sample (Figure 6), showing the median, mean, interquartile range, and outliers. Sample C3 demonstrated the highest median (approximately 8.0) and mean (around 7.5), indicating the strongest overall preference among participants. However, the presence of a single low outlier suggests a potentially polarizing attribute. Samples X and C1 showed nearly identical profiles with median and mean scores around 7.0–7.2, suggesting stable and generally favorable evaluations with minimal variability and no outliers. Sample C2, despite sharing the same median (7.0), exhibited a lower mean (approximately 6.8), suggesting a slight skew toward lower ratings among some respondents. This implies a more heterogeneous perception.
Sample C4 presented a consistent score distribution with a median and mean around 7.0 and no extreme values, suggesting a stable but less distinguished profile.
Internal preference mapping (IPM) confirmed that the majority of consumers preferred C1 and C3, with individual variation showing that these beers aligned with the preferences of both regular and occasional beer consumers (Figure 7). Kruskal–Wallis tests on nine-point liking scores indicated significant sample effects (H(4) = 32.7; p < 0.001). Median likes followed the order C1 ≈ C2 > X > C3 ≈ C4. IPM accounted for 78% of consumer variance; vector clustering showed that 67% of consumers projected into the quadrant containing C1 and C3, reinforcing their broad appeal.
The results of IPM provide further insight into consumer attitudes toward the beer samples, revealing that the majority of participants expressed a clear preference for samples C1 and C3, with these two beers aligning with the hedonic responses of both regular and occasional beer consumers (Figure 7). This suggests that C1 and C3 offer sensorial characteristics that are appreciated across diverse consumer segments. These findings further corroborate the descriptive and associative data obtained from QDA and CATA, reinforcing the market potential of C1 and C3 in satisfying general consumer expectations.
The Kruskal–Wallis test conducted on nine-point hedonic liking scores confirmed the presence of statistically significant differences among the samples (H(4) = 32.7; p < 0.001).
Figure 7 illustrates the spatial distribution of consumers based on individual liking vectors, allowing the identification of preference patterns at the level of individual respondents.

3.2.5. Cluster Analysis

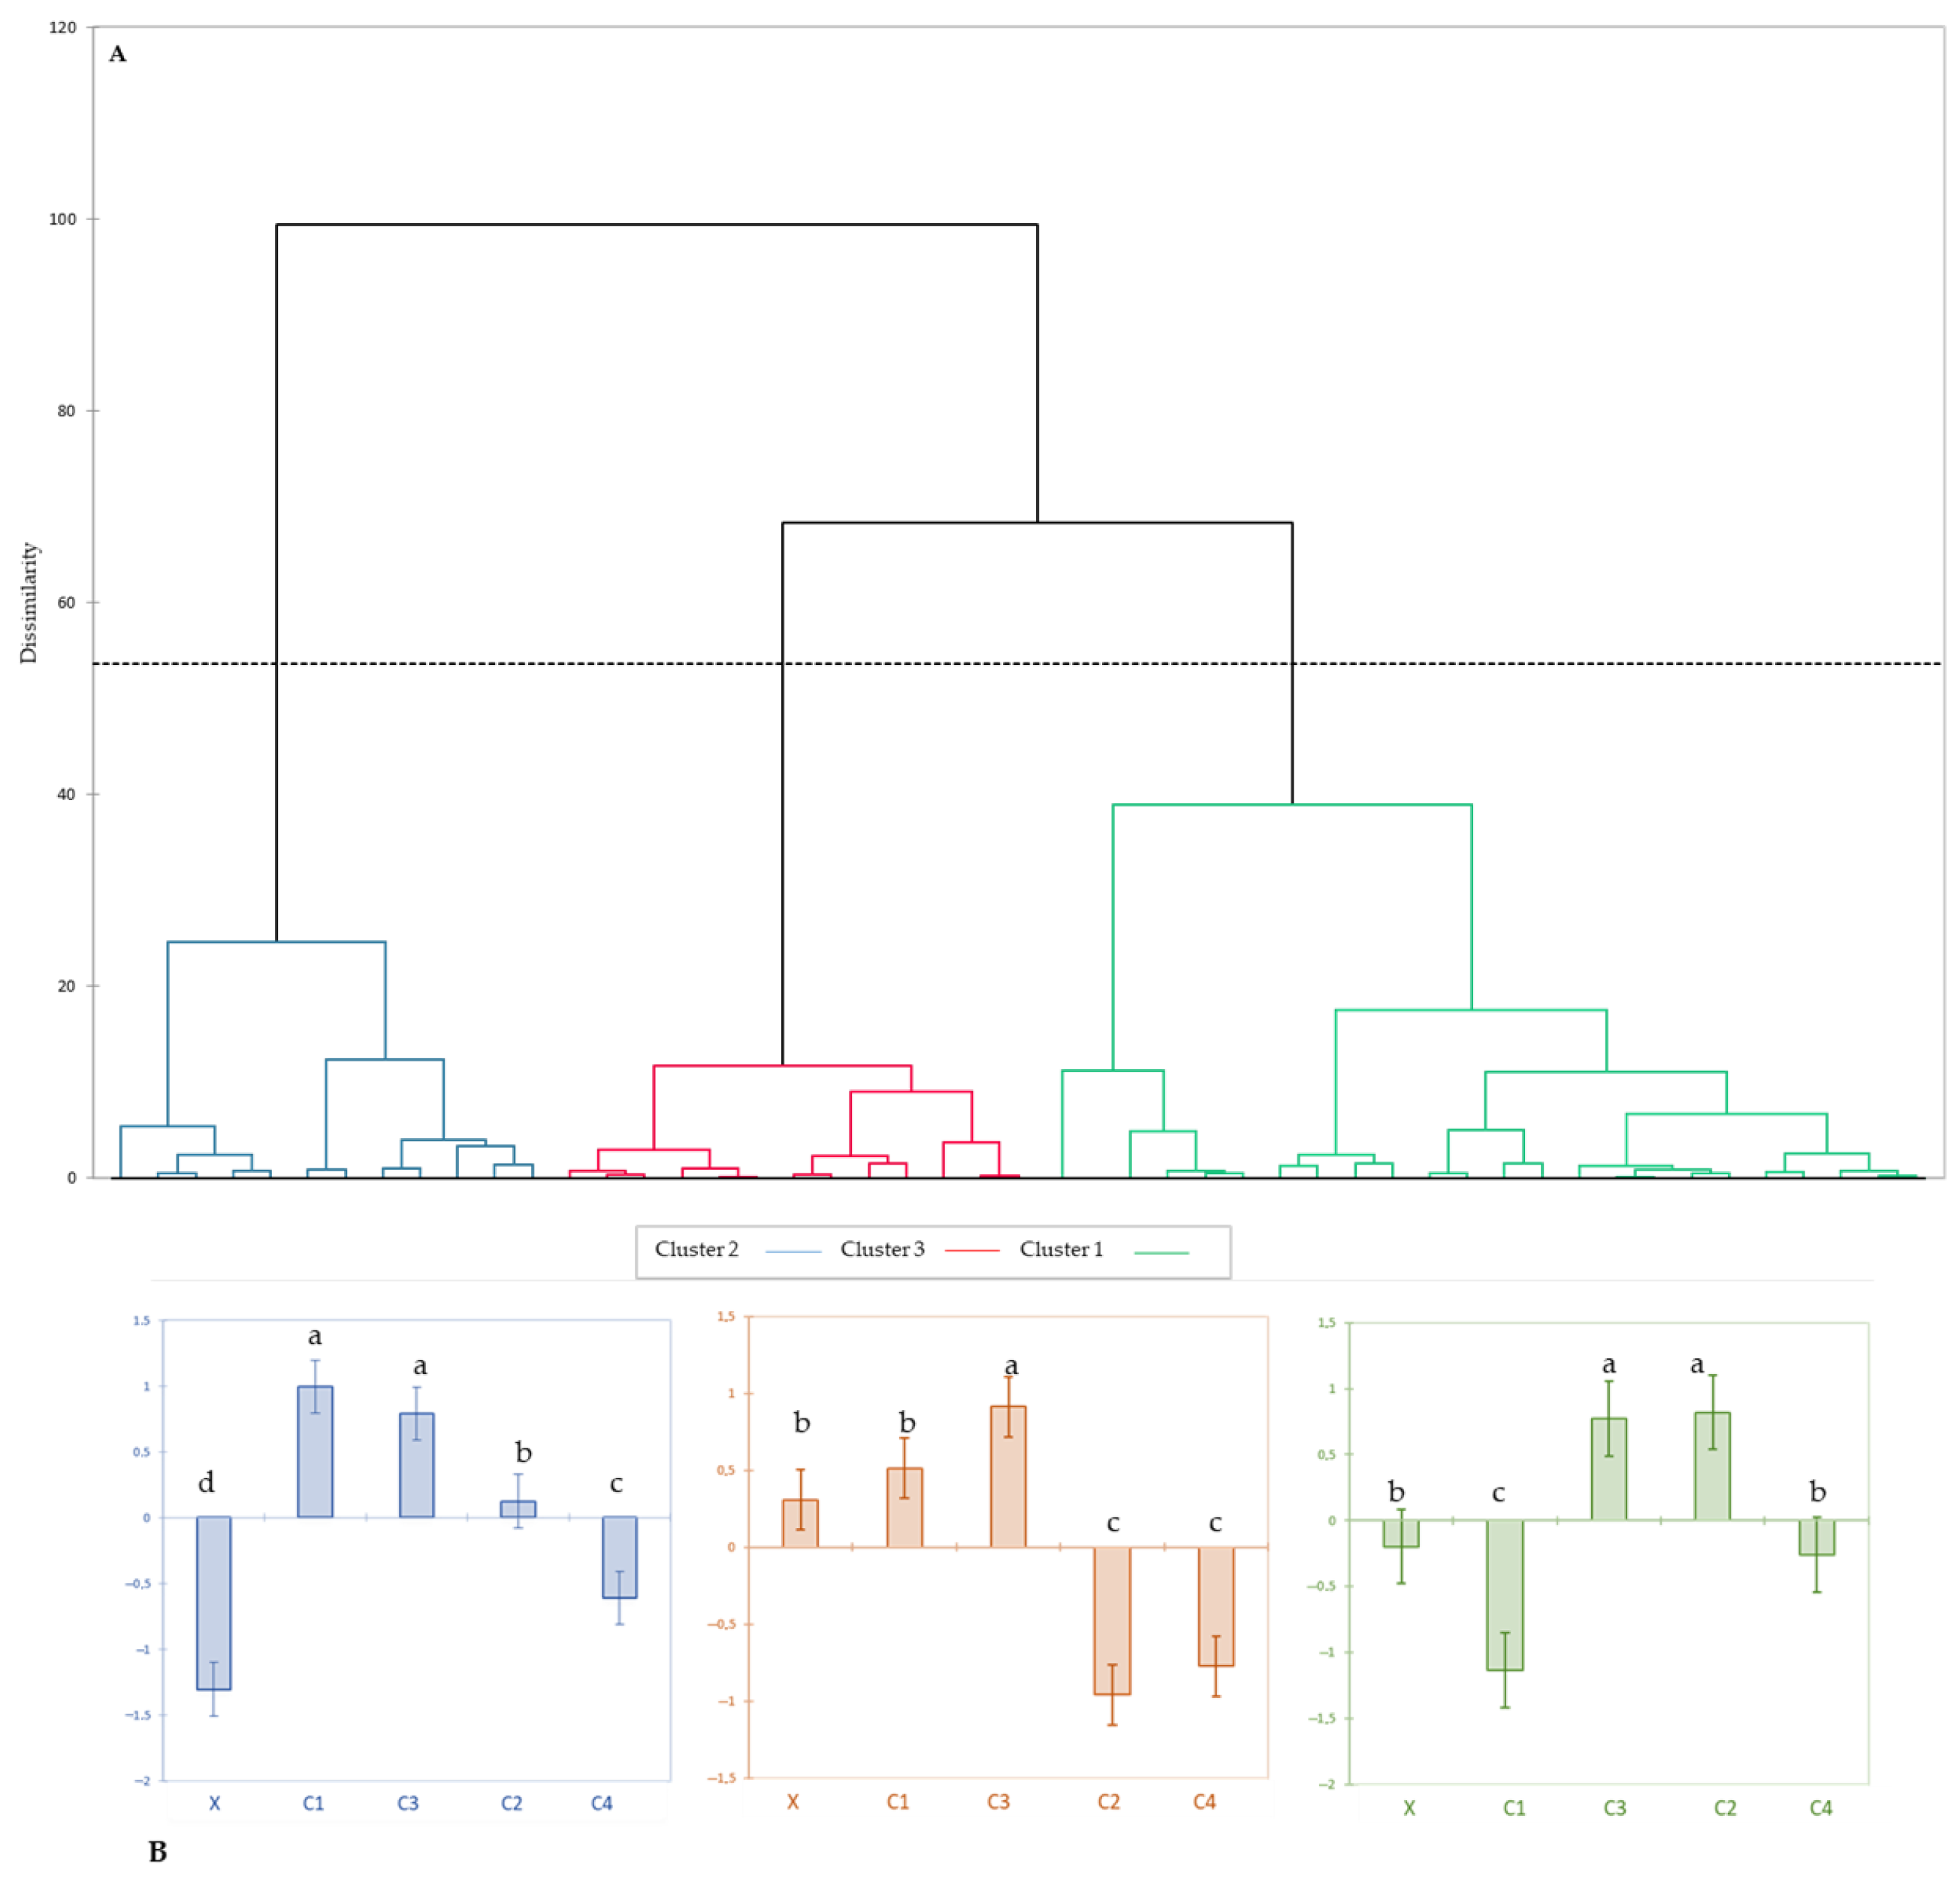
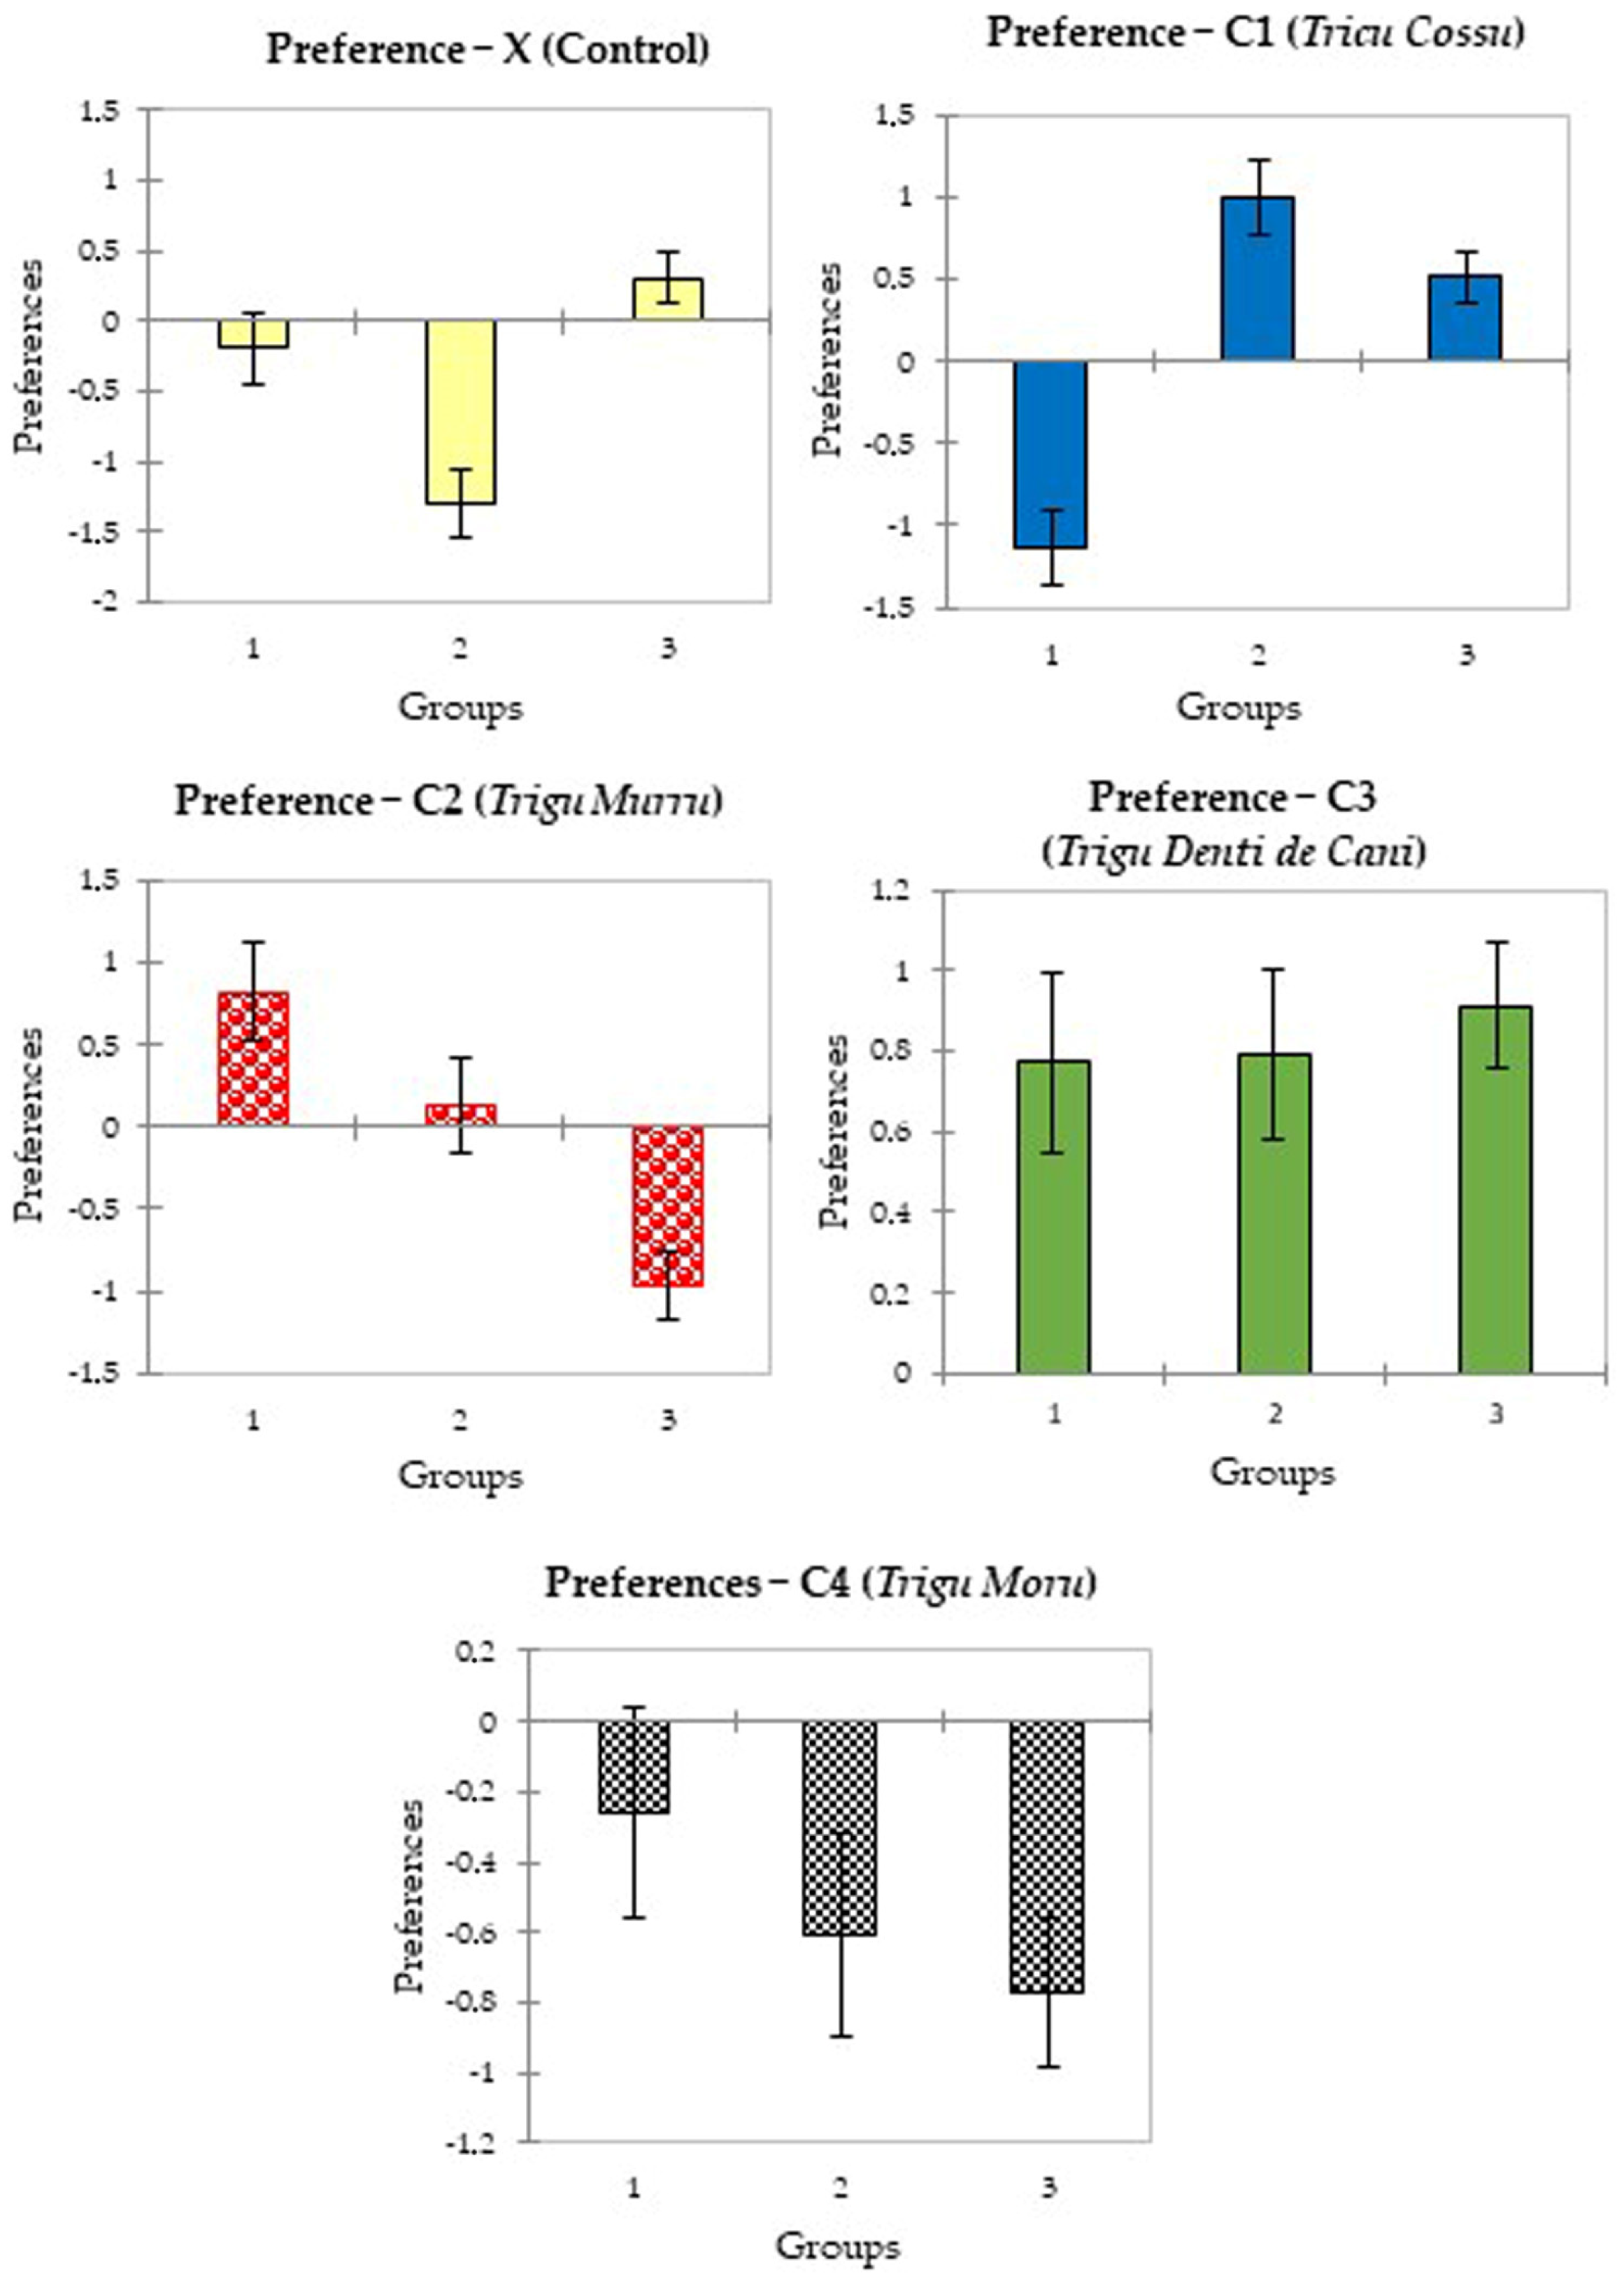
The cluster analysis results, presented in Figure 8, provide additional insight into how different demographic groups responded to the sensory attributes of the beer samples. The dendrogram (Figure 8A) identifies three distinct consumer clusters based on overall acceptability ratings. Cluster 2 consists primarily of men aged 30 to 45 years old who are regular and experienced consumers of craft beer. This group expressed a clear preference for sample C1 (Tricu Cossu beer), indicating alignment between their sensory expectations and the attributes of this sample. Cluster 1 includes men aged 46 to 60 years old with habitual beer consumption patterns. These individuals showed the highest acceptability for sample C2 (Trigu Murru beer), suggesting familiarity or alignment with the sensory characteristics of this sample. Cluster 3 is composed mainly of women aged 35 to 55 years old who consume craft beer occasionally. While this group exhibited a mild preference for sample C3 (Trigu Denti de Cani beer), the response was generally less intense compared to that of the other clusters. These findings reflect the influence of demographic and experiential variables on sensory preferences. In particular, age, gender, and frequency of beer consumption appeared to shape individual responses to the sensory profiles presented. Figure 8B further illustrates the correspondence between cluster membership and sample preference. The spatial organization of the clusters confirms that evaluators tend to group according to shared demographic traits and similar patterns of liking.
This segmentation, based solely on sensory acceptability, contributes to a deeper understanding of how different population groups perceive beers, offering an evidence-based approach to interpreting sensory diversity in consumer responses. These demographic insights highlight the market potential for targeting specific segments with cultivar-based product stories (Figure 9).

4. Discussion

One of the most fascinating aspects of the new renaissance of beer, due largely to craft beers [23], lies in their extreme style heterogeneity. This characteristic is expressed in the most varied use of raw materials and in the re-proposition of old beer styles. Contemporary productions maintain only some of the sensorial characteristics of the original ones, due to the continuous changes in life habits and customs.
Brewing productions around the world have always been based on available cereals, so in all brewing cultures, the most diverse grains, malted and not, lead to different interpretations of recipes and tastes. Therefore, as barley malt remains the main raw material in the production of most beer styles, the use of other cereals, such as wheat, in different percentages, is common, for example, in Belgium for the production of beers like witbier and saison and in Germany for the weizenbier.
This study, exploring and comparing the chemical and sensory characteristics of beers brewed with four Sardinian old grains (C1 with Tricu Cossu; C2 with Trigu Murru; C3 with Trigu Denti de Cani and C4 with Trigu Moru), demonstrated the suitability of these unmalted wheat varieties. The intent was also to enhance biodiversity and reduce the environmental impact of the malting process in terms of energy use, CO2 emissions, and water consumption, although within the limit of 24% of the grist in the recipes.
The beers had homogeneous values for the main technological parameters (see Table 1), except for color, ethanol concentration, and the real degree of fermentation (slightly higher for sample C1). Foam stability showed the highest values in the control beer (X). This homogeneity is in line with the findings of De Flaviis et al. [25] and Yorke et al. [40].
On the other hand, different grains impacted the composition of the VOC fractions and, consequently, the results of sensory analysis (Figure 1, Figure 2 and Figure 5). The orientation and clustering of samples show a reliable discrimination in the chemometric characterization of beer (Figure 2). The spatial distribution of the variables indicates possible co-variation patterns, potentially driven by shared fermentation processes, yeast metabolism, or raw material inputs.
The sensorial analysis was conducted in different and complementary ways: the QDA provided quantitative intensity ratings from a trained panel; the CATA methodology provided consumer-driven insights based on frequencies of descriptor selection; and CA, conducted on the CATA data, allowed us to visualize the associations between samples and sensory terms.
The QDA results indicated that samples C1 and C2 were characterized by prominent honey and cereal attributes. Specifically, C1 had the highest scores for cereal aroma and flavor, while C2 stood out for sweetness and honey-like characteristics (Figure 3). These findings were reinforced by the CATA data (Figure 4), in which these same samples were most frequently associated with the descriptors “honey smell,” “sweet taste,” and “cereal smell.” Such convergence across methodologies suggests that these attributes were not only strong and consistent across panels but were also highly recognizable by both trained and untrained assessors. This is particularly relevant for consumer acceptability, as sweet and aromatic notes tend to correlate positively with preference.
The CA further confirmed these associations. In the CA biplot (Figure 5), C1 is positioned near the terms “cereal smell” and “honey smell,” while C2 lies close to “sweet taste” and “yeast smell.” The proximity of samples to these descriptors in the CA space reflects the strength of their associations. Importantly, the CA explained 86% of the total variance in the CATA dataset, supporting the robustness of the observed relationships.
On the other hand, samples C3, C4, and X are positioned more distantly from the positive flavor descriptors. In the QDA, C3 was described as relatively neutral, with moderate values across most attributes, whereas CATA responses placed it near the “alcohol” descriptor, suggesting a minor perceived warming or ethanol note. Sample X, which was also associated with “alcohol,” showed fewer positive sensory associations overall. This could suggest a less aromatic or more neutral sensory profile.
Sample C4 displayed a more distinctive profile, being closely associated with “viscous,” “acid taste,” and “bitter taste” in the CA plot. The QDA data similarly highlighted its higher viscosity and astringency. These attributes may reflect a fuller body and more intense taste, which could be desirable for certain consumer segments or specific beer styles.
Previous studies have demonstrated the reproducibility of CATA results, which are consistent with sensory profiles obtained with trained panels [45,46,47]. It is also noteworthy that certain attributes, such as alcohol, bitterness, and viscosity, were more clearly differentiated in QDA than in CATA. This discrepancy is likely due to the nature of the methods: QDA, employing trained panelists and quantitative scales, allows fine discrimination of nuanced traits, whereas CATA, relying on binary responses from untrained consumers, is more sensitive to salient and intuitive descriptors. The differences highlight the complementary strengths of the two approaches: QDA excels in analytical precision, while CATA captures perceptual relevance from a consumer standpoint.
The Generalized Procrustes Analysis (GPA) [49,50,51,52] revealed a Procrustes disparity of 0.147, indicating a moderate-to-strong overall agreement between the spatial configurations based on volatile composition and sensory descriptors (Supplementary Material SM4). Sample C4, for instance, exhibited very similar coordinates in both the chemical and sensory spaces, suggesting that its distinctive aroma profile is well-explained by its volatile composition. Similarly, sample X showed close alignment between its chemical and sensory representations, reinforcing its potential as a sample with a consistent chemical–sensory identity. Conversely, samples such as C2 and C3 displayed a greater separation between their chemical and sensory coordinates, suggesting that additional factors—such as matrix effects and compound interactions—may influence their perceived aroma. These mismatches highlight the multifactorial nature of flavor perception and indicate that some compounds may modulate perception indirectly or in synergy with others. Taken together, these results support the existence of a structured relationship between the physicochemical composition of beer and its aromatic perception, as visualized through multivariate alignment.
Taken together, the findings suggest that C1 and C2 offer the most favorable sensory profiles, aligning with desirable attributes such as sweetness and honey aroma. In contrast, C4 may be positioned as a more robust and structured option.
This comparative approach demonstrates the value of combining expert-based descriptive analysis with consumer-centered methods. When integrated with multivariate tools such as correspondence analysis, the dual methodology offers a comprehensive picture of product performance, balancing technical profiling with perceptual impact. Such insights are essential for guiding product development, especially in markets increasingly oriented toward flavor differentiation and consumer experience.
The exploitation of raw materials associated with a specific territory may also lead to the concept of terroir, which has the property of connecting a place with its physical and socio-cultural characteristics, as well as the people and technological peculiarities through which it is realized. The combination of climate and soil with human capabilities and the heritage of traditions can be the determining attributes in ensuring the production of quality food, also having a great impact on sustainability [53]. Historically, the term terroir was used pejoratively in the French Renaissance to describe the ‘earthy’ flavor of peasant wines. It was in the Champagne region that people began to emphasize the importance of soil, tradition, and local authenticity in order to distinguish their products, as an act of resistance against capitalist logic [54]. This made the term ‘terroir’ a key word in oenological parochialism between the 19th and 21st centuries. More recently, the term has also been extended to other foods, including beers [50].
Bearing this in mind, using old varieties of cereal can help to ensure the distinctive taste of beers produced in a given place. Similarly, climate change and global warming are driving the use of rustic and resilient local varieties [15].

5. Conclusions

This study demonstrated that the use of unmalted old Sardinian wheat varieties significantly influences the sensory and chemical characteristics of craft beers. Beers brewed with Trigu Murru and Tricu Cossu were associated with desirable sensory attributes such as honey aroma, sweet taste, and cereal notes, but the ones with Trigu Murru recived lower acceptability scores. This result appears to be linked to the perception of a less balanced profile, where certain sensory dimensions, such as mouthfeel and overall structure, were rated less positively. Trigu Moru was marked by bitterness and astringency, limiting broad appeal but suiting niche markets seeking intense flavor profiles. Sensory and volatile compound data were consistent, confirming the decisive role of raw materials in defining beer identity and highlighting the potential of old Sardinian wheats for product diversification, aiming to enhance and preserve local cereal biodiversity.

Supplementary Materials

The following supporting information can be downloaded at https://www.mdpi.com/article/10.3390/app15169138/s1 (SM1: Informed Consent Form; SM2: Consumer questionnaire; SM3: Organizational and Operating Regulations of the Sardinia Ethics Committee; SM4: Generalized Procrusted Analysys (GPA)).

Author Contributions

Conceptualization, L.P. and M.S. (Manuela Sanna); methodology, L.P., A.V. and M.S. (Manuela Sanna); validation, L.P., M.S. (Manuela Sanna), A.V. and M.S. (Marco Serra); formal analysis, M.S. (Manuela Sanna), M.S. (Marco Serra), and R.M.; investigation, L.P., M.S. (Manuela Sanna), and A.V.; data curation, M.G.F., M.S. (Manuela Sanna), and R.M.; writing—original draft preparation, M.G.F., M.S. (Manuela Sanna), and L.P.; writing—review and editing, M.C.P., L.P. and P.P.P.; supervision, L.P. All authors have read and agreed to the published version of the manuscript.

Funding

This research was funded by “Sardegna FESR 2014/2020-Asse Prioritario I, Ricerca Scientifica, Sviluppo Tecnologico e Innovazione”, Action 1.1.4-Sostegno alle Attività Collaborative di R&S per lo Sviluppo di Nuove Tecnologie Sostenibili, di Nuovi Prodotti e Servizi, “Sviluppo Sostenibile della Birra Artigianale in Sardegna”.

Institutional Review Board Statement

This study did not require formal approval by an ethics committee, in accordance with current European regulations on non-invasive consumer research (e.g., Regulation (EU) 2016/679 and the European Code of Conduct for Research Integrity). All procedures involving human participants were conducted in compliance with ISO 11136:2014—Sensory analysis—Methodology—General guidance for conducting hedonic tests with consumers in a controlled area.

Informed Consent Statement

All participants were adults, took part voluntarily, and provided written informed consent prior to participation (Supplementary Material SM1).

Data Availability Statement

The original contributions presented in this study are included in the article. Further inquiries can be directed to the corresponding author.

Acknowledgments

L.P. gratefully acknowledges Sardinia Regional Government for the financial support of their research grant: “Sviluppo Sostenibile della Birra Artigianale in Sardegna”.

Conflicts of Interest

Authors Manuela Sanna, Maria Grazia Farbo, Antonio Valentoni, Riccardo Melis, Piero Pasqualino Piu, Marco Serra and Luca Pretti are employed by the company “Porto Conte Ricerche Srl.”. The remaining author declares no conflicts of interest. The funders had no role in the design of this study; in the collection, analyses, or interpretation of data; in the writing of the manuscript; or in the decision to publish the results.

Abbreviations

The following abbreviations are used in this manuscript:
CACorrespondence analysis
CATACheck-All-That-Apply
GAEGallic acid equivalent
GC-MSGas chromatography–mass spectrometry
HS-SPMEHead-space solid-phase microextraction
IPMInternal preference mapping
PCAPrincipal Component Analysis
PTFEPolytetrafluoroethylene
QDAQuantitative Descriptive Analysis
TPCTotal Polyphenol Content
VOCVolatile Organic Compounds

References

  1. Arzani, A.; Ashraf, M. Cultivated Ancient Wheats (Triticum spp.): A Potential Source of Health-Beneficial Food Products. Compr. Rev. Food Sci. Food Saf. 2017, 16, 477–488. [Google Scholar] [CrossRef]
  2. De Santis, M.A.; Kosik, O.; Passmore, D.; Flagella, Z.; Shewry, P.R.; Lovegrove, A. Comparison of the dietary fibre composition of old and modern durum wheat (Triticum turgidum spp. durum) genotypes. Food Chem. 2018, 244, 304–310. [Google Scholar] [CrossRef] [PubMed]
  3. Dinu, M.; Whittaker, A.; Pagliai, G.; Benedettelli, S.; Sofi, F. Ancient wheat species and human health: Biochemical and clinical implications. J. Nutr. Biochem. 2018, 52, 1–9. [Google Scholar] [CrossRef] [PubMed]
  4. Albanese, L.; Ciriminna, R.; Meneguzzo, F.; Pagliaro, M. Innovative beer-brewing of typical, old and healthy wheat varieties to boost their spreading. J. Clean. Prod. 2018, 171, 297–311. [Google Scholar] [CrossRef]
  5. García-Puebla, C.A.; Heredia-Olea, E.; López-Córdova, J.P.; Dórame-Miranda, R.F.; Padilla-Torres, C.V.; Rodríguez Félix, F.; López-Ahumada, G.A. Use of durum wheat (Triticum durum L.) with “yellow berry” as an alternative to malts in the production of ale-type beer: Physicochemical, quality of malts, and sensorial analysis. J. Cereal Sci. 2023, 109, 103613. [Google Scholar] [CrossRef]
  6. Mayer, H.; Marconi, O.; Perretti, G.; Sensidoni, M.; Fantozzi, P. Investigation of the Suitability of Hulled Wheats for Malting and Brewing. J. Am. Soc. Brew. Chem. 2011, 69, 116–120. [Google Scholar] [CrossRef]
  7. Benedetti, P.; Salvi, S.; Giomo, A.; Van Deun, R.; Boselli, E.; Frega, N. Taste-Active Components of Beers from Emmer Wheat (Triticum dicoccum) Malt. Sci. Agric. Bohem. 2016, 47, 82–89. [Google Scholar] [CrossRef]
  8. Mayer, H.; Ceccaroni, D.; Marconi, O.; Sileoni, V.; Perretti, G.; Fantozzi, P. Development of an all rice malt beer: A gluten free alternative. LWT–Food Sci. Technol. 2016, 67, 67–73. [Google Scholar] [CrossRef]
  9. Mongelli, A.; Rodolfi, M.; Ganino, T.; Marieschi, M.; Caligiani, A.; Dall’Asta, C.; Bruni, R. Are Humulus lupulus L. ecotypes and cultivars suitable for the cultivation of aromatic hop in Italy? A phytochemical approach. Ind. Crops Prod. 2016, 83, 693–700. [Google Scholar] [CrossRef]
  10. Rossini, F.; Loreti, P.; Provenzano, M.E.; De Santis, D.; Ruggeri, R. Agronomic Performance and Beer Quality Assessment of Twenty Hop Cultivars Grown in Central Italy. Ital. J. Agron. 2016, 11, 746. [Google Scholar] [CrossRef]
  11. Alfeo, V.; Jaskula-Goiris, B.; Venora, G.; Schimmenti, E.; Aerts, G.; Todaro, A. Screening of durum wheat landraces (Triticum turgidum subsp. durum) for the malting suitability. J. Cereal Sci. 2018, 83, 101–109. [Google Scholar] [CrossRef]
  12. Forteschi, M.; Porcu, M.C.; Fanari, M.; Zinellu, M.; Secchi, N.; Buiatti, S.; Passaghe, P.; Bertoli, S.; Pretti, L. Quality assessment of Cascade Hop (Humulus lupulus L.) grown in Sardinia. Eur. Food Res. Technol. 2019, 245, 863–871. [Google Scholar] [CrossRef]
  13. Gugino, I.M.; Alfeo, V.; Ashkezary, M.R.; Marconi, O.; Pirrone, A.; Francesca, N.; Cincotta, F.; Verzera, A.; Todaro, A. Maiorca wheat malt: A comprehensive analysis of physicochemical properties, volatile compounds, and sensory evaluation in brewing process and final product quality. Food Chem. 2024, 435, 137517. [Google Scholar] [CrossRef]
  14. Ruggeri, R.; Rossini, F.; Roberto, S.R.; Sato, A.J.; Loussert, P.; Rutto, L.K.; Agehara, S. Development of hop cultivation in new growing areas: The state of the art and the way forward. Eur. J. Agron. 2024, 161, 127335. [Google Scholar] [CrossRef]
  15. Gugino, I.M.; Pirrone, A.; Lo Porto, L.G.; Giammusso, N.; Alfeo, V.; De Rouck, G.; Francesca, N.; Todaro, A. Optimizing malting conditions for the old Sicilian durum wheat landrace Perciasacchi: Effects of steeping time and temperature on malt and beer quality. LWT 2025, 216, 117361. [Google Scholar] [CrossRef]
  16. Herb, D.; Filichkin, T.; Fisk, S.; Helgerson, L.; Hayes, P.; Benson, A.; Vega, V.; Carey, D.; Thiel, R.; Cistue, L.; et al. Malt Modification and its Effects on the Contributions of Barley Genotype to Beer Flavor. J. Am. Soc. Brew. Chem. 2017, 75, 354–362. [Google Scholar] [CrossRef]
  17. Parenti, O.; Carini, E.; Cattaneo, C.; Dall’Asta, M.; Laureati, M.; Scazzina, F.; Fascioli, D.; Chiavaro, E. Preserving Triticum biodiversity: High technological, nutritional, and sensory quality of whole wheat pasta from ancient, old, and evolutionary wheat varieties. LWT 2025, 228, 118065. [Google Scholar] [CrossRef]
  18. Frankin, S.; Cna’ani, A.; Bonfil, D.J.; Tzin, V.; Nashef, K.; Degen, D.; Simhon, Y.; Baizerman, M.; Ibba, M.I.; González Santoyo, H.I.; et al. New flavors from old wheats: Exploring the aroma profiles and sensory attributes of local Mediterranean wheat landraces. Front. Nutr. 2023, 10, 1059078. [Google Scholar] [CrossRef]
  19. Shewry, P.R. Do ancient types of wheat have health benefits compared with modern bread wheat? J. Cereal Sci. 2018, 79, 469–476. [Google Scholar] [CrossRef]
  20. Shewry, P.R.; Hey, S. Do “ancient” wheat species differ from modern bread wheat in their contents of bioactive components? J. Cereal Sci. 2015, 65, 236–243. [Google Scholar] [CrossRef]
  21. Boukid, F.; Dall’Asta, M.; Bresciani, L.; Mena, P.; Del Rio, D.; Calani, L.; Sayar, R.; Seo, Y.W.; Yacoubi, I.; Mejri, M. Phenolic profile and antioxidant capacity of landraces, old and modern Tunisian durum wheat. Eur. Food Res. Technol. 2019, 245, 73–82. [Google Scholar] [CrossRef]
  22. Dinelli, G.; Segura Carretero, A.; Di Silvestro, R.; Marotti, I.; Fu, S.; Benedettelli, S.; Ghiselli, L.; Fernández Gutiérrez, A. Determination of phenolic compounds in modern and old varieties of durum wheat using liquid chromatography coupled with time-of-flight mass spectrometry. J. Chromatogr. A 2009, 1216, 7229–7240. [Google Scholar] [CrossRef]
  23. Garavaglia, C.; Swinnen, J. Economics of the Craft Beer Revolution: A Comparative International Perspective. In Economic Perspectives on Craft Beer: A Revolution in the Global Beer Industry; Garavaglia, C., Swinnen, J., Eds.; Springer International Publishing: Cham, Switzerland, 2018; pp. 3–51. [Google Scholar]
  24. Alfeo, V.; De Francesco, G.; Sileoni, V.; Blangiforti, S.; Palmeri, R.; Aerts, G.; Perretti, G.; Todaro, A. Physicochemical properties, sugar profile, and non-starch polysaccharides characterization of old wheat malt landraces. J. Food Compos. Anal. 2021, 102, 103997. [Google Scholar] [CrossRef]
  25. De Flaviis, R.; Santarelli, V.; Giuliani, M.; Neri, L.; Sacchetti, G. Influence of wheat content and origin on the volatilome of craft wheat beer: An investigation by combined multivariate statistical approaches. Food Res. Int. 2024, 191, 114709. [Google Scholar] [CrossRef] [PubMed]
  26. Giunta, F.; Pruneddu, G.; Motzo, R. Grain yield and grain protein of old and modern durum wheat cultivars grown under different cropping systems. Field Crops Res. 2019, 230, 107–120. [Google Scholar] [CrossRef]
  27. Gómez-Corona, C.; Escalona-Buendía, H.B.; García, M.; Chollet, S.; Valentin, D. Craft vs. industrial: Habits, attitudes and motivations towards beer consumption in Mexico. Appetite 2016, 96, 358–367. [Google Scholar] [CrossRef] [PubMed]
  28. Aquilani, B.; Laureti, T.; Poponi, S.; Secondi, L. Beer choice and consumption determinants when craft beers are tasted: An exploratory study of consumer preferences. Food Qual. Prefer. 2015, 41, 214–224. [Google Scholar] [CrossRef]
  29. Bimbo, F.; De Meo, E.; Baiano, A.; Carlucci, D. The Value of Craft Beer Styles: Evidence from the Italian Market. Foods 2023, 12, 1328. [Google Scholar] [CrossRef]
  30. Gómez-Corona, C.; Escalona-Buendía, H.B.; Chollet, S.; Valentin, D. The building blocks of drinking experience across men and women: A case study with craft and industrial beers. Appetite 2017, 116, 345–356. [Google Scholar] [CrossRef]
  31. Donadini, G.; Fumi, M.D.; Kordialik-Bogacka, E.; Maggi, L.; Lambri, M.; Sckokai, P. Consumer interest in specialty beers in three European markets. Food Res. Int. 2016, 85, 301–314. [Google Scholar] [CrossRef]
  32. Mefleh, M.; Conte, P.; Fadda, C.; Giunta, F.; Piga, A.; Hassoun, G.; Motzo, R. From ancient to old and modern durum wheat varieties: Interaction among cultivar traits, management, and technological quality. J. Sci. Food Agric. 2019, 99, 2059–2067. [Google Scholar] [CrossRef]
  33. Agenzia Laore. Sardegna—Repertorio Regionale Dell’Agrobiodiversità. Available online: https://www.biodiversitasardegna.it/laore/it/agrobiodiversita/repertorio-regionale/ (accessed on 6 August 2025).
  34. Vaccino, P.M. Francesco I frumenti teneri locali della Sardegna: Un’inaspettata riscoperta, le iniziative di valorizzazione. Analysis 2018, 2. [Google Scholar]
  35. European Brewery Convention (EBC) (Ed.) 9.6—Colour of Beer: Spectrophotometric Method (IM). In Analytica; Fachverlag Hans Carl: Nürnberg, Germany, 2004. [Google Scholar]
  36. European Brewery Convention (EBC) (Ed.) 9.42—Foam Stability of Beer using the NIBEM-T Meter. In Analytica; Fachverlag Hans Carl: Nürnberg, Germany, 2007. [Google Scholar]
  37. Singleton, V.L.; Rossi, J.A. Colorimetry of Total Phenolics with Phosphomolybdic-Phosphotungstic Acid Reagents. Am. J. Enol. Viticult 1965, 16, 144–158. [Google Scholar] [CrossRef]
  38. Ligor, M.; Stankevičius, M.; Wenda-Piesik, A.; Obelevičius, K.; Ragažinskienė, O.; Stanius, Ž.; Maruška, A.; Buszewski, B. Comparative Gas Chromatographic–Mass Spectrometric Evaluation of Hop (Humulus lupulus L.) Essential Oils and Extracts Obtained Using Different Sample Preparation Methods. Food Anal. Methods 2014, 7, 1433–1442. [Google Scholar] [CrossRef]
  39. ISO 8589; Sensory Analysis—General Guidance for the Design of Test Rooms. International Organization for Standardization (ISO): Geneva, Switzerland, 2007.
  40. Yorke, J.; Cook, D.; Ford, R. Brewing with Unmalted Cereal Adjuncts: Sensory and Analytical Impacts on Beer Quality. Beverages 2021, 7, 4. [Google Scholar] [CrossRef]
  41. ISO 8586; Sensory Analysis—Selection and Training of Sensory Assessors. International Organization for Standardization (ISO): Geneva, Switzerland, 2023.
  42. ISO 13299; Sensory Analysis—Methodology—General Guide to Defining a Sensory Profile. International Organization for Standardization (ISO): Geneva, Switzerland, 2016.
  43. Murray, J.M.; Delahunty, C.M.; Baxter, I.A. Descriptive sensory analysis: Past, present and future. Food Res. Int. 2001, 34, 461–471. [Google Scholar] [CrossRef]
  44. Tomic, O.; Luciano, G.; Nilsen, A.; Hyldig, G.; Lorensen, K.; Næs, T. Analysing sensory panel performance in a proficiency test using the PanelCheck software. Eur. Food Res. Technol. 2010, 230, 497–511. [Google Scholar] [CrossRef]
  45. Jaeger, S.R.; Chheang, S.L.; Yin, J.; Bava, C.M.; Gimenez, A.; Vidal, L.; Ares, G. Check-all-that-apply (CATA) responses elicited by consumers: Within-assessor reproducibility and stability of sensory product characterizations. Food Qual. Prefer. 2013, 30, 56–67. [Google Scholar] [CrossRef]
  46. Dooley, L.; Lee, Y.-S.; Meullenet, J.-F. The application of check-all-that-apply (CATA) consumer profiling to preference mapping of vanilla ice cream and its comparison to classical external preference mapping. Food Qual. Prefer. 2010, 21, 394–401. [Google Scholar] [CrossRef]
  47. Ares, G.; Jaeger, S.R. Check-all-that-apply questions: Influence of attribute order on sensory product characterization. Food Qual. Prefer. 2013, 28, 141–153. [Google Scholar] [CrossRef]
  48. Meilgaard, M.; Civille, G.V.; Carr, B.T. Sensory Evaluation Techniques; CRC Press: Boca Raton, FL, USA, 2006; p. 464. [Google Scholar]
  49. Chung, S.-J.; Heymann, H.; Grün, I.U. Application of GPA and PLSR in correlating sensory and chemical data sets. Food Qual. Prefer. 2003, 14, 485–495. [Google Scholar] [CrossRef]
  50. De Flaviis, R.; Santarelli, V.; Mutarutwa, D.; Grilli, S.; Sacchetti, G. A unifying approach to wheat beer flavour by chemometric analyses. Could we speak of ‘terroir’? Curr. Res. Food Sci. 2023, 6, 100429. [Google Scholar] [CrossRef]
  51. Elgaard, L.; Mielby, L.A.; Hopfer, H.; Byrne, D.V. A Comparison of Two Sensory Panels Trained with Different Feedback Calibration Range Specifications via Sensory Description of Five Beers. Foods 2019, 8, 534. [Google Scholar] [CrossRef]
  52. Gower, J.C. Generalized procrustes analysis. Psychometrika 1975, 40, 33–51. [Google Scholar] [CrossRef]
  53. Leedon, G.; L’Espoir Decosta, J.-N.P.; Buttriss, G.; Lu, V.N. Consuming the earth? Terroir and rural sustainability. J. Rural Stud. 2021, 87, 415–422. [Google Scholar] [CrossRef]
  54. Castelló, E. The will for terroir: A communicative approach. J. Rural Stud. 2021, 86, 386–397. [Google Scholar] [CrossRef]
Figure 1. Relative abundance (%) of chemical classes of VOCs in beers: X (control); C1 (Tricu Cossu beer), C2 (Trigu Murru beer); C3 (Trigu Denti de Cani beer); C4 (Trigu Moru beer).
Applsci 15 09138 g001
Figure 2. Principal Component Analysis (PCA) biplot of VOC profiles from wheat beer samples. Blue circles represent individual beer samples, labeled according to sample codes (X: control; C1: Tricu Cossu beer; C2: Trigu Murru beer; C3: Trigu Denti de Cani beer; C4: Trigu Moru beer). Black arrows indicate the variable loadings of VOCs, each labeled with a number. The direction and length of each arrow represent the contribution and correlation of each compound to the first two principal components (PC1 and PC2). VOCs are labeled numerically as follows: 1—n-Decanoic acid; 2—3-methylbutan-1-ol; 3—2-methylbutan-1-ol; 4—2-phenylethan-1-ol; 5—3-methylbutyl ethanoate; 6—2-methylbutyl ethanoate; 7—ethyl hexanoate; 8—ethyl octanoate; 9—phenethyl acetate; 10—ethyl decanoate; 11-ethyl dodecanoate: 12-linalool.
Applsci 15 09138 g002
Figure 3. Descriptive analysis results: mean values for each sensory descriptor: X (control); C1 (Tricu Cossu beer); C2 (Trigu Murru beer); C3 (Trigu Denti de Cani beer); C4 (Trigu Moru beer). For each descriptor, the relevant significance is reported (** p < 0.01; * p < 0.05).
Applsci 15 09138 g003
Figure 4. Radar plots of the main sensory descriptors and the frequency of selection by 128 panelists across all beer samples: X (control); C1 (Tricu Cossu beer); C2 (Trigu Murru beer); C3 (Trigu Denti de Cani beer); C4 (Trigu Moru beer).
Applsci 15 09138 g004
Figure 5. A biplot drawn by the correspondence analysis (CA), explaining 86 % of total variance in the association between samples and sensory attributes of the beers: X (control); C1 (Tricu Cossu beer); C2 (Trigu Murru beer); C3 (Trigu Denti de Cani beer); C4 (Trigu Moru beer).
Applsci 15 09138 g005
Figure 6. Box plot for consumers acceptance testing using a nine-point structure hedonic scale. Outliers are represented as points (.) beyond the whiskers.
Applsci 15 09138 g006
Figure 7. Internal preference mapping referring to all consumers involved in this study allows us to determine evaluator by evaluator which products were the most liked.
Applsci 15 09138 g007
Figure 8. (A) Dendrogram representing the results of the cluster analysis of the beers C1, C2, C3, and C4 and the control X, organizing the samples in clusters according to the global sensory acceptability values. (B) Preferences cluster in Cluster 2 (men aged 30–45 years, experienced and regular consumers of craft beers), Cluster 1 (men aged 46–60 years, regular consumers of beer, including craft beer), and Cluster 3 (women aged 35–55 years, occasional consumers of craft beers). Lowercase letters indicate significant differences (p < 0.05).
Applsci 15 09138 g008
Figure 9. Preferences expressed by clusters for each beer: control (X), C1 (Tricu Cossu beer), C2 (Trigu Murru beer), C3 (Trigu Denti de Cani beer), C4 (Trigu Moru beer).
Applsci 15 09138 g009
Table 1. Standard quality parameters: X (control), C1 (Tricu Cossu beer), C2 (Trigu Murru beer), C3 (Trigu Denti de Cani beer), C4 (Trigu Moru beer). Values are averages of six measurements ± the standard deviation. Values in the same line followed by different letters are statistically different (p < 0.05).
ParameterXC1C2C3C4
Alcohol (% v/v)5.02 ± 0.00 b6.22 ± 0.00 a4.41 ± 0.00 c4.92 ± 0.20 bc5.04 ± 0.00 b
Density (g/cm3)1.01446 ± 0.00071 a1.01154 ± 0.00007 b1.01441 ± 0.00001 a1.01311 ± 0.00008 ab1.01228 ± 0.00001 b
Re (real extract) (% w/w)5.96 ± 0.19 a5.62 ± 0.00 ab5.74 ± 0.01 ab5.58 ± 0.04 ab5.41 ± 0.00 b
Ae (app. extract) (% w/w)4.16 ± 0.18 a3.41 ± 0.01 b4.15 ± 0.01 a3.82 ± 0.02 ab3.60 ± 0.00 ab
Oe (original extract) (% w/w)13.47 ± 0.22 b14.87 ± 0.00 a12.37 ± 0.06 c12.97 ± 0.31 bc12.99 ± 0.01 b
RDF (real deg. of ferm.)57.57 ± 0.64 bc64.08 ± 0.01 a55.28 ± 0.16 c58.65 ± 0.74 b59.99 ± 0.01 b
Foam stability (s/3 cm)337 ± 1 a272 ± 2 b298 ± 11 ab258 ± 25 bc249 ± 2 c
TPC (GAE mg/L)335.0 ± 6.0 a331.2 ± 7.1 ab283.1 ± 22.5 b334.9 ± 3.0 a339.0 ± 9.2 a
Color (EBC unit)7.11 ± 0.01 b9.00 ± 0.13 a6.45 ± 0.69 c6.99 ± 0.18 b7.65 ± 0.07 b
pH4.57 ± 0.03 b4.50 ± 0.01 b4.63 ± 0.02 ab4.68 ± 0.00 a4.70 ± 0.01 a
Table 2. Volatile Organic Compounds of the beers identified by using GC-MS. X (control); C1 (Tricu Cossu beer); C2 (Trigu Murru beer); C3 (Trigu Denti de Cani beer); C4 (Trigu Moru beer). Different letters within each row represent a significant difference (p < 0.05).
Chemical ClassNameRTRIcalcXC1C2C3C4
Alcohols2-methylpropan-1-ol7.61654--0.65 ± 0.05--
3-methylbutan-1-ol12.357384.31 ± 0.12 d6.50 bc ± 0.78.85 ± 0.31 a5.44 ± 0.51 c7.21 ± 0.40 b
2-methylbutan-1-ol12.547411.13 ± 0.02 b2.10 ± 0.37 a2.14 ± 0.11 a1.30 ± 0.10 b1.45 ± 0.04 b
2-Furanmethanol19.598590.22 ± 0.00-0.29 ± 0.020.08 ± 0.010.11 ± 0.02
1-Hexanol20.428730.02 ± 0.00-0.07 ± 0.000.02 ± 0.000.03 ± 0.00
1-Heptanol26.5973--0.02 ± 0.00--
2-ethylhexan-1-ol29.751032----0.03 ± 0.00
1-Octanol32.110740.02 ± 0.00-0.06 ± 0.010.03 ± 0.000.03 ± 0.00
2-Nonanol33.7311020.39 ± 0.01-0.83 ± 0.060.31 ± 0.010.41 ± 0.03
2-phenylethan-1-ol34.5611185.09 ± 0.03 b4.00 ± 0.09 c16.07 ± 0.63 a10.99 ± 0.77 b11.86 ± 0.89 b
2-Decanol38.8612020.25 ± 0.00-0.66 ± 0.030.17 ± 0.010.29 ± 0.01
1-Decanol42.2612730.04 ± 0.00-0.12 ± 0.010.04 ± 0.000.05 ± 0.00
2-Undecan-1-ol43.6513020.59 ± 0.06-1.28 ± 0.090.39 ± 0.020.54 ± 0.05
2-Methoxy-4-vinylphenol44.2713161.22 ± 0.071.30 ± 0.001.34 ± 0.110.90 ± 0.220.88 ± 0.18
1-Dodecanol51.2214750.02 ± 0.00-0.03 ± 0.000.02 ± 0.000.01 ± 0.00
2.4-Di-tert-butylphenol52.6315090.52 ± 0.06-1.45 ± 0.260.13 ± 0.070.37 ± 0.11
EstersEthyl acetate7.12a4.80 ± 0.44 3.03 ± 0.293.74 ± 0.623.80 ± 0.02
2-Methylpropyl ethanoate14.457750.14 ± 0.03 0.09 ± 0.000.14 ± 0.010.09 ± 0.09
Ethyl butanoate16.058030.15 ± 0.00 0.10 ± 0.010.10 ± 0.000.08 ± 0.01
3-methylbutyl ethanoate20.768787.94 ± 0.48 ab8.82 ± 0.79 a4.26 ± 0.07 d5.73 ± 0.34 c6.34 ± 0.33 bc
2-methylbutyl ethanoate20.888800.82 ± 0.021.30 ± 0.170.53 ± 0.000.67 ± 0.080.57 ± 0.03
Ethyl hexanoate28.019982.05 ±0.19 2.01 ± 0.091.04 ± 0.271.31 ± 0.14
Hexyl ethanoate28.810120.23 ± 0.01 b3.97 ± 0.26 a0.14 ± 0.00 b0.10 ± 0.03 c0.11 ± 0.00 c
3-Methylbutyl 2-methylpropanoate28.9810180.22 ± 0.02 0.03 ± 0.000.01 ± 0.000.02 ± 0.00
Hethyl heptanoate33.4310980.06 ± 0.00 0.08 ± 0.000.04 ± 0.010.05 ± 0.00
Ethyl octanoate38.53119612.86 ± 0.42 b18.80 ± 0.07 a9.17 ± 0.86 c8.84 ± 0.42 c10.82 ± 1.50 bc
phenethyl acetate41.5112583.83± 0.29 ab3.42 ± 0.13 b3.64 ± 0.08 b5.06 ± 0.44 a4.00 ± 0.69 ab
Methyl geranate44.5213220.18 ± 0.02 0.23 ± 0.010.09 ± 0.000.15 ± 0.01
Ethyl decanoate47.75139415.03 ± 0.14 b20.59 ± 0.45 a9.85 ± 0.83 c19.13 ± 2.13 ab17.69 ± 1.96 ab
Ethyl 9-decenoate47.381385- 0.85 ± 0.28-0.25 ± 0.02
3-methylbutyl octanoate49.9614450.17 ± 0.01 0.18 ± 0.020.38 ± 0.040.21 ± 0.07
Ethyl dodecanoate55.9615928.12 ± 0.07 ab2.30 ± 0.21 c6.01 ± 0.40 b10.13 ± 1.27 a8.90 ± 1.90 ab
Ethyl hexadec-9-enoate71.4819740.09 ± 0.06 0.19 ± 0.070.25 ± 0.050.04 ± 0.03
Ethyl hexadecanoate72.3619930.25 ± 0.10 0.46 ± 0.021.64 ±0.361.10 ± 0.58
Organic acidsHexanoic acid27.19830.50 ± 0.06 0.75 ± 0.030.53 ± 0.060.62 ± 0.06
Octanoic acidN/F 10.15 ± 0.55 a10.62 ± 1.10 a12.67 ± 0.52 a9.33 ± 0.76 a9.60 ± 2.60 a
Nonanoic acid41.9712670.15 ± 0.01 0.22 ± 0.010.13 ± 0.010.13 ± 0.03
n-Decanoic acid46.97137615.20 ± 0.37 a10.13 ± 0.10 bc8.66 ± 0.19 c10.69 ± 0.15 b8.68 ± 1.00 c
Dodecanoic acid54.7315611.49 ± 0.05 0.71 ± 0.011.03 ± 0.010.59 ± 0.30
9-Hexadecenoic acid70.031943- ---
Terpenes3.3.6-Trimethyl-1.5-heptadiene22.359040.03 ± 0.00 0.04 ± 0.01--
Limonene29.8810340.01 ± 0.00 0.02 ± 0.000.01 ± 0.000.01 ± 0.00
β-Phellandrene29.9910360.03 ± 0.00 0.05 ± 0.010.02 ± 0.000.03 ± 0.00
3.7-dimethylocta-1.3.6-triene30.7210490.03 ± 0.00 0.05 ± 0.010.03 ± 0.000.03 ± 0.00
Linalool33.6511010.23 ± 0.00 c0.95 ± 0.03 a0.40 ± 0.01 b0.22 ± 0.02 c0.21 ± 0.05 c
(3R) -3.7-dimethyloct-6-en-1-ol40.0912280.21 ± 0.01 0.33 ± 0.040.10 ± 0.010.15 ± 0.01
Geraniol41.2612520.02 ± 0.00 0.07 ± 0.000.02 ±0.000.03 ± 0.00
(Z)-beta-farnesene50.3314540.08 ± 0.00 0.11 ± 0.010.12 ± 0.060.10 ± 0.04
α-Humulene50.9314680.10 ± 0.00 0.09 ± 0.020.39 ± 0.250.21 ± 0.20
Terpineol38.7612000.24 ± 0.01-0.05 ± 0.000.02 ± 0.000.21 ± 0.00
Other2-Nonanone33.1410930.02 ± 0.00 0.14 ± 0.010.02 ± 0.000.05 ± 0.00
4H-Pyran-4-one. 2.3-dihydro-3.5-dihydroxy-6-methyl-36.0611480.10 ± 0.00 0.07 ± 0.020.04 ± 0.000.05 ± 0.01
Styrene21.648920.34 ± 0.02 0.27 ± 0.020.17 ± 0.040.21 ± 0.02
Unknown29.610290.12 ± 0.01 0.17 ± 0.010.08 ± 0.000.09 ± 0.01
Spiropentane, butyl-42.7312830.19 ± 0.02 0.42 ± 0.030.13 ± 0.010.19 ± 0.04
Table 3. Post hoc multiple pairwise comparisons were performed using McNemar’s test with Bonferroni alpha adjustment. The proportions with different letters within each row represent a significant difference a p < 0.05.
DescriptorXC1C2C3C4
honey smell0.316 a0.658 b0.697 b0.654 b0.237 a
cereal smell0.368 b0.474 b0.395 b0.368 b0.158 a
yeast smell0.250 a0.342 ab0.329 ab0.289 a0.276 a
acid taste0.171 ab0.184 ab0.132 a0.289 b0.276 b
viscous0.053 a0.158 ab0.132 ab0.158 ab0.211 b
sweet taste0.145 a0.342 b0.237 ab0.158 a0.263 ab
bitter taste0.329 a0.368 ab0.408 ab0.342 ab0.461 b
alcohol0.197 a0.132 a0.132 a0.237 b0.171 a
astringent0.224 b0.132 ab0.013 a0.158 b0.013 a
Disclaimer/Publisher’s Note: The statements, opinions and data contained in all publications are solely those of the individual author(s) and contributor(s) and not of MDPI and/or the editor(s). MDPI and/or the editor(s) disclaim responsibility for any injury to people or property resulting from any ideas, methods, instructions or products referred to in the content.