Article

Enhancing Wafer Notch Detection for Ion Implantation: Optimized YOLOv8 Approach with Global Attention Mechanism

by
Yuanhao Zhang
,
Hyo Jun Sim
,
Jong Jin Hwang
and
Seung Jae Moon
*
Department of Mechanical Convergence Engineering, Hanyang University, Seoul 04763, Republic of Korea
*
Author to whom correspondence should be addressed.
These authors contributed equally to this work.
Appl. Sci. 2025, 15(16), 9122; https://doi.org/10.3390/app15169122
Submission received: 11 July 2025 / Revised: 2 August 2025 / Accepted: 9 August 2025 / Published: 19 August 2025

Abstract

In the semiconductor manufacturing process, precise control of wafer notch angles during ion implantation is critical to prevent channeling effects that can lead to defects. Current detection methods face challenges in identifying wafer notches accurately, particularly under varying conditions. This paper proposes an enhanced YOLOv8 model tailored for small object detection, specifically aimed at improving the accuracy of wafer notch angle detection. By addressing class imbalance issues, introducing a small target detection layer and two new detection heads, and optimizing the global attention mechanism within the model’s backbone, we significantly improve detection performance. Experimental results demonstrate that our improved YOLOv8 model achieves a mean average precision of 93.4%, outperforming existing YOLO versions and other relevant models. This study not only enhances the reliability of wafer notch detection but also offers insights into optimizing object detection algorithms for precision manufacturing applications.

1. Introduction

Ion implantation is the process of introducing impurities into a wafer at precise angles to control its electrical properties. However, if ions are implanted at incorrect angles, they may fail to reach the designated target locations, resulting in the channeling effect. The channeling effect refers to a phenomenon observed when ions travel along specific crystallographic directions of the wafer. In such directions, the regular and periodic arrangement of atoms in the crystal lattice creates open channels, allowing ions to penetrate deeper into the material with fewer collisions. This unintended deep penetration disrupts the uniform distribution of dopants, leading to inconsistent electrical properties and potential defects in the wafer. Proper control of implantation angles in real time is therefore critical to avoiding the channeling effect and ensuring the accuracy of the ion implantation process [1,2].
In order to prevent the channeling effect, many attempts have been made. Existing wafer notch detection methods mainly use the brightness difference between the wafer and other areas under light irradiation to determine the notch. When the notch matching degree exceeds a set threshold level, it is determined to be a notch [3]. When the notch is positioned at the wafer edge support point on the inspection platform, the material used for the support is not fully transparent, causing partial obstruction of the incident light. As a result, the brightness difference changes, preventing the notch identification system from matching notches based on brightness differences, which leads to recognition and detection failure.
To overcome limitations in similar situations, the development of deep-learning-based algorithms capable of detecting subtle differences has emerged as an effective and reliable solution [4,5,6]. Due to the development of numerous detection algorithms, it became necessary to identify and select the most optimal algorithm for specific environmental conditions. Compared with detection technologies, such as EGDNet, faster R-CNN, cascade R-CNN, and RetinaNet, the YOLO (you only look once) model has shown significant advantages in many fields with its efficient real-time object detection capabilities, and it can quickly identify and track a variety of objects, such as cars, pedestrians, bicycles, and other obstacles, for action recognition in surveillance videos, greatly improving the efficiency of traffic management and public safety [7,8,9,10,11,12]. For example, EGDNet outperforms YOLO in detection accuracy, particularly for multi-scale features, but its real-time processing capability is limited due to the computational complexity of its feature pyramid balancing and intersection over union (IoU) balancing modules [13]. In detecting small objects in unmanned aerial vehicle (UAV) aerial photography, the YOLO model applied improved small object detection by optimizing feature extraction and fusion, enabling more accurate identification of targets in aerial imagery. By integrating lightweight modules and an improved loss function, the model effectively balanced detection performance and computational efficiency, making it suitable for real-time drone applications [14]. In addition, YOLO plays a vital role in biometric security, medical diagnostics, and remote sensing, enhancing system security, diagnostic accuracy, and applications like urban planning and traffic management [15,16,17,18]. Considering these strengths, YOLO can be recognized as a highly effective and superior detection method compared to other existing techniques.
This study presents a novel adaptation of the YOLOv8 network architecture, achieving significant performance improvements through a series of targeted enhancements [19]. To address the challenges of false detection and missed detection in wafer notch detection, a dedicated dataset was developed by incorporating images without wafer notches. Additionally, training datasets with varying proportions of positive and negative samples were employed to effectively resolve the class imbalance problem inherent in YOLOv8. Building on this foundation, the detection head architecture was refined by introducing two additional detection heads, enabling more fine-grained detection, particularly for small targets, with their necessity and effectiveness thoroughly validated. Furthermore, the study explores the feasibility of using an unconventional training approach where the same dataset is utilized for both training and validation under fixed scenarios and specific detection conditions, successfully demonstrating its practicality. To further enhance detection accuracy, multiple attention mechanisms, including the convolutional block attention module (CBAM), global attention mechanism (GAM), efficient channel attention mechanism (ECAM), squeeze and excitation attention network (SEAN), and parameter-free attention mechanism (PFAM), were integrated into the YOLOv8 architecture. The effects of applying these mechanisms to different network components, such as the backbone, neck, and head, were analyzed to assess their contributions to overall performance [20,21,22,23,24]. Despite the growing adoption of YOLO-based detectors in fields like UAV imaging and medical diagnostics, their application to wafer notch detection—particularly with angle estimation—remains underexplored. Existing studies are limited in scope and mostly address binary notch presence rather than precise angle localization. Therefore, this work aims to fill this research gap by offering a specialized approach tailored to the unique challenges of wafer notch detection. Additionally, an improved YOLOv8 detection method is proposed, incorporating the GAM into the backbone network and optimizing the GAM spatial attention mechanism by replacing the original large convolutional kernel with a smaller one. This optimization not only improves the accuracy of detecting small objects but also significantly reduces computational complexity, making the proposed method highly effective for wafer notch detection tasks.

2. Methods

2.1. Yolov8

Ultralytics YOLOv8 is an advanced and lightweight model that builds on the success of previous YOLO versions and introduces new modules, such as C2F, to further improve performance and flexibility [25]. YOLOv8 is designed to be fast, accurate, and easy to use, making it an excellent choice for a variety of object detection and tracking, instance segmentation, image classification, and pose estimation tasks.
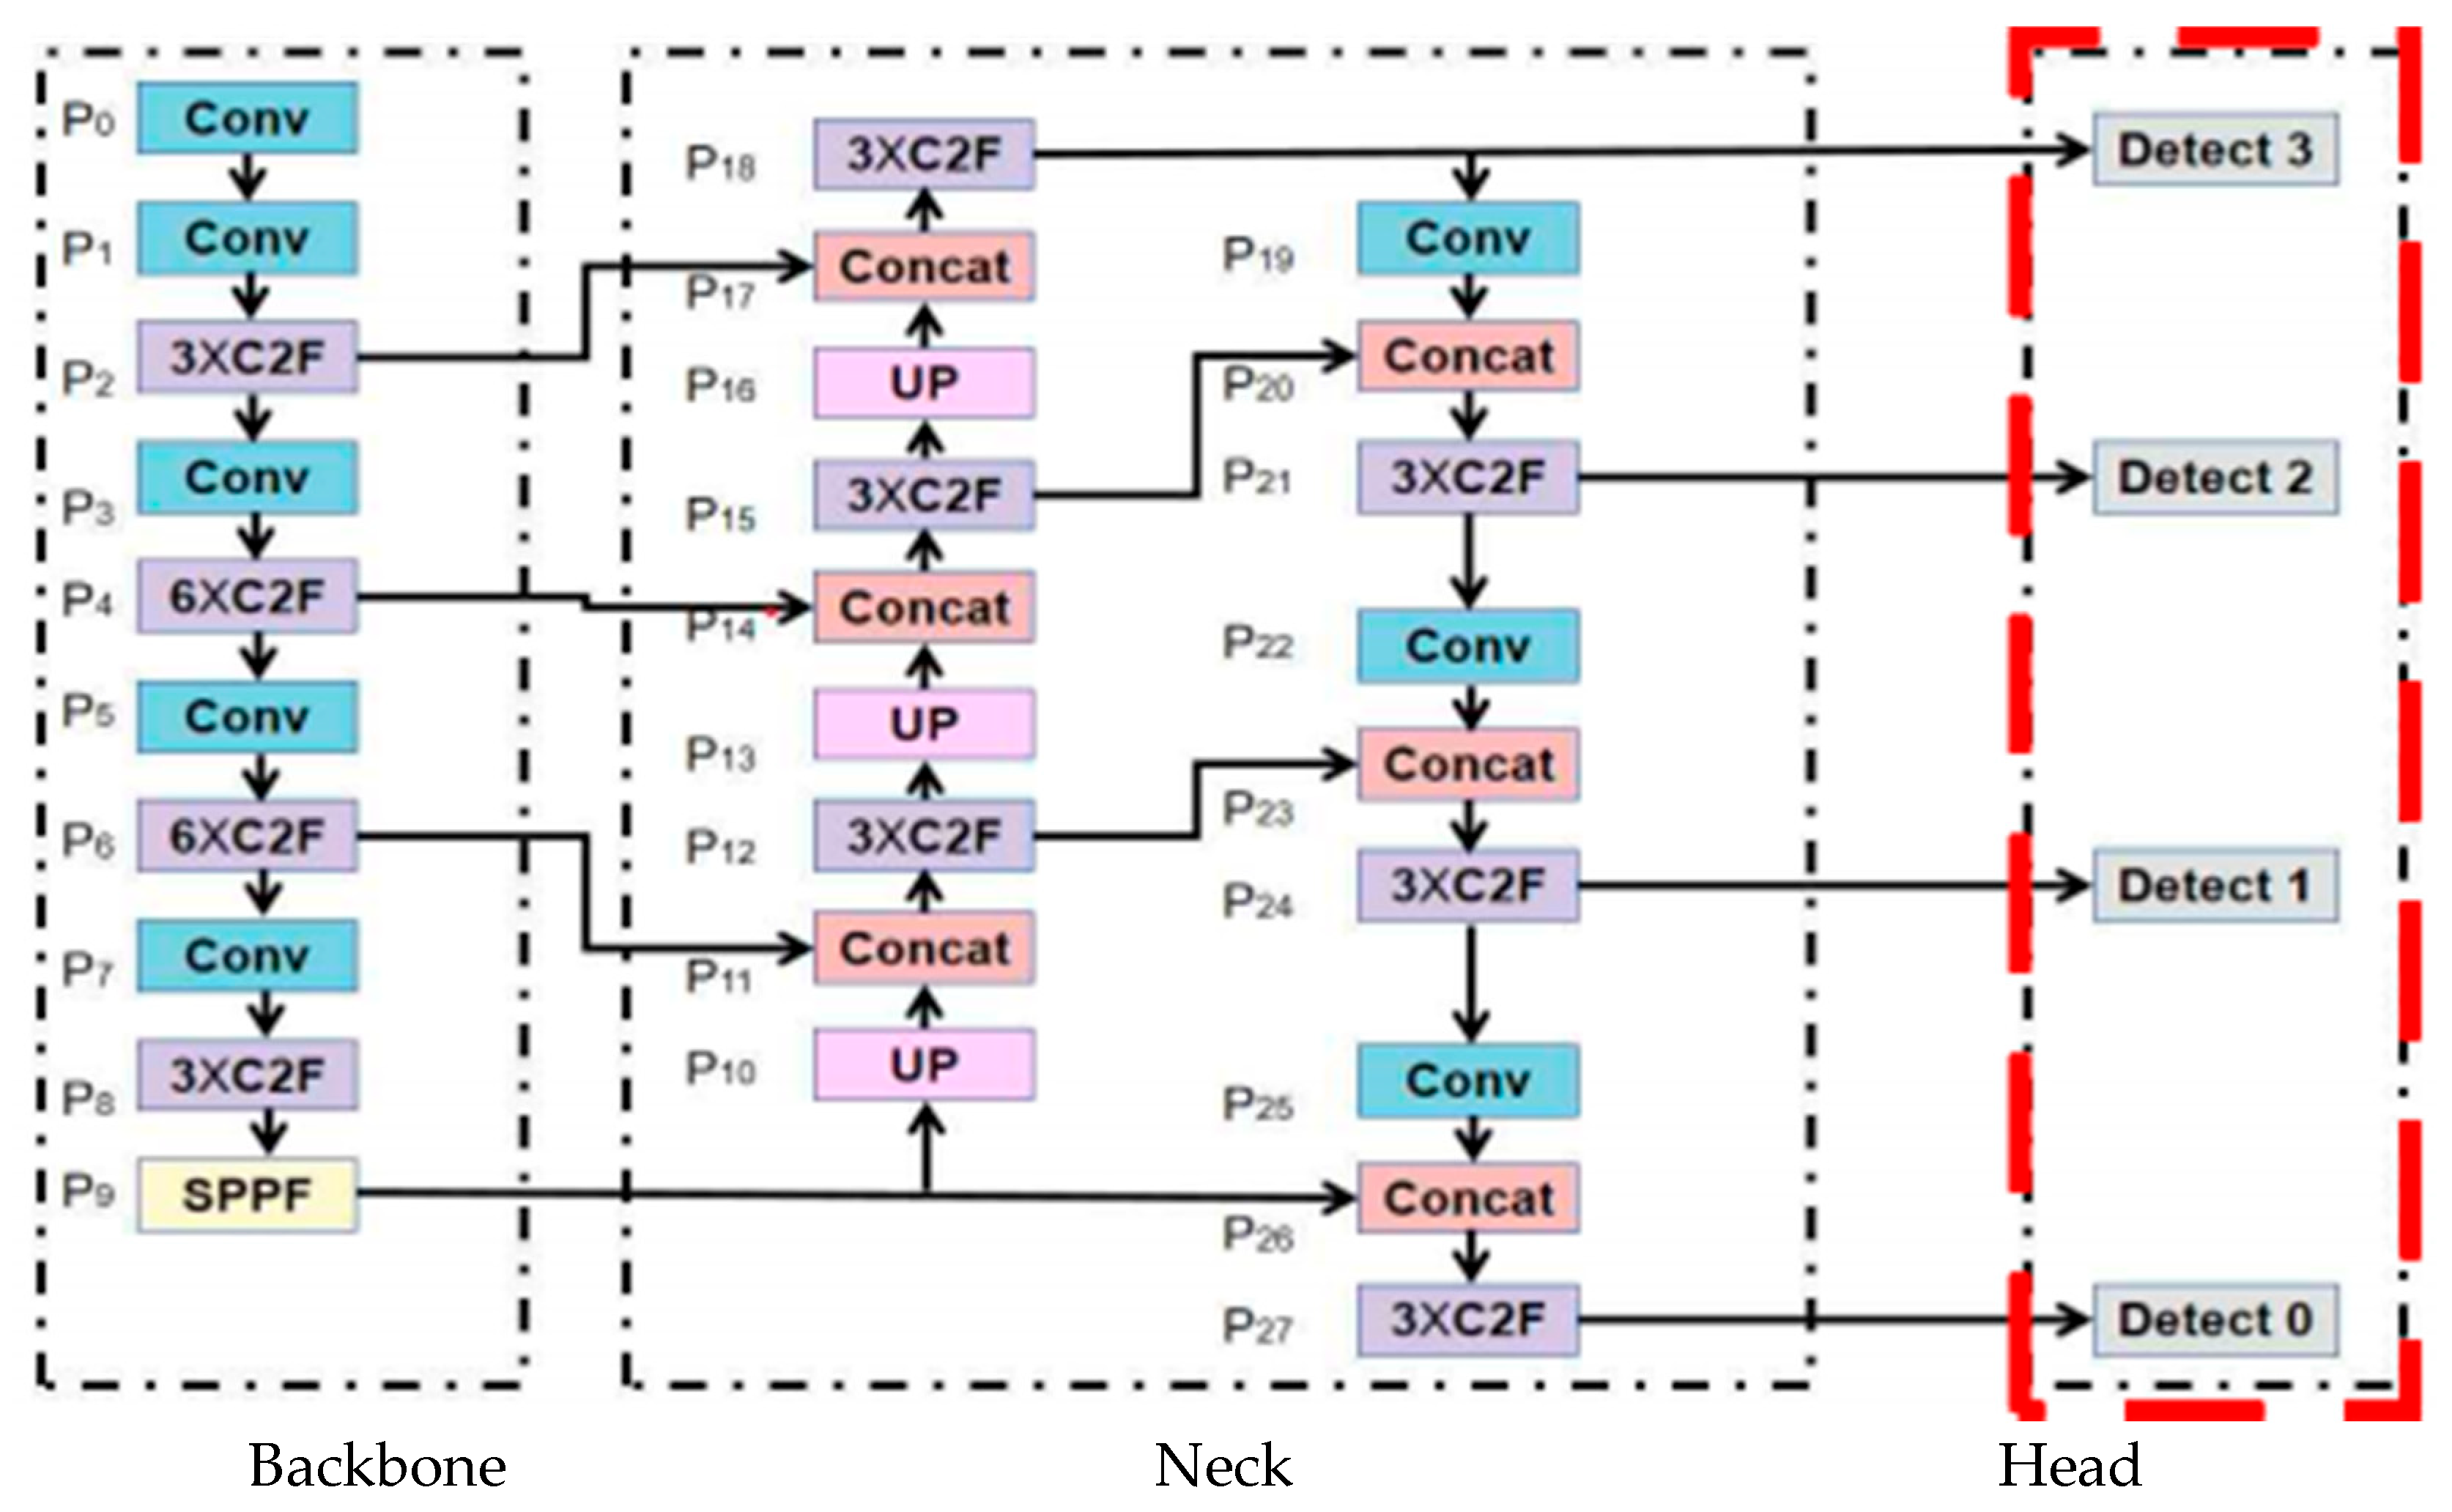
The network structure of YOLOv8 is divided into three parts, the backbone network, the feature enhancement network (neck), and the detection head, as shown in Figure 1. In the backbone network, the backbone network of YOLOv8 mainly uses five Conv modules, four c2f modules and one SPPF module, to complete the extraction of features of different sizes. In the feature enhancement network (neck), the YOLOv8 mainly adopts the idea of path aggregation network-featured pyramid networks (PA-FPN), but it removes some convolutions in the upsampling stage of PA-FPN so that the model’s architecture can be more concise, thus reducing the complexity of the model, reducing the amount of calculation and the number of parameters of the model, and thereby improving the reasoning speed of the model. In the detection head, YOLOv8 introduces a new module called the decoupling head, which separates the classification branch from the positioning branch, alleviating the inherent conflict between classification and regression tasks. In general, YOLOv8’s performance in target detection far exceeds that of other models of the same type.

2.2. Dataset Preparation

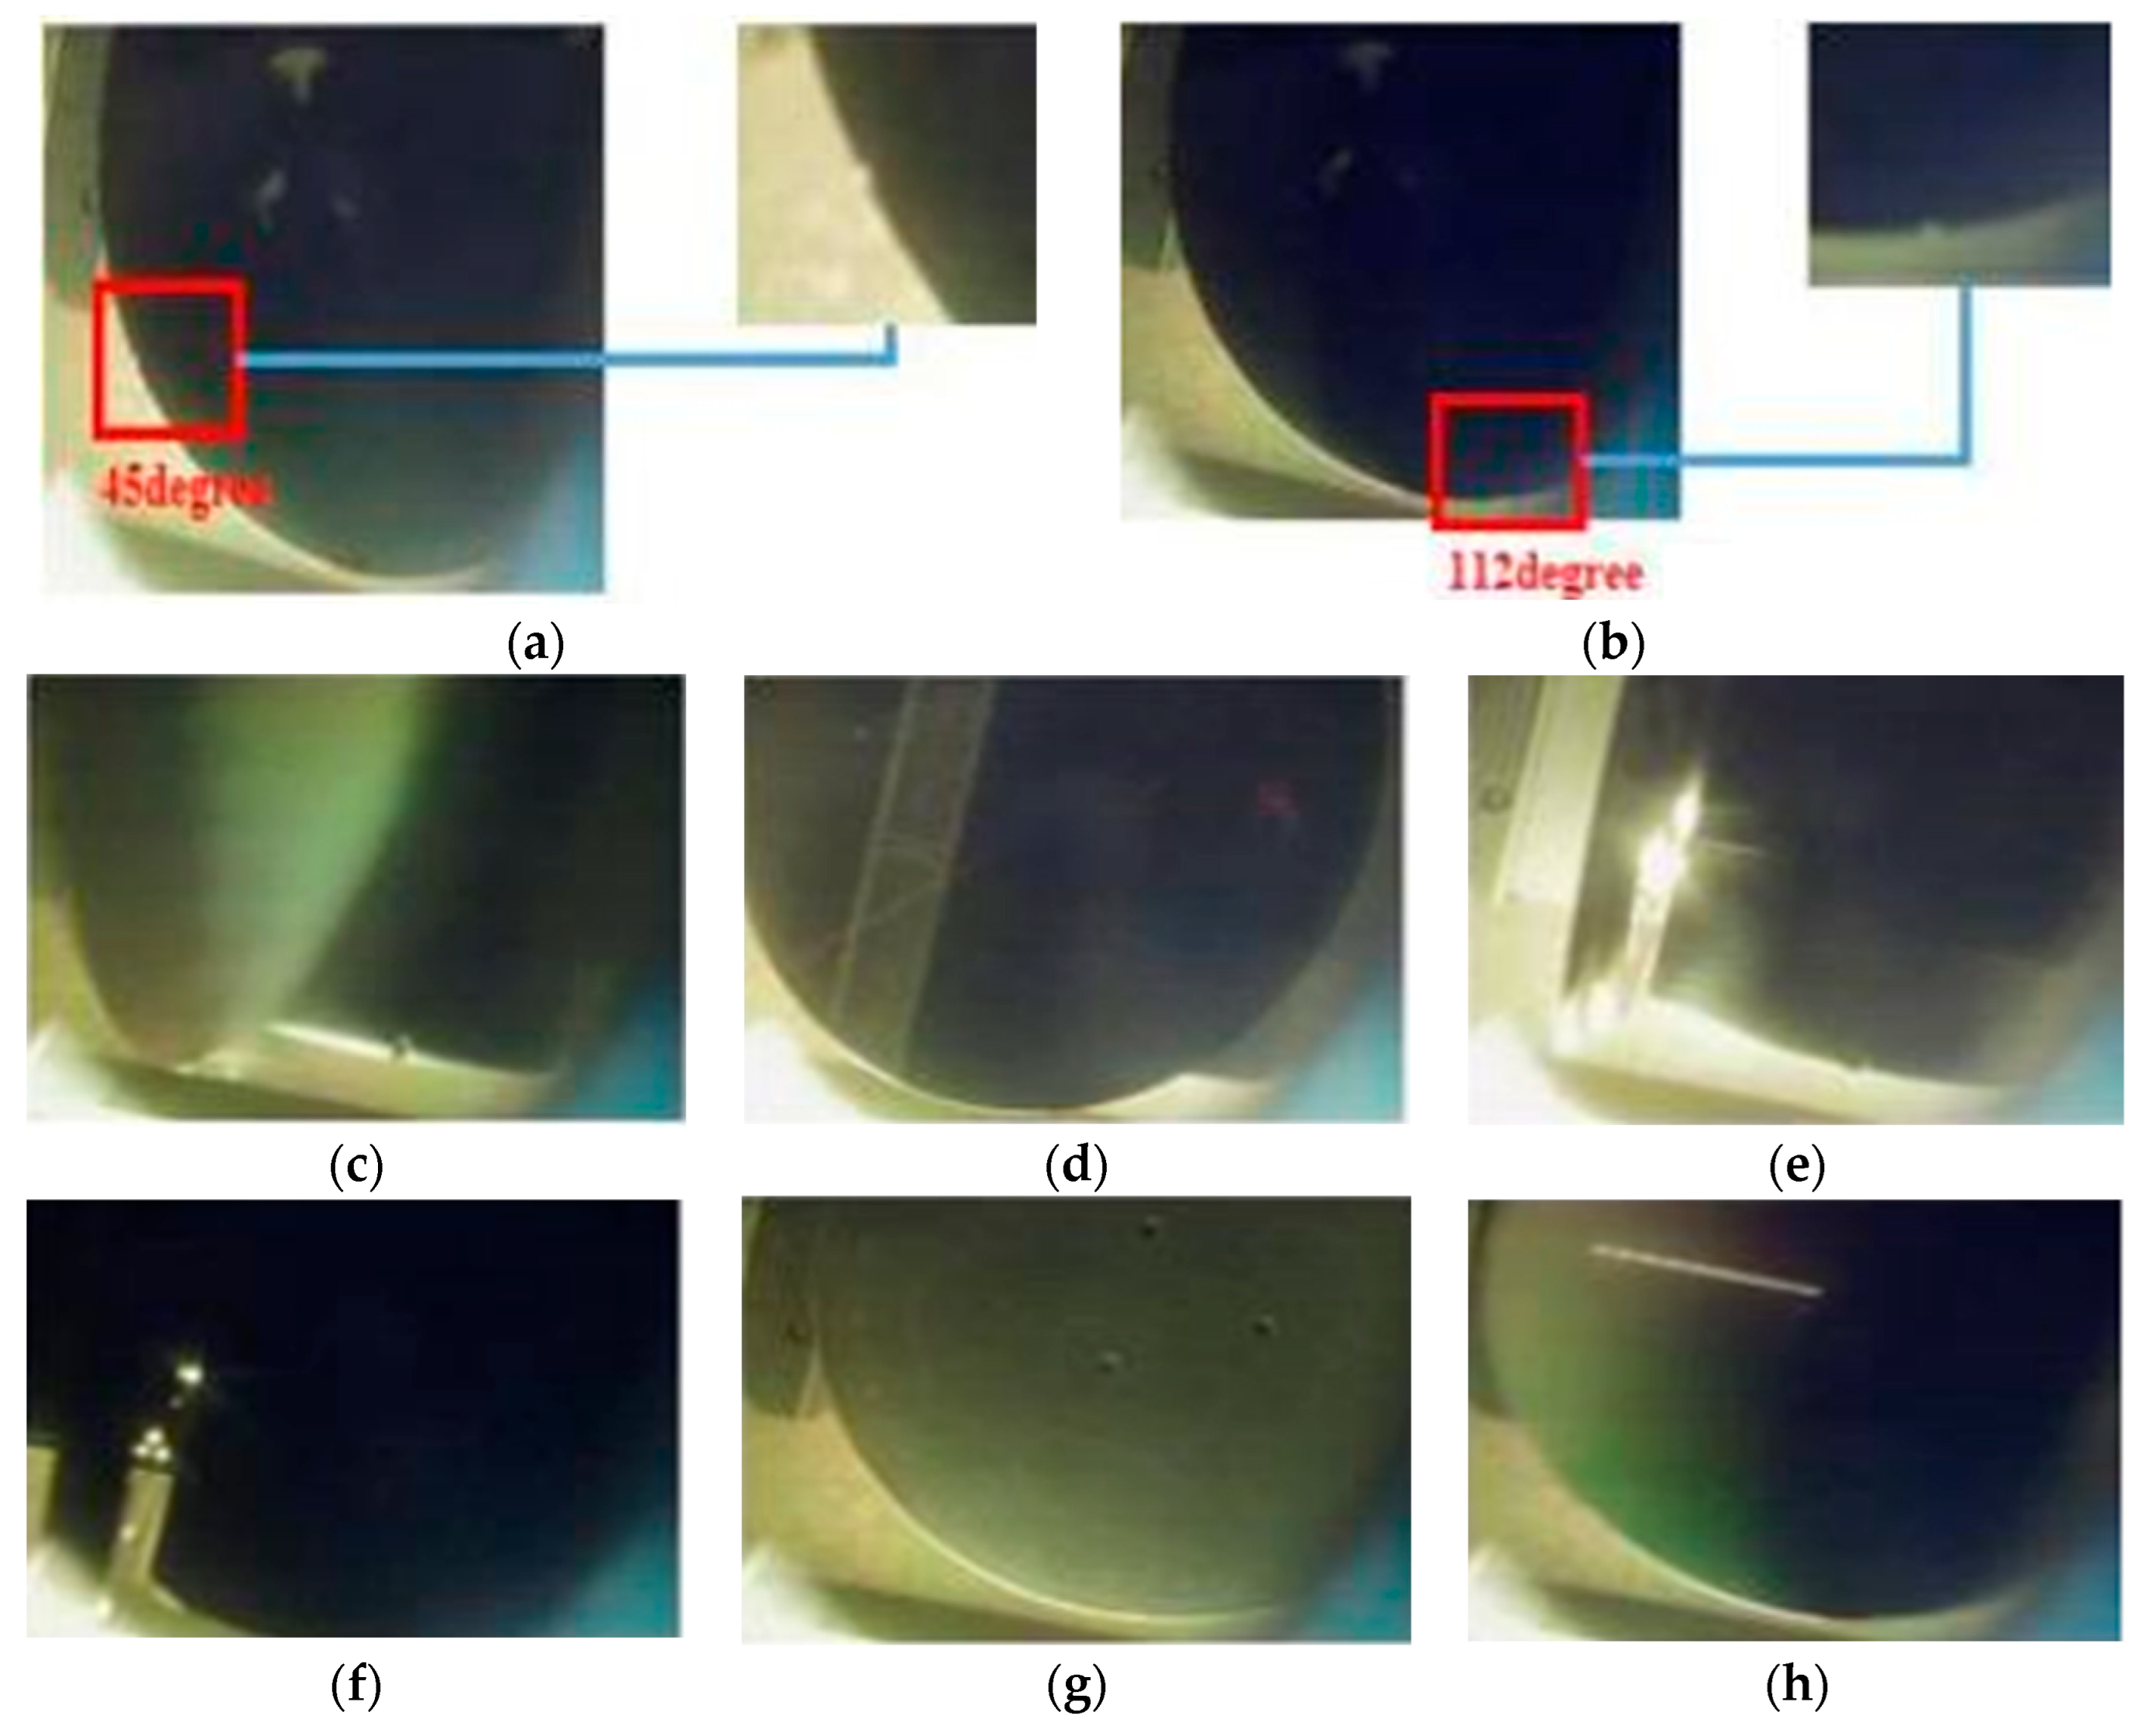
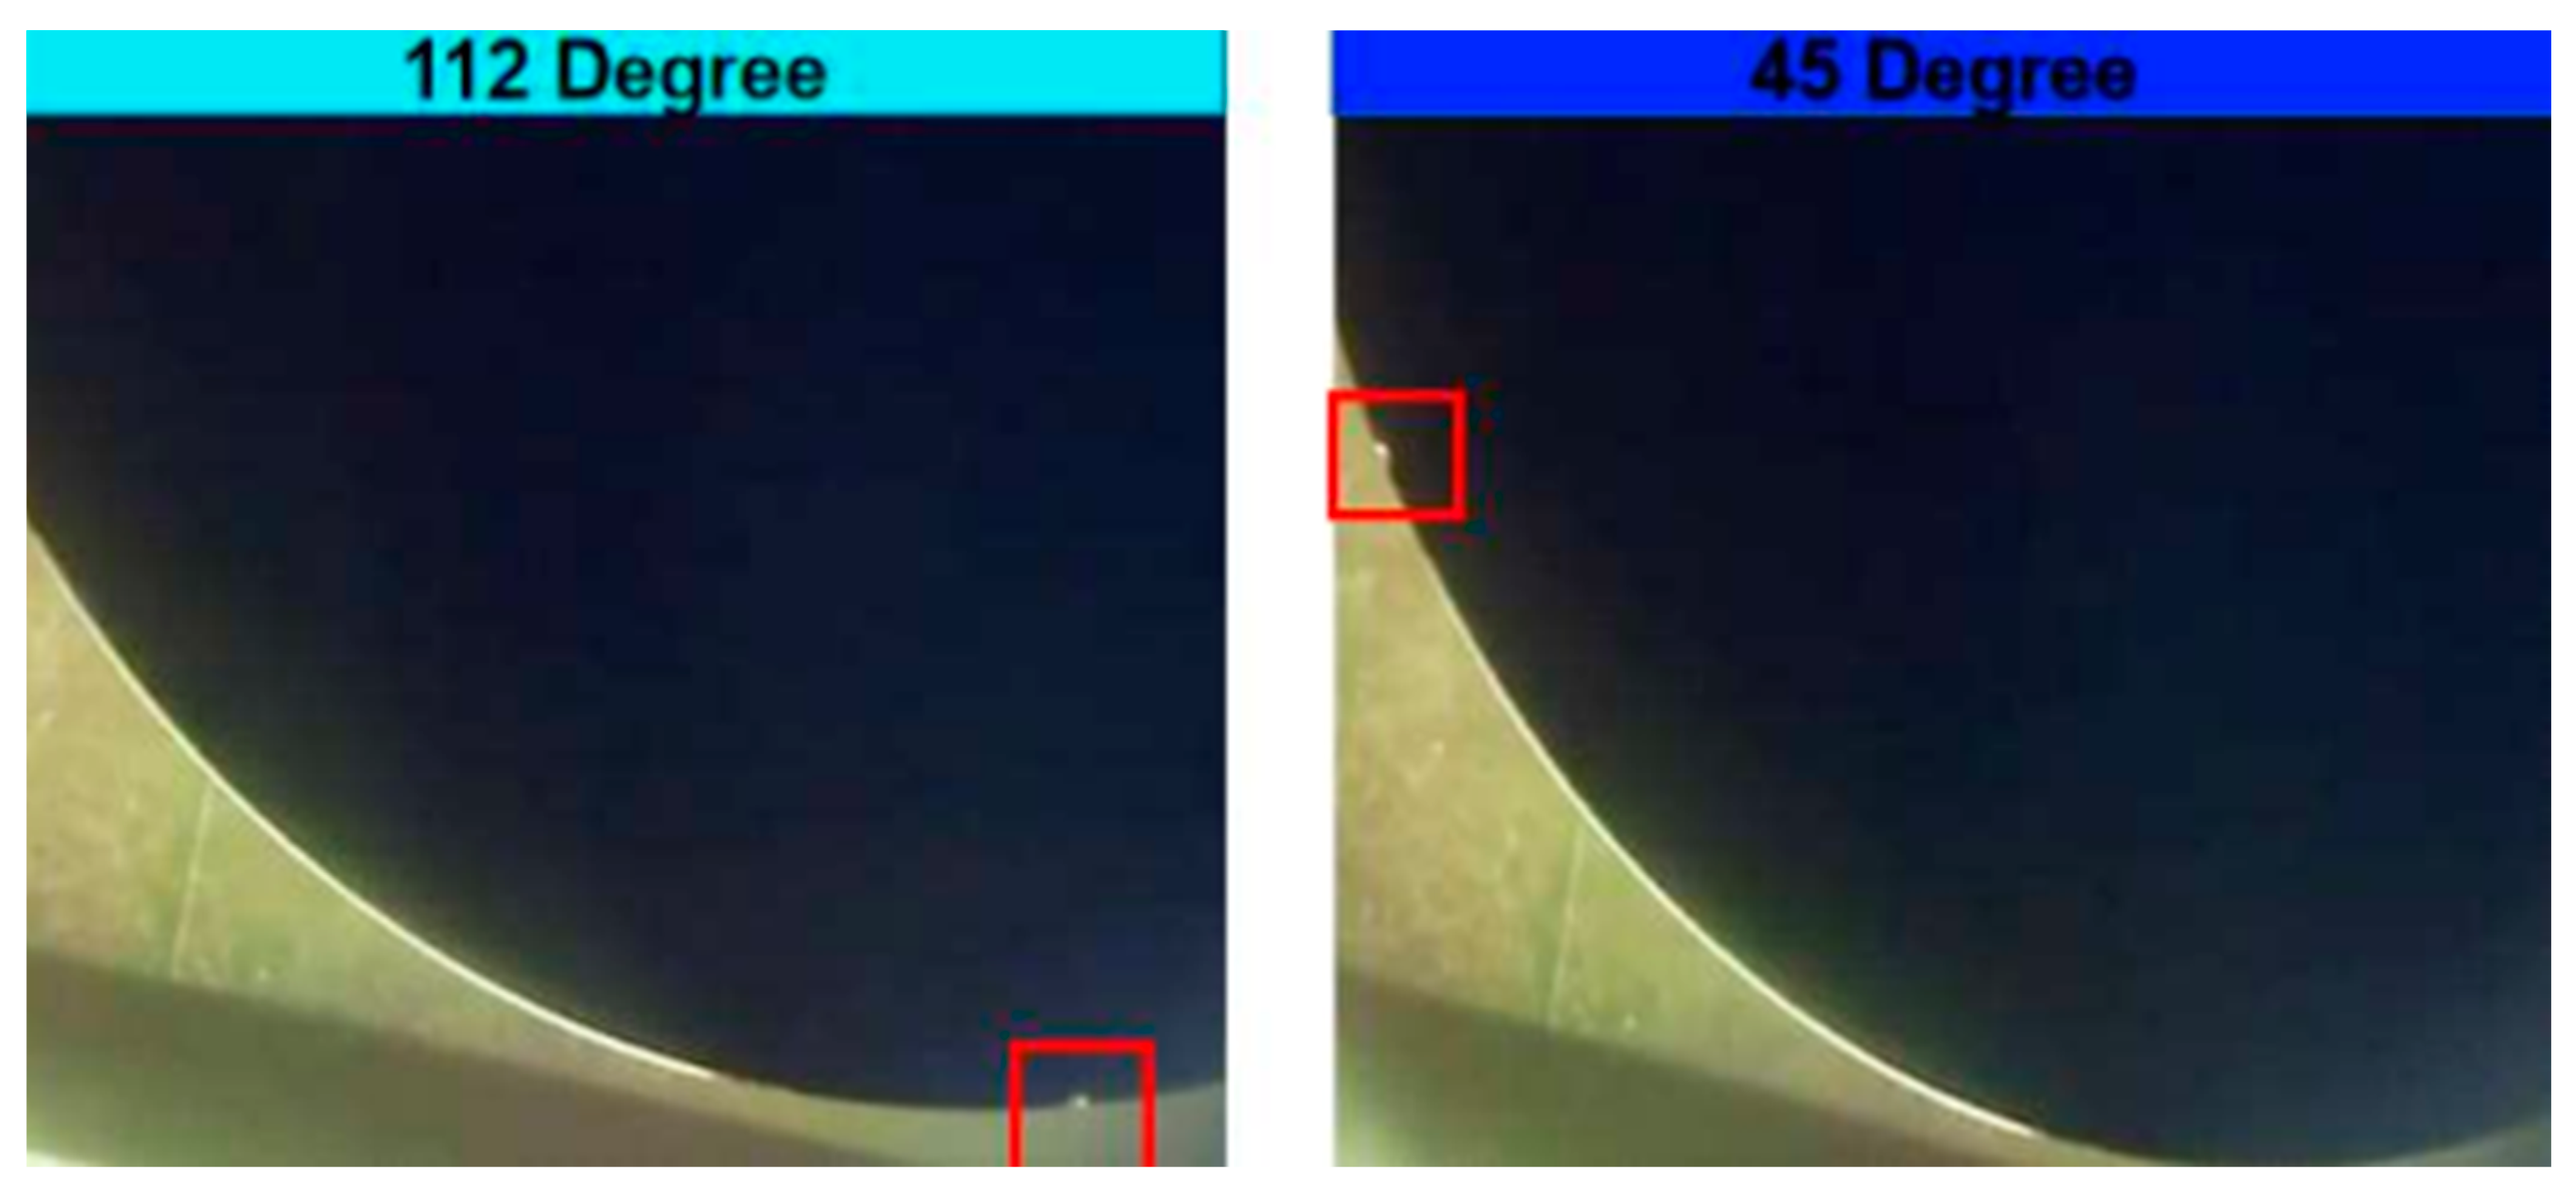
In the experiment, a 5 megapixels (MP) USB camera and F1.8, 5–100 mm lens were used, installed on a five-axis mobile and stable camera module frame, to collect wafer inspection images. All data were collected under 3000 K lighting conditions. During the inspection process, three types of wafer images were collected as training datasets, including 45-degree wafer notch photos, 112-degree wafer notch photos, and photos without a wafer notch. Among them, the images without a wafer notch are further subdivided into six types: wafer images during 112-degree inspection, wafer images during 45-degree inspection, bottom plate images without wafers, images of platform movement when placing the next wafer, and images of wafer conversion processes with a notch at different angles. When shooting, the distance between the camera and the wafer was fixed at 900 mm.

2.2.1. Misidentification (False Detection)

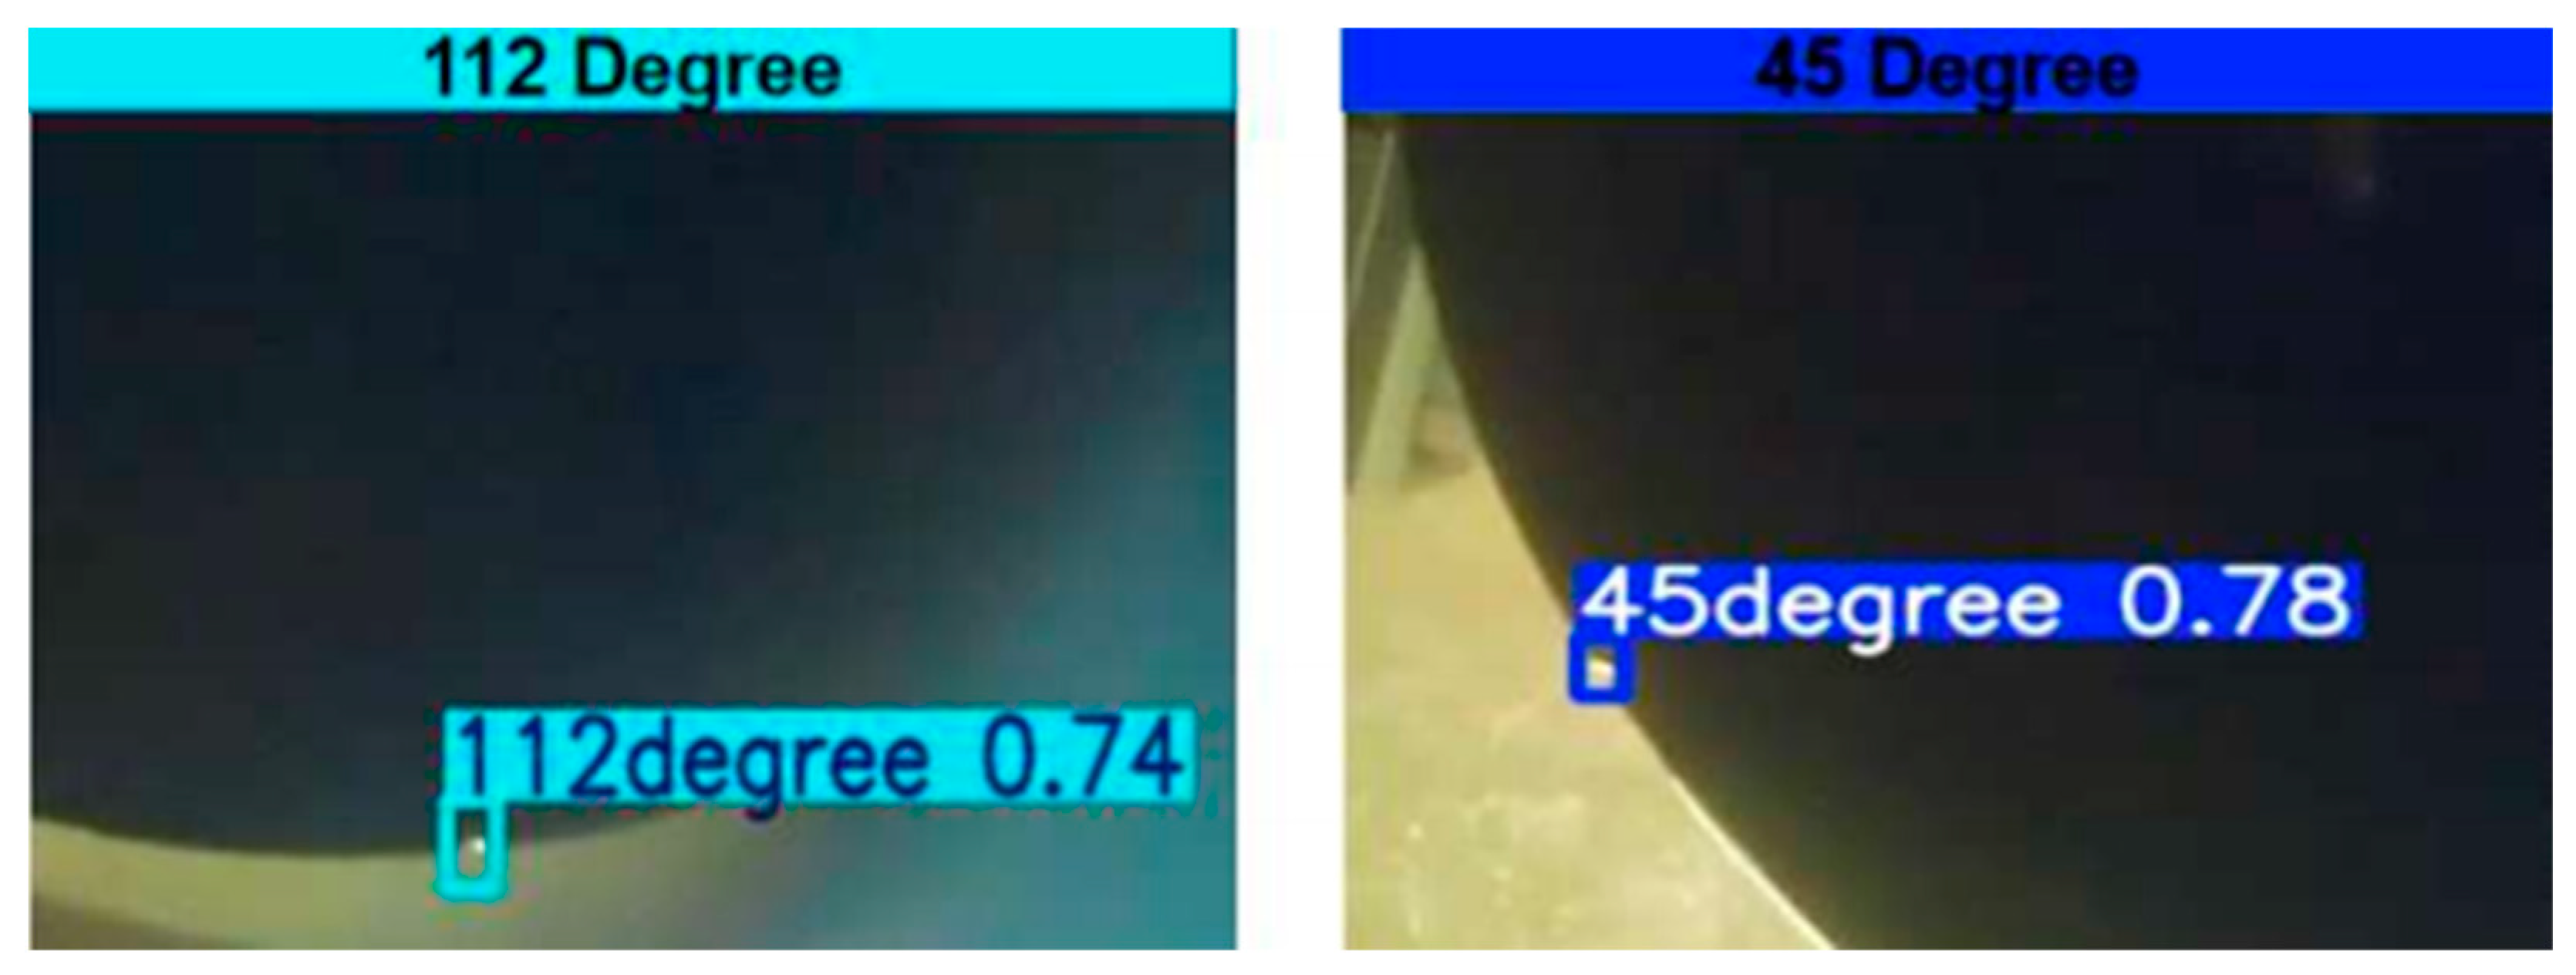
During the wafer notch detection process, certain locations in Figure 2 were misjudged by the model due to their shapes resembling notches, adversely impacting the actual production inspection results. To address this issue, all images from the wafer inspection process were classified and sorted during the wafer notch detection process, as shown in Figure 3, with particular emphasis on those without notches, which were deliberately left unannotated. In this way, the model can automatically learn the features of images without notches during training, thereby ignoring these areas during detection, effectively reducing the occurrence of misjudgment problems.

2.2.2. Class Imbalance

The experiment assumes that the number of data samples in each category is the same. On this basis, a basic experimental dataset for wafer notch detection was constructed. The training set contained 80 photos at a 45-degree angle and 80 photos at a 112-degree angle, and the validation set contains 20 photos at a 45-degree angle and 20 photos at a 112-degree angle. Photos without wafer notches were introduced, photos with wafer notches were used as positive samples, and photos without wafer notches were used as negative samples. In our experiment, the positive class included both 45° and 112° wafer notch images, which were treated as a unified detection target. The negative class included various non-notch wafer and background images captured under the same inspection conditions. Experiments with different positive and negative sample ratios (1:0, 1:1, 1:2, 1:4, 1:8, 1:16) were conducted (as shown in Table 1). The optimal positive and negative sample ratio was determined by comparing the experimental results, effectively solving the problems of misjudgment and category imbalance.

2.2.3. New Dataset Construction

This paper proposes a new dataset training method. In previous dataset construction, due to the complexity of the detection task, such as the fact that the distance between the object and the camera cannot be determined, the angle of the object may be from the front or the side, resulting in changes in the shape of the detection; furthermore, the background environment is very complex, and there may be scenes that have never been seen. In order to enhance the robustness of the model, we usually use different datasets for training and verification. However, in wafer notch detection, the distance between the camera and the wafer is fixed, the detection environment remains unchanged, and the appearance of the wafer notch at 45 and 112 degrees does not change. Therefore, this paper attempts to use the same dataset as the training set and validation set and verifies the feasibility of this dataset training model by comparing the experimental results.

2.3. Improved YOLOv8 Model

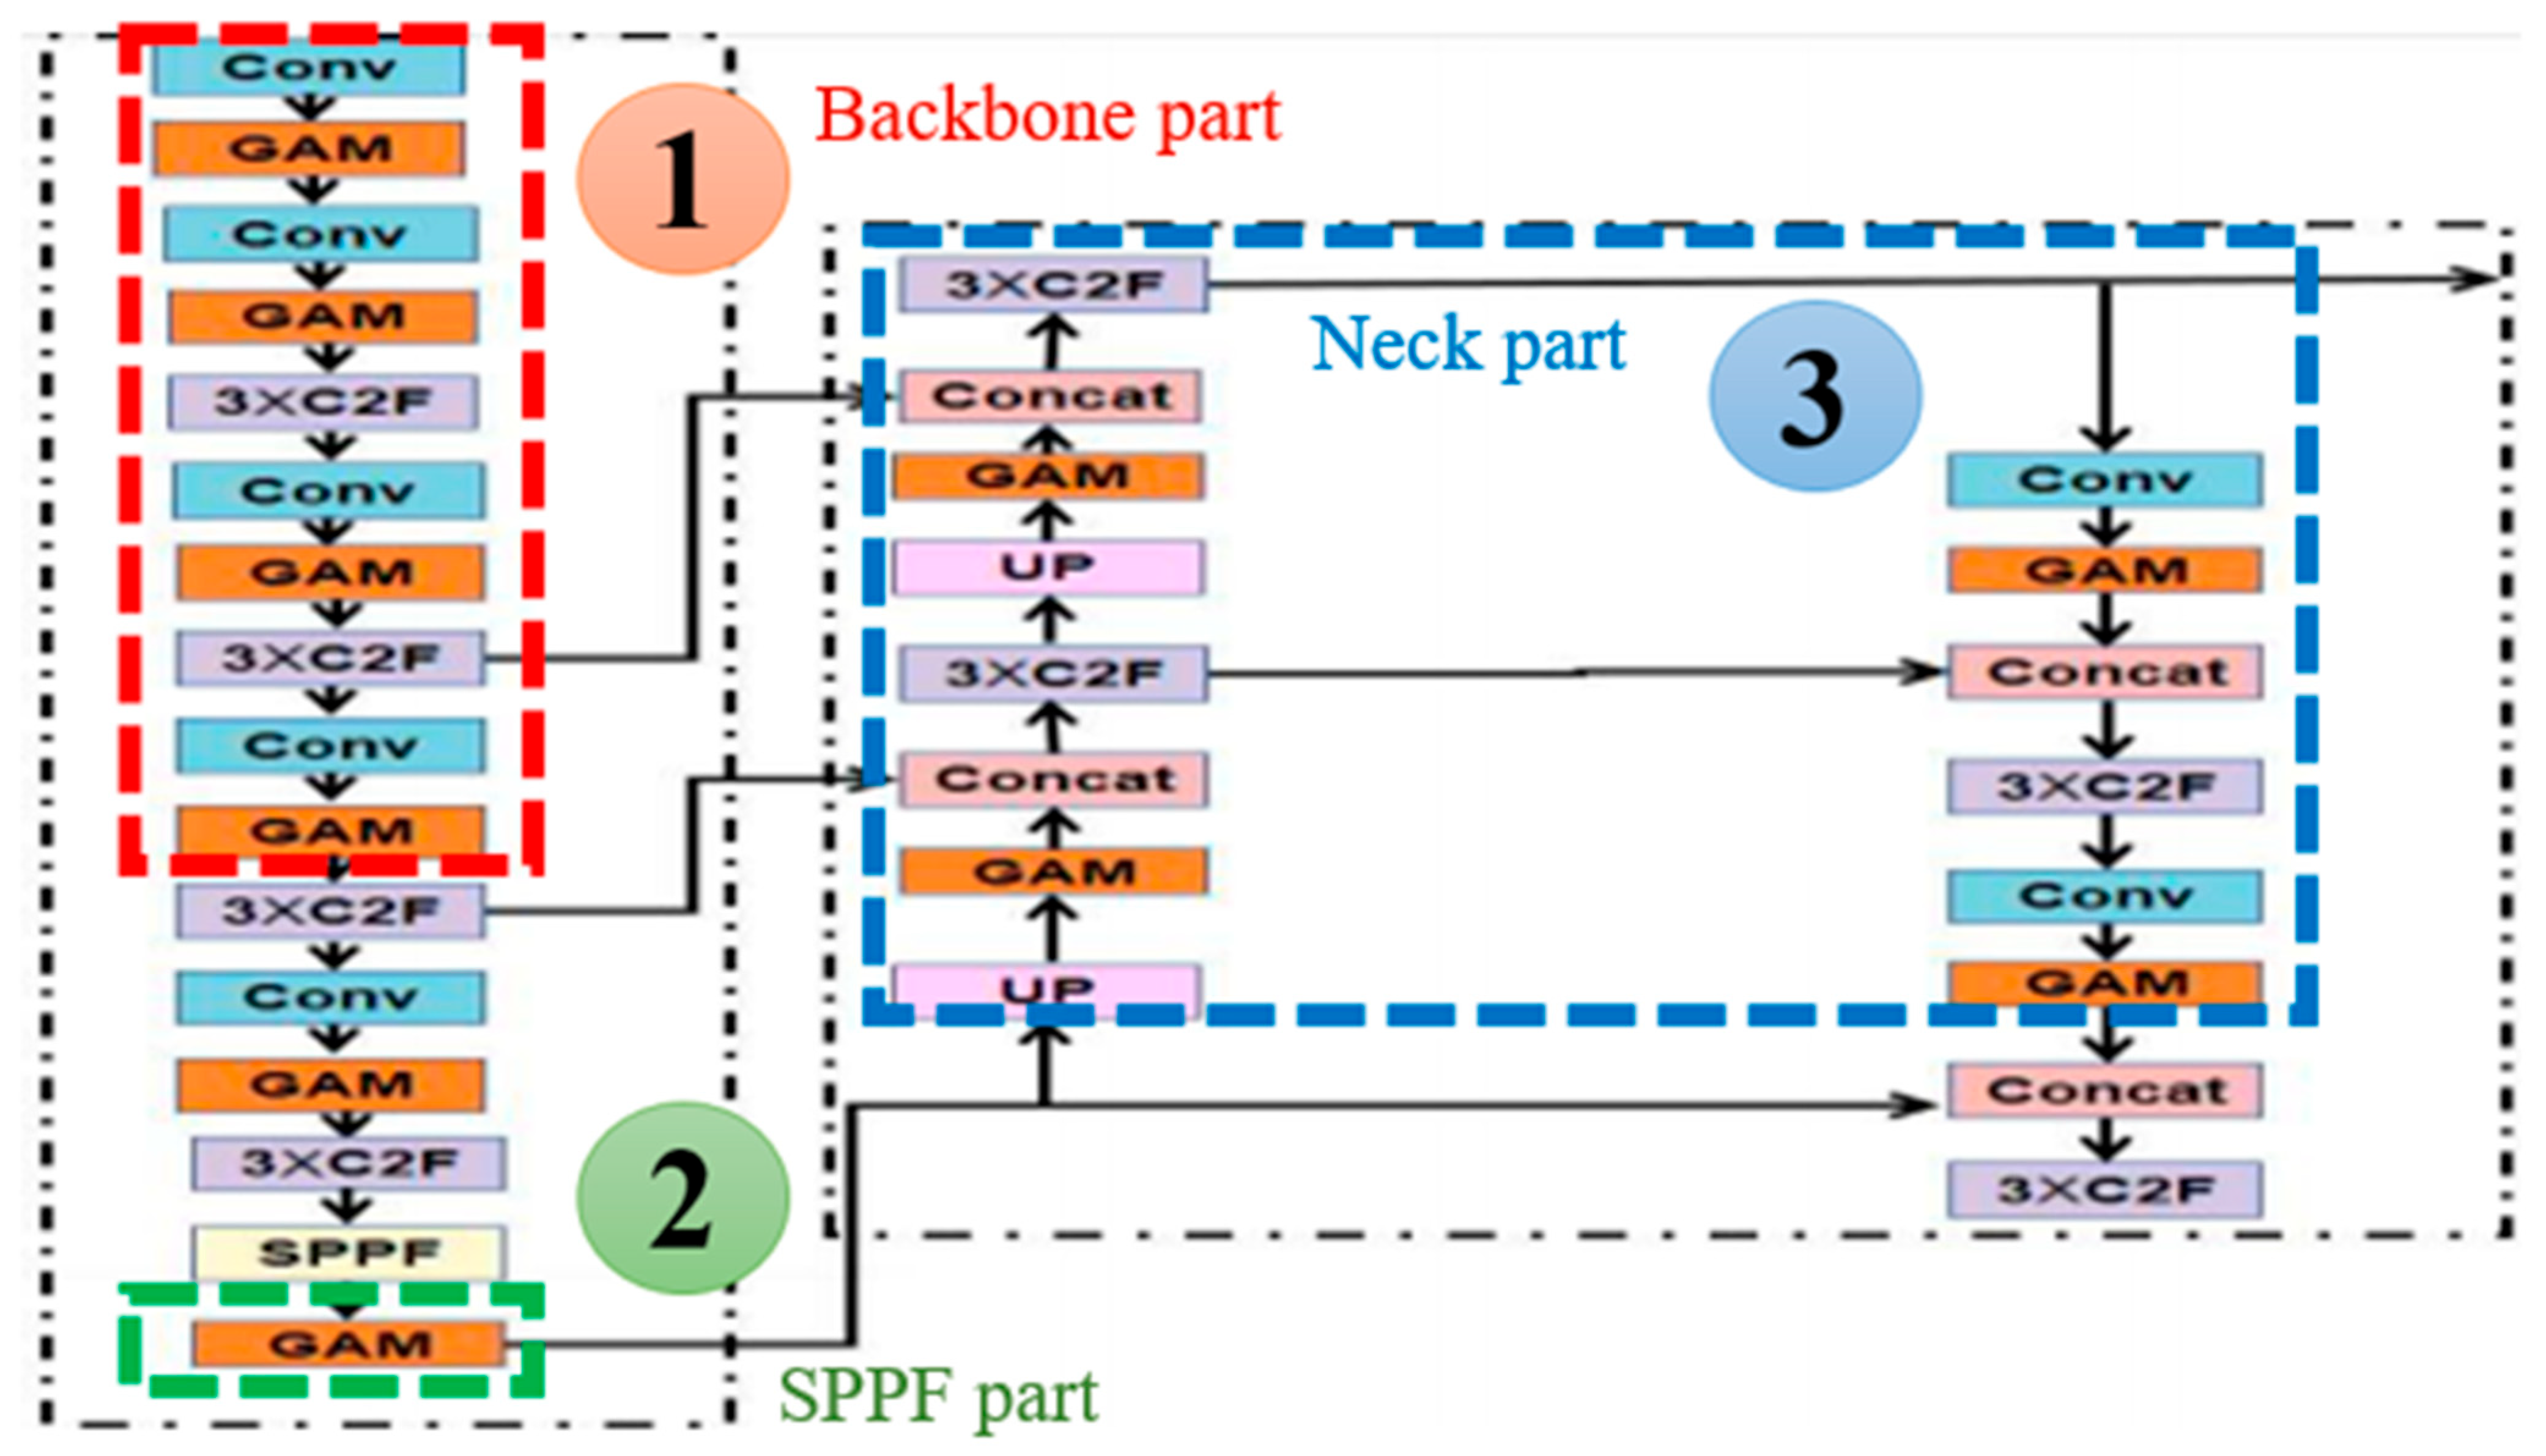
This paper proposes an improved object detection model for real-time monitoring of wafer notches in Figure 4. In terms of improving detection accuracy, combining attention mechanisms is a common method. By adding an attention mechanism and filtering to find the channels with the greatest correlation, the features extracted from the channels with high correlation are mainly learned [10]. Because they have fewer parameters and higher performance, the accuracy of the model can be improved. After experimenting with various attention mechanisms, this study selected the excellent GAM to be integrated into the original YOLOv8 model. The integration of the GAM reduces the computational complexity and improves the accuracy of YOLOv8 in detecting wafer notches. In terms of detection heads, we introduced two additional detection heads to handle objects of different scales so that the detection of small objects is more accurate. The specific changes are shown in Figure 4, which is significantly different from Figure 1. All improvements are marked by the red dotted boxes.

2.3.1. Detection Head

In convolutional neural networks, the feature maps extracted by convolutional layers with different parameters contain different target information. The feature maps generated by deep convolutional layers have higher resolution and mainly retain position information but lack semantic information, while the feature maps generated by shallow convolutional layers are just the opposite, containing more semantic information but with lower resolution. Therefore, in order to better integrate these different levels of information, we improved the detection head and proposed two models.
Model 1 (as shown in Figure 5) adds a small detection head to the detection head part to improve the ability to detect details. Model 2 (as shown in Figure 6) adds a C2F (cross stage partial layer) after the first convolutional layer of the backbone and adds two detections heads to the head part to better integrate small-size features. This improvement enables the model to show stronger capabilities in wafer notch detection, especially in the extraction and recognition of small-size features.

2.3.2. Global Attention Mechanism

In daily life, all kinds of information are received every moment, and the most representative information can be always identified from the input. Attention is a complex cognitive function, with its most important feature being the ability to use limited energy to select and prioritize significant parts of the received information. For instance, when reading a paper, the title is typically the first element to draw attention; when observing a person, the face is often noticed first. Similarly, when a specific area of a scene frequently contains the object of interest, attention naturally shifts to that area in similar future scenarios, focusing more on the useful parts. This process allows humans to efficiently extract high-value information from an overwhelming amount of data using limited processing resources. The attention mechanism significantly enhances the efficiency and accuracy of perceptual information processing.
Upon comparison with other attention mechanisms, this paper chooses the GAM as an attention mechanism. The GAM is a mechanism that reduces information reduction and amplifies the interactive features of global dimensions. Overall, the attention mechanisms of the GAM and the CBAM are similar. Both use the channel attention mechanism and the spatial attention mechanism. The difference lies in the processing methods of channel attention and spatial attention.
The channel attention submodule uses 3D permutation to retain 3D information, and then it uses two layers of multilayer perceptron (MLP) to amplify the channel–spatial dependencies across dimensions. MLP is an encoder–decoder structure with a reduction ratio of r, which is the same as the block attention module (BAM). The channel attention submodule is shown in Figure 7. In the spatial attention submodule (Figure 8), in order to focus on spatial information, the GAM uses two convolutional layers for spatial information fusion, and the reduction ratio r is the same as the channel attention submodule, which is the same as BAM. At the same time, maximum pooling will reduce the amount of information and produce negative contributions. These remove the pooling to further preserve the feature map.
After choosing to use the GAM, we tried adding it in four different locations. The first option is to add the GAM after all convolutional layers in the backbone part (Figure 9➀) and select the features extracted by each convolution layer through the global module to strengthen important features. The second is to add the GAM after the spatial pyramid pooling-fast (SPPF) module of the backbone (Figure 9➁) and extract key feature information through the GAM module before the features enter the neck. The third is to introduce the GAM before the concept operation of the neck part (Figure 9➂) to further extract useful information to ensure that the effectiveness of the features can be improved before data fusion so that the fused features are more accurate. The fourth one is to combine the positions added in the previous three and finally add the GAM to all of them (Figure 9).

2.3.3. Global Attention Mechanism Improvements

In this study, we improved the spatial attention module of the GAM. Figure 10 shows that the 7 × 7 convolution kernel in the spatial attention of the original GAM module was replaced with three consecutive 3 × 3 convolution kernels. The purpose of this modification is to reduce the number of parameters and computation of the model while enhancing the model’s nonlinear expression ability and fine-grained feature extraction ability.
Small convolution kernels can play a better role in small object detection. When a small convolution kernel (such as 3 × 3) slides into the image, each operation only covers a smaller area, so it can capture the details in the image more carefully. This is particularly useful for detecting small objects, because the features of small objects are usually subtler and require higher spatial resolution for accurate positioning and identification. Compared with large convolution kernels, small convolution kernels have fewer parameters and lower computation. This not only improves the training efficiency and inference speed of the model but also reduces the risk of overfitting, making the model more robust in small object detection tasks.

3. Experimental Settings

3.1. Experimental Environment

The experimental platform and hyper parameters used in this study are shown in Table 2. Consistent hyper parameters were applied throughout the training process for all experiments.

Network Architecture Enhancements

To improve computational efficiency while maintaining an equivalent receptive field, the original 7 × 7 convolution kernel in the GAM module was replaced with three sequential 3 × 3 convolutional layers. Each 3 × 3 layer incrementally increases the receptive field from 3 × 3 to 5 × 5 and 7 × 7, thereby matching the effective field size of the original kernel. In terms of model complexity, this modification reduces the parameter count from 49C2 to 27C2 and FLOPs from 49HWC2 to 27HWC2, achieving an approximate 45% reduction while preserving spatial representation capacity in Table 3.

3.2. Evaluation Metrics

In object detection tasks, recall (R), precision (P), MAP50, and MAP50–95 are usually used for evaluation [23]. Recall can detect the missed detection rate, precision can detect the false detection rate, and mean average precision (MAP) can detect the reliability.

3.2.1. Recall

“Recall,” also known as “sensitivity,” “hit rate,” or “true positive rate (TPR),” is a crucial performance metric in binary classification tasks. It measures the proportion of true positive predictions made by a model among all actual positive instances. The formula for calculating recall is as follows:
Recall = True   positives True   positives + False   negatives × 100 %
True positives (TP) refer to instances where the model correctly predicts positive cases, such as accurately detecting defects, as illustrated in Figure 11. Also, false negatives (FN) refer to instances where the model incorrectly predicts positive cases as negative, resulting in missed detections, as illustrated in Figure 12.

3.2.2. Precision

Precision is a crucial performance metric in binary classification tasks, including crystalline wafer defect detection. It measures the accuracy of positive predictions made by a model, specifically the proportion of correctly predicted positive instances among all instances predicted as positive. The formula for calculating precision is as follows:
Precision = True   positives True   positives + False   positives × 100 %
The number of false positives presents the number of actual negative instances that the model incorrectly classified as positive (false positives), in this case, the number of images in which a wafer notch was falsely detected among images without a wafer notch (as shown in Figure 2).

3.2.3. Mean Average Precision

In this study, we used MAP as the main evaluation indicator of model performance. MAP is a standard evaluation indicator commonly used in object detection tasks that can effectively measure the accuracy and recall of the model in multi-category detection tasks [26]. This indicator calculates the average precision (AP) of each category and averages the AP of all categories to reflect the overall detection effect of the model.
MAP = 1 N i = 1 N A P i
where N is the number of categories and APi is the average precision of the ith category. In this paper, MAP (0.5) and MAP (0.5–0.95) as evaluation criteria are used. MAP (0.5) represents the MAP when the IoU threshold is set to 0.5. The MAP (0.5–0.95) represents the average MAP between IoU thresholds from 0.5 to 0.95 (with a step size of 0.05).

4. Results and Discussion

4.1. Class Imbalance and Misidentification Problems

Using YOLOv8 for wafer notch detection revealed a common issue where the model mistakenly detected notches in areas without them. To address the class imbalance and false detection problems, datasets with varying positive and negative sample ratios were used for training. By adding photos without notches, the aim is to reduce false detections and explore the impact of the positive and negative sample ratio on the detection effect.
The experimental results are shown in Table 4. The results show that when we introduce photos without notches, precision is improved by approximately 36%. In addition, the experiment also found that when the model is trained by a dataset with a positive–negative sample ratio of 1:2, the MAP is at least 0.01 higher than the model with other ratios. As the positive–negative sample ratio increases, YOLOv8 will tend to learn images without notches, resulting in a decrease in precision. Therefore, during the training process, the positive–negative sample ratio should not deviate too much. A large positive sample ratio may lead to an increase in false detections, while a large negative sample ratio will lead to a decrease in MAP.

4.2. Comparison with YOLOv8

In order to explore the effect of optimal detection head design, this study conducted multiple sets of comparative experiments to fully evaluate the necessity of each detection head. According to the classification of the model, we classified the different types of detection heads (Table 5). The experimental results are shown in Table 6. When we add a new cons layer after the first layer of the backbone and add two detection heads in the head part (model F), the design shows significant improvements in accuracy and MAP50–95. This model offers approximately 2 to 5% performance improvements compared to other detector head designs. Therefore, this improved detection head design can better capture the basic information in the input features, thereby improving the overall performance of the model.

4.3. Comparison of Results from New and Old Datasets

In other YOLOv8 model training, due to the complex background and changing detection environment, it is usually necessary to use different images for training the training set and the detection set. However, in wafer notch detection, because the angle, background, light, and distance between the wafer and the camera remain constant, we tried to train it by combining the training set and the validation set. According to the results in Table 7, MAP50–95 increased by approximately 28%. This method can effectively improve the detection performance of the model, proving that under certain circumstances, merging the training set and the validation set can significantly improve the detection effect.

4.4. Different Attention Mechanisms

This section explores the role of different attention mechanisms in the wafer notch detection task and their effects at various network positions. Different attention mechanisms were introduced after each convolutional layer (conv layer) in the backbone for comparison, aiming to further extract important information through the attention mechanism. Five attention mechanisms were selected, GAM, CBAM, SimAM (simple attention module), ECAM, and SEAN, and we conducted comparative experiments to assess their performance.
From the results in Table 8, it can be seen that the GAM attention mechanism is 1 to 2% higher than other attention mechanisms in MAP, and, compared with the original model without adding the attention mechanism, the MAP is improved by 6%. These results show that the GAM module has better performance in wafer notch detection and can effectively improve the detection accuracy of the model.

4.5. Adding the GAM at Different Positions

This subsection explores the impact of adding the GAM to different locations on model performance. Comparative experiments were conducted with four options: the first was to add the GAM after each convolutional layer in the backbone part; the second was to add the GAM after the SPPF module; and the third was to add the GAM after each convolutional layer in the backbone part. The GAM was added after a concat module to further extract global information after fusion of each feature; the fourth method was to add the GAM at all of the above locations at the same time.
Experimental results show that adding the GAM after the SPPF module is the most effective option, with MAP improving by 1 to 4% compared to other positions, as shown in Table 9. Although adding the attention mechanism after the concat module also achieved significant results, considering the model’s complexity and performance improvement, this article finally adopted the design of adding the GAM after the SPPF module.

4.6. Improved Global Attention Mechanism

It can be seen from the experimental results that the position of the detection head has a certain impact on the model’s performance. After the improvement, MAP 0.5 at 0.95% increased significantly, reaching 98.7% (Table 10), indicating that the rear detection head can more comprehensively handle detection tasks under different IoU thresholds. Therefore, in wafer notch inspection, the rear-mounted inspection head can provide stronger generalization ability and inspection accuracy, and it is more suitable for dealing with complex inspection scenarios.

4.7. Comparison with Other Models

In order to compare the efficiency of the improved algorithm proposed in this article, we selected the classic YOLOv5, YOLOv7, and the faster YOLOv10 for comparative experiments. The experiments were performed using the same equipment, datasets, and data augmentation methods while maintaining equal proportions between training and test sets. The experiment was conducted over 300 iterations, and the best results were selected for testing purposes. Comparative data for precision, recall, MAP, frame rate, and model size are shown in Table 11.
As shown in Table 11, the algorithm proposed in this paper exhibits significant MAP50-95, reaching 98.7% under the same experimental settings. However, in comparison, YOLOv5 (56.5%), YOLOv7 (57.8%), YOLOv10 (57.2%), and standard YOLOv8 (59.8%) showed significant differences in MAP. The improved model proposed in this paper performs better in terms of detection accuracy. In other words, the proposed algorithm not only meets the requirements of real-time detection but also improves detection accuracy, reduces model volume, and has higher versatility and practical value. On the one hand, the optimization focus of this study is on the overall robustness of the model at different IoU thresholds, which is mainly reflected in the improvement of the comprehensive mAP50–95 metric. On the other hand, the dataset itself already has a high detection rate at low IoU thresholds, leaving limited room for further improvement. The optimization of the model’s structure mainly improves localization accuracy and multi-scale object adaptability.

5. Conclusions

This paper studies the detection of wafer notches and proposes an improved algorithm based on YOLOv8 for wafer notch detection. By introducing different images, eliminating the problems of misidentification and class imbalance, and fusing the detection head and the GAM module with multiple features, the feature extraction and representation capabilities of the algorithm are enhanced.
In the ablation experiment, the MAP of the improved YOLOv8 wafer notch network increased by 36%, and the MAP was 98.7% during the test. Compared with the original YOLOv8 network, the improved model showed considerable improvement in all basic indicators. In addition, the improved model showed more reliable performance in wafer notch detection, with a lower misidentification rate and missed detection rate and higher MAP compared with other models.
When training a model to detect a single target, considering the detection distance, and when the shape and background of the detected object will not change, the detection set and the training set can be trained with the same dataset, which will greatly improve the performance of the model.
Experimental results show that the used model exhibits significant application potential in wafer notch inspection. This shows that the Yolov8 model can provide an efficient and accurate solution for wafer inspection, especially in automated production lines. This ability of the model can significantly improve the accuracy and efficiency of inspection.

Author Contributions

Conceptualization, Y.Z., J.J.H. and S.J.M.; methodology, Y.Z. and H.J.S.; software, Y.Z. and H.J.S.; validation, J.J.H. and S.J.M.; formal analysis, Y.Z. and S.J.M.; investigation, Y.Z.; data curation, Y.Z. and H.J.S.; resources, J.J.H. and S.J.M.; funding acquisition, S.J.M.; writing—original draft preparation, Y.Z.; writing—review and editing, S.J.M.; visualization, Y.Z. and H.J.S.; supervision, S.J.M. All authors have read and agreed to the published version of the manuscript.

Funding

This work was supported by the Korea Institute of Energy Technology and Evaluation Planning (KETEP) in 2024 under the research project (Project No.: 2410010247; No. RS-2024-00420215).

Data Availability Statement

Further inquiries can be directed to the corresponding author.

Conflicts of Interest

The authors declare no conflicts of interest.

References

  1. Purwaningsih, L.; Konsulke, P.; Tonhaeuser, M.; Jantoljak, H. Defect Inspection Wafer Notch Orientation and Defect Detection Dependency. In Proceedings of the International Symposium for Testing and Failure Analysis, Phoenix, AZ, USA, 31 October–4 November 2021; ASM International: Almere, The Netherlands, 2021; Volume 84215, pp. 403–405. [Google Scholar]
  2. Chaudhry, A.; Kumar, M.J. Controlling Short-Channel Effects in Deep-Submicron SOI MOSFETs for Improved Reliability: A Review. IEEE Trans. Device Mater. Reliab. 2004, 4, 99–109. [Google Scholar] [CrossRef]
  3. Qu, D.; Qiao, S.; Rong, W.; Song, Y.; Zhao, Y. Design and Experiment of the Wafer Pre-Alignment System. In Proceedings of the 2007 International Conference on Mechatronics and Automation, Kumamoto, Japan, 8–10 May 2007; pp. 1483–1488. [Google Scholar]
  4. Jiang, H.; Learned-Miller, E. Face Detection with the Faster R-CNN. In Proceedings of the 2017 12th IEEE International Conference on Automatic Face & Gesture Recognition (FG 2017), Washington, DC, USA, 30 May–3 June 2017; pp. 650–657. [Google Scholar]
  5. Cai, Z.; Vasconcelos, N. Cascade R-Cnn: Delving into High Quality Object Detection. In Proceedings of the IEEE Conference on Computer Vision and Pattern Recognition, Salt Lake City, UT, USA, 18–22 June 2018; pp. 6154–6162. [Google Scholar]
  6. Wang, H.; Sim, H.J.; Hwang, J.J.; Kwak, S.J.; Moon, S.J. YOLOv4-Based Semiconductor Wafer Notch Detection Using Deep Learning and Image Enhancement Algorithms. Int. J. Precis. Eng. Manuf. 2024, 25, 1909–1916. [Google Scholar] [CrossRef]
  7. Li, Y.; Ren, F. Light-Weight Retinanet for Object Detection. arXiv 2019, arXiv:1905.10011. [Google Scholar]
  8. Putra, M.H.; Yussof, Z.M.; Lim, K.C.; Salim, S.I. Convolutional Neural Network for Person and Car Detection Using Yolo Framework. J. Telecommun. Electron. Comput. Eng. 2018, 10, 67–71. [Google Scholar]
  9. Alruwaili, M.; Siddiqi, M.H.; Atta, M.N.; Arif, M. Deep Learning and Ubiquitous Systems for Disabled People Detection Using YOLO Models. Comput. Hum. Behav. 2024, 154, 108150. [Google Scholar] [CrossRef]
  10. Gomes, H.; Redinha, N.; Lavado, N.; Mendes, M. Counting People and Bicycles in Real Time Using YOLO on Jetson Nano. Energies 2022, 15, 8816. [Google Scholar] [CrossRef]
  11. Khobdeh, S.B.; Yamaghani, M.R.; Sareshkeh, S.K. Basketball Action Recognition Based on the Combination of YOLO and a Deep Fuzzy LSTM Network. J. Supercomput. 2024, 80, 3528–3553. [Google Scholar] [CrossRef]
  12. Bochkovskiy, A.; Wang, C.-Y.; Liao, H.-Y.M. Yolov4: Optimal Speed and Accuracy of Object Detection. arXiv 2020, arXiv:2004.10934. [Google Scholar] [CrossRef]
  13. Ali, S.G.; Wang, X.; Li, P.; Li, H.; Yang, P.; Jung, Y.; Qin, J.; Kim, J.; Sheng, B. Egdnet: An Efficient Glomerular Detection Network for Multiple Anomalous Pathological Feature in Glomerulonephritis. Vis. Comput. 2024, 41, 2817–2834. [Google Scholar] [CrossRef]
  14. Pan, W.; Yang, Z. A Lightweight Enhanced YOLOv8 Algorithm for Detecting Small Objects in UAV Aerial Photography. Vis. Comput. 2025, 41, 7123–7139. [Google Scholar] [CrossRef]
  15. Shugui, Z.; Shuli, C.; Zhan, Z. Recognition Algorithm for Crop Leaf Diseases and Pests Based on Improved YOLOv8. J. Chin. Agric. Mech. 2024, 45, 255. [Google Scholar]
  16. Junos, M.H.; Mohd Khairuddin, A.S.; Thannirmalai, S.; Dahari, M. An Optimized YOLO-based Object Detection Model for Crop Harvesting System. IET Image Process 2021, 15, 2112–2125. [Google Scholar] [CrossRef]
  17. Prinzi, F.; Insalaco, M.; Orlando, A.; Gaglio, S.; Vitabile, S. A Yolo-Based Model for Breast Cancer Detection in Mammograms. Cogn. Comput. 2024, 16, 107–120. [Google Scholar] [CrossRef]
  18. Wang, G.; Chen, Y.; An, P.; Hong, H.; Hu, J.; Huang, T. UAV-YOLOv8: A Small-Object-Detection Model Based on Improved YOLOv8 for UAV Aerial Photography Scenarios. Sensors 2023, 23, 7190. [Google Scholar] [CrossRef] [PubMed]
  19. Woo, S.; Park, J.; Lee, J.-Y.; Kweon, I.S. Cbam: Convolutional Block Attention Module. In Proceedings of the European Conference on Computer Vision (ECCV), Munich, Germany, 8–14 September 2018; pp. 3–19. [Google Scholar]
  20. Liu, Y.; Shao, Z.; Hoffmann, N. Global Attention Mechanism: Retain Information to Enhance Channel-Spatial Interactions. arXiv 2021, arXiv:2112.05561. [Google Scholar] [CrossRef]
  21. Wang, Q.; Wu, B.; Zhu, P.; Li, P.; Zuo, W.; Hu, Q. ECA-Net: Efficient Channel Attention for Deep Convolutional Neural Networks. In Proceedings of the IEEE/CVF Conference on Computer Vision and Pattern Recognition, Seattle, WA, USA, 14–19 June 2020; pp. 11534–11542. [Google Scholar]
  22. Hu, J.; Shen, L.; Sun, G. Squeeze-and-Excitation Networks. In Proceedings of the IEEE Conference on Computer Vision and Pattern Recognition, Salt Lake City, UT, USA, 18–22 June 2018; pp. 7132–7141. [Google Scholar]
  23. Wang, H.; Fan, Y.; Wang, Z.; Jiao, L.; Schiele, B. Parameter-Free Spatial Attention Network for Person Re-Identification. arXiv 2018, arXiv:1811.12150. [Google Scholar] [CrossRef]
  24. Lou, H.; Duan, X.; Guo, J.; Liu, H.; Gu, J.; Bi, L.; Chen, H. DC-YOLOv8: Small-Size Object Detection Algorithm Based on Camera Sensor. Electronics 2023, 12, 2323. [Google Scholar] [CrossRef]
  25. Zhang, Y.; Guo, Z.; Wu, J.; Tian, Y.; Tang, H.; Guo, X. Real-Time Vehicle Detection Based on Improved Yolo V5. Sustainability 2022, 14, 12274. [Google Scholar] [CrossRef]
  26. Everingham, M.; Van Gool, L.; Williams, C.K.I.; Winn, J.; Zisserman, A. The Pascal Visual Object Classes (Voc) Challenge. Int. J. Comput. Vis. 2010, 88, 303–338. [Google Scholar] [CrossRef]
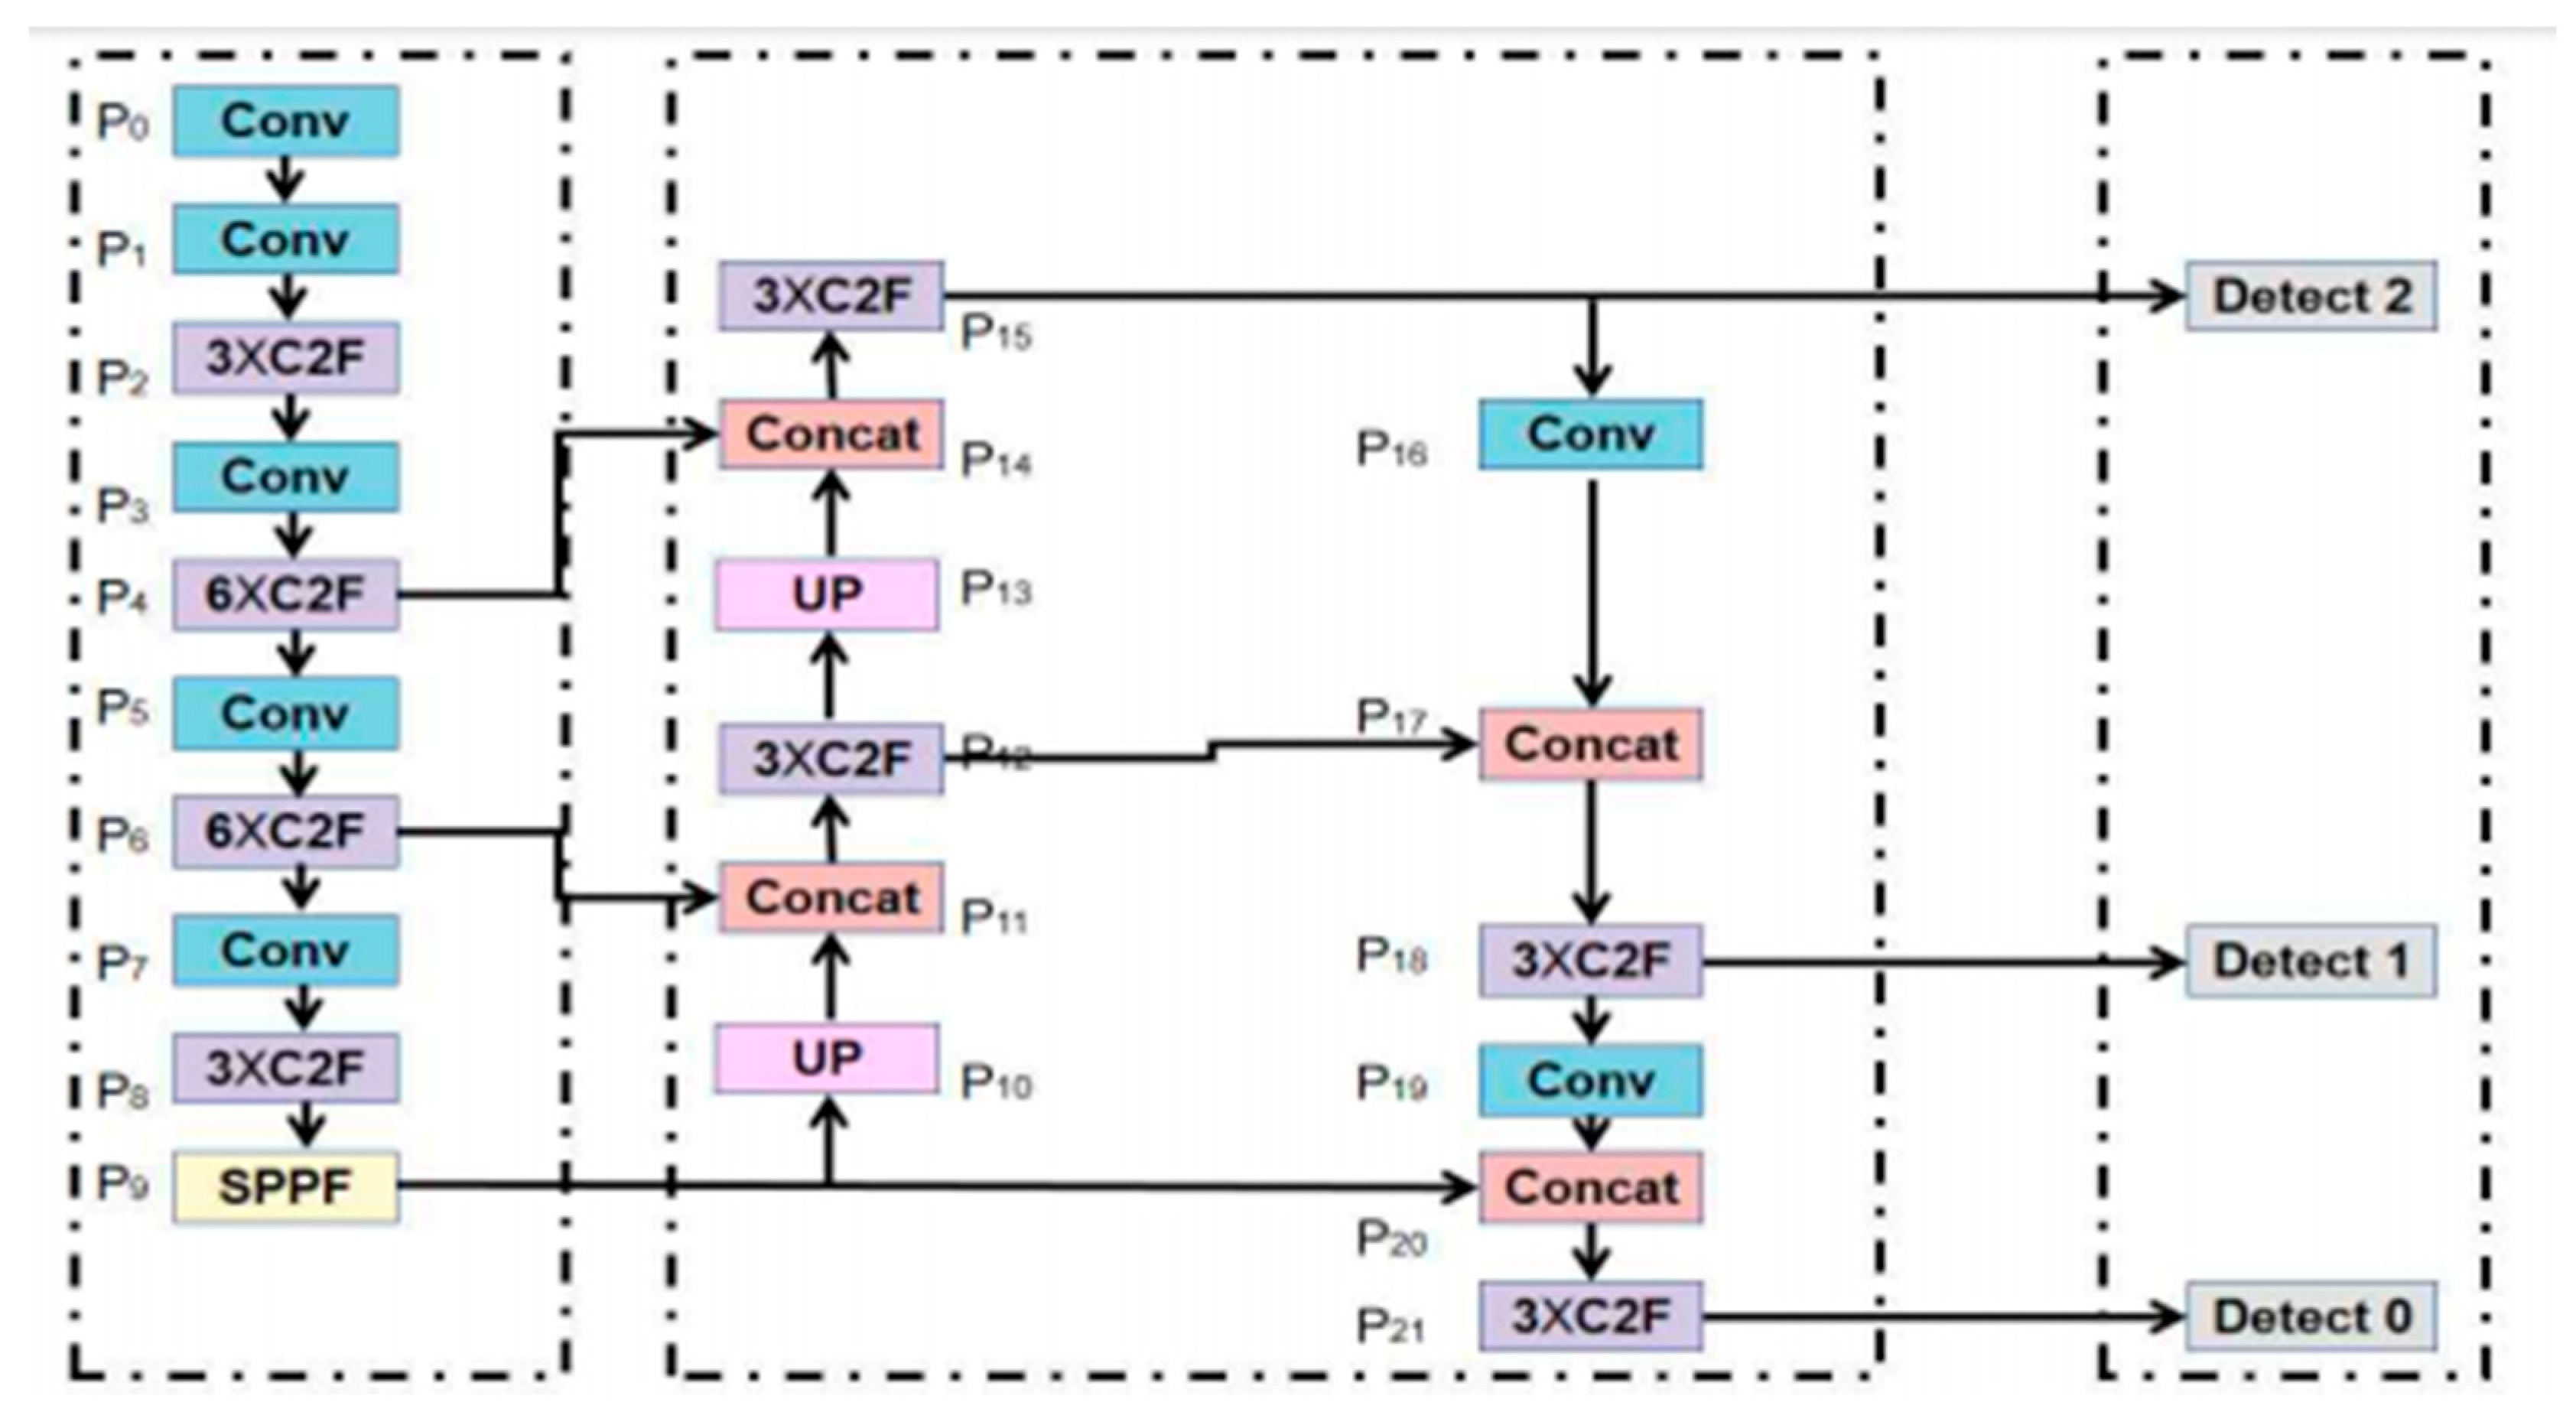
Figure 1. Standard YOLOv8 model structure diagram.
Applsci 15 09122 g001
Figure 2. False detection.
Applsci 15 09122 g002
Figure 3. Wafer photo classification: (a) wafer with 45-degree notch, (b) wafer with 112-degree notch, (c) photos of the wafer during the 112-degree inspection process, (d) photos of the wafer during the 45-degree inspection process, (e) photos of the machine moving when the next wafer is placed, (f) photos of the bottom plate without the wafer, (g,h) photos of the conversion process between wafers with notches at different angles.
Applsci 15 09122 g003
Figure 4. Improved YOLOv8 model structure diagram.
Applsci 15 09122 g004
Figure 5. YOLOv8 model with four detection heads.
Applsci 15 09122 g005
Figure 6. Yolov8 model with five detection heads.
Applsci 15 09122 g006
Figure 7. Channel attention submodule of GAM.
Applsci 15 09122 g007
Figure 8. Spatial attention submodule of GAM.
Applsci 15 09122 g008
Figure 9. GAM adding position.
Applsci 15 09122 g009
Figure 10. Improved spatial attention of the GAM.
Applsci 15 09122 g010
Figure 11. True positives.
Applsci 15 09122 g011
Figure 12. False negatives.
Applsci 15 09122 g012
Table 1. Composition of training and validation datasets under different positive-to-negative sample ratios.
Positive:
Negative
Train Set
(45°)
Train Set
(112°)
Train Set
(Negative)
Val Set
(45°)
Val Set
(112°)
Val Set
(Negative)
1:08080020200
1:18080160202040
1:28080320202080
1:480806402020160
1:8808012802020320
1:16808025602020640
Table 2. Experimental environment.
Hyper ParametersValue
Leering0.01
Image size640
Batch64
Epoch2000
Patience2000
Central processing unit (CPU)i5-11400F
Graphics processing unit (GPU)4070
Deep learning frameworkPorch
Table 3. Parameter and FLOP comparison in the GAM module.
Kernel ConfigurationReceptive FieldParametersFLOPs
7 × 7 Conv7 × 749 C 2 49 H W C 2
3 × 3 × 3 Conv Stack7 × 7 (equivalent)27 C 2 27 H W C 2
Table 4. Model training results under different positive and negative sample ratios.
Positive and
Negative Sample Ratio
PrecisionRecallMAP50MAP0.5–0.95
1:060.510.9860.597
1:196.40.9980.9850.581
1:20.96710.9850.595
1:40.9660.9980.9870.587
1:80.9650.9990.9760.564
1:160.9640.9980.9850.544
Table 5. Classification of various types of detection heads.
NamesABCDEF
P1P1P1P1 P1
P2P2P2 P2P2
P3P3 P3P3P3
P4 P4P4P4P4
P5P5P5P5P5
NamesGHIJK
P1P1P1P1
P2P2 P2P2
P3 P3P3P3
P4P4P4P4
Table 6. Detection capabilities of different types of detection heads.
NamesPrecisionRecallMAPMAP50–95
A0.96810.9910.582
B0.96910.9930.586
C0.9710.990.601
D0.9710.9910.568
E0.9710.9950.571
F0.97110.9870.608
G0.9610.9910.561
H0.9710.9940.558
I0.9710.990.589
J0000
K0.97110.990.581
Table 7. Comparison of results from new and old datasets.
NamesRecallPrecisionMAP50MAP50–95
Old data10.9710.9850.608
New data0.9920.9910.9940.88
Table 8. The results of different attention mechanisms.
NamesPrecisionRecallMAP50MAP50–95
GAM0.99610.9950.937
CBAM0.99510.9950.933
SimAM0.99410.9950.882
ECAM0.99410.9950.889
SEAN0.99410.9950.911
Table 9. Adding GAM at different positions.
PositionPrecisionRecallMAP50MAP50–95
Backbone0.99710.9950.937
SPPF0.99710.9950.953
Cancat0.99510.9950.95
All0.99310.9950.911
Table 10. Improved GAM results.
NamesPrecisionRecallMAP50MAP50–95
Old0.99410.9880.953
Module
New0.99510.9860.987
Module
Table 11. Comparison with other models.
Names of ModelsPrecision (%)Recall (%)MAP50 (%)MAP50–95 (%)
Yolov596.81009956.5
Yolov797.110098.257.8
Yolov898.810098.559.8
Yolov1099.610099.857.2
Our-Yolov899.510098.698.7
Disclaimer/Publisher’s Note: The statements, opinions and data contained in all publications are solely those of the individual author(s) and contributor(s) and not of MDPI and/or the editor(s). MDPI and/or the editor(s) disclaim responsibility for any injury to people or property resulting from any ideas, methods, instructions or products referred to in the content.