Article

Spectroscopy of ITO Films in Optical and Terahertz Spectral Ranges

by
Vladimir V. Bassarab
1,*,
Vadim A. Shalygin
1,
Alexey A. Shakhmin
2 and
Grigory I. Kropotov
2
1
Institute of Electronics and Telecommunications, Peter the Great St. Petersburg Polytechnic University, St. Petersburg 195251, Russia
2
TYDEX, LLC, St. Petersburg 194292, Russia
*
Author to whom correspondence should be addressed.
Appl. Sci. 2025, 15(16), 9121; https://doi.org/10.3390/app15169121
Submission received: 5 June 2025 / Revised: 30 July 2025 / Accepted: 15 August 2025 / Published: 19 August 2025
(This article belongs to the Section Optics and Lasers)

Abstract

In the present study, the reflection and transmission of radiation in submicron indium tin oxide (ITO) films deposited on a borosilicate glass substrate are experimentally investigated for a wide spectral range, including ultraviolet, visible, infrared and terahertz regions. Theoretical modeling of the spectra is performed using the transfer matrix method. The interaction of electromagnetic radiation with ITO is considered in the framework of the Drude model. The simulated spectra are in good agreement with the experimental ones. New non-destructive methods for determining the ITO film parameters (sheet resistivity, thickness, electron concentration and mobility) have been developed. They are based on a fitting procedure for reflectivity and/or transmittance spectra.

1. Introduction

The extensive use of optoelectronic devices, such as video cameras, laser pointers, laser rangefinders, etc., for some applications in the modern world encounters difficulties in their operation. One of the problems is the necessity to operate these devices under conditions of exposure to electromagnetic radiation different from basic, standard radiation. Mainly, the wavelengths of electromagnetic interference lie in the microwave range from 1 mm to 1 m (frequencies from 300 GHz to 300 MHz). One solution is to shield the sensitive elements of optoelectronic devices from interference by means of frequency filters. At the same time, such filters should not interfere with the operation of the device in the normal wavelength range. Currently, there are many variants of filters that can cope with this task, for example, metal meshes [1], thin films of conducting materials [2,3,4,5], various types of porous materials [6] and polymer composites [7]. Among them, thin conducting films of oxide semiconductors seem to be the most promising [8].
The most studied and widely used oxide semiconductor is indium tin oxide (ITO) [9]. It is mainly used as transparent electrodes for solar cells [10] and liquid crystal displays [11]. However, it is also applied as a material for transparent integrated circuits [12,13,14] and frequency filters [15,16,17]. In the present paper, we focus on the use of ITO films as a frequency filter. Such a filter should transmit electromagnetic radiation in the visible and near IR ranges and, at the same time, screen radiation, with wavelengths exceeding the long-wave limit of the operating range of an optoelectronic device.
It was experimentally demonstrated that ITO films with a sheet resistivity of 15–20 Ohm/sq can provide a shielding effectiveness of about 22 dB in the frequency range of 3–23 GHz, with at least 70% transmittance in the visible range [18]. Thicker ITO films with a sheet resistivity of ~4 Ohm/sq demonstrated in the same spectral region a shielding effectiveness of about 26 dB, with about 80% transmittance in the visible range [19]. Using a combination of transparent ITO film with absorbing glass, it is possible to reach a shielding effectiveness of 65 dB in the frequency range of 12–18 GHz [20].
Other transparent conducting oxides demonstrate lower performance in microwave shielding effectiveness and optical transparency. Thin films of aluminum zinc oxide have high transmittance in the optical range (~85% at a film thickness of ~300 nm with an electron concentration of 6·1020 cm−3), but they provide a relatively low shielding effectiveness: ~13 dB at a frequency of 1 GHz [21,22]. Thin films of fluorine zinc oxide show even lower shielding effectiveness (~10 dB) [22]. The electromagnetic interference shielding effect of multilayered thin films in which indium–zinc oxide (IZO) thin films and Ag thin films were deposited alternately was studied in [23]. These multilayer structures provided high shielding effectiveness (~40 dB), but they had insufficient visible light transmittance (~65%).
Thus, ITO is the most suitable material for the development of transparent conducting coatings for optoelectronic devices in order to protect them from electromagnetic interference in the microwave range. Optical studies of ITO films are often limited to the visible and near IR spectral ranges, where optoelectronic devices operate (see [24,25,26,27,28,29,30] and references therein). There are relatively few studies on the properties of ITO films in the THz and microwave ranges (see [5,31] and references therein).
The aim of this work was to study the interaction of ITO films with electromagnetic radiation in the optical and terahertz spectral ranges (wavelengths from 0.2 μm to 3 mm, frequencies from 1500 to 0.1 THz), as well as to develop non-contact methods for determining the parameters of these films. As a result of the studies, a non-contact method for determining film sheet resistivity was developed, based on the analysis of experimental THz transmission spectra. This method is important because it is the value of the sheet resistivity that determines the efficiency of suppressing electromagnetic interference in the microwave range. In addition, a method has been developed for the separate determination of three parameters of ITO films (film thickness, electron concentration and electron mobility) that determine the value of sheet resistivity. The method is based on a two-stage fitting procedure for the reflectivity and transmittance spectra in the optical spectral range.

2. Samples and Experimental Technique

To develop and test a non-contact method for determining the parameters of ITO films, six types of samples with ITO films of different thicknesses were prepared on a K108 borosilicate glass substrate. One set of different samples was intended for optical studies only. Witness samples were used for scanning electron microscope (SEM) studies and electrical measurements.
Round plane-parallel glass plates with a thickness of d 2 = 3 mm and a diameter of 50 mm were used as a substrate. To form thin ITO films, the method of cathode sputtering of an indium and tin oxide target (In2O3:SnO2 = 90:10) in magnetron discharge plasma was used. The target size was 820 mm × 80 mm. Sputtering was carried out in a reactive mode in an Ar–O2 gas mixture (300 and 15 cm3, respectively). The substrate was located parallel to the target and moved reciprocatingly along the target width at a speed of 10 mm/s. The substrate temperature was 300 °C. At a magnetron power of 5 kW, the film growth rate was 7.14 nm per pass. The resulting film thickness depended on the number of passes.
In each sample, the central region with a diameter of 10 mm was examined. Within this region, small fluctuations in the ITO film thickness, as well as in the sheet resistivity, were observed. To locally determine the film thickness, the chipped structures in the central part of the witness samples were examined using the SEM technique with a resolution of about 5 nm. Up to 10 SEM images with a field of view of 800–2800 nm were analyzed for each sample. The average film thicknesses and average thickness fluctuations for the set of SEM images are given in Table 1.
To locally determine the sheet resistivity of the ITO film, we performed measurements using the four-probe method. A probe head with four co-linear probes equally spaced with a separation of 1 mm was used. We carried out measurements at direct current (DC) in 9 points across the tested region of each sample. In samples 1–5, the average value of DC sheet resistivity fluctuations relative to the average value for 9 examined points exceeded the measurement error of the device. In sample 6 (the thickest ITO film), no fluctuations exceeding the measurement error of 0.02 Ohm/sq were observed. The measurement results are presented in Table 1.
With an increase in the film thickness from 76 to 457 nm, its DC sheet resistivity monotonically decreased from ~29 to ~4 Ohm/sq (see Table 1), while the bulk resistivity ρ changed less than twofold (within the range from 1.53 × 10⁻⁴ to 2.37 × 10⁻⁴ Ohm × cm).
In this work, we experimentally investigated the transmission and reflection spectra of all six samples in the optical spectral range from ultraviolet to far infrared (wavelengths from 0.2 to 335 μm). For this purpose, we used PhotonRT (EssentOptics, Vilnius, Lithuania) and Vertex 70 (Bruker, Ettlingen, Germany) spectrometers; their working spectral ranges are listed in Table 2. The measurement methods are described in [32,33], and the diameter of the optical probing region in the ITO film plane was about 10 mm.
Measurements in the ultraviolet and visible spectral ranges were carried out using a Photon RT dual-beam grating spectrophotometer. A halogen or deuterium lamp was used as a radiation source. The spectrophotometer has two optical channels: the main channel and the reference channel. The reference channel is used to calibrate the main channel signal by wavelength and magnitude. In the visible spectral range, transmission and reflection spectra were recorded with a wavelength resolution of 0.6 nm. Spectra in the ultraviolet range were obtained with a resolution of 0.3 nm.
The infrared studies were carried out using a Vertex 70 Fourier spectrometer. Different radiation sources, beam splitters and detectors were used in different regions of this range, namely, in the near infrared (NIR), mid infrared (MIR) and far infrared (FIR) (for a detailed description, see [32,33]). Transmission measurements were carried out under normal incidence conditions with an angular beam divergence of ~16°. When measuring reflectivity, the incident beam axis formed an angle of 11° relative to the normal to the sample surface, and a gold mirror was used as a standard. Measurements in the NIR and MIR regions were carried out with a spectral resolution of 8 cm−1 (0.24 THz). For measurements in the FIR region, a spectral resolution of 4 cm−1 (0.12 THz) was chosen.
In addition, transmission spectra were measured in the terahertz spectral range (wavelengths from 150 to 3000 μm). These measurements were carried out by time domain spectroscopy (TDS) using a TERA K8 THz-TDS system (Menlo Systems, Martinsried, Germany). The time dependences of two signals were recorded: with and without a sample. Fourier analysis of these dependences in a time window corresponding to a single pass of radiation through the sample allows one to abstract from the Fabry–Pérot interference effect, which leads to oscillations in the transmission of the glass substrate at wavelengths longer than 1000 μm (see [32]). As a result of this procedure, we obtained an experimental single-pass transmittance spectrum with a spectral resolution of 0.2 THz.

3. Transmittance and Reflectivity Spectra: Experimental Results

The results of the study of the samples in the optical spectral range (wavelengths λ = 0.2–400 μm) are shown in Figure 1. The use of K108 glass as a substrate restricts the possibility of analyzing the transmission spectra of ITO films to the spectral range 0.35–4.3 μm, which corresponds to the transparency region of glass in the optical range [32]. However, in this range, features are clearly observed that allow one to determine a number of parameters of ITO films.
Firstly, with an increase in the film thickness, the long-wavelength boundary of the sample’s passband experiences a significant “blue” shift from 2.4 μm to 1.1 μm at a level of 0.5 (see Figure 1a). This shift is primarily associated with the short-wavelength tail of free-electron absorption in the ITO film. With decreasing wavelength, this absorption decreases monotonically [34]; thus, the thicker the film, the smaller the wavelength at which the product of the film thickness and the absorption coefficient, which determines the radiation loss, reaches a given value. Thus, the spectral shape of the transmission curve at λ > 1.1 μm carries information about both the film thickness and the parameters of free electrons in it (their concentration N e and mobility μ ). Detailed physical modeling of the reflectivity and transmittance spectra of the ITO film/K108 glass structures, taking into account reflection at all interfaces and interference in the ITO film, as well as a sharp decrease in the glass transparency in the wavelength region of 1.5–4.3 μm, will be discussed in Section 4 and Section 5.
Secondly, at short wavelengths ( λ < 0.8 μ m), when the free-electron absorption becomes negligible even in the thickest film, the transmission spectra show oscillations, the period of which decreases with increasing film thickness. These oscillations are caused by Fabry–Pérot interference in the transparent film, which means that the transmission spectrum of samples in this region is determined primarily by the film thickness and weakly depends on the parameters of free electrons.
From the point of view of determining the parameters of ITO films, the reflectance spectra are informative both in the transparency band of the substrate and beyond it (see Figure 1b).
For example, for the thickest film (sample #6), a plasma minimum is clearly visible at λ = 1.08 μm, and a sharp plasma reflection edge can be observed at λ > 1.08 μm. Based on the spectral position of the plasma minimum, it is possible to estimate the concentration of free electrons in the film, relying on previously obtained experimental data for ITO films on high-frequency permittivity, ε = 4.00 ± 0.05 [9,19], and the effective mass of electrons, m e = 0.35   m 0 [35]. Using, as a first approximation, the formula for the spectral position of the plasma minimum for a semi-infinite medium is [36]:
λ m i n = 2 π c ω m i n = 2 π c ω p ε 1 ε ,
where
ω p = 4 π N e e 2 ε m e
characterizes the plasma frequency, with e being the electron charge, and sample #6 is characterized by the plasma frequency ω p 1.5 × 10¹⁵ s−1 and the free electron concentration N e = 9.9 × 1020 cm−3. (Here and later, we use the Gaussian system of units in all analytic expressions.) Knowing the electron concentration, film thickness and value of DC sheet resistivity (see Table 1), it is also possible to estimate the mobility of free electrons μ in the film of this sample, using the ratio
ρ s = 1 d 1 e μ N e ,
which gives μ = 35 cm2/(V × s). As will be seen from the following, the approximate value of N e calculated in this way is overestimated by 12% and that of μ is underestimated by 22% compared to the more accurate results obtained by the method developed in this article. The error in determining the electron concentration is due to the fact that strictly speaking, Equation (1) does not work for a film of finite thickness. The calculations, described below in Section 4, show that the position of the plasma minimum in the reflection spectrum of the film is shifted relative to the plasma minimum for a semi-infinite medium. Errors in the measurement of film thickness and sheet resistivity also contribute to the accuracy of mobility determination.
As the ITO film thickness decreases (from sample #6 to sample #1), the steepness of the plasma edge and the long-wavelength reflectivity become smaller (see Figure 1b). In this case, the spectral reflectivity curve in the vicinity of the plasma minimum is additionally distorted due to Fabry–Pérot interference. In thin-film samples (##1–4), a small peak at λ = 10 μm is superimposed on the plasma reflectivity in the ITO film, caused by the excitation of the Si–O vibrational mode in the glass substrate (see [32]).
Like the transmittance spectra, the reflectivity spectra at λ > 1.1 μm carry information about both the ITO film thickness and the parameters of free electrons in it. At wavelengths λ < 0.8 μm, when the absorption by free electrons in ITO films becomes very weak, the observed oscillations in the reflectivity spectra are primarily determined by the film thickness.
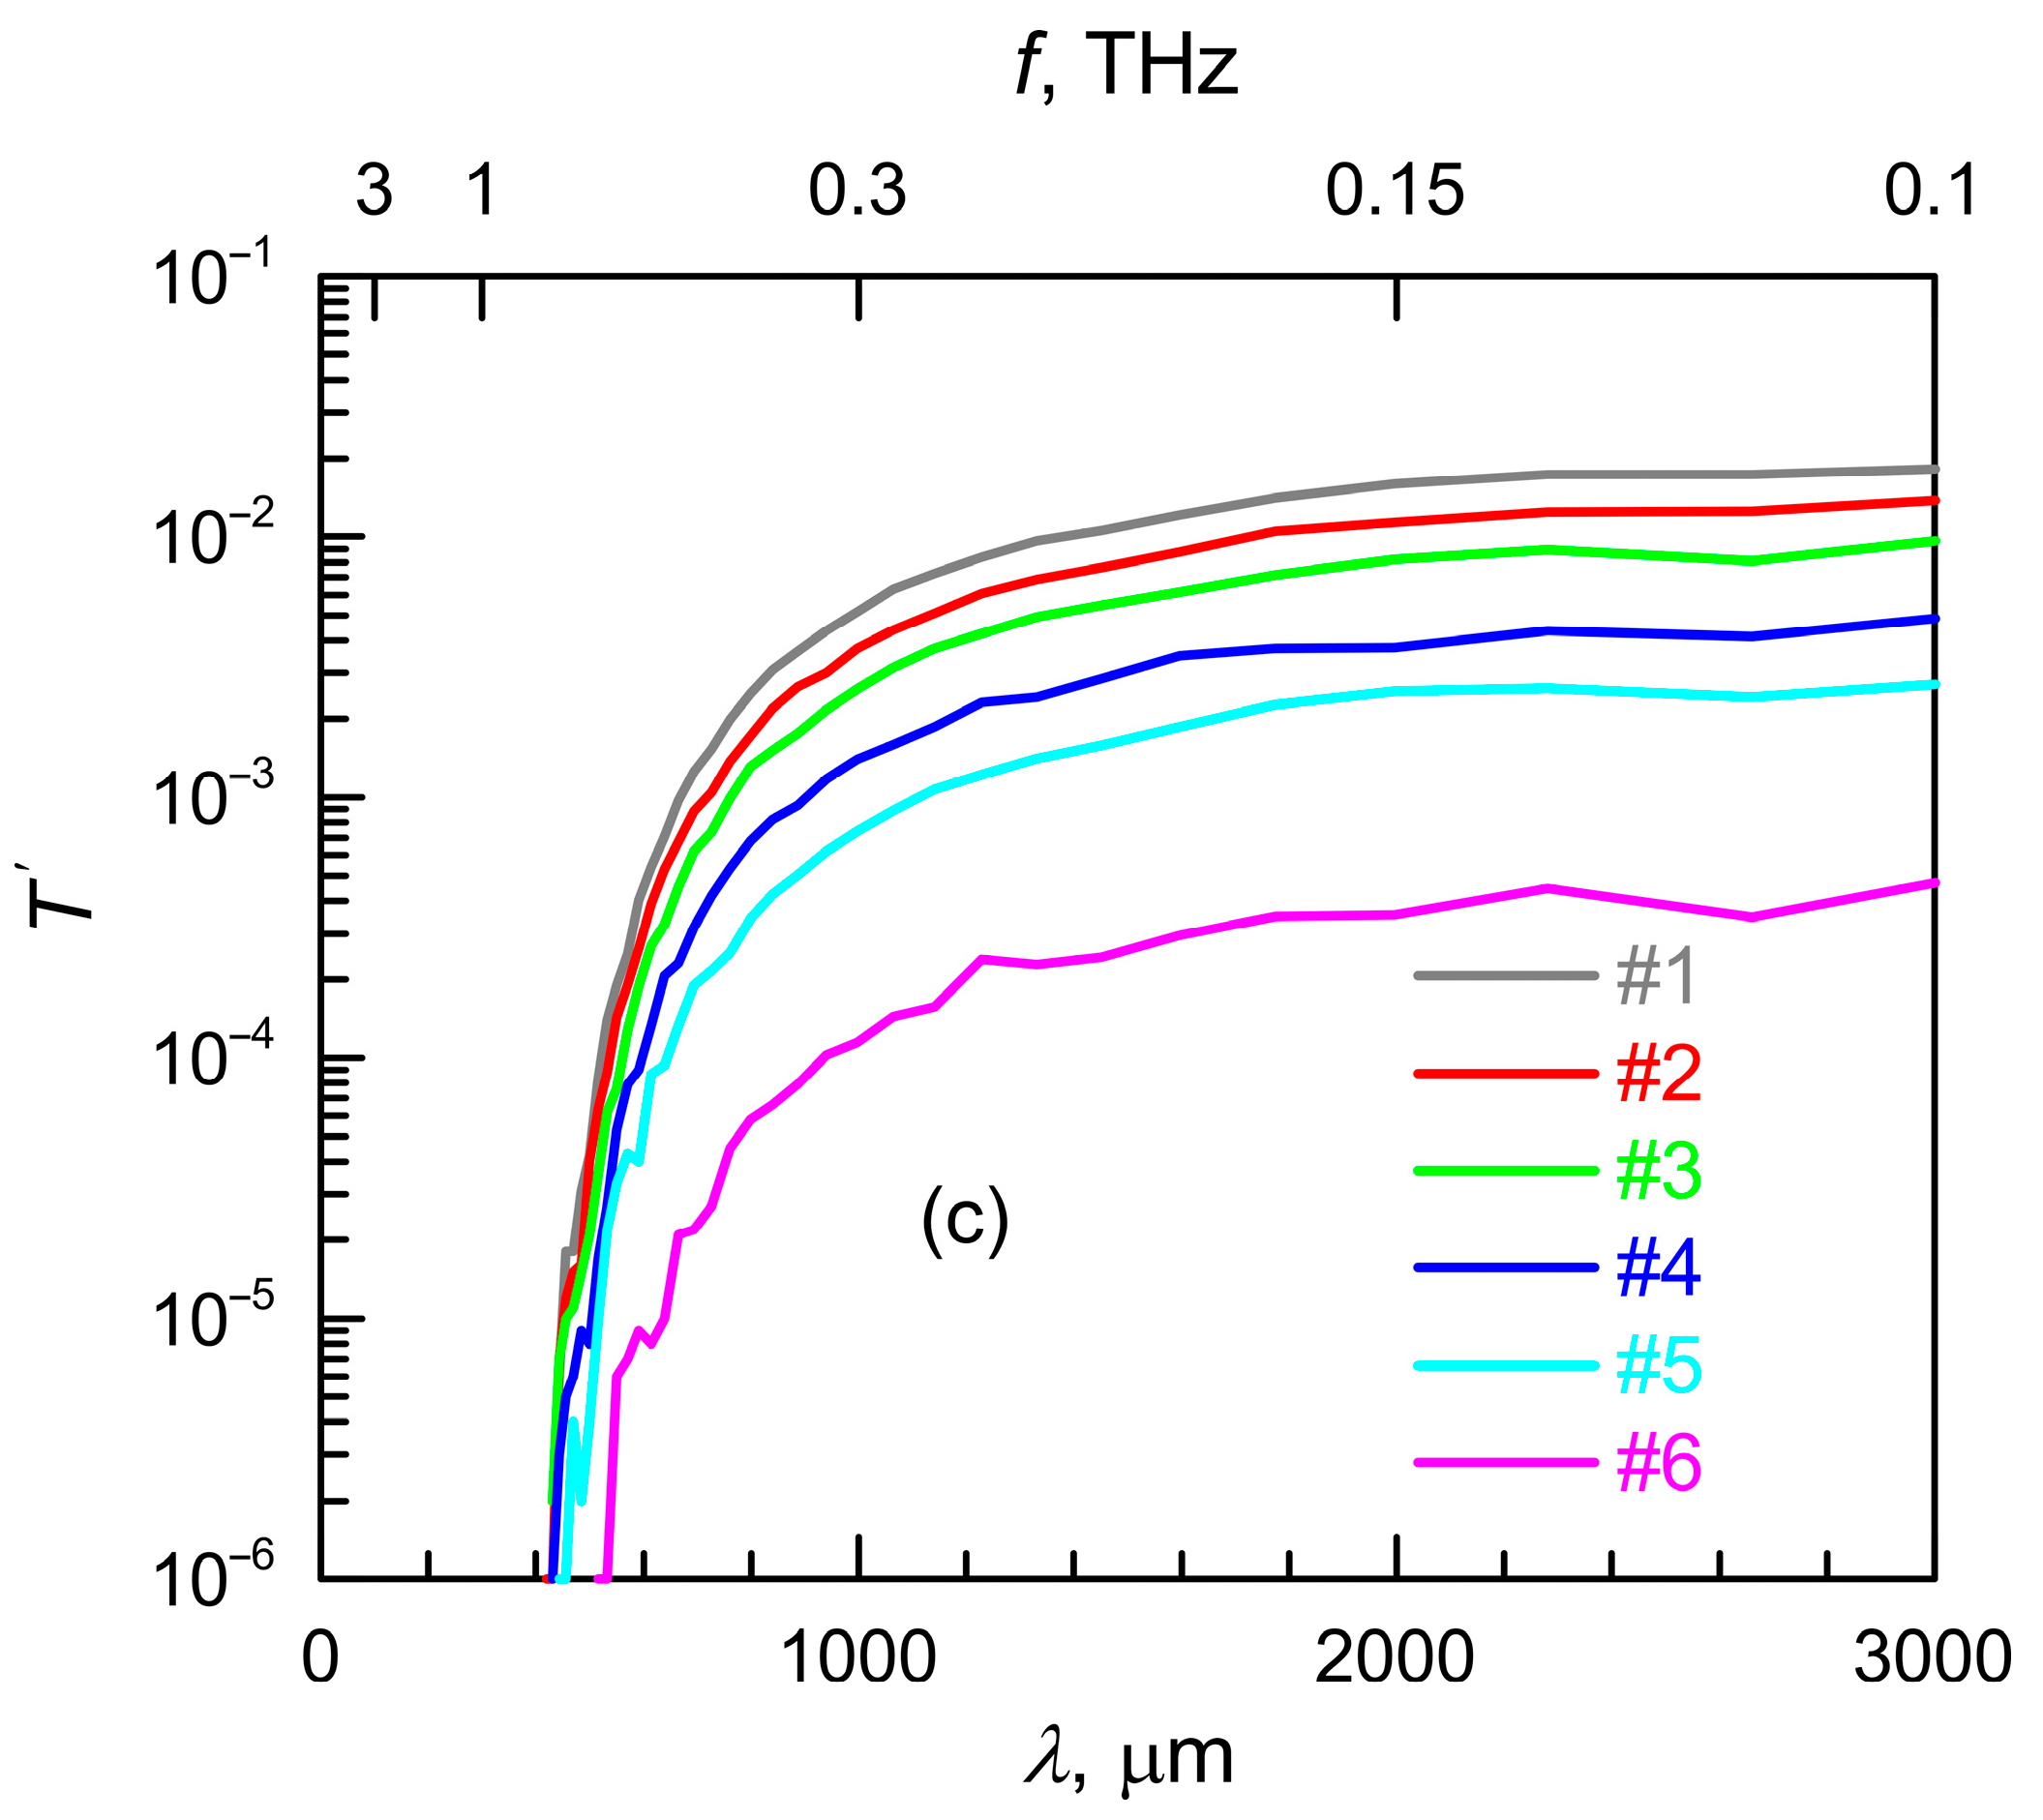
The K108 glass substrate is also transparent in the terahertz spectral range: at λ > 900 μm, its transmittance exceeds 0.1 [32]. Experimental single-pass transmittance spectra for all studied samples in the wavelength range from 400 to 3000 μm (frequencies from 0.75 to 0.1 THz) are shown in Figure 2. The spectral behavior of the transmittance curves of the samples in a semi-logarithmic scale is almost the same; it is determined primarily by the optical parameters of the glass substrate (see [32]). As the thickness of the ITO film increases, the transmission spectrum shifts downwards as a whole, retaining its shape. This is due to the fact that in the spectral range under consideration, the skin layer thickness significantly exceeds the thickness of the films under study, and as a result, the film transmittance is practically independent of the wavelength, being determined only by the value of the DC sheet resistivity of the film. The rationale for this statement is given below in Section 4. It is also shown there that the transmittance of the ITO film in the long-wavelength limit decreases monotonically with a decrease in the DC sheet resistivity of the film, which forms the basis for the development of a non-contact method for determining the latter parameter.
The next section will provide a detailed theoretical description of the transmittance and reflectivity spectra for free-standing ITO films, as well as for ITO film/glass structures.

4. Theoretical Modeling of the Transmittance and Reflectivity Spectra

4.1. Free-Standing ITO Film

Let us consider a free-standing ITO film. Dielectric permittivity of the conductive ITO film beyond the spectral region of interband transitions (i.e., at λ > 0.35 μm, see [37]) can be described by the well-known complex function [38,39,40]:
ε ω = ε ε ω p 2 ω ω + i τ + k = 1 s ε k ω ,
where ω = 2 π f = 2 π c / λ is the angular frequency of the radiation, and c is the speed of light in vacuum; the second term describes the contribution of free electrons within the Drude model, τ = μ m e / e characterizes the electron relaxation time, and the third term represents a sum of s oscillators that describe lattice vibration contributions.
In the optical spectral range, the most relevant for us is its short-wavelength region (λ < 4.3 μm), where we carry out theoretical modeling and fitting of the transmittance and reflectivity spectra. In this range, the third term in Equation (4) is negligibly small, and the permittivity can be represented as (see [28,39]):
ε ω = ε 1 ω p 2 ω ω + i τ .
The lattice vibration resonances in ITO have significantly longer wavelengths (31–41 μm) [38,41].
In the terahertz region of the spectrum (from 400 to 3000 μm) that we studied, the wavelengths, on the contrary, significantly exceed the wavelengths of the lattice vibration resonances. In this limiting case, the third term in (4) is equal to ( ε 0 ε ), and permittivity can be represented as:
ε ω = ε 0 ε ω p 2 ω ω + i τ .
The spectral dependences of the refractive index and extinction coefficient of the ITO film can be calculated using the Fresnel equation:
n ~ 1 2 = ε ω ,
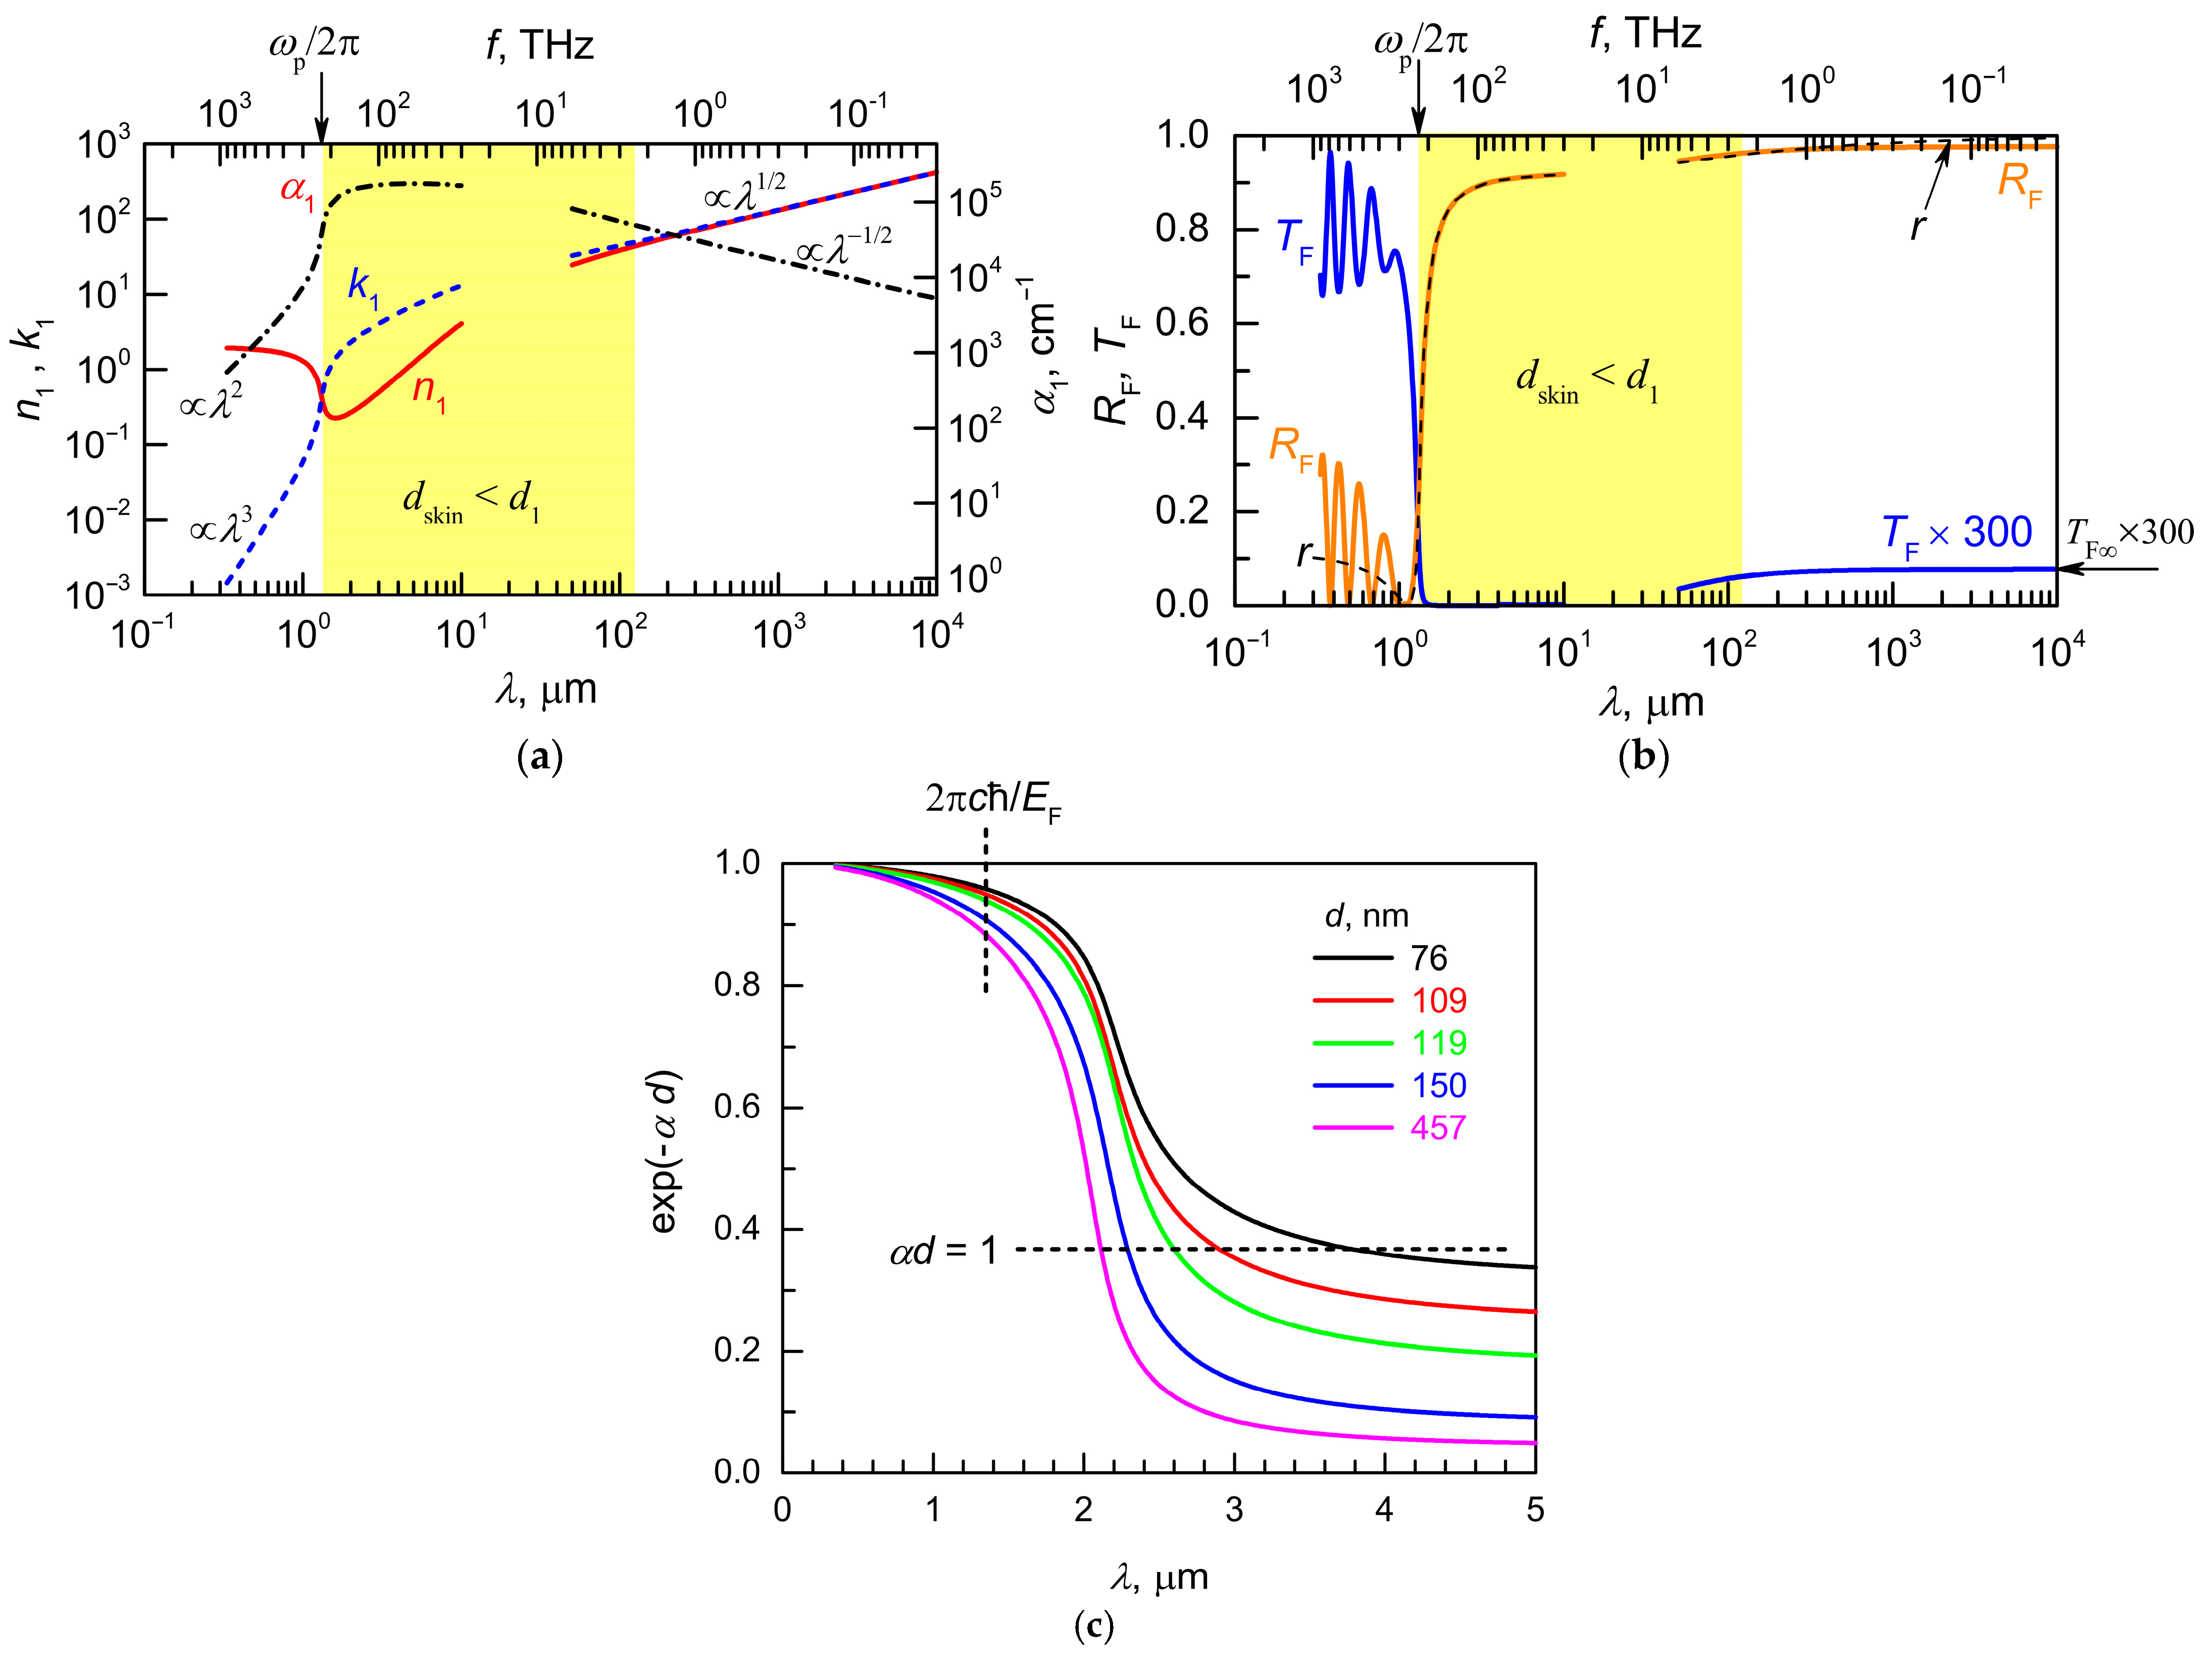
where n ~ 1 = n 1 + i k 1 is the complex refractive index. Figure 3a shows the calculated spectra for a 400 nm thick ITO film with typical values of electron concentration and mobility: N e = 9 × 1020 cm−3 and μ = 40 cm2/(V × s). At short wavelengths ( λ < 10 μm), Equation (5) was used in the calculation, and at long wavelengths ( λ > 50 μm), Equation (6) was used with the static permittivity of the ITO crystal lattice ε 0 = 9.3 [15]. The calculation shows that in the short-wavelength limit (when the radiation frequency is higher than the plasma frequency), the extinction coefficient is proportional to λ 3, and the refractive index depends weakly on the wavelength. In the long-wavelength limit ( λ > 100 μm), k 1   n 1     λ 1 / 2 . Note that despite the monotonic increase in the extinction coefficient with wavelength, the spectral dependence of the absorption coefficient is non-monotonic. In the region of short wavelengths, the absorption coefficient rapidly increases with wavelength: α 1     λ 2 . In the long-wavelength limit, it slowly decreases: α 1     λ 1 / 2 . In the intermediate wavelength region, the absorption coefficient reaches such high values that the skin layer thickness in the ITO film becomes smaller than the film thickness (this region is shown in Figure 3a by color filling), which leads to a low film transmittance.
The transmittance and reflectivity spectra for the considered free-standing ITO film were calculated using the Airy formulas:
T F = 1 r 2 e α 1 d 1 1 2 r e α 1 d 1 cos δ + r 2 e 2 α 1 d 1 ,
R F = 1 2 e α 1 d 1 cos δ + e 2 α 1 d 1 1 2 r e α 1 d 1 cos δ + r 2 e 2 α 1 d 1 ,
where
r = n 1 1 2 + k 1 2 n 1 + 1 2 + k 1 2
is the intensity reflection coefficient for the ITO/vacuum interface at normal incidence of a beam of monochromatic electromagnetic radiation, and δ = 4 π n 1 d 1 / λ is the phase shift for the double passage of radiation through the ITO film. The calculation results are shown in Figure 3b.
First, let us pay attention to the Fabry–Pérot oscillations in the transmittance and reflectivity spectra, which are observed at frequencies above the plasma frequency ω p / 2 π (at wavelengths λ < 1 μm). In this spectral region, the film is sufficiently transparent, which leads to interference of the radiation beams that are multiply reflected from the front and back surfaces of the film.
We simulated the single-pass attenuation e x p ( α d ) as a function of the radiation wavelength for films of various thicknesses (see Figure 3c). If we follow the long-wavelength boundary of the film passband under the condition α d = 1 , then as the film thickness decreases from 457 to 76 nm, the boundary experiences a blue shift from 3.8 μm to 2.1 μm. Note that in the experimental transmittance spectra for the ITO film/K108 glass structure (Figure 1), the long-wavelength decline of the transparency band is steeper than for the free-standing film considered here, which is due to a sharp decrease in the transparency of the glass in the wavelength range of 1.5–4.3 μm [32]. A detailed quantitative model of the optical properties of the ITO film/K108 glass structures is developed in Section 4.2 and Section 5.
Another significant feature in Figure 3b is the plasma reflection band: at frequencies f ω p / 2 π (i.e., at wavelengths λ > 3.5 μm), the film reflectivity R F exceeds 0.9, and the transmittance T F becomes extremely small. In this case, in the wavelength band where the strong absorption condition is met ( d s k i n <   d 1 ) , the film reflectivity R F practically coincides with the reflectivity of a single ITO/vacuum interface r . However, this equality is violated at λ > 200 μm, and the film reflectivity becomes less than the reflectivity of the interface: R F  < r. The last inequality is due to the fact that at all wavelengths λ > 200 μm, the phase shift δ < π / 2 and it decreases monotonically with the wavelength ( δ     λ 1 / 2 ), while the single-pass film transparency exp α 1 d 1 > 0.2 and it increases monotonically with the wavelength (since α 1     λ 1 / 2 ).
In the long-wave limit (at λ ), the coefficient r 1 and Equations (8) and (9) yield an uncertainty of the form 0/0, since δ 0 and α 1 0 . Opening this uncertainty with Equations (2)–(10), we obtain the expressions for the transmittance and reflectivity of a free-standing ITO film in the long-wavelength limit:
T F lim λ T F = 2 c 2 2 c 2 + ( 8 π c / ρ s ) + 4 π / ρ s 2 ,
R F lim λ R F = 4 π / ρ s 2 2 c 2 + ( 8 π c / ρ s ) + 4 π / ρ s 2 ,
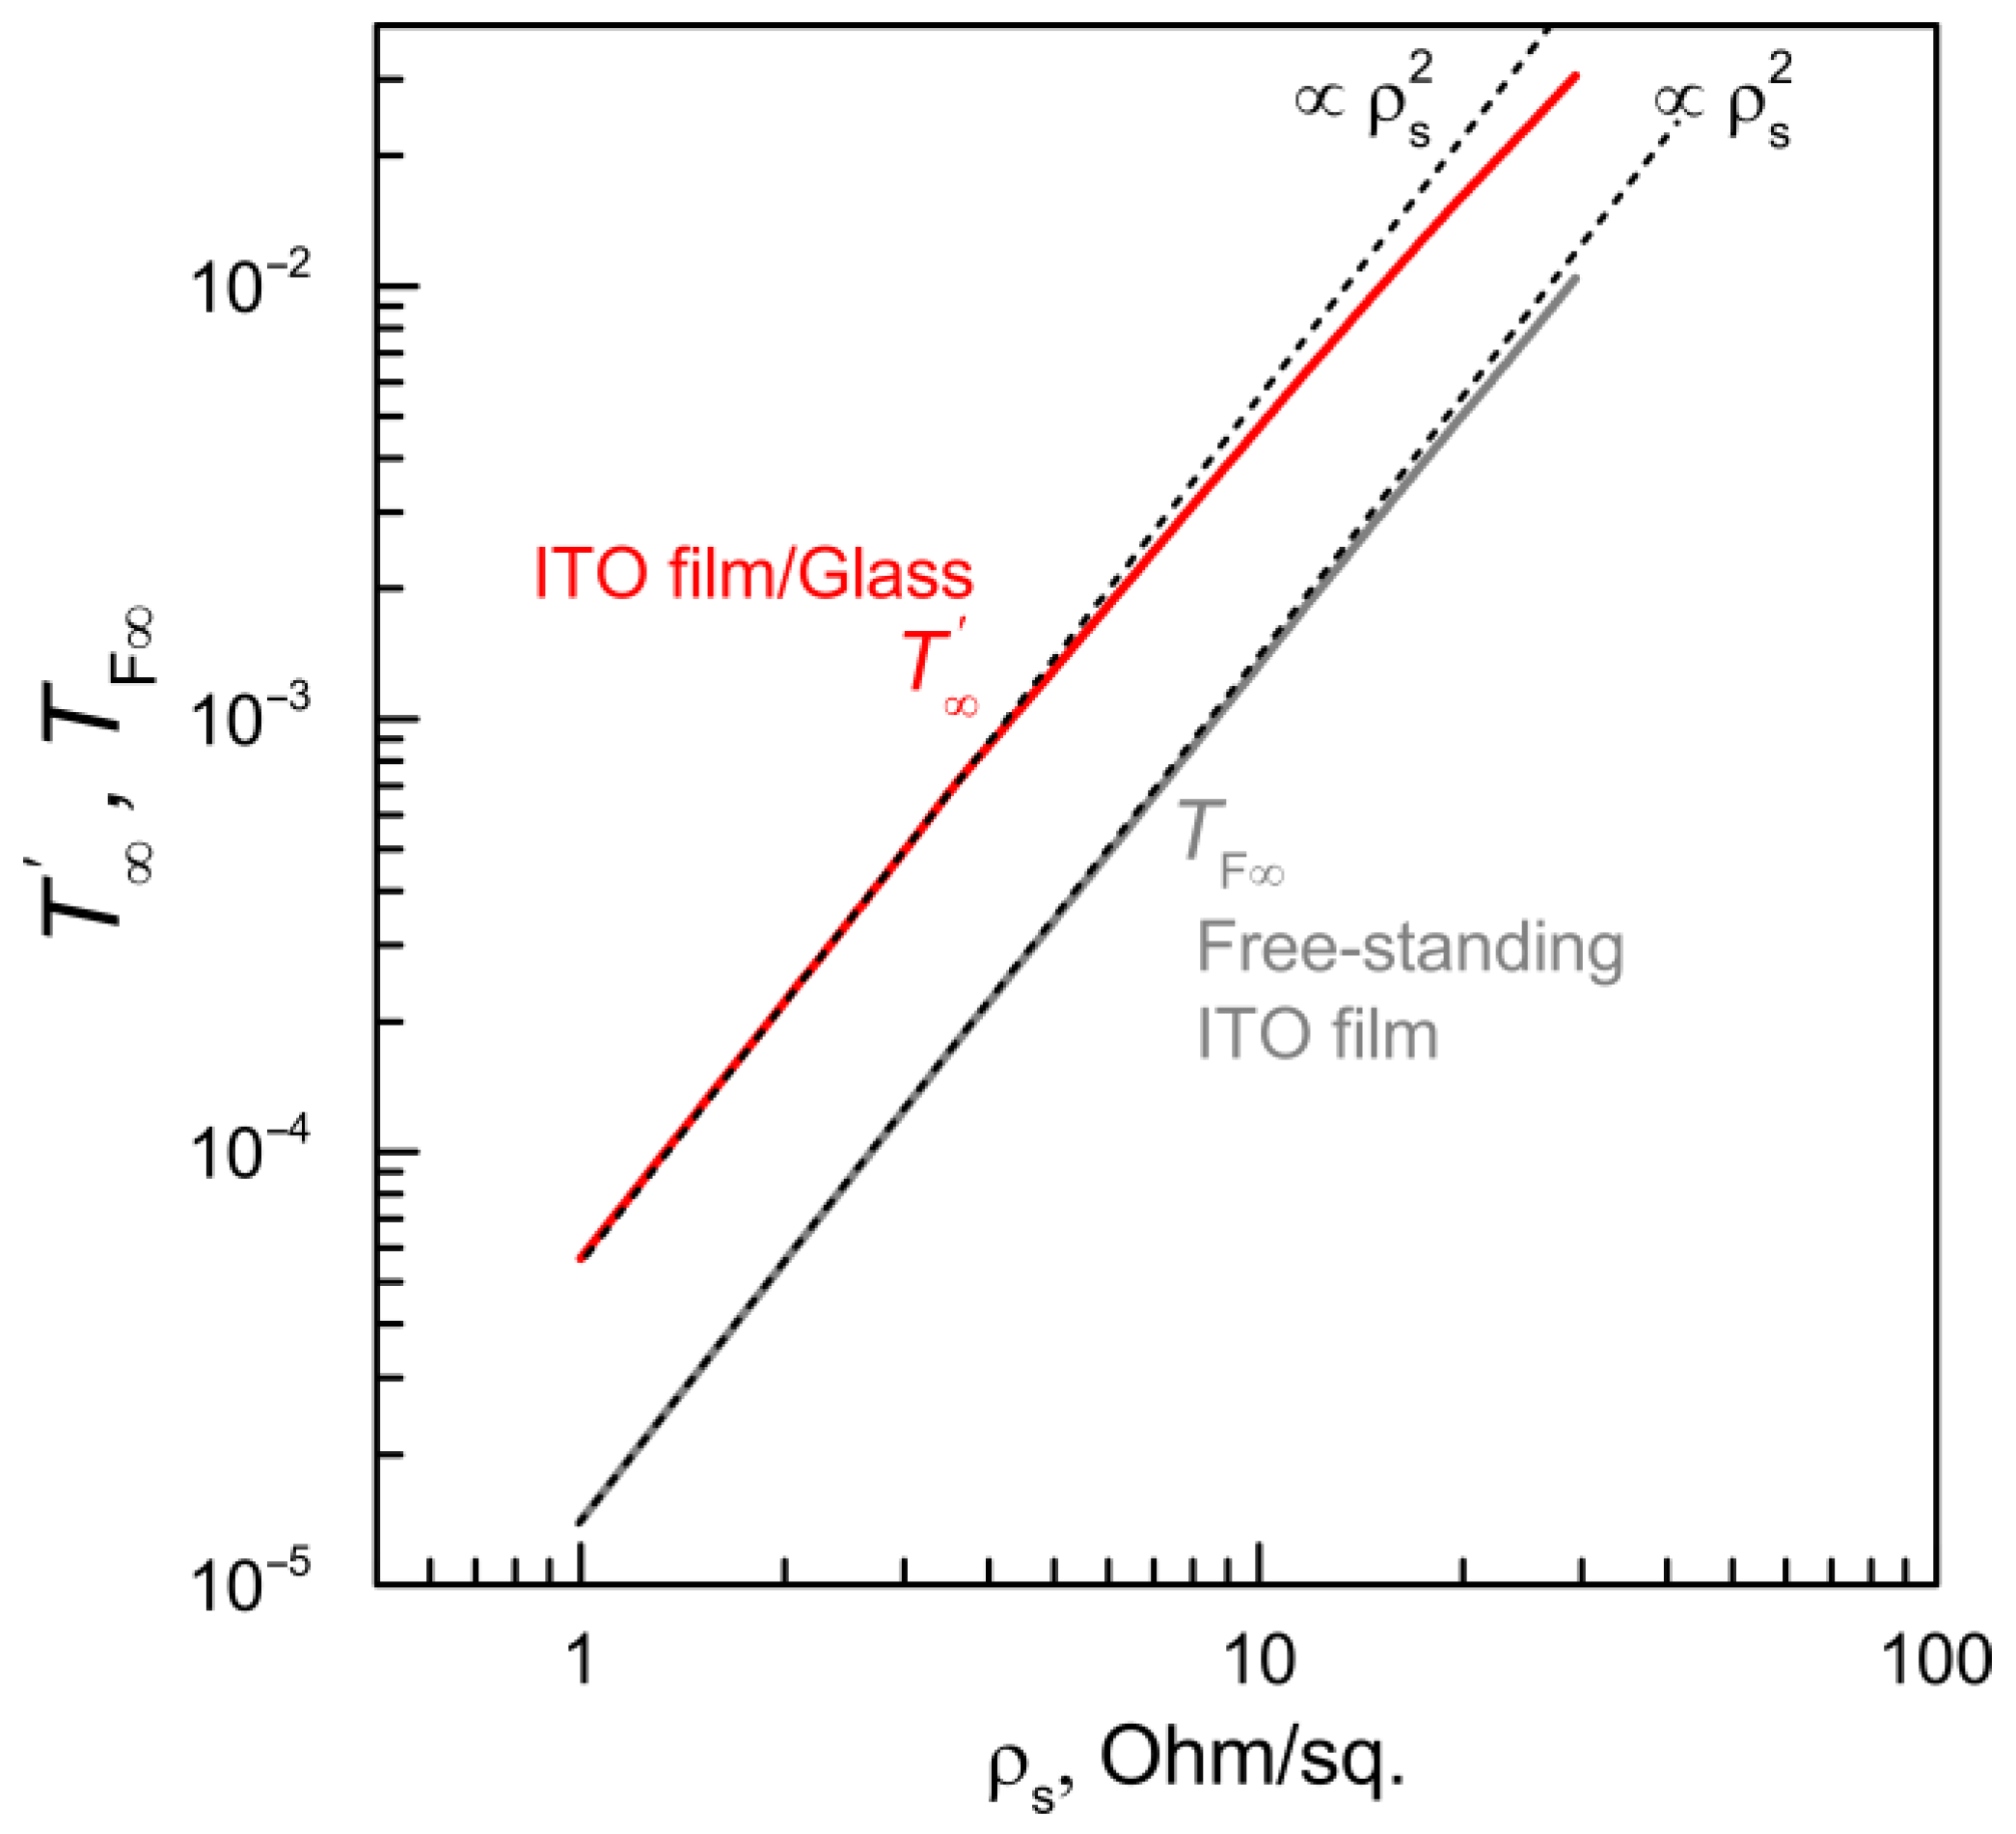
where c is the speed of light in vacuum. Note that generally speaking, the model under consideration contains three ITO film parameters: thickness d 1 , electron concentration N e and electron mobility μ . However, in the long-wavelength limit, the transmittance and reflectivity values are completely determined by the product of these parameters (via ρ s , see Equations (11) and (12)). Thus, to calculate T F and R F , there is no necessity to know these three parameters separately; it is sufficient to specify the DC sheet resistivity value. The dependence   T F ρ s for a free-standing ITO film, calculated using Equation (11), is shown in Figure 4. As the argument decreases, this dependence asymptotically approaches ρ s 2 (the relative deviation is less than 5% at ρ s < 10 Ohm/sq).

4.2. The ITO Film on a Glass Substrate

Let us proceed to modeling the transmission and reflection spectra of an ITO film deposited on a borosilicate glass substrate. To solve this problem, it is convenient to use the transfer matrix method [42,43,44].
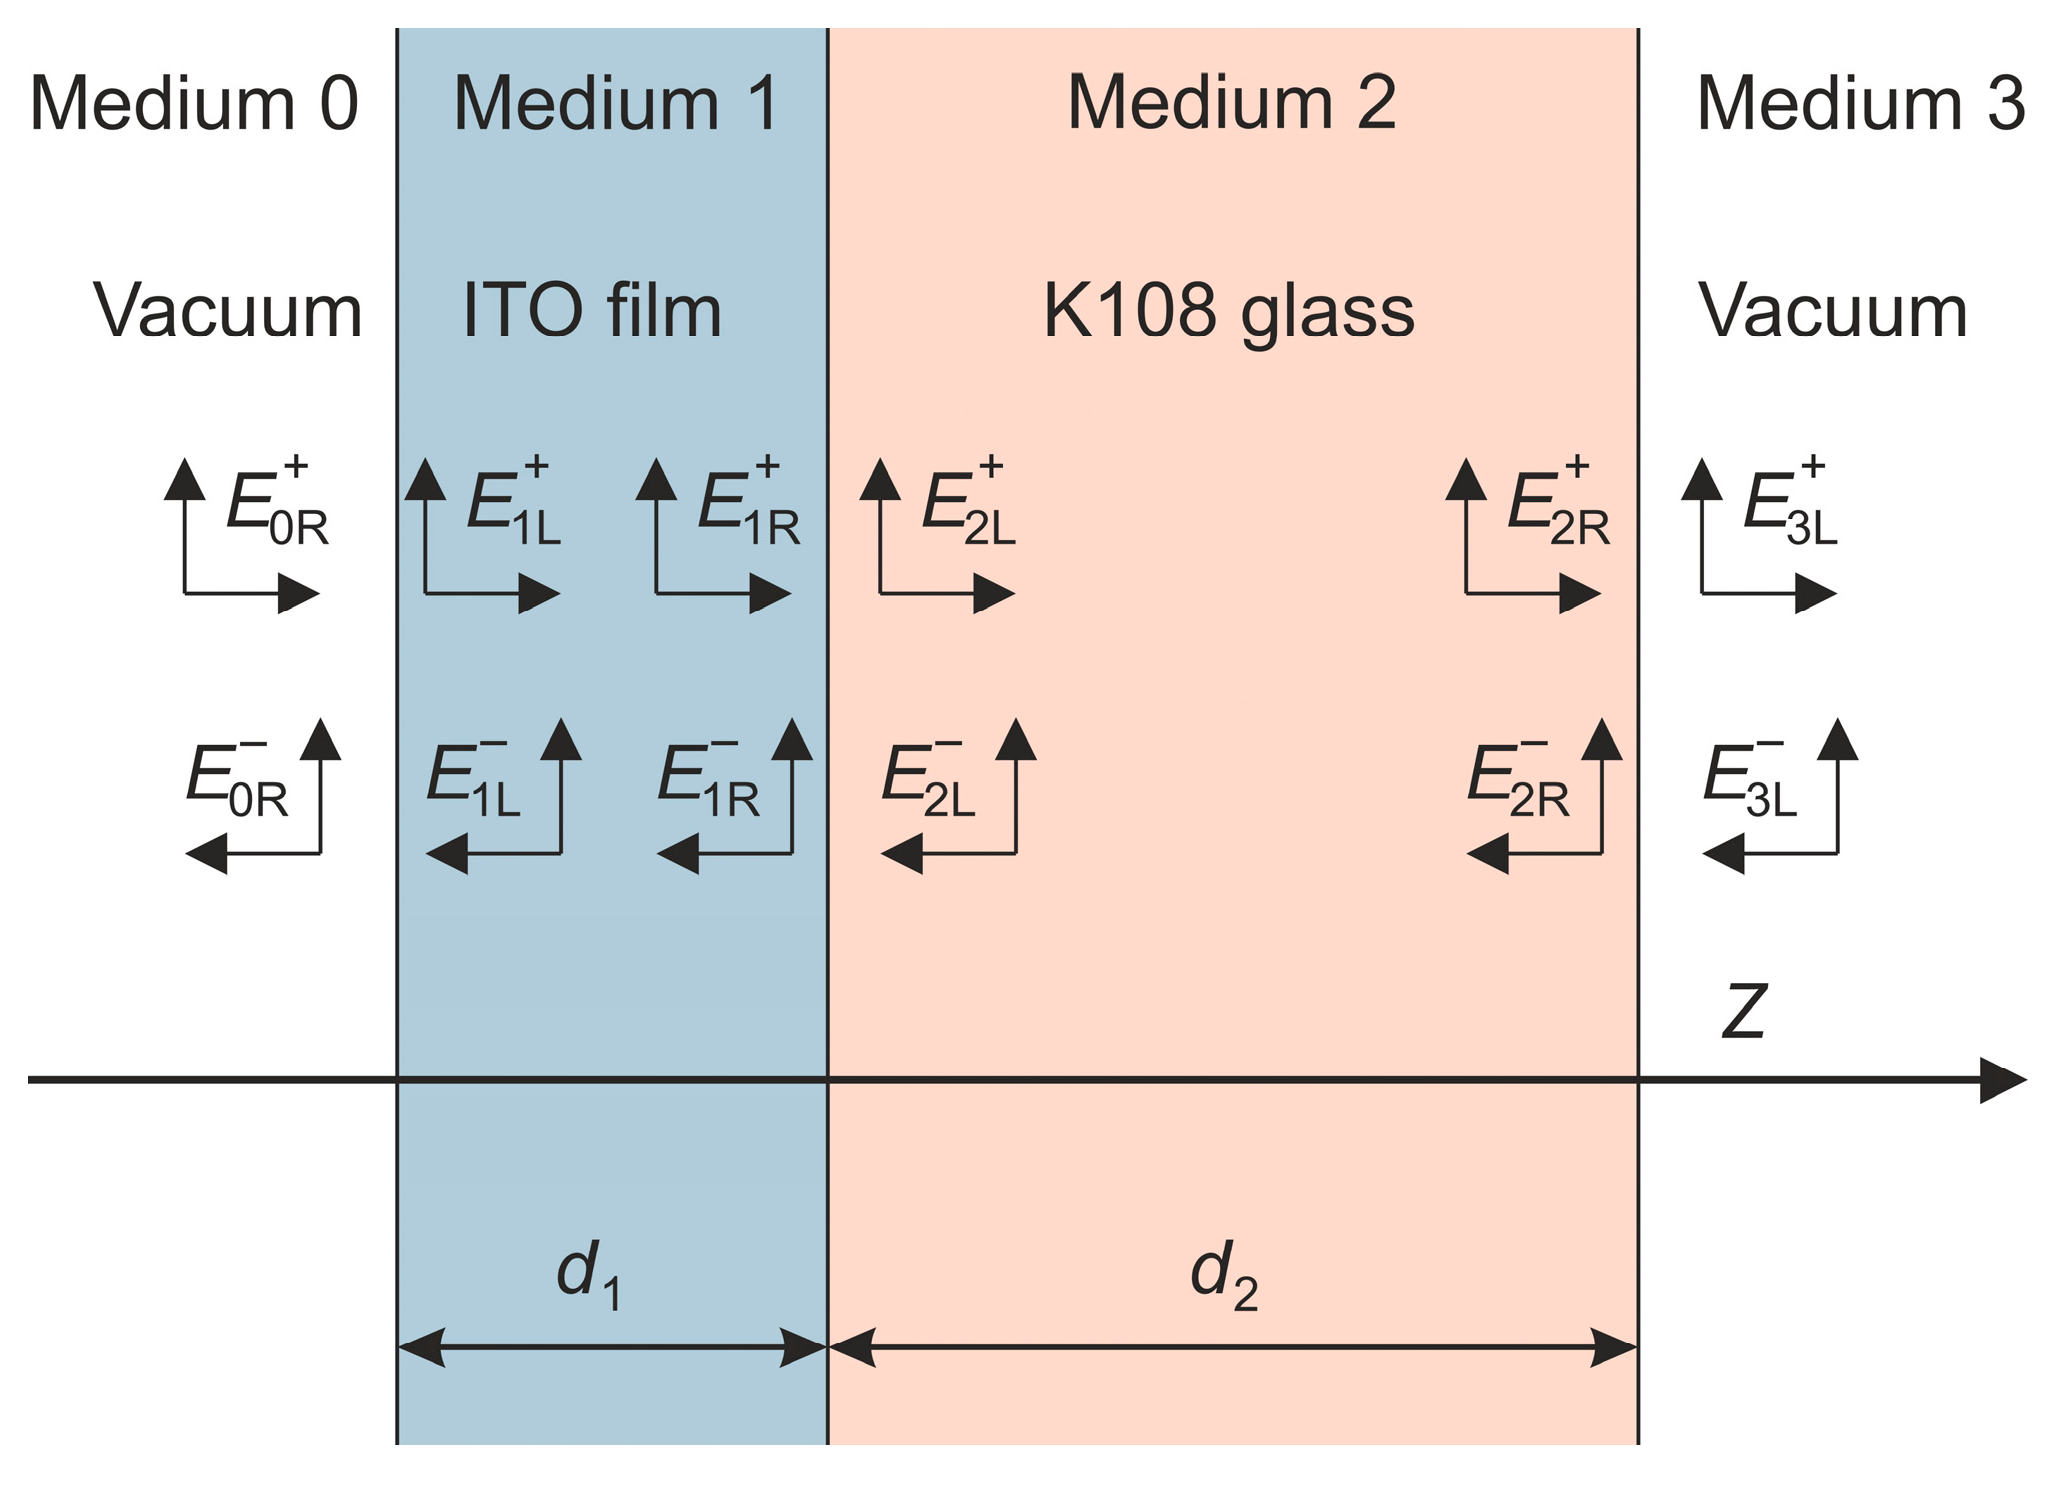
Let us consider a plane monochromatic wave incident from a vacuum (medium 0) onto an ITO film/glass structure (medium 1/medium 2), on the back side of which there is also a vacuum (medium 3) (see Figure 5). We directed the z-axis in the direction perpendicular to the interfaces, from medium 0 to medium 3. Let us denote by E i R + and E i + 1 L + , the complex amplitudes of the electric field of the forward-propagating electromagnetic radiation at the right boundary of the medium i and the left boundary of the medium i+1, respectively. Similarly, let us denote by E i + 1 L and E i R , the amplitudes of the electric field of the backward-propagating electromagnetic radiation at the left boundary of the medium i + 1 and the right boundary of the medium i . In the configuration of normal incidence of radiation, all four waves under consideration are homogeneous. The wave vector of a wave propagating forward in medium i is co-directed with the z-axis and is equal to q i = ω c × n ~ i = 2 π λ × n ~ i , while for a wave propagating backward, it is equal to q i , where we assume the time dependence of exp i ω t .
Let us introduce the interface transfer matrix D ( i + 1 ) / i , which relates the amplitudes of the above waves on both sides of the interface i + 1 / i (here i = 0, 1, 2), using the relation:
E ( i + 1 ) L + E ( i + 1 ) L = D i + 1 / i E i R + E i R .
The elements of this matrix are determined by the Fresnel formulas:
D i + 1 / i = 1 2 n ~ i + 1 n ~ i + 1 + n ~ i n ~ i + 1 n ~ i n ~ i + 1 n ~ i n ~ i + 1 + n ~ i .
The amplitudes of the electric field at the left and right edges of layers 1 and 2, having thicknesses d 1 and d 2 , respectively, can be related using the propagation matrix P i , (here i = 1, 2):
E i R + E i R = P i E i L + E i L ,
P i = e i q i d i 0 0 e i q i d i .
Note that in the case of normal incidence under consideration, Equations (14) and (16) are valid for the radiation of arbitrary polarization, as well as for unpolarized radiation.
Thus, with known thicknesses and complex refractive indices of both layers of the structure, it is possible to calculate the amplitudes of electromagnetic waves at the output of the structure in layer 3, E 3 L + E 3 L , if we sequentially multiply the column vector of the amplitudes of electromagnetic waves at the input to the structure in layer 0, E 0 R + E 0 R , by the transfer matrices of all interfaces and layers:
E 3 L + E 3 L = D 3 / 2 P 2 D 2 / 1 P 1 D 1 / 0 E 0 R + E 0 R .
In other words, the matrix
M = M 11 M 12 M 21 M 22 = D 3 / 2 P 2 D 2 / 1 P 1 D 1 / 0
is the transfer matrix for the entire structure. If we consider the case where a plane monochromatic wave of unit amplitude ( E 0 R + = 1 ) is incident on the structure from the left, and there is no wave incident from the right ( E 3 L = 0 ), then the amplitude transmittance and reflectivity (t and r, respectively) for the structure in question can be found from the equation:
t 0 = M 1 r .  
Accordingly, the intensity transmittance and reflectivity for the structure (T and R, respectively), measured experimentally at a given frequency ω, can be expressed through the elements of the transfer matrix M:
T = t 2 = M 11 M 12 M 21 M 22 2 ,
R = r 2 = M 21 M 22 2 .
When modeling the transmission and reflection spectra of the samples, the complex refractive index of the ITO films n ~ 1 was calculated using the Drude model (see Section 4.1), and the complex refractive index of the substrate n ~ 2 = n 2 + i k 2 was calculated using the experimental values of the optical parameters of K108 glass that we obtained earlier [32]. When calculating directly using Equations (13)–(21), the spectra T and R exhibit oscillations caused by Fabry–Pérot interference during multiple passes of radiation in a thin ITO film (these oscillations have a relatively large period) and in a thick substrate (the period of these oscillations is three orders of magnitude smaller). This situation is realized for electromagnetic radiation with an infinite coherence length.
Our measurements in the optical spectral range were carried out with a rather low spectral resolution (Δν = 8 cm−1) when the coherence length of the radiation inside the substrate 1 / ( n 2 ν ) is significantly less than the double substrate thickness 2 d 2 ( n 2   1.5 in the transparency band of K108 glass [32]). Under these conditions, with a double passage of radiation through the substrate, the phase of the wave changes randomly, and interference in the substrate is not observed. To transform the model spectra accordingly, we considered the substrate as an “incoherent layer” with a transfer matrix
P 2 δ = e i ( q 2 d 2 + δ 2 ) 0 0 e i ( q 2 d 2 + δ 2 ) ,
where the phase δ changes randomly in the range from 0 to 2 π [42,44]. Substituting P2(δ) instead of P2 in (18), we then calculated the functions T(δ) and R(δ) using Equations (20) and (21), averaging all phase values, which gives the transmittance and reflectivity of the structure under study, for the selected spectral resolution
T = 1 2 π π π T δ d δ ,
R = 1 2 π π π R δ d δ .
As noted in Section 3, at a spectral resolution of Δν = 8 cm−1, the experimental transmission and reflection spectra demonstrate oscillations caused by the interference of electromagnetic waves in the thin ITO film. Note that the possibility of observing these oscillations is due to the fulfillment of the inequality 1 / ( n 1 ν )   2 d 1 in the transparency region of the ITO film. Below in Section 5, it is shown that simulation of the spectra with Equations (23) and (24) adequately reproduces the interference oscillations in thin films in the optical spectral range.
As was mentioned above (see Section 2), the experimental studies of transmission in the terahertz range ( λ   = 400–3000 μm) were performed using the THz TDS method, where the Fourier analysis of the time dependences of the signals (the transmitted waveforms) was carried out in the time window corresponding to a single pass of the radiation through a thick substrate with a thickness of d 2 . The section of the time dependence with the echo signal corresponding to the superposition of the signal from the double-passed beam on the signal from the single-passed beam was cut off (for details, see [32]). Thus, for each sample, a single-pass transmittance intensity spectrum was experimentally obtained. For theoretical modeling of this spectrum, we used the following formula (see [44]):
T = T 1 e α 2 d 2 1 r 32 n 2 n 3 ,
where the intensity transmittance T 1 for the ITO film (with the account of two interfaces) is described by the transfer matrix m :
m = D 21 P 1 D 10 ,         T 1 = m 11 m 12 m 21 m 22 2 .
In Equation (25), the absorption coefficient of the substrate is α 2 = 4 π k 2 / λ , the intensity reflection coefficient for the vacuum/substrate interface is r 32 = n ~ 2 1 n ~ 2 + 1 2 , and the refractive index of vacuum is n 3 = 1 .
We obtained an analytical expression for the complex index of the ITO film n ~ 1 (which determines the elements of the matrix m ) for radiation with a wavelength of λ ≥ 400 μm. Here, two approximations can be used. First, due to the low electron mobility in ITO films μ   1000 cm2/(V × s), the condition ω 1 / τ , is satisfied, and the dispersion of the permittivity (see Equation (6)) is reduced to
ε ω = ε 0 + i 4 π ρ ω ,
where ρ = 1 / ( e μ N e ) is DC volume resistivity. Secondly, the second term in Equation (27) dominates under the condition ρ 1.6 Ohm × cm, which is satisfied for the ITO films under study with a margin of three orders of magnitude (see Table 1). This allows us to rewrite the Fresnel Equation (7) as
n ~ 1 2 = i 4 π ρ ω = i 4 π ρ s d 1 ω .
Using (28) gives the following expression for the matrix m in the limit λ (i.e., ω 0 ):
m lim λ m = n ~ 2 + n ~ 0 4 π ρ s c n ~ 2 n ~ 0 4 π ρ s c n ~ 2 n ~ 0 + 4 π ρ s c n ~ 2 + n ~ 0 + 4 π ρ s c ,
which, using Equations (25) and (26), allows us to find the single-pass transmittance value of the ITO film/glass structure in the long-wave limit
T lim λ T λ .
Based on Equations (25), (26), (29) and (30), we can conclude that, as in the case of a free-standing film, the transmission of the ITO film/glass structure in the limit λ is completely determined by the single-film parameter ρ s (for a given glass thickness). Numerical calculations were performed for n ~ 2 ( ω = 0 ) = n 2 = 2.520 (K108 glass, see [32]), d 2 = 3 mm, and n ~ 0 = n 0 = 1 (vacuum).
The calculated dependence of T on DC sheet resistivity is shown in Figure 4. As in the case of a free-standing film, the dependence T ρ s asymptotically approaches ρ s 2 with decreasing argument, and the relative deviation is less than 5% for ρ s   < 5 Ohm/sq. The obtained dependence allows us to estimate with high accuracy how well the ITO film will suppress microwave radiation with a frequency of 1 GHz or less based on measurements of DC sheet resistivity. This can be useful in developing optoelectronic devices in the ultraviolet, visible and near IR ranges that are protected from radio frequency interference. Note that the ITO film/K108 glass structure attenuates radio waves approximately 4 times (i.e., ~6 dB) less than the free-standing film. The microwave shielding effectiveness of the structure can be increased by using a substrate with a lower static permittivity. The issue of suppressing microwave radiation with frequencies above 1 GHz requires special consideration; this analysis will be published elsewhere.
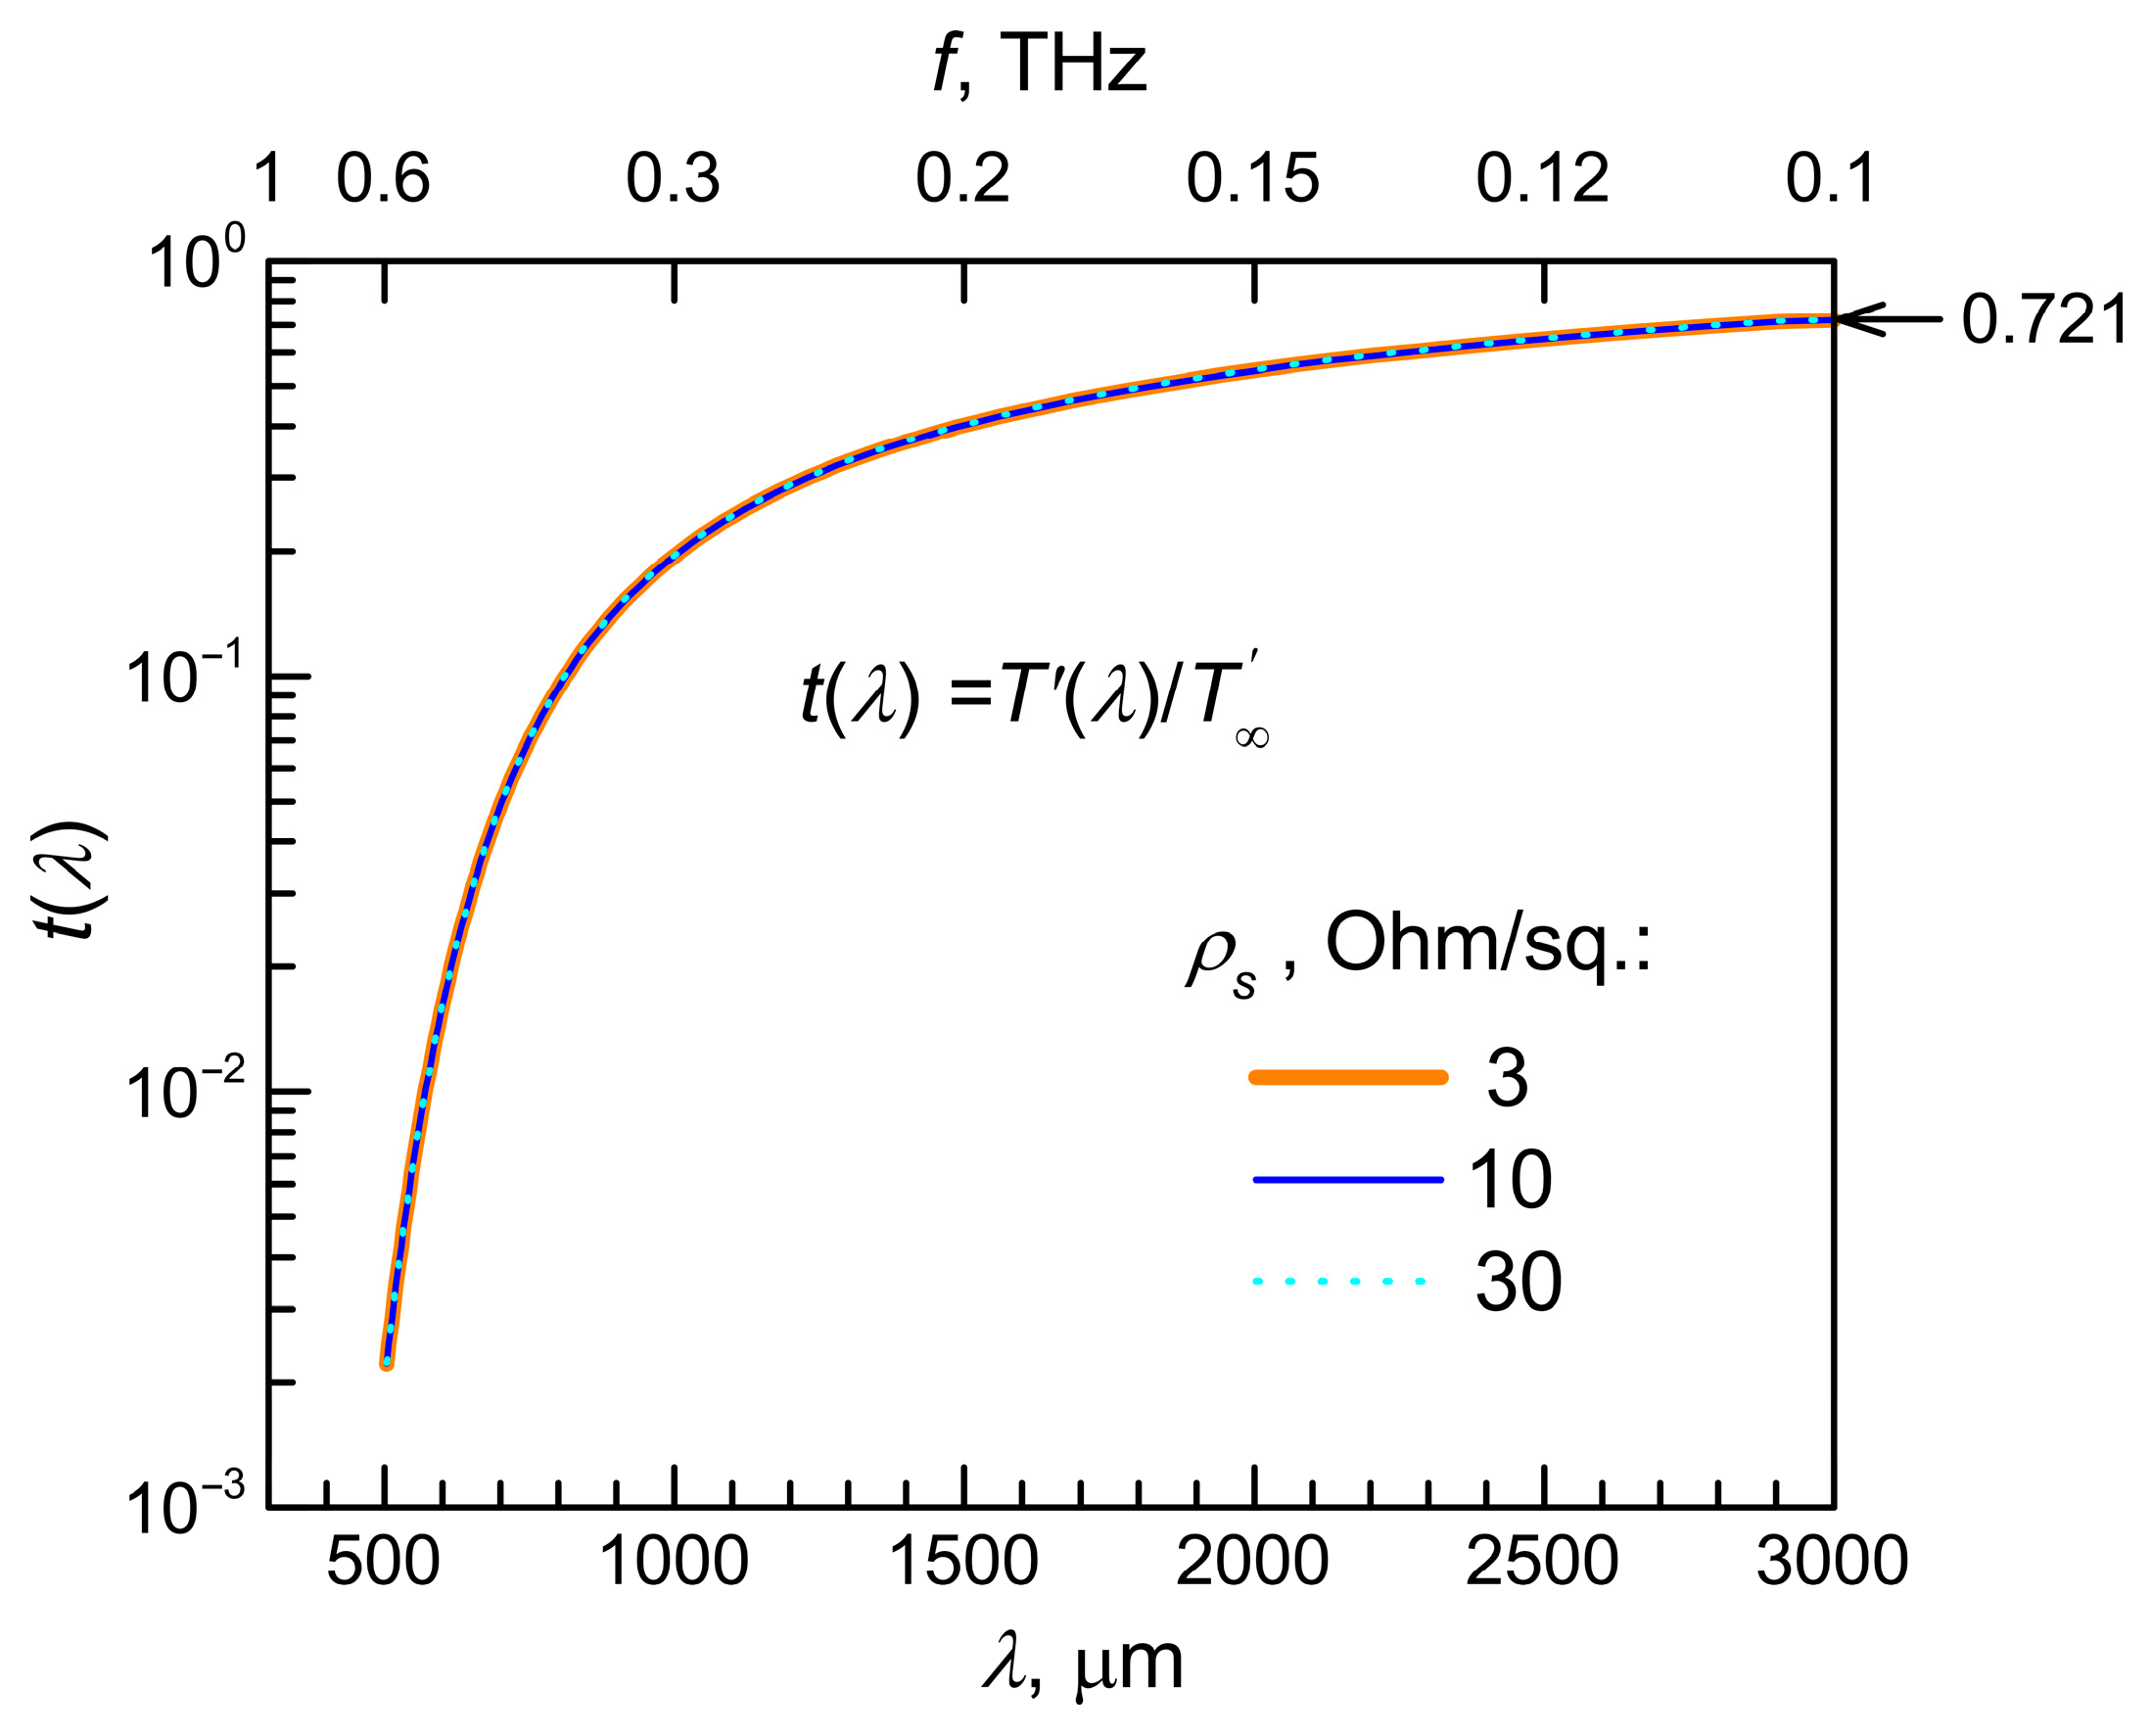
Next, we performed a model calculation of the spectra of single-pass transmittance T λ in the terahertz spectral range for structures with ITO films having a DC sheet resistivity of 3, 10 and 30 Ohm/sq. Figure 6 shows the spectra of the normalized THz transmittance of these structures
t λ = T λ / T
in the spectral range λ = 500–3000 μm. In the figure, all three spectra coincide with each other. Quantitative analysis shows that when the resistivity ρ s varies within 3–30 Ohm/sq., the relative deviation of t λ from the curve corresponding to ρ s = 10 Ohm/sq. does not exceed 0.5%. This deviation is significantly less than the experimental errors when measuring THz transmission δ T T T H z (see Table S1 in Supplementary Materials). Therefore, in the future, we assumed that for all ITO films, the dependence t ( λ ) has a universal form (corresponding to ρ s = 10 Ohm/sq). The spectrum of the THz single-pass transmittance for a structure with a given value of DC sheet resistivity ρ s was modeled by multiplying the universal curve t λ by the factor T ρ s (see dashed lines in Figure 7).

5. Determination of ITO Film Parameters

The analysis of the experimental results presented in Section 3, using the theoretical models considered in Section 4, allowed us to develop and test two non-contact methods for determining the parameters of ITO films: (i) a method for determining DC sheet resistivity and (ii) a method for determining the film thickness and free electron concentration and mobility.

5.1. Determination of DC Sheet Resistivity

We performed fitting of the experimental THz transmittance spectra T e λ   (see Figure 2) using the formula
t λ = T λ / T ,
where t λ is the universal spectral dependence of the THz transmission (see Figure 6), and T is the fitting parameter. The measure of the deviation of the modeled spectrum from the experimental one was the objective function
Z T H z = l = 1 N T e λ l T s λ l T e λ l 2 / N 1 / 2 ,
where N is a number of the experimental points. Fitting was performed using the Nelder–Mead method (see [45]) in the wavelength range of 545–3000 μm (frequencies from 0.55 to 0.1 THz). The best-fit values of the fitting parameter T for all the samples are given in Table 3.
For each sample, the simulated spectrum at the best-fit parameter is in good agreement with the experimental one (see Figure 7). This allows one to uniquely determine the DC sheet resistivity ρ s for each ITO film based on the found T value, using the theoretically calculated dependence T ρ s (see Figure 4). The resulting DC sheet resistivities for all samples are presented in Table 3 with absolute and relative errors ( δ ρ s and δ ρ s / ρ s , respectively) indicated. The absolute errors δ ρ s were determined using data on the accuracy of the experimental measurements of THz transmittance and the results of calculating the dependence of the objective function Z T H z on ρ s   (see Section S1 in Supplementary Materials for details).
Figure 7. Single-pass transmittance spectra for all samples in the THz spectral range: a comparison of the simulated spectra at best-fit parameters with the experimental ones. The experimental results are shown as solid lines; the curve numbers correspond to the sample numbers. The simulated spectra are shown by dashed lines.
Applsci 15 09121 g007
Let us compare the results of determining the DC sheet resistivity ρ s by the optical method proposed here (Table 3) with preliminary data obtained by electrical measurements using the four-probe method (Table 1). Electrical measurements were carried out in nine discrete regions of 3 mm length inside the tested area of 10 mm in diameter. In all samples except sample 6, electrical measurements reveal the presence of local fluctuations of the sheet resistivity of about 3–4%. The optical method allows one to reliably determine the value of DC sheet resistivity, averaged over the entire continuum of points in the tested area. In the thinnest ITO film, the relative error for this value turned out to be minimal (2.5%), and as the film thickness increases, it increases to 8.6% (see Table 3), which is primarily due to a decrease in the signal-to-noise ratio on the photodetector due to a decrease in the transparency of the film.
Generally speaking, measurements of DC sheet resistivity by the four-probe method are taken in separate discrete points, and averaging the measurement results over a small number of points can lead to a noticeable error compared to averaging over the entire continuum of points in the tested region. This is due to the fact that with discrete probing, most of the tested film area does not fall within the measurement zone, and in the case of fluctuations in the sheet resistivity, the set of test points may not be representative enough. In our experiments, a set of nine probing points proved to be sufficient for most samples: the sheet resistivity averaged over nine locations of the probe head lies within the error limits of measurements carried out by the optical method. At the same time, a different situation occurs for the two remaining samples (samples 1 and 3). For example, for sample 3, the average value of ρ s , based on the results of measurements by the four-probe method, differs from the average value of ρ s , based on the results of optical measurements, by +9.4%, with a confidence interval for optical measurements in this sample of ±4.4%.
It should be emphasized that our proposed method for determining the DC sheet resistivity is contactless, and this is its main advantage.
The ability to measure DC sheet resistivity contactlessly with high accuracy is important because it is this parameter that determines the effectiveness of electromagnetic interference suppression in the microwave range.

5.2. Determination of ITO Film Thickness, Free Electron Concentration and Mobility

After determining the DC sheet resistivity ρ s using the method described above, we proceeded to separately determine the three parameters of the ITO films (film thickness d 1 , electron concentration N e and electron mobility μ ) using an analysis of the experimental transmittance and reflectivity spectra in the short-wavelength part of the optical range (0.35 μm < λ < 4.3 μm). In this case, the parameters d 1 and N e were used as fitting parameters of the model spectra, and the electron mobility was calculated using the value of ρ s :
μ = 1 / ( e ρ s d 1 N e ) .
The model spectra of T and R in the short-wavelength part of the optical range were also calculated using the Drude model (see Section 4.1), which, generally speaking, works well for photon energies not exceeding the Fermi energy E F =   2 2 m e 3 π 2 N e 2 / 3 . In the studied samples, the Fermi energy varied slightly (within 12%) and was ~1 eV, so that the range of wavelengths where the Drude model is applicable is determined by the inequality λ > 2 π c / E F ≈ 1.3 μm. However, we also used the Drude model for λ < 1.3 μm, where the absorption coefficient decreases sharply with decreasing wavelength (see Figure 3a) and gradually ceases to affect the values of T and R. In particular, at wavelengths λ 0.8 μm, ITO films have high transparency (see the experimental spectra in Figure 1), and the specific configuration of interference oscillations in the T and R spectra allows us to determine the film thickness d 1 with high accuracy. The latter is due to the fact that the period of interference oscillations in the T and R spectra decreases sharply with increasing ITO film thickness (see Figure 1).
Simulation within the Drude model confirms the high transparency of ITO films at λ ≤ 0.8 μm (see Figure 3c). The statement about the high transparency of ITO films in this spectral region will remain true even if we move from the Drude theory, which is incorrect in this range, to the quantum theory of light absorption by free electrons during their scattering by polar optical phonons, which is relevant here (in a polar semiconductor at room temperature, this mechanism usually dominates). Indeed, for λ < 0.8 μm, the condition ω 1 / τ = e / ( μ m e ) is satisfied, and the Drude model leads to the relationship α 1 d 1 λ 2 . The quantum theory of light absorption by free electrons due to their scattering on polar optical phonons leads to, in this region (λ <   2 π c / E F ), a faster decrease in absorption with decreasing wavelength: α 1 d 1 λ 5 / 2 [34]. We do not use rigorous quantum theory in our simulations, since not all necessary parameters are known for ITO films. However, it is noteworthy that quantum theory predicts a steeper spectral dependence of α 1 d 1 , which corresponds to greater transparency of the samples in the region of the short-wavelength tail of free-electron absorption.
We determined the ITO film thickness and free electron concentration and mobility using a two-stage fitting procedure for the transmittance and reflectivity spectra. At both stages, we used the same objective function to estimate the deviation of the model spectra from the experimental ones:
Z O p t = l = 1 N T e λ l T s λ l 2 / N 1 / 2 + l = 1 N R e λ l R s λ l 2 / N 1 / 2 ,
where R e λ l and R s λ l are the experimental and simulated reflectivity spectra, respectively, and N is a number of the experimental points. The model spectra were calculated with the transfer matrix method using Equations (13)–(24).
At the first stage, the fitting procedure was performed in the spectral range from 0.35 to 4.3   μ m using d 1 and N e as fitting parameters and μ defined by Equation (34). The obtained parameters for all samples are presented in Table 4. Absolute and relative errors for the film thicknesses ( δ d 1 and δ d 1 / d 1 , respectively) are also indicated in Table 4. The absolute errors δ d 1 were determined using data on the accuracy of experimental measurements of the transmittance and reflectivity in the optical range and the results of calculating the dependence of the objective function Z O p t on d 1 (see Section S2 in Supplementary Materials for details).
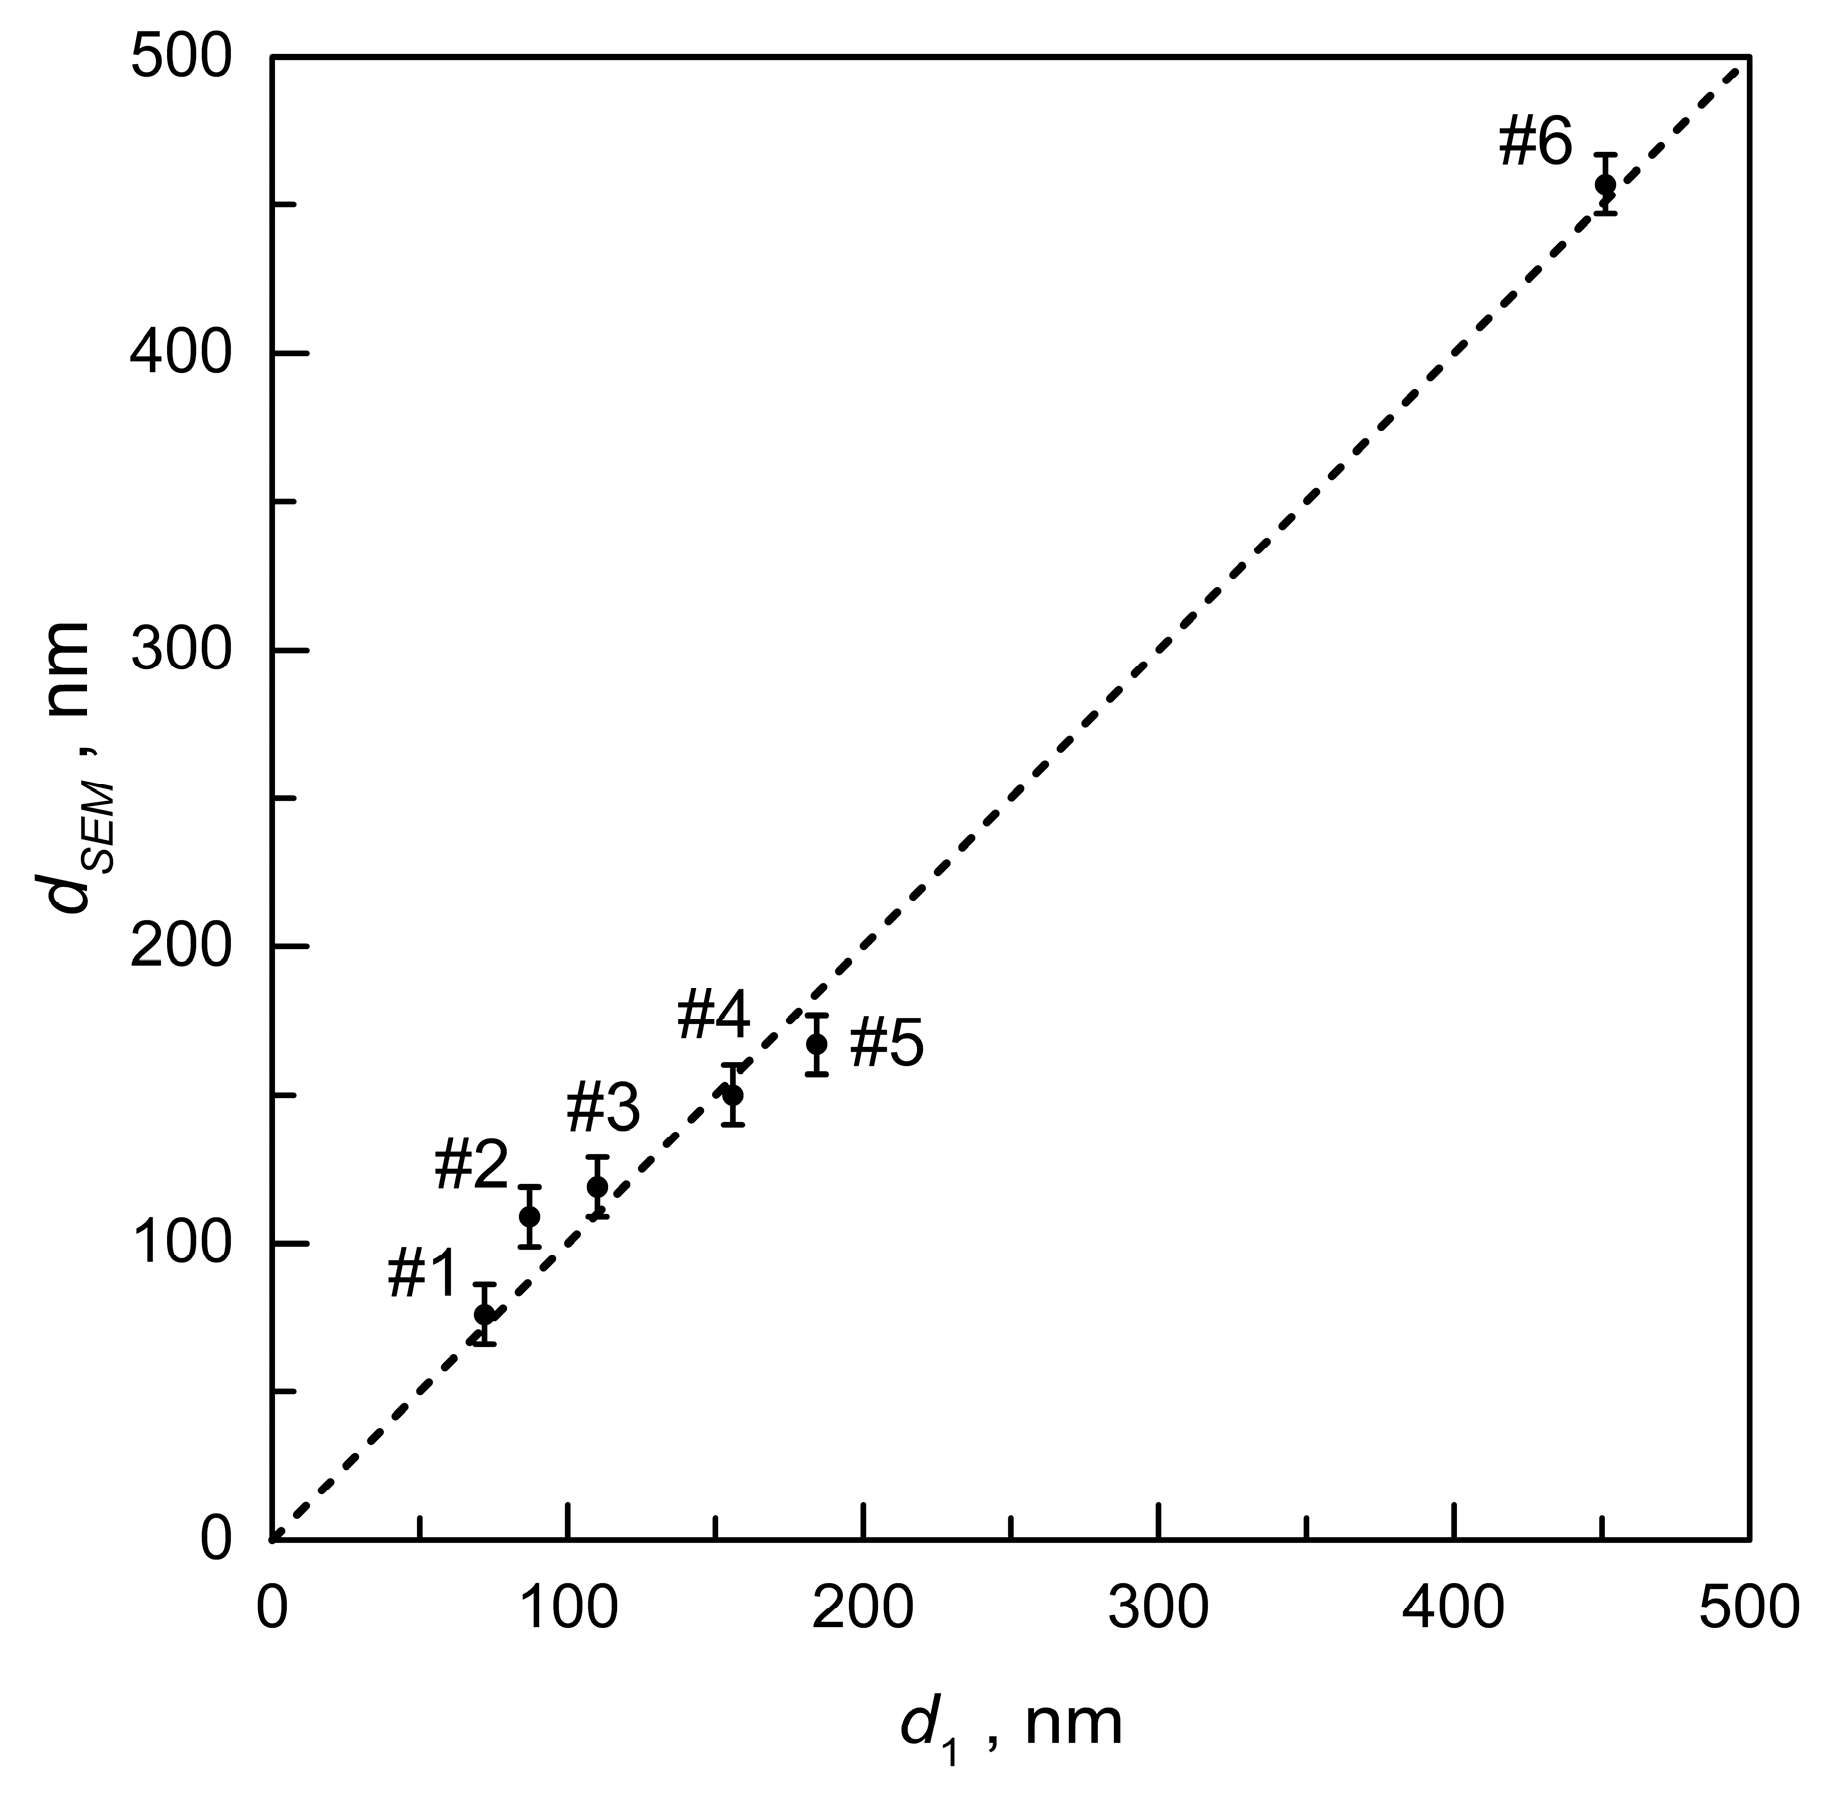
Figure 8 establishes a correlation between the ITO film thickness values obtained by the optical method ( d 1 , see Table 4) and the results of preliminary measurements by the SEM method ( d S E M , see Table 1). The graph shows six experimental points with circles, the abscissas of which correspond to the d 1 values and the ordinates to the d S E M values. The error bars for the SEM measurements (±10 nm) denote the average thickness fluctuations for a set of SEM images (up to 10 tested points) in the central film area with a diameter of 10 mm. The error in determining the d1 value is significantly smaller (1.1–2.8 nm), and the radius of the circles in the figure is equal to the largest of these values. The high accuracy of determining the average film thickness (in the tested area of the sample) by the developed optical method is based on the analysis of the interference pattern on the transmittance and reflectivity spectra in the transparency region of the film.
Averaging the results of SEM measurements in a limited number of separate discrete points does not provide the same high level of accuracy in determining the average film thickness of the ITO films deposited by the magnetron sputtering technique, since these films have rather large local thickness fluctuations (~10 nm).
The main result of the first stage of the fitting procedure is high accuracy in determining the thickness of ITO films. However, the parameters N e and μ are determined at this stage with some error, due to the fact that in a relatively small part of the analyzed spectral region (0.8 μm < λ < 1.3 μm), the use of the Drude model to describe the absorption of radiation by free electrons is methodologically erroneous. However, it was expected that this error would be relatively small, since the above-mentioned region includes a rather small part of the total number of spectral points analyzed in the first stage of fitting (18%).
The second stage of the analysis of the spectra under consideration is aimed at eliminating the above-mentioned methodological error in determining the electron concentration N e and their mobility μ. At this stage, the comparison of the model spectra with the experimental ones was carried out in a narrower spectral range at wavelengths from 2 to 4.3 μm, where the Drude model is obviously relevant and adequately describes the optical properties of free electrons in the ITO films under study. In other words, at the second stage of fitting, the spectral region is excluded from consideration, where the use of the Drude model is questionable ( λ < 1.3 μm). When calculating the model spectra T s λ l and R s λ l , only one fitting parameter was used: the electron concentration N e . The d 1 values determined at the first stage of the fitting procedure (see Table 4) were used as the ITO film thickness, and the electron mobility μ was calculated using Equation (34). The refined values of the electron concentration and mobility in the samples under study are presented in Table 5.
Absolute and relative errors for both parameters are also indicated in Table 5. The absolute errors δ N e were determined using data on the accuracy of the experimental measurements of the transmittance and reflectivity in the spectral interval of 2.0   μ m < λ < 4.3   μ m and the results of calculating the dependence of the objective function Z O p t on N e (see Section S3 in Supplementary Materials for details). Then, in accordance with Equation (34), the relative errors for the electron mobilities were calculated as
δ μ   μ = δ ρ s ρ s + δ d 1   d 1 + δ N e   N e ,
using the values of δ ρ s / ρ s and δ d 1 / d 1 from Table 3 and Table 4, respectively. The absolute errors δ μ were found by multiplication of the μ values by the relative errors δ μ / μ .
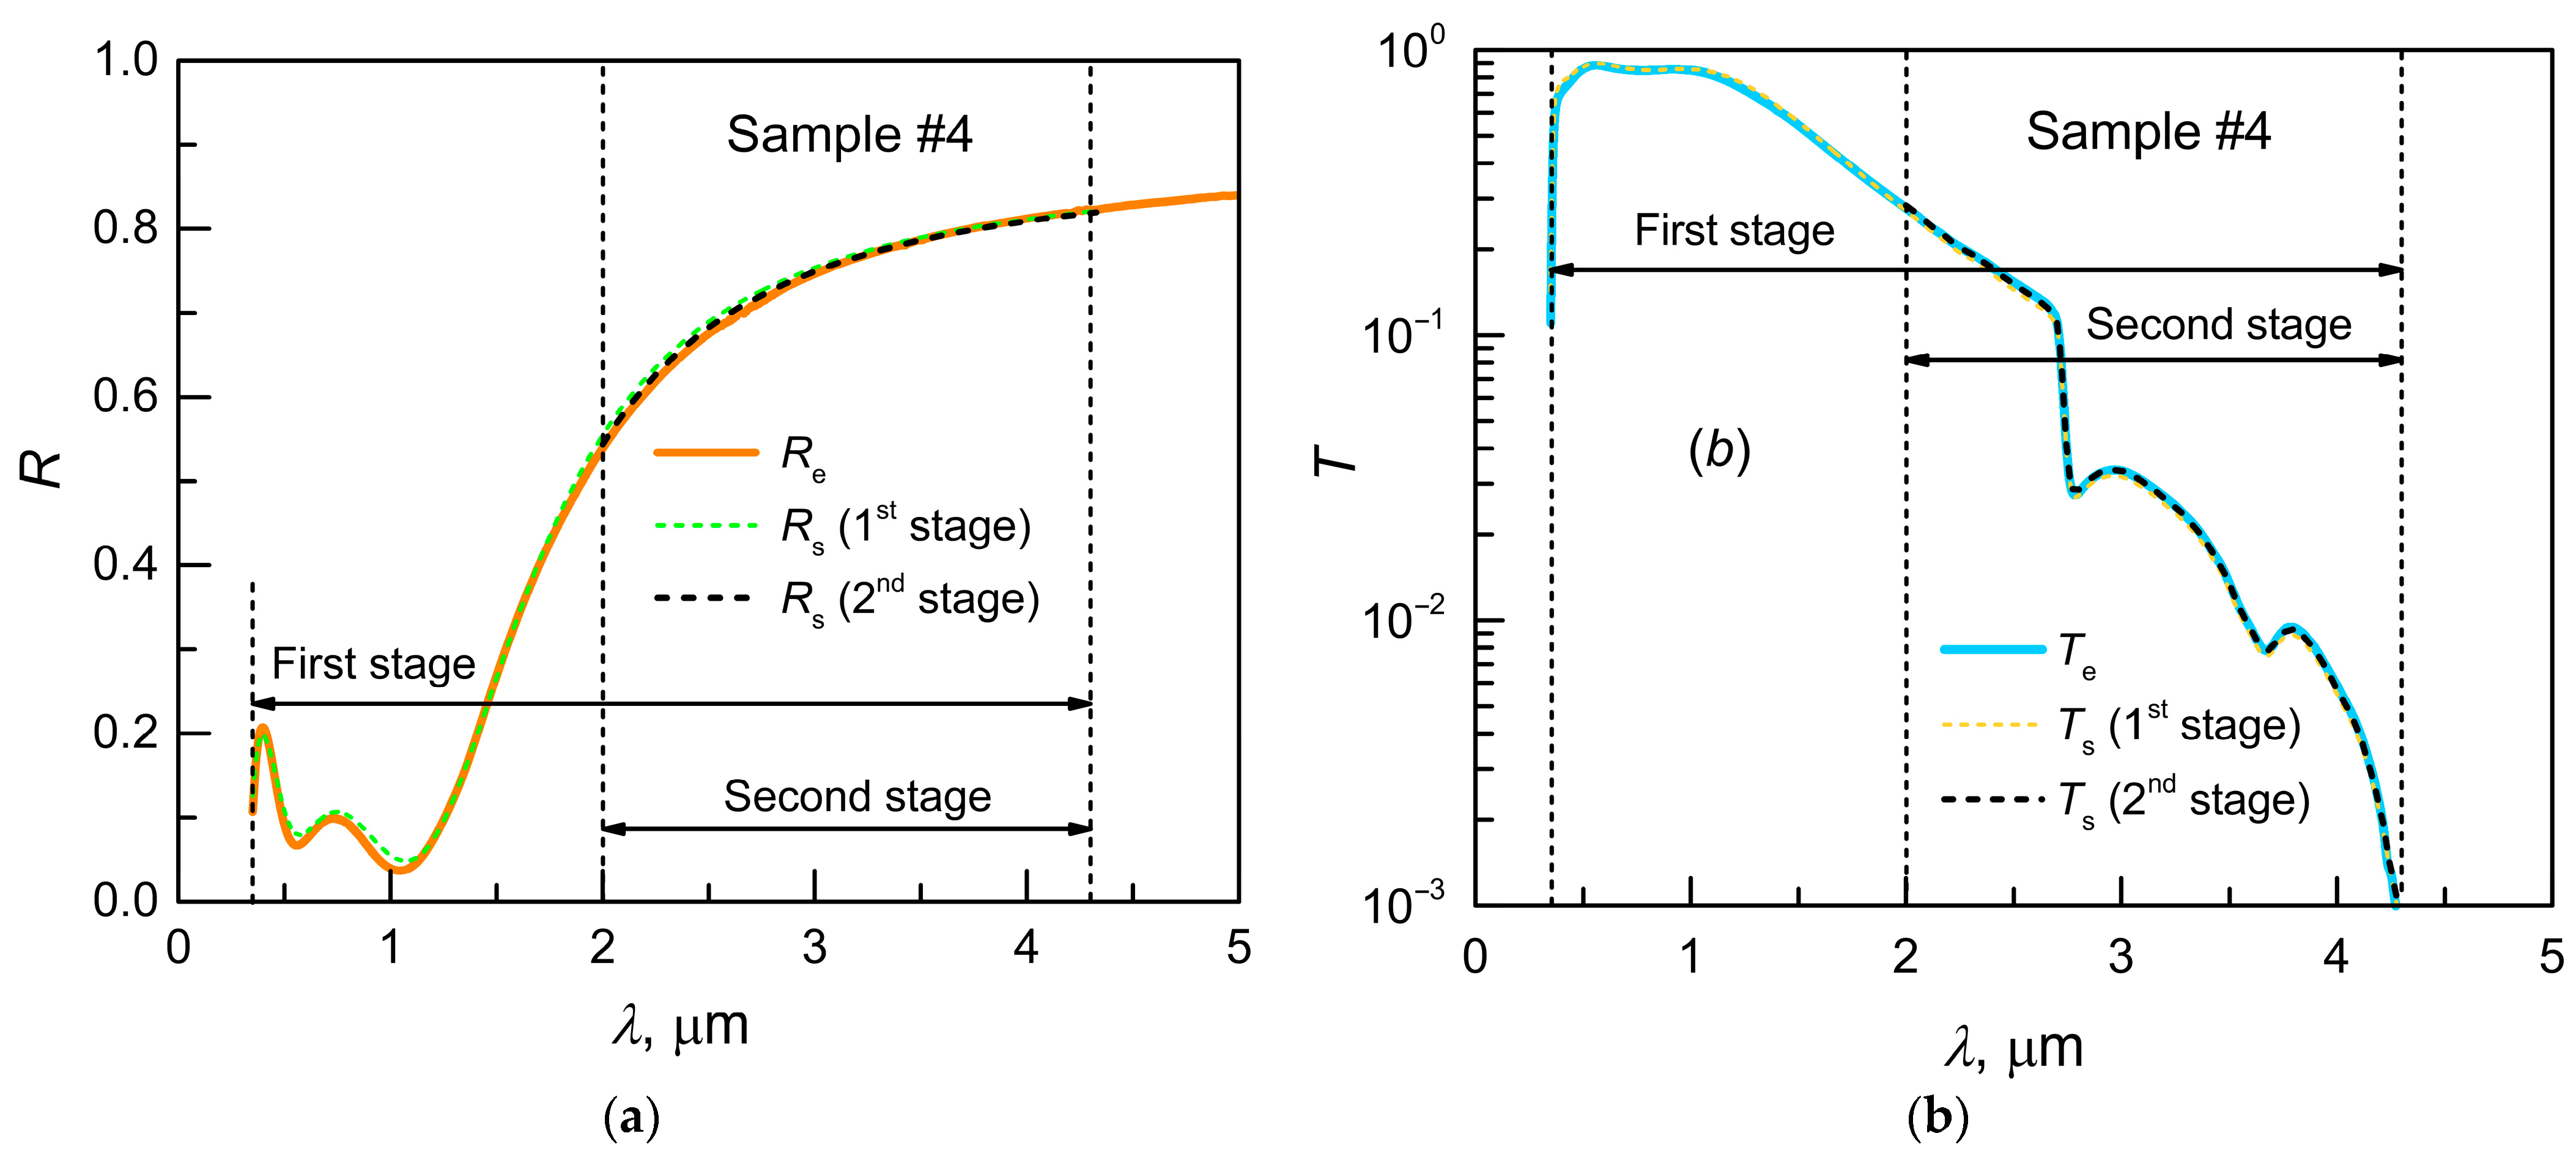
In Figure 9, for one of the samples, the experimental transmission and reflection spectra in the optical range are compared with the model spectra after the first and second fitting stages. We emphasize that at wavelengths of 2.0 μm < λ < 4.3 μm, the second fitting stage provides better agreement between the model spectra and the experimental ones compared to the first stage.
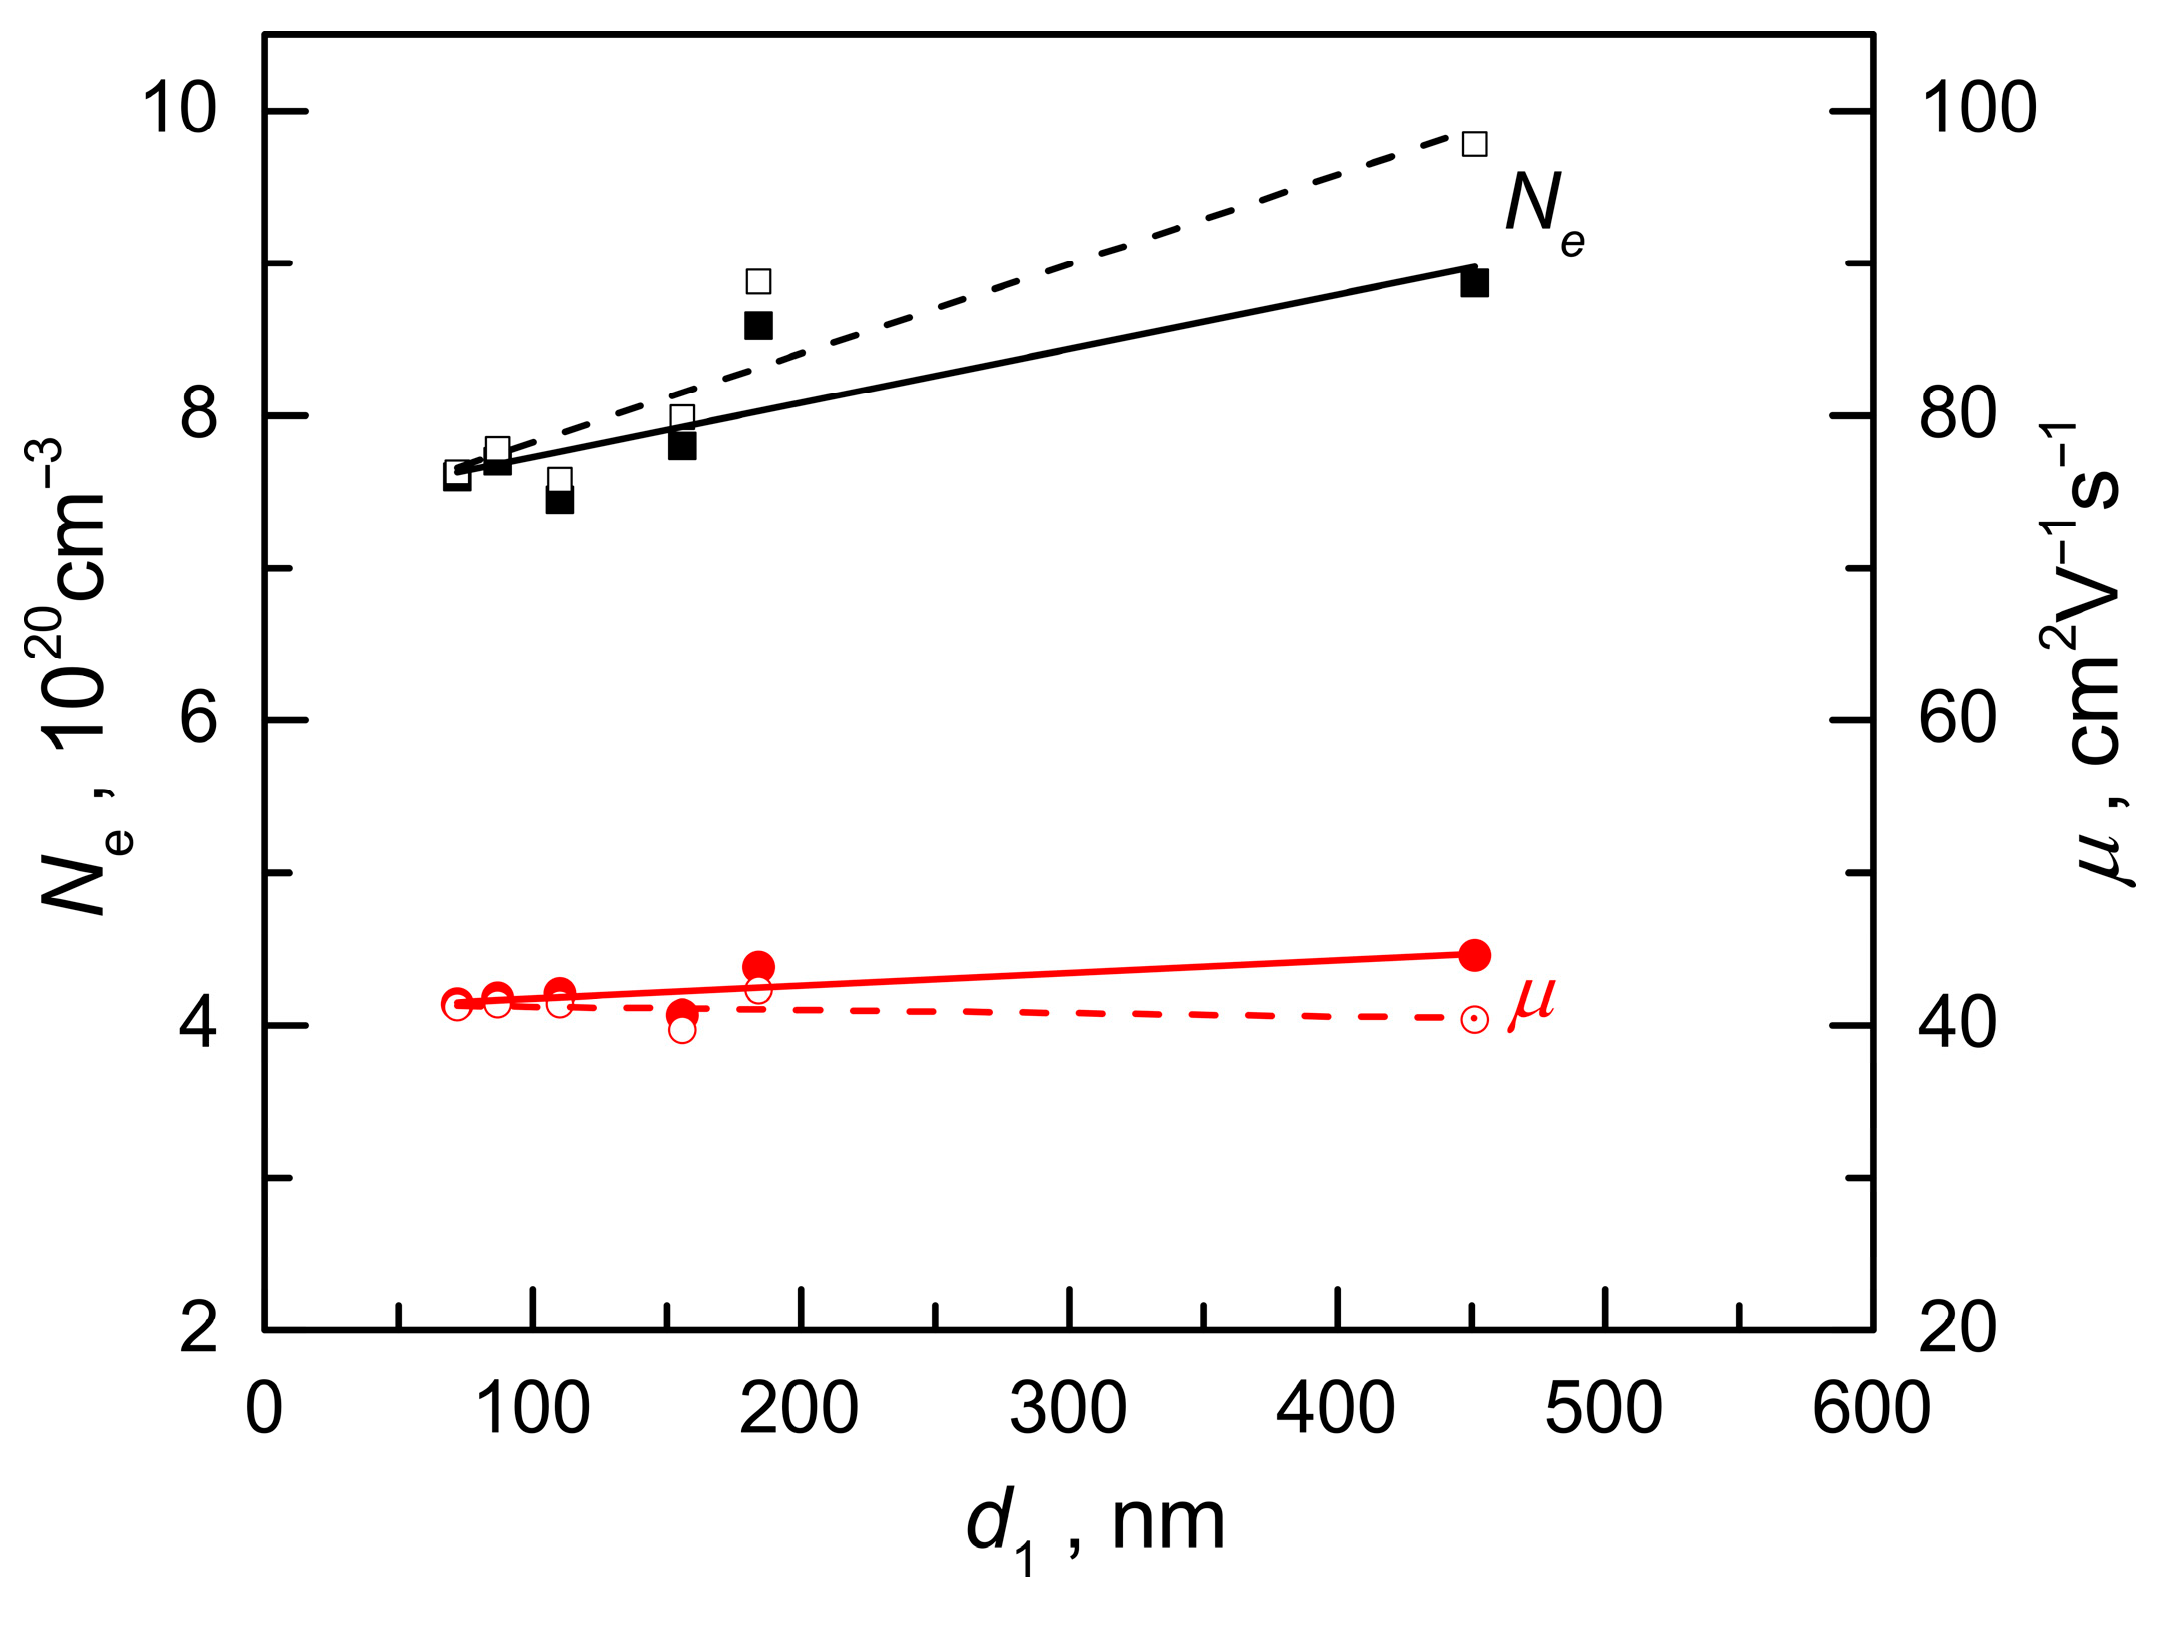
Figure 10 illustrates the results of determining the concentration and mobility of free electrons in ITO films of various thicknesses after the first and second stages of the fitting procedure. For films with a thickness of ~150 μ m or less, the second stage of fitting provides values of N e and μ close to the results of the first stage of fitting. This is due to the fact that in thin films, the short-wavelength tail of light absorption on free electrons at λ < 2 π c / E F   ≈ 1.3 µm is very weak and has little effect on the dependence of the objective function Z O p t on the electron concentration N e . However, for thicker films, the first stage of fitting provides an overestimated value of the electron concentration (up to 10%), as well as an underestimated value of electron mobility (up to −10%). Obviously, this is due to the inaccuracy of using the Drude model in the short-wavelength part of the optical range, which is included in the first stage of transmittance and reflectivity spectra analysis. Therefore, we considered the values of N e and μ obtained at the first stage of fitting asa first approximation and took the values of N e and μ obtained at the second stage of fitting as the true values of the electron concentration and their mobility.
At the second stage, high accuracy in determining concentration and mobility was ensured by analyzing the transmittance and reflectivity spectra of samples only in the range where the criterion of applicability of the Drude model for the studied ITO films (λ > 2 µm) is obviously fulfilled.

6. Discussion of the Results

The results in Section 5 reveal the dependence of the electrophysical parameters of ITO films ( ρ s , N e , and μ ) on the film thickness. With decreasing thickness, there is a gradual decrease in both the concentration and mobility of electrons (see Figure 10). In the thinnest films, the electron concentration averaged over the film thickness is lower by ~17%, and the average mobility is lower by ~8% than in the thickest ones. This is probably due to the fact that an electron-depleted layer appears near the film/glass interface, and electrons are scattered more strongly in this layer than in the film volume. Note that a decrease in electron mobility near the film/substrate boundary was previously observed in ITO films grown on quartz and silicon [39,46].
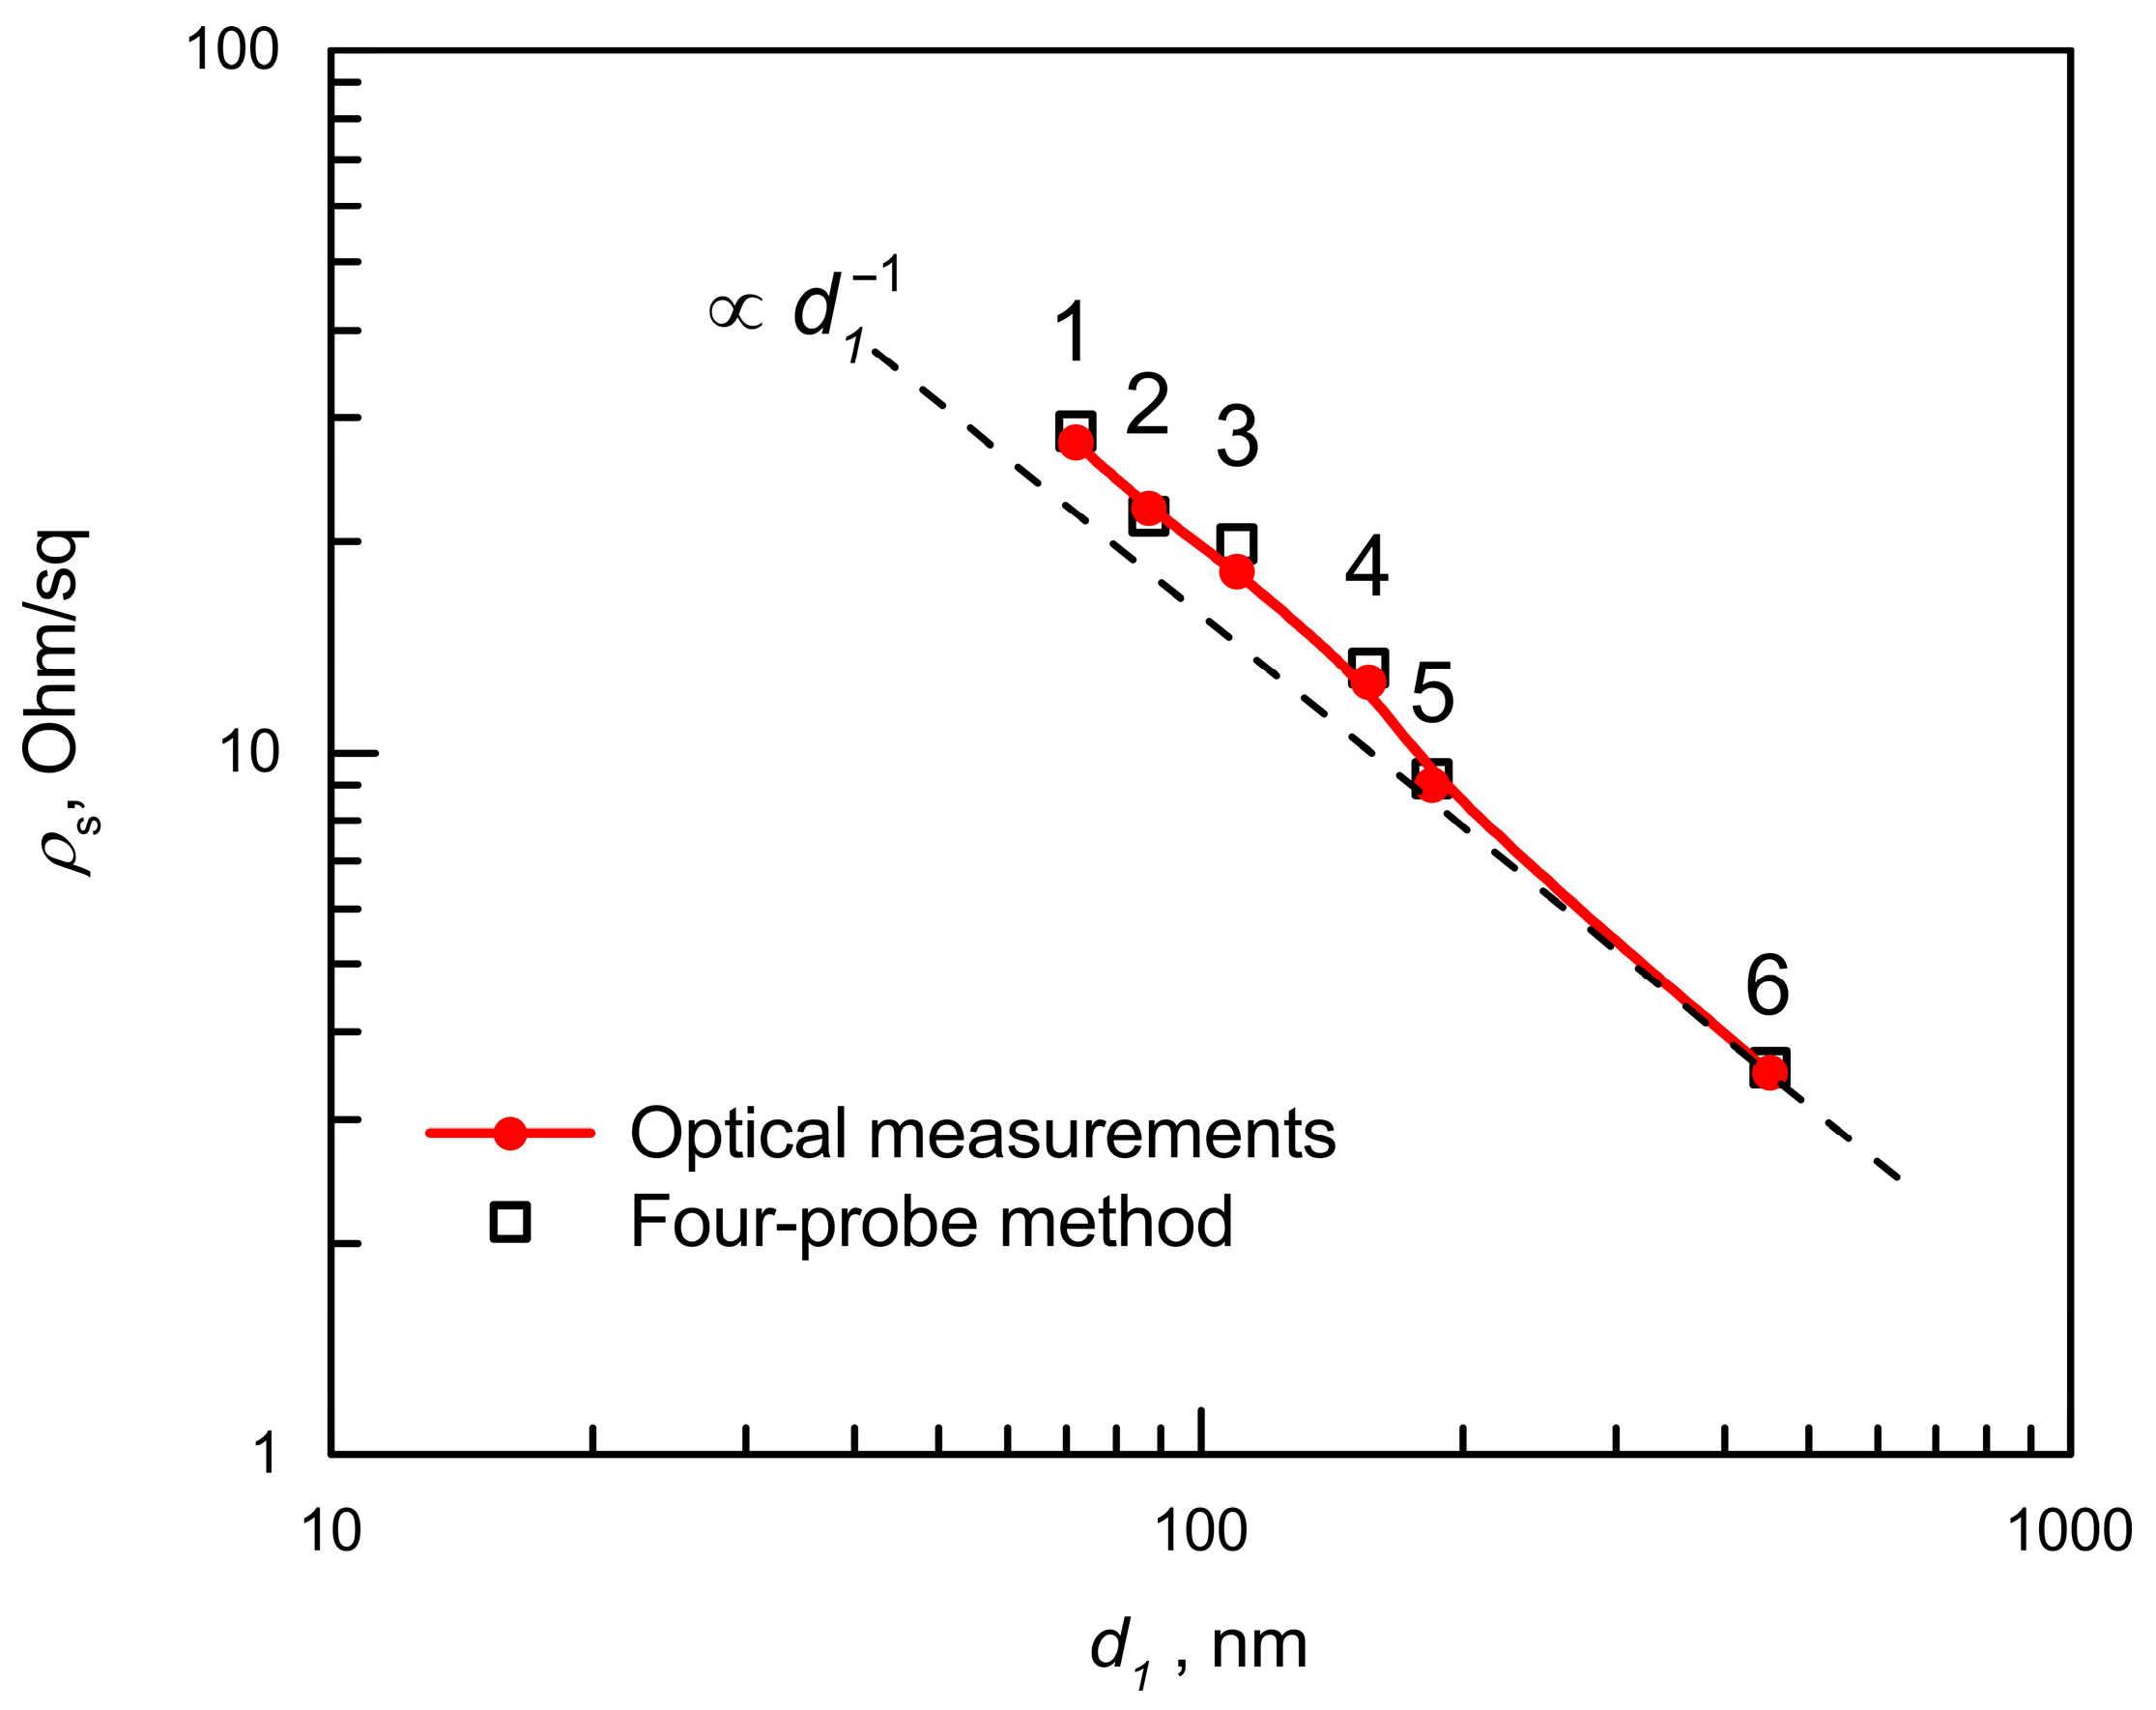
The sheet resistivity of the ITO films versus the film thickness is shown in Figure 11. The DC sheet resistivity ρ s for a film of thickness d 1 and the DC volume resistivity ρ = 1 / ( e μ N e ) are related by the obvious relationship: ρ s ( d 1 ) = ρ / d 1 . Consequently, for films with the same value of ρ , a hyperbolic dependence of ρ s on the film thickness should be observed. Our studies of films with thicknesses from 72 to 451 nm demonstrate that the ρ s ( d 1 ) dependence deviates from the hyperbolic one (which is represented by a straight line in a double logarithmic scale; see Figure 11). As can be seen from the figure, the thinnest films are characterized by a higher value of DC volume resistivity than the thickest ones (by ~26%). This pattern is consistent with the above-mentioned effect of the film/glass interface on the average electron concentration (up to +17%) and the average mobility (up to +8%). Increase in the DC volume resistivity with decreasing film thickness was previously observed in the ITO films deposited on acrylics [17].
It should be noted that the concentration and mobility of electrons in ITO films are often determined using studies of electrical conductivity and the Hall effect [39,46,47]. Let us compare this method with our non-contact method in terms of measurement accuracy. For instance, in [46], Ohmic contact electrodes with a Hall bar geometry were fabricated on the ITO film surface. In films with a surface electron concentration of (2.0–2.9) × 1014 cm−2, an accuracy of ±1.6% was obtained in determining the volume concentration and ±1.5% in determining the mobility. Our method for similar films provides higher accuracy in determining N e (±0.6%), but it loses accuracy in determining μ (±4.8%).
To reduce the influence of contacts on the results of electrical conductivity and Hall effect measurements in conducting films, the four-probe method in collinear or van der Pauw geometry is used, or a Hall bar is formed on the film surface. However, it is not possible to completely exclude the influence of contacts; the dimensions of the contacts and the shape/dimensions of the samples are critical. For conducting contact electrophysical measurements, witness samples are usually used, since during such measurements, the films lose their as-grown condition.
Non-destructive non-contact methods for determining the free electron parameters are preferable. Their use does not require witness samples, and there are no restrictions on the shape of the samples. The localization of the optical testing area and its size and shape can vary. Using a small diameter of an optically tested area, it is possible to study the film inhomogeneity. The methods we have developed are non-contact methods and have the listed advantages. Let us compare the performance of our method and the spectroscopic ellipsometry method, which is widely used for studying transparent conducting oxides, in particular ITO [39,47,48,49,50,51]. In [47], the spectra of the refractive index and extinction coefficient in the wavelength range 0.2–1.7 μm were obtained by ellipsometry. Based on the analysis of the obtained spectra, the electron concentration and mobility were determined. It was demonstrated that the results obtained by the optical method are in quasiperfect agreement with the results of the resistivity and Hall effect measurements (>90% correlation). Data on the accuracy of parameter determination are not provided. Fujiwara and Kondo [51] achieved excellent agreement between carrier concentrations determined by spectroscopic ellipsometry and Hall measurements. The optical mobility in ITO films, however, showed poor agreement with the Hall mobility.
In [39], the authors studied the thickness dependence of the optical and electrical properties for ITO films with thickness in the range from 10 to 100 nm. Spectroscopic ellipsometry was used to obtain the complex permittivity of the ITO films in the wavelength range of 0.5–12 μm. Additionally, the sheet resistance and Hall effect in the van der Pauw configuration were measured. The error in determining the electron concentration was 29% (by spectroscopic ellipsometry) and 5% (by Hall measurements), and the discrepancy between the results of the two methods did not exceed the measurement error. With film thicknesses of less than 100 nm, our method provides a significantly higher accuracy in determining N e : 0.7%. For mobility measurements, the absolute error of electrical measurements was 2.5 cm2/(V × s), which is comparable to our results of 2 cm2/(V × s) with a film thickness of less than 100 nm. High accuracy in determining electron concentration (~1%) and mobility (~2%) was achieved in ellipsometric studies of ITO films with a thickness of 20–250 nm in [48,49].
In the paper [50], spectroscopic ellipsometry was used to measure ITO film thickness. For films with a thickness of ~20 nm, the absolute error in thickness measurement was ~1 nm. Note that our method provides the same accuracy for films with a thickness of less than 100 nm.
The high accuracy of our concentration measurement method is based on the fact that the value of N e is extracted from the analysis of the reflection and transmission spectra in the plasma edge region at wavelengths where the Drude model is obviously applicable to describe the contribution of free electrons to the dielectric constant.
The method proposed in this paper for determining the parameters of ITO films can be used in the development of filters that suppress radio frequency interference in optoelectronic devices. Preliminary experiments have shown that ITO films with high transparency in the entire visible spectral range (~80% for the ITO/K108 glass filters) can provide microwave shielding effectiveness above 26 dB in the frequency range 2.8–23 GHz [19]. Similar effectiveness for a film in the form of ITO/Cu-doped Ag/ITO deposited on a polyethylene terephthalate (PET) substrate was also demonstrated over a broadband radiofrequency range [3]. As shown in [17], microwave shielding effectiveness increases with the thickness of the ITO film, and it is almost entirely determined by reflection losses. The contribution of absorption losses is negligible.
Note that the algorithm for theoretical modeling of the transmittance spectrum, discussed in Section 4, allows us to obtain the frequency dependence of microwave shielding effectiveness for a given value of the DC sheet resistivity of the ITO film. The latter parameter can be experimentally determined for ITO-based microwave shielding filters of a small diameter using the non-destructive non-contact method described in Section 5.1. This, in principle, avoids direct measurement of the microwave shielding effectiveness, which would require depositing an identical ITO film on a substrate with a large diameter (20 cm or more) and using sophisticated equipment for measurements in the gigahertz range.

7. Summary

The interaction of electromagnetic radiation with ITO films in the optical and terahertz spectral ranges was studied experimentally and theoretically. The object of the study was ITO films of various thicknesses (70–500 nm) grown on a borosilicate glass substrate.
Using a diffraction spectrometer and a Fourier spectrometer, the spectra of the transmittance and reflectivity of samples in the optical range from ultraviolet to the far infrared region (wavelengths 0.2–400 μm) were experimentally obtained. A plasma minimum with a reflectivity of less than 0.1 was detected on the reflection spectra of all samples. For radiation with a wavelength shorter than the wavelength of the plasma minimum, ITO films had high transmittance, which made it possible to observe Fabry–Pérot oscillations on the transmittance and reflectivity spectra. The oscillation period decreased with increasing thickness of the ITO film. At long wavelengths (in the region beyond the plasma edge), the transmittance of the samples decreased sharply with wavelength (and the reflection increased sharply), which is associated with an increase in free-electron absorption.
Experiments in the terahertz range (wavelengths from 150 to 3000 μm) were performed using terahertz time domain spectroscopy. The experiments show that for different ITO films deposited on identical substrates, the terahertz transmittance spectra have a universal character: they differ from each other only by a scaling factor. The dependence of this multiplier on the DC sheet resistivity of the film is close to quadratic.
All the patterns observed in the experiment found an adequate quantitative description within the framework of the considered theoretical models. To describe the dielectric constant of the conductive ITO film, the Drude model, with such parameters as the concentration and mobility of free electrons, was used. Firstly, the transmittance and reflectivity spectra for a free-standing ITO film of a given thickness were modeled using Airy formulas. Secondly, using the transfer matrix method, similar spectra were modeled for an ITO film deposited on the surface of a borosilicate glass plate.
Based on the results of experimental studies and theoretical modeling, a non-contact method for determining DC sheet resistivity based on the analysis of THz transmittance spectra has been developed. This method is of great importance, since it is the value of the DC sheet resistivity that determines the effectiveness of electromagnetic interference suppression in the microwave range. In addition, an optical method was developed for the separate determination of three parameters of ITO films (film thickness, electron concentration and electron mobility) that determine the value of the DC sheet resistivity.
For films with a thickness of 70–500 nm, the error in determining the thickness does not exceed 3 nm. The error in determining the DC sheet resistivity for films with a thickness of less than 100 nm is ~3%, and with an increase in film thickness to 500 nm, it increases to 9%. The error in determining the concentration and mobility of electrons varies in the range of 1–5% and 5–14%, respectively, depending on the thickness of the film. The specified characteristics are related to the tested film area of 10 mm in diameter. The developed methods are non-destructive, and this is their important advantage.
The research results can be used to develop transparent conducting coatings for optoelectronic devices in order to protect them from electromagnetic interference in the microwave range.

Supplementary Materials

The following supporting information can be downloaded at: https://www.mdpi.com/article/10.3390/app15169121/s1, Section S1: Determination of the measurement error of the DC sheet resistivity of ITO films; Section S2: Determination of the measurement error of ITO film thickness; Section S3: Determination of the measurement error of the free electron concentration in ITO films.

Author Contributions

Conceptualization, V.A.S. and G.I.K.; Data curation, V.V.B. and A.A.S.; Formal analysis, V.A.S. and V.V.B.; Software, V.V.B.; Investigation, V.V.B. and A.A.S.; Methodology, V.A.S., V.V.B. and A.A.S.; Project administration, G.I.K.; Supervision, G.I.K.; Writing—original draft, V.A.S. and V.V.B.; Writing—review and editing, V.A.S. and G.I.K. All authors have read and agreed to the published version of the manuscript.

Funding

The work was performed using the facilities and resources of Tydex LLC. The author V.A.S. thanks the Ministry of Science and Higher Education of the Russian Federation for financial support (state assignment FSEG-2023-0016).

Institutional Review Board Statement

Not applicable.

Informed Consent Statement

Not applicable.

Data Availability Statement

The original contributions presented in the study are included in the article and Supplementary Materials; further inquiries can be directed to the corresponding authors.

Acknowledgments

The authors thank Valentin S. Sokolov for his help with the terahertz transmittance measurements.

Conflicts of Interest

Author Alexey A. Shakhmin and Grigory I. Kropotov were employed by the company TYDEX LLC. The remaining authors declare that the research was conducted in the absence of any commercial or financial relationships that could be construed as a potential conflict of interest.

Abbreviations

The following abbreviations are used in this manuscript:
DCDirect Current
FIRFar Infra-Red
ITOIndium Tin Oxide
MIRMid Infra-Red
NIRNear Infra-Red
SEMScanning Electron Microscope
TDSTime Domain Spectroscopy

References

  1. Khodzitsky, M.K.; Bassarab, V.V.; Shakhmin, A.A.; Sokolov, V.S.; Kropotov, G.I. The Electromagnetic Shielding of Optoelectronic Devices by Mesh Structures. Appl. Sci. 2021, 11, 9841. [Google Scholar] [CrossRef]
  2. Batrakov, K.; Kuzhir, P.; Maksimenko, S.; Paddubskaya, A.; Voronovich, S.; Kaplas, T.; Svirko, Y. Enhanced microwave shielding effectiveness of ultrathin pyrolytic carbon films. Appl. Phys. Lett. 2013, 103, 073117. [Google Scholar] [CrossRef]
  3. Wang, H.; Ji, C.; Zhang, C.; Zhang, Y.; Zhang, Z.; Lu, Z.; Tan, J.; Guo, L.J. Transparent ultrathin doped silver film for broadband electromagnetic interference shielding. In Proceedings of the IEEE MTT-S International Microwave Workshop Series on Advanced Materials and Processes for RF and THz Applications (IMWS-AMP), Ann Arbor, MI, USA, 16–18 July 2018; pp. 1–3. [Google Scholar]
  4. Klein, C.A. Microwave shielding effectiveness of EC-coated dielectric slabs. IEEE Trans. Microw. Theory Tech. 1990, 38, 321–324. [Google Scholar] [CrossRef]
  5. Erdogan, N.; Erden, F.; Astarlioglu, A.T.; Ozdemir, M.; Ozbay, S.; Aygun, G.; Ozyuzer, L. ITO/Au/ITO multilayer thin films on transparent polycarbonate with enhanced EMI shielding properties. Curr. Appl Phys. 2020, 20, 489–497. [Google Scholar] [CrossRef]
  6. González, M.; Pozuelo, J.; Baselga, J. Electromagnetic shielding materials in GHz range. Chem. Rec. 2018, 18, 1000–1009. [Google Scholar] [CrossRef]
  7. Huang, J.-C. EMI shielding plastics: A review. Adv. Polym. Technol. 1995, 14, 137–150. [Google Scholar] [CrossRef]
  8. Stadler, A. Transparent Conducting Oxides—An Up-To-Date Overview. Materials 2012, 5, 661–683. [Google Scholar] [CrossRef] [PubMed]
  9. Granqvist, C.G.; Hultåker, A. Transparent and conducting ITO films: New developments and applications. Thin Solid Films 2002, 411, 1–5. [Google Scholar] [CrossRef]
  10. Kwak, D.-J.; Moon, B.H.; Lee, D.K.; Park, C.S.; Sung, Y.M. Comparison of transparent conductive indium tin oxide, titanium-doped indium oxide, and fluorine-doped tin oxide films for dye-sensitized solar cell application. J. Electr. Eng. Technol. 2011, 6, 684–687. [Google Scholar] [CrossRef]
  11. Yan, X.; Mont, F.W.; Poxson, D.J.; Schubert, M.F.; Kim, J.K.; Cho, J.; Schubert, E.F. Refractive-Index-Matched Indium–Tin-Oxide Electrodes for Liquid Crystal Displays. Jpn. J. Appl. Phys. 2009, 48, 120203. [Google Scholar] [CrossRef]
  12. Li, S.; Tian, M.; Gao, Q.; Wang, M.; Li, T.; Hu, Q.; Li, X.; Wu, Y. Nanometer-thin indium tin oxide for advanced high-performance electronics. Nat. Mater. 2019, 18, 1091–1097. [Google Scholar] [CrossRef]
  13. Pasquarelli, R.M.; Ginley, D.S.; O’Hayre, R. Solution processing of transparent conductors: From flask to film. Chem. Soc. Rev. 2011, 40, 5406. [Google Scholar] [CrossRef] [PubMed]
  14. Si, M.; Andler, J.; Lyu, X.; Niu, C.; Datta, S.; Agrawal, R.; Ye, P.D. Indium–tin-oxide transistors with one nanometer thick channel and ferroelectric gating. ACS Nano 2020, 14, 11542–11547. [Google Scholar] [CrossRef] [PubMed]
  15. Yi, F.; Shim, E.; Zhu, A.Y.; Zhu, H.; Reed, J.C.; Cubukcu, E. Voltage tuning of plasmonic absorbers by indium tin oxide. Appl. Phys. Lett. 2013, 102, 221102. [Google Scholar] [CrossRef]
  16. Zhu, M.; Xiong, C.; Lee, Q. Research on ITO transparent electromagnetic shielding coatings for E-O system. In Proceedings of the 3rd International Symposium on Advanced Optical Manufacturing and Testing Technologies: Advanced Optical Manufacturing Technologies, Chengdu, China, 14 November 2007; Volume 6722, pp. 875–881. [Google Scholar]
  17. Huang, J.L.; Yau, B.S.; Chen, C.Y.; Lo, W.T.; Lii, D.F. The electromagnetic shielding effectiveness of indium tin oxide films. Ceram. Int. 2001, 27, 363–365. [Google Scholar] [CrossRef]
  18. Osipkov, A.; Makeev, M.; Garsiya, E.; Filyaev, A.; Sinyagaeva, K.; Kirillov, D.; Ryzhenko, D.; Yurkov, G. Radio-Shielding metamaterials transparent in the visible spectrum: Approaches to creation. In Proceedings of the IOP Conference Series: Materials Science and Engineering, Wrexham, UK, 22–26 June 2020; p. 012007. [Google Scholar]
  19. Kropotov, G.I.; Bassarab, V.V.; Shakhmin, A.A.; Sokolov, V.S.; Shalygin, V.A. Spectroscopy of ITO coatings in optical and microwave ranges. In Proceedings of the 49th International Conference on Infrared, Millimeter, and Terahertz Waves (IRMMW-THz), Perth, Australia, 1–6 September 2024; pp. 1–3. [Google Scholar]
  20. Zhao, H.; Ma, X.; Song, X.; Zheng, H.; Yan, H. Study on the optimization of wave absorption of glass substrate indium tin oxide film composite building materials. J. Mater. Sci. Mater. Electron. 2024, 35, 335. [Google Scholar] [CrossRef]
  21. Choi, Y.J.; Gong, S.C.; Johnson, D.C.; Golledge, S.; Yeom, G.Y.; Park, H.H. Characteristics of the electromagnetic interference shielding effectiveness of Al-doped ZnO thin films deposited by atomic layer deposition. Appl. Surf. Sci. 2013, 269, 92–97. [Google Scholar] [CrossRef]
  22. Choi, Y.J.; Kang, K.M.; Lee, H.S.; Park, H.H. Electromagnetic interference shielding behaviors of Zn-based conducting oxide films prepared by atomic layer deposition. Thin Solid Films 2015, 583, 226–232. [Google Scholar] [CrossRef]
  23. Kim, W.M.; Ku, D.Y.; Lee, I.K.; Seo, Y.W.; Cheong, B.K.; Lee, T.S.; Kim, I.; Lee, K.S. The electromagnetic interference shielding effect of indium–zinc oxide/silver alloy multilayered thin films. Thin Solid Films 2005, 473, 315–320. [Google Scholar] [CrossRef]
  24. Chen, Z.; Zhuo, Y.; Tu, W.; Li, Z.; Ma, X.; Pei, Y.; Wang, G. High mobility indium tin oxide thin film and its application at infrared wavelengths: Model and experiment. Opt. Express 2018, 26, 22123. [Google Scholar] [CrossRef]
  25. Maniyara, R.A.; Graham, C.; Paulillo, B.; Bi, Y.; Chen, Y.; Herranz, G.; Baker, D.E.; Mazumder, P.; Konstantatos, G.; Pruneri, V. Highly transparent and conductive ITO substrates for near infrared applications. APL Mater. 2021, 9, 021121. [Google Scholar] [CrossRef]
  26. Thirumoorthi, M.; Prakash, J.T.J. Structure, optical and electrical properties of indium tin oxide ultra thin films prepared by jet nebulizer spray pyrolysis technique. J. Asian Ceram. Soc. 2016, 4, 124–132. [Google Scholar] [CrossRef]
  27. Askari, H.; Fallah, H.; Askari, M.; Mohmmadieyh, M.C. Electrical and optical properties of ITO thin films prepared by DC magnetron sputtering for low-emitting coatings. Mater. Sci. 2014. [Google Scholar] [CrossRef]
  28. Ananthanarayanan, D.; Leon, J.J.D.; Wong, J.; Nicolay, S.; Aberle, A.G.; Ho, J.W. Mid-infrared characterization and modelling of transparent conductive oxides. Sol. Energy 2020, 209, 424–430. [Google Scholar] [CrossRef]
  29. Kim, J.; Shrestha, S.; Souri, M.; Connell, J.G.; Park, S.; Seo, A. High-temperature optical properties of indium tin oxide thin-films. Sci. Rep. 2020, 10, 12486. [Google Scholar] [CrossRef] [PubMed]
  30. Ahmed, N.M.; Sabah, F.A.; Abdulgafour, H.I.; Alsadig, A.; Sulieman, A.; Alkhoaryef, M. The effect of post annealing temperature on grain size of indium-tin-oxide for optical and electrical properties improvement. Results Phys. 2019, 13, 102159. [Google Scholar] [CrossRef]
  31. Sahoo, A.K.; Au, W.-C.; Pan, C.-L. Characterization of Indium Tin Oxide (ITO) Thin Films towards Terahertz (THz) Functional Device Applications. Coatings 2024, 14, 895. [Google Scholar] [CrossRef]
  32. Bassarab, V.V.; Shalygin, V.A.; Shakhmin, A.A.; Sokolov, V.S.; Kropotov, G.I. Spectroscopy of a borosilicate crown glass in the wavelength range of 0.2 µm–15 cm. J. Opt. 2023, 25, 065401. [Google Scholar] [CrossRef]
  33. Kropotov, G.I.; Shakhmin, A.A.; Kaplunov, I.A.; Rogalin, V.E. Application of Spectral Devices in the Optical Engineering and Scientific Research. Photonics Russ. 2023, 5, 378–392. [Google Scholar] [CrossRef]
  34. Seeger, K. Semiconductor Physics: An Introduction, 9th ed.; Springer: Berlin/Heidelberg, Germany, 2004; pp. 35–46. ISBN 978-3-642-06023-6. [Google Scholar]
  35. Qiao, Z.; Latz, R.; Mergel, D. Thickness dependence of In2O3:Sn film growth. Thin Solid Films 2004, 466, 250–258. [Google Scholar] [CrossRef]
  36. Ukhanov, Y.I. Optical Properties of Semiconductors; Nauka: Moscow, Russia, 1977. (In Russian) [Google Scholar]
  37. Hamberg, I.; Granqvist, C.; Berggren, K.; Sernelius, B.; Engström, L. Bandgap Widening in Heavily Sn-Doped In2O3. Phys. Rev. B. 1984, 30, 3240–3249. [Google Scholar] [CrossRef]
  38. Hillier, J.A.; Camelio, S.; Cranton, W.; Nabok, A.V.; Mellor, C.J.; Koutsogeorgis, D.C.; Kalfagiannis, N. When ellipsometry works best: A case study with transparent conductive oxides. ACS Photonics 2020, 7, 2692–2702. [Google Scholar] [CrossRef]
  39. Cleary, J.W.; Smith, E.M.; Leedy, K.D.; Grzybowski, G.; Guo, J. Optical and electrical properties of ultra-thin indium tin oxide nanofilms on silicon for infrared photonics. Opt. Mater. Express 2018, 8, 1231–1245. [Google Scholar] [CrossRef]
  40. Shalygin, V.A.; Moldavskaya, M.D.; Panevin, V.Y.; Galimov, A.I.; Melentev, G.A.; Artemyev, A.A.; Firsov, D.A.; Vorobjev, L.E.; Klimko, G.V.; Usikova, A.A.; et al. Interaction of surface plasmon-phonon polaritons with terahertz radiation in heavily doped GaAs epilayers. J. Phys. Condens. Matter 2019, 31, 105002. [Google Scholar] [CrossRef] [PubMed]
  41. Uprety, P.; Junda, M.M.; Salmon, H.; Podraza, N.J. Understanding near Infrared Absorption in Tin Doped Indium Oxide Thin Films. J. Phys. D Appl. Phys. 2018, 51, 295302. [Google Scholar] [CrossRef]
  42. Katsidis, C.C.; Siapkas, D.I. General transfer-matrix method for optical multilayer systems with coherent, partially coherent, and incoherent interference. Appl. Opt. 2002, 41, 3978. [Google Scholar] [CrossRef] [PubMed]
  43. Kim, J.; Jung, S.; Jeong, I. Optical modeling for polarization-dependent optical power dissipation of thin-film organic solar cells at oblique incidence. J. Opt. Soc. Korea 2012, 16, 6–12. [Google Scholar] [CrossRef]
  44. Adamov, R.B.; Pashnev, D.; Shalygin, V.A.; Moldavskaya, M.D.; Vinnichenko, M.Y.; Janonis, V.; Jorudas, J.; Tumėnas, S.; Prystawko, P.; Krysko, M.; et al. Optical performance of two dimensional electron gas and GaN:C buffer layers in AlGaN/AlN/GaN heterostructures on SiC substrate. Appl. Sci. 2021, 11, 6053. [Google Scholar] [CrossRef]
  45. Gao, F.; Han, L. Implementing the Nelder-Mead simplex algorithm with adaptive parameters. Comput. Optim. Appl. 2012, 51, 259. [Google Scholar] [CrossRef]
  46. Liu, X.; Kang, J.H.; Yuan, H.; Park, J.; Cui, Y.; Hwang, H.Y.; Brongersma, M.L. Tuning of plasmons in transparent conductive oxides by carrier accumulation. ACS Photonics 2018, 5, 1493–1498. [Google Scholar] [CrossRef]
  47. Gui, Y.; Miscuglio, M.; Ma, Z.; Tahersima, M.H.; Sun, S.; Amin, R.; Dalir, H.; Sorger, V.J. Towards integrated metatronics: A holistic approach on precise optical and electrical properties of Indium Tin Oxide. Sci. Rep. 2019, 9, 11279. [Google Scholar] [CrossRef]
  48. Inritsapong, Y.; Chindaudom, P.; Nuntawong, N.; Patthanasetthakul, V.; Horphathum, M.; Eiamchai, P.; Pokaipisit, A.; Limsuwan, P. Post-annealing effects on the structural, optical and electrical properties of ito films studied by spectroscopic ellipsometry. Mod. Phys. Lett. B 2010, 24, 595–605. [Google Scholar] [CrossRef]
  49. Hinrichs, K.; Furchner, A.; Rappich, J.; Oates, T.W. Polarization-dependent and ellipsometric infrared microscopy for analysis of anisotropic thin films. J. Phys. Chem. C 2013, 117, 13557–13563. [Google Scholar] [CrossRef]
  50. Rasheed, M.; Barillé, R. Optical constants of DC sputtering derived ITO, TiO2 and TiO2: Nb thin films characterized by spectrophotometry and spectroscopic ellipsometry for optoelectronic devices. J. Non Cryst. Solids 2017, 476, 1–14. [Google Scholar] [CrossRef]
  51. Fujiwara, H.; Kondo, M. Effects of carrier concentration on the dielectric function of ZnO: Ga and In2O3:Sn studied by spectroscopic ellipsometry: Analysis of free-carrier and band-edge absorption. Phys. Rev. B Condens. Matter 2005, 71, 075109. [Google Scholar] [CrossRef]
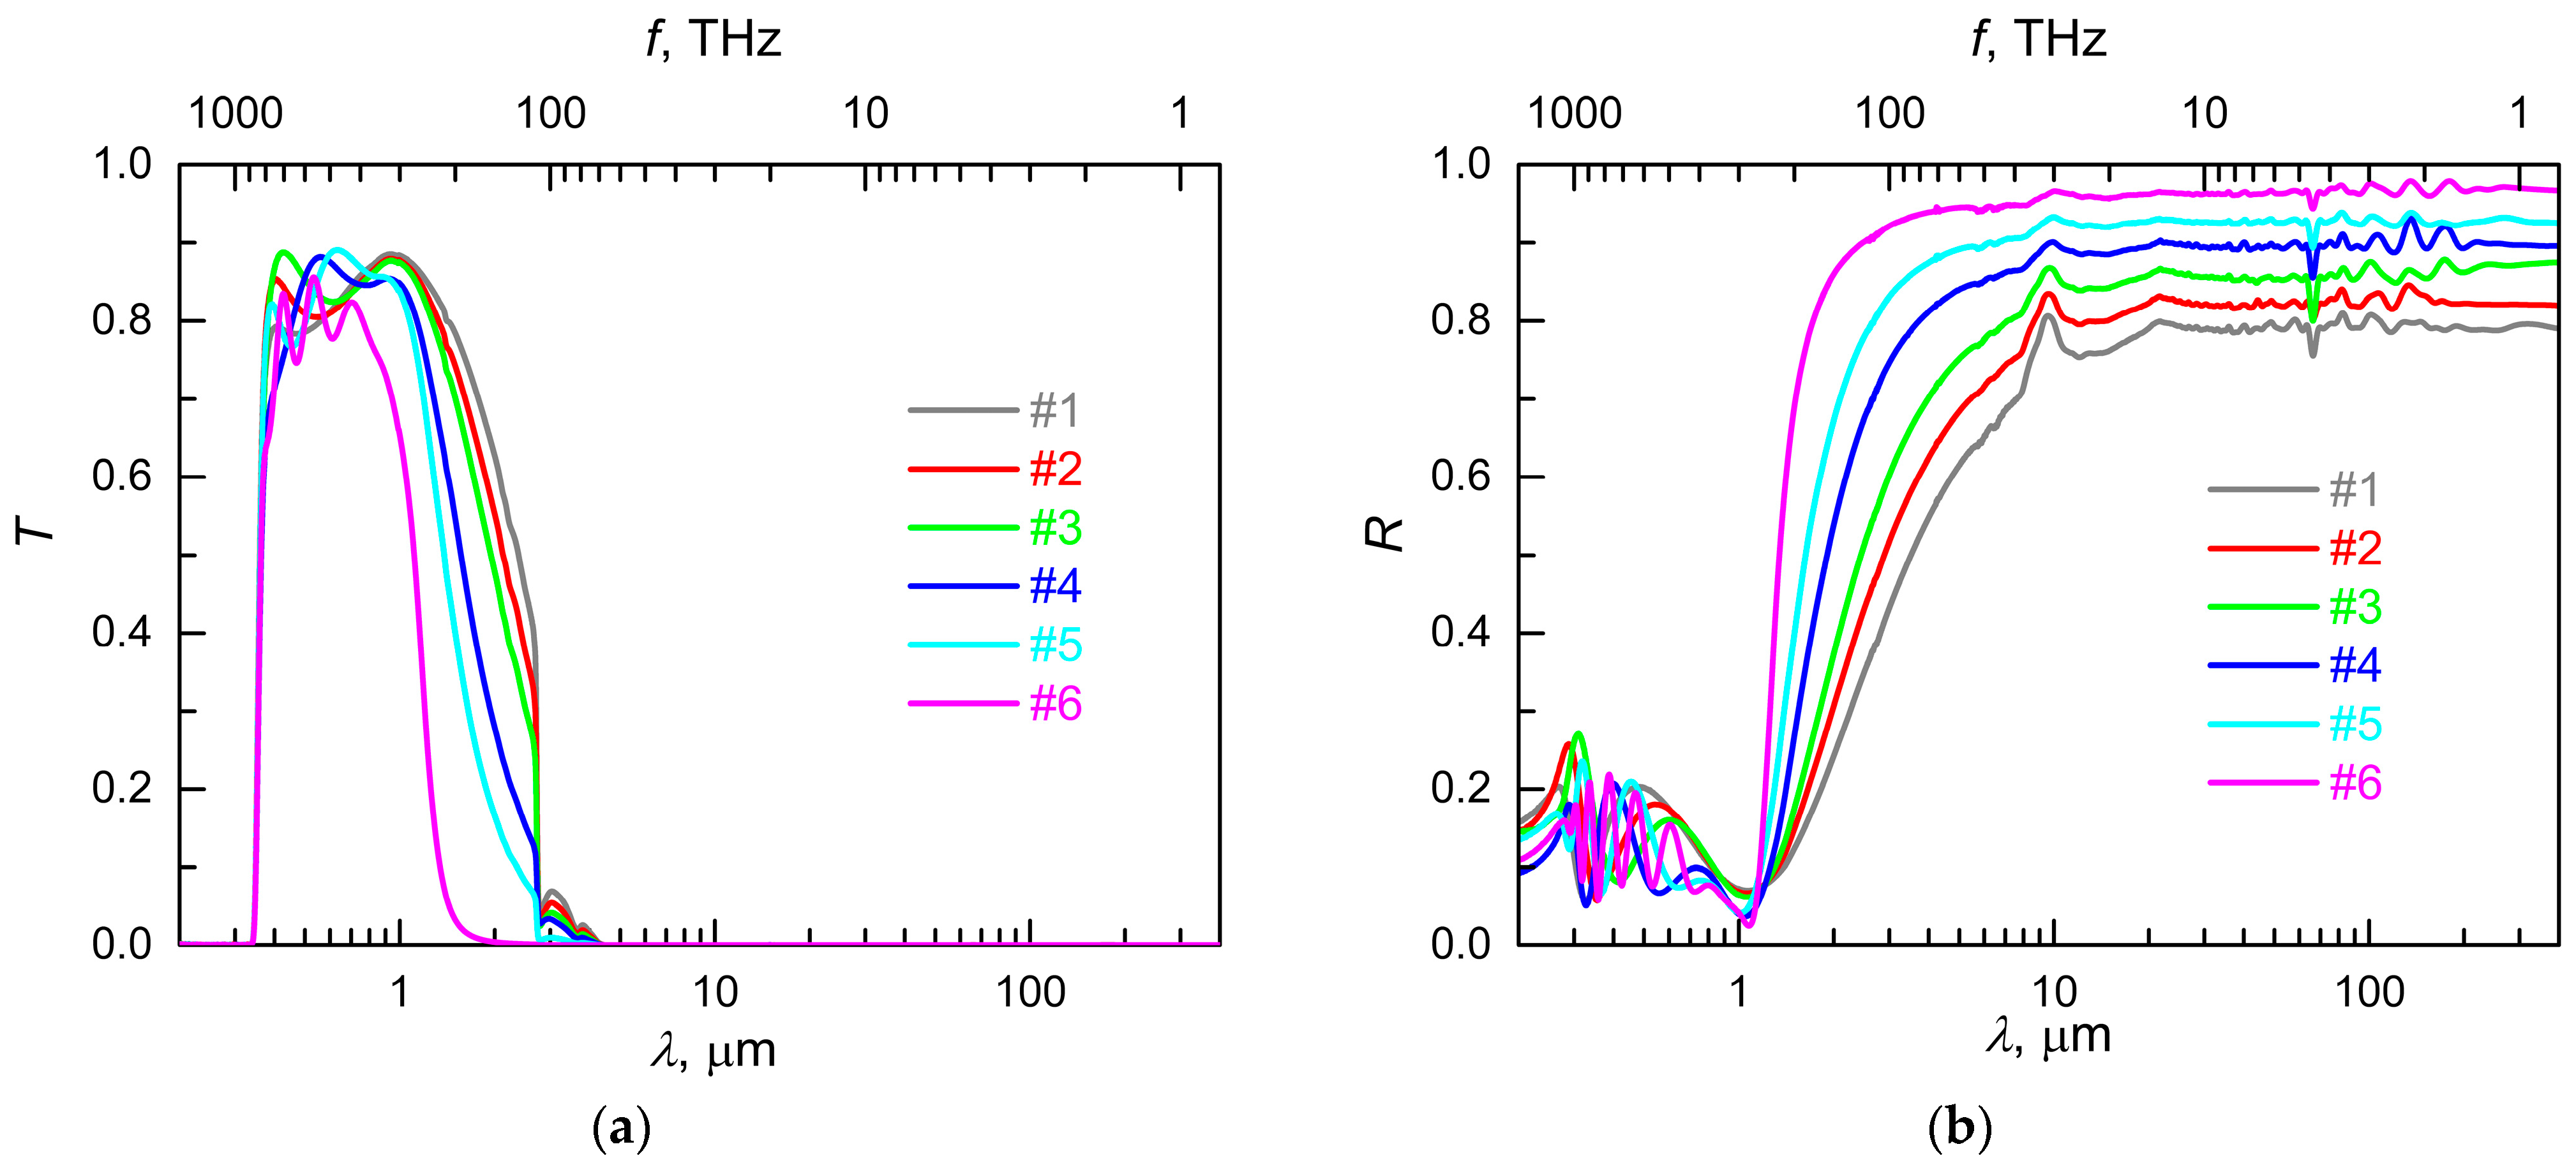
Figure 1. Experimental spectra of the transmittance (a) and reflectivity (b) for different samples in the optical spectral range. The curve numbers correspond to the sample numbers.
Applsci 15 09121 g001
Figure 2. Experimental single-pass transmittance spectra for all samples in the THz spectral range. The curve numbers correspond to the sample numbers.
Applsci 15 09121 g002
Figure 3. (a) Spectra of the refractive index n 1 , extinction coefficient k 1 and absorption coefficient α 1 of the free-standing ITO film. Simulation at d 1 = 400 nm, N e = 9 × 1020 cm−3, and μ = 40 cm2/(V × s). The area of strong absorption is shown by the yellow filling. (b) The transmittance T F and reflectivity R F spectra of the free-standing ITO film simulated at the same parameters. A dashed line demonstrates reflectivity r for the ITO/vacuum interface. (c) Single-pass attenuation factor e x p ( α d ) versus wavelength for a film of thickness d. Simulation for the film thicknesses listed in Table 1. A horizontal dashed line indicates the attenuation level corresponding to the condition α 1 d 1 = 1 . A vertical dashed line indicates the wavelength corresponding to the Fermi energy.
Applsci 15 09121 g003
Figure 4. The transmittance of electromagnetic radiation in the long-wave limit ( λ ) for the free-standing ITO film and for the ITO film/K108 glass structure with a glass thickness of 3 mm vs. the DC sheet resistivity of the film.
Applsci 15 09121 g004
Figure 5. A schematic representation of forward- and backward-propagating electromagnetic waves in the examined structure. The ITO film thickness d 1 varies in different samples (see Table 1).
Applsci 15 09121 g005
Figure 6. The spectral dependence of normalized THz single-pass transmittance t ( λ ) =   T ( λ ) / T for ITO film/K108 glass structures. The calculation was performed for a glass thickness of 3 mm and films with DC sheet resistivity of 3, 10 and 30 Ohm/sq.
Applsci 15 09121 g006
Figure 8. Deviation of the ITO film thickness measured using the SEM method ( d S E M ) from the thickness obtained by the non-contact optical method proposed in the present work ( d 1 ). The numbers next to the experimental points indicate the sample numbers. The error bars denote the average thickness fluctuations for a set of SEM images (up to 10 tested points) in the central film area with a diameter of 10 mm. The error in determining the value of d 1 does not exceed the radius of the circles. The dashed line corresponds to the equality d S E M = d 1 .
Applsci 15 09121 g008
Figure 9. A comparison of experimental transmittance and reflectivity spectra ( T e and R e ) with simulated spectra ( T s and R s ) for sample #4 in the optical range after the first and second fitting stages. Simulated spectra were calculated at the best-fit parameters d 1 , N e and μ (see Table 4 and Table 5). (a) Reflectivity spectra. (b) Transmittance spectra.
Applsci 15 09121 g009
Figure 10. The results of the determination of the concentration N e and mobility μ of free electrons in ITO films of various thicknesses after the first and second stages of the fitting procedure. Empty and filled symbols represent the results of the first and second stages of sample spectrum analysis, respectively. Solid and dashed lines represent the results of fitting the experimental data with linear functions.
Applsci 15 09121 g010
Figure 11. The sheet resistivity of the ITO films versus film thickness. Data corresponding to the optical measurements (Table 3) are shown by filled circles. The solid line is a guide for the eye. Empty squares indicate the results of sheet resistivity measurements using the four-probe method (Table 1). The dashed line indicates the hyperbolic dependence ρ s ( d 1 ) = ρ ( # 6 ) / d 1 , where ρ ( # 6 ) denotes the DC volume resistivity of sample #6.
Applsci 15 09121 g011
Table 1. Sample specifications.
Sample Number#1#2#3#4#5#6
ITO film thickness
d S E M , nm
76 ± 10109 ± 10119 ± 10150 ± 10167 ± 10457 ± 10
DC sheet resistivity
ρ s , Ohm/sq
28.7 ± 1.221.7 ± 0.619.8 ± 0.713.2 ± 0.59.18 ± 0.263.56 ± 0.02
DC volume resistivity
ρ = ρ s d S E M , 10−4 Ohm × cm
2.192.372.361.981.531.63
Table 2. The operating spectral ranges of the used spectrometers.
SpectrometerSpectral RangeOperating WavelengthsOperating Frequencies
Photon RTUV/VIS0.185–1.65 μm182–1622 THz
FTIR spectrometer Vertex 70NIR0.667–8.34 μm36–450 THz
MIR1.3–27 μm11.1–231 THz
FIR14–335 μm0.9–21.4 THz
TERA K8 THz TDS systemTHz150–3000 μm0.1–2 THz
Table 3. The results of analysis of the experimental single-pass transmittance spectra in the THz spectral range.
Sample Number T ρ s
(Ohm/Sq.)
δ ρ s
(Ohm/Sq.)
δ ρ s   ρ s
#10.027927.70.70.025
#20.019722.30.60.027
#30.013818.10.80.044
#40.007412.60.60.048
#50.00409.00.60.067
#60.000673.50.30.086
Table 4. The best-fit parameters of ITO films obtained at the first stage of the transmittance and reflectivity spectra analysis in the optical range.
Sample Number d 1 ,
(nm)
δ d 1 ,
(nm)
δ d 1 d 1 N e
( 10 20 cm - 3 )
μ   ( c m 2 V × s )
#171.91.20.0177.6341.2
#287.11.10.0137.7841.4
#3110.11.70.0157.5841.4
#4155.91.80.0127.9939.7
#5184.31.90.0108.8842.3
#6451.22.80.0069.7840.4
Table 5. The best-fit parameters of ITO films obtained at the second stage of the transmittance and reflectivity spectra analysis in the optical range.
Sample Number N e
( 10 20 cm 3 )
δ N e
( 10 20 cm 3 )
δ N e   N e μ c m 2 V × s δ μ c m 2 V × s δ μ   μ
#17.600.050.00641.42.00.048
#27.700.050.00741.82.00.047
#37.450.040.00542.12.70.064
#47.800.050.00640.72.70.066
#58.590.060.00743.83.70.084
#68.870.450.05044.66.30.142
Disclaimer/Publisher’s Note: The statements, opinions and data contained in all publications are solely those of the individual author(s) and contributor(s) and not of MDPI and/or the editor(s). MDPI and/or the editor(s) disclaim responsibility for any injury to people or property resulting from any ideas, methods, instructions or products referred to in the content.