Article

Mechanistic Investigation of Machine-Made Sand Methylene Blue Value Effects on Mortar Performance

1
Changjiang River Scientific Research Institute of Changjiang Water Resources Commission, Wuhan 430010, China
2
Research Center of the National Dam Safety Engineering Technology, Wuhan 430010, China
3
School of Civil Engineering, Wuhan University, Wuhan 430000, China
4
Institute of High Performance Engineering Structure, Wuhan University of Science and Technology, Wuhan 430065, China
5
State Key Laboratory of Precision Blasting, Jianghan University, Wuhan 430056, China
*
Author to whom correspondence should be addressed.
Appl. Sci. 2025, 15(16), 9115; https://doi.org/10.3390/app15169115
Submission received: 8 July 2025 / Revised: 31 July 2025 / Accepted: 7 August 2025 / Published: 19 August 2025

Abstract

This investigation examines the impact of machine-made sand methylene blue (MB) values on mortar properties and microstructure through controlled clay type and content testing, encompassing macro-performances, microstructures, and mechanisms measuring compressive strength, flexural strength, drying shrinkage, frost resistance, impermeability, pore structure, microstructure, interfacial transition zones (ITZs), and hydration products. MB testing demonstrates that montmorillonite and illite exhibit a significant sensitivity divergence, where 1% montmorillonite achieves an MB value of 1.42, exceeding 1.40, while illite requires a 5% content to attain an MB of 1.50, complying with SL/T 352-2020 specifications. Increasing MB values induce an initial rise followed by a decline in 7d compressive strength yet a persistent increase in flexural strength for montmorillonite mortars, with both strength parameters decreasing at 28d and 90d. Illite mortars exhibit progressive declines in compressive and flexural strength across all curing ages (7d, 28d, and 90d) with rising MB values. SEM-EDS analyses reveal a deteriorating mortar microstructure, reduced paste compactness, and thickened ITZ under identical clay types as MB values increase. Combined XRD and TG-DTA analyses demonstrate a diminishing hydration degree and decreased hydration products in mortars with ascending MB values. Given a constant clay mineralogy, elevated MB values inhibit hydration-product formation, causing incomplete cement hydration reactions and deteriorated ITZ microstructures, consequently impairing mortar macro-performances.

1. Introduction

Manufactured sand, produced through rock crushing, has become an essential substitute for natural sand in construction applications [1]. However, during the extraction process, the existence of weak interlayers or clay seams in parent rock formations leads to significant clay contamination in the final manufactured sand product [2]. Clay fines demonstrate pronounced adsorption characteristics, actively interacting with both water molecules and superplasticizers in concrete mixtures [3]. This interaction effectively reduces the available water-to-binder ratio in the system. Furthermore, when present in excessive amounts, clay fines tend to envelop cement particles, thereby obstructing the hydration process [4]. This interference results in multiple detrimental effects: incomplete hydration, microstructural degradation (manifested as pore coarsening and elevated porosity), and ultimately compromised concrete performance [5]. The combined impact of these mechanisms significantly diminishes the quality of hydraulic concrete, leading to reduced workability, impaired dimensional stability, decreased compressive strength, lowered durability, intensified drying shrinkage, and particularly notable deterioration in the workability of superplasticizer-enhanced concrete mixtures [6].
Clay fines present in manufactured sand primarily consist of montmorillonite, illite, kaolinite, and similar clay minerals [1,5,6,7,8]. The methylene blue (MB) test has proven to be an effective method for quantifying the clay content in manufactured sand fines [9]. According to the Test Code for Hydraulic Concrete (SL/T 352-2020), the specified MB value threshold should not exceed 1.458 [10], and when the MB value is ≤1.4, the fine particle composition is primarily composed of rock powder; when the MB value is >1.4, it is primarily composed of clay. The MB value is predominantly determined by two key factors: clay content and mineralogical composition [11]. Experimental results demonstrate a linear relationship between MB value and clay content, while the specific surface area and mineral characteristics of clay fines also significantly influence the measurements [12]. In contrast, increased rock powder content shows minimal effect on MB values, with the rock powder’s specific surface area, parent rock lithology, and mineral characteristics exhibiting negligible impacts [7,13]. Research by Dong et al. has experimentally confirmed that MB values increase logarithmically as the maximum particle size of manufactured sand decreases [14]. Furthermore, through comprehensive investigations of particle size distribution, sieving conditions, rock powder lithology, and fine composition, Chen et al. determined that the MB value mainly stems from the intrinsic background value of fines, typically ranging from 0.15 to 0.35 g/kg [15].
Regarding the impact of machine-made sand MB values on mortar macro-properties, Du et al. examined influences of clay content characteristics and MB values ranging from 0.35 to 2.5 on concrete performance [16]. Jiao et al. investigated effects of clay minerals versus clay-sized non-clay particles in manufactured fine aggregates by incorporating both into micro-fine aggregates [17]. Pedro et al. discovered that fine powders with low MB values enhance workability of fresh concrete and densification of hardened concrete, whereas high MB value powders impair frost resistance and shrinkage behavior. Concerning MB value impacts on mortar microstructure [18], Xie et al. designed five high-strength machine-made sand concretes under controlled clay powder contents, demonstrating decreased fluidity yet stable water retention with increasing MB values [19]. Kurad et al. and Shi et al. conducted XRD analyses on clay–cement interactions, revealing no new phases divergent from pure cement hydration products [20,21]. Incorporating fly ash in hydraulic structures effectively mitigates thermal cracking, enhances durability, improves workability, suppresses alkali–aggregate reaction, and delivers economic and environmental benefits. Conversely, omitting fly ash introduces short-term risks during construction, including outbreaks of thermal cracks, cold joints during placing, and plastic shrinkage cracking, and long-term deterioration during operation, such as freeze–thaw scaling, alkali–aggregate reaction-induced expansion, sulfate attack, and leakage-induced dissolution. Current research focuses predominantly on macro-scale aspects, including strength, deformation, drying shrinkage, and frost durability, lacking microscopic testing and microscale mechanistic interpretations.
This study comprehensively investigates the influence of varying clay contents on the macroscopic properties of manufactured sand mortar, while simultaneously examining the microstructural alterations, pore distribution characteristics, and interfacial transition zone (ITZ) evolution induced by clay impurities. This research elucidates the fundamental mechanisms governing macroscopic performance degradation, thereby advancing both theoretical frameworks and technical knowledge systems [22,23]. It provides crucial technical support for processing and utilizing high-clay-content manufactured sand of MB value in hydraulic engineering, offering significant guidance for high-quality practical applications. By correlating MB values, clay mineralogy (montmorillonite/illite), and pore structure evolution patterns, the micro-mechanisms underlying clay-induced mortar performance variations are systematically clarified. Multi-scale characterization through SEM, electronic differential system (EDS), and X-ray diffraction (XRD) reveals the competitive “filling effect–hydration inhibition-interface deterioration” mechanism of clay fines. This explains the non-monotonic porosity variation pattern, characterized by an initial reduction followed by subsequent escalation. Furthermore, shifts in both the most probable pore diameter and the harmless/harmful pore ratio are effectively utilized to predict frost resistance deterioration and permeability degradation trends in mortars with different MB values.

2. Test Progress

2.1. Mix Proportion Design

In accordance with the Specification for Hydraulic Concrete Construction (SL 677-2014) [10], the USACE EM (1110-2-2000) [24], and the Test Code for Hydraulic Concrete (SL/T 352-2020) [25], the influence of expansive montmorillonite clay and non-expansive illite clay, as clay fines, on the MB value of manufactured sand necessitates critical consideration [26]. Machine-made sand is produced using basalt as raw material. Consequently, MB values were set to 0.6 g·kg−1, 1.1 g·kg−1, and 2.2 g·kg−1, controlled through clay mineral type and content [8]. These three MB values correspond to montmorillonite and illite contents of 0%/0%, 0.6%/3%, and 2%/9%, respectively, as detailed in Table 1. The mortar mix proportion was cement:fly ash:manufactured sand:water = 315 kg:135 kg:1350 kg:216 kg, with a water-to-binder ratio of 0.48 [27]. At the current water–cement ratio of 0.686, the expected 28-day compressive strength is about 30.6 Pa. Manufactured sand was provided by Suichuan Yinghong Building Materials Co., Ltd., Suichuan, China. A PCA-1 polycarboxylate-based high-performance water reducer, produced by Jiangsu Sobute New Materials Co., Ltd. (Nanjing, China), was incorporated by mass proportion [28], with its certified parameters conforming to the Concrete Admixtures standard (GB 8076-2008) [29], as specified in Table 1.
The selected clay fines comprised calcium-based montmorillonite with purity exceeding 95% and high-purity 1250-mesh illite [29], with their chemical compositions detailed in Table 2 and Table 3.
Ordinary Portland cement (42.5 grade), supplied by Huaxin Cement Co., Ltd., has all tested parameters conforming to the Common Portland Cement standard (GB 175-2023) [30]. The fly ash utilized was Class F Grade I fly ash produced by Gansu Pan’nan Power Plant, demonstrating compliance with the Technical Specification for Fly Ash Used in Hydraulic Concrete (DL/T 5055-2007) [31]. The granite manufactured sand commonly adopted in hydropower engineering served as the reference sand, with its performance metrics satisfying the Specification for Hydraulic Concrete Construction (SL 677-2014) [10].

2.2. Experimental Setup and Measurements

The fluidity of cement mortar was determined according to the Test Method for Fluidity of Cement Mortar (GB/T 2419-2005) [32]. After the mixed mortar was poured into a conical frustum mold mounted on the flow table apparatus, the spread diameters were measured to assess flow characteristics, with the experimental setup and procedure documented in Figure 1.
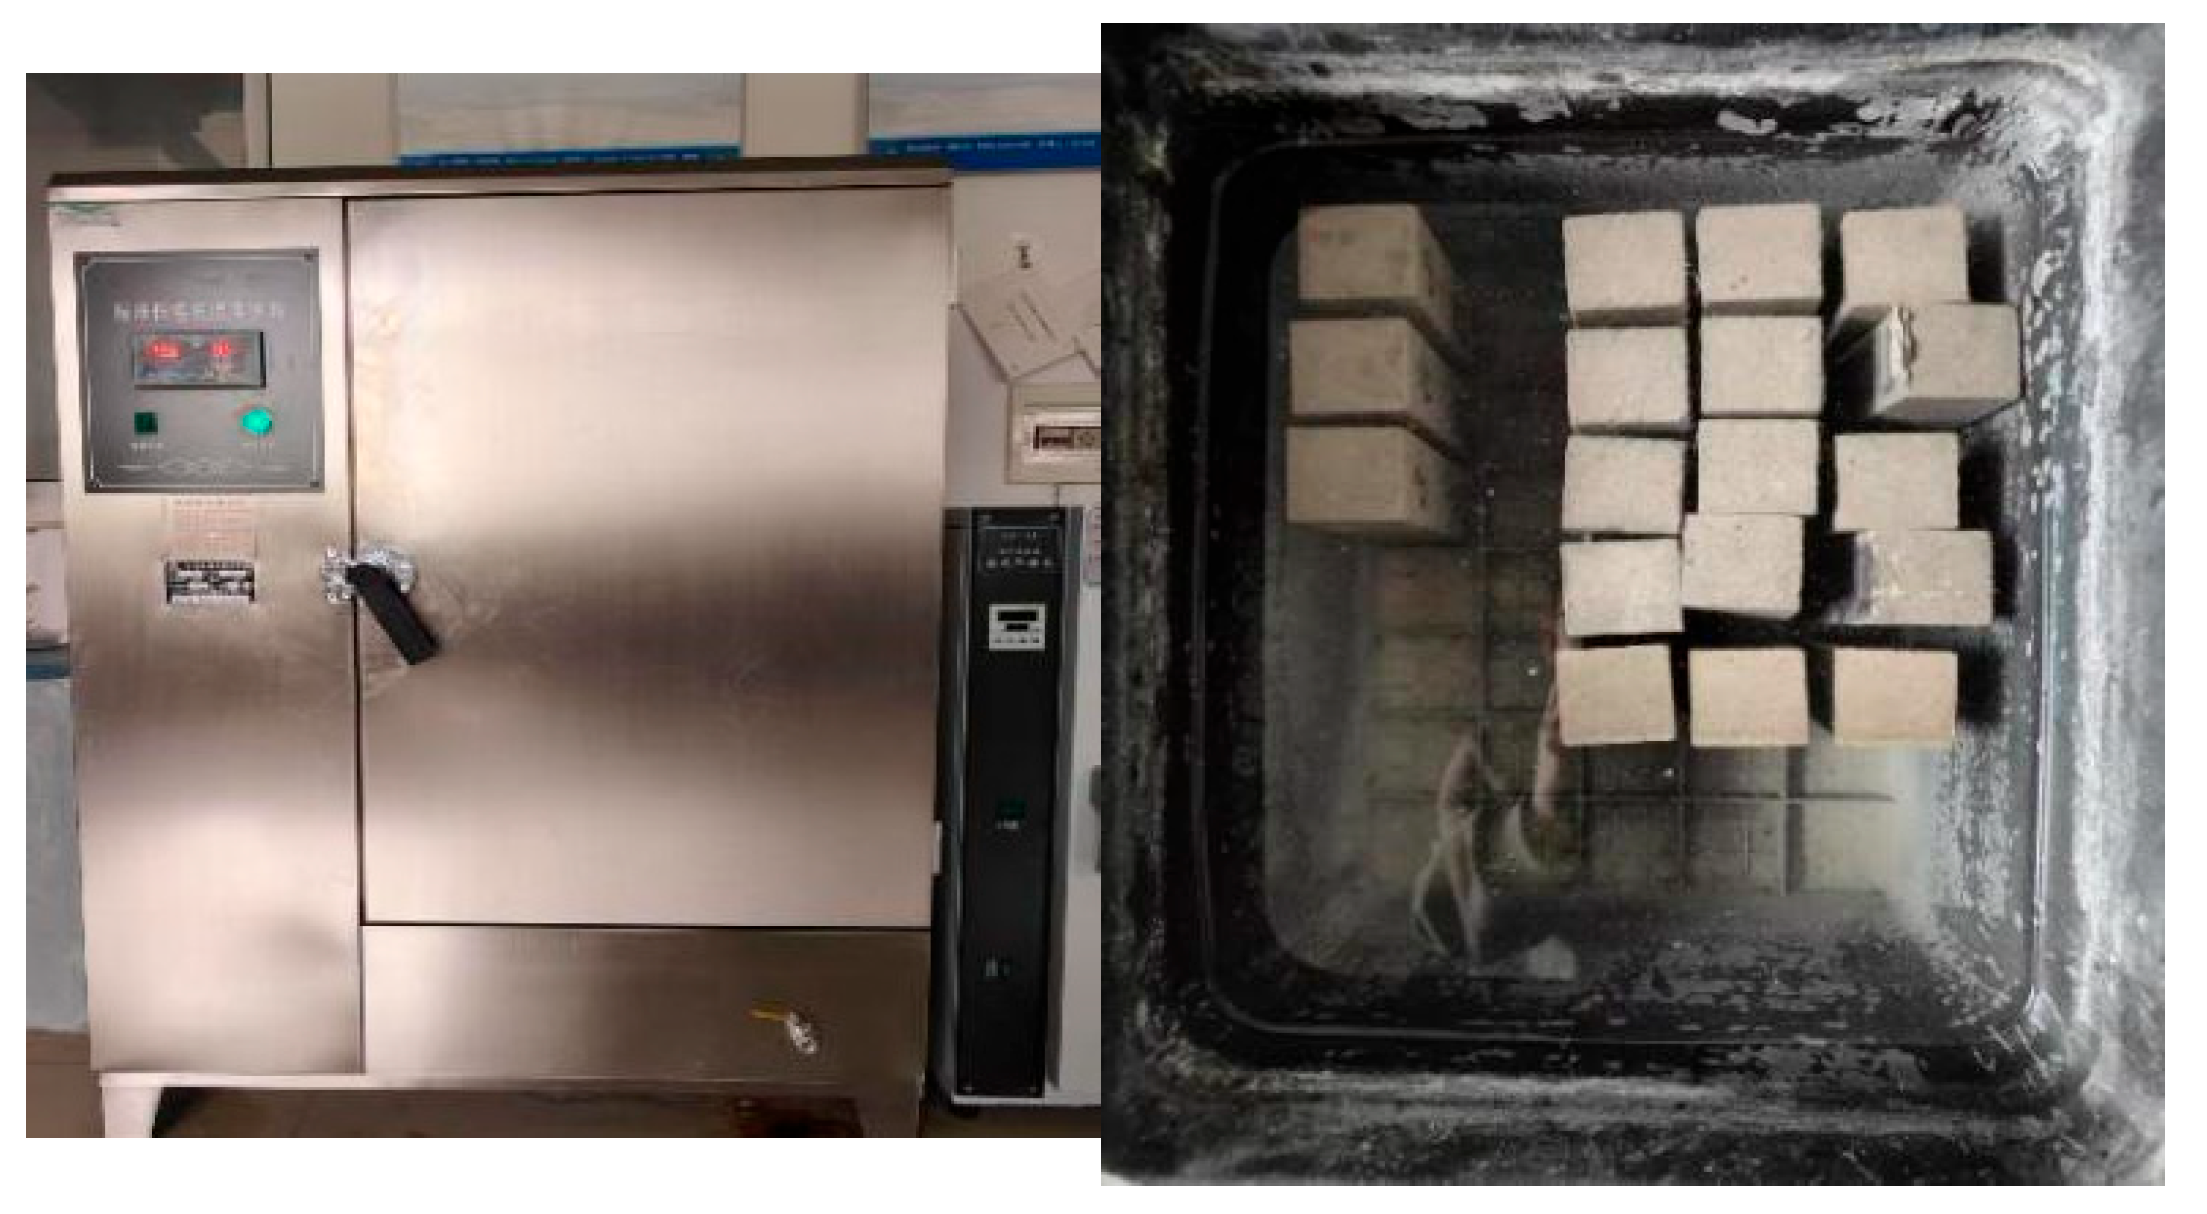
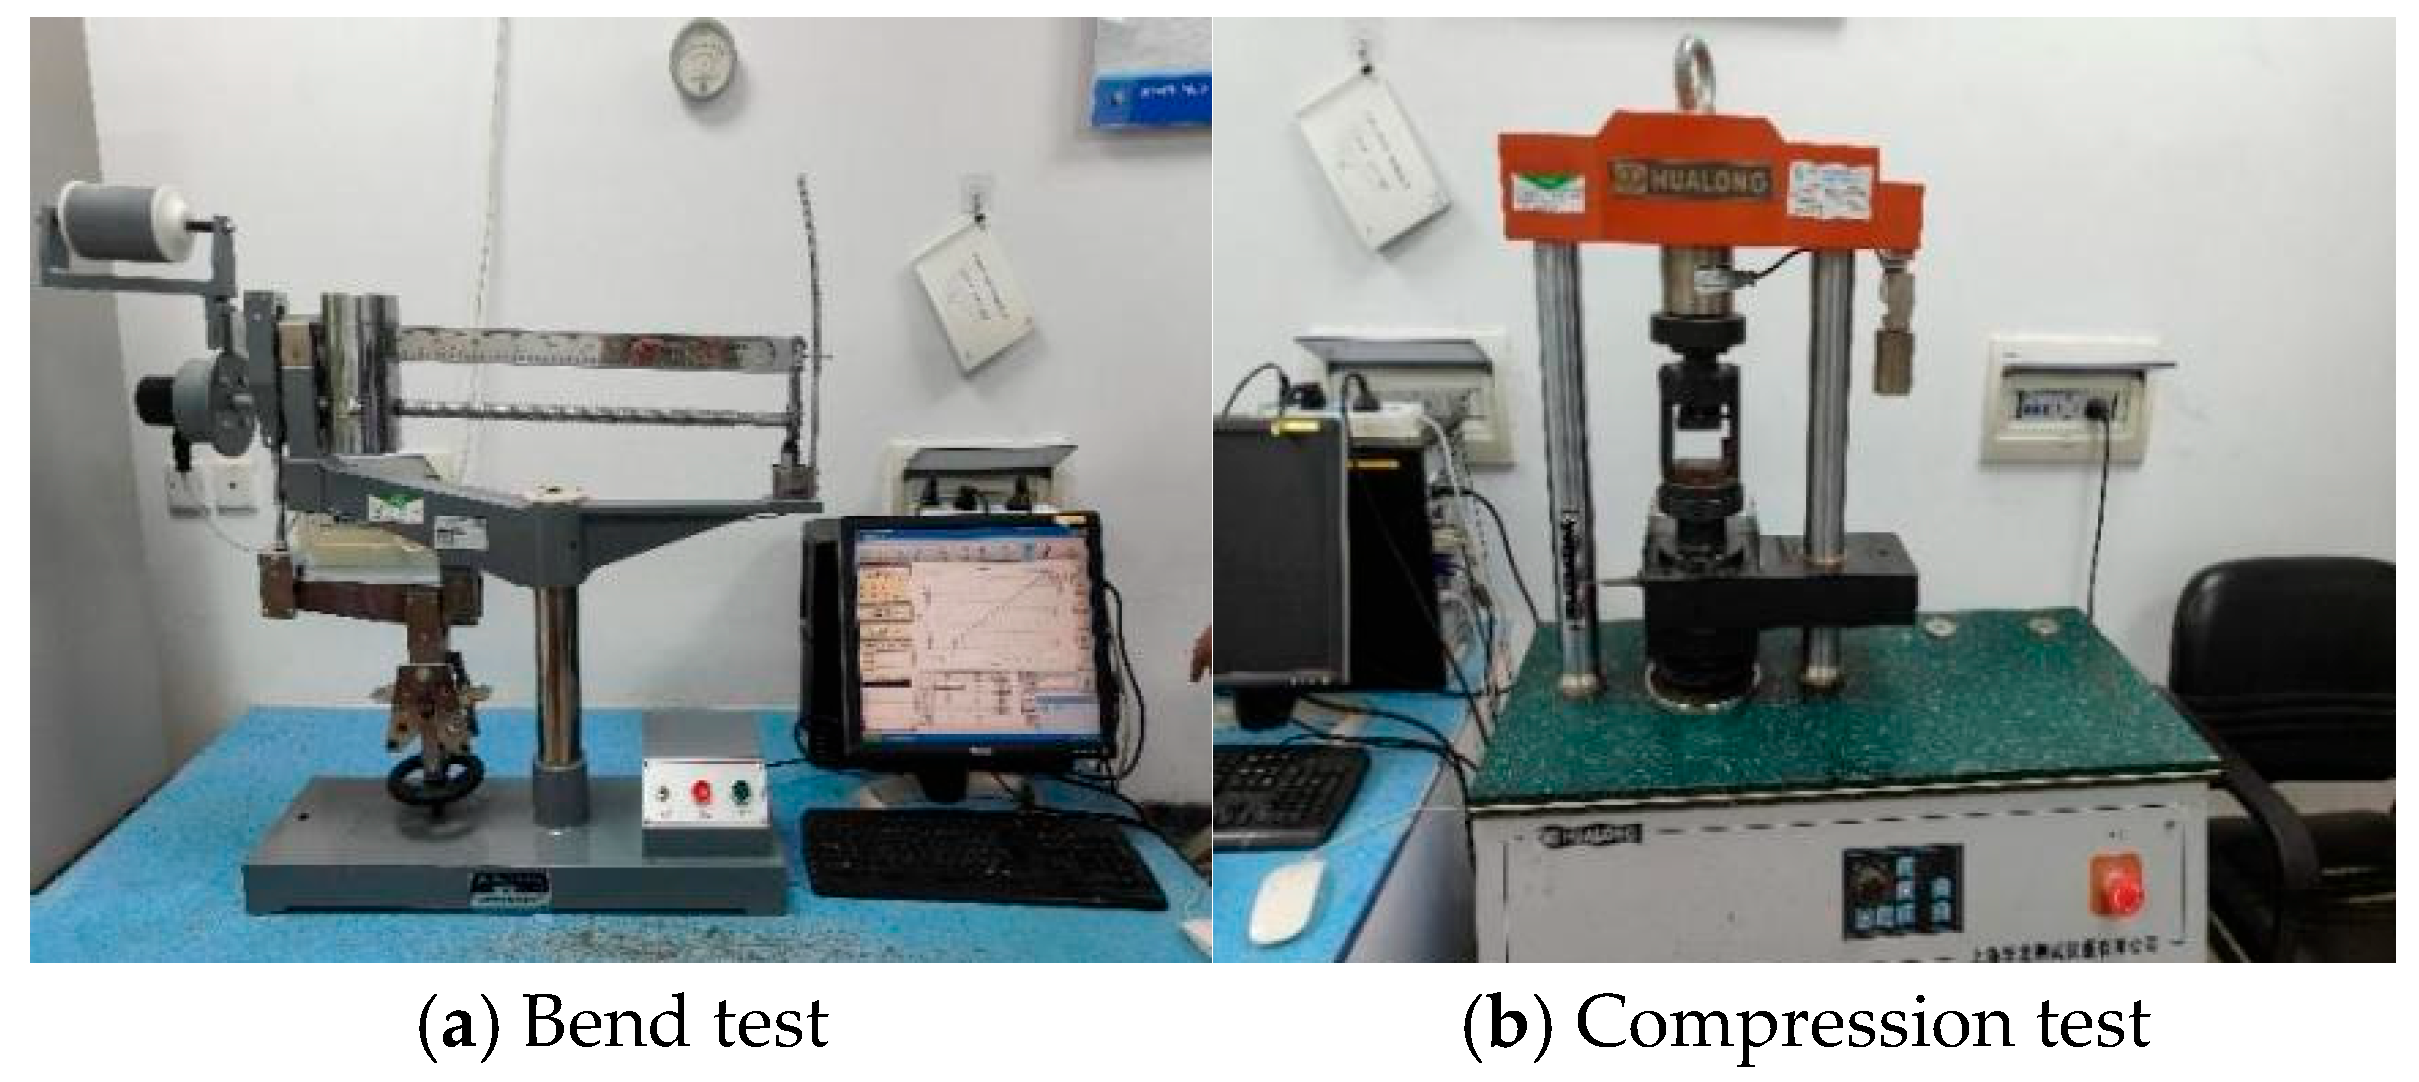
The testing of flexural and compressive strengths was conducted in compliance with the Method for Testing Cement Mortar Strength (ISO Method) (GB/T 17671-2021) [33]. Prismatic specimens measuring 40 mm × 40 mm × 160 mm were cast in sets of three and then cured in a standard chamber maintained at (20 ± 3) °C with ≥90% relative humidity (Figure 2) [33]. At designated curing ages of 7, 28, and 90 days, the specimens were demolded and subjected to strength testing, as illustrated in Figure 3.
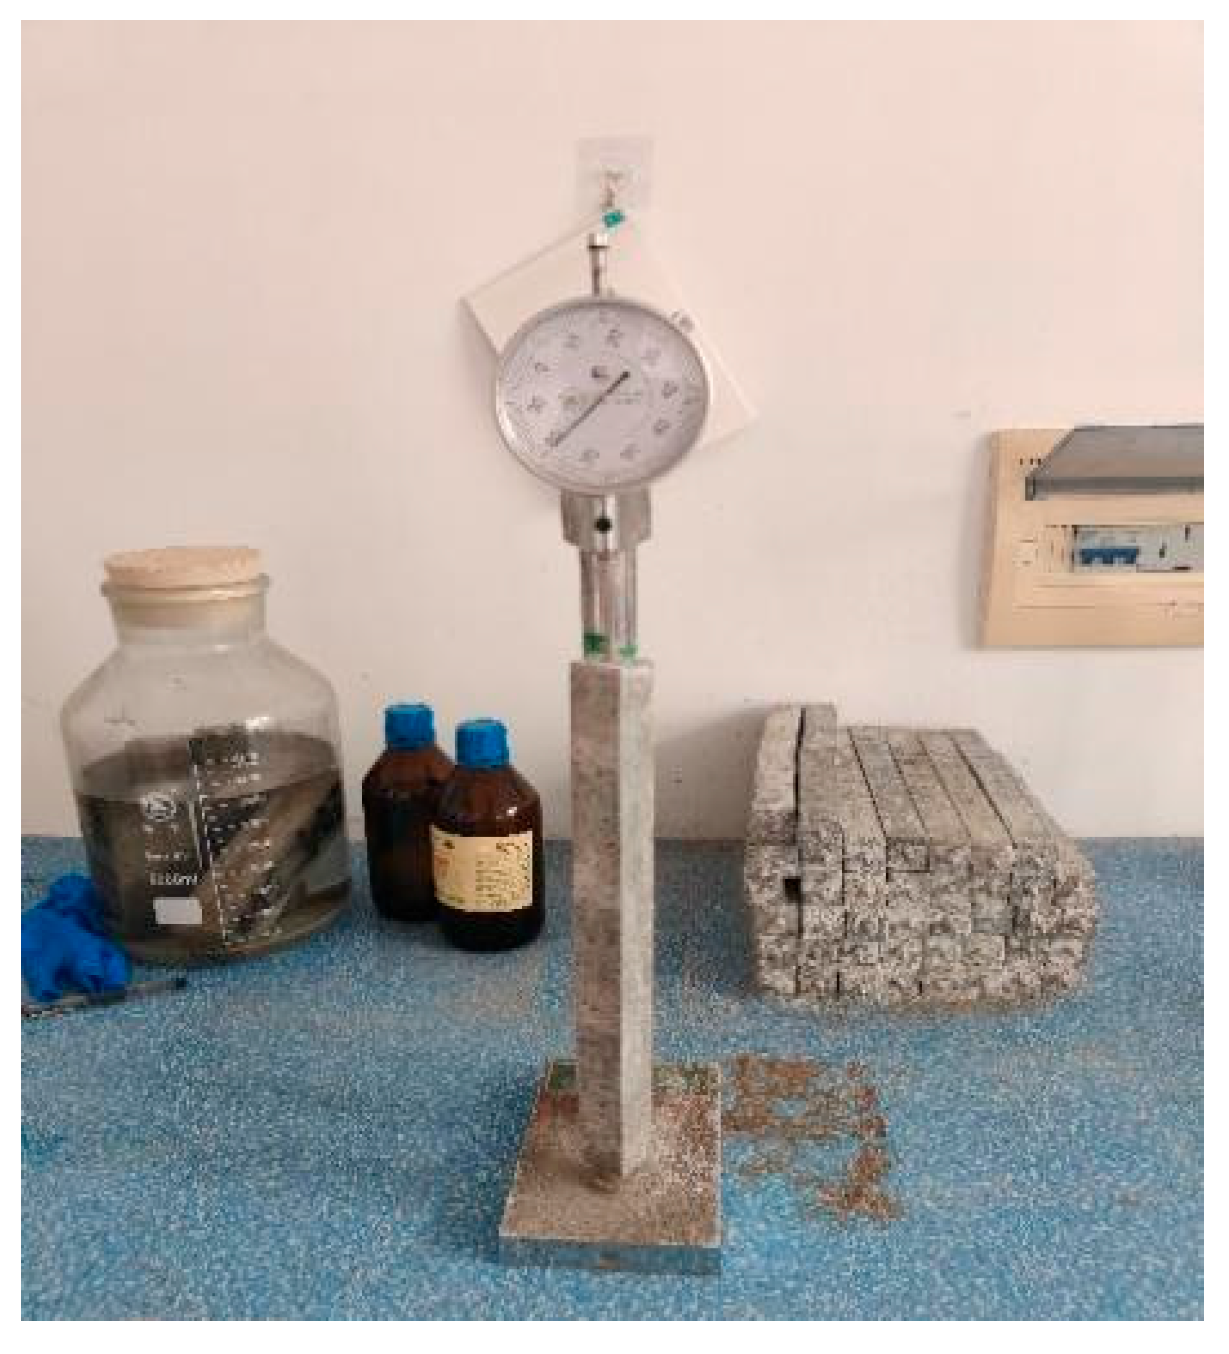
Dry shrinkage testing was performed according to the Test Method for Drying Shrinkage of Cement Mortar (JC/T 603-2004) [34], employing 25 mm × 25 mm × 280 mm prismatic specimens with embedded gauge studs cast in a three-gang mold assembly comprising orthogonal baffles, end plates, baseplates, and positioning screws [8,35]. After casting and initial curing, the specimens were transferred to a specialized shrinkage chamber maintained at (20 ± 3) °C with (50 ± 4)% relative humidity [36]. The measuring epochs commenced upon demolding, with specimen lengths recorded at 1, 3, 7, 28, 60, and 90 days using a precision length comparator, as shown in Figure 4.
Rapid freeze–thaw cycling was conducted according to the Test Specifications for Hydraulic Concrete (SL/T 352-2020) [25] to evaluate the frost resistance of mortar specimens containing varying clay types and contents, with durability assessed via MB value-based frost resistance tests on 40 mm × 40 mm × 160 mm specimens after 28-day curing. Chloride ion permeability was determined in accordance with the Standard for Test Methods of Long-term Performance and Durability of Ordinary Concrete (GB/T 50082-2009) using electrical flux measurements on Φ100 mm × 50 mm cylinders [36]. Microstructural characterization was performed using mercury intrusion porosimetry, SEM, EDS, XRD, and differential scanning calorimetry to analyze pore structure, hydration products, morphological features, and ITZ evolution [23,37]. Thermogravimetric analysis parameters comprised the following [38,39,40]: a temperature ramp from ambient to 1000 °C under a high-purity nitrogen atmosphere at 10 °C min−1, utilizing approximately 25 mg of pulverized mortar.

3. Influence of MB Value on Macrostructural Properties of Mortar

3.1. Effects of Clay Content Types and Concentrations on Mb Value

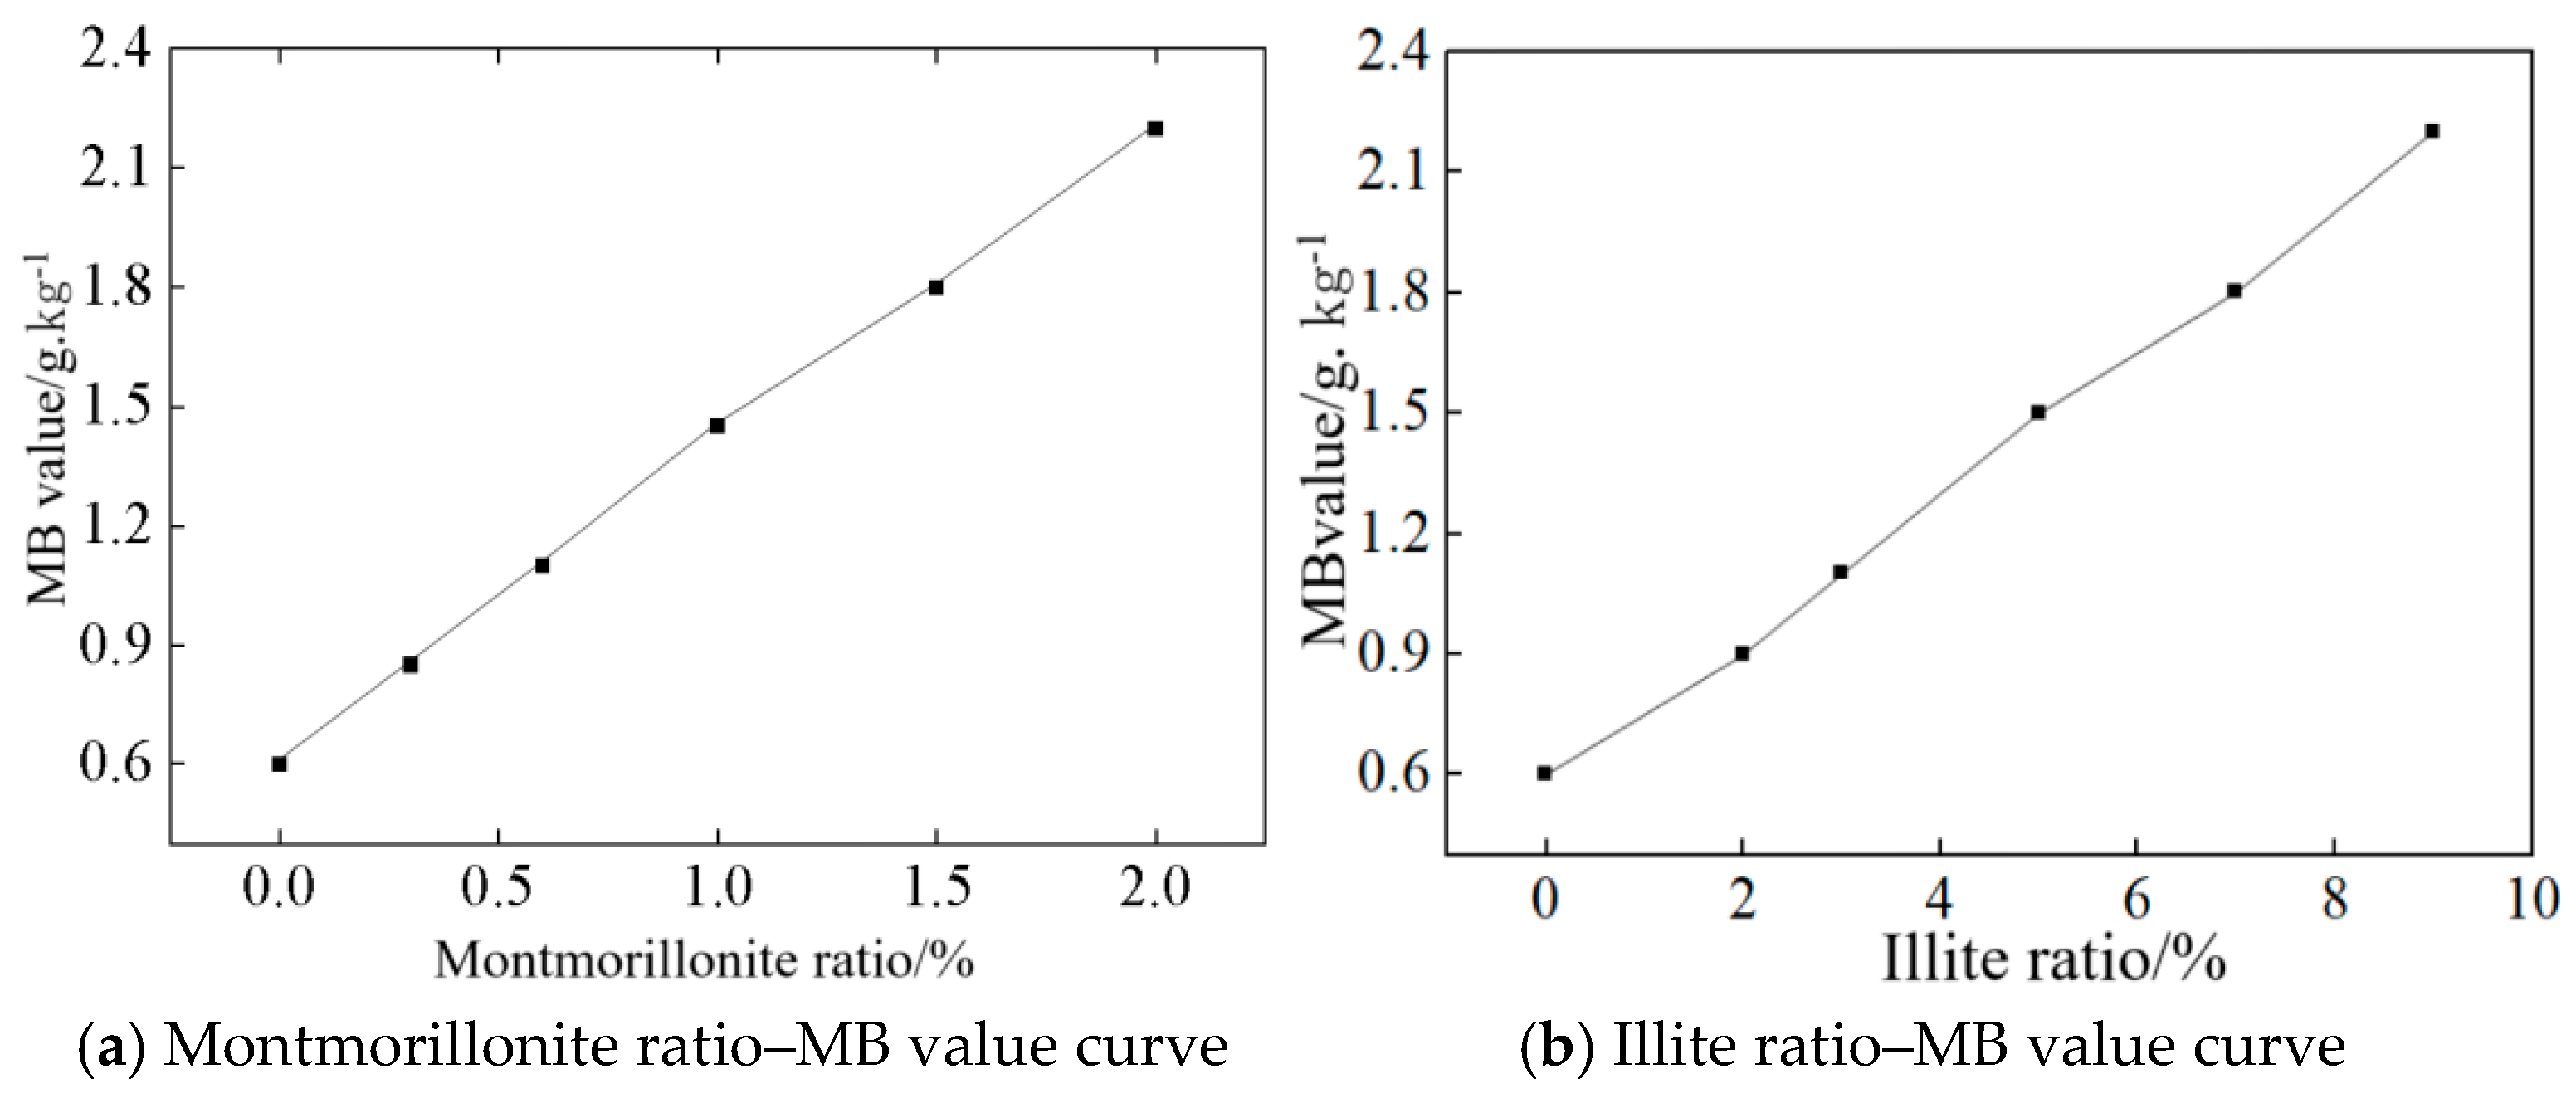
MB value testing of machine-made sand was conducted following the Test Specifications for Hydraulic Concrete (SL/T 352-2020) [25], with the total stone and clay powder content constantly controlled at 11% for enhanced accuracy. Sieving removed particles exceeding 2.5 mm before recycling the sieved stone powder and clay powder into the mixture, ultimately measuring MB values corresponding to varying clay types and contents, as documented in Figure 5.
As shown in Figure 5, the MB value exhibits a linearly increasing trend with the rising content of both montmorillonite and illite, while the growth rate for montmorillonite addition is nearly five times faster than that for illite [40]. As the montmorillonite content increases from 0% to 2%, the MB value rises from 0.6 to 2.2, whereas with the illite content increasing from 0% to 9%, the MB value also increases from 0.6 to 2.2. This indicates that montmorillonite exerts a more significant influence on the MB value than illite, and the impact of different clay types on the MB value can vary substantially [41].
As an expansive clay mineral, montmorillonite possesses a high specific surface area and cation exchange capacity. Its interlayers are weakly bonded via van der Waals forces, allowing interlayer cations such as Na+ and Ca2+ to exchange with cations in the MB solution, thereby adsorbing more MB [42], hence the rapid increase in MB value with rising montmorillonite content. In illite, K+ ions are fixed and non-exchangeable, limiting MB adsorption to external surfaces where adsorption capacity is governed by the specific surface area. Additionally, the interlayer expansibility of illite is weaker than that of montmorillonite, resulting in its lesser impact on the MB value.

3.2. Effect of MB Value on Mortar Workability

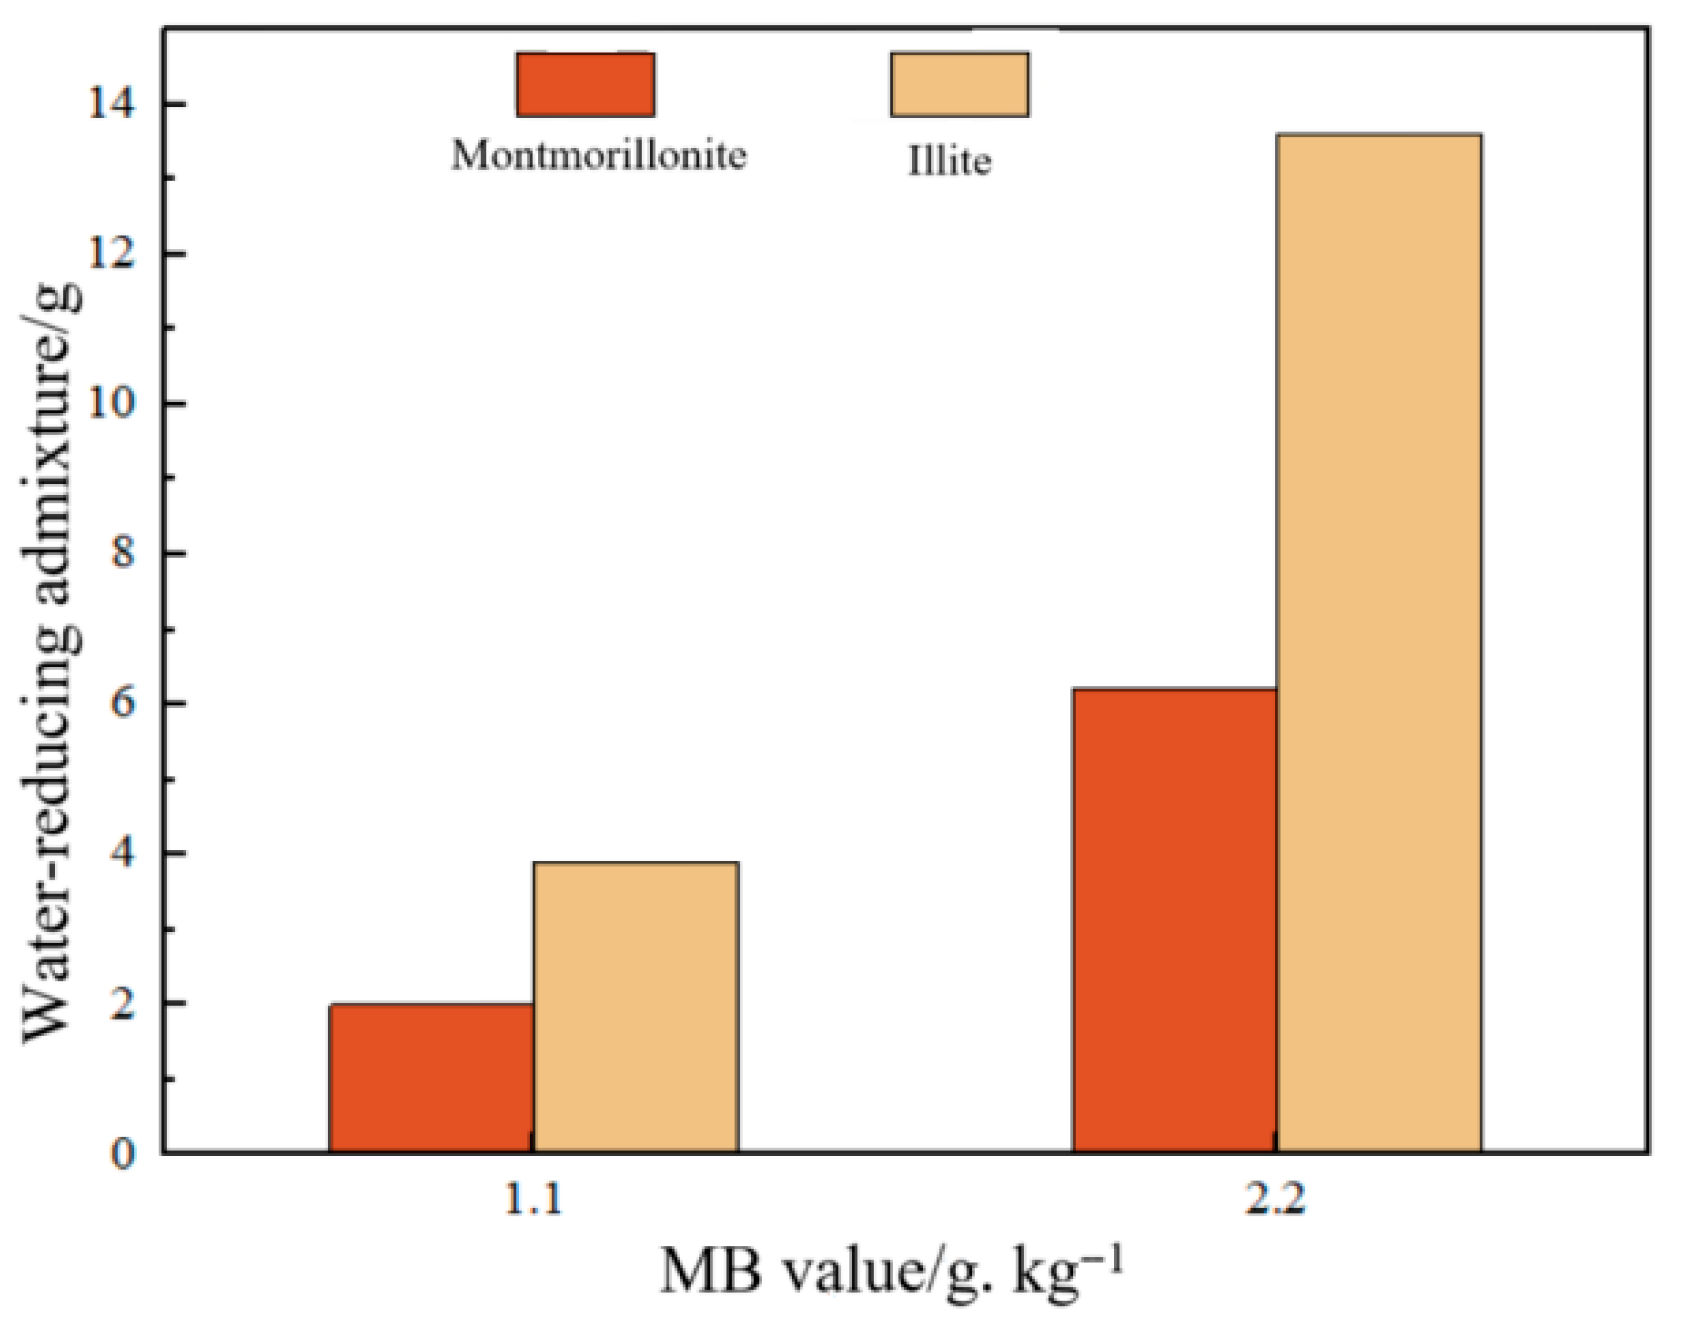
The water-to-cement ratio and superplasticizer dosage serve as critical benchmarks for evaluating the impact of various clay fines on mortar workability [43]. When mortar fluidity is controlled at (170 ± 5) mm with identical mix proportions, the required superplasticizer dosages for different clay fines are as illustrated in Figure 6. An analysis of Figure 6 and Table 1 reveals that at an MB value of 1.1, the required montmorillonite and illite contents are 8.1 g and 40.5 g, respectively, while the corresponding superplasticizer dosages to maintain equivalent fluidity are 2 g and 3.9 g, indicating that illite demands 1.95 times more superplasticizer than montmorillonite. At an MB value of 2.2, the montmorillonite and illite contents increase to 27 g and 121.5 g, respectively, with superplasticizer dosages rising to 6.2 g and 13.6 g. Here, illite requires 2.19 times more superplasticizer than montmorillonite [44]. These results demonstrate that illite exhibits a stronger adsorption capacity for the superplasticizer compared to montmorillonite at identical MB values and fluidity levels, with this disparity amplifying as MB values increase. Furthermore, achieving the same MB value necessitates substantially higher illite content than montmorillonite, which directly contributes to illite’s elevated superplasticizer demand.

3.3. Effect of MB Value on Mortar Compressive Strength

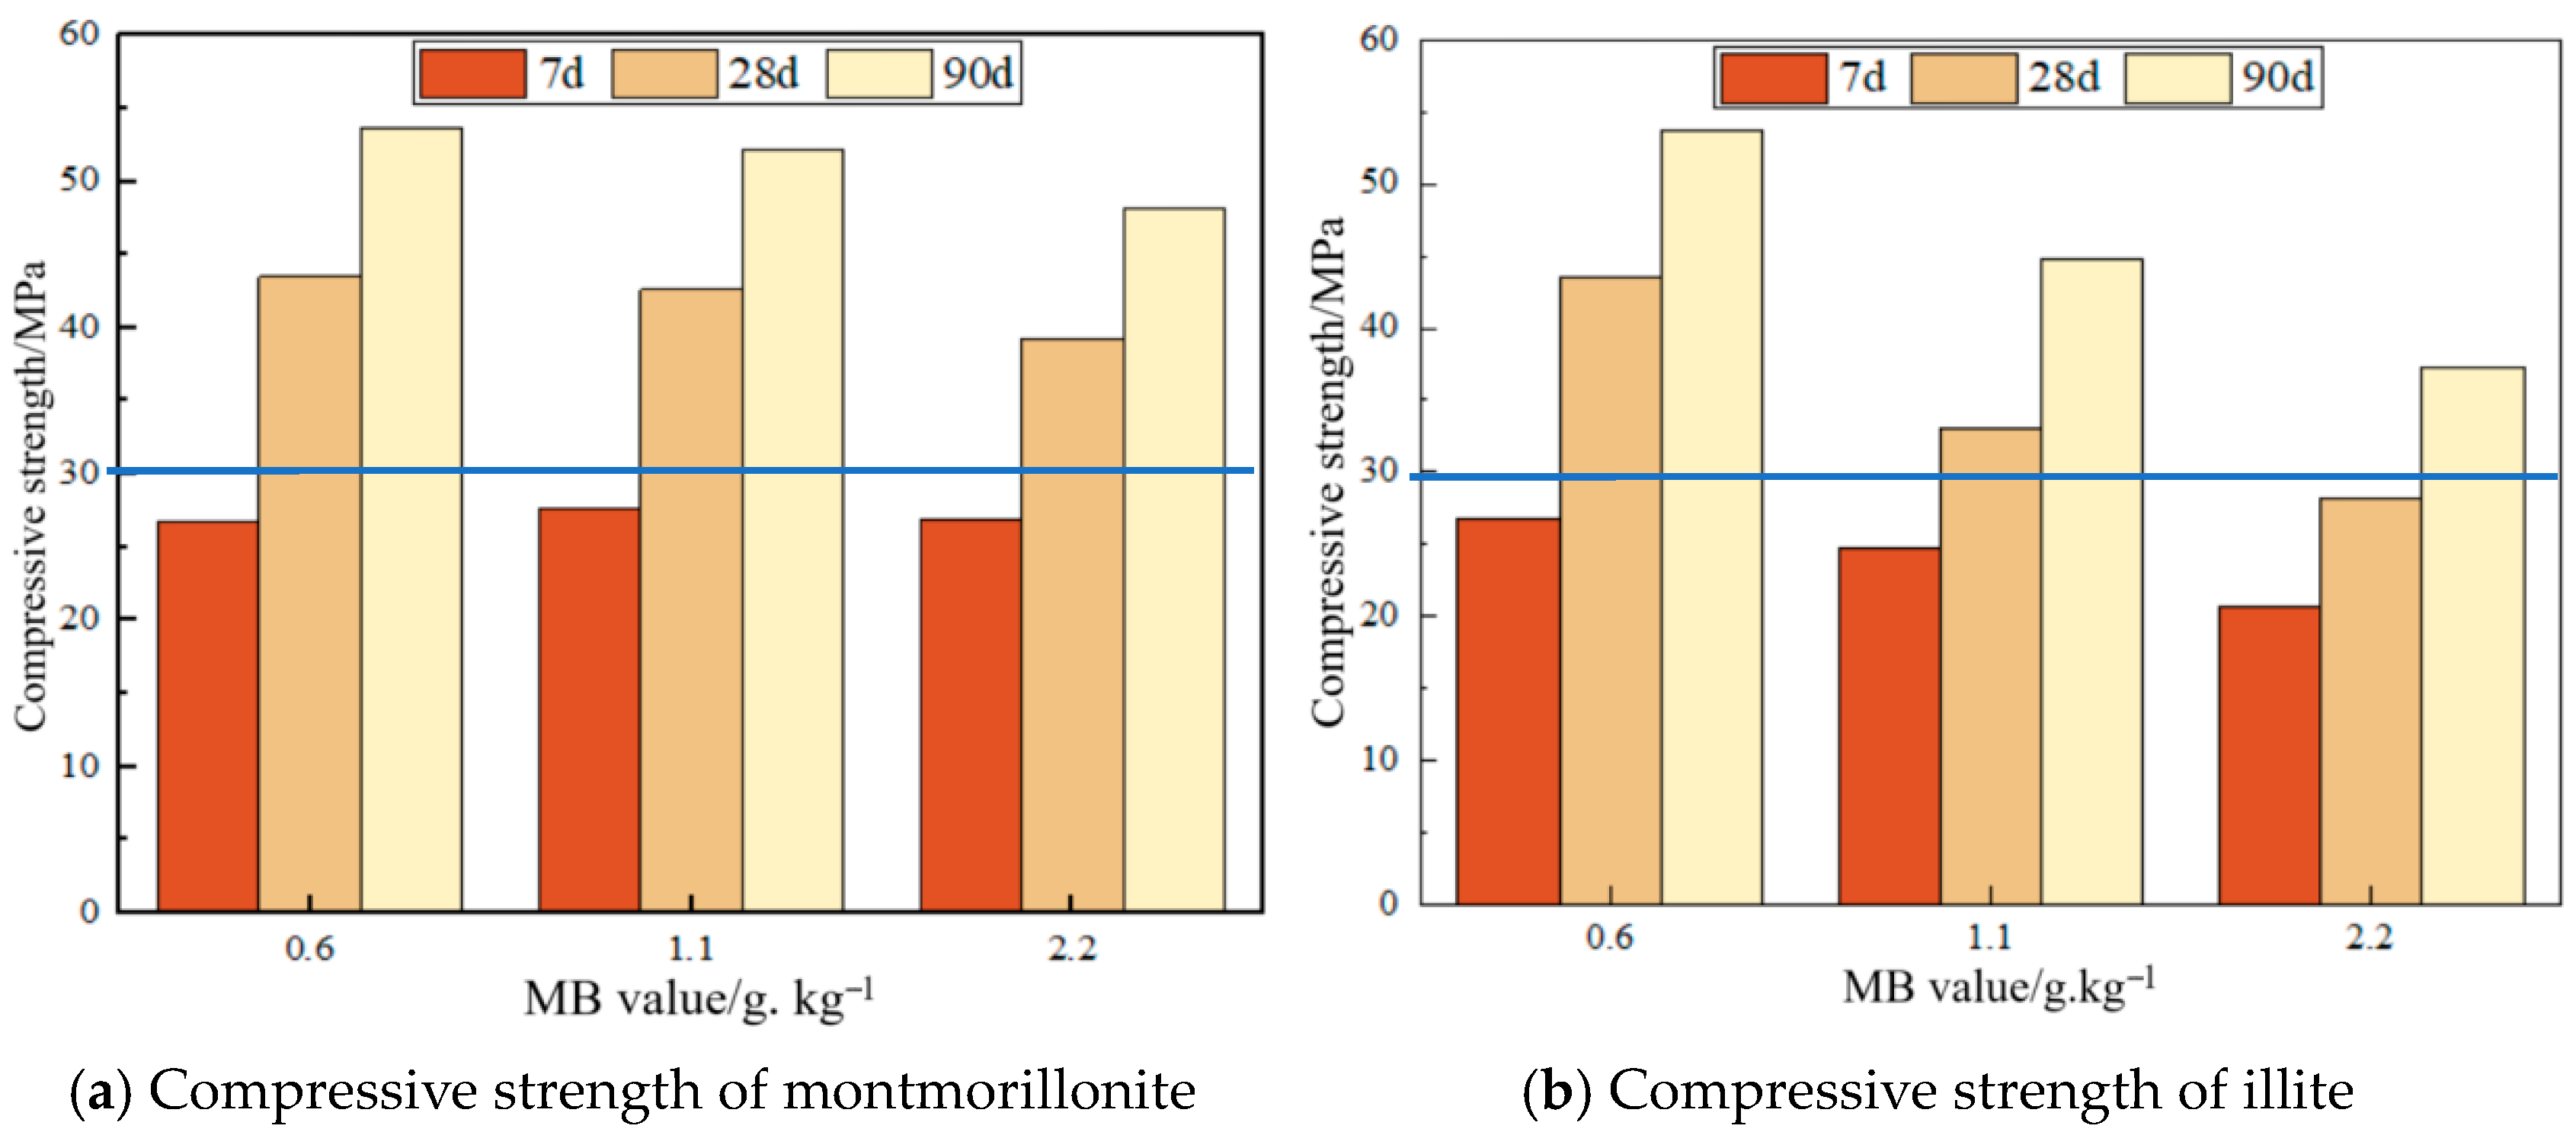
Figure 7 illustrates the compressive strength testing patterns of mortar specimens according to the experimental specifications. As shown in Figure 7a, at constant flowability, the compressive strength of montmorillonite at 7 days initially increases and then decreases with an increasing MB value, while showing a decreasing trend at 28 and 90 days. (1) At 7 days, as the MB value increases from 0.6 to 1.1, the compressive strength rises from 26.8 MPa to 27.7 MPa, representing an approximately 3.4% increase, and when the MB value increases from 0.6 to 2.2, the compressive strength slightly rises from 26.8 MPa to 26.9 MPa, remaining nearly unchanged. (2) At 28 days, as the MB value increases from 0.6 to 1.1, the compressive strength decreases from 43.5 MPa to 42.6 MPa, showing a minor reduction, and when the MB value increases from 0.6 to 2.2, the compressive strength declines from 43.5 MPa to 39.2 MPa, representing a 9.9% decrease. (3) At 90 days, as the MB value increases from 0.6 to 1.1, the compressive strength decreases from 53.7 MPa to 52.1 MPa, again showing a minor reduction, and when the MB value increases from 0.6 to 2.2, the compressive strength drops from 53.7 MPa to 48.2 MPa, representing a 10.2% decrease. At 7 days, an increased MB value has minimal effect on compressive strength, even demonstrating a slight improvement within certain ranges. At 28 days, compressive strength decreases with an increasing MB value, and the reduction is negligible within an MB value range of 0.6–1.1 but becomes substantial when the MB value reaches 2.2. The results at 90 days are comparable to those at 28 days. This indicates that an increased MB value significantly negatively impacts the long-term strength of montmorillonite mortar.
Figure 7b reveals a consistently declining compressive strength in illites at 7d, 28d, and 90d curing ages with increasing MB values under identical flowability. Specifically, an MB elevation from 0.6 to 1.1 reduced the 7d strength from 26.8 MPa to 24.7 MPa, representing a 7.8% reduction; the 28d strength from 43.5 MPa to 33.1 MPa, signifying a 23.9% reduction; and the 90d strength from 53.7 MPa to 44.8 MPa, indicating a 16.6% reduction. A further MB increase from 0.6 to 2.2 decreased the 7d strength to 20.7 MPa, with a 22.8% reduction; the 28d strength to 28.2 MPa, exhibiting a 35.2% reduction; and the 90d strength to 37.3 MPa, showing a 30.5% reduction in both MB increment ranges, from 0.6 to 1.1 and from 0.6 to 2.2, which demonstrated an initial increase followed by a decrease in compressive strength reduction magnitude with prolonged curing ages, with the trend becoming more evident under higher MB elevations.

3.4. Effect of MB Value on Mortar Flexural Strength

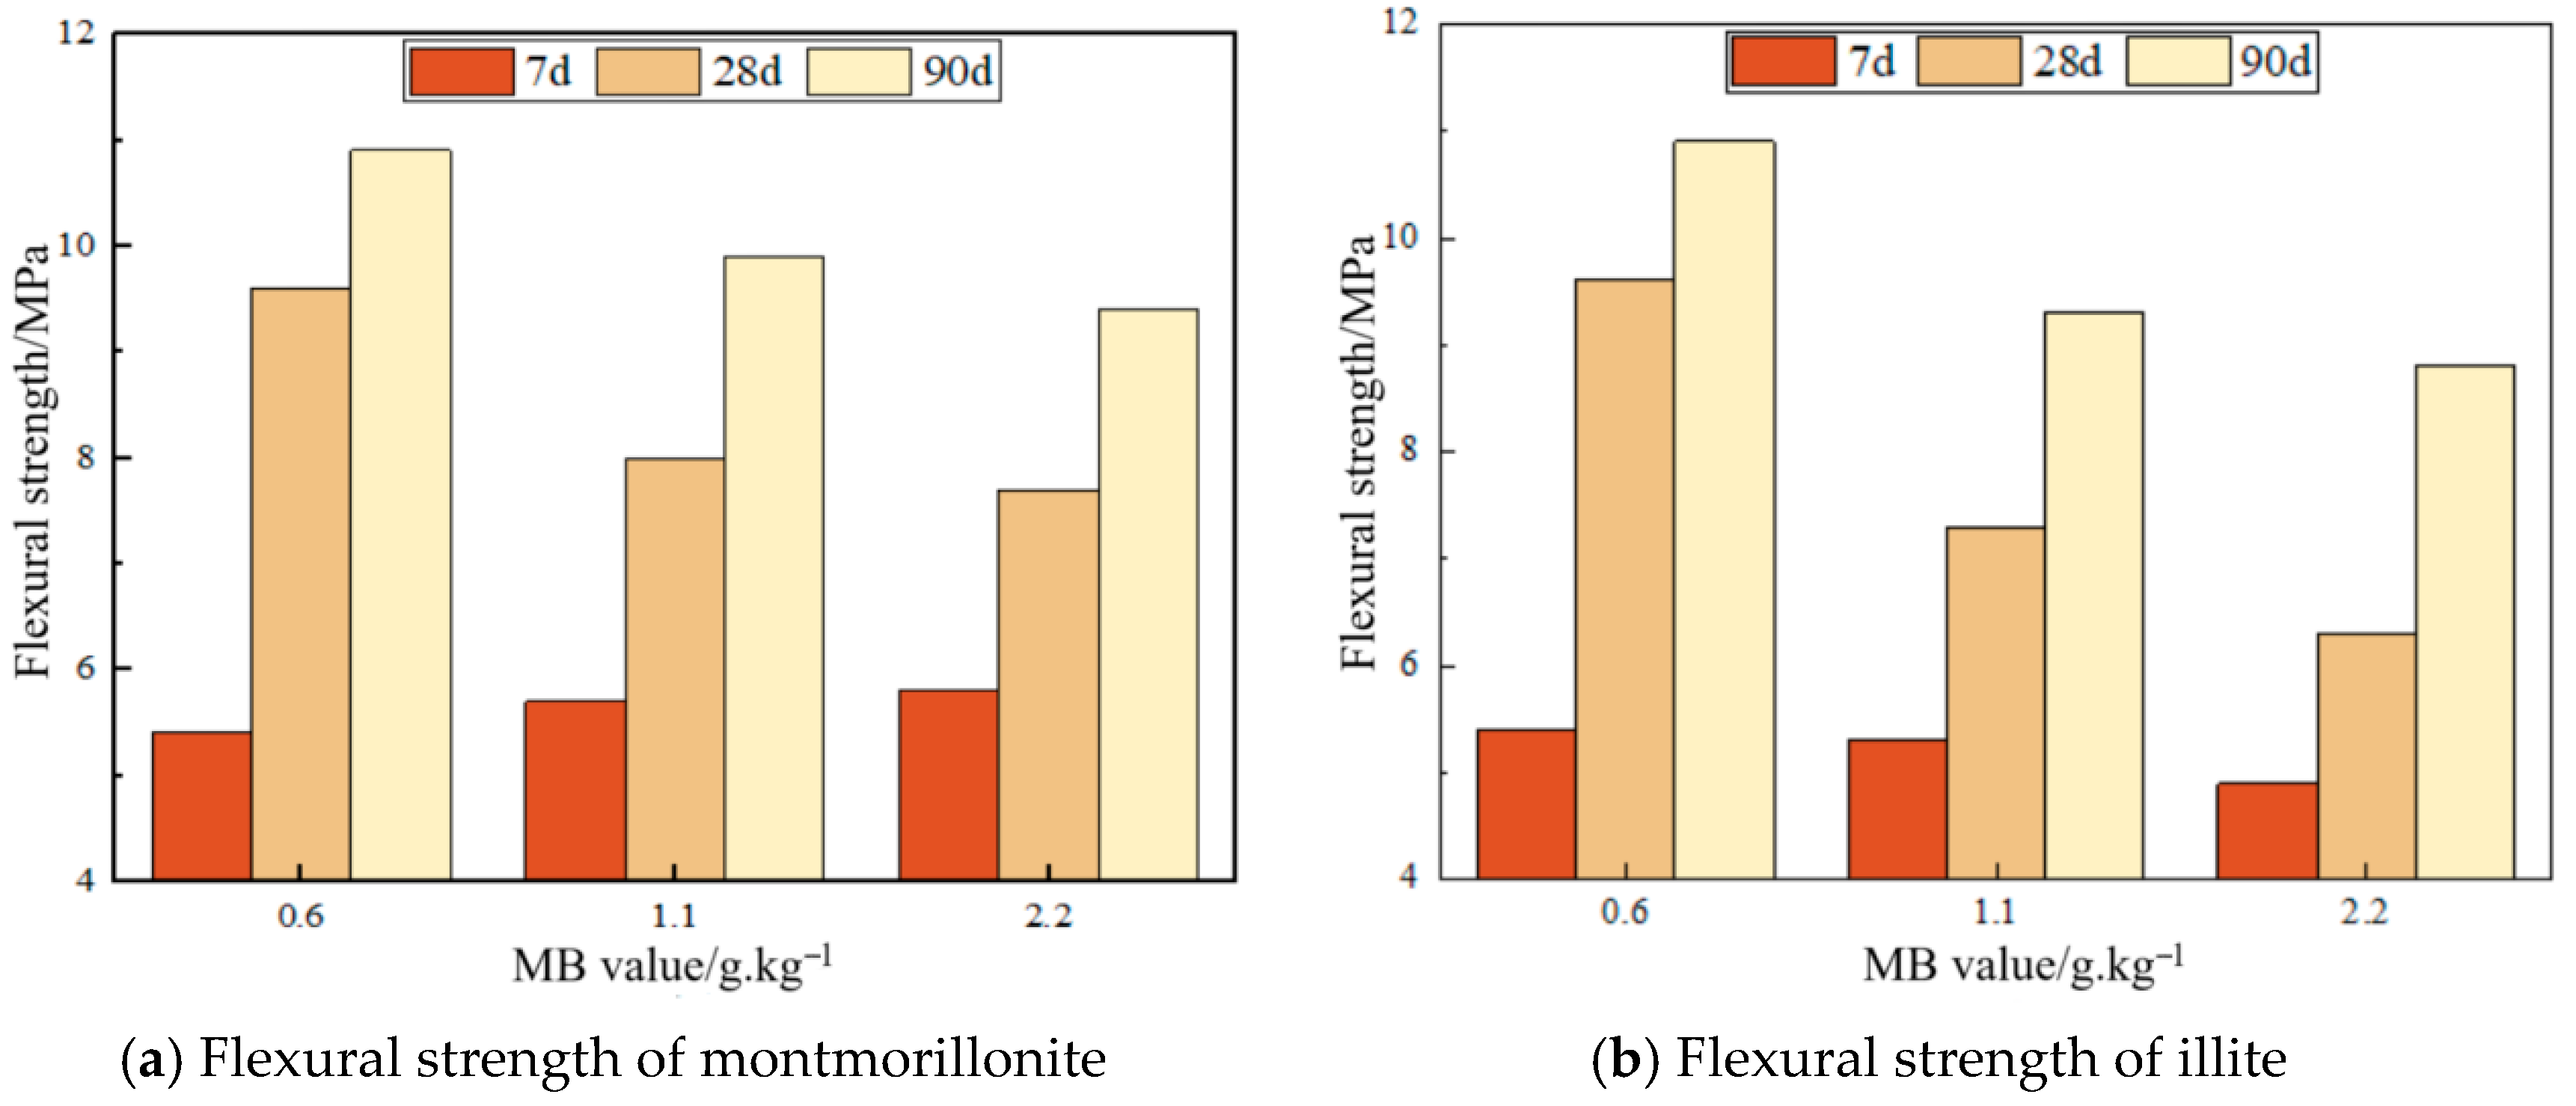
Figure 8 illustrates the patterns of flexural strength testing for mortar at 7, 28, and 90 days under varying MB values. As shown in Figure 8a, at constant flowability, the flexural strength of montmorillonite mortar increases at 7 days but decreases at 28 and 90 days with a rising MB value. First, when the MB value increases from 0.6 to 1.1, the 7-day flexural strength rises from 5.4 MPa to 5.7 MPa, showing a 5.6 percent increase; the 28-day flexural strength decreases from 9.6 MPa to 8.0 MPa, representing a 16.7 percent reduction; and the 90-day flexural strength decreases from 10.9 MPa to 9.9 MPa, indicating a 9.2 percent reduction. Second, when the MB value increases from 0.6 to 2.2, the 7-day flexural strength rises from 5.4 MPa to 5.8 MPa, corresponding to a 7.4 percent increase; the 28-day flexural strength decreases from 9.6 MPa to 7.7 MPa, marking a 19.8 percent reduction; and the 90-day flexural strength decreases from 10.9 MPa to 9.4 MPa, reflecting a 13.8 percent reduction. MB elevation exerts age-dependent effects on mortar flexural strength: at 7 days, montmorillonite mortar with an MB equal to 2.2 achieves peak flexural strength, contrasting with compressive strength optimization when MB equals 1.1, indicating beneficial flexural effects within the MB range of 0 to 2.2, primarily attributed to montmorillonite’s micro-filler dominance in small cross-section specimens; whereas at 28 and 90 days, the JZ exhibits superior flexural performance, confirming that an MB increase chronically compromises flexural capacity.
Figure 8b indicates a decreasing flexural strength in illite across 7d, 28d, and 90d curing ages with rising MB values under equivalent flowability. Specifically, an MB increase from 0.6 to 1.1 marginally reduced the 7d strength from 5.4 MPa to 5.3 MPa, remaining essentially unchanged, while substantially reducing the 28d strength from 9.6 MPa to 7.3 MPa, marking a 24.0 percent reduction, and lowering the 90d strength from 10.9 MPa to 9.3 MPa, reflecting a 14.7 percent reduction. Further MB elevation from 0.6 to 2.2 decreased the 7d strength to 4.9 MPa, with a 9.3 percent reduction, the 28d strength to 6.3 MPa, showing a 34.3 percent reduction, and the 90d strength to 8.8 MPa, indicating a 19.3 percent reduction. Both MB enhancement intervals from 0.6 to 1.1 and from 0.6 to 2.2 exhibited an initial increase followed by a decrease in strength reduction magnitude with prolonged aging, where the 0.6-to-1.1 group demonstrated more pronounced trends at both enhancement and attenuation stages.

3.5. Effect of MB Value on Mortar Drying Shrinkage

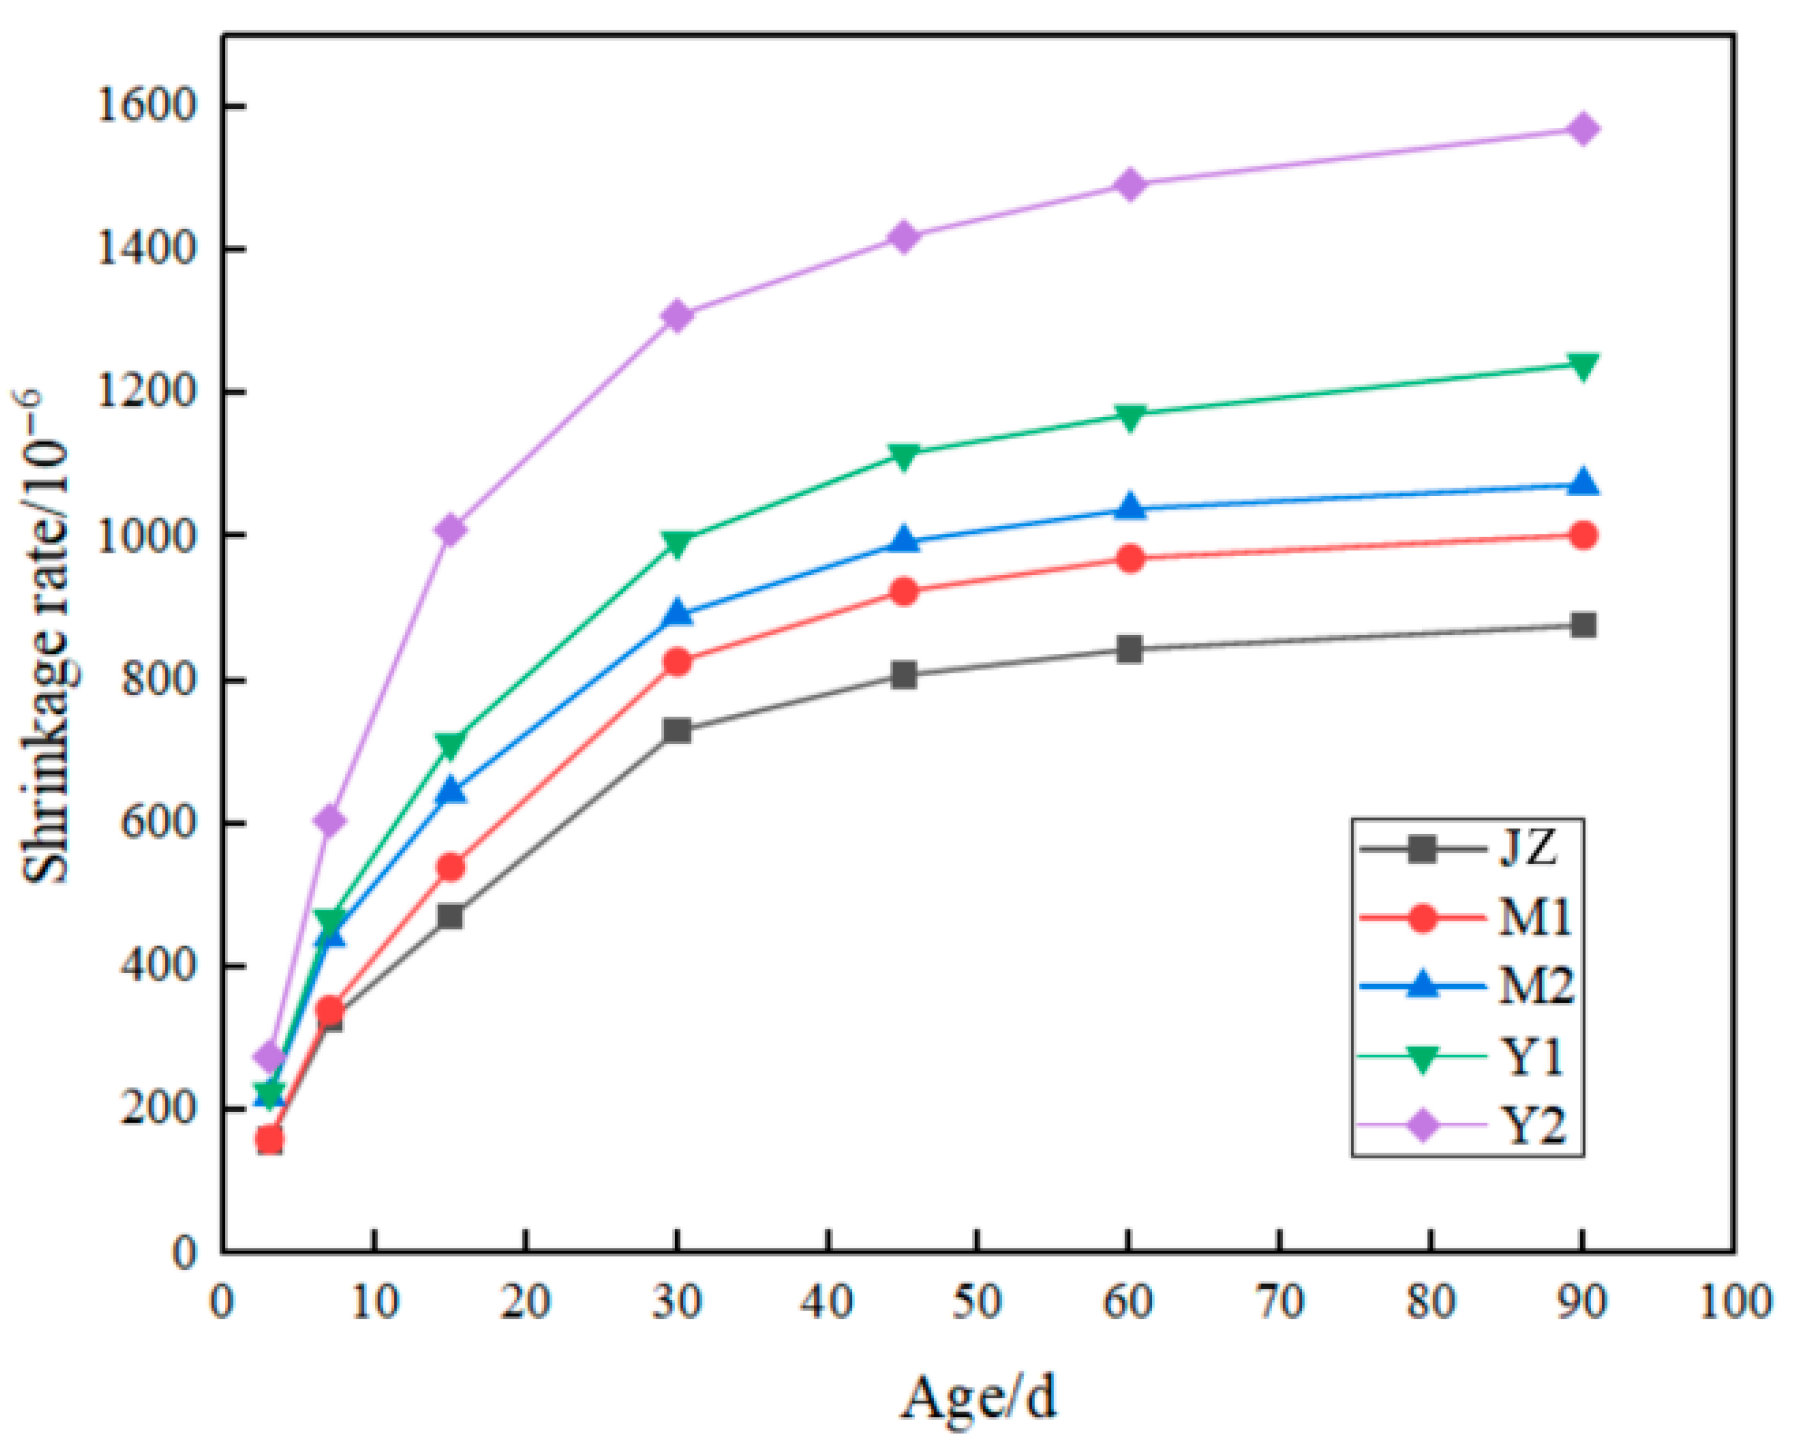
Figure 9 presents the specimen length measurements at 1d, 3d, 7d, 14d, 28d, 45d, 60d, and 90d alongside calculated drying shrinkage rates. The results demonstrate progressive shrinkage escalation with curing age, where MB value exerts substantial influence, particularly on early-stage drying shrinkage. During later phases, hydration decelerates as the adsorbed moisture in clay fines partially releases, shifting the dominant shrinkage mechanism to autogenous drying with attenuated growth rates [45]. Mortars containing identical clay types exhibit elevated shrinkage with increasing MB values, though specimens at MB = 2.2 unexpectedly manifest lower shrinkage than MB = 1.1 counterparts, indicating clay content predominance over MB value in shrinkage modulation.

3.6. Effect of MB Value on Mortar Frost Resistance

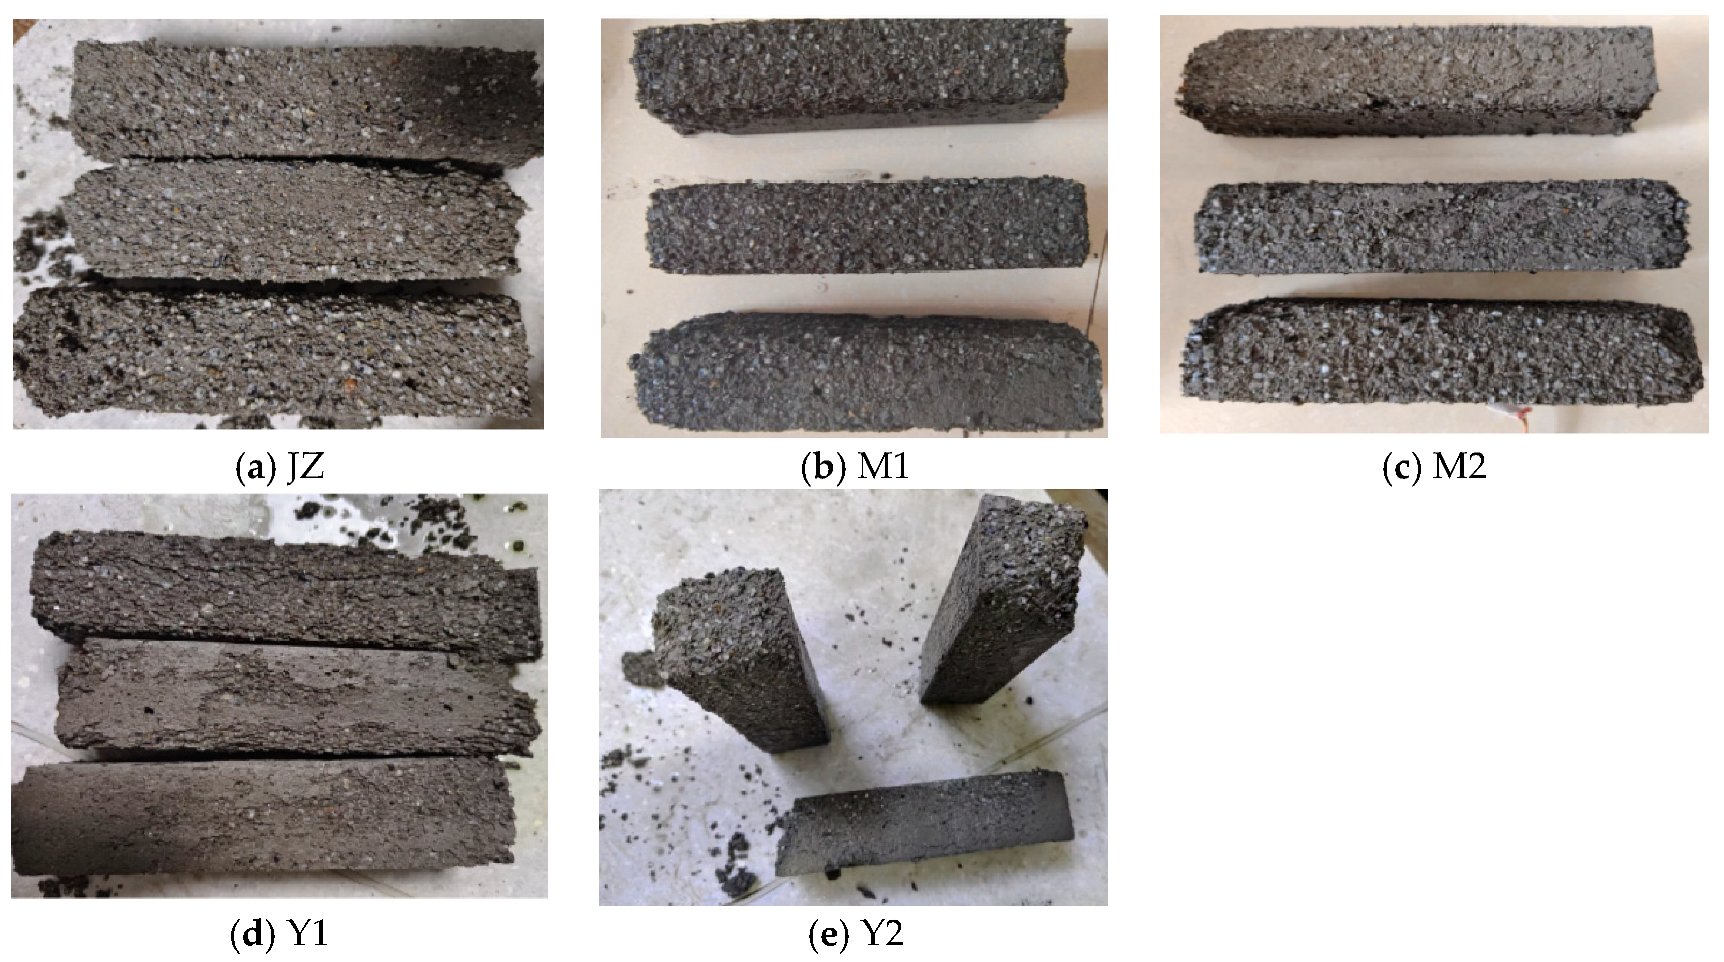
Figure 10 shows the mass loss of mortars with varied MB values. Figure 11 shows a freeze–thaw damage phenomenon under different conditions. These figures indicate that frost resistance grading criteria require a post-cycling mass loss below 5% and a relative dynamic elastic modulus exceeding 60%. The experimental results demonstrate that M1 and M2 mortars exhibit optimal frost resistance after 75 cycles (mass loss greater than 5%), with M2 showing greater mass loss than M1. Y2 mortar displays the poorest performance (mass loss greater than 5% after 25 cycles). The reference mortar and Y1 mortar exceed a 5% mass loss after 50 cycles, yet Y1 experiences higher mass loss than the reference. Montmorillonite-based mortars demonstrate enhanced frost resistance with increasing MB values, whereas illite-based mortars exhibit the opposite trend [46]. This observation confirms the dominant influence of clay content, where 2% or less clay fines improve frost resistance, while 3% or more prove detrimental. When assuming homogeneous dispersion within mortar matrices, limited clay fines refine pore structures through void filling and moisture migration path blocking. However, excessive clay fines, particularly porous varieties, absorb substantial capillary water, and their weakened capillary walls, when compared with conventional mortar, fracture under cyclic freezing conditions, thereby accelerating frost resistance degradation.

3.7. Effect of MB Value on Mortar Impermeability

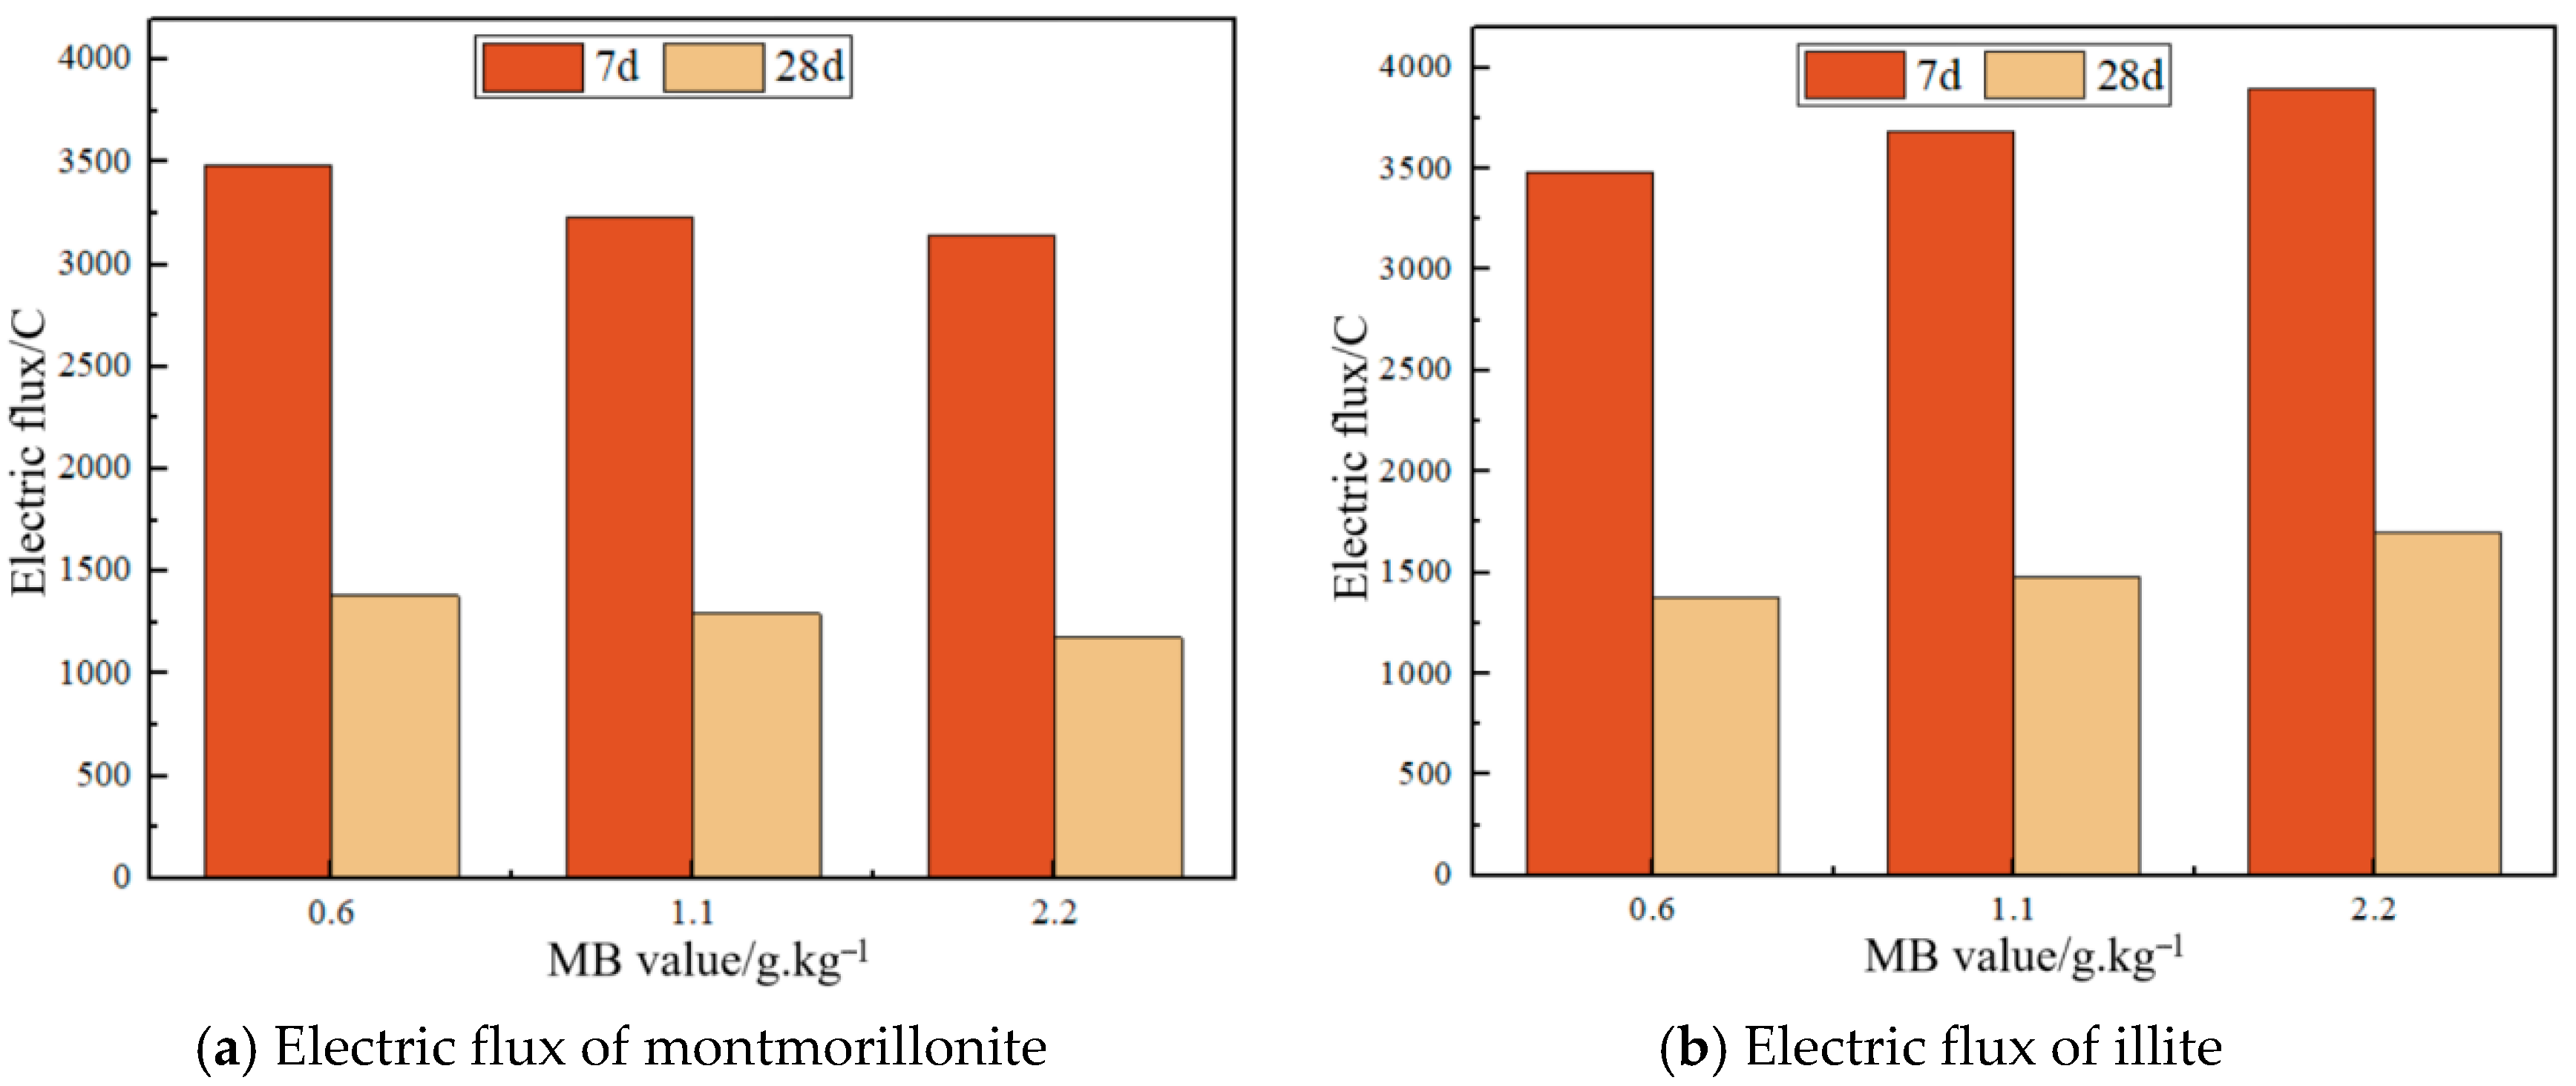
Figure 12 illustrates charge passed measurements reflecting chloride permeability of specimens at 7d and 28d curing ages under varying MB values, where a consistent charge passed reduction occurred with increasing MB values in montmorillonite mortars at both ages. Concurrently, a charge passed elevation was observed in illite mortars, indicating superior chloride permeability resistance compared to JZ for montmorillonite yet inferior performance for illite [47]. This further suggests significant clay content influence on impermeability, specifically that a clay content below 2% enhances mortar impermeability, while exceeding 3% deteriorates it, with the results aligning with the frost resistance test findings.

4. Effect of MB Value on Mortar Microstructure

4.1. Influence of MB Value on Mortar Pore Structure

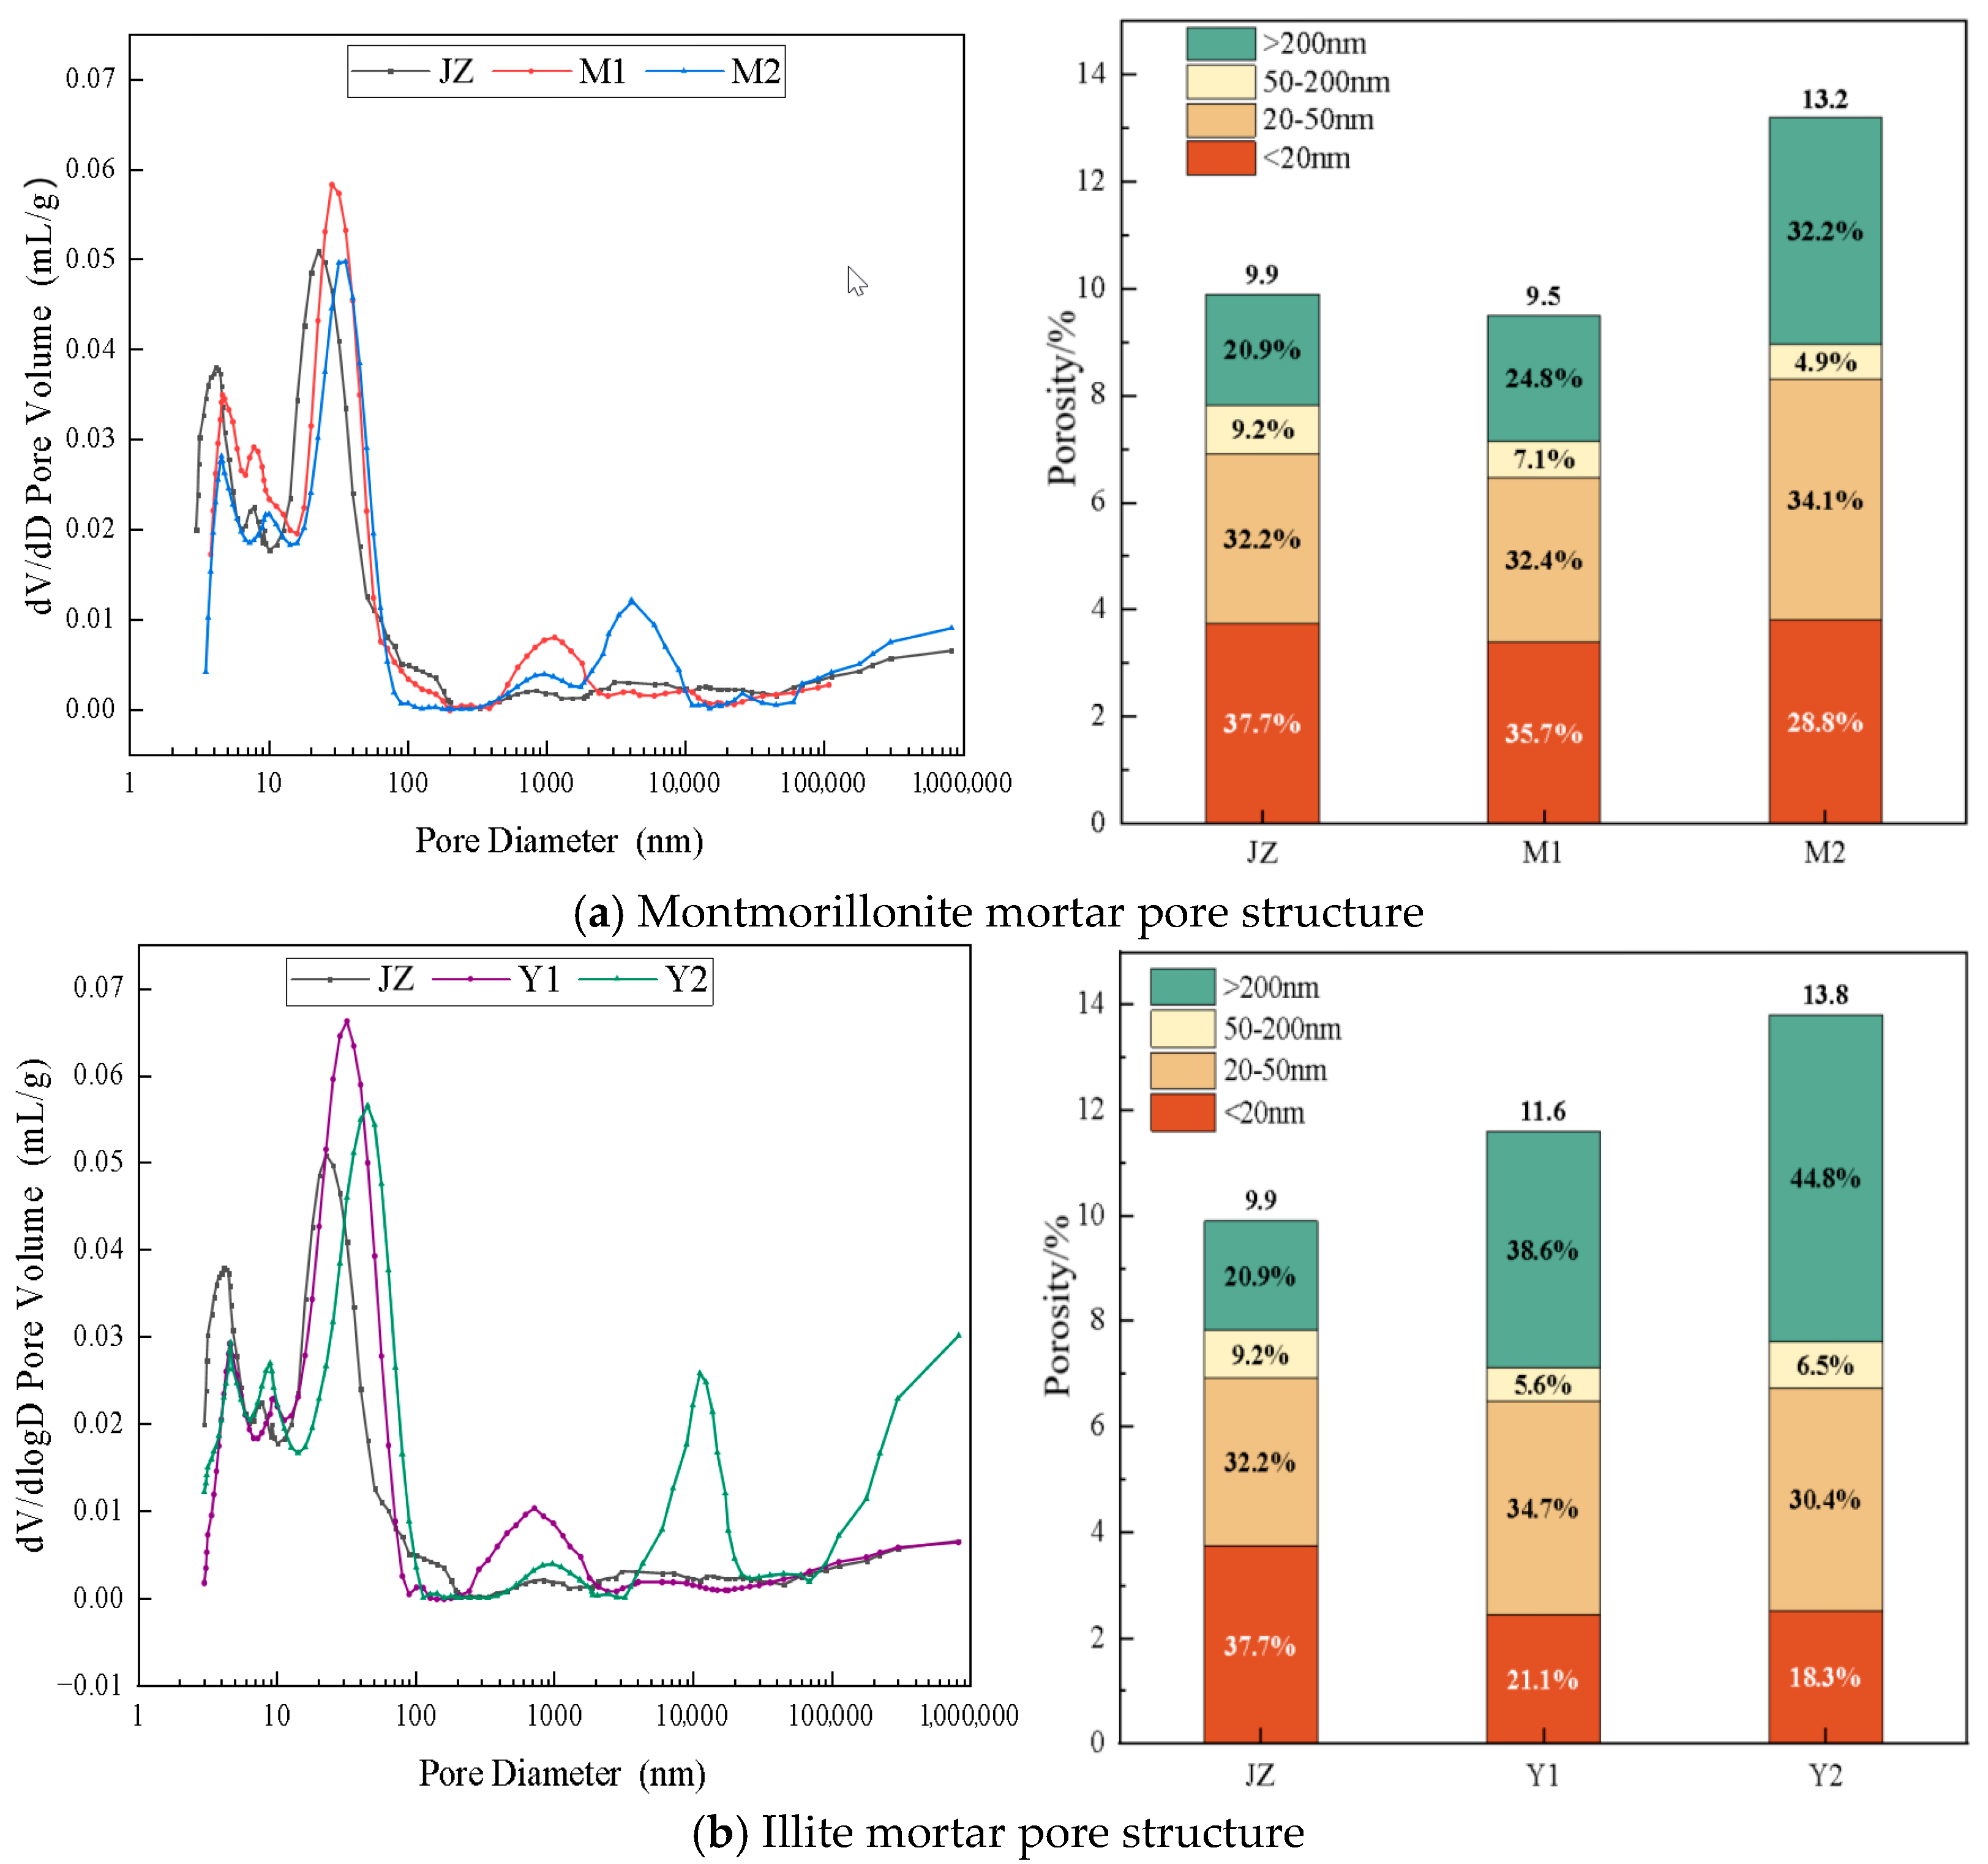
Mercury intrusion porosimetry on 28d-cured specimens established pore structure evolution patterns, classifying pores into four categories, pores below 20 nm as harmless, 20 to 50 nm as less harmful, 50 to 200 nm as harmful, and above 200 nm as multi-harmful, with the porosity, pore size distribution, average pore diameter, and median pore diameter provided in Table 4. The results reveal that the montmorillonite mortar porosity initially decreased then increased with rising MB values, while the illite mortar porosity consistently increased [39]; concurrently, both average and median pore diameters enlarged with MB increments. M1 exhibited comparable harmless and multi-harmful pores to JZ yet attained the lowest porosity, demonstrating that limited clay content reduces mortar porosity via a filling mechanism.
Figure 13 further elucidates the impact of MB value on mortar pore structure. M2 exhibits increased quantities of both small and large pores, indicating that montmorillonite’s influence on hydration outweighs its filler effect. Y2 demonstrates the lowest proportion of harmless pores and the highest proportion of highly harmful pores. The ranking of harmless and slightly harmful pore contents shows that M2 has the highest content, followed by JZ, then M1, Y1, and finally Y2 with the lowest content, while highly harmful pore contents show that JZ has the lowest content, followed by M1, then M2, Y1, and finally Y2 with the highest content. Increasing MB values progressively degrade pore structure and diminish the filler effect.
The peak diameter on the curve in Figure 13 represents the most probable pore diameter, reflecting the highest frequency pore size. Under standard curing, elevating MB values shifts the most probable pore diameter rightward for both montmorillonite and illite mortars, confirming its positive correlation with MB value. Higher MB values increase both the quantity and size of large pores [48]. Clay fines primarily exert dual effects: pore filling and hydration suppression via water absorption. M1 achieves the lowest porosity yet minimal harmless pores, signifying dominant pore-filling action. M2 shows increased porosity and harmful pores, revealing pronounced hydration inhibition at high MB values. Illite mortar develops weak interfacial zones due to weak interlayer bonding, promoting harmful pore formation and an inferior pore structure.

4.2. Microscopic Morphology Analysis

4.2.1. Microscopic Morphology Analysis of Montmorillonite and Illite

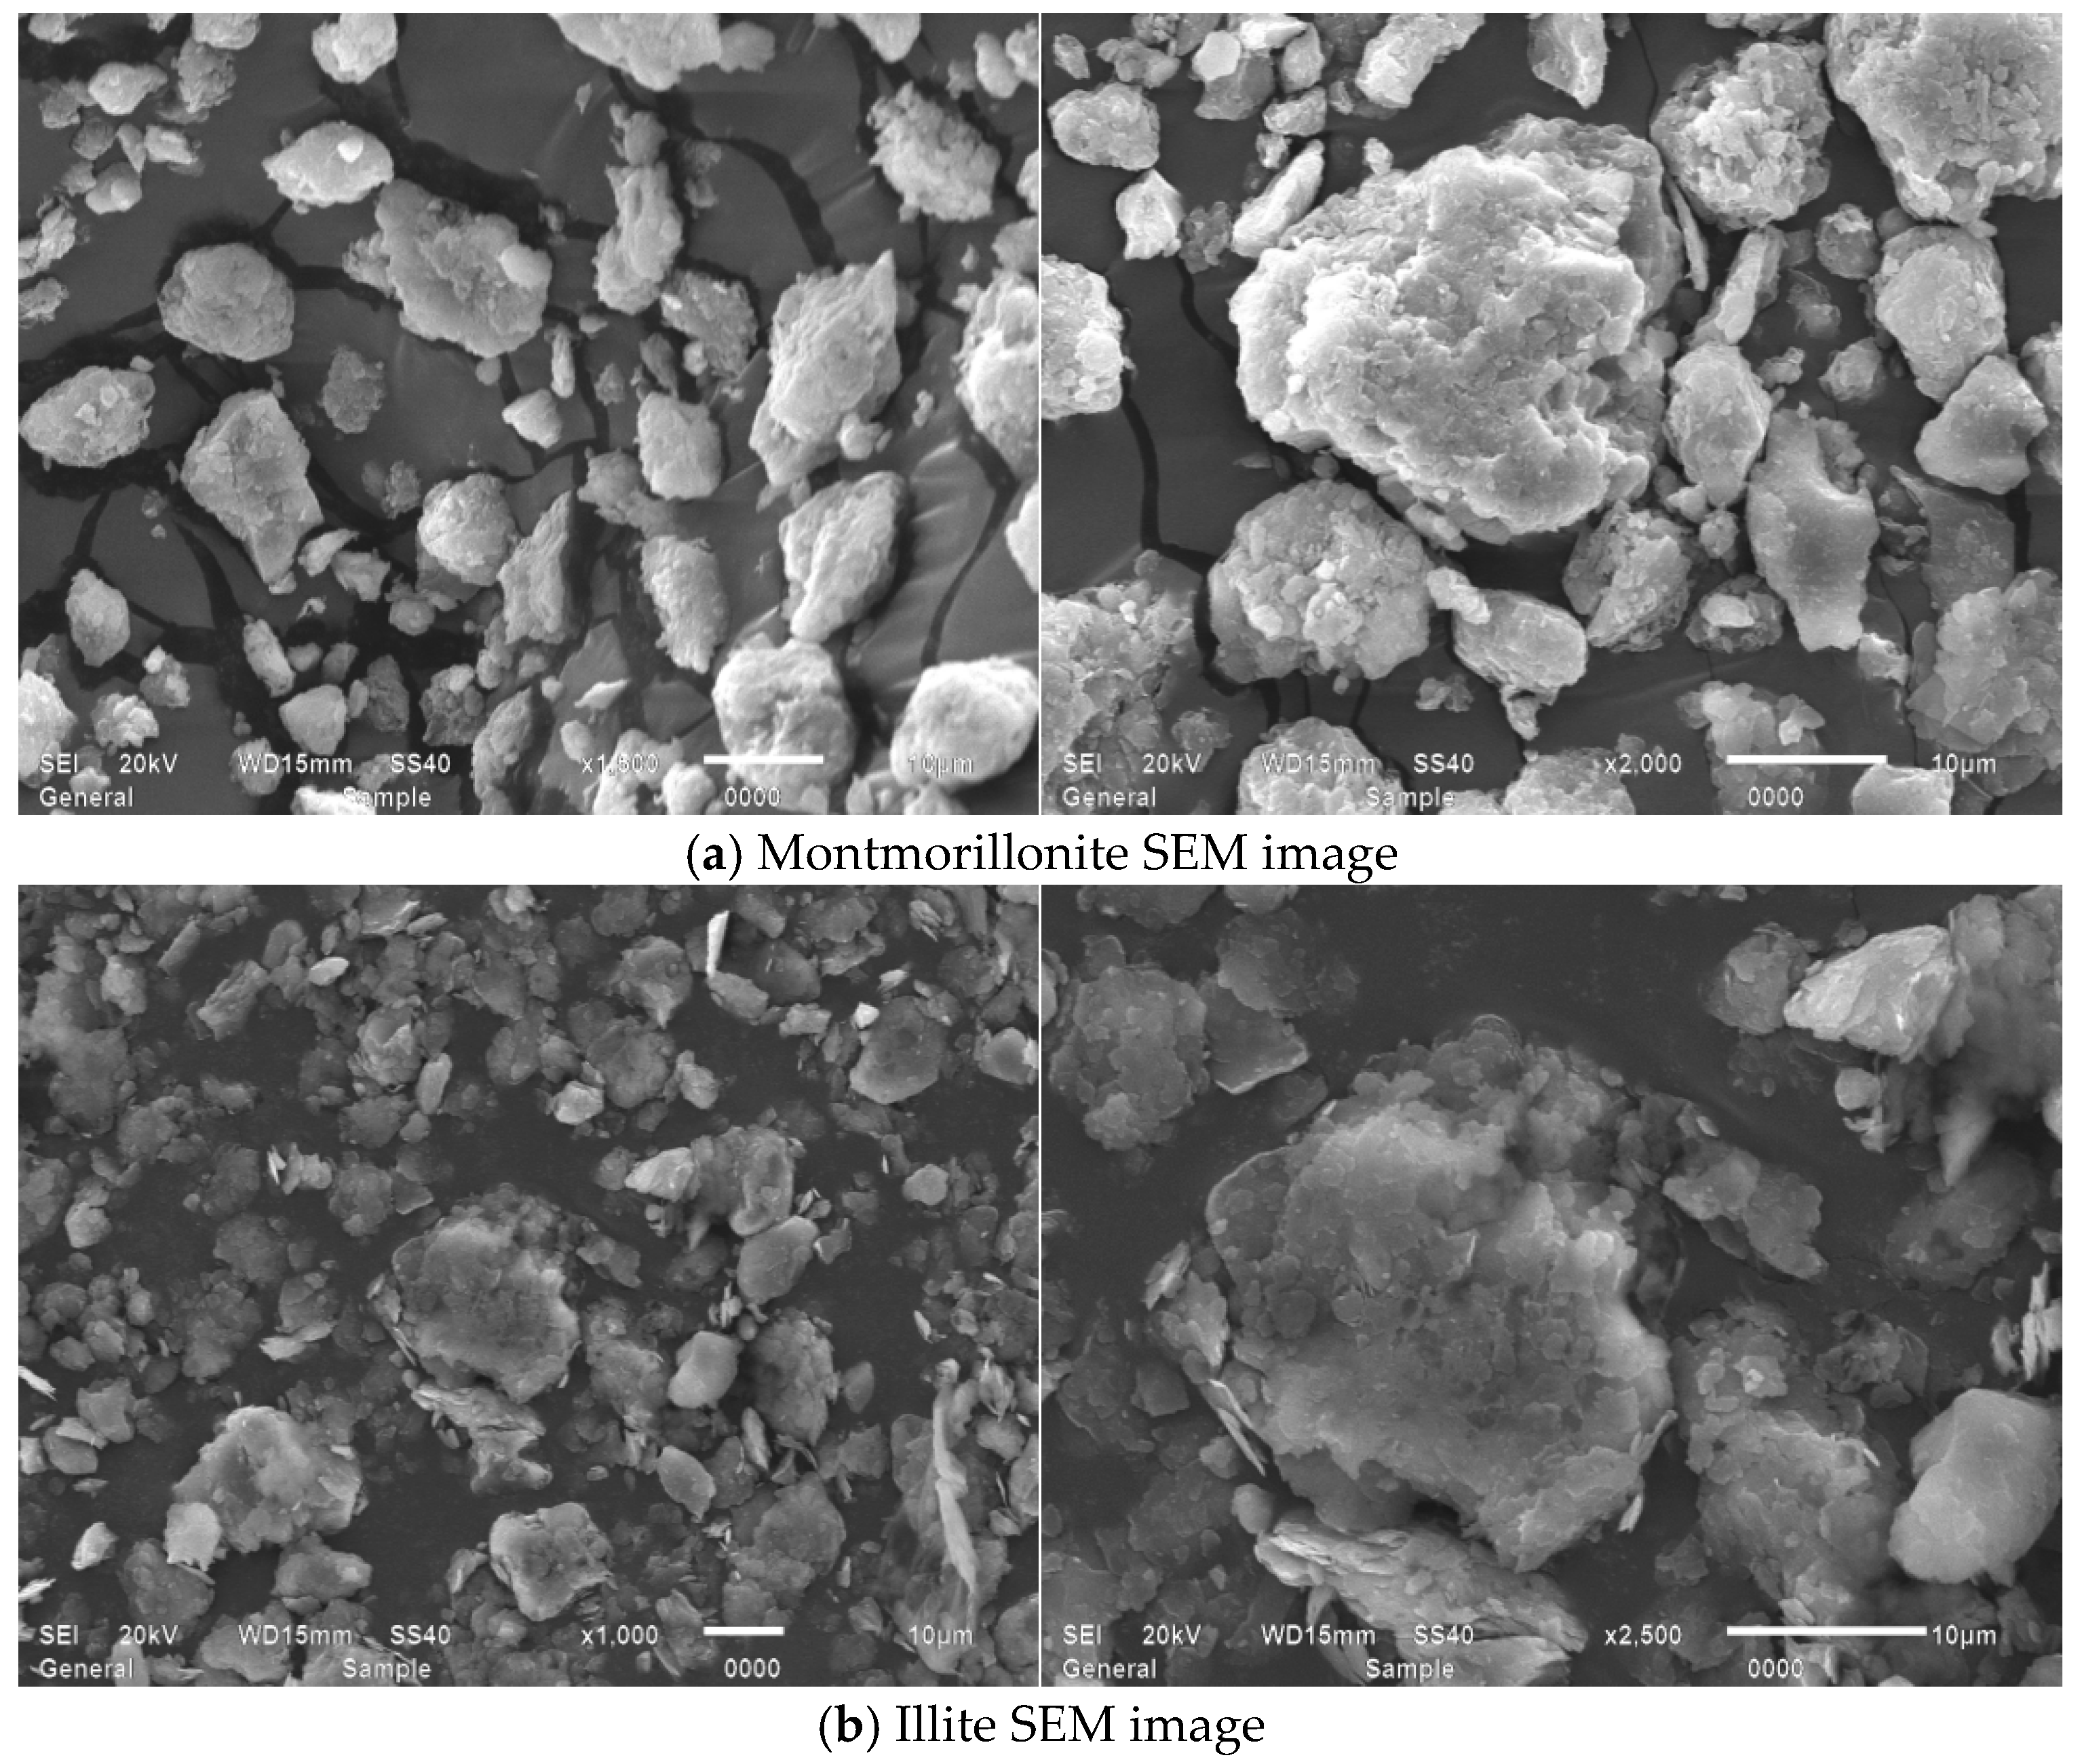
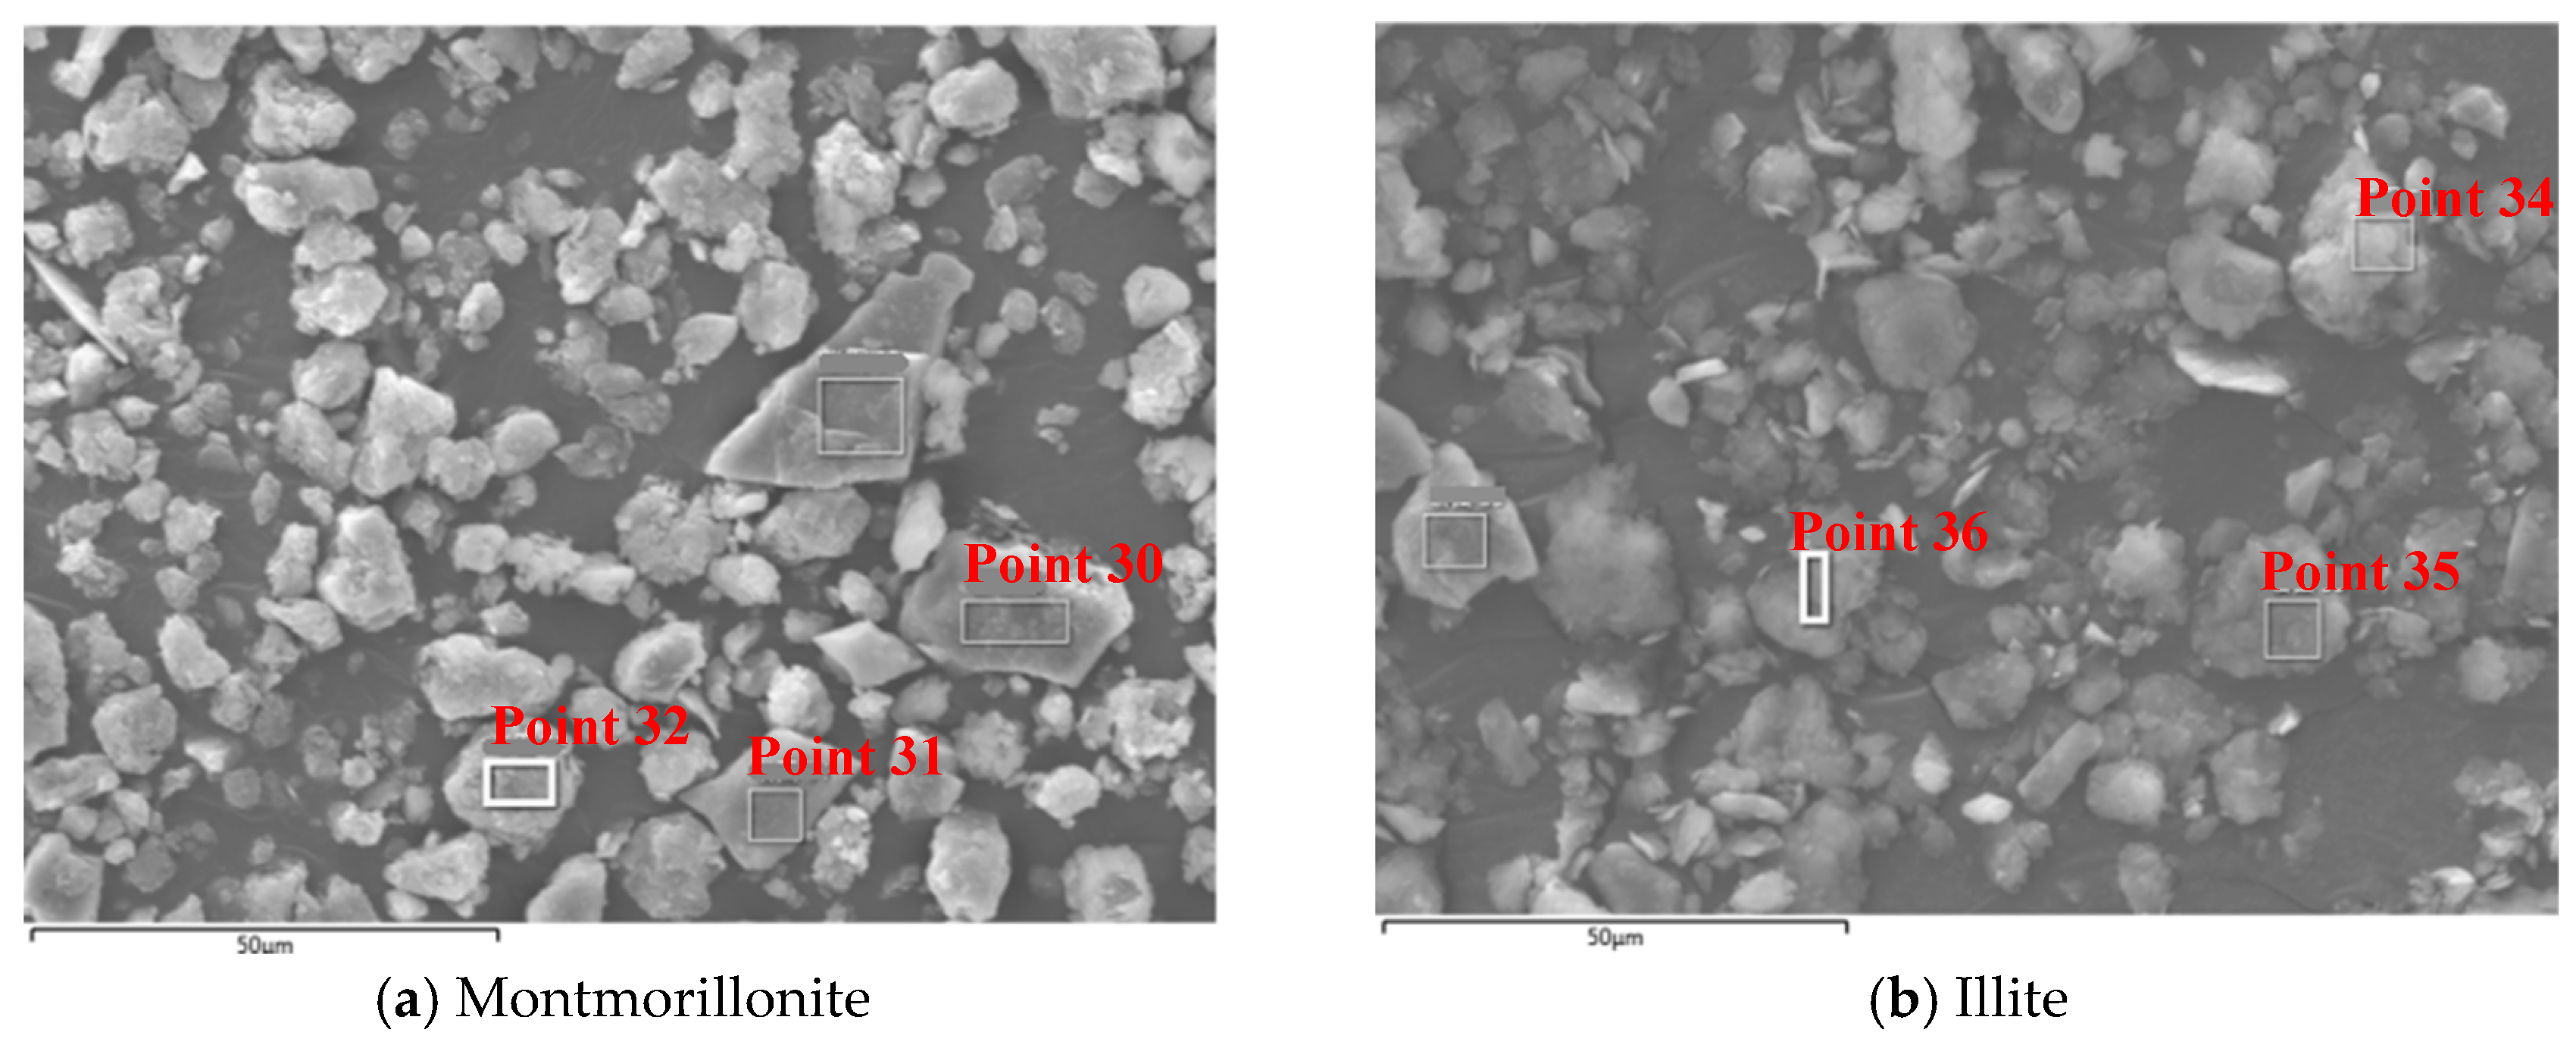
Figure 14 presents magnified SEM images of the montmorillonite and illite used in the experiments, revealing montmorillonite particles with rough, porous surfaces characterized by multi-layered stratification that features interlamellar pores visible between layers and irregularly curved edges, while illite particles exhibit smoother, denser surfaces with less undulation and comparatively straighter edges than montmorillonite.

4.2.2. Influence of MB Value on the Micro-Morphology of Mortars

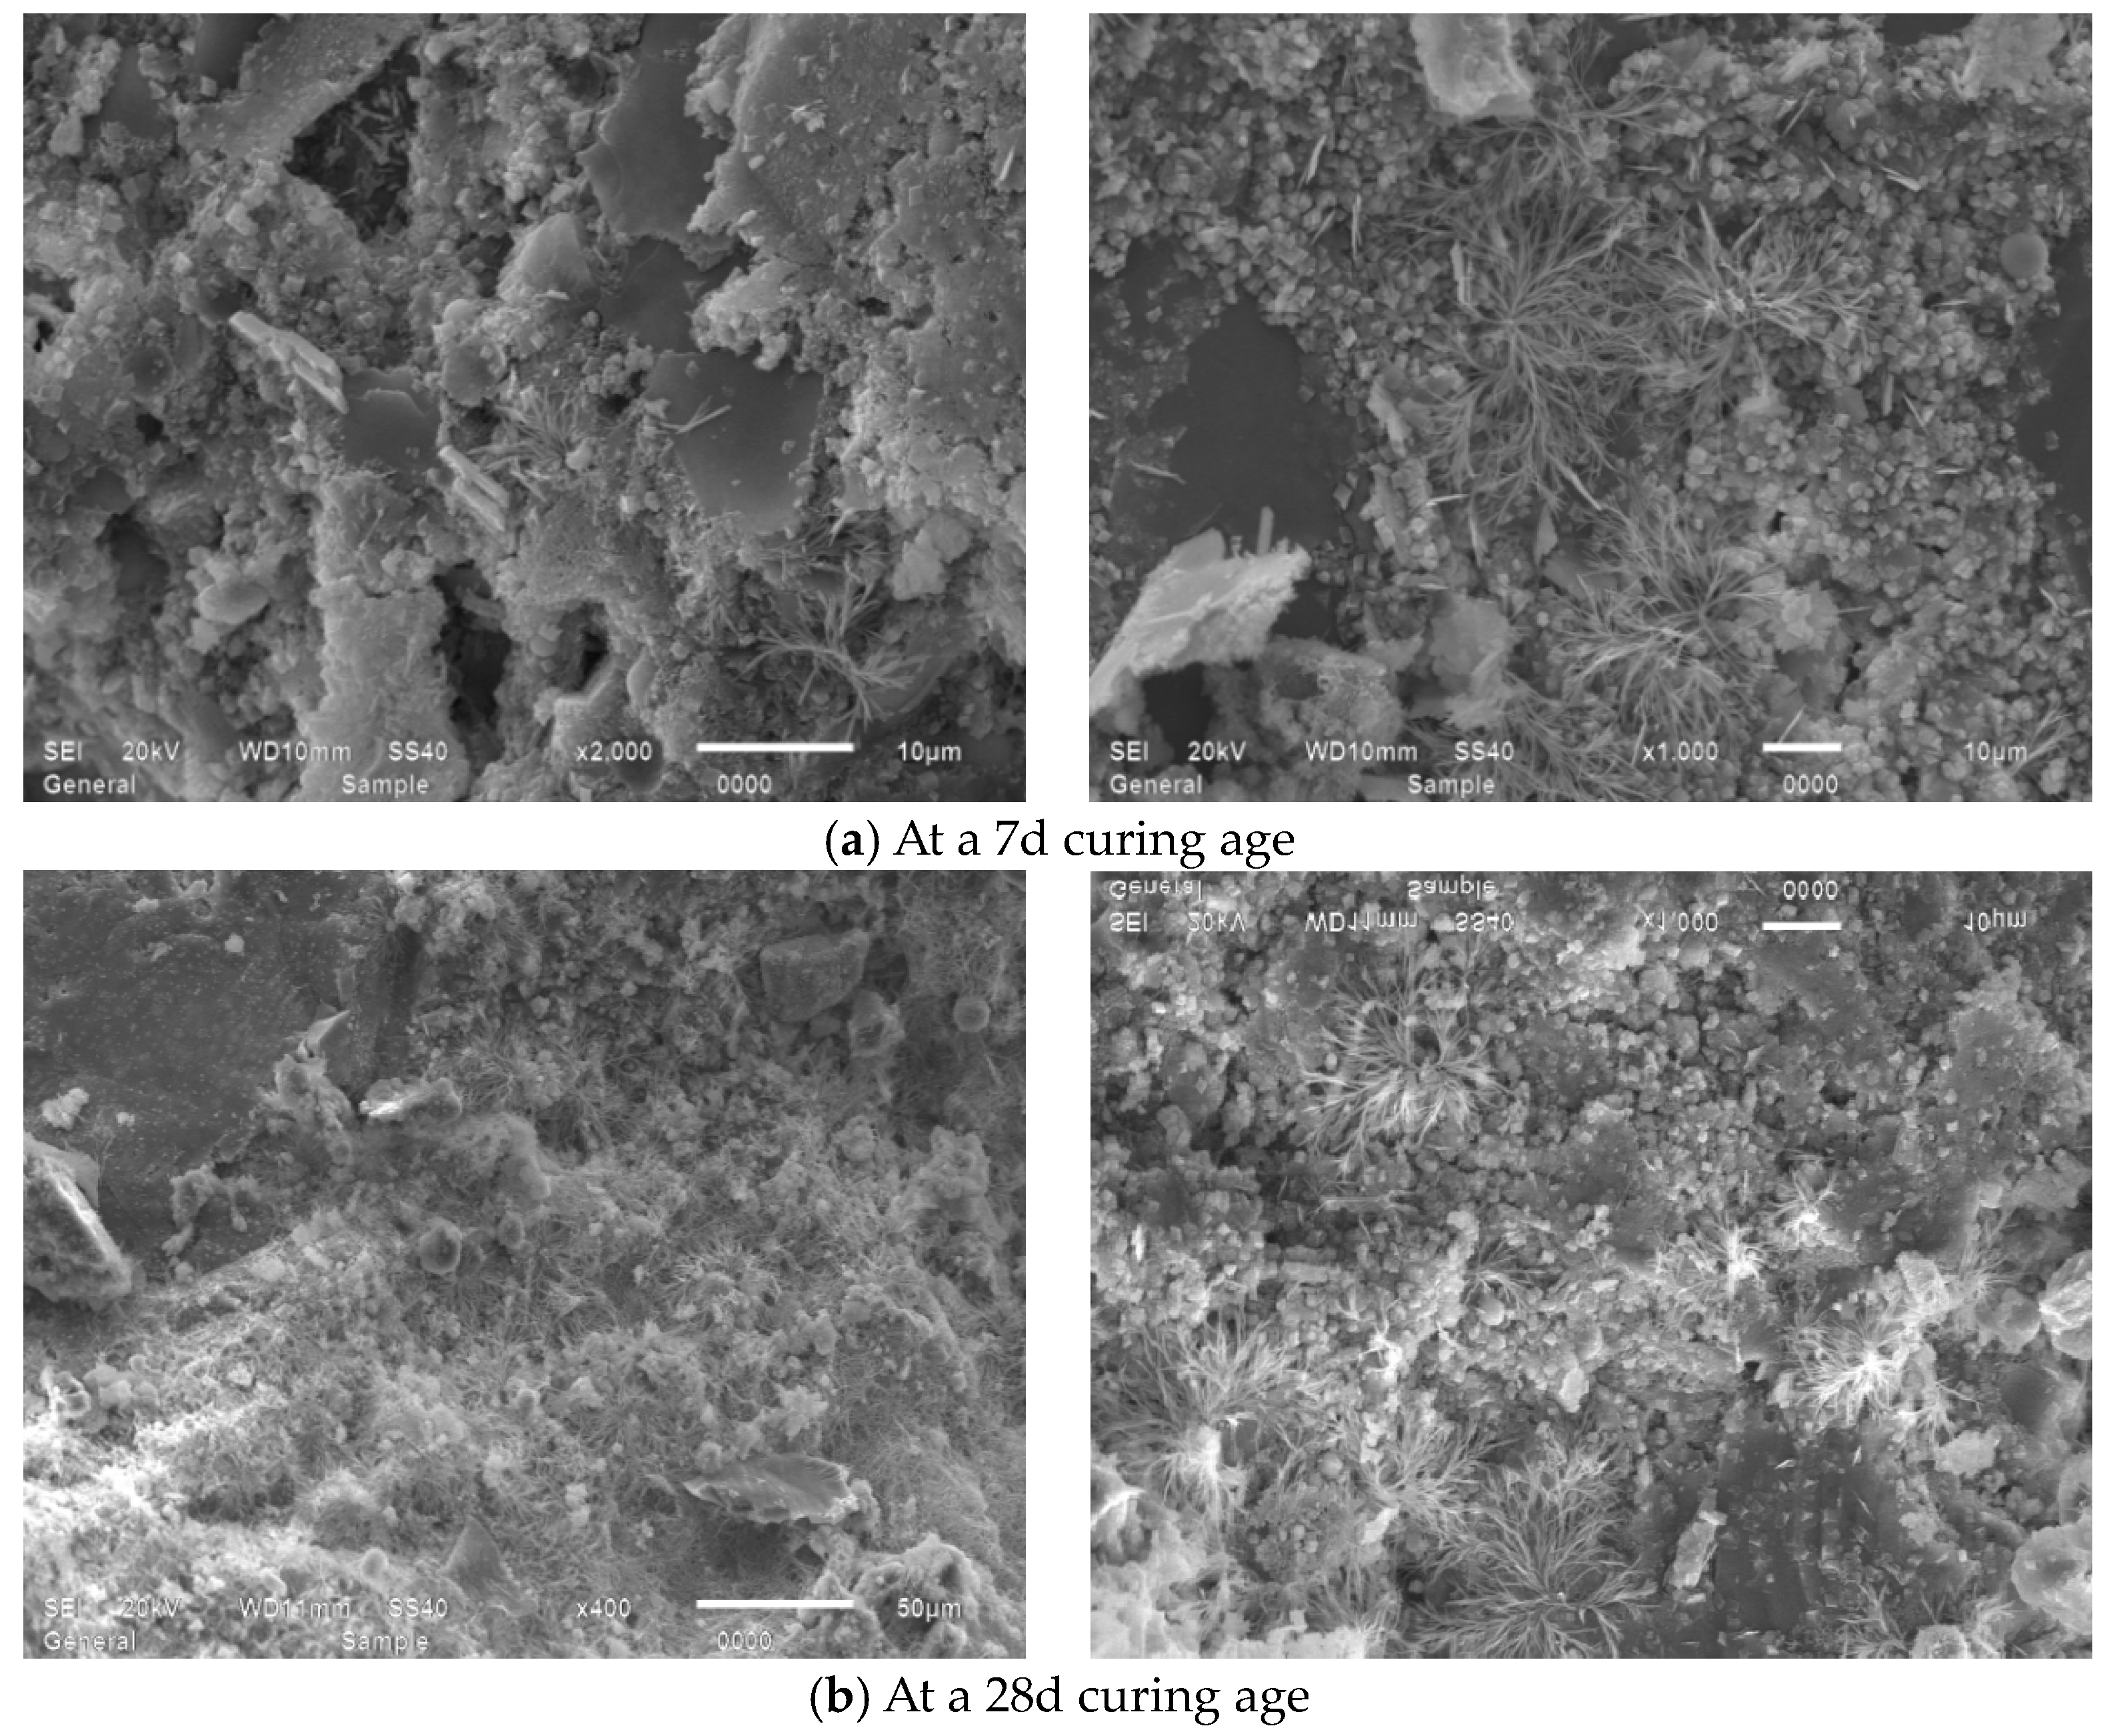
Figure 15 presents SEM observations of JZ specimens sectioned into 15 mm × 15 mm × 15 mm at 7-day and 28-day curing ages, revealing that at 7 days, the reference mortar contains amorphous flocculent C-S-H gel, minor acicular AFt crystals, hexagonal platy portlandite (CH), and irregular flat particles, where unhydrated cement particles interweave with hydration products to form the internal microstructure while exhibiting discernible voids, indicating partial yet incomplete hydration [49]. At 28 days, substantially increased amorphous C-S-H gel forms interconnected honeycomb frameworks that coalesce with other hydration products into dense network structures, showing a conspicuous absence of acicular AFt, a significant reduction in unhydrated cement particles, and diminished or refined pores filled by C-S-H gel, collectively evidencing an enhanced hydration degree, amplified reaction products, and progressive pore refinement with extended curing.
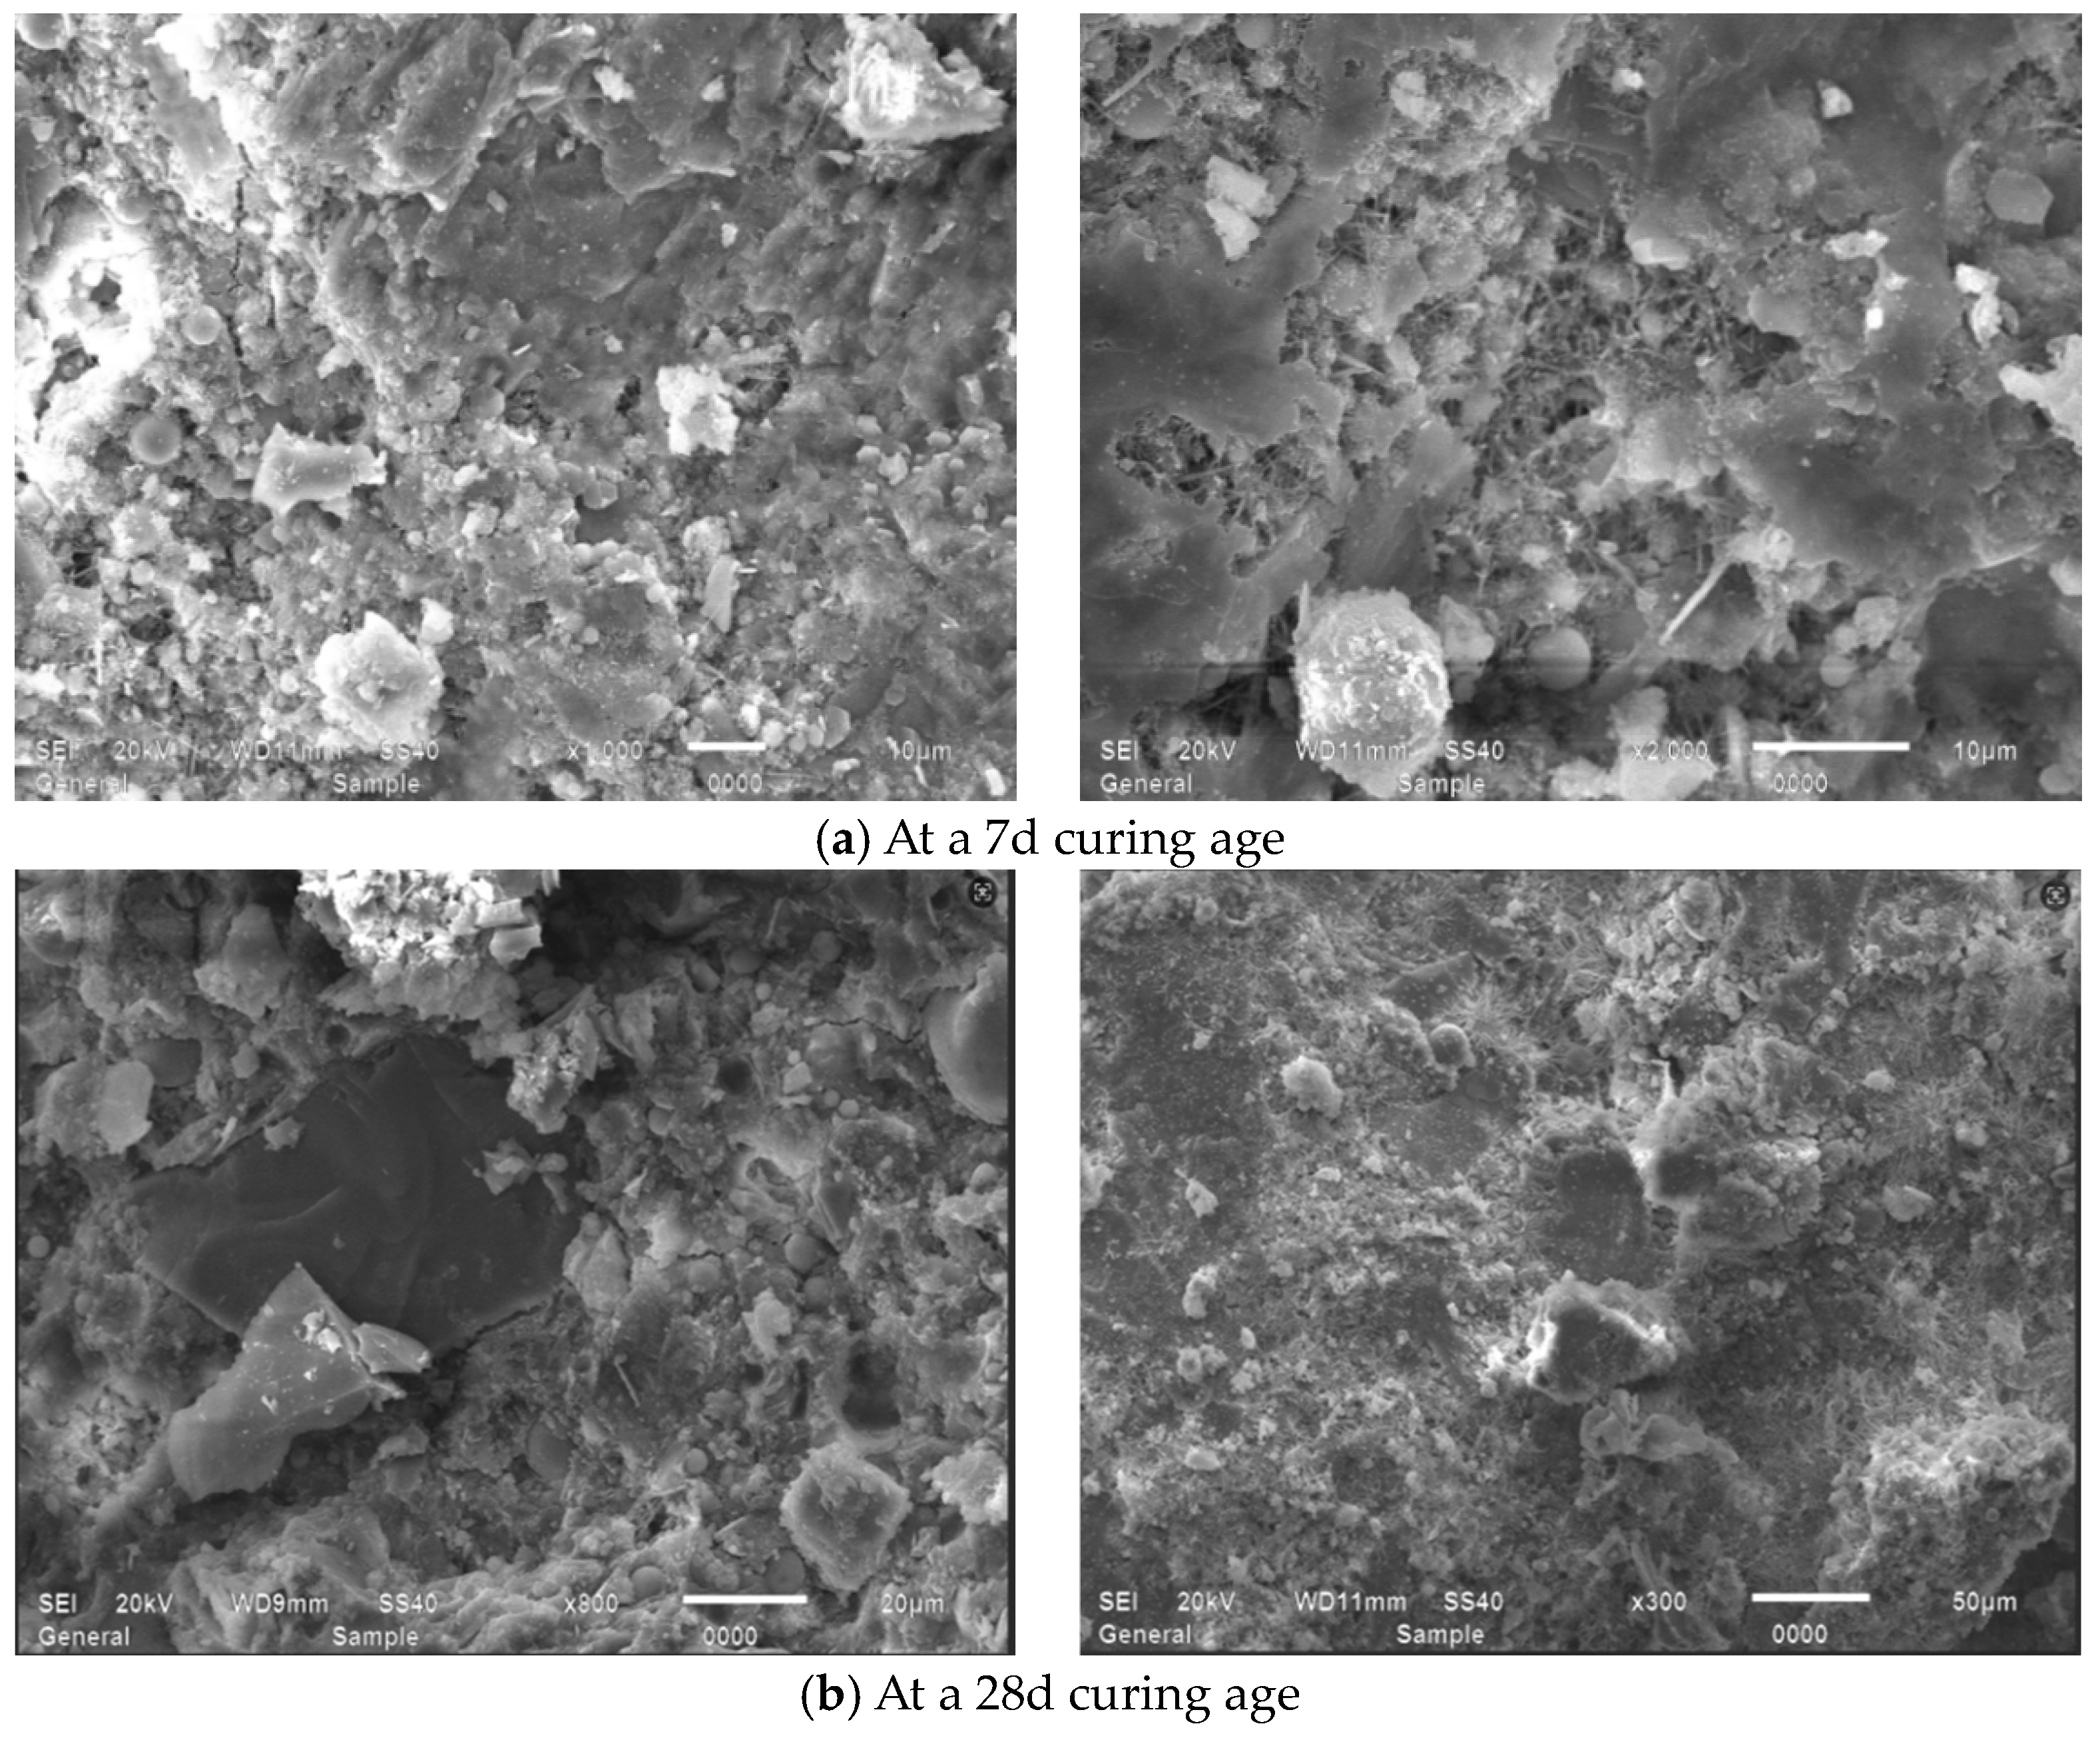
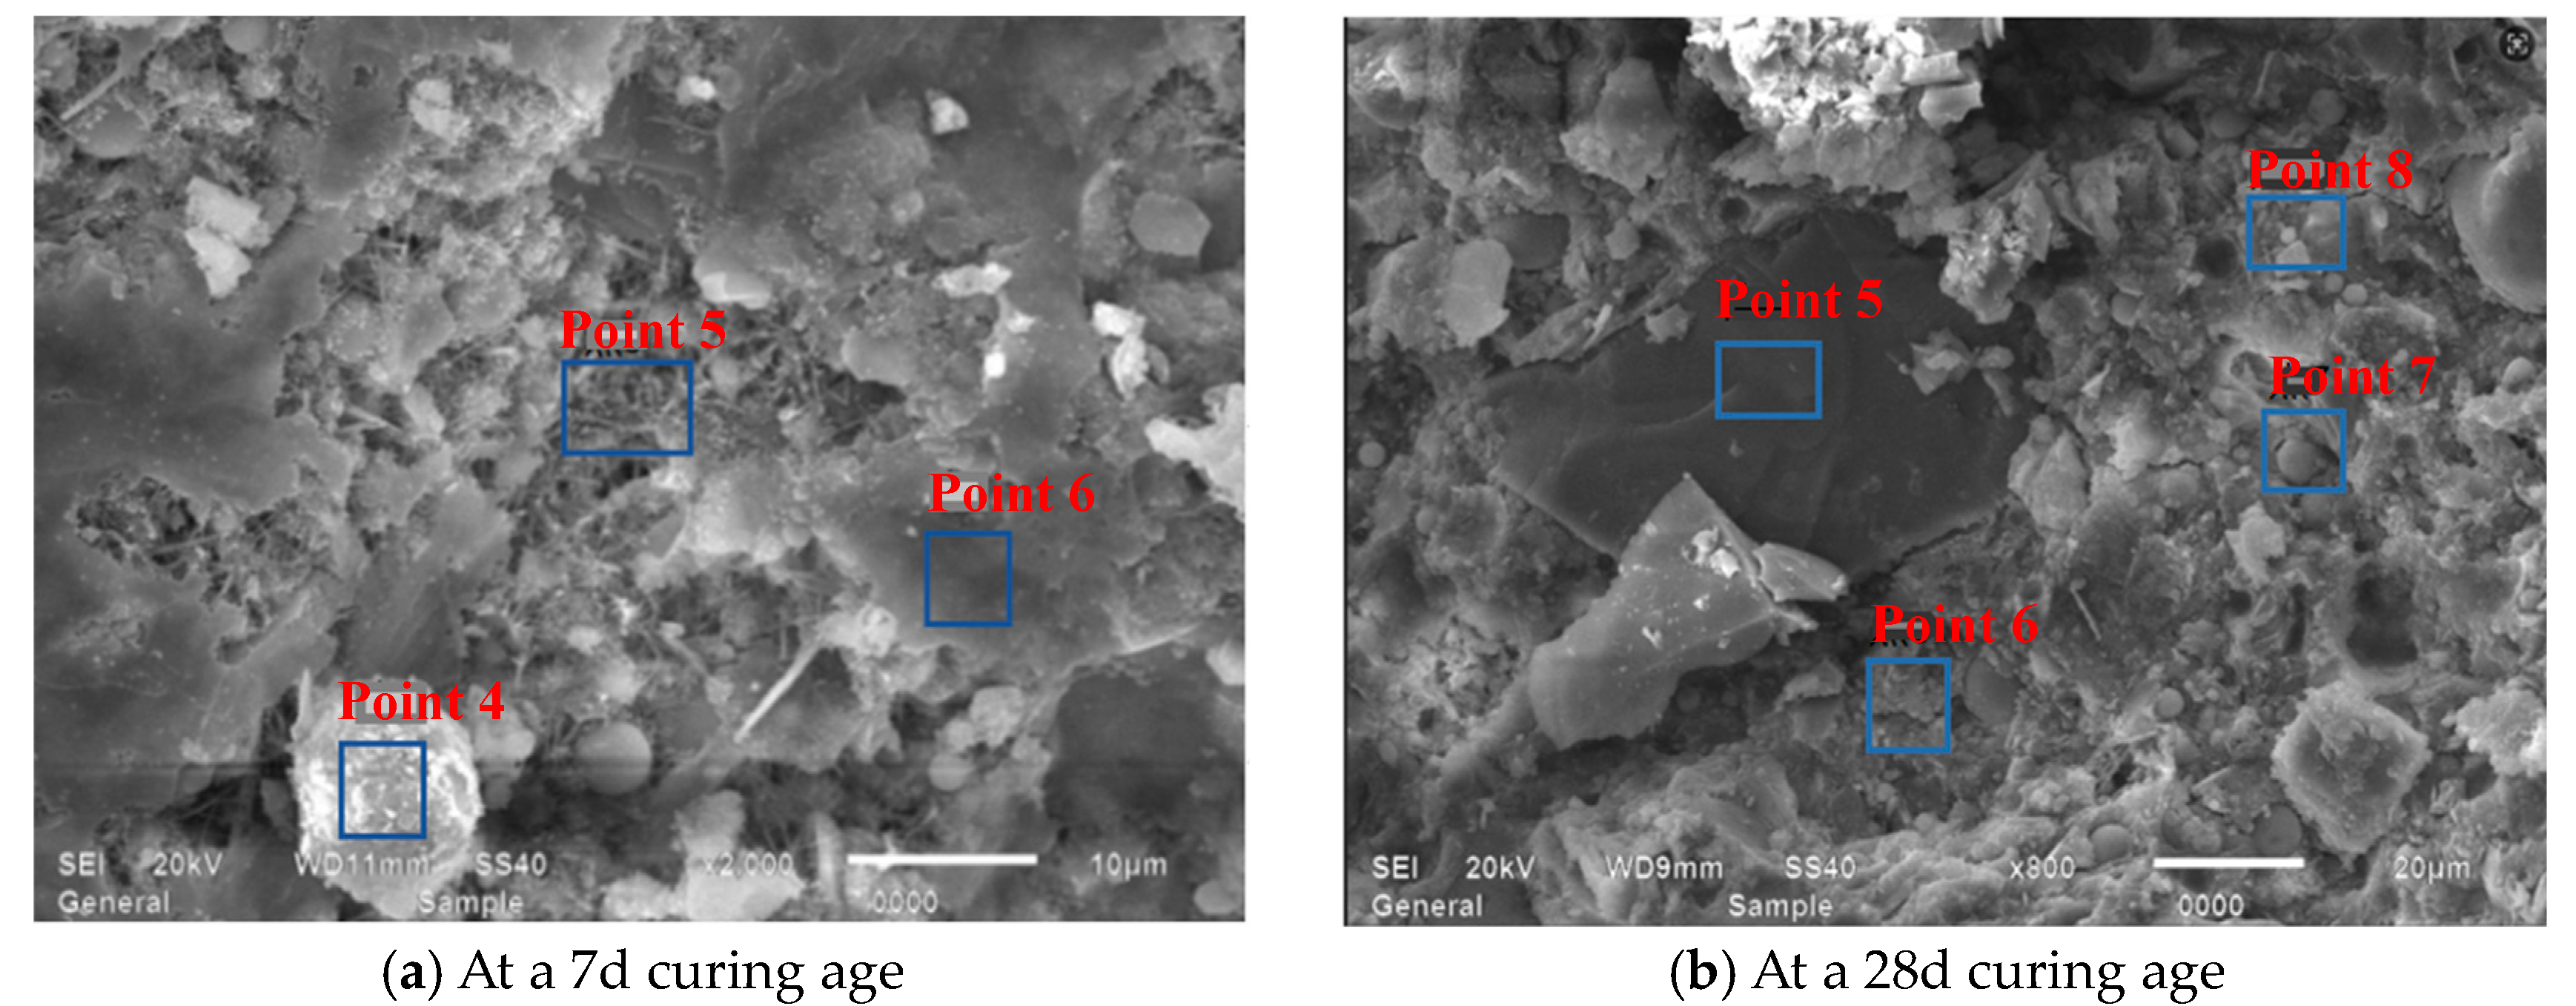
Figure 16 displays SEM images of M1 specimens sectioned into 5 mm × 15 mm × 15 mm at 7-day and 28-day curing ages, revealing that at 7 days, the M1 mortar similarly contains amorphous flocculent C-S-H gel, partially formed hexagonal platy portlandite crystals, and minor acicular AFt, where C-S-H gel co-constructs the internal microstructure with lamellar hydration products while infiltrating voids, and montmorillonite is shown to fill interstitial spaces among cement hydrates [50]. By 28 days, significantly increased C-S-H gel forms extensive coalescence alongside discernible hexagonal portlandite crystals and diversified hydration products, yielding densified microstructures through synergistic integration, with reduced or refined pores occupied by hydration products and montmorillonite. A comparative analysis indicates negligible microstructural divergence from the reference mortar at 7 days except for minor montmorillonite presence, while at 28 days, it exhibits a discernible C-S-H reduction and weakened cohesion among hydration products relative to the reference system.
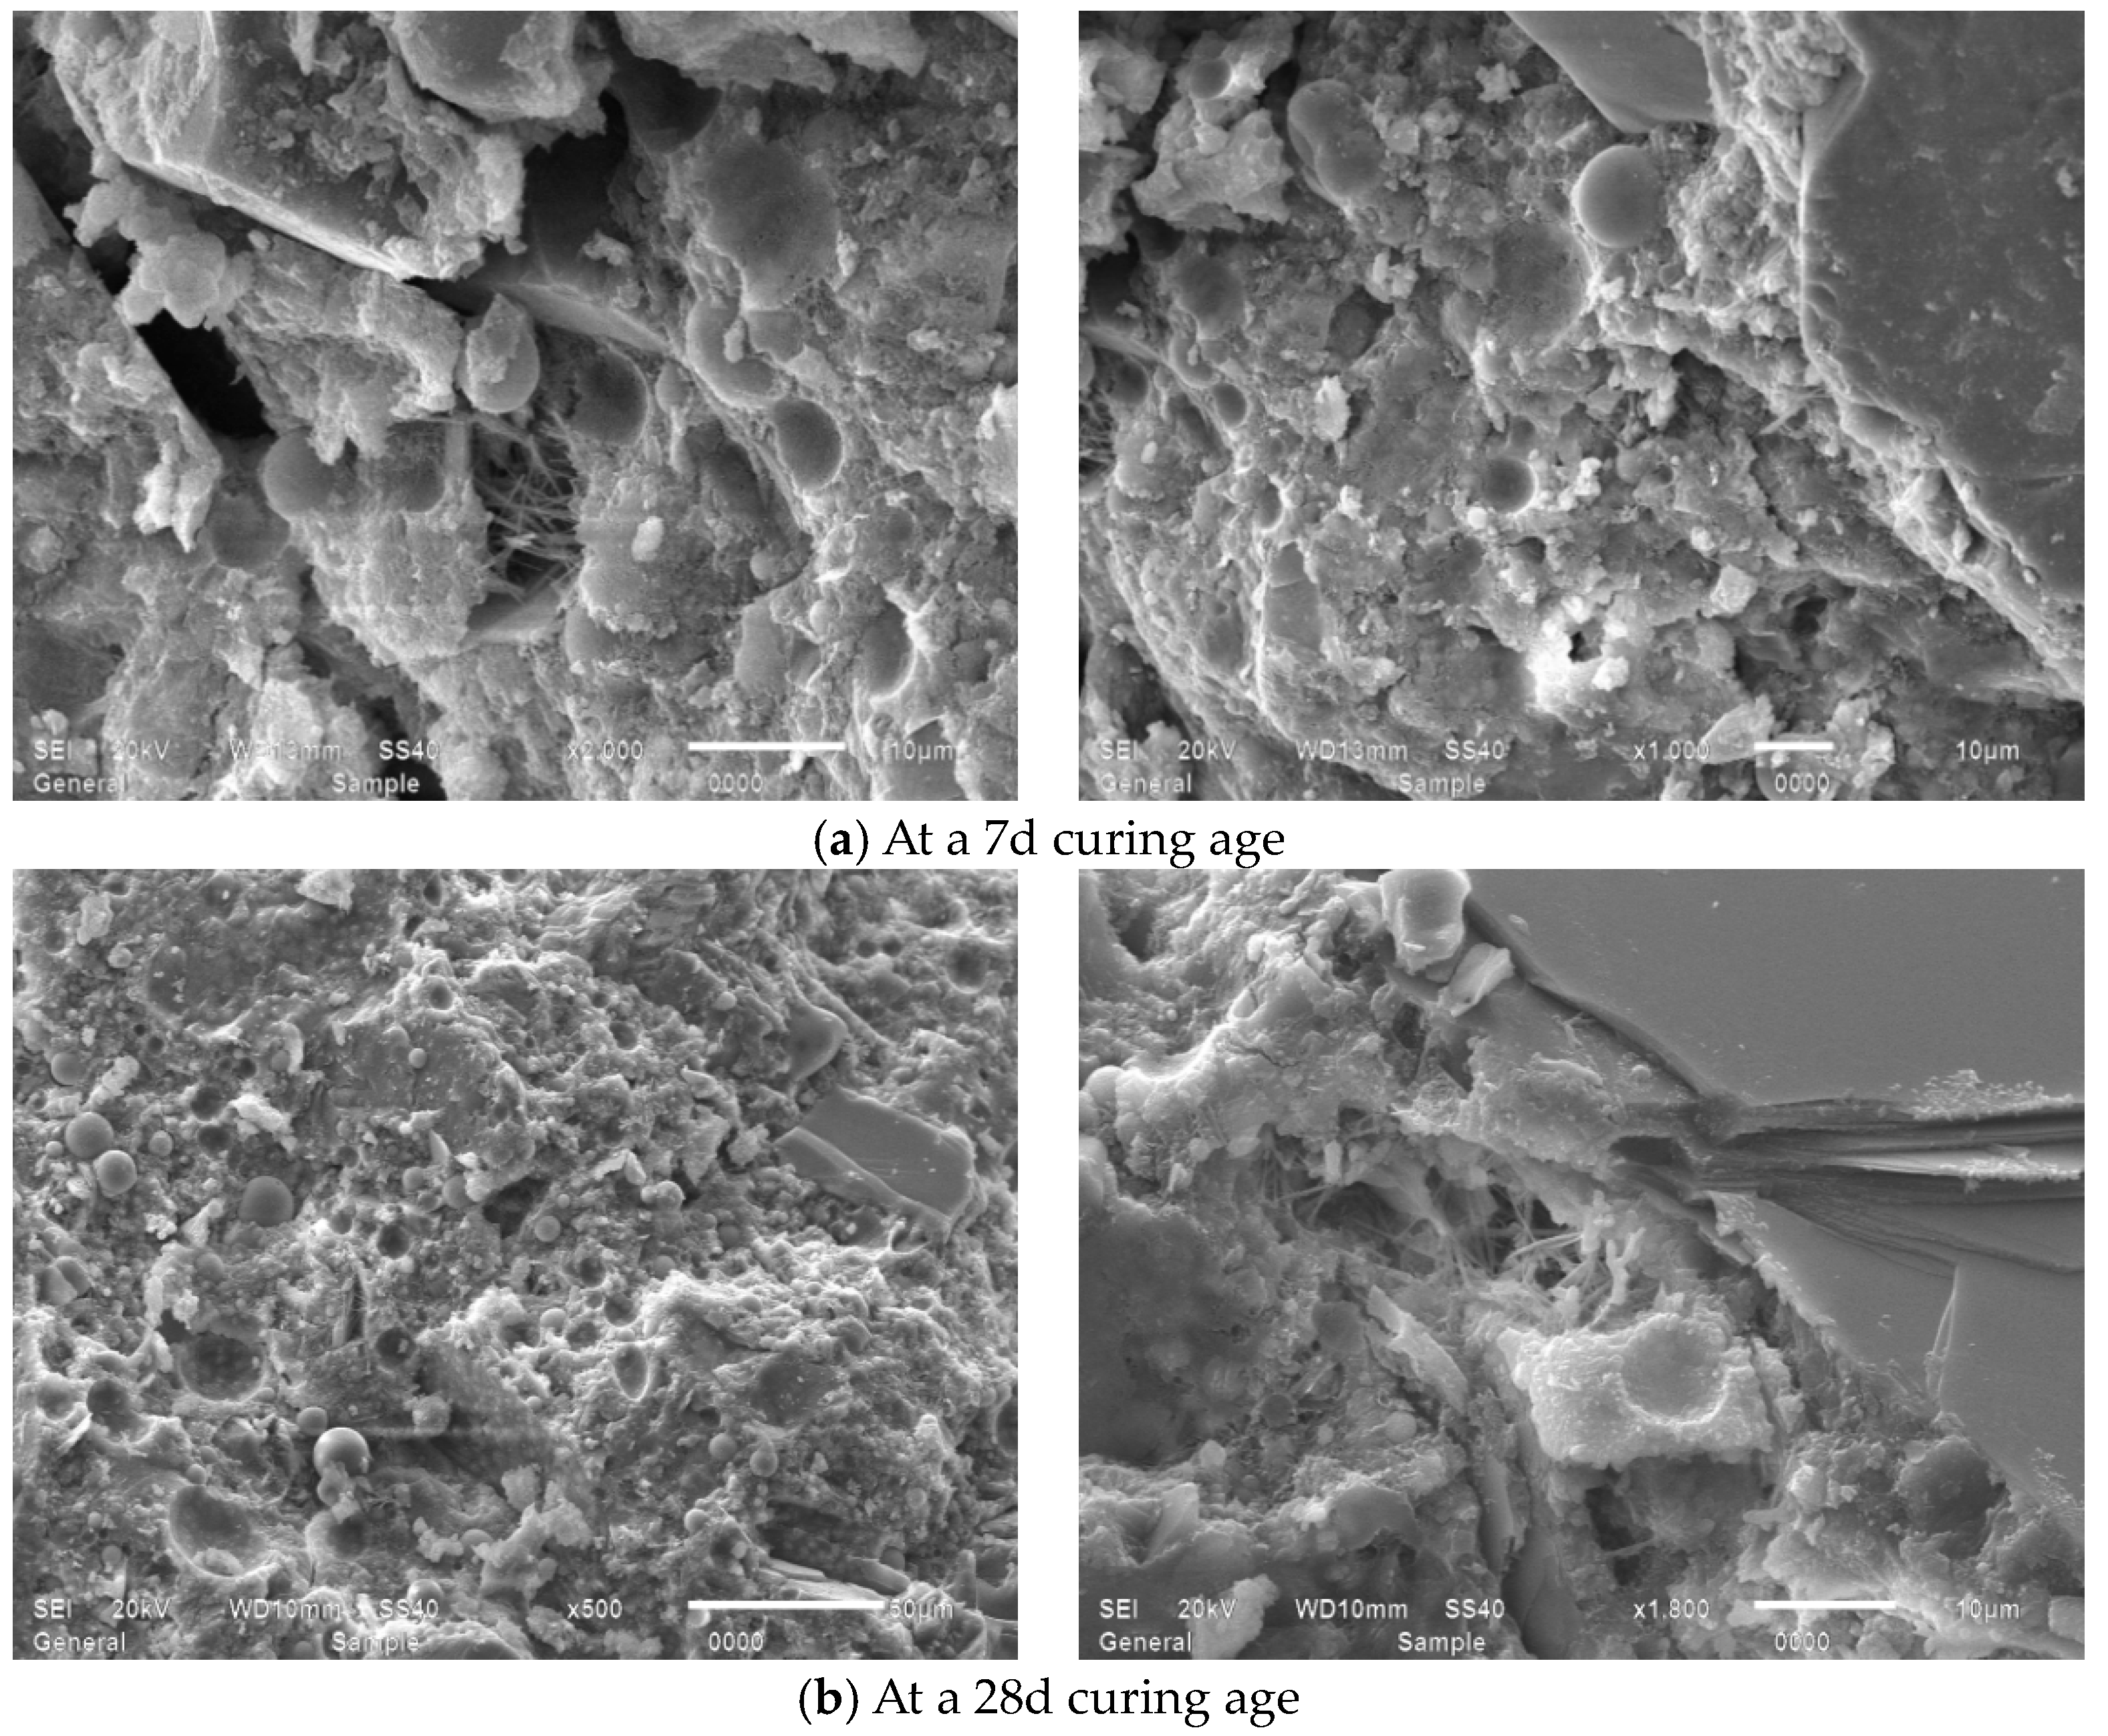
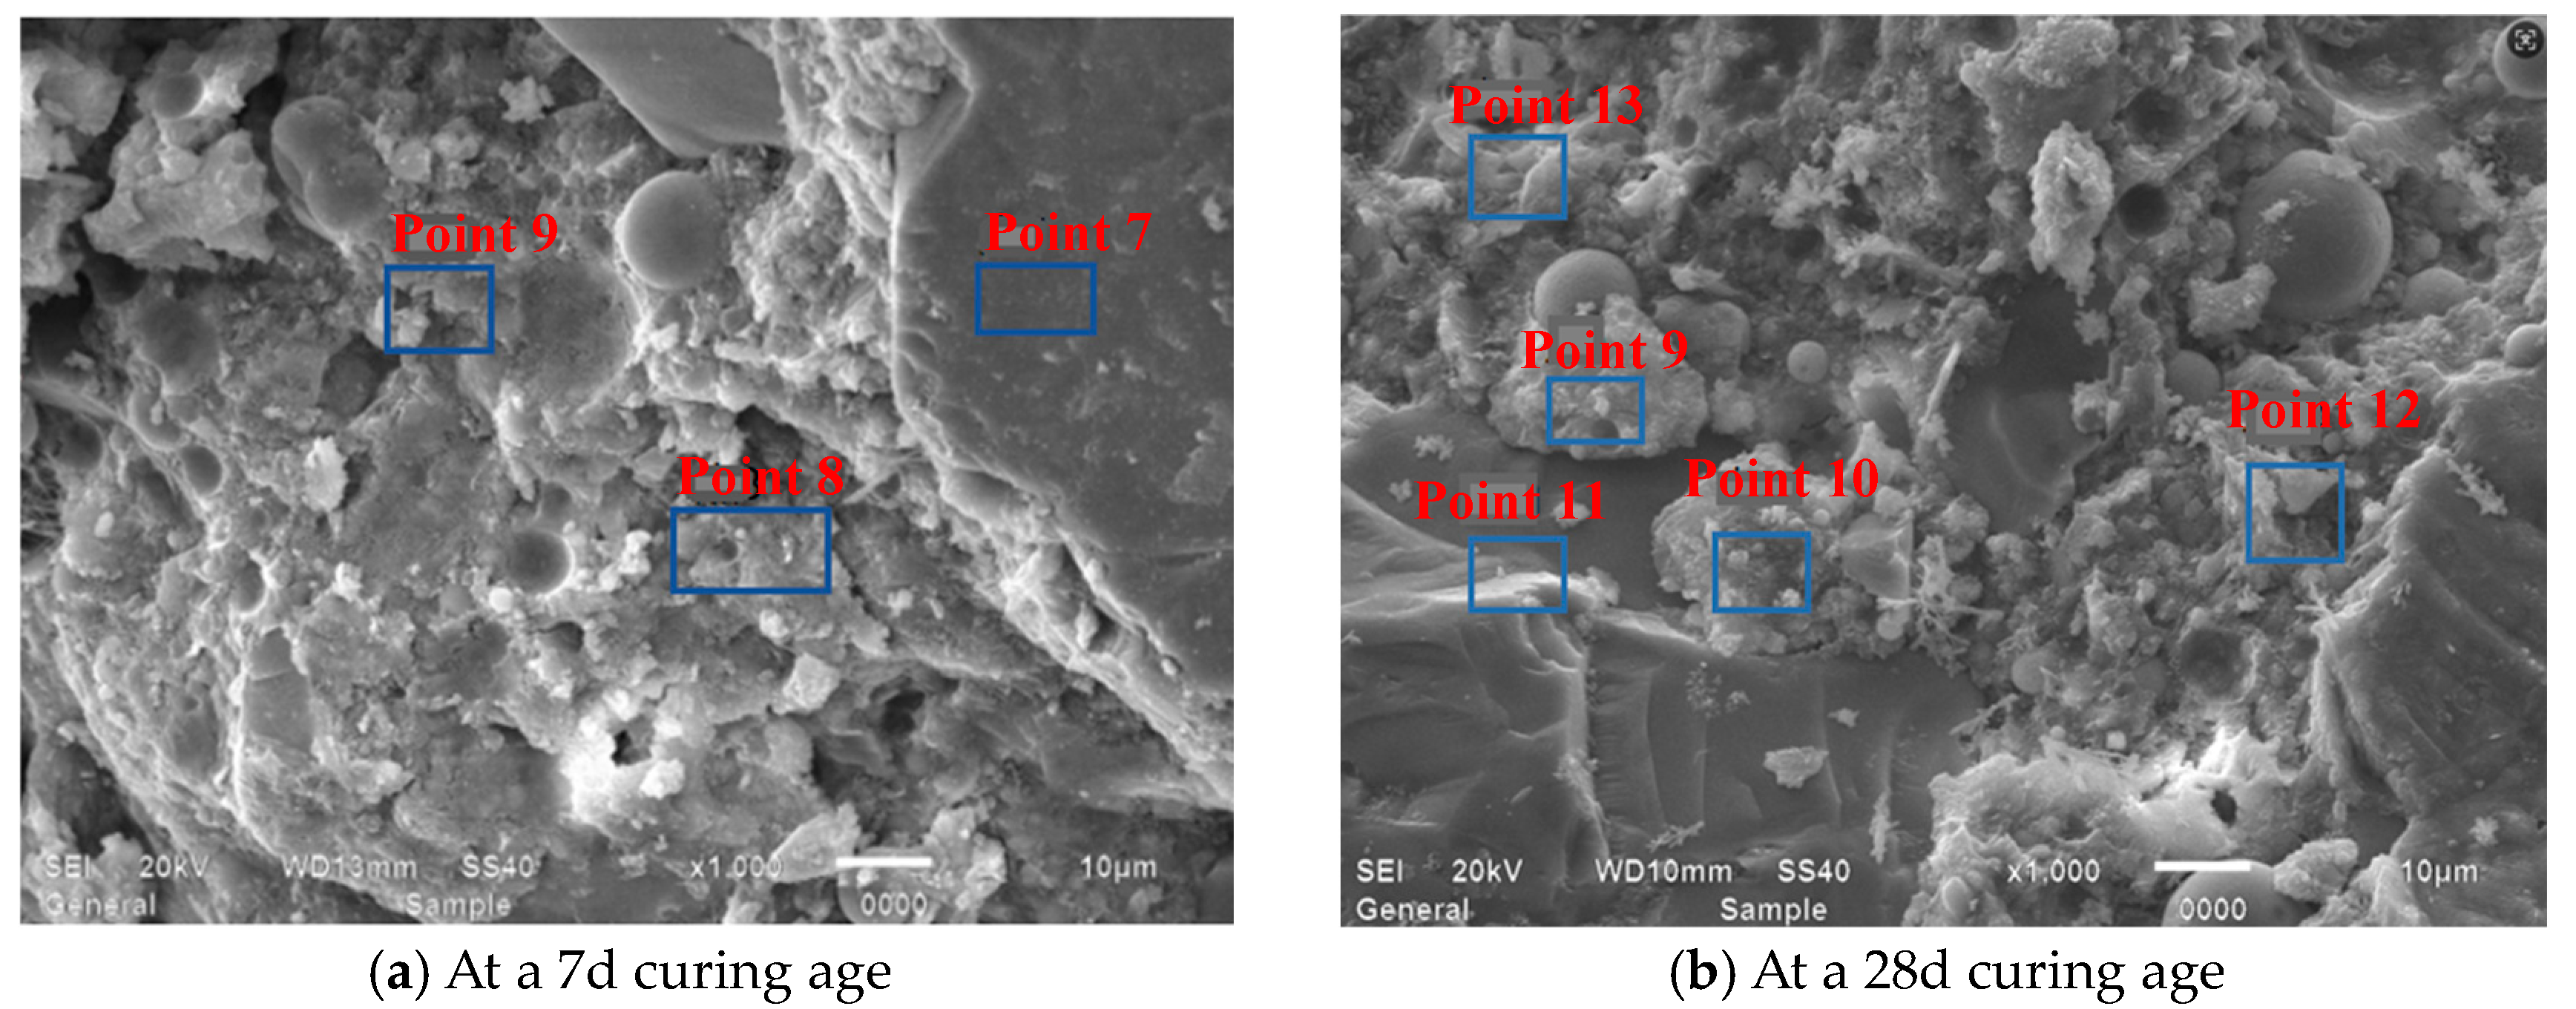
Figure 17 illustrates SEM observations of M2 specimens sectioned into 5 mm × 15 mm × 15 mm at 7-day and 28-day curing ages, revealing that at 7 days, the M2 mortar contains sparse C-S-H gel alongside substantial spherical fly ash particles and minor montmorillonite, with a conspicuous absence of hexagonal platy portlandite and acicular AFt crystals, exhibiting distinct voids with observable cracks, where the loose, porous microstructure comprises limited C-S-H gel, spherical fly ash, and unhydrated constituents. By 28 days, discernible C-S-H gel and lamellar hydration products indicate a moderate hydration progression with a partial void reduction, yet ITZ displays numerous enlarged voids and deficient bonding between hydration products and aggregates, showing C-S-H gel and montmorillonite within the pores. A comparative assessment against the reference mortar demonstrates substantially diminished C-S-H gel, reduced hydration products, and elevated spherical fly ash content at both ages, indicating suppressed hydration kinetics, accompanied by microstructural deterioration manifested as enlarged voids and compromised paste–aggregate connectivity in interfacial zones, culminating in significant strength impairment.
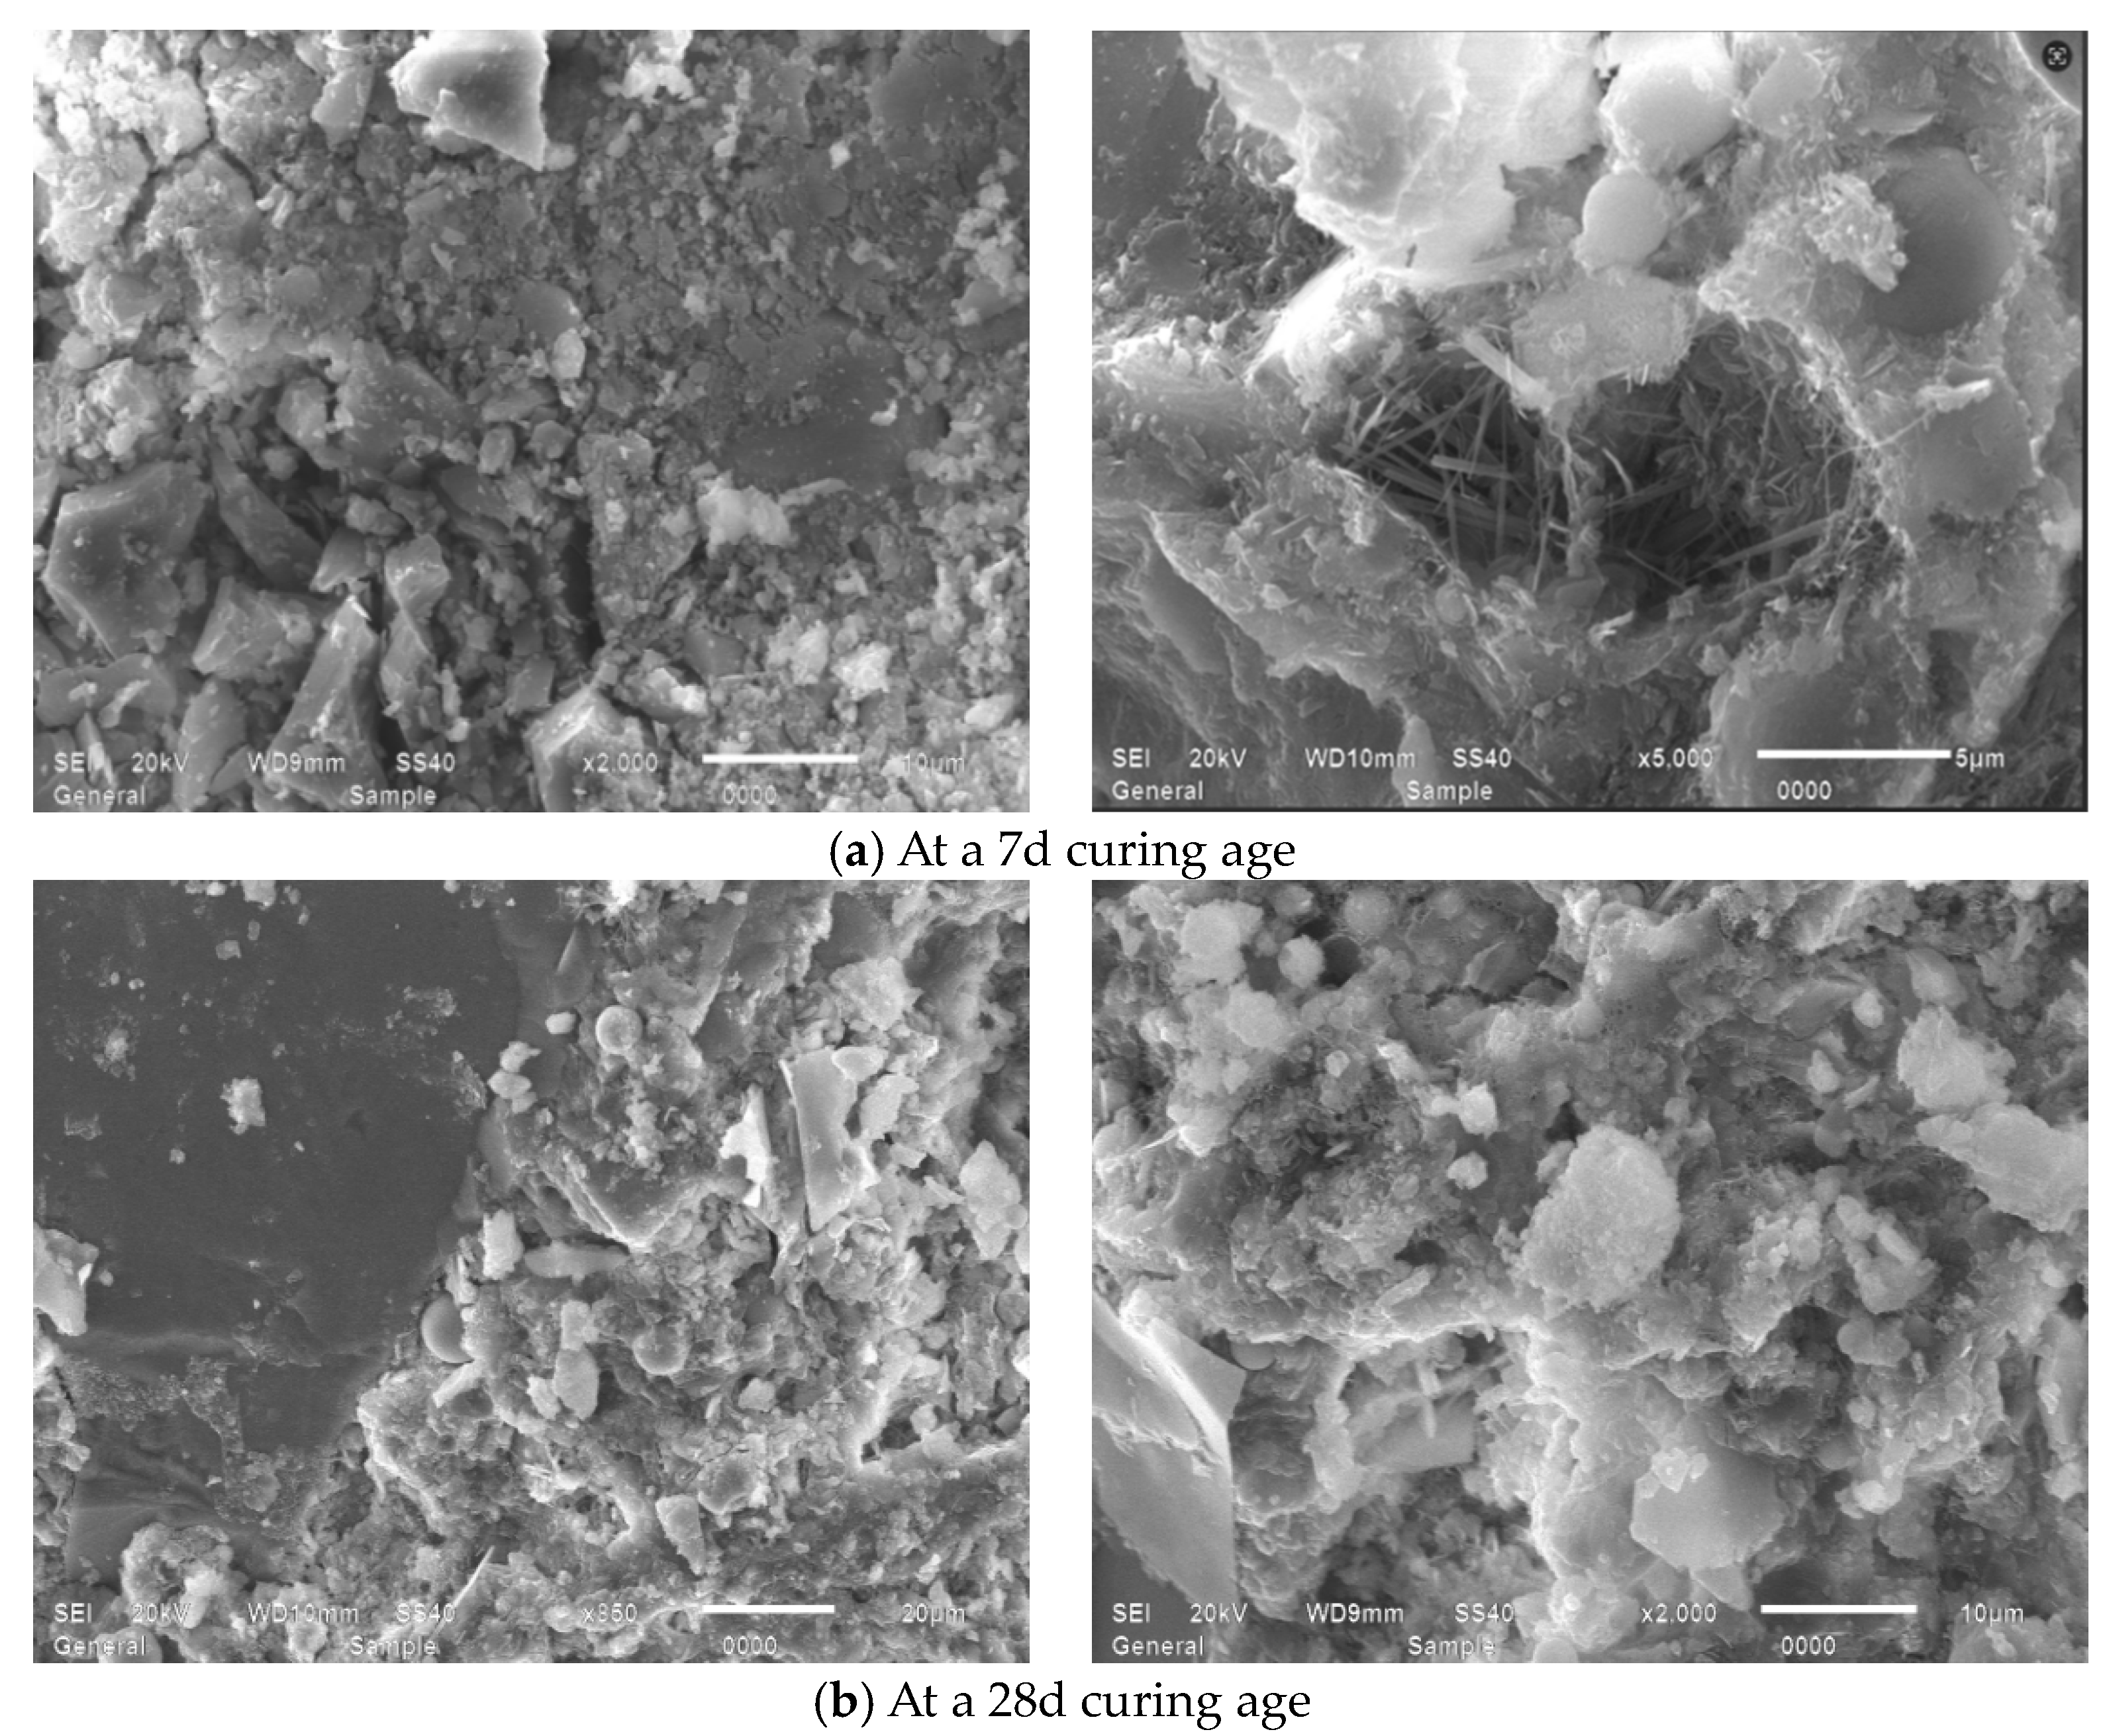
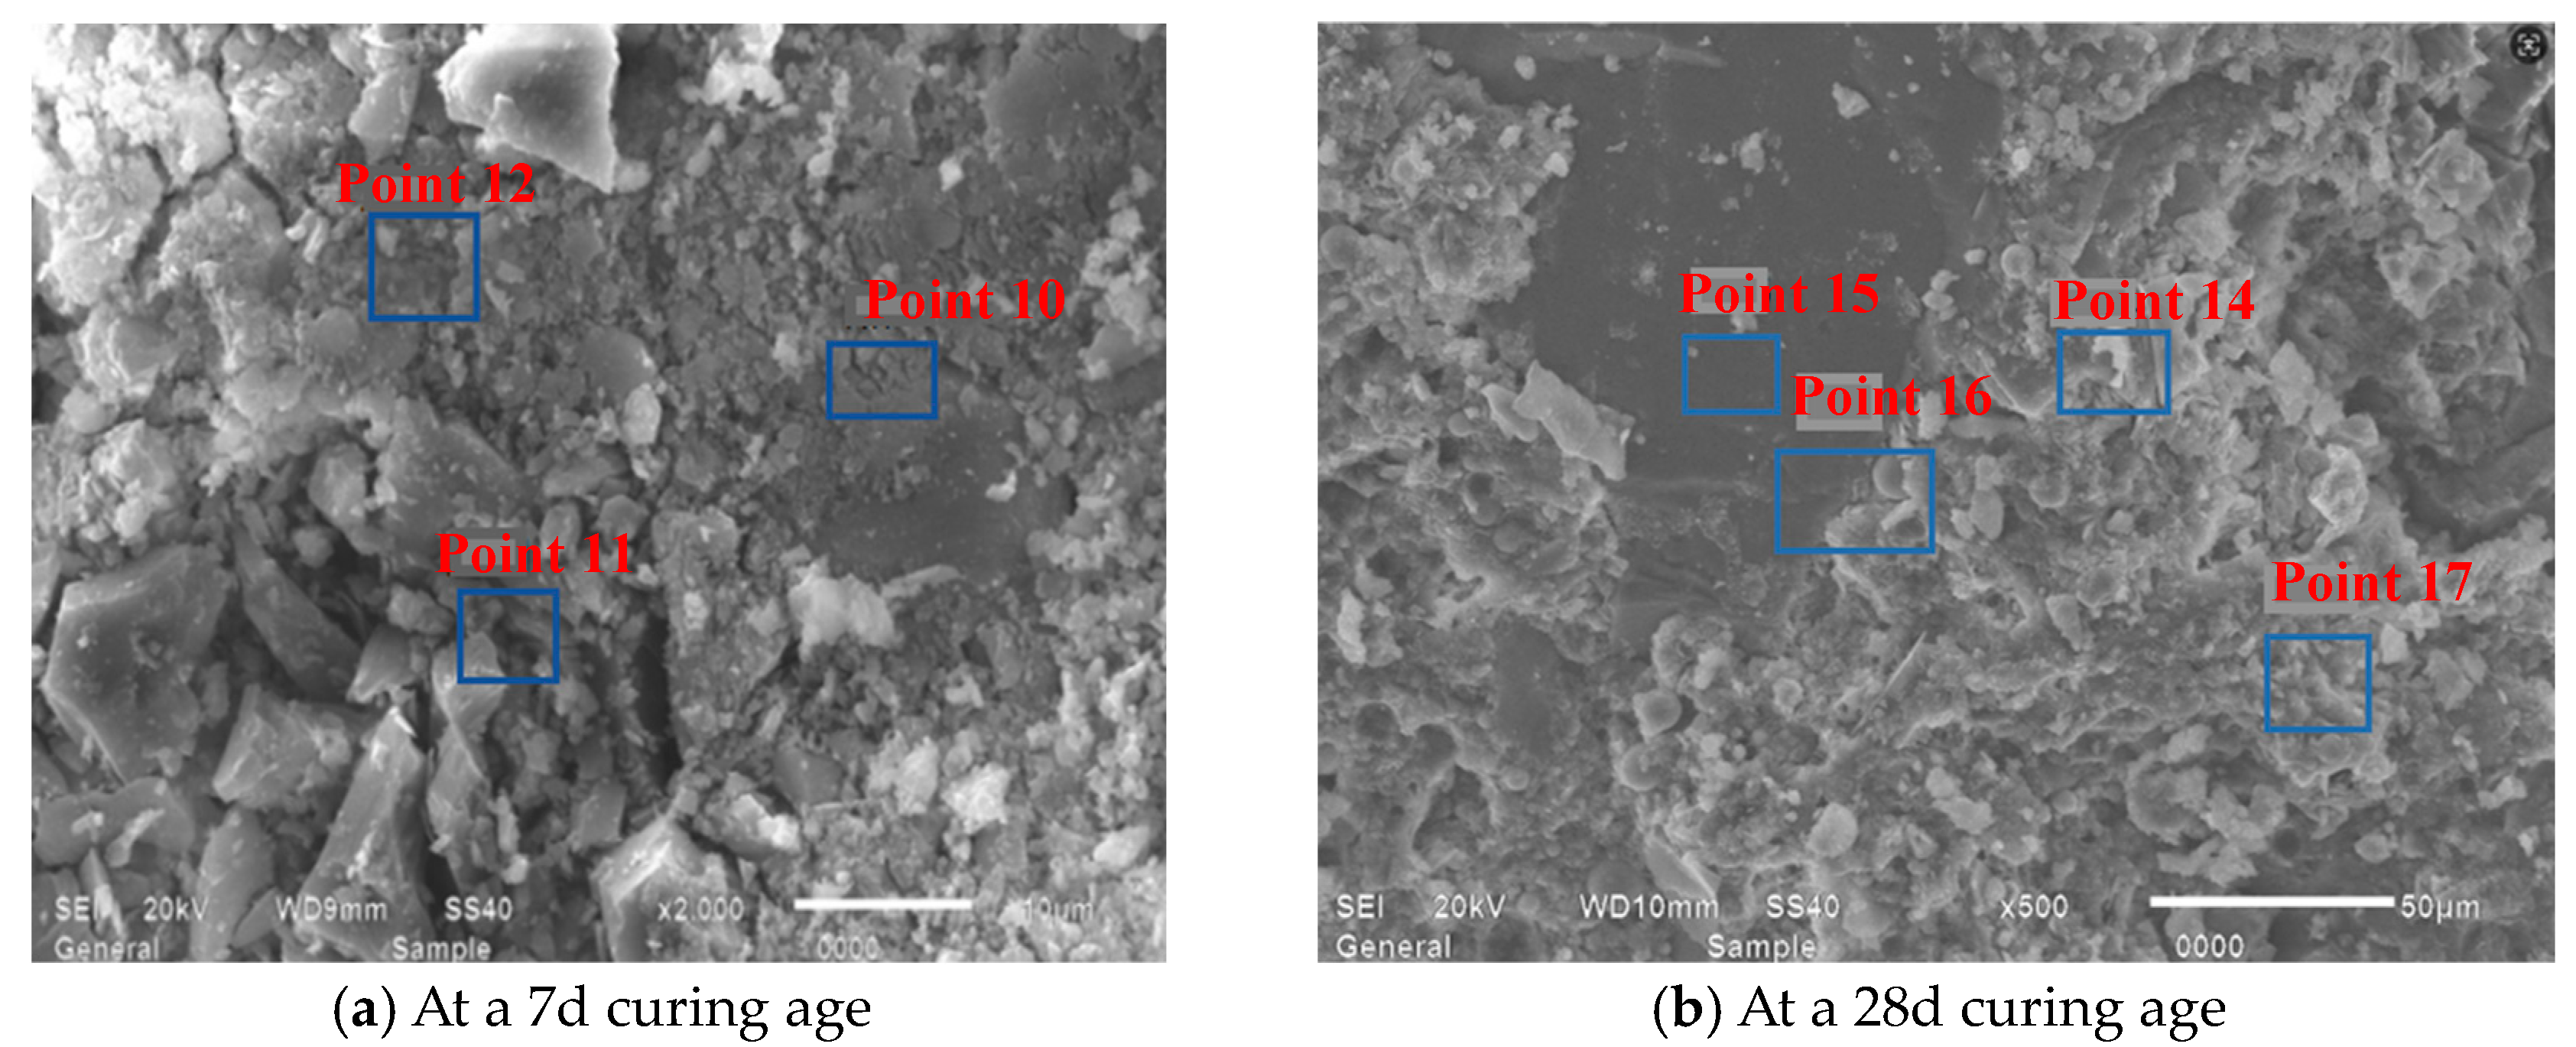
Figure 18 exhibits SEM images of Y1 specimens sectioned into 5 mm × 15 mm × 15 mm at 7-day and 28-day curing ages, revealing that at 7 days (2000× magnification), the C-S-H gel is indistinct, while fragmented hydration products, unhydrated constituents, and illite are observed, with no detectable hexagonal platy portlandite or acicular AFt crystals, exhibiting compromised structural integrity and discernible voids where a 5000× magnification discloses C-S-H gel within the pores co-integrating with other hydration products and spherical fly ash to form the mortar framework. At 28 days, marginally improved structural compactness features limited C-S-H gel increments alongside persistent unhydrated spherical fly ash and illite, with refined yet quantitatively unaltered pores. Conspicuously, ITZ displays a suppressed hydration degree, abundant voids, and deficient bonding between hydration products and aggregates. A comparative analysis against the reference mortar demonstrates a substantial C-S-H depletion, scarce hydration products, and a porous microstructure at both ages, with minor illite identified within hydrates adversely affecting paste matrix integrity.
Figure 19 presents SEM images of Y2 specimens sectioned into 5 mm × 15 mm × 15 mm at 7-day and 28-day curing ages, demonstrating that at 7 days, stunted C-S-H gel co-constitutes the mortar framework with lamellar hydration products, unhydrated material, and illite, with no discernible hexagonal platy portlandite or acicular AFt crystals, indicating suppressed hydration alongside porous ITZ exhibiting compromised compactness and deficient bonding between hydration products and aggregates [51]. At 28 days, illite adhered to hydrates, which severely impeded cement hydration, yielding limited hydration-product augmentation amidst abundant partially hydrated constituents dominating the microstructure, while enlarged or proliferated voids exacerbate structural deterioration. A comparative assessment against the reference mortar reveals a substantial C-S-H reduction, an elevated partially hydrated content, and a porous architecture at both ages, attributable to illite’s dual interference mechanisms, including competitive water absorption lowering the effective water–cement ratio and physical barrier effects hindering cement hydration kinetics, collectively degrading mechanical performance.

4.2.3. Influence of MB Value on Chemical Composition of Mortar

Figure 20 presents EDS spectra of montmorillonite and illite, with EDS analyses conducted on specific hydration products within their SEM images as listed in Table 5 and Table 6 to elucidate elemental compositions. The compositional nature of hydration products profoundly influences macrostructural properties and microstructural development in cement mortars, where initial hydration typically generates C-S-H gel, portlandite, and ettringite [34]. The calcium-to-silicon ratio serves as a critical parameter quantifying the C-S-H structure, wherein Ca/Si values between 0.6 and 2.0 indicate C-S-H gel formation, whereas values exceeding 2.0 signify portlandite presence during early hydration. Table 5 and Table 6 reveal elemental abundance sequences of O-Si-Al-Ca in montmorillonite dominated by SiO2, Al2O3, and CaO, contrasting with O-Si-Al-K dominance in illite primarily composed of SiO2, Al2O3, and K2O.
(1)
EDS analyses of specific products within JZ’s SEM images, as established through Figure 21 and Table 7, demonstrate that the 28d mortar calcium-to-silicon ratios significantly exceeded their 7d counterparts, increasing from 2.88 and 2.25 at 7 days to 3.73 and 4.49 at 28 days, thereby confirming more extensive hydration.
(2)
EDS analyses of products across M1’s SEM, as demonstrated through Figure 22 and Table 8, revealed that the 28d mortar calcium-to-silicon ratios surpassed their 7d counterparts, with point 4 identified as montmorillonite, while other points, excluding point 5, represented calcium silicate aluminate hydrates at varying hydration stages alongside portlandite.
(3)
EDS analyses of products across M2’s SEM, as revealed through Figure 23 and Table 9, showed significantly greater calcium-to-silicon ratios in the 28d mortar compared to the 7d mortar, with points 7 and 11 constituting sand particles, whereas other points represented calcium silicate aluminate hydrates at distinct hydration degrees alongside portlandite.
(4)
EDS analyses of products across Y1’s SEM, as established through Figure 24 and Table 10, showed significantly greater calcium-to-silicon ratios in the 28d mortar compared to the 7d mortar, with point 15 constituting sand particles, whereas other points represented calcium silicate aluminate hydrates at distinct hydration degrees alongside portlandite.
(5)
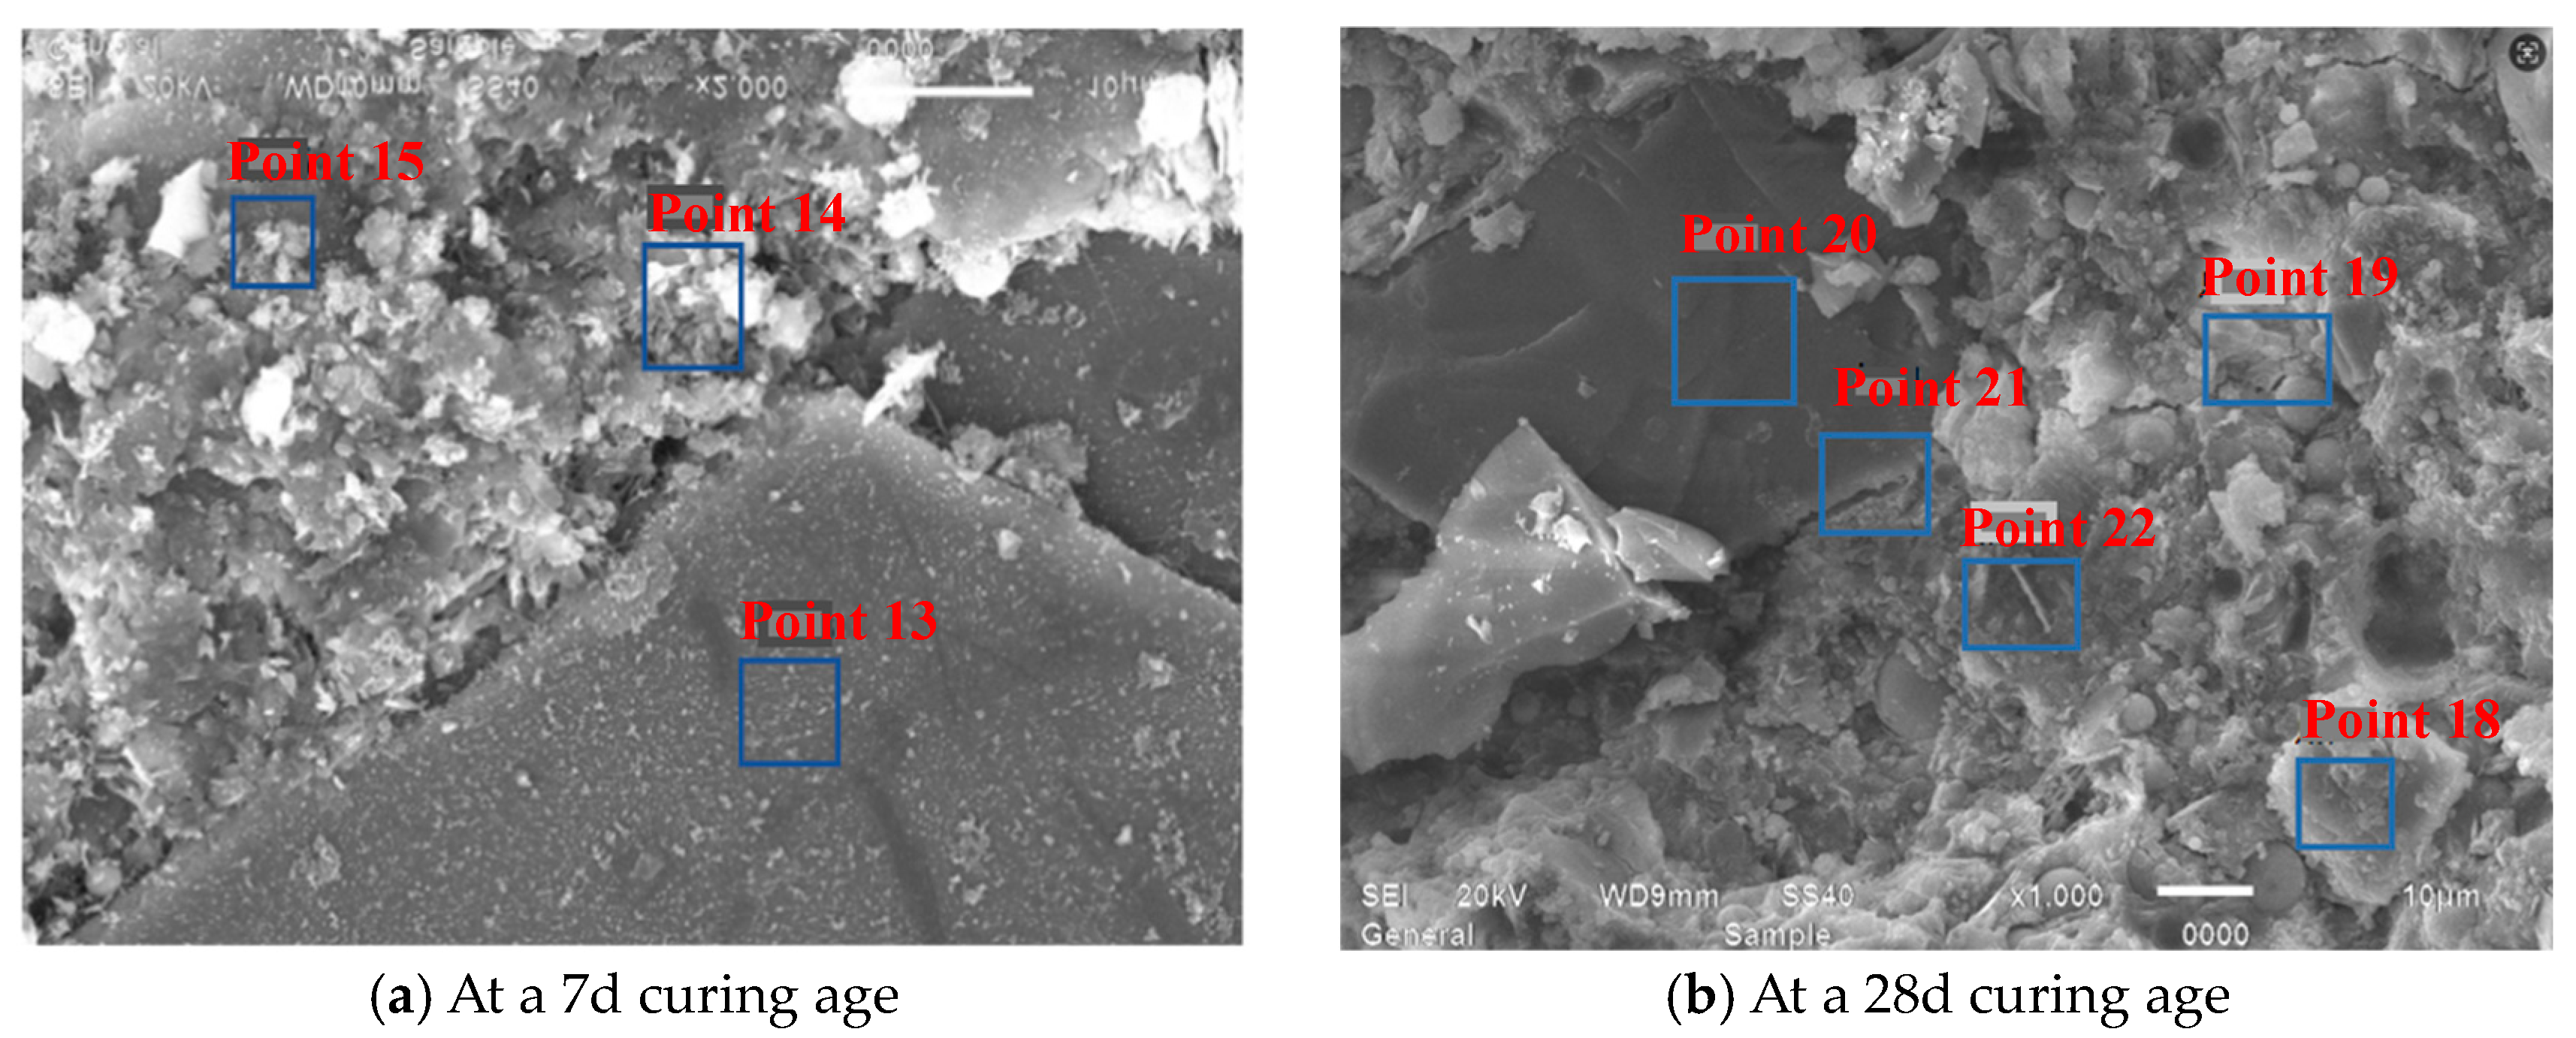
EDS analyses of products across Y2’s SEM, as established through Figure 25 and Table 11, revealed significantly greater calcium-to-silicon ratios in the 28d mortar compared to its 7d counterpart, with points 20 and 13 constituting sand particles that demonstrated significantly lower calcium-to-silicon ratios than other mortar groups, thereby indicating the lowest hydration degree in Y2.

4.2.4. Influence of MB Value on ITZ Properties in Mortar

The ITZ between cement paste and aggregate constitutes a structurally vulnerable region within mortar systems, recognized as a critical weakness, where ITZ thickness and mechanical strength govern ultimate load-bearing capacity [41]. Characterized by porous, loosely packed microstructures exhibiting elevated porosity relative to bulk paste, this zone frequently develops microcracks [18,27]. Macroscopic mortar performance can consequently be evaluated through a quantitative assessment of ITZ thickness, defined as the interfacial distance extending from aggregate surfaces to the unaffected cementitious matrix.
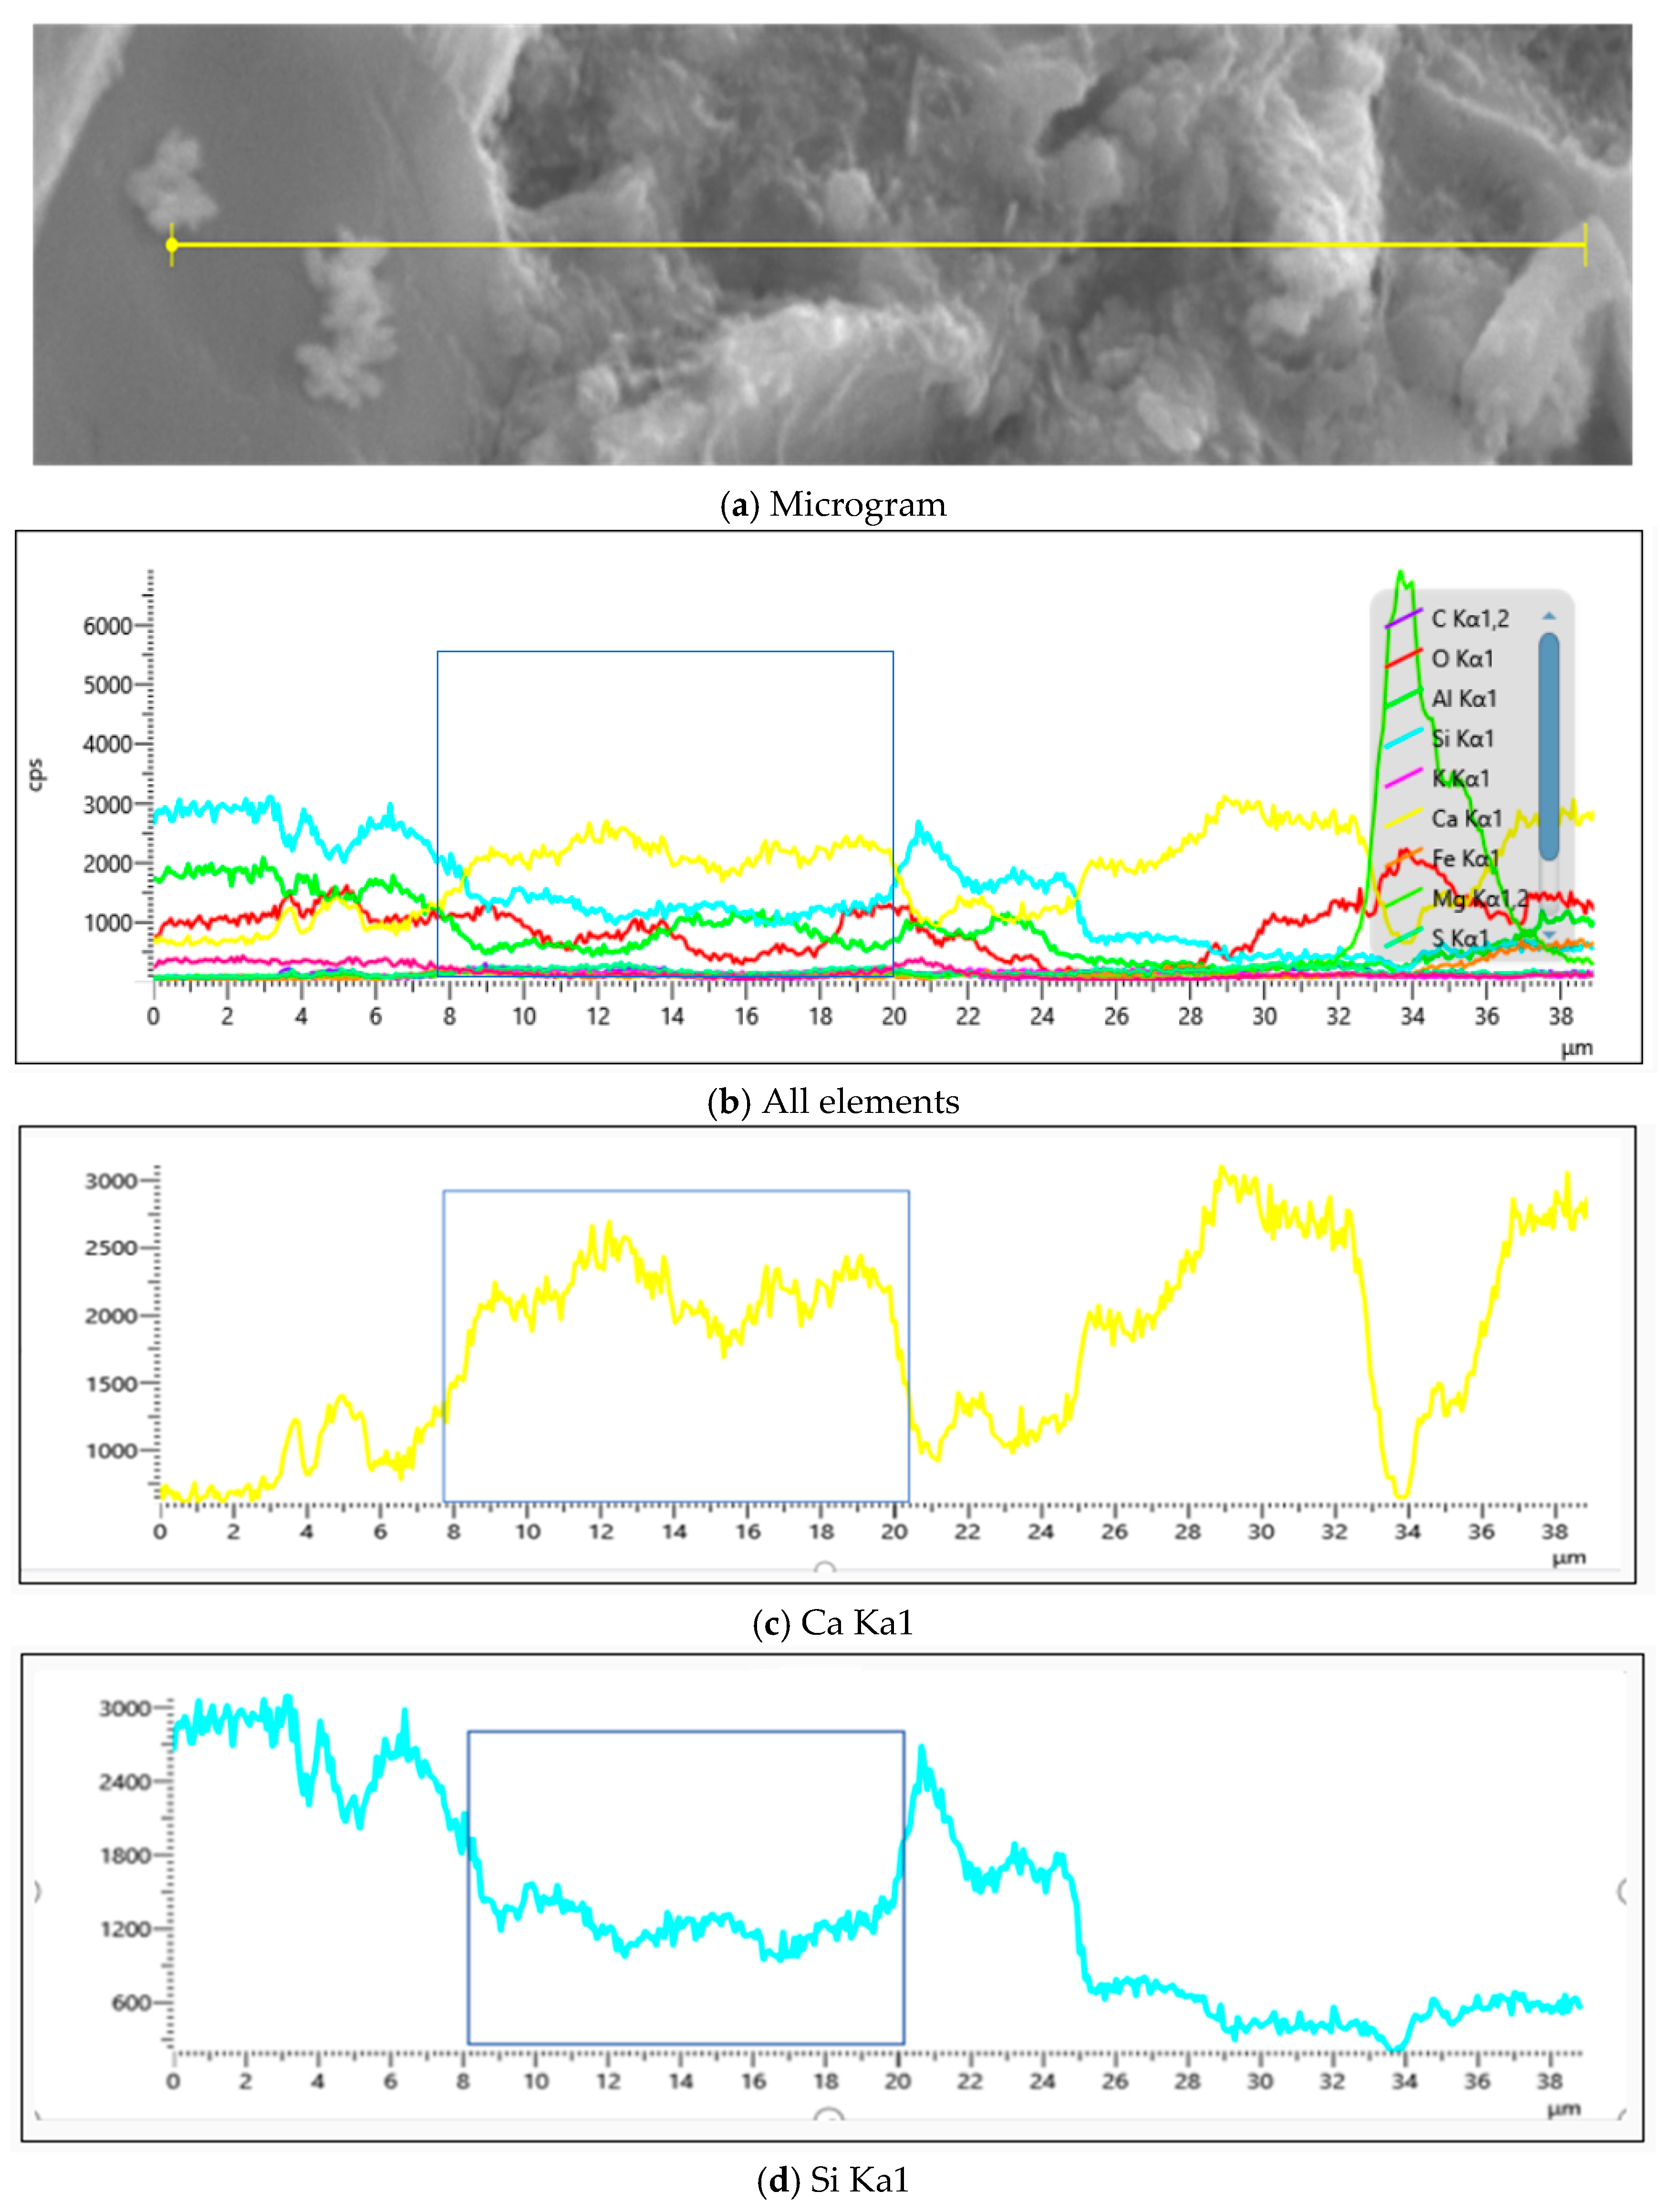
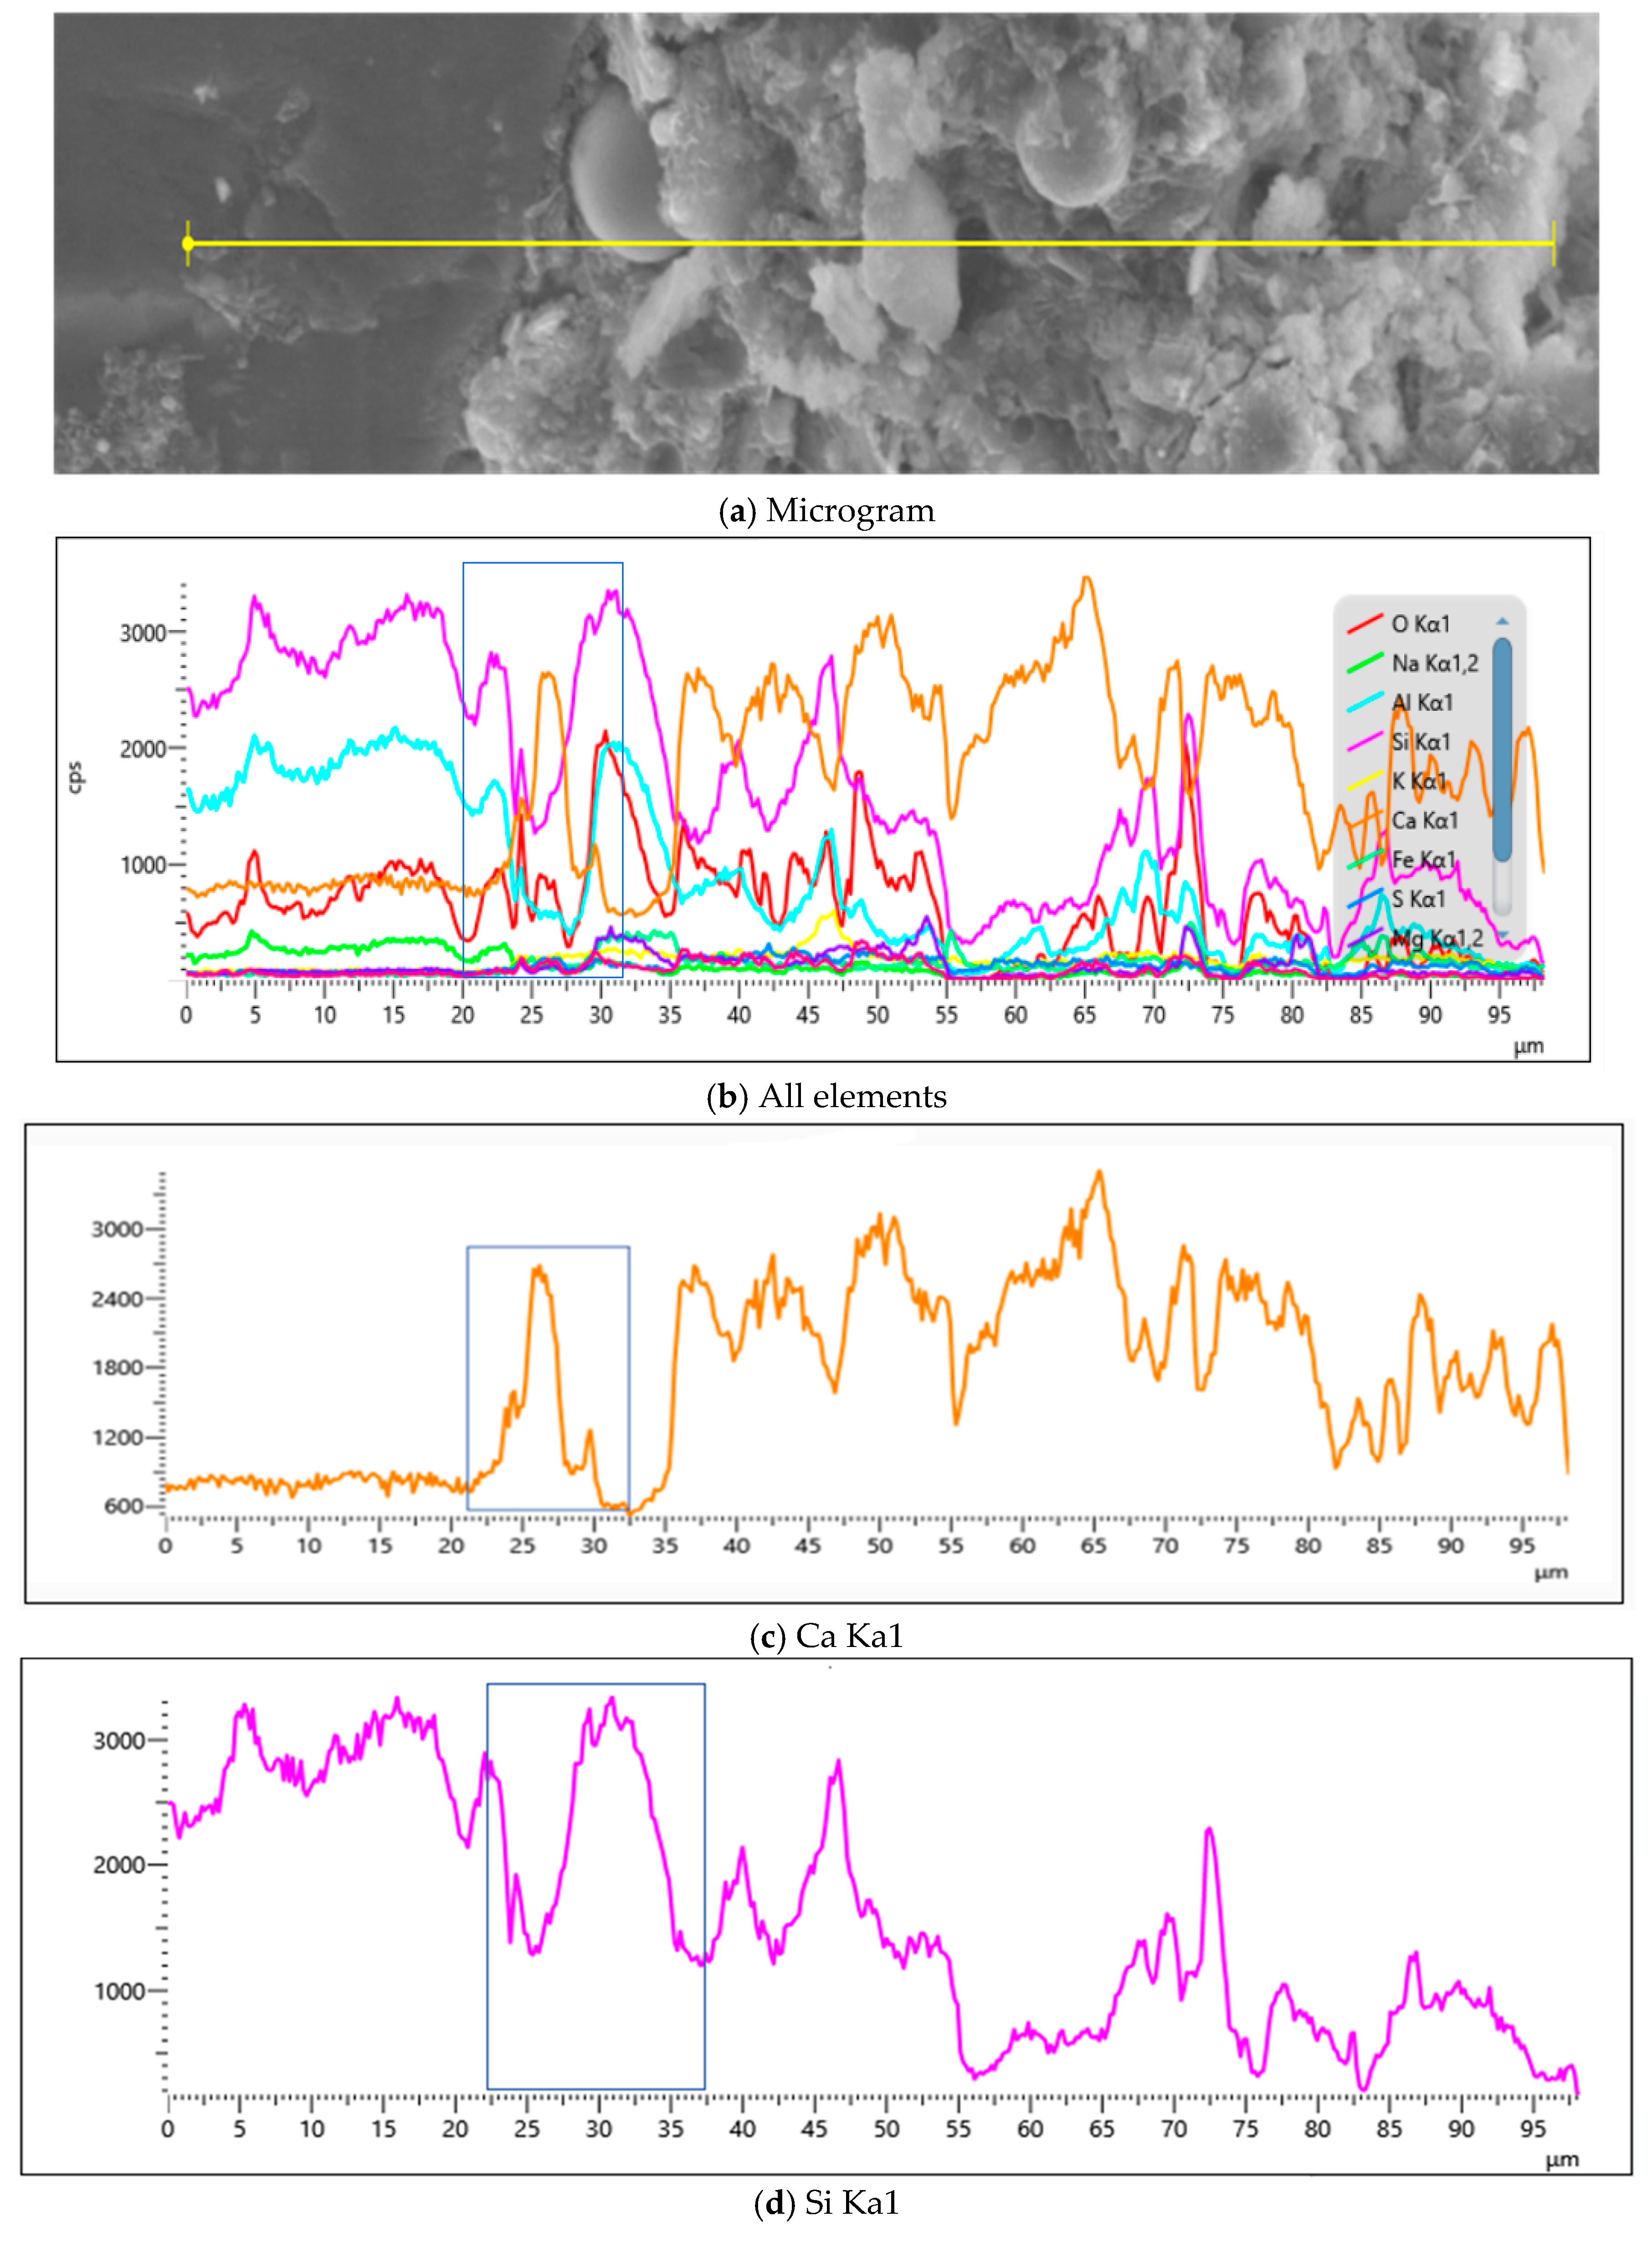
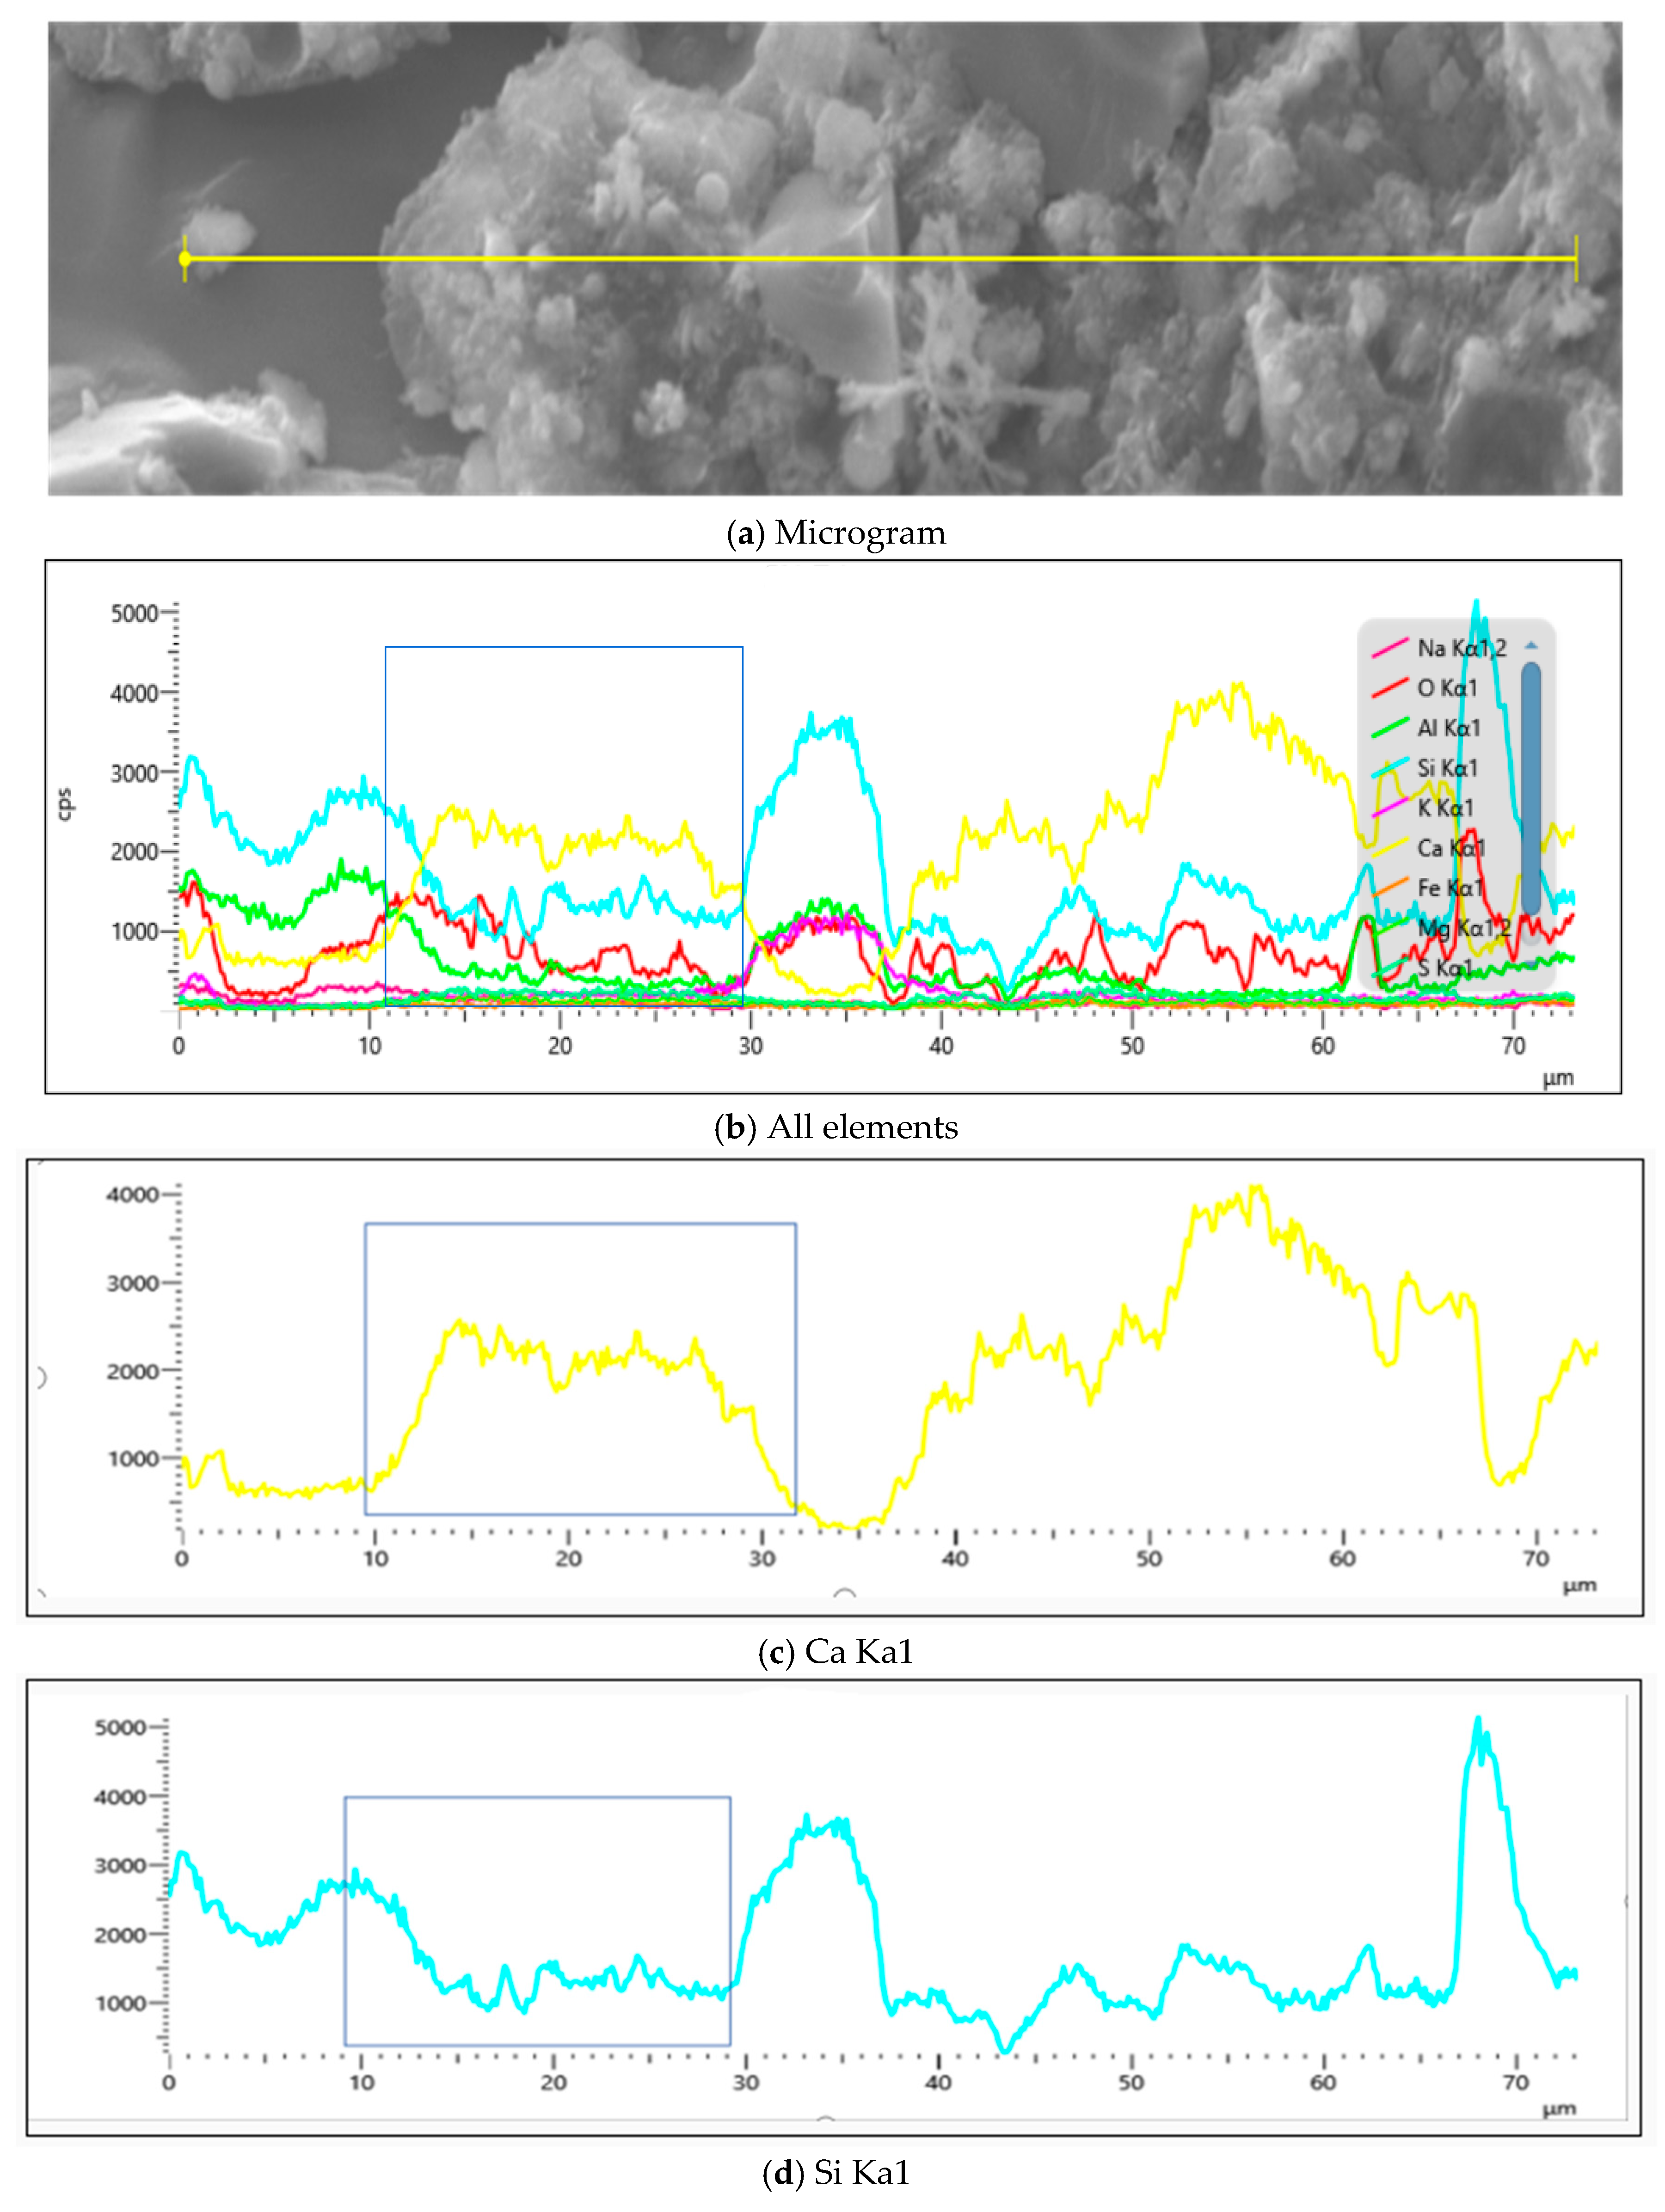
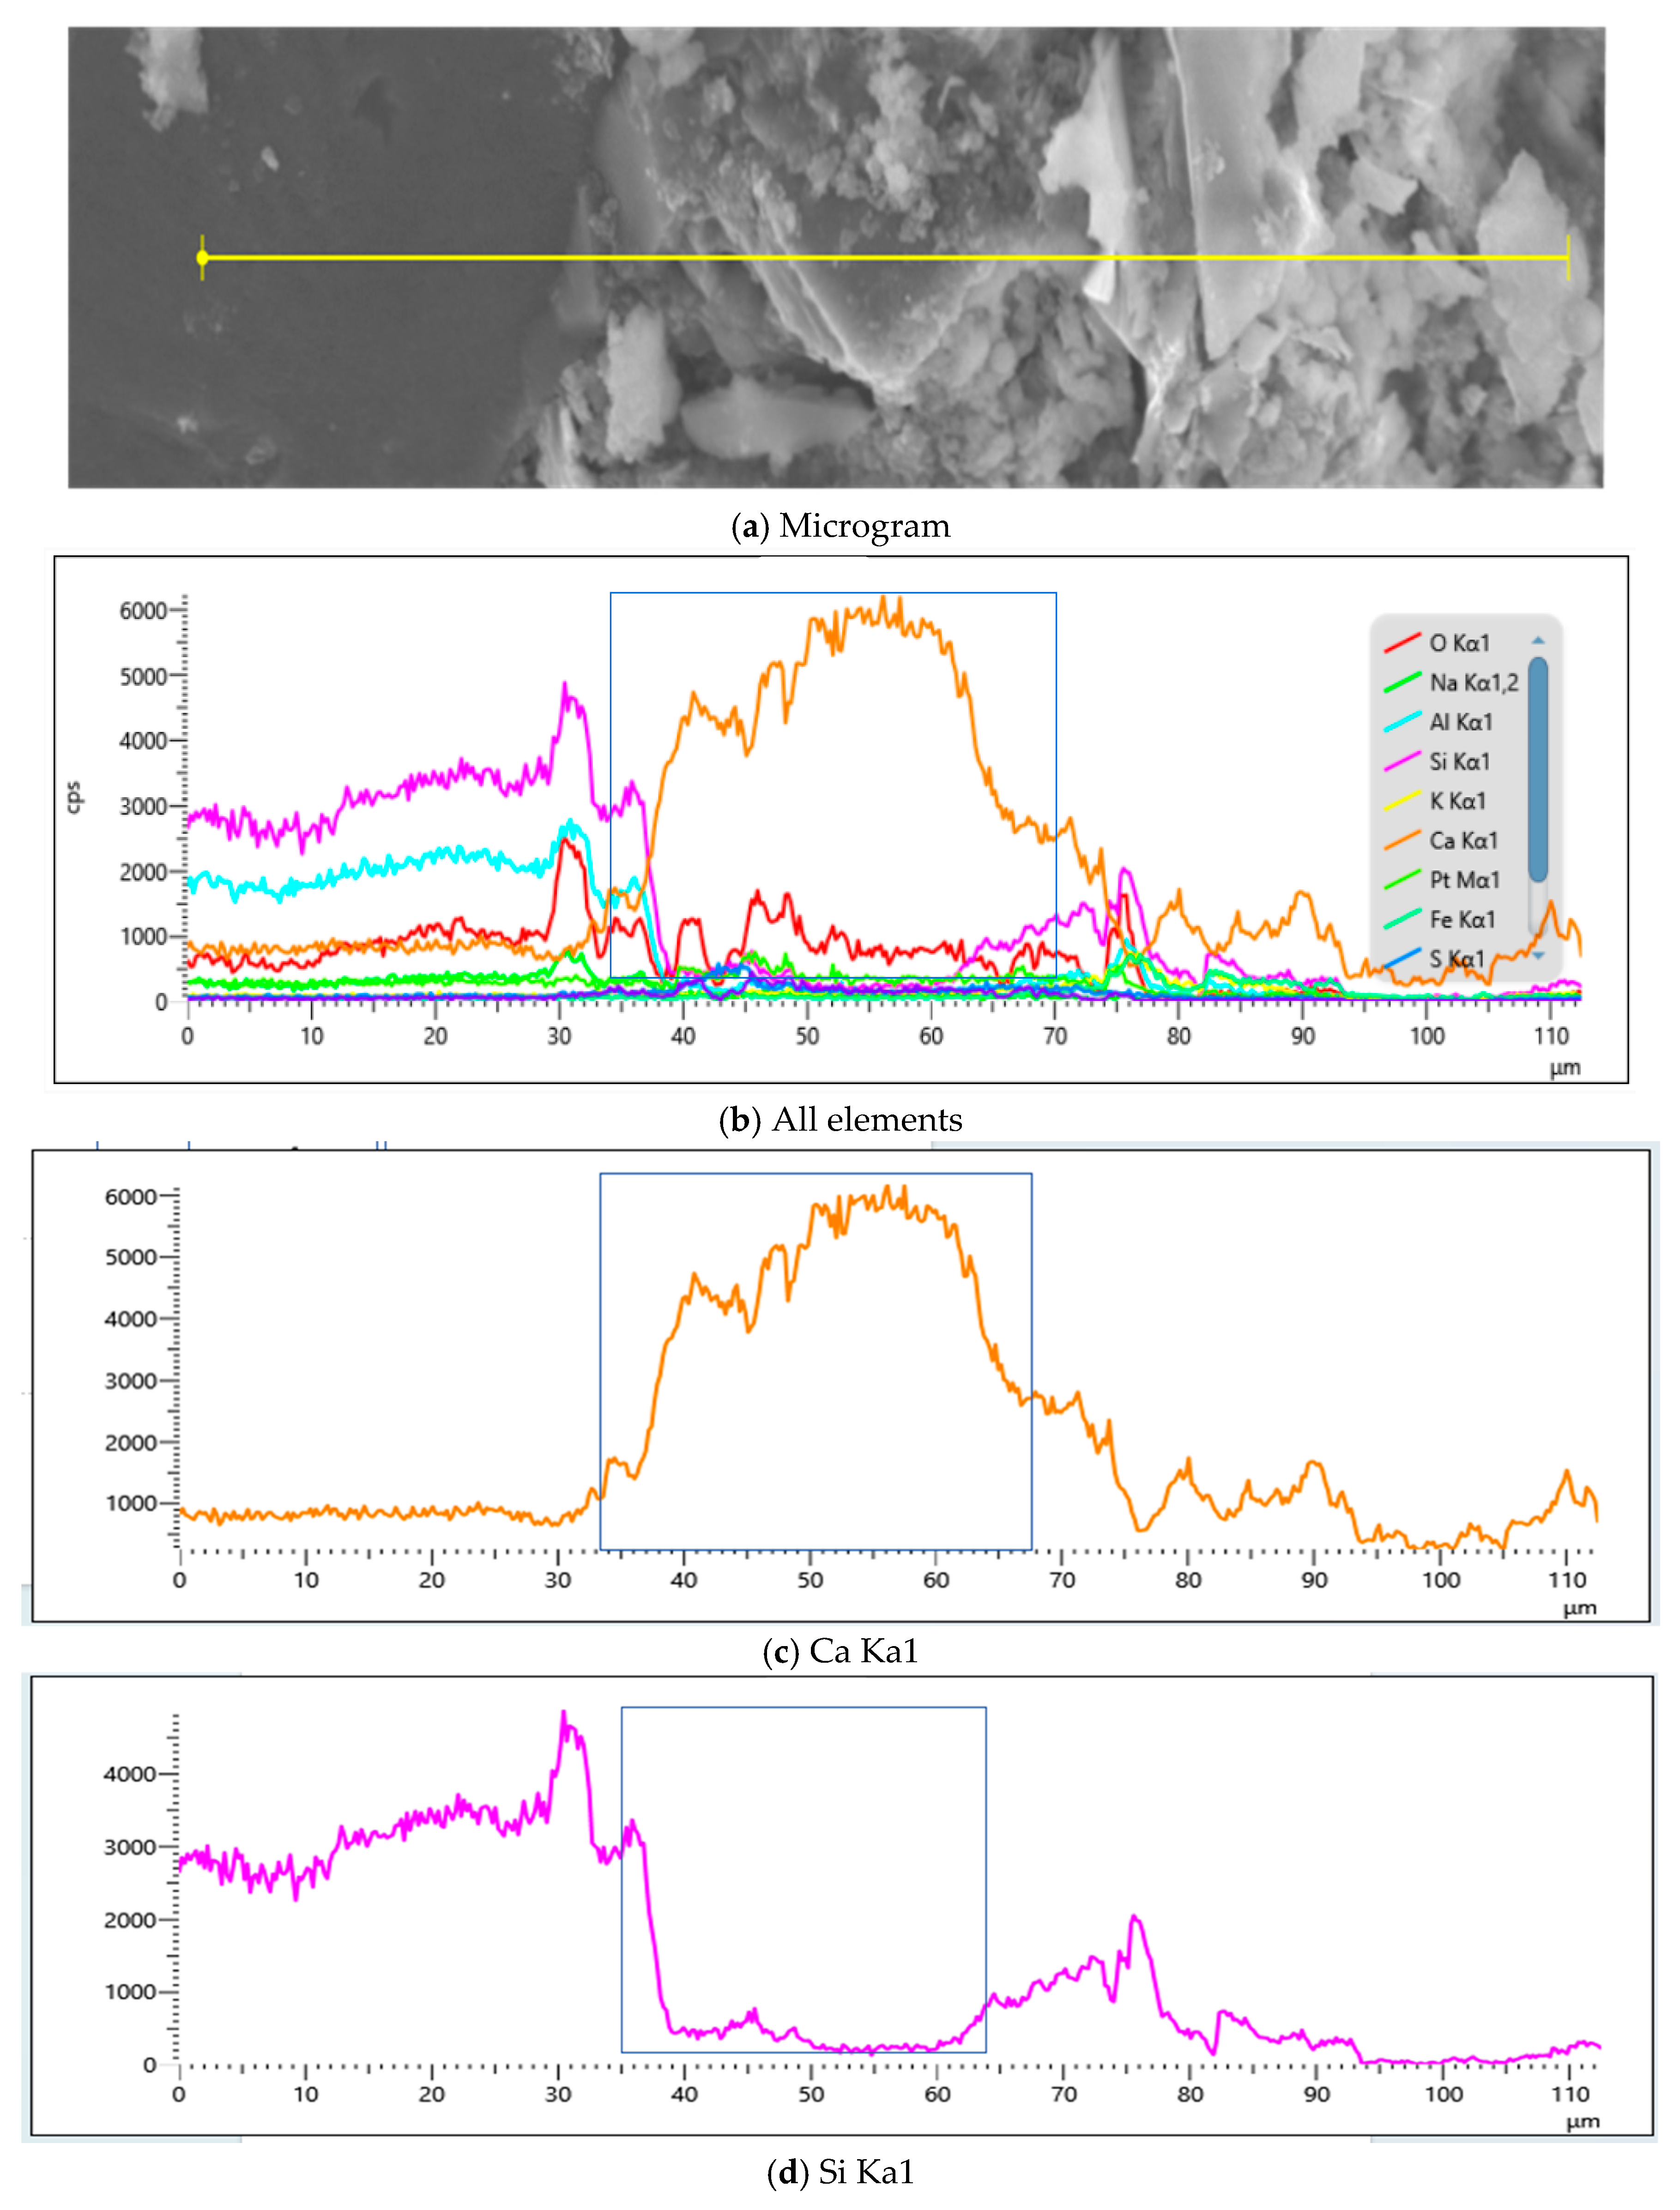
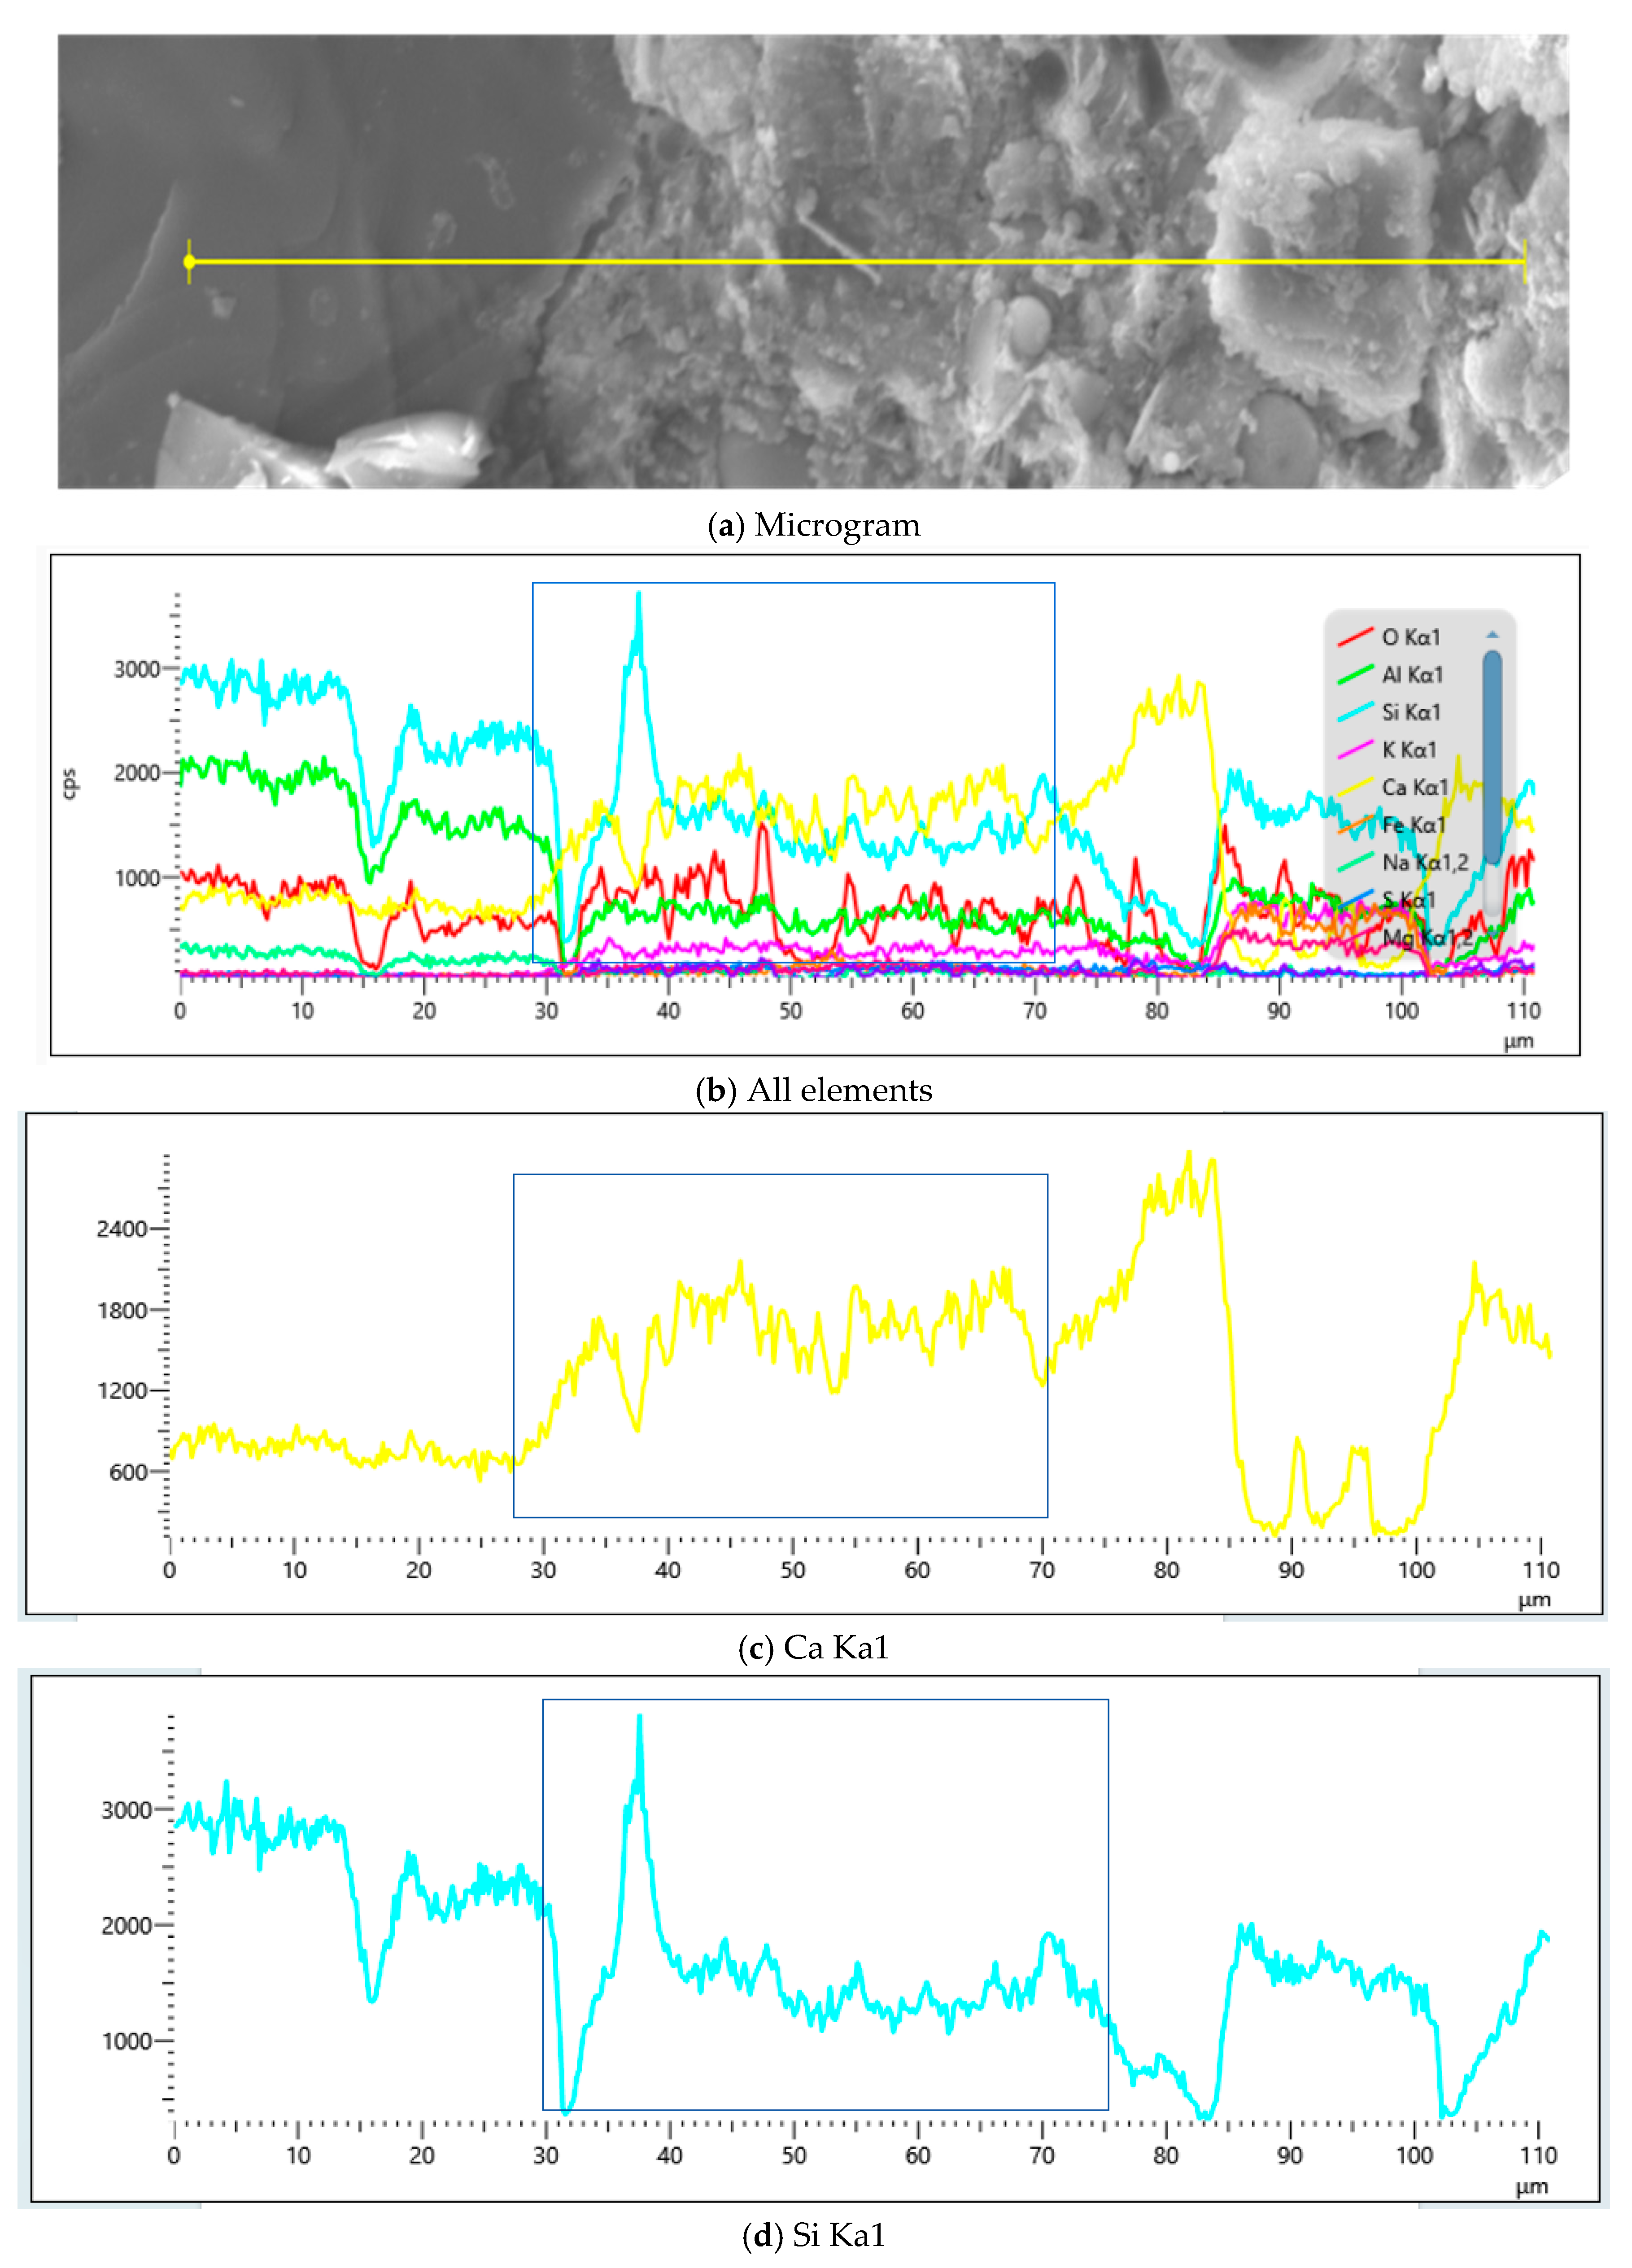
ITZ thickness was quantified through elemental distribution profiles of calcium and silicon along designated scan paths (Figure 26, Figure 27, Figure 28, Figure 29 and Figure 30), leveraging the siliceous nature of the manufactured sand aggregate. Energy-dispersive spectroscopy analyses confirmed silicon-dominated elemental signatures within aggregates versus calcium-enriched cement paste matrices, establishing distinct distribution patterns across aggregate–ITZ–paste domains [41]. Aggregates exhibit a dense silicon distribution with ascending concentration profiles, and sparse calcium shows descending trends. The ITZ demonstrates a reduced silicon density with declining gradients and stabilized calcium distributions [51]. Paste regions display plateaued silicon concentrations, while calcium exhibits progressively denser ascending profiles.
Quantitative ITZ thickness determination through calcium and silicon elemental distribution gradients along designated scan paths revealed ITZ dimensions of 12 to 13 μm for the JZ mortar, 11.5 to 15 μm for the M1 mortar, 20 to 22 μm for the M2 mortar, 29 to 34 μm for the Y1 mortar, and 43 to 46 μm for the Y2 mortar. For identical clay mineralogy, the ITZ thickness exhibited a positive correlation with an increase in MB value, indicating clay content-dependent interfacial deterioration.
High-MB-value sand surfaces adsorb substantial mixing water through montmorillonite and illite, elevating local water-to-binder ratios around aggregates significantly beyond the matrix, thereby inducing preferential crystallization of portlandite and ettringite over extended domains, which increases the initial ITZ thickness, whereas clay particle coatings obstruct direct cement aggregate contact, forcing hydration products, including portlandite and ettringite, to precipitate away from aggregates, with dried clay exhibiting shrinkage rates typically reaching 10%, which far exceeds that of cement paste, generating tensile stresses within the ITZ that propagate microcracks and further expand ITZ thickness.

4.3. XRD Diffraction Analysis

4.3.1. XRD of Montmorillonite and Illite

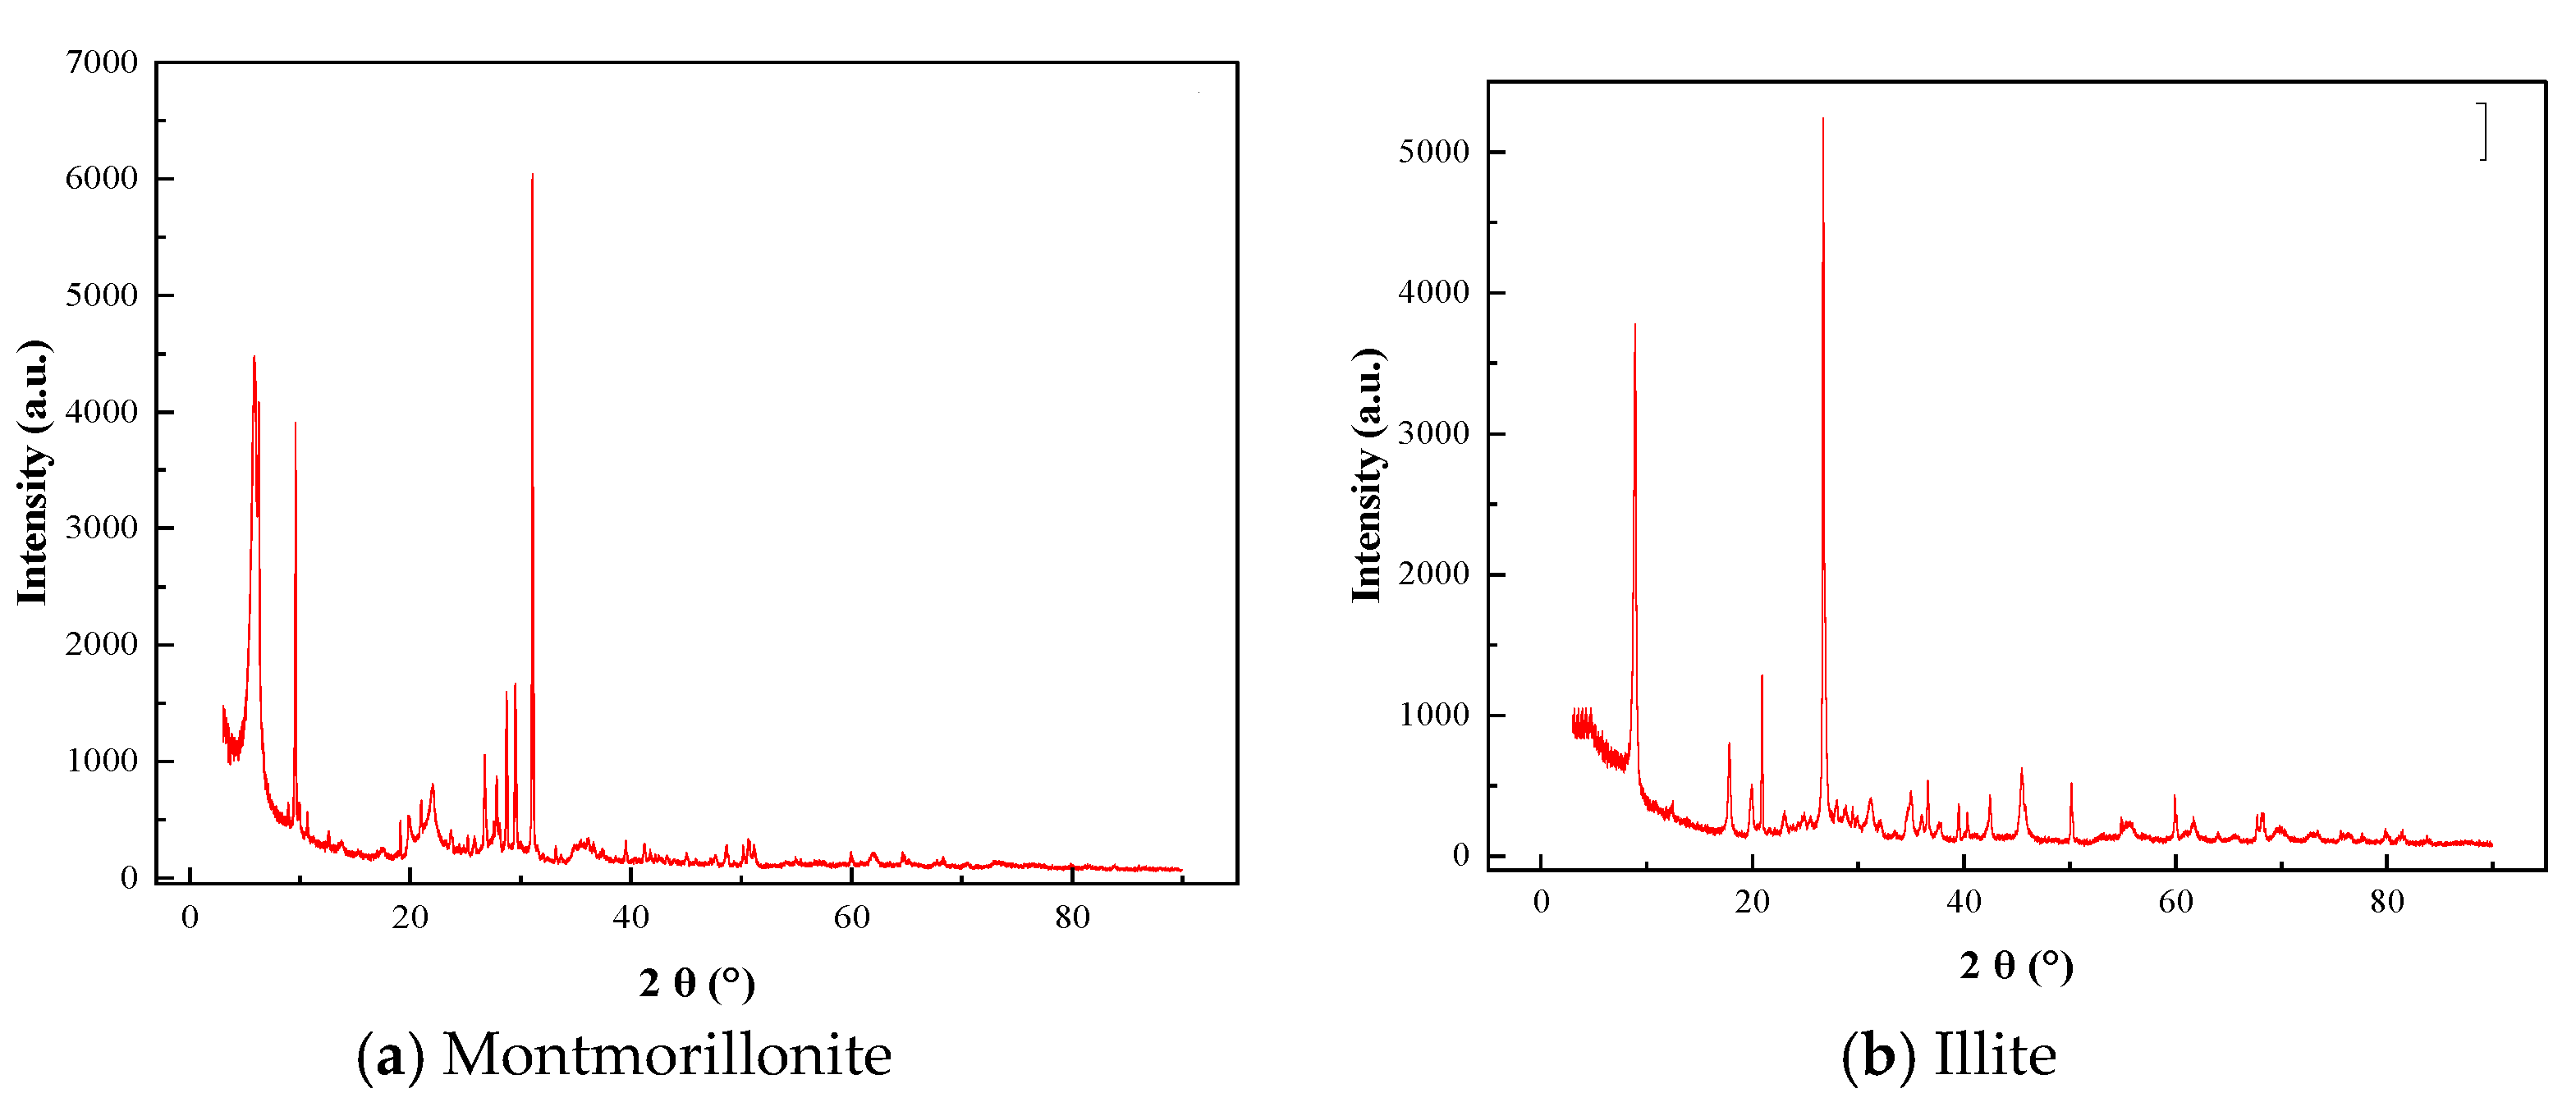
An XRD analysis of incorporated montmorillonite and illite reveals their distinct impacts on mortar hydration products and kinetics, as demonstrated in Figure 31. Montmorillonite exhibits three major diffraction peaks [28]: a primary peak at 5.8 degrees, exhibiting an intensity of 4427 counts; a secondary peak at 9.59 degrees, registering 3905 counts; and a tertiary peak at 31.09 degrees, representing the maximum intensity at 6040 counts. In contrast, illite displays only two principal peaks: a primary peak at 8.9 degrees, with 3777 counts, and a secondary peak at 26.7 degrees, showing the maximum intensity of 5239 counts.

4.3.2. XRD Analysis of Different MB Values

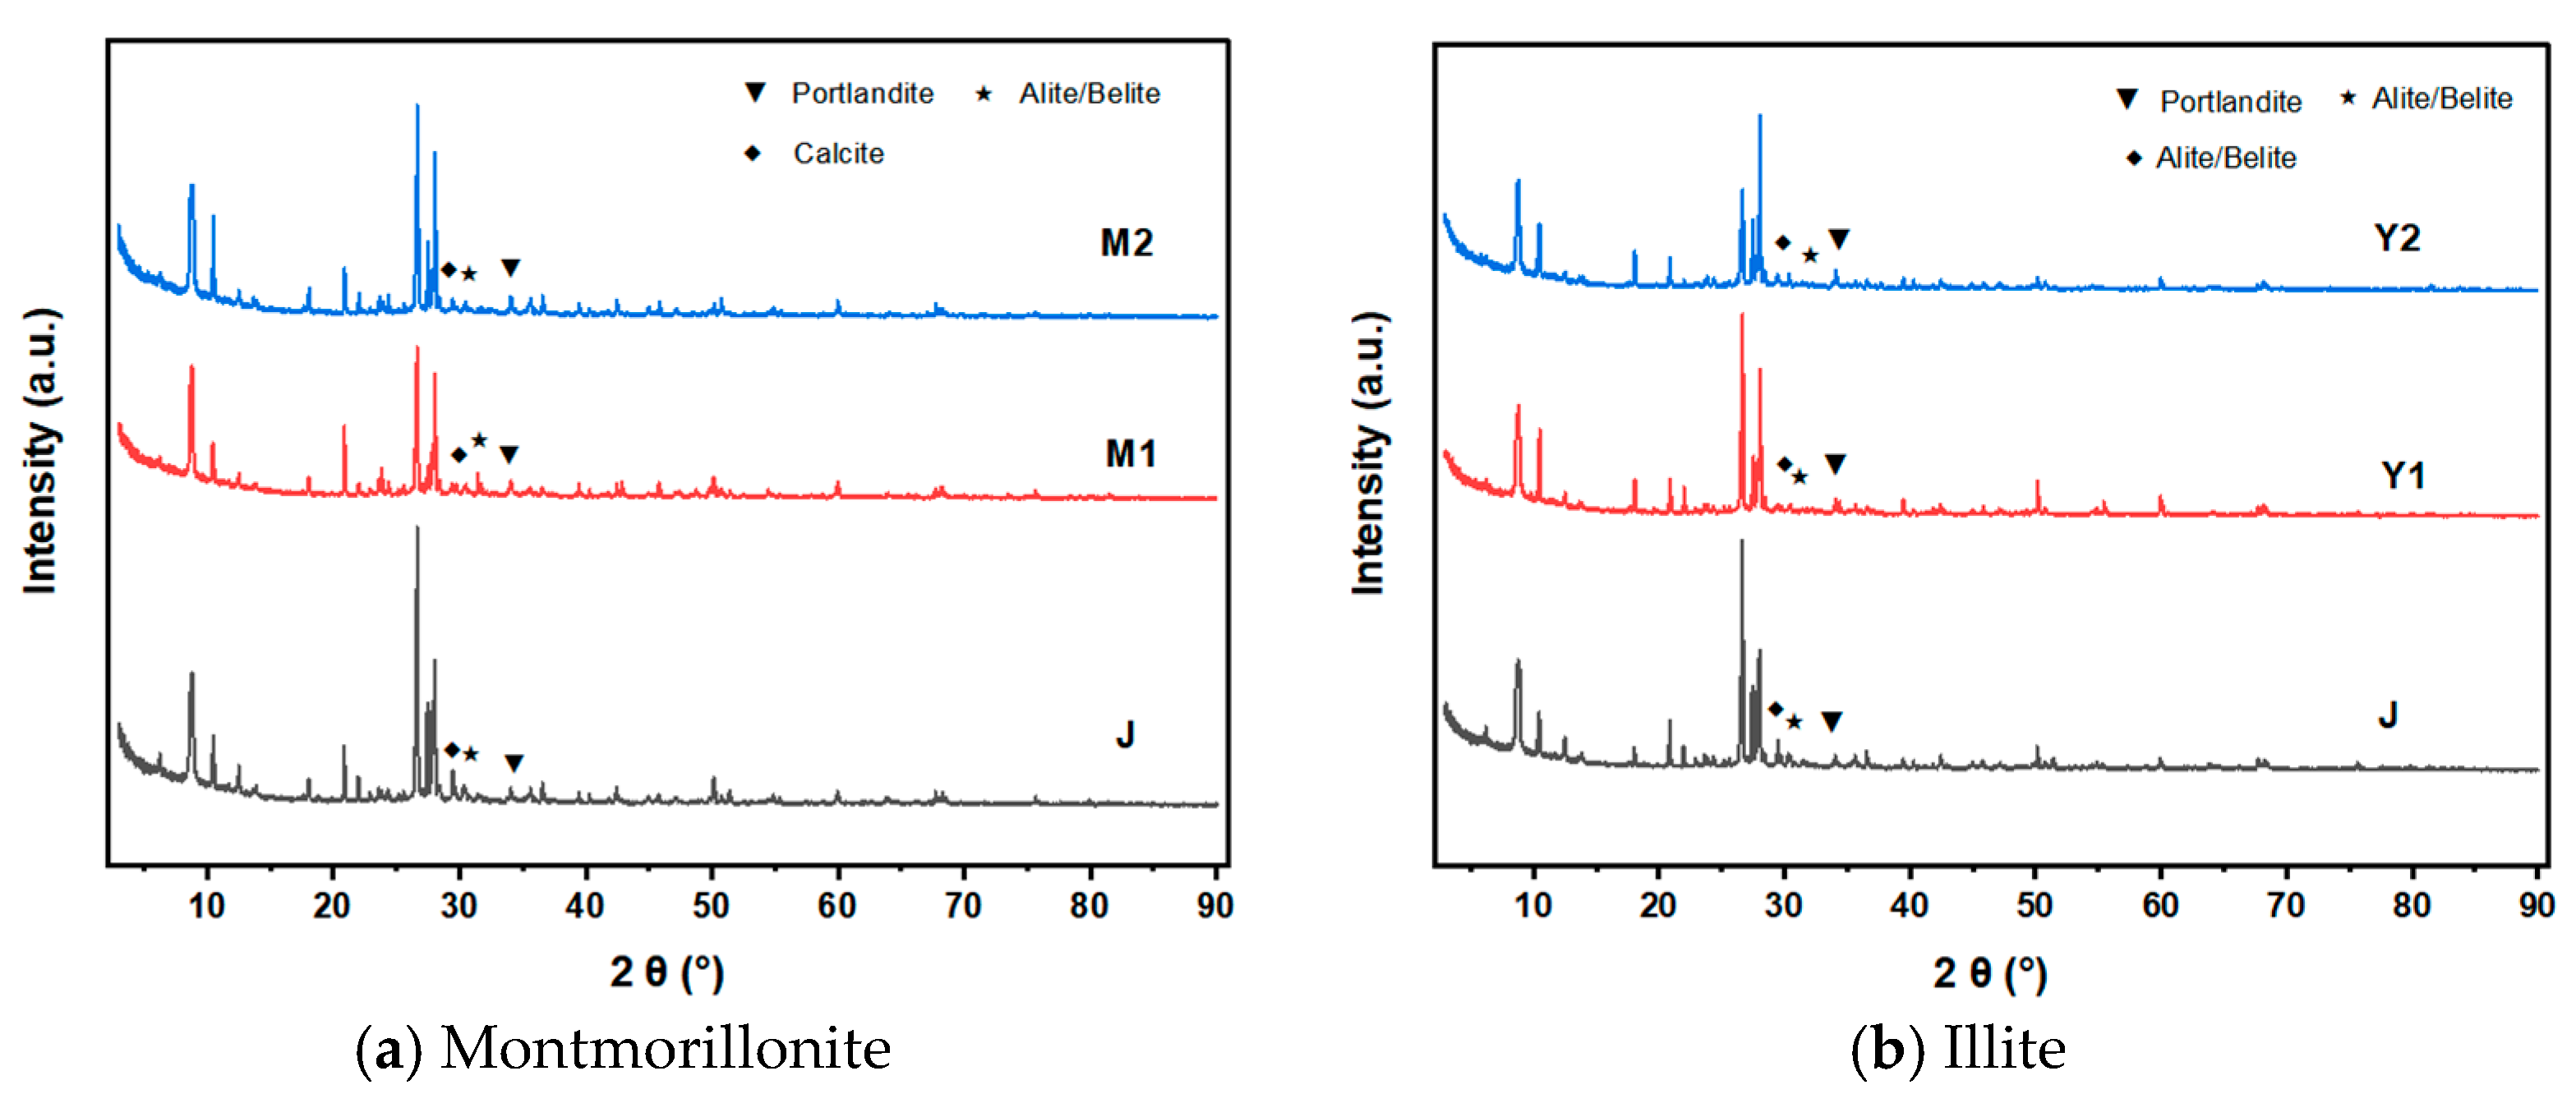
An XRD analysis of the 28-day-cured montmorillonite and illite mortars with varying MB values elucidates impacts on hydration products, revealing such primary constituents as calcium hydroxide, silicon dioxide, ettringite, calcite, dicalcium silicate, and tricalcium silicate. Silicon dioxide originates predominantly from sand, calcium hydroxide derives mainly from cement hydration, and calcite formation results from carbonation of calcium hydroxide [36]. Detectable dicalcium silicate and tricalcium silicate residues in the mortars M2, Y1, and Y2 indicate incomplete cement hydration at this stage, as evidenced in Figure 32.
An XRD analysis of mortar specimens necessitates a combined interpretation of data and patterns due to amplified silicon dioxide peaks, with characteristic calcium hydroxide diffraction near 18 degrees and 34.1 degrees, ettringite near 9.09 degrees, tricalcium silicate and dicalcium silicate between 32 degrees and 34 degrees, and calcium silicate near 29.4 degrees, all identified via standard powder diffraction cards. Pervasive silicon dioxide reflections appearing at multiple locations required no further analysis and are consequently unlabeled in the figures, while montmorillonite and illite peaks remained undetected due to an overlap with silicon signatures.
Figure 32 demonstrates that the mortars M1 with an MB value of 1.1 and M2 with an MB value of 2.2 exhibit negligible diffraction peaks near 5.8 degrees, 9.59 degrees, and 31.09 degrees, indicating undetectable trace montmorillonite by XRD. A comparative analysis of the reference mortar JZ alongside M1 and M2 reveals ascending peak intensities for dicalcium silicate and tricalcium silicate between 32.0 degrees and 32.6 degrees, with maximum intensities of 419 and 542 counts, respectively, coinciding with increasing MB values. Concomitantly, calcium hydroxide peaks at 18.0 degrees and 34.1 degrees display the highest intensity in JZ and the lowest in M2, signifying that montmorillonite’s elevated adsorption capacity consumes substantial free water and adsorbs calcium ions, thereby inhibiting hydration reactions of tricalcium silicate and dicalcium silicate and consequently reducing calcium hydroxide formation. Additionally, calcite peaks exhibit a higher intensity in JZ relative to reduced intensities in M1 and M2, presumably due to minor specimen carbonation.
A comparative XRD analysis of Y1 and Y2 with MB values of 1.1 and 2.2 reveals absent discernible peaks near 8.9 degrees, alongside a spectral overlap with silicon dioxide signatures at 26.7 degrees, precluding illite detection. An examination of the reference JZ alongside Y1 and Y2 demonstrates increasing dicalcium silicate and tricalcium silicate peak intensities within 29.3 degrees to 32.9 degrees, reaching maxima of 330 and 430 counts, respectively, with ascending MB values, indicating that despite its inferior adsorption capacity relative to montmorillonite, substantial illite incorporation still impedes hydration. Concurrently, calcium hydroxide peaks at 18.0 degrees exhibit significantly greater intensity in the Y1 and Y2 mortars compared to the JZ, M1, and M2 counterparts, attributable to superimposed illite reflections amplifying this signal. On the other hand, diminished calcium hydroxide intensities persist at 34.1 degrees across the specimens, with calcite peaks in Y1 and Y2 displaying comparable magnitudes to those in M1 and M2 mortars, presumably due to analogous minor carbonation effects.
Clay incorporation induces no detectable phase alterations in hydration products but modifies hydration kinetics through adsorption and physical filling effects. Low clay additions, such as 0.6% montmorillonite, may temporarily enhance compactness via filling, whereas adsorption-dominated adverse effects at a higher loading increase porosity, ultimately manifested as reduced calcium hydroxide formation and an elevated residual content of incompletely hydrated cement minerals.

4.4. Thermogravimetric Analysis

Figure 33 delineates the thermogravimetric patterns of the mortars with varying clay types and contents, wherein four distinct mass-loss stages emerge between 25 °C and 800 °C, as established in reference [51]. Specifically, Stage 1 involves water evaporation, encompassing free water and partially bound water, at 25 °C to 100 °C. Stage 2 comprises decomposition of calcium silicate hydrate, ettringite, and monosulfoaluminate at 110 °C to 250 °C. Stage 3 features calcium hydroxide decomposition at 400 °C to 500 °C. Stage 4 is marked by calcium carbonate decomposition at 650 °C to 800 °C.
Montmorillonite mass loss manifests through two discrete stages. Specifically, Stage 1, from 50 °C to 150 °C, is characterized by an elimination of physically adsorbed water and partial interlayer water, accounting for a 5% to 15% mass reduction. Stage 2, between 500 °C and 800 °C, exhibits a 3% to 6% mass loss, primarily attributed to hydroxyl group elimination and lattice structural degradation.
An Illite mass-loss analysis similarly reveals two distinct stages. Specifically, Stage 1, from 40 °C to 150 °C, exhibits an approximately 1% to 2% mass reduction due to surface-adsorbed water elimination. Stage 2, between 500 °C and 700 °C, shows a 3% to 6% mass loss, primarily resulting from hydroxyl group decomposition accompanied by partial structural degradation.
Figure 33 reveals three consecutive mass-loss troughs for JZ with an MB value of 0.6. Specifically, the first trough occurs from 70 °C to 250 °C, exhibiting a 1.47% mass loss attributed to free water evaporation; partial bound water elimination; and decomposition of calcium silicate hydrate, ettringite, and monosulfoaluminate. The second trough emerges between 400 °C and 480 °C, with a 0.88% mass loss, indicating calcium hydroxide decomposition. The third trough develops from 500 °C to 710 °C, demonstrating a 1.92% mass loss associated with calcium carbonate decomposition.
M1, possessing an MB value of 1.1, displays an indistinct mass-loss trough from 70 °C to 250 °C, demonstrating that incorporating 0.6% montmorillonite retards mortar decomposition during its initial two stages, yielding a merely 0.58% mass loss equating to only 39% of the JZ specimen. This is followed by a defined first trough between 400 °C and 480 °C, exhibiting a 0.82% mass loss that is slightly below JZ, indicating a comparable calcium hydroxide content. Subsequently, a second trough from 500 °C to 720 °C reveals marginally extended decomposition toward elevated temperatures, with a 2.07% mass loss, moderately exceeding JZ values, since both montmorillonite and calcium carbonate decompose within this temperature range, confirming an equivalent calcium carbonate content relative to JZ.
M2, showcasing an MB value of 2.2, manifests an initial mass-loss trough from 70 °C to 250 °C analogous to JZ, with a 1.26% mass loss, signifying that 2% montmorillonite exerts minimal impact on decomposition during the first two mortar stages. This is succeeded by a second trough between 400 °C and 480 °C revealing a 0.78% mass loss lower than both JZ and M1, indicating a reduced calcium hydroxide content and a diminished hydration degree. The results culminate in a third trough, from 500 °C to 730 °C, exhibiting further extended decomposition toward elevated temperatures relative to M1, with a 2.27% mass loss, exceeding both JZ and M1 values, while montmorillonite and calcium carbonate co-decompose within this temperature range, confirming a calcium carbonate content equivalent to JZ.
Y1, featuring an MB value of 1.1, fails to manifest a distinct mass-loss trough from 70 °C to 250 °C analogous to M1 with an identical MB value, signifying that 3% illite incorporation decelerates mortar decomposition during initial stages, yielding a 1.09% mass loss that accounts for 74% of the JZ value. Subsequently, it demonstrates a defined first trough between 400 °C and 480 °C, exhibiting a 0.77% mass loss below JZ, indicating a reduced calcium hydroxide content and a diminished hydration degree. The results culminate in a second trough, from 500 °C to 720 °C, revealing marginally extended decomposition toward elevated temperatures relative to JZ, with a 1.91% mass loss, moderately exceeding JZ yet remaining inferior to both M1 and M2, while illite and calcium carbonate decompose concurrently within this thermal range, confirming a lower calcium carbonate content than JZ.
Y2, displaying an MB value of 2.2, exhibits an initial mass-loss trough from 60 °C to 200 °C that is identical to JZ, with a contracted thermal decomposition range and a 1.12% mass loss below JZ, confirming that 9% illite incorporation influences decomposition during the first two mortar stages. This is followed by a second trough between 400 °C and 480 °C, demonstrating a 0.75% mass loss that is lower than both the JZ and Y1 specimens, indicating the lowest calcium hydroxide content and minimal hydration degree. The results are succeeded by a third trough, from 500 °C to 710 °C, featuring decomposition temperatures equivalent to JZ, with a 1.67% mass loss that is inferior to both JZ and Y1, establishing the lowest calcium carbonate content and minimal hydration degree, thus yielding the hydration degree sequence JZ > M1 > M2 > Y1 > Y2.

5. Conclusions

This study systematically investigates the mechanical properties, frost resistance, and impermeability of machine-made sand mortars containing varied clay types and contents, elucidating the impact of distinct engineering sands on mortar performance, integrated with microstructural analyses of clay-bearing mortars encompassing pore distribution and ITZ to comprehensively interpret macro-performance mechanisms. The core conclusions are as follows:
(1)
MB testing reveals that montmorillonite and illite exhibit markedly distinct MB sensitivity, where 1% montmorillonite yields an MB value of 1.42, exceeding the specification limit of 1.40, whereas illite requires a 5% content to attain an MB of 1.50.
(2)
Under constant fluidity and mix proportion, equivalent MB values necessitate only 50% water reducer demand for montmorillonite mortars relative to their illite counterparts, yet an equivalent clay powder content conversely demands a significantly higher water reducer for montmorillonite mortars.
(3)
Compressive strength of montmorillonite mortars initially increases then decreases with rising MB values at 7d, while flexural strength increases persistently; both parameters decline at 28d and 90d. Across all curing ages (7d, 28d, and 90d), illite mortars exhibit progressive declines in both compressive and flexural strength with an increasing MB, where montmorillonite mortar with an MB of 2.2 surpasses illite mortar with an MB of 1.1 in strength. Given a constant clay type, mortar drying shrinkage escalates with ascending MB values; nevertheless, the montmorillonite mortar with an MB of 2.2 demonstrates superior shrinkage performance compared to the illite mortar with an MB of 1.1, indicating that clay content exerts greater influence than MB value on drying shrinkage.
(4)
M1 and M2 exhibit enhanced frost resistance and impermeability relative to JZ. Y1 shows reduced impermeability and marginally inferior frost resistance versus JZ, whereas Y2 displays significantly compromised frost resistance and impermeability. Regarding frost-impermeability impacts, clay content demonstrates greater influence dominance than MB value, with a low clay content, below 2%, improving both properties.
(5)
Increasing MB values correlate with reduced harmless and marginally harmful pores, increased multi-harm pores, diminished hydration degrees, decreased hydration products, compromised structural compactness, thickened ITZ, and overall microstructural deterioration, consequently inducing macro-performance degradation.

Author Contributions

Y.S.: writing—original draft, visualization, validation, software, methodology, investigation, funding, formal analysis, data curation, and conceptualization. S.P.: writing—review and editing, supervision, resources, funding, software, and project administration. J.H., Y.W., Y.L., and Q.D.: investigation, formal analysis, and conceptualization. All authors have read and agreed to the published version of the manuscript.

Funding

This research was funded by National Natural Science Foundation of China (52179122 and U2340229), the Natural Science Foundation of Hubei Province (2022CFD026 and 2022CFB662) and the Central Non-Profit Scientific Research Fund for Institutes (CKSF20241023/CL and CKSF20241002/CL).

Data Availability Statement

The original contributions presented in this study are included in the article. Further inquiries can be directed to the corresponding author.

Acknowledgments

The authors would like to acknowledge the financial support received from the National Natural Science Foundation of China (52179122 and U2340229), the Natural Science Foundation of Hubei Province (2022CFD026 and 2022CFB662) and the Central Non-Profit Scientific Research Fund for Institutes (CKSF20241023/CL and CKSF20241002/CL).

Conflicts of Interest

The authors declare no conflicts of interest.

References

  1. Weerdt, K.D.; Justnes, H. The effect of sea water on the phase assemblage of hydrated cement paste. Cem. Concr. Comp. 2015, 55, 215–222. [Google Scholar] [CrossRef]
  2. Tadesse, D.M.; Jeon, J.; Kim, S.; Park, S. The effect of seawater on the phase assemblage of hydrated cement paste: A study on PC, CAC and CSA. Dev. Built. Environ. 2023, 15, 100183. [Google Scholar] [CrossRef]
  3. Zhao, H.; Ma, Y.; Zhang, J.; Hu, Z.; Li, H.; Wang, Y.; Liu, J.; Li, Z. Effect of clay content on plastic shrinkage cracking of cementitious materials. Constr. Build. Mater. 2022, 342, 127989. [Google Scholar] [CrossRef]
  4. Ghourchian, S.; Wyrzykowski, M.; Plamondon, M.; Lura, P. On the mechanism of plastic shrinkage cracking in fresh cementitious materials. Cem. Concr. Res. 2019, 115, 251–263. [Google Scholar] [CrossRef]
  5. Nehdi, M. Clay in cement-based materials: Critical overview of state-of-the-art. Constr. Build. Mater. 2014, 51, 372–382. [Google Scholar] [CrossRef]
  6. Jiao, D.; De Schryver, R.; Shi, C.; De Schutter, G. Thixotropic structural build-up of cement-based materials: A state-of-the-art review. Cem. Concr. Comp. 2021, 122, 104152. [Google Scholar] [CrossRef]
  7. Ma, F.; Zhang, Y.; Qiao, H.; Liu, H. Damage constitutive model of manufactured sand concrete for bridges under composite salt freeze-thaw cycles. Constr. Build. Mater. 2025, 483, 141339. [Google Scholar] [CrossRef]
  8. Cortes, D.D.; Kim, H.K.; Palomino, A.; Santamarina, J. Rheological and mechanical properties of mortars prepared with natural and manufactured sand. Cem. Concr. Res. 2008, 38, 1142–1147. [Google Scholar] [CrossRef]
  9. Yool, A.I.G.; Lees, T.P.; Fried, A. Improvements to the methylene blue dye test for harmful clay in aggregates for concrete and mortar. Cem. Concr. Res. 1998, 28, 1417–1428. [Google Scholar] [CrossRef]
  10. SL/T 352-2020; Test Code for Hydraulic Concrete. China Water & Power Press: Beijing, China, 2020.
  11. Liang, T.; Ahmed, W.; Duan, Z.; Qu, Z.; Zhang, B.; Jiao, D. A critical review on the applications of modified recycled coarse aggregate in conventional concrete and high-performance concrete. J. Build. Eng. 2025, 106, 112601. [Google Scholar] [CrossRef]
  12. Muñoz, J.F.; Gullerud, K.J.; Cramer, S.M.; Tejedor, M.I.; Anderson, M.A. Effects of coarse aggregate coatings on concrete performance. J. Mater. Civ. Eng. 2010, 22, 96–103. [Google Scholar] [CrossRef]
  13. Courard, L.; Michel, F.; Pierard, J. Influence of clay in limestone fillers for self-compacting cement based composites. Constr. Build. Mater. 2011, 25, 1356–1361. [Google Scholar] [CrossRef]
  14. Dong, W.; Ahmed, A.H.; Liebscher, M.; Li, H.; Guo, Y.; Pang, B.; Adresi, M.; Li, W.; Mechtcherine, V. Electrical resistivity and self-sensing properties of low-cement limestone calcined clay cement (LC3) mortar. Mater. Design 2025, 252, 113790. [Google Scholar] [CrossRef]
  15. Chen, X.; Yuguang, G.; Li, B.; Zhou, M.; Li, B.; Liu, Z.; Zhou, J. Coupled effects of the content and methylene blue value (MBV) of microfines on the performance of manufactured sand concrete. Constr. Build. Mater. 2020, 20, 117953. [Google Scholar] [CrossRef]
  16. Du, W.; Liu, B.; Ding, Q.; Jiang, L.; Zuo, D.; Liu, Q.; Feng, Z. Research on improving the frost resistance and self-repair performance of limestone calcined clay cement concrete by microcapsules. J. Build. Eng. 2024, 94, 109960. [Google Scholar] [CrossRef]
  17. Jiao, Y.; Yang, H.; Wang, J.; Fang, M.; Shi, H. Effects of fiber properties on flexural and fracture characteristics of manufactured sand concrete based on acoustic emission. J. Build. Eng. 2024, 84, 108308. [Google Scholar] [CrossRef]
  18. Pedro, D.; De Brito, J.; Evangelista, L. Mechanical characterization of high performance concrete prepared with recycled aggregates and silica fume from precast industry. J. Clean. Prod. 2017, 164, 939–949. [Google Scholar] [CrossRef]
  19. Xie, J.; Fang, C.; Lu, Z.; Li, Z.; Li, L. Effects of the addition of silica fume and rubber particles on the compressive behaviour of recycled aggregate concrete with steel fibres. J. Clean. Prod. 2018, 197, 656–667. [Google Scholar] [CrossRef]
  20. Kurad, R.; Silvestre, J.D.; de Brito, J.; Ahmed, H. Effect of incorporation of high volume of recycled concrete aggregates and fly ash on the strength and global warming potential of concrete. J. Clean. Prod. 2017, 166, 485–502. [Google Scholar] [CrossRef]
  21. Shi, C.; Li, Y.; Zhang, J.; Li, W.; Chong, L.; Xie, Z. Performance enhancement of recycled concrete aggregate—A review. J. Clean. Prod. 2016, 112, 466–472. [Google Scholar] [CrossRef]
  22. Cai, J.W. Research of effects and mechanism of micro fines on manufactured fine aggregate concrete. J. Wuhan Univ. Technol.-Mater. Sci. Ed. 2006, 16, 331–337. [Google Scholar]
  23. Gonçalves, J.P.; Tavares, L.M.; Toledo Filho, R.D.; Fairbairn, E.M.R.; Cunha, E.R. Comparison of natural and manufactured fine aggregates in cement mortars. Cem. Concr. Res. 2007, 37, 924–932. [Google Scholar] [CrossRef]
  24. USACE EM 1110-2-2000; Design of Gravity Dams. U.S. Army Corps of Engineers (USACE): Washington, DC, USA, 2000.
  25. SL 677-2014; Specifications for Hydraulic Concrete Construction. China Water & Power Press: Beijing, China, 2014.
  26. Li, B.; Ke, G.; Zhou, M. Influence of manufactured sand characteristics on strength and abrasion resistance of pavement cement concrete. Constr. Build. Mater. 2011, 25, 3849–3853. [Google Scholar] [CrossRef]
  27. Ilangovan, R.; Nagamani, K.; Swamy, P.G. Recycling of quarry waste as an alternative material in concrete manufacturing. Indian Constr. 2007, 40, 7–12. [Google Scholar]
  28. Li, B.; Wang, J.; Zhou, M. Effect of limestone fines content in manufactured sand on durability of low-and high-strength concretes. Constr. Build. Mater. 2009, 23, 2846–2850. [Google Scholar] [CrossRef]
  29. GB 8076-2008; Concrete Admixture. Standards Press of China: Beijing, China, 2009.
  30. GB 175-2023; Common Portland Cement Standard. Standards Press of China: Beijing, China, 2023.
  31. DL/T 5055-2007; Technical Specification for Fly Ash Used in Hydraulic Concrete. China Electric Power Press: Beijing, China, 2007.
  32. GB/T 2419-2005; Test Method for Fluidity of Cement Mortar. Standards Press of China: Beijing, China, 2005.
  33. GB/T 17671-2021; Method for Testing Cement Mortar Strength (ISO Method). Standards Press of China: Beijing, China, 2021.
  34. JC/T 603-2004; Test Method for Drying Shrinkage of Cement Mortar. China Building Materials Industry Press: Beijing, China, 2004.
  35. Nanthagopalan, P.; Santhanam, M. Fresh and hardened properties of self-compacting concrete produced with manufactured sand. Cem. Concr. Compos. 2011, 33, 353–358. [Google Scholar] [CrossRef]
  36. Zhou, M.; Wang, J.; Zhu, L.; He, T. Effects of Manufactured-sand on dry shrinkage and creep of high-strength concrete. J. Wuhan Univ. Technol.-Mater. Sci. Ed. 2008, 23, 249–253. [Google Scholar] [CrossRef]
  37. GB/T 50082-2009; Standard for Test Methods of Long-term Performance and Durability of Ordinary Concrete. China Architecture & Building Press: Beijing, China, 2009.
  38. Jaturapitakkul, C.; Tangpagasit, J.; Songmue, S.; Kiattikomol, K. Filler effect of fine particle sand on the compressive strength of mortar. Int. J. Miner. Metall. Mater. 2010, 18, 240–246. [Google Scholar] [CrossRef]
  39. Westerholm, M.; Lagerblad, B.; Silfwerbrand, J.; Forssberg, E. Influence of fine aggregate characteristics on the rheological properties of mortars. Cem. Concr. Compos. 2008, 30, 274–282. [Google Scholar] [CrossRef]
  40. Ji, T.; Chen, C.Y.; Zhuang, Y.Z.; Chen, J.F. A mix proportion design method of manufactured sand concrete based on minimum paste theory. Constr. Build. Mater. 2013, 44, 422–426. [Google Scholar] [CrossRef]
  41. Kim, J.K.; Lee, C.S.; Park, C.K.; Eo, S.H. The fracture characteristics of crushed limestone sand concrete. Cem. Concr. Res. 1997, 27, 1719–1729. [Google Scholar] [CrossRef]
  42. Li, B.; Zhou, M.; Wang, J. Effect of the methylene blue value of manufactured sand on performances of concrete. J. Ad. Con. Technol. 2011, 9, 127–132. [Google Scholar]
  43. Zhan, A.L.; Zhou, M.K. Effect of clay-contaminated microfines on properties of low-and high-strength concrete. Arab. J. Sci. Eng. 2015, 11, 13–17. [Google Scholar]
  44. Zhan, A.L.; Zhou, M.K.; Yao, C.K. Relationship between methylene blue value of manufactured sand and mortar properties. Key Eng. Mater. 2015, 629, 612–617. [Google Scholar]
  45. Zhan, A.L.; Zhou, M.K.; Li, B.X. Relationships between modified methylene blue value of microfines in manufactured sand and concrete properties. J. Wuhan Univ. Technol.-Mater. Sci. Ed. 2016, 31, 574–581. [Google Scholar]
  46. Wang, L.H.; Liu, J. Effect of particle shape of limestone manufactured sand and natural sand on concrete. In Proceedings of the 2013 International Conference on Material Science and Environmental Engineering (MSEE2013), Wuhan, China, 21–22 December 2013; pp. 463–468. [Google Scholar]
  47. Marinoni, N.; Pavese, A.; Foi, M.; Trombino, L. Characterisation of mortar morphology in thin sections by digital image processing. Cem. Concr. Res. 2005, 35, 1613–1619. [Google Scholar] [CrossRef]
  48. Garboczi, E.J.; Bullard, J.W. Contact function, uniform-thickness shell volume, and convexity measure for 3-D star-shaped random particles. Powder Technol. 2013, 237, 191–201. [Google Scholar] [CrossRef]
  49. Hestnes, K.; Sørensen, B. Evaluation of quantitative X-ray diffraction for possible use in the quality control of granitic pegmatite in mineral production. Miner. Eng. 2012, 39, 239–247. [Google Scholar] [CrossRef]
  50. Guan, M.S.; Lai, Z.C.; Xiao, Q.; Du, H.B.; Zhang, K. Bond behavior of concrete-filled steel tube columns using manufactured sand (MS-CFT). Eng. Str. 2019, 187, 199–208. [Google Scholar] [CrossRef]
  51. Yang, H.F.; Liang, D.Y.; Deng, Z.H.; Qin, Y.H. Effect of limestone powder in manufactured sand on the hydration products and microstructure of recycled aggregate concrete. Constr. Build. Mater. 2018, 188, 1045–1049. [Google Scholar] [CrossRef]
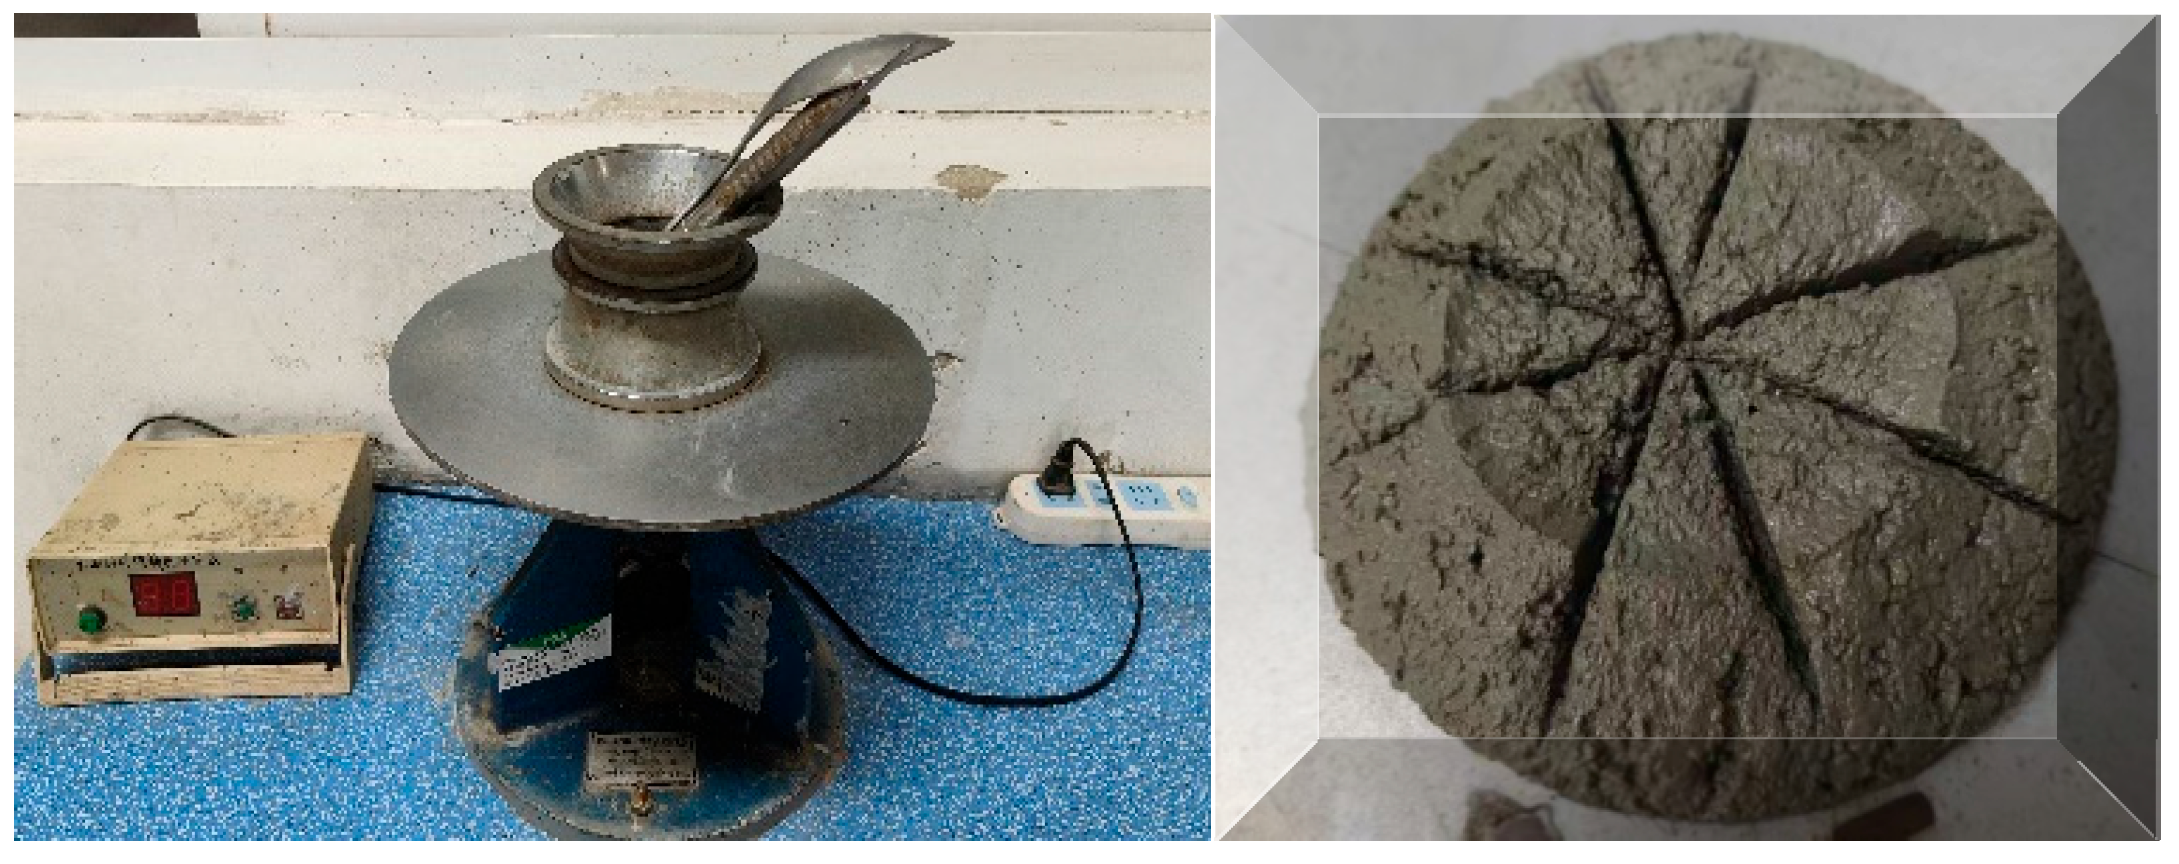
Figure 1. Flowability measuring instrument.
Applsci 15 09115 g001
Figure 2. Diagram of mortar curing.
Applsci 15 09115 g002
Figure 3. Testing of flexural and compressive strengths.
Applsci 15 09115 g003
Figure 4. Diagram of shrinkage test.
Applsci 15 09115 g004
Figure 5. MB values with clay fine types and concentrations.
Applsci 15 09115 g005
Figure 6. The influence of water-reducing admixture.
Applsci 15 09115 g006
Figure 7. Mortar compressive strength at different MB values. Blue line: Intensity standard value.
Applsci 15 09115 g007
Figure 8. Mortar flexural strength at different MB values.
Applsci 15 09115 g008
Figure 9. Drying shrinkage of mortars with varied MB values.
Applsci 15 09115 g009
Figure 10. Mass loss of mortars with varied MB values.
Applsci 15 09115 g010
Figure 11. Freeze–thaw damage phenomenon under different conditions.
Applsci 15 09115 g011
Figure 12. Electric flux of mortars with varied MB values.
Applsci 15 09115 g012
Figure 13. Pattern of mortar hole structure.
Applsci 15 09115 g013
Figure 14. SEM images of montmorillonite and illite.
Applsci 15 09115 g014
Figure 15. SEM images of JZ.
Applsci 15 09115 g015
Figure 16. SEM images of M1.
Applsci 15 09115 g016
Figure 17. SEM images of M2.
Applsci 15 09115 g017
Figure 18. SEM images of Y1.
Applsci 15 09115 g018
Figure 19. SEM images of Y2.
Applsci 15 09115 g019
Figure 20. XRD of montmorillonite and illite.
Applsci 15 09115 g020
Figure 21. XRD images of JZ.
Applsci 15 09115 g021
Figure 22. XRD images of M1.
Applsci 15 09115 g022
Figure 23. XRD images of M2.
Applsci 15 09115 g023
Figure 24. XRD images of Y1.
Applsci 15 09115 g024
Figure 25. XRD images of Y2.
Applsci 15 09115 g025
Figure 26. EDS of the interface transition zone of JZ.
Applsci 15 09115 g026
Figure 27. EDS of the interface transition zone of M1.
Applsci 15 09115 g027
Figure 28. EDS of the interface transition zone of M2.
Applsci 15 09115 g028
Figure 29. EDS of the interface transition zone of Y1.
Applsci 15 09115 g029
Figure 30. EDS of the interface transition zone of Y2.
Applsci 15 09115 g030
Figure 31. XRD results of montmorillonite and illite.
Applsci 15 09115 g031
Figure 32. Diagram of the XRD results.
Applsci 15 09115 g032
Figure 33. Thermogravimetric curves of mortars with varied clay types and contents.
Applsci 15 09115 g033
Table 1. Mix proportions of manufactured sand mortar.
SpecimenWater–Cement RatioMB Value/g·kg−1SandClay Content/%Montmorillonite/gIllite
/g
Water
/kg
Cement
/kg
Fly Ash
/kg
Manufactured Sand/kgWater Reducer/%Fluidity
/mm
Montmorillonite RatioIllite Ratio
JZ0.480.6Manufactured Sand000021631513513500175
M10.481.1Manufactured Sand0.638.140.521631513513500.1170
M20.482.2Manufactured Sand2927121.521631513513500.31175
Y10.481.1Manufactured Sand0.638.140.521631513513500.2170
Y20.482.2Manufactured Sand2927121.521631513513500.68170
Table 2. The chemical compositions of montmorillonite.
Chemical CompositionSiO2AL2O3CaOFe2O3MgONa2OK2O
Ratio/%71.4716.453.832.282.250.650.91
Table 3. The chemical compositions of illite.
Chemical CompositionSiO2AL2O3CaOFe2O3MgONa2OK2O
Ratio/%49.9529.45-3.281.25-7.91
Table 4. Test results of pore structure.
SpecimenCuring Age
/d
MB ValuePorosity
/%
Pore Size Distribution/%
<20 nm20~50 nm50~200 nm>200 nmAverage Pore Diameter/nmMedian Aperture/nm
JZ280.69.937.732.29.220.914.229.6
M1281.19.535.732.47.124.816.931.9
M2282.213.228.834.14.932.218.634.5
Y1281.111.621.134.75.638.626.841.4
Y2282.213.818.330.46.544.831.348.2
Table 5. Chemical composition of montmorillonite.
LocationCaOMgSiAlFe
Point 302.8150.7-37.666.72-
Point 311.1050.850.7237.226.790.71
Point 321.9150.50.8837.856.680.66
Table 6. Chemical composition of illite.
LocationOSiAlKFeMg
Point 3446.3724.8317.038.652.390.73
Point 3546.8224.8217.797.931.750.66
Point 3646.8125.1717.297.832.050.85
Table 7. Chemical composition of JZ.
AgeLocationOCaSiAlFeCalcium–Silicate RatioHydration Product
7dPoint 138.5648.163.311.540.8214.58Calcium hydroxide
Point 238.3130.1413.286.795.932.88-
Point 339.1230.8613.714.893.332.25Hydrated calcium (alumino) silicate
28dPoint 156.365.0415.289.170.190.33Hydrated calcium (alumino) silicate
Point 255.0521.185.671.231.313.73-
Point 358.3717.13.811.410.894.49-
Point 446.5140.791.210.360.3433.7Partial calcium hydroxide
Table 8. Chemical composition of M1.
AgeLocationOCaSiAlFeCalcium–Silicate RatioHydration Product
7dPoint 441.961.8631.9611.453.490.058Montmorillonite
Point 536.4720.8623.412.702.210.89Hydrated calcium (alumino) silicate
Point 638.7131.3215.526.082.312.03Hydrated calcium (alumino) silicate
28dPoint 552.315.2618.7812.140.20.28Silica aggregate
Point 647.6411.223.218.242.333.49-
Point 751.2512.524.514.102.462.76-
Point 847.047.802.423.93.773.22-
Table 9. Chemical composition of M2.
AgeLocationOCaSiAlFeCalcium–Silicate RatioHydration Product
7dPoint 744.686.7333.028.650.890.20Silica aggregate
Point 839.9621.6219.168.713.081.08Hydrated calcium (alumino) silicate
Point 942.8618.3318.8910.124.250.97Hydrated calcium (alumino) silicate
28dPoint 958.4412.147.132.771.151.70Hydrated calcium (alumino) silicate
Point 1027.8413.826.82.541.12.03Hydrated calcium (alumino) silicate
Point 1152.316.2619.7812.140.20.32Silica aggregate
Point 1258.1716.006.001.480.802.67-
Point 1358.6815.474.721.61.023.28-
Table 10. Chemical composition of Y1.
AgeLocationOCaSiAlFeCalcium–Silicate RatioHydration Product
7dPoint 1038.6833.7313.123.683.192.57Hydrated calcium (alumino) silicate
Point 1141.2227.6411.221.281.242.46Hydrated calcium (alumino) silicate
Point 1237.8431.2512.521.583.102.50Hydrated calcium (alumino) silicate
28dPoint 1448.1627.046.802.223.133.98-
Point 1553.046.7118.9811.59-0.58Silica aggregate
Point 1658.2410.538.785.400.31.20-
Point 1741.1835.394.921.757.367.19-
Table 11. Chemical composition of Y2.
AgeLocationOCaSiAlFeCalcium–Silicate RatioHydration Product
7dPoint 1343.514.6733.082.182.050.14Silica aggregate
Point 1439.988.8117.348.7715.530.51Hydrated calcium (alumino) silicate
Point 1539.737.5517.178.715.270.43Hydrated calcium (alumino) silicate
28dPoint 1852.633.679.634.899.20.38-
Point 1956.519.279.326.422.120.99Hydrated calcium (alumino) silicate
Point 2053.035.5619.2712.040.170.29Silica aggregate
Point 2156.8311.499.505.170.841.21-
Point 2256.8815.346.283.270.822.44Hydrated calcium (alumino) silicate
Disclaimer/Publisher’s Note: The statements, opinions and data contained in all publications are solely those of the individual author(s) and contributor(s) and not of MDPI and/or the editor(s). MDPI and/or the editor(s) disclaim responsibility for any injury to people or property resulting from any ideas, methods, instructions or products referred to in the content.