1. Introduction
As a critical mineral resource for strategic emerging industries, lithium (Li) holds significant strategic importance and research value in fields such as medicine, agriculture, new energy, electronics, information technology, aerospace, and national defense [
1,
2]. Currently, China’s Li resources are primarily concentrated in granite-type, pegmatite-type, salt-lake-type, and clay-type deposits [
1,
3,
4]. Among these, salt-lake-type Li deposits are predominantly sulfate-rich and typically exhibit high Mg/Li ratios, resulting in complex and costly extraction processes. Traditional granite-type Li deposits often face challenges such as low grades and high development costs. Although pegmatite-type Li deposits remain the primary source of China’s Li supply [
1,
3,
5,
6], their limited mineralization depth has constrained growth in new reserves in recent years. Meanwhile, intensified exploration efforts have led to the discovery of increasingly abundant clay-type Li deposits with high Li content and potential for independent development [
7,
8,
9,
10,
11], positioning sedimentary clay-type Li deposits as a growing focal point.
Current extraction technologies for clay-type Li deposits primarily include direct leaching, roasting–leaching, additive-assisted roasting–leaching, and chlorination–sulfidation methods, with variations in techniques depending on genetic deposit types [
12,
13,
14,
15,
16]. For instance, volcanic clay-type deposits often contain silicon (Si)–magnesium (Mg) clay minerals such as smectite, characterized by layered structures comprising silica tetrahedral and magnesia octahedral sheets. Li predominantly occurs as structurally bound substitutions within octahedral layers, complicating extraction processes [
17]. Although direct leaching, additive-assisted roasting, and chlorination–sulfidation have been applied to such deposits, additive-assisted roasting remains the most prevalent method [
18,
19]. In carbonate clay-type deposits, Li is mainly adsorbed in smectite interlayers. Medium-temperature roasting alters the smectite structure, rendering Li exchangeable for leaching via hydrogen ions (sulfuric acid solution) or ferric ions. For this deposit type, previous studies employed inorganic trivalent ferric salt solutions to leach medium-temperature-roasted clay ore, achieving a Li leaching rate exceeding 80% under optimized conditions: roasting at 600 °C, 15 wt% FeCl
3 solution, liquid–solid (L/S) ratio of 5 mL/g, leaching temperature of 80 °C, and reaction duration of 240 min [
19].
When utilizing clay-type Li resources to produce lithium carbonate, beyond leaching Li from the ore, it is essential to remove impurity ions from the Li-bearing leachate to ensure Li
+ concentration and purity meet production requirements. Current research on clay-type Li deposits remains limited, particularly regarding impurity removal and precipitation processes for Li-bearing leachates, with no documented literature on specialized methods. Consequently, fundamental principles and techniques largely draw from mainstream Li ore processing approaches. Mature industrial methods with relevance to clay-type Li deposits include the sulfuric acid method, sulfate method, and limestone roasting method [
20,
21,
22,
23]. For the sulfuric acid and sulfate methods, Li-bearing leachates undergo impurity removal via pH adjustment with lime, followed by further purification with sodium carbonate. The purified solution is then evaporated and concentrated before saturated sodium carbonate solution is added to precipitate qualified Li carbonate. These processes carry significant environmental burdens: sulfuric acid digestion of Li-bearing ore releases SO
2/SO
3 emissions (acid rain precursors), while sulfate roasting of lepidolite emits toxic HF/SiF
4 gases [
14,
19]. Both methods produce acidic residues containing leachable heavy metals (e.g., As, Cd), which significantly contribute to groundwater contamination risks. The limestone roasting method, the oldest technique for Li salt production, involves high-temperature roasting of Li-bearing minerals like spodumene or lepidolite with limestone to form alkali metal aluminates. Subsequent leaching, concentration, and purification yield Li carbonate. Despite its simple flow and raw materials, this method suffers from excessive limestone consumption, high waste residue generation, significant energy demands, and low Li recovery rates [
7].
The ore properties of Li resources in the Jinyinshan deposit, southern Hubei, exhibit distinct differences from other domestic clay-type Li deposits [
24,
25]. This uniqueness provides a natural laboratory for comprehensive mineralogical studies and mineral processing-metallurgical extraction experiments on clay-type Li ores, offering critical insights for China’s Li exploration and development. Through detailed mineralogical analysis of ore samples from the deposit, this study elucidates the mineral composition, chemical characteristics, and Li occurrence states in siltstone and slate, establishing a foundation for subsequent beneficiation and extraction. By optimizing leaching parameters and extraction pathways, efficient recovery and comprehensive utilization of clay-type Li ore were achieved. The two full-scale industrially adaptable blank roasting–acid leaching processes developed herein not only produce high-purity lithium carbonate but also address environmental impacts by minimizing energy consumption and pollution. This research provides novel pathways for effective resource utilization of clay-type Li deposits while contributing valuable references for environmental protection and sustainable development.
2. Regional Geological Setting
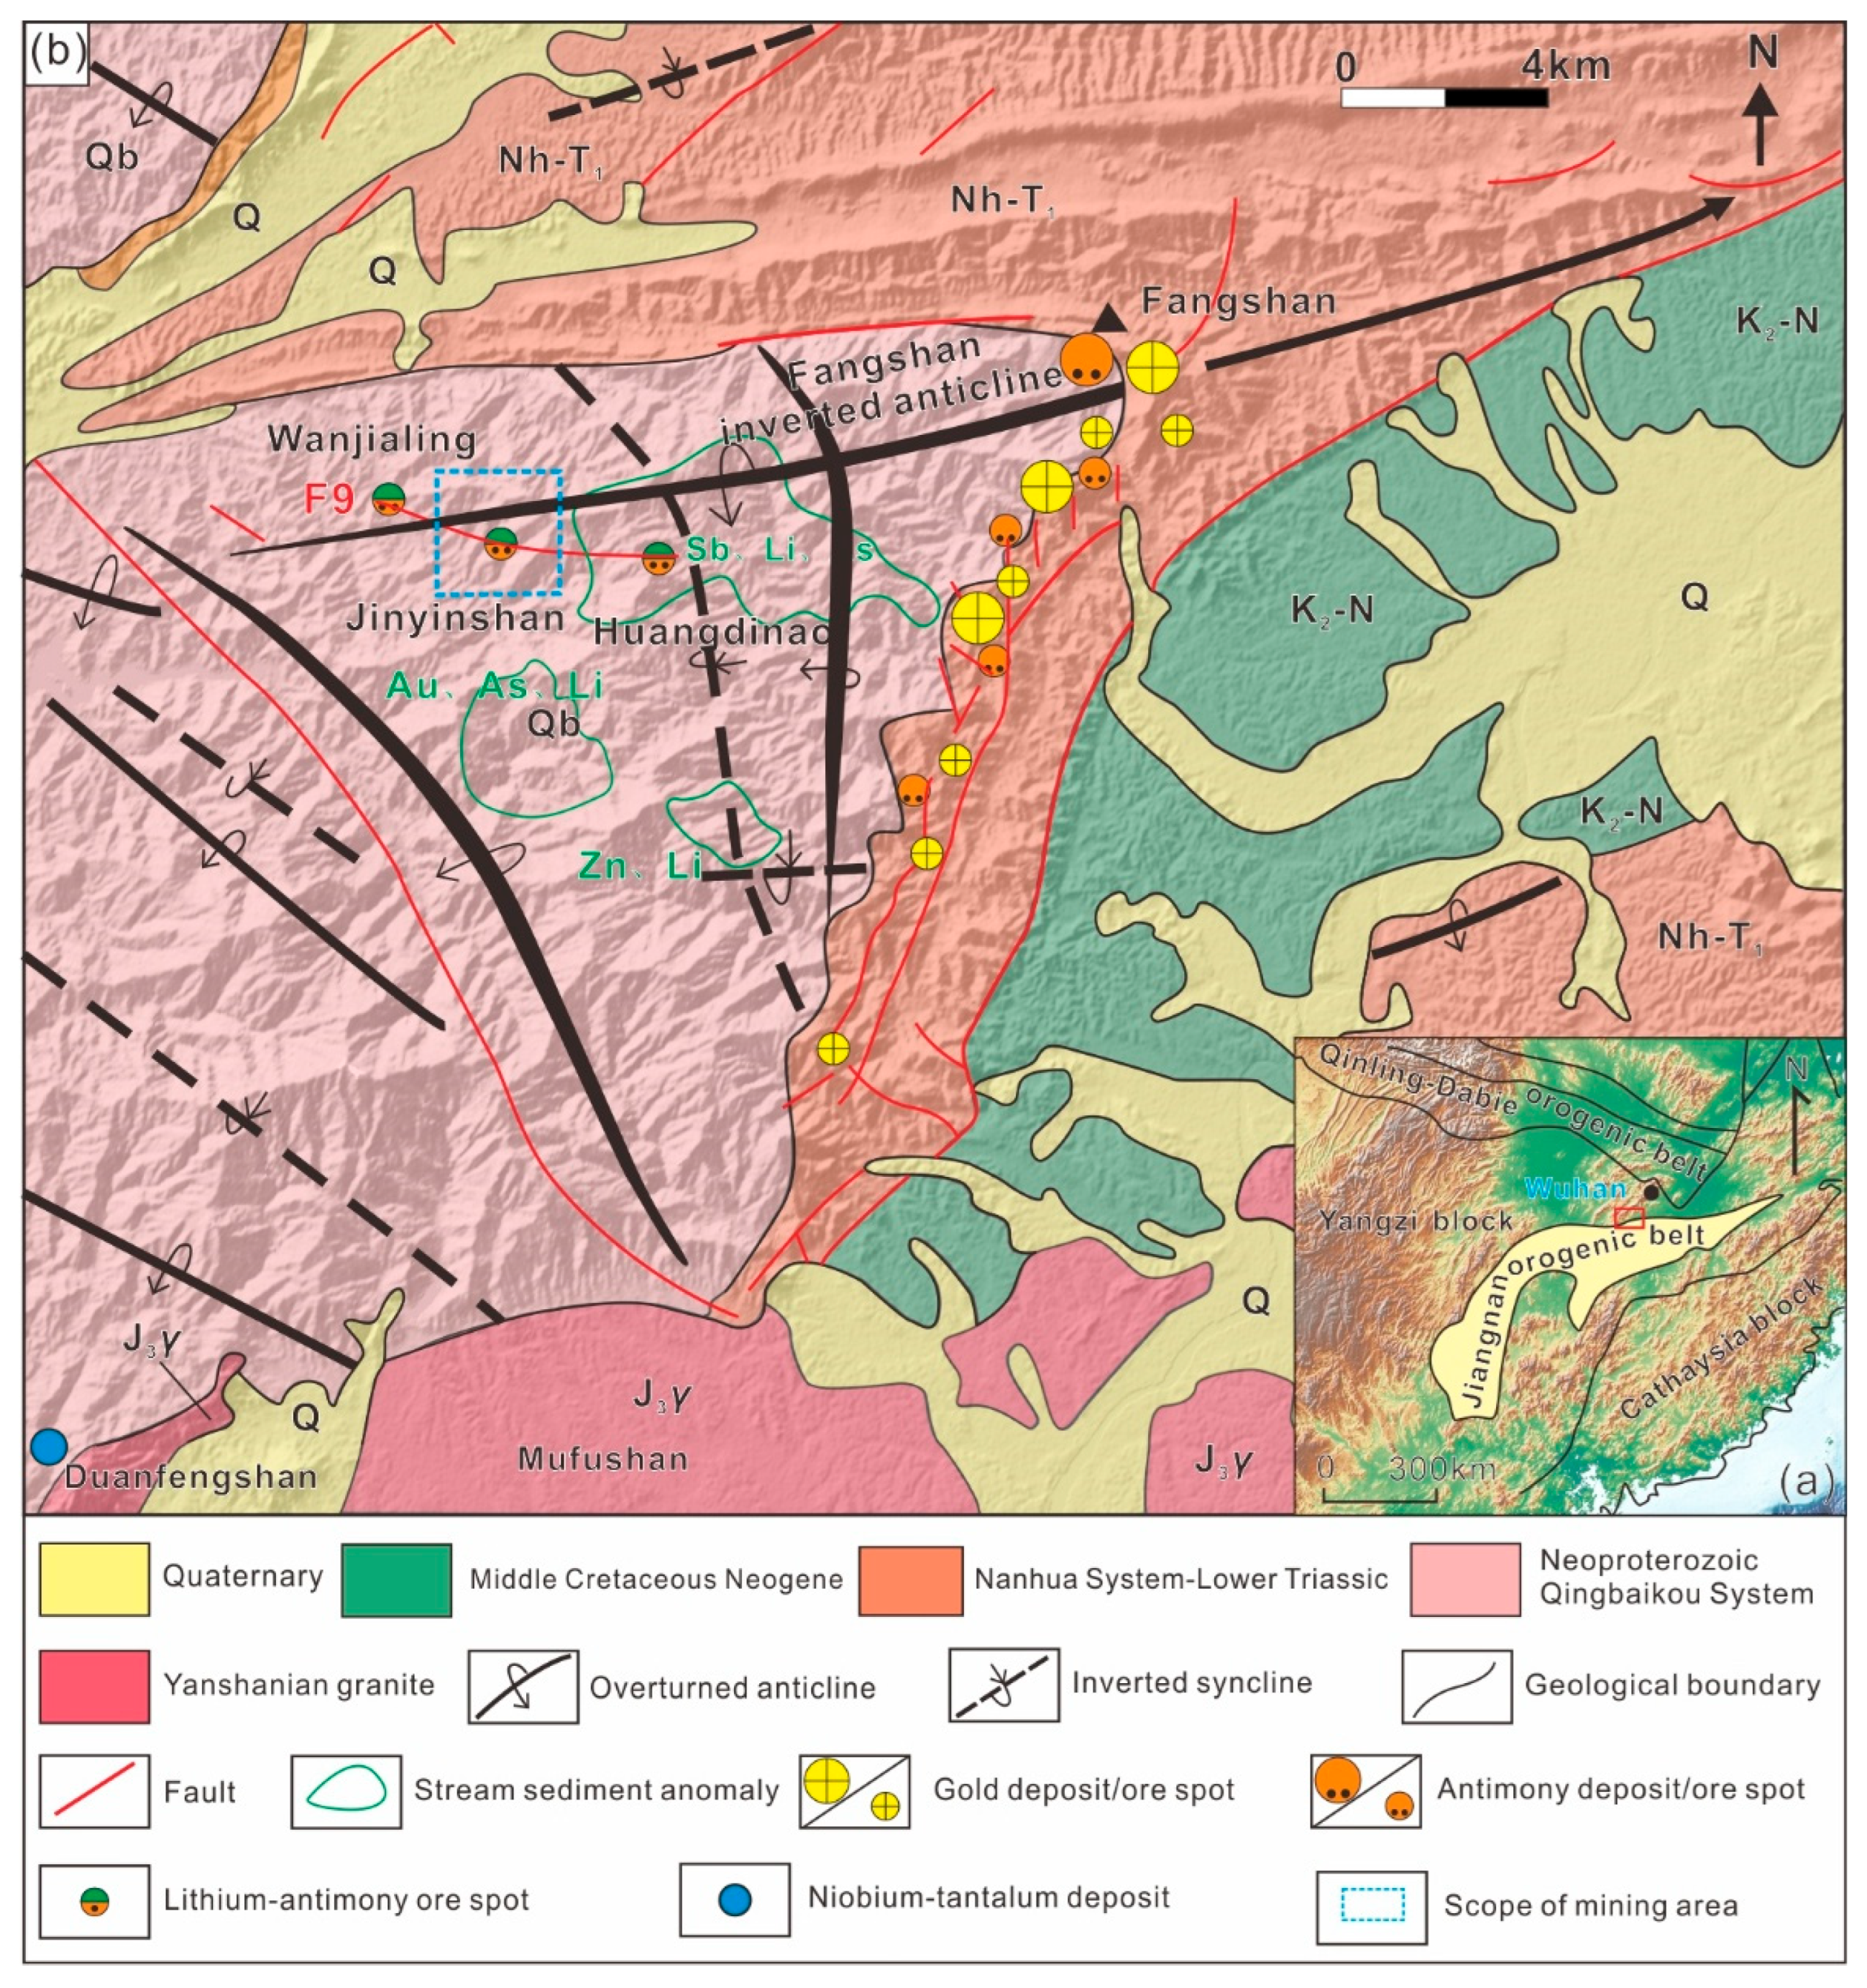
Jinyinshan deposit is situated in the northern Jiangnan Uplift Belt at the junction of the Yangtze and Cathaysia plates, belonging to the Puqi-Tongshan Cu-Au-Sb polymetallic metallogenic belt (
Figure 1a). This deposit is located approximately 30 km at 220° azimuth from Chibi City and administratively falls under Zhaoliqiao Town. Hydrogeologically, it is classified as a simple-to-moderate fissure-watered type. Engineering geological conditions are moderate-to-good, and the geo-environmental quality is rated as medium [
26]. Regionally exposed strata consist predominantly of the Mesoproterozoic Qingbaikou System Lengjiaxi Group to the Mesozoic Cretaceous System, exhibiting essentially continuous outcrops. The basement comprises regionally shallow metamorphic rocks, while the cover sequence includes carbonate rocks, siliceous rocks, and clastic rocks (
Figure 1b). Major regional dike rocks include lamprophyre, spessartite, minette, and quartz veins. South of the study area lies the Mesozoic Yanshanian Mufushan batholith, primarily composed of biotite monzogranite and two-mica monzogranite, representing typical S-type granites [
27,
28,
29]. This batholith exhibits distinct specialization for rare metal mineralization (Li, Be, Nb, Ta).
The region has undergone multiple phases of tectonic movement and deformation, resulting in complex structural features (
Figure 1b). Fangshan overturned anticline extends along a NEE-SWW trend with a “7”-shaped configuration, plunging eastward. Its core exposes shallow metamorphic rocks of the Lengjiaxi Group, while the limbs consist of Sinian-Cambrian strata. The northern limb exhibits overturned bedding, dipping 170–180° with steep dips of 60–70°; the southeastern limb maintains normal bedding, dipping 130–140° at angles of 30–50°. The nearly E-W trending F9 fault extends ~9 km from Chongyang Huangdinao in the east, through Zheping, to Wanjialing at the Hunan border in the west, though surface geomorphological expressions are subtle. The fault generally dips 166–185° at 48–69°, transitioning westward in the Wanjialing segment to dips of 185–222° at 25–48°. Its fracture zone ranges from 0.10 to 2.25 m in width, displaying an overall tight, pinch-and-swell structure with localized narrowing. Distinctly developed bleaching halos of variable thickness flank both sides. Within the fracture zone, tectonic breccias—predominantly cataclasite and fault breccia—exhibit silicification, bleaching alteration, and intermittent stibnite mineralization [
30]. This structure initially acted as a compressional-shear fault, later transitioning to extensional right-lateral strike-slip characteristics, serving as a large-scale ore-conducting and ore-hosting structure.
The Li ore bodies occur within the nearly E-W trending F9 fault fracture zone and adjacent wall rocks, exhibiting a stratiform distribution. The mineralized body generally dips southward at approximately 60°, extending ~1.2 km in length with an average thickness of 5.36 m and an average Li
2O grade of 0.24 wt%. The thickness remains continuous along the strike from west to east and relatively stable down-dip. Ore grades vary locally along the strike (enriched in some sections, depleted in others) and display a trend of decreasing enrichment from shallow to deep levels down-dip. The mineralized lithologies comprise silicified cataclasite, fractured silty slate, fractured argillaceous slate, metamorphic siltstone, and lamprophyre [
25]. The dominant ore textures are fractured and cataclastic, while primary structures include massive, stockwork, and disseminated types. Major ore minerals consist of clay minerals, sericite, quartz, and iron oxides. Clay minerals are predominantly chlorite, fibrous hydromica, and kaolinite, with most exhibiting silicification [
24,
25]. Locally, minor relict clastic occurrences are observed.
3. Sample Collection and Their Mineralogical and Chemical Characteristics
3.1. Collection and Preparation
Ore samples for testing were selected based on a comprehensive evaluation of the current exploration layout and ore body occurrence characteristics. Systematic sampling targeted mineralized bodies in six core profiles (ZK2001, ZK2301, ZK2601, ZK2903, ZK3001, and ZK3002) from the Jinyinshan mining area, southern Hubei. Sampled lithologies include cataclastic rock, silty slate, metamorphic siltstone, and lamprophyre. A combination of oriented channel sampling from trenches and split-core sampling from drill holes yielded a cumulative sample weight of 391.5 kg. This sampling strategy ensured complete coverage of orebody characteristics across varying elevations through three-dimensional integrated surface and subsurface sampling, guaranteeing spatially representative distribution within the deposit.
Sample preprocessing sequentially involved standardized crushing, multi-stage sieving, and splitting operations, ultimately categorizing samples into three categories: test specimens, chemical analysis samples, and archival reference samples. The chemical analysis samples were divided into 3 equal parts for component analysis. Preliminary analysis data indicated a Li
2O content of 0.265 wt% in the samples (
Table 1), consistent with the theoretical average grade (0.24 wt%) calculated from the deposit’s geostatistical model [
25], thereby confirming the samples’ representativeness.
The AMICS test sample was prepared through particle size fractionation. The bulk sample was first crushed to <74 μm using a jaw crusher and roller mill, then homogenized by cone-and-quartering. This processed material was sieved into three fractions: >74 μm, 45–74 μm, and <45 μm, with respective yields of 60.17%, 11.25%, and 28.58%. Test samples were prepared from each fraction, and the final AMICS results represent a comprehensive analysis integrating data from all three size fractions. Separately, representative Li ore samples were selected for probe thin sections preparation.
3.2. Analysis Method and Mineralogical Characteristics
To determine in detail the mineral composition, content, and the occurrence state and concentration of Li within the samples, this study utilized multiple analytical techniques including the automated mineral identification and characterization system (AMICS), electron probe microanalyzer (EPMA), and laser ablation inductively coupled plasma mass spectrometry (LA-ICP-MS) to conduct a comprehensive mineralogical investigation.
3.2.1. AMICS, EPMA and LA-ICP-MS
The AMICS system of Hubei Provincial Geological Experimental Testing Center integrates a ZEISS Sigma 300 high-resolution field emission scanning electron microscope (FESEM), a Bruker XFlash 6/60 energy-dispersive X-ray spectrometer (EDS), and a specialized software suite comprising AMICSTool, Investigator, MineralSTDManager, and AMICSProcess. Operational parameters are configured as follows: 20 kV accelerating voltage, high vacuum environment, 8.5 mm working distance, high-current mode activation, backscattered electron detection using HDBSD, and 60 μm objective lens grating aperture.
Major element compositional analyses were conducted at the Electron Probe Laboratory of the Chinese Academy of Geological Sciences (Beijing) utilizing a JEOL JXA-8230 electron probe microanalyzer (EPMA). Sample preparation involved carbon coating to achieve a conductive layer approximately 20 nm thick. Analytical conditions included an accelerating voltage of 15 kV, beam current of 20 nA, and beam diameter of 2 μm. The measurement times were 10 s per element and 5 s for background acquisition. Natural mineral and synthetic oxide standards were used, and the ZAF correction method was applied to all analytical data.
In situ laser ablation inductively coupled plasma mass spectrometry (LA-ICP-MS) was performed at the National Geological Experimental Testing Center. The test employed the American ASIJ-200 343 nm femtosecond laser and the German Thermo X-Series inductively coupled plasma mass spectrometer on-line. In situ point analyses were performed using a laser ablation spot size of 24 μm, a repetition rate of 6 Hz, and NIST SRM 610 synthetic silicate glass as the primary external calibration standard. To ensure analytical precision, standardized reference materials were systematically interspersed within every batch of 5–7 sample mounts. Each measurement cycle incorporated a 20 s background signal acquisition (gas blank), followed by 50 s of sample ablation, and concluded with a 20 s washout period to minimize cross-contamination. Raw data were reduced using ICPMS DataCal 10.7 software, applying background subtraction, and drift correction.
3.2.2. Chemical Composition
The Li
2O content in the samples from the Jinyinshan deposit is 0.265 wt%, with major chemical constituents including SiO
2 (66.39 wt%), Al
2O
3 (16.19 wt%), and Fe
2O
3 (7.06 wt%). Concentrations of rare and dispersed metals such as REE, Ga, Nb, Ta, and Sb are relatively low. Detailed ore composition data are provided in
Table 1.
3.2.3. Mineral Composition
Integrated analysis using AMICS and SEM-EDS reveals that quartz is the dominant mineral in the samples (55.07%), followed by clay minerals including illite (K
<1(Al,R
2+)
2[(Si,Al)Si
3O
10](OH)
2·nH
2O, 13.55%), cookeite (LiAl
4(Si
3Al)O
10(OH)
8, 7.25%), and rectorite ((Na,Ca)Al
4(Si,Al)
8O
20(OH)
4·2H
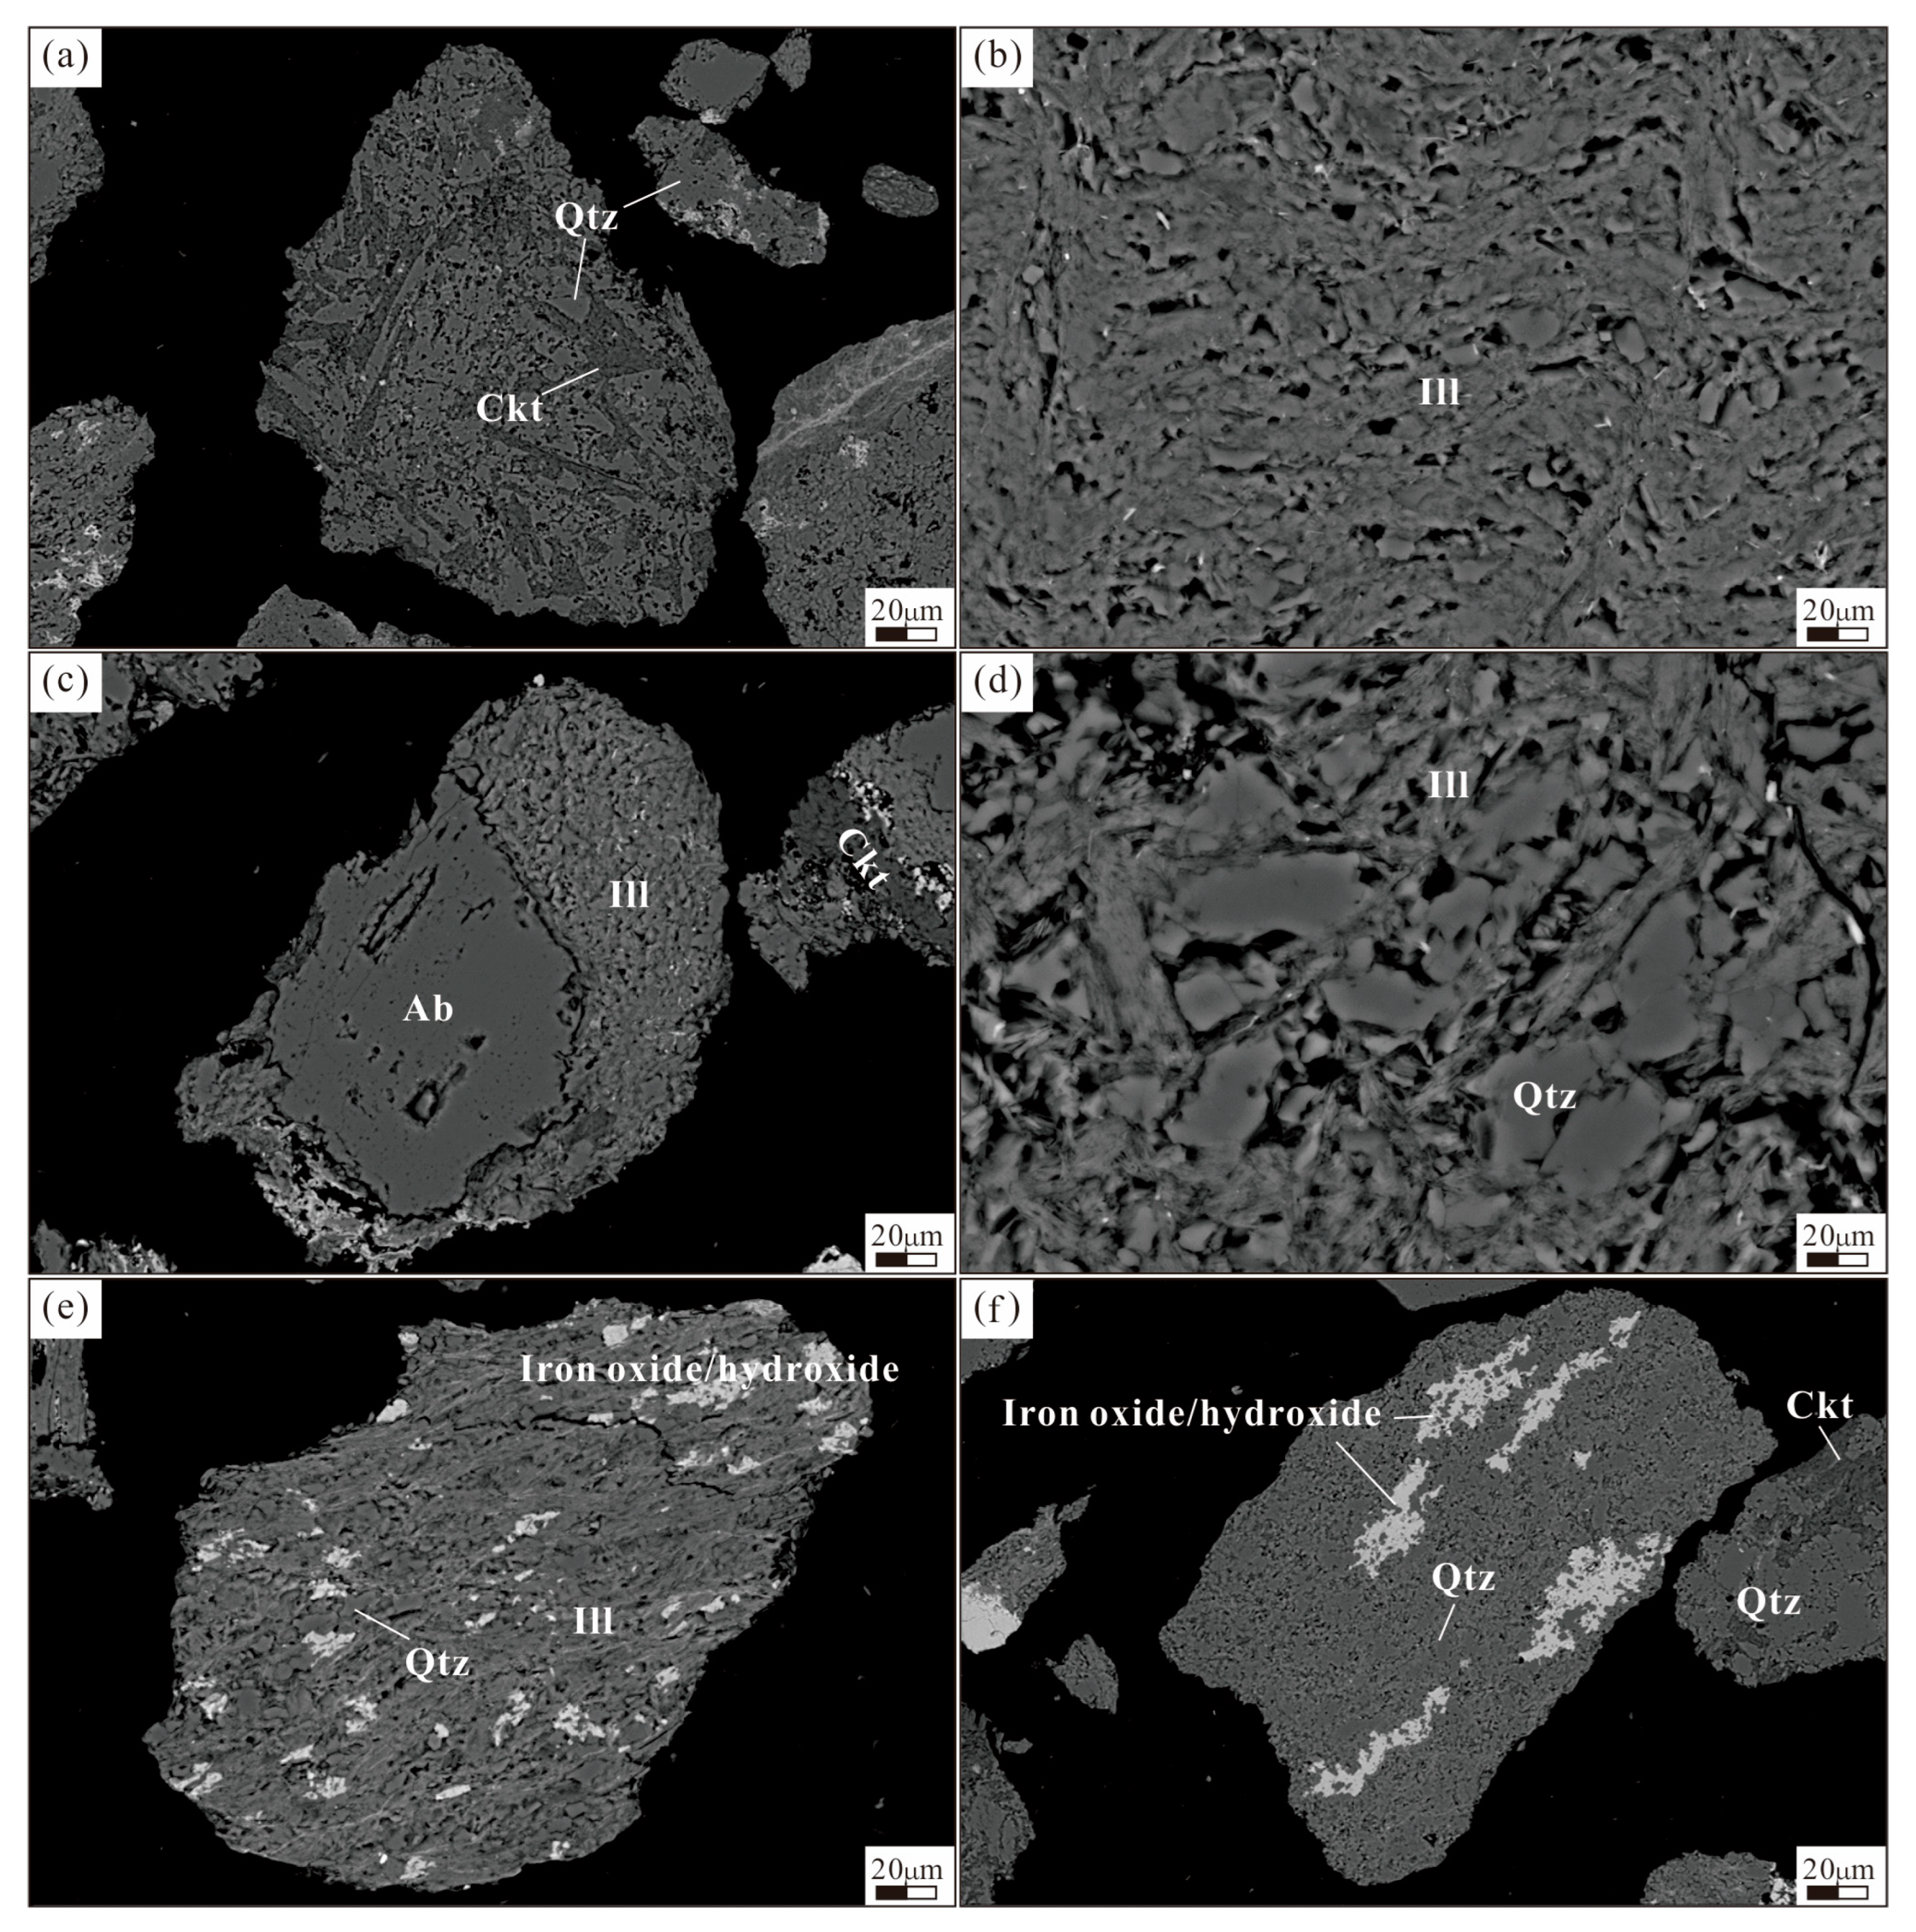
2O, 4.86%). The dominant metallic minerals are iron oxides/hydroxides (3.20%, commonly referred to as “limonite” in field descriptions;
Figure 2e,f). Accessory minerals are diverse and include florencite, apatite, anatase, and zircon. Detailed mineralogical composition is provided in
Appendix A.
3.2.4. Li Occurrence State
The test samples were primarily composed of quartz and clay minerals (cookeite, illite, rectorite), with no traditional Li-bearing minerals such as spodumene observed (
Figure 2). Given that SEM-EDS cannot provide quantitative Li characterization, this study employed EPMA and LA-ICP-MS for in situ microanalysis of major clay minerals (detailed data provided in
Appendix B). Integrated with chemical phase analysis, this approach comprehensively determined Li occurrence states and distribution patterns.
Cookeite exhibits significant Li enrichment (11,308–16,048 ppm), with an average content of 14,079.5 ppm. The structure of chlorite-group minerals is composed of alternating stacking of talc layers (T-O-T) and brucite layers (octahedral sheet, O). This brucite layer is an octahedral sheet sandwiched between the T-O-T layers. Its crystal chemical structure indicates that Li
+ mainly replaces the cations (e.g., Al
3+) in the interlayer octahedron sheet with its structural characteristics [
31].
Illite shows lower Li concentrations (555–685 ppm), averaging 607 ppm. Structural charge imbalance requires interlayer cations (Li
+, K
+, Na
+) to compensate for positive charge deficits from Al
3+ replacing Si
4+ in tetrahedral sites (Li
+ + Al
3+ → Si
4+) [
32]. Simultaneously, Mg
2+ substitution for Al
3+ in octahedral sites generates localized negative charges, compensated by interlayer Li
+ through inner-/outer-sphere complexation (Li
+ + Mg
2+ → Al
3+) [
33,
34,
35]. Therefore, Li
+ mainly exists in the interlayer space as interlayer cations in illite. However, illite’s limited interlayer space restricts its capacity to accommodate H
2O and cations, resulting in constrained Li uptake [
36].
Rectorite also demonstrates high Li content (864–1969 ppm, average 1322.2 ppm) with substantial variation. As a regular interlayer mineral (mica layer/smectite layer), Li
+ in rectorite primarily resides in the interlayer space of the mica layer (analogous to illite), and partially occupies exchangeable cation sites within the smectite layer [
37,
38]. Crucially, rectorite’s expandible interlayer domains enable extensive adsorption of cations (e.g., Li
+, K
+), thus conferring substantially higher Li enrichment capacity than illite.
The content of each mineral was provided by AMICS analysis (
Appendix A), which was used to calculate the occurrence ratio of Li in the main mineral phases. The following formula was applied: Total metallic Li content per mineral = mineral content × average Li concentration (
Table 2). Li was predominantly hosted in cookeite (82.55% of total Li), followed by illite (6.65%) and rectorite (5.20%). Collectively, these clay minerals accounted for 94.40% of Li, confirming cookeite as the dominant Li host in the deposit.
3.2.5. Minerals Particle Size Characteristics
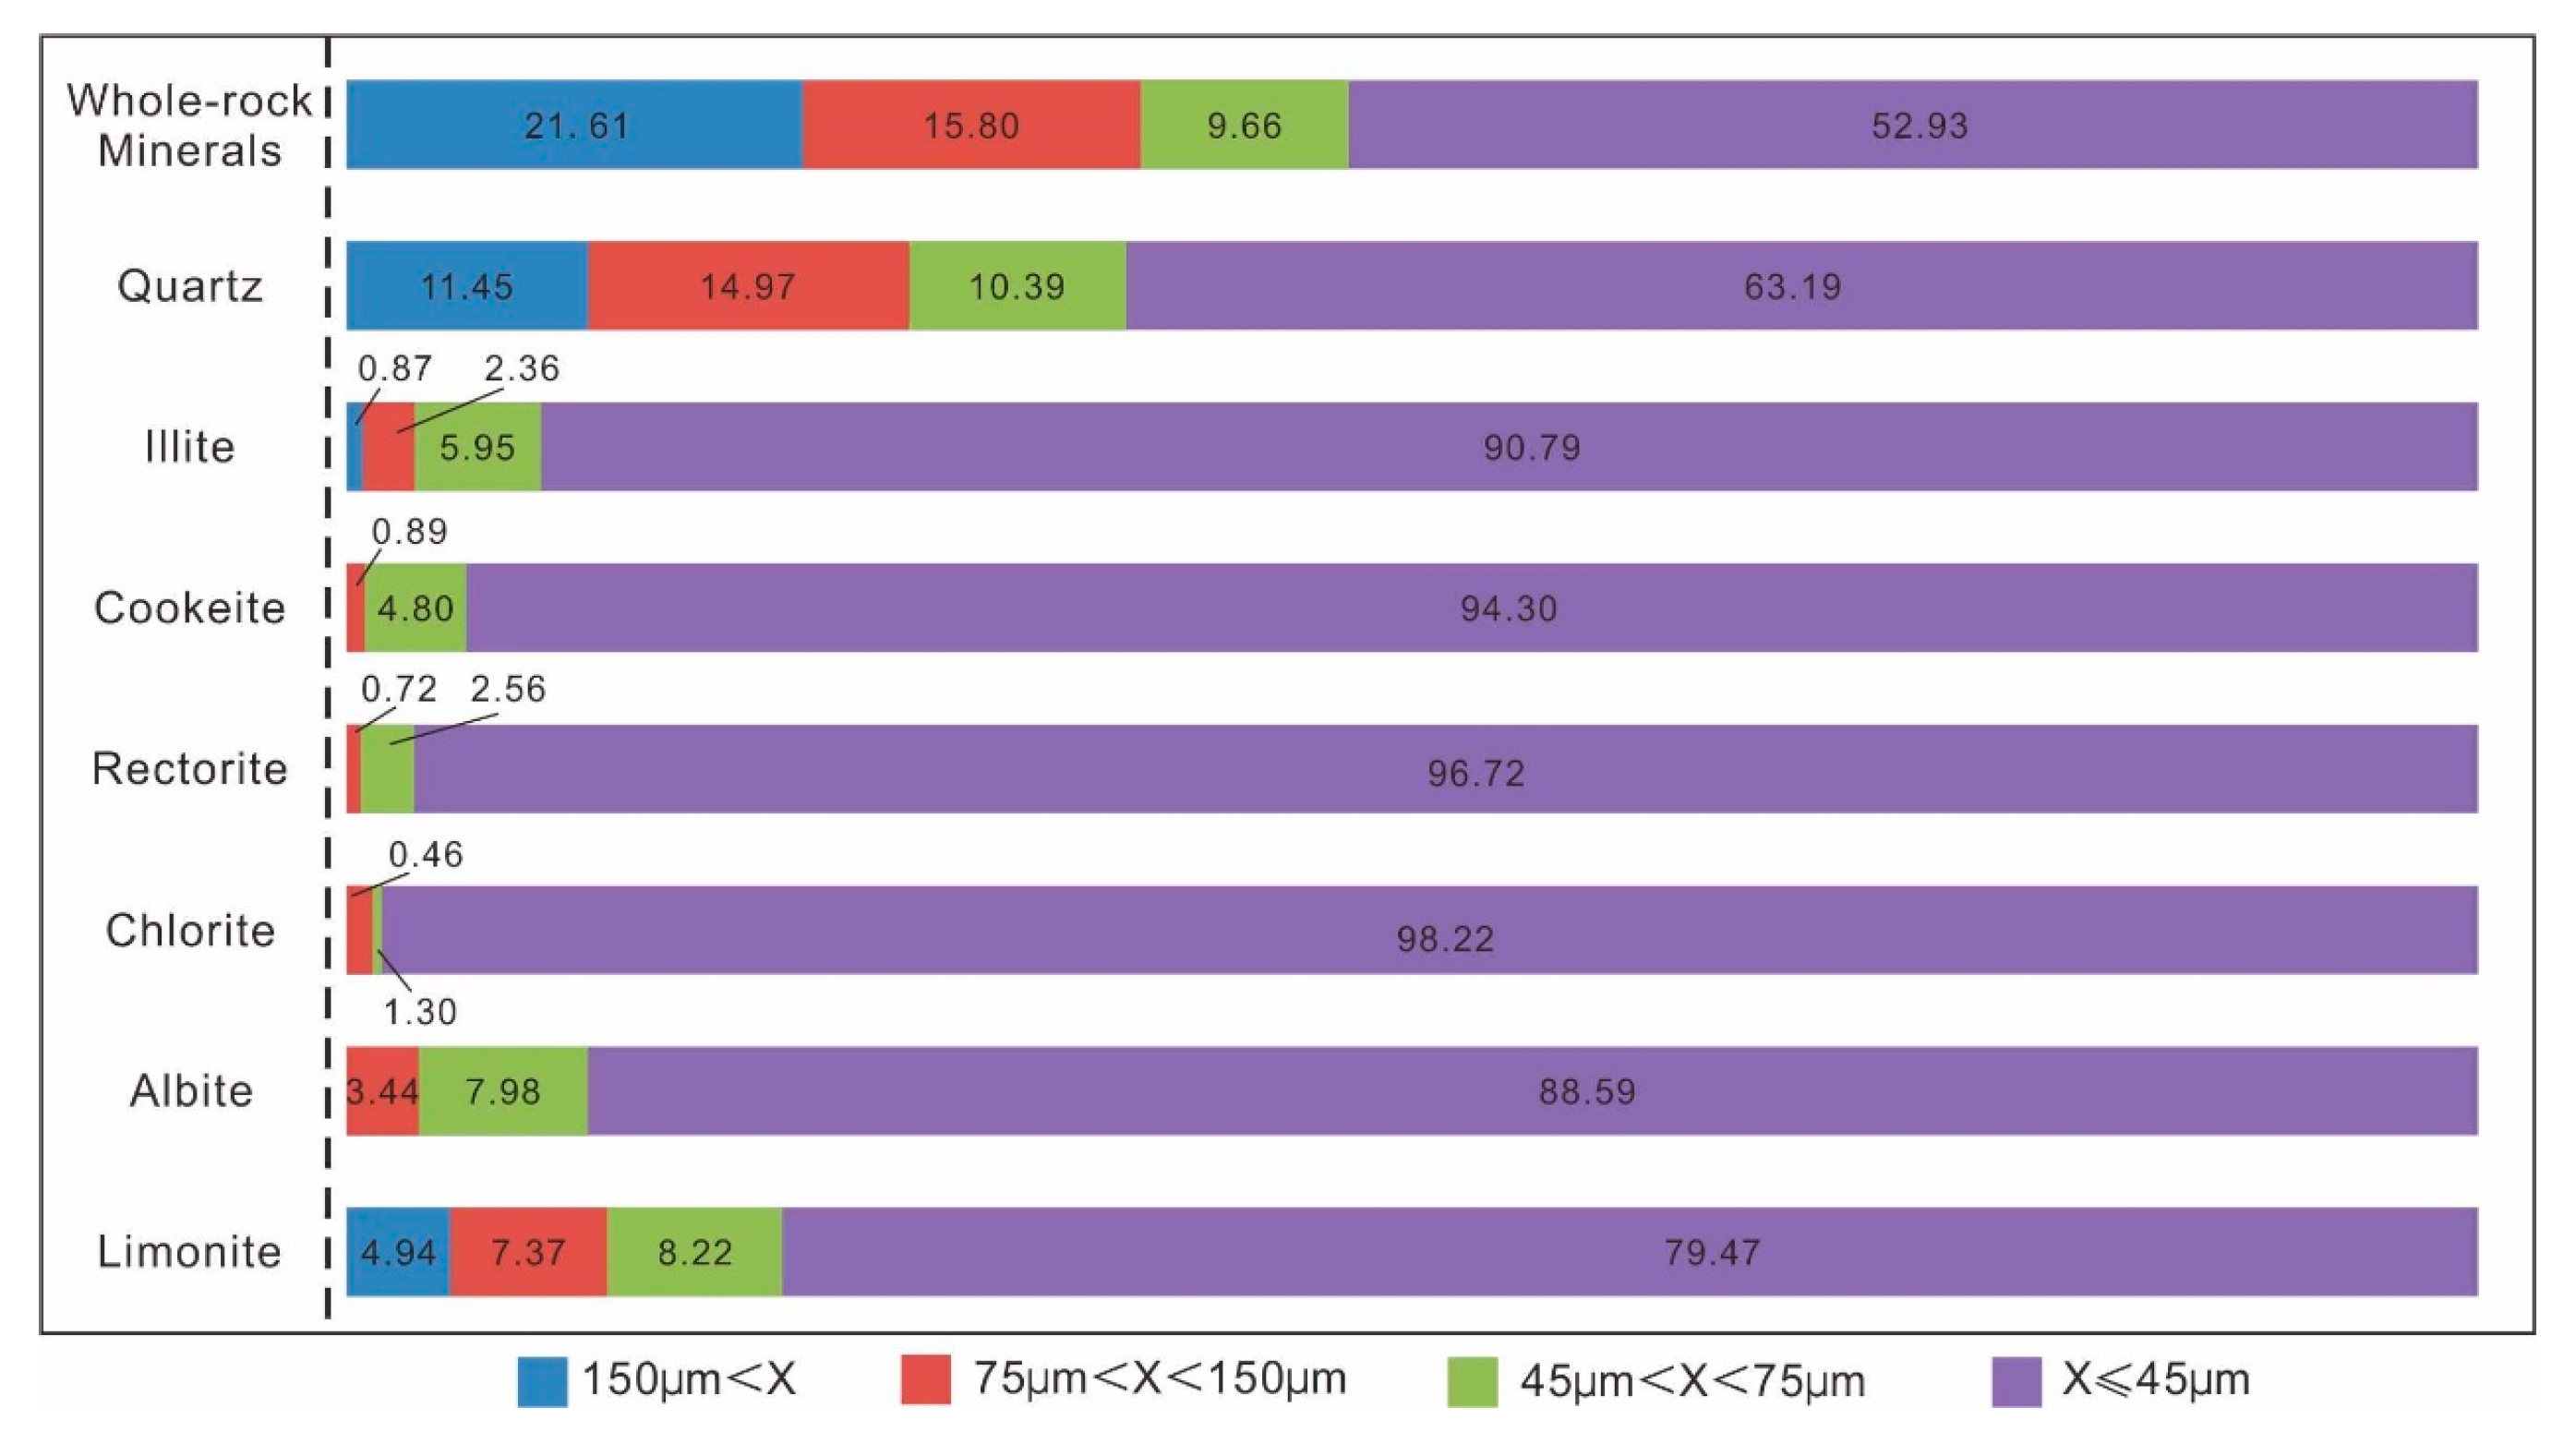
Particle size distributions were quantified using the Equivalent Circular Diameter method based on SEM-BSE images. Mineral projections were analyzed in ImageJ (v1.53) with
n ≥ 300 particles per sample to ensure statistical significance. Whole-rock mineral and individual phase size distributions (
Figure 3) reveal that Li-bearing minerals (illite, cookeite, and rectorite) display submicroscopic flaky morphology with predominantly fine-grained sizes (over 90% of particles < 45 μm). These minerals commonly intergrow with quartz and primarily occur as aggregates (
Figure 2). Quartz contains a significant coarse-grained fraction (11.45% > 150 μm). As the predominant metallic mineral, limonite shows a similar size distribution to Li-bearing clay minerals, with most particles (<45 μm) in the fine fraction.
4. Experimental Methods and Results
Current mainstream Li extraction processes for traditional Li ores such as lepidolite (KLi
2Al(Si
4O
10)(F,OH)
2) and spodumene (LiAlSi
2O
6) in the industrial sector primarily employ the sulfuric acid method, sulfate method, and limestone roasting method [
14,
20,
21,
22,
23,
39,
40]. Conversely, clay-type Li deposits present greater extraction challenges due to their complex mineral compositions and diverse Li occurrence states. Existing extraction technologies mainly include direct leaching, roasting–leaching, and additive-assisted roasting–leaching methods [
12,
13,
14,
15,
16].
Based on systematic process mineralogy and exploratory test characterization, this study confirms that Li is predominantly hosted in clay minerals including cookeite and rectorite. Upon roasting, these minerals undergo significant phase transformations where Al-Si bonds in silicates are activated, thereby enhancing the leaching rate for Li and other metallic elements [
41,
42,
43]. Through iterative experimentation, two clean extraction processes—blank roasting–hydrochloric acid leaching and blank roasting–sulfuric acid leaching—were ultimately identified, both offering high Li leaching efficiencies with notable economic and environmental benefits.
4.1. Process Flow I: Blank Roasting–Hydrochloric Acid Leaching Method
4.1.1. Optimization of Li Leaching Conditions
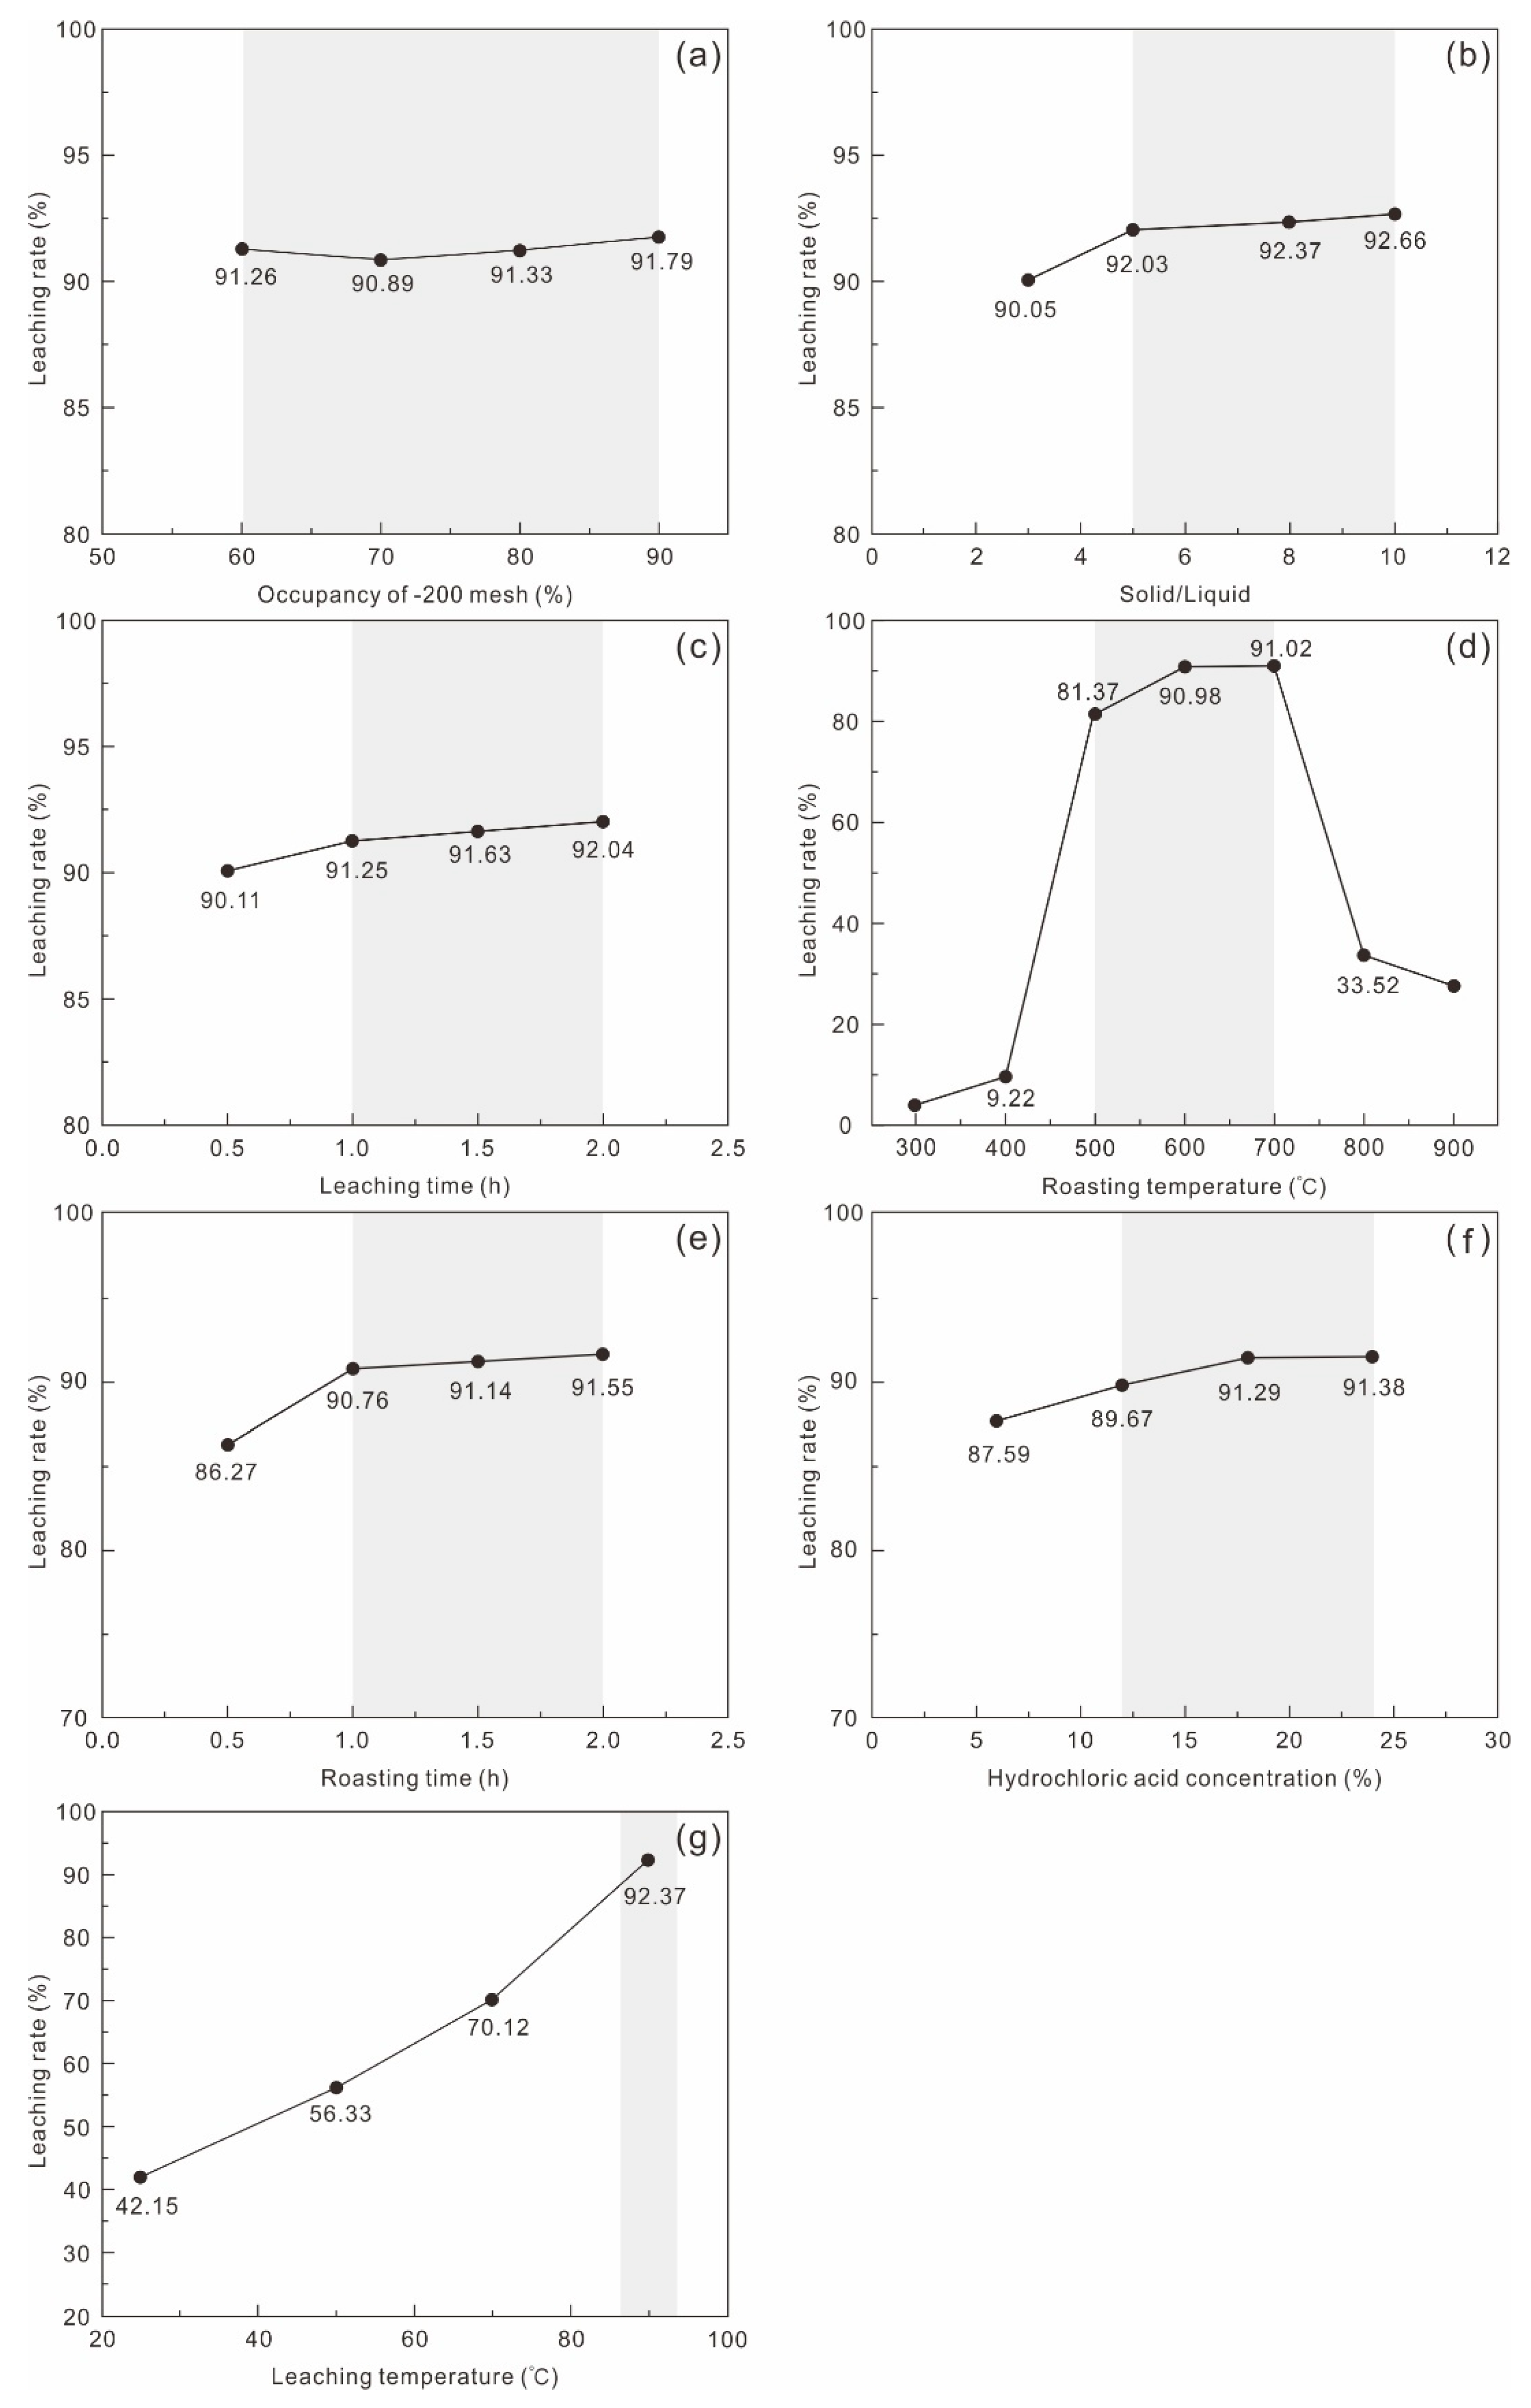
Condition optimization tests investigated grinding fineness, roasting temperature, roasting time, hydrochloric acid concentration, L/S ratio, leaching temperature, and leaching time. Results indicate that grinding fineness, L/S ratio, and leaching time exerted negligible effects on Li leaching rate (
Figure 4a–c). In contrast, roasting temperature, roasting time, hydrochloric acid concentration, and leaching temperature exerted substantial regulatory effects (
Figure 4d–g).
Roasting Temperature
As the roasting temperature increased from 300 °C to 900 °C, the Li leaching rate exhibited a unimodal trend (
Figure 4d). At 500 °C, the leaching rate abruptly increased to 81.37%. Further increases to 600 °C and 700 °C yielded rates of 90.98% and 91.02%, respectively. At 800 °C, however, these sharply decreased to 33.52%.
Roasting Time
The Li leaching rate generally increased with prolonged roasting time (
Figure 4e). At 0.5 h, the rate reached 86.27%, rising to 90.76% at 1 h. Extending time beyond 1.5 h stabilized above 91%, confirming sufficient thermal activation as a prerequisite for liberating structural Li.
Hydrochloric Acid Concentration
Increasing hydrochloric acid concentrations progressively enhanced the leaching rate (
Figure 4f). At 6 wt% hydrochloric acid, the rate was 87.59%, approaching 90% at 12 wt%. Continued concentration increases pushed the rate above 91%. Balancing cost and efficacy, 18 wt% hydrochloric acid was laboratory-optimized, though industrial implementation may adopt a gradient range of 12–18 wt%.
Leaching Temperature
Increasing leaching temperature from 25 °C to 90 °C enhanced the Li recovery rate from 42.15% to 92.37%, demonstrating a gradual upward trend (
Figure 4g). Thus, 90 °C is optimal.
Tests on grinding fineness, L/S ratio, and leaching time confirmed their negligible influence (
Figure 4a–c). Consequently, the optimized parameters were: grinding fineness of 200 mesh accounts for 60%, roasting temperature of 600 °C, roasting duration of 1.5 h, hydrochloric acid concentration of 18 wt%, an L/S ratio of 5, leaching temperature of 90 °C, and leaching time of 1 h.
4.1.2. Leachate Purification and Li Precipitation Test
Compared to spodumene and lepidolite concentrates, clay-type Li ore features complex composition and polymetallic associations. After blank roasting–acid leaching, significant coexisting metal ions (Al
3+, Fe
3+, Ca
2+, Mg
2+) dissolve alongside target Li, substantially complicating Li separation and purification. Initial leaching results indicated Al and Fe concentrations exceeding 7.5 g/L in both hydrogen chloride and hydrogen sulfate systems, followed by Ca and Mg. Addressing the characteristic low-Li and high-Al leachate, this study innovatively implements a process flow of leachate roasting–water leaching for Li-Al separation–alkali precipitation for Ca and Mg removal–concentration for Li precipitation (
Figure 5). This approach utilizes the hydrolysis properties of AlCl
3 in the leachate to convert Al to amorphous alumina, achieving Li-Al separation via water leaching (roasting temperature 600 °C, roasting time 2 h, liquid–liquid ratio of 3, leaching temperature of 90 °C, and leaching time of 1 h.). Concurrently, volatilized HCl from calcination is captured via closed-loop absorption, significantly reducing acid consumption in the leaching circuit.
The secondary leachate primarily contains Ca
2+ and Mg
2+ impurities. Although mature separation techniques exist for Li-Ca-Mg systems, conventional pH adjustment with lime introduces new Ca
2+ contamination, while NaOH—despite higher alkalinity and lower dosage—may cause Li adsorption losses [
44,
45]. Therefore, this study employed widely used Na
2CO
3 as a precipitant. At 1.5 times the stoichiometric ratio, Li loss was limited to 0.13%, demonstrating both high efficiency and cost-effectiveness.
4.1.3. Purified Solution Concentration and Li Precipitation
The optimal Li
+ concentration for carbonate precipitation is 20–25 g/L [
46]. The Ca/Mg-removed solution was further concentrated to crystallize crude sodium chloride, adjusting the final purified solution to 20–25 g/L Li
+.
The concentrated solution was heated to 90 °C, and 400 g/L Na2CO3 solution was added dropwise at a constant rate of 10 mL/min (1.1 times stoichiometric requirement) under agitation. After 30 min of precipitation, immediate filtration yielded crude lithium carbonate. X-ray diffraction (XRD) analytical results showed 85.73% Li2CO3 content, with Na2CO3 and K2CO3 as primary impurities, achieving 90.05% Li precipitation rate. In practical production, Li-rich filtrate can be recycled to subsequent cycles, increasing the overall rate beyond 98% at equilibrium.
4.1.4. Crude Lithium Carbonate Washing and Purification
Preliminary purification of crude lithium carbonate involved three-stage cross-flow washing and three-stage counter-current washing (L/S ratio: 2; temperature: 90 °C; time: 15 min; results in
Table 3).
Counter-current washing demonstrated superior performance. Leveraging Li2CO3 solubility characteristics, this method minimized Li losses. By the third stage, Na+ and K+ concentrations in wash liquor fell below 0.2 g/L, confirming an approximately 99% washing rate. Purified concentrate analysis indicated 99.03% Li2CO3 content, with impurities of 0.14% Na, 0.005% K, and 0.07% Ca; Fe and Mg below detection limits.
4.1.5. Full Flow Process I
Following detailed experimental investigations, Process I established a comprehensive Li extraction procedure comprising blank roasting–hydrochloric acid leaching–Li-Al separation from leachate–Ca/Mg removal–concentration for Li precipitation–three-stage counter-current washing (
Figure 5). Full-process test parameters indicate that under conditions of 600 °C roasting temperature, a 1.5 h roasting time, 18 wt% hydrochloric acid concentration, 90 °C leaching temperature, 1 h leaching time, and L/S ratio of 5, a Li leaching rate of 92.37% and an Al leaching rate of 47.62% were achieved.
Roasting of the leachate followed by water leaching achieved Li-Al separation with a 93.91% Li leaching rate, while Al and Fe were completely converted into Al-rich residue. The concentrated leachate was treated with NaOH and Na2CO3 to remove Mg and Ca, yielding a purified solution with Li loss rates of 2.59% and 0.13%, respectively. Subsequent evaporation and concentration crystallized crude sodium chloride salt. Filtration produced a Li-rich purified solution, from which sodium carbonate precipitation generated a crude lithium carbonate product containing 85.73% Li2CO3, with a Li precipitation rate of 90.05% (in actual production, filtrate recycling could further enhance precipitation rate). Three-stage counter-current washing of the crude lithium carbonate yielded a final product with 99.03% Li2CO3 content (increased washing cycles may further improve purity).
Final outputs of Process I include: lithium carbonate product (0.48% yield, 99.03% Li2CO3, 73.89% Li total recovery), alumina-rich residue (34% yield, 46.88% Al2O3, 47.62% Al recovery), and crude sodium chloride product (1% yield, 99.13% NaCl).
4.2. Process Flow II: Blank Roasting–Sulfuric Acid Leaching Test
4.2.1. Optimization of Li Leaching Conditions
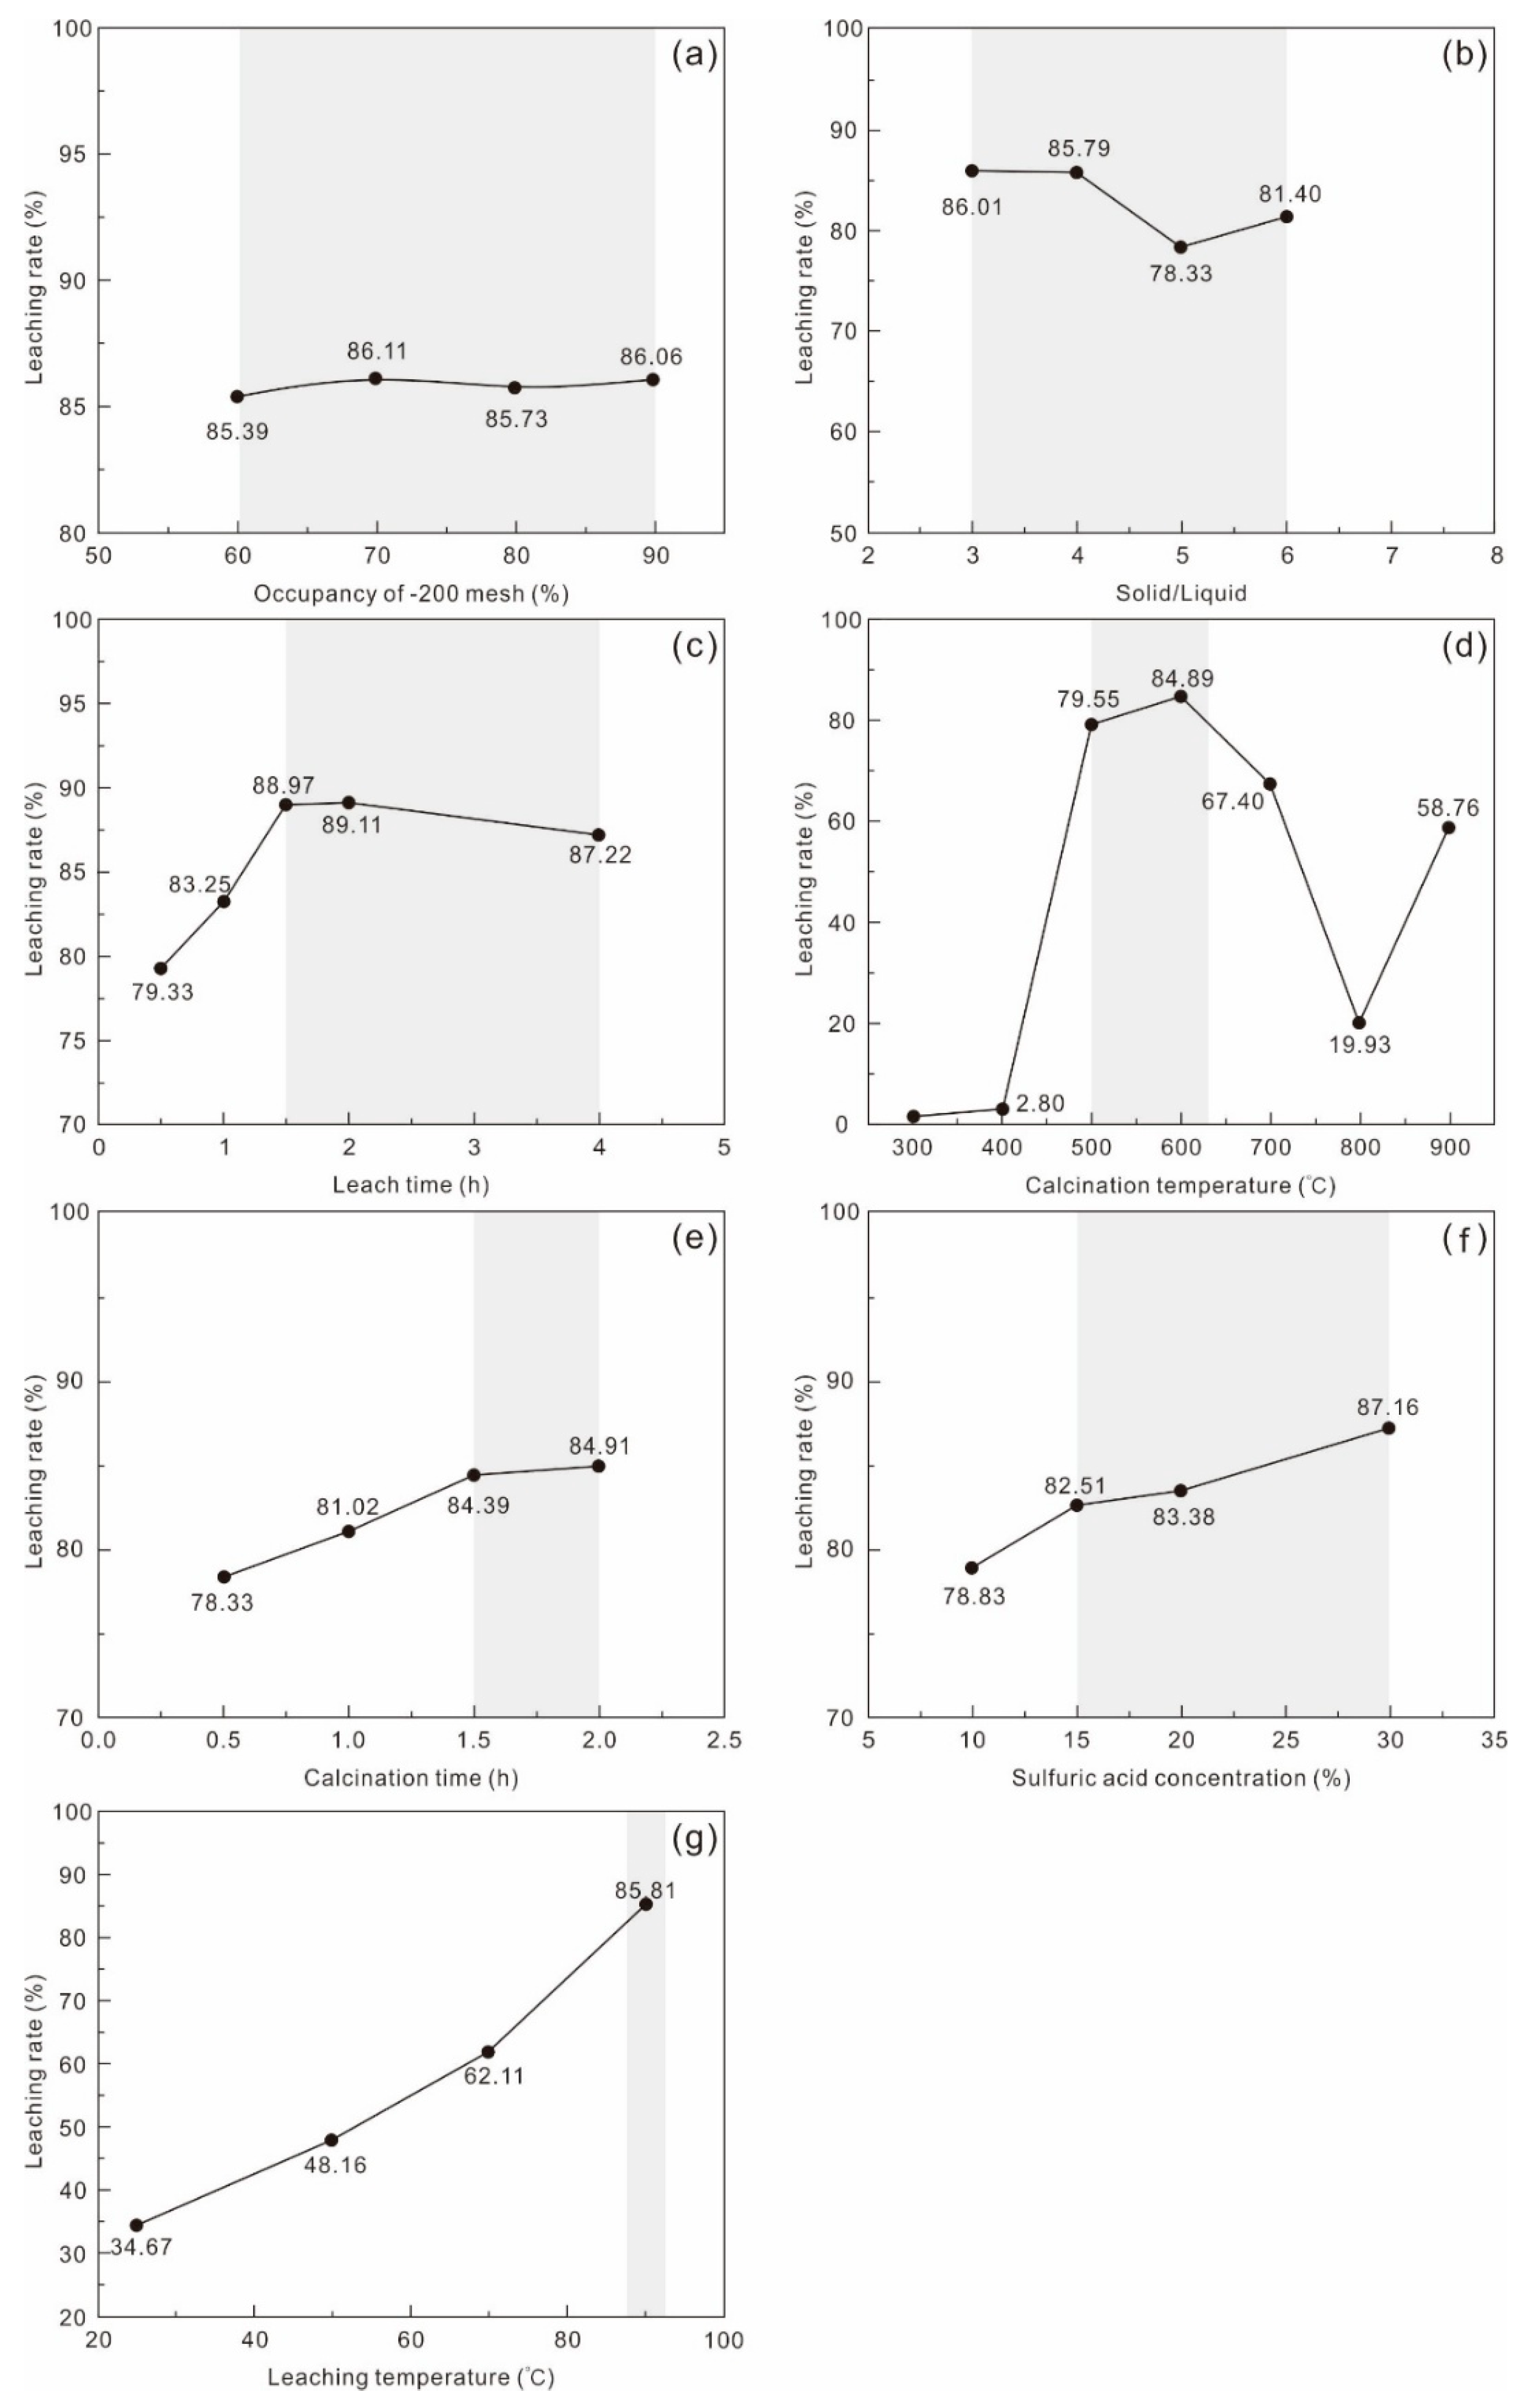
Process II similarly conducted condition optimization tests for grinding fineness, roasting temperature, roasting time, sulfuric acid concentration, L/S ratio, leaching temperature, and leaching time. Results indicate that grinding fineness and L/S ratio exerted limited influence on the Li leaching rate (
Figure 6a,b), while roasting temperature, roasting time, sulfuric acid concentration, leaching temperature, and leaching time significantly affected outcomes (
Figure 6c–g). Specifically, the Li leaching rate initially rose and then declined with prolonged leaching time, peaking at 89.11% at 2 h before decreasing to 83.79% at 4 h (
Figure 6c). At a 400 °C roasting temperature, the leaching rate was only 2.80%, rapidly increasing to 79.55% at 500 °C and peaking at 84.89% at 600 °C, above which it rapidly increased (
Figure 6d). Both prolonged roasting time and increased sulfuric acid concentration showed positive correlations, achieving an 84.91% rate at 2 h roasting and 87.16% at 30% sulfuric acid concentration (
Figure 6e,f). Leaching temperature demonstrated the most pronounced effect, with the rate increasing by 147.5% when raised from 25 °C to 90 °C (
Figure 6g).
4.2.2. Leachate Purification and Li Precipitation Test
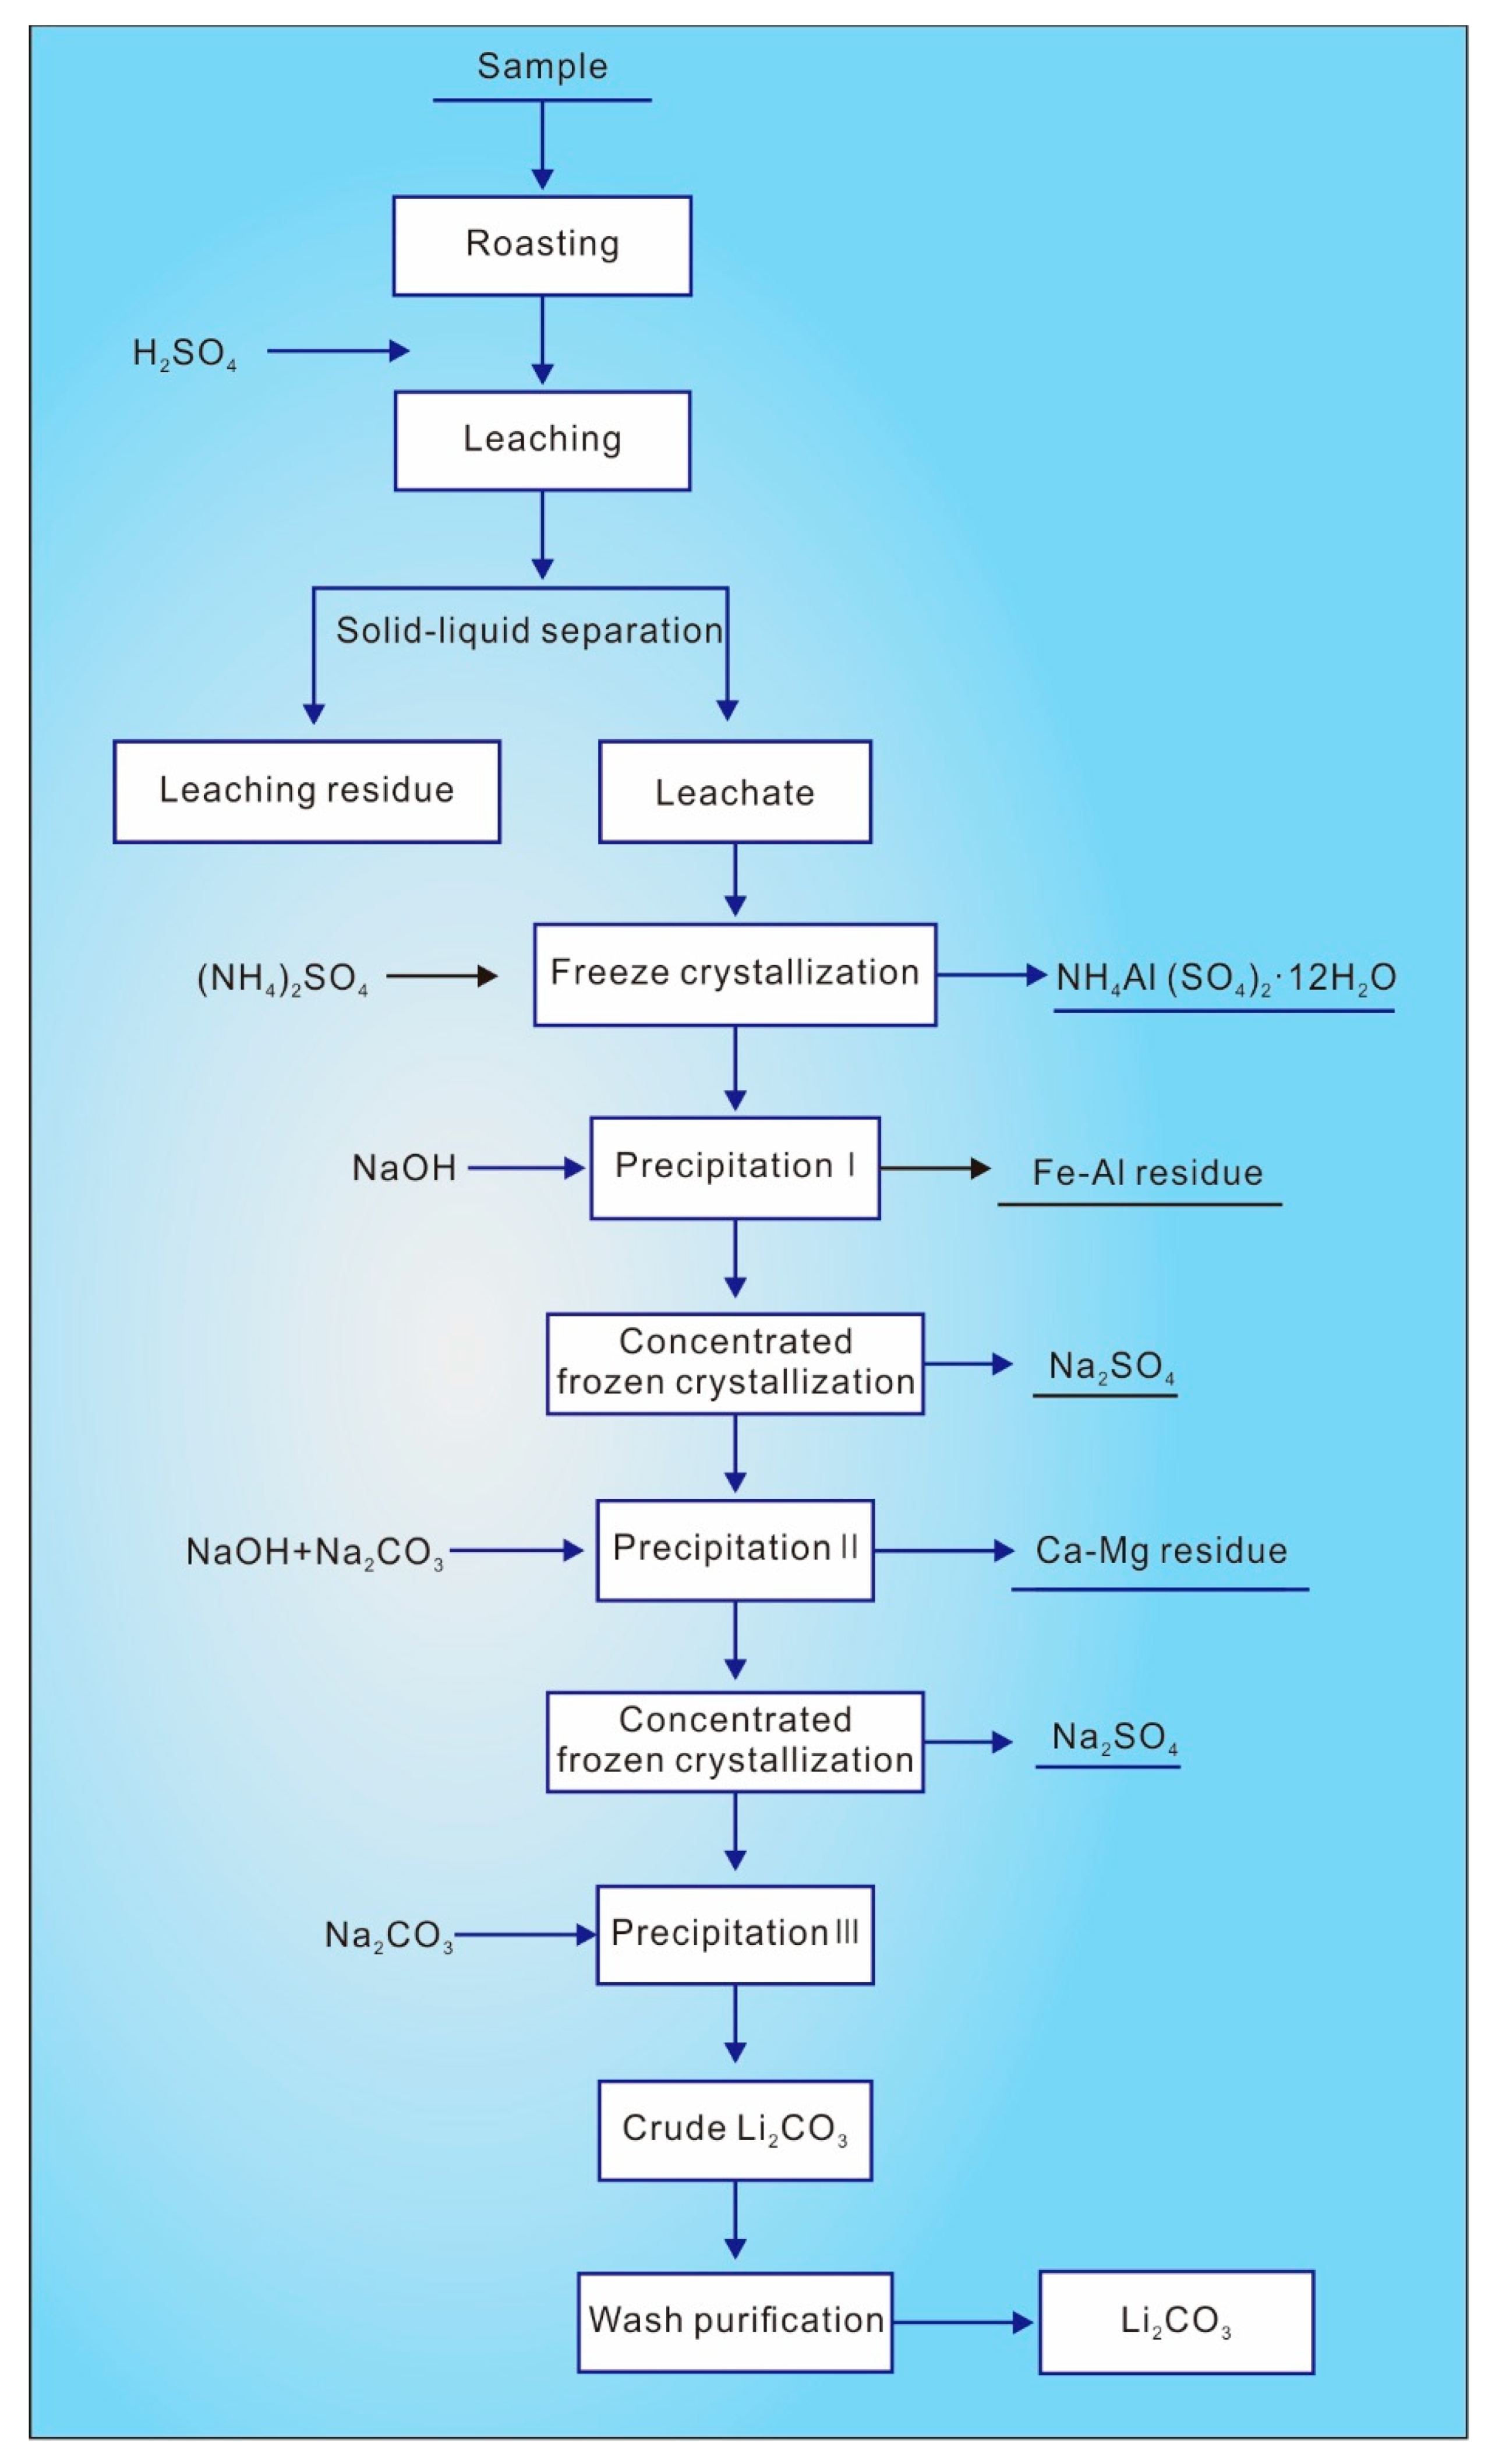
From a technical perspective, the key challenge in processing sulfuric acid leachate remains Li-Al separation, with alum precipitation being the mainstream method. This involves adding appropriate amounts of (NH4)2SO4 or K2SO4 to form alum salts with Al2(SO4)3 in the leachate for Al removal. Based on the characteristics of blank roasting–sulfuric acid leachate, this study adopted a process flow of Al removal via alum precipitation–alkali precipitation for Fe/Al removal–alkali precipitation for Ca/Mg removal–freezing crystallization for sodium sulfate removal–concentration for Li precipitation.
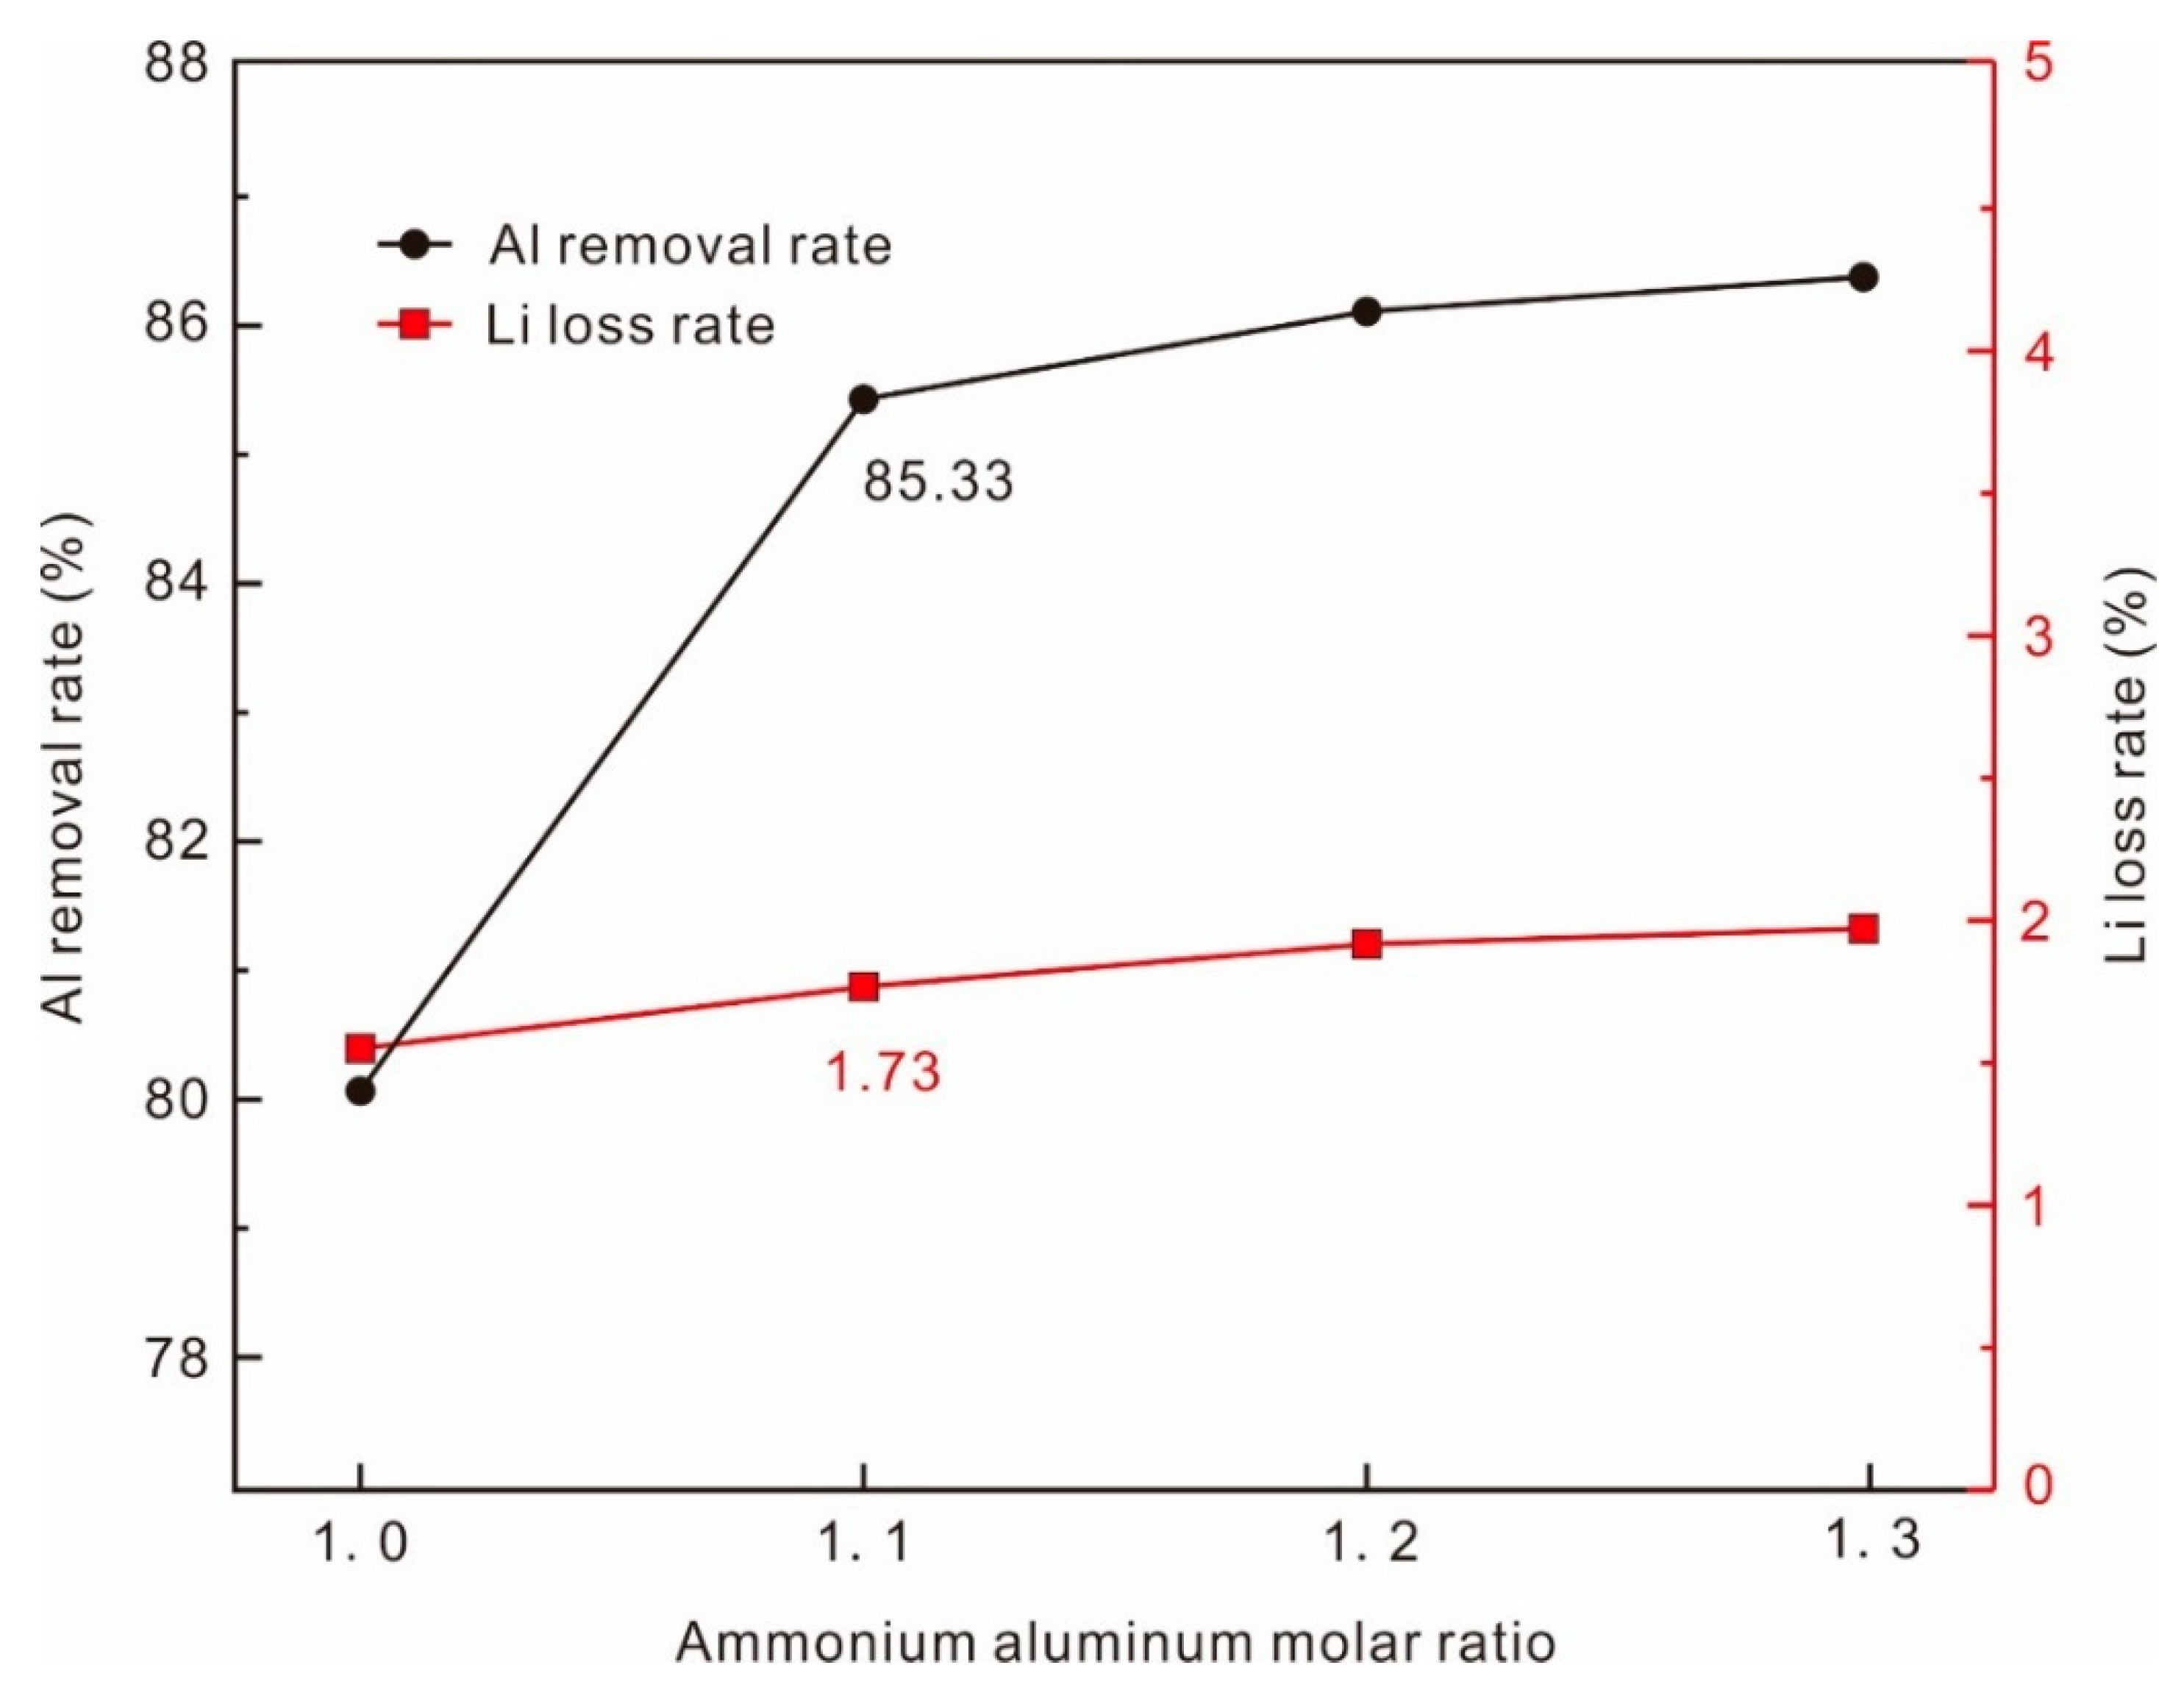
Since cyclic leaching tests were not conducted, the leachate was evaporated to double concentration prior to alum precipitation to ensure the Al crystallization rate. Ammonium alum crystallization, a well-established Al removal method, is affected by metal ions like Fe in the leachate, which consume ammonium sulfate. Consequently, ammonium sulfate dosage was optimized. Results (
Figure 7) demonstrate that increasing the ammonium aluminum molar ratio positively enhances Al removal. Li loss during alum crystallization primarily stems from crystal entrapment and is of negligible correlation with ammonium sulfate dosage, maintaining low loss rates. Optimal conditions (1.1 × stoichiometric (NH
4)
2SO
4, 150 rpm agitation, 4 °C crystallization temperature, 60 min crystallization time) achieved 85.33% Al removal (residual Al 3.89 g/L) with 1.73% Li loss.
4.2.3. Alkali Precipitation for Fe/Al and Ca/Ma Removal
The single-pass Al removal efficiency is inherently limited by ammonium alum solubility, necessitating deep removal of residual Al/Fe. Alkali precipitation to form Al(OH)
3 and Fe(OH)
3 is the most common method, but Al(OH)
3 exhibits strong Li
+ adsorption [
47]. Precise alkali addition is critical to prevent the formation of highly adsorbent colloids. Furthermore, as Al is amphoteric, pH must be strictly controlled near 7 to avoid aluminate formation at elevated pH, which complicates complete Al removal. Building on the previous step, the solution was first concentrated to a Li
+ concentration of approximately 5 g/L. At this stage, the concentrations of Ca
2+ and Mg
2+ were approximately 557 mg/L and 3.41 g/L, respectively. Subsequently, 300 g/L simultaneous NaOH and Na
2CO
3 addition was used for Ca/Mg removal, outperforming stepwise addition (
Table 4).
4.2.4. Purified Solution Concentration and Li Precipitation
The purified solution was concentrated to 20% of its original volume to obtain an Li-rich solution. Based on prior tests, the solution was heated to 90 °C, and 400 g/L Na2CO3 solution (1.1 × stoichiometric) was added dropwise at 10 mL/min under agitation for 30 min. Immediate filtration produced crude lithium carbonate assayed at 89.52% Li2CO3 with 87.35% Li precipitation efficiency.
4.2.5. Crude Lithium Carbonate Washing and Purification
For preliminary purification, three-stage counter-current washing (L/S ratio 2; 90 °C; 15 min) was conducted. By Stage 3, Na
+ and K
+ concentrations in wash liquor decreased to 0.1 g/L, with 2.71% Li loss, indicating effective purification. Washed product analysis showed 98.85% Li
2CO
3 content, with impurities at 0.11% Na, 0.005% K, and 0.07% Ca; Fe and Mg were below detection limits (
Table 5). Product quality could be further enhanced with additional washing cycles.
4.2.6. Full Process Flow II
Following detailed experimental investigations, Process II was established: blank roasting–sulfuric acid leaching–Al removal via alum precipitation–Fe/Al removal–freezing crystallization for sodium sulfate removal–Ca/Mg removal–concentration for Li precipitation–three-stage counter-current washing (
Figure 8). Key performance metrics under optimized conditions (roasting: 600 °C, 2 h; leaching: 15 wt% sulfuric acid, 90 °C, 2 h, L/S ratio 3) include a Li leaching rate of 89.11% and an Al leaching rate of 44.33%. Al removal via ammonium sulfate freeze crystallization achieved an 85.33% rate (crystallization rate: 85.33%) with 1.73% Li loss. Subsequent Fe/Al removal via pH adjustment (NaOH) incurred 1.91% Li loss. After concentration and freezing to remove sodium sulfate, NaOH and Na
2CO
3 were added to eliminate Ca/Mg (3.85% Li loss). The purified solution underwent further concentration/freezing for sodium sulfate removal, yielding a Li-rich solution. Sodium carbonate precipitation produced crude lithium carbonate (89.52% Li
2CO
3), which was upgraded to 98.85% Li
2CO
3 purity via three-stage counter-current washing.
Final outputs of Process II include, lithium carbonate product (0.46% yield, 98.85% Li2CO3, 69.89% Li total recovery), crude ammonium alum (29.48% yield, 37.83% Al recovery), and crude sodium sulfate (43% yield).
