1. Introduction
Rail transport remains a pivotal component in contemporary passenger and freight transportation systems. However, residual stresses induced during rail manufacturing and service generate localized stress concentrations [
1]. Under superimposed cyclic rolling contact stresses, micro-defects initiate at/near the rail surface and progressively develop into rolling contact fatigue (RCF) cracks. These cracks ultimately propagate, causing rail head spalling or fracture and potentially triggering severe derailment accidents. As a critical RCF manifestation, rail head cracks predominantly emerge in subsurface regions of the rail head [
2]. Investigations confirm that such fatigue cracks constitute a primary factor limiting rail service life [
3], underscoring the necessity of precise detection for accident prevention.
Nondestructive testing (NDT) identifies material flaws by monitoring anomalies in physical fields (thermal, electrical, magnetic, etc.) without causing damage [
4]. Conventional NDT techniques—including visual testing (VT), ultrasonic testing (UT), eddy current testing (ECT), radiographic testing (RT), and magnetic particle testing (MT)—can detect surface or internal defects [
5], yet they exhibit inherent limitations. Visual testing is widely used in nondestructive testing due to its high detection speed and accuracy [
6]. However, the blurring effect caused by the high-speed movement of the cameras requires higher resolution [
7], and it is also unable to obtain image data of buried defects [
8]. Rizzo et al. [
9] developed a laser-guided wave system capable of detecting transverse rail head cracks ≥ 1 mm deep, but it requires couplers and suffers from low efficiency; eddy current testing is typically used for the detection of surface and subsurface defects in conductive materials. In the presence of defects, the eddy currents induced by AC coil excitation are disturbed, resulting in fluctuations in the secondary magnetic field. These magnetic field fluctuations are detected by the detection coil in the form of induced voltage [
10]. Zen-Zinger et al. [
11] achieved single-layer subsurface defect detection via eddy current thermography, whereas actual RCF often propagates in a multidirectional manner with overlapping layers. Xie et al. [
12] proposed a convolutional neural networks (CNNs)-based surface defect recognition and classification method for detecting surface defects in sheet metal parts. However, X-ray equipment is expensive and involves radiation hazards, making it difficult to adapt to on-site railway detection.
Eddy-current-pulsed thermography (ECPT), an emerging NDT technique integrating eddy current excitation with infrared thermography, specializes in RCF defect detection for metal materials. Liu et al. [
13] achieved depth quantification of natural surface-breaking rail cracks using thermal image skewness features, with systematic comparisons of ECPT detection accuracy and robustness under static versus scanning modes. Zhu et al. [
14] evaluated eight spatiotemporal ECPT features on idealized and actual RCF cracks, demonstrating that area-based thermal signatures and kurtosis analysis provide optimal robustness for inclination characterization. Since 2009, its rich spatiotemporal transient information has attracted attention in defect classification and identification for aerospace, rail transit, and other fields.
Excitation parameters are one of the key factors determining the effectiveness of detection and identification. When a metal specimen is placed near the detection coil, the alternating current in the coil generates an alternating magnetic field, which induces eddy currents on both the surface and interior of the specimen. The current density inside the specimen decreases with depth, forming the skin effect. At high excitation frequencies, the eddy currents are concentrated near the surface and in shallow regions, making it more sensitive to surface and subsurface defects. In contrast, at low excitation frequencies, the eddy currents can penetrate deeper, enabling the detection of deeper defects. To achieve effective detection of multilayer rolling contact fatigue (RCF) cracks, Zhang et al. [
15] introduced multiple excitation frequency channels into the ECPTT system, extracting the thermal response characteristics of surface cracks at different layers and depths, thus enabling the identification and differentiation of multilayer RCF cracks.
Open defects directly affect the magnetic field and current distribution in the surface region, concentrating the heating effect around the defect. However, buried cracks cause only local changes in eddy current distribution, thereby affecting the surface thermal response. To address the aforementioned challenges in rail safety diagnostics: quantitative characterization of multilayer buried RCF cracks with complex spatial configurations. This paper proposes a detection method based on a swept-frequency ECPTT system to identify the layer count, angle, and depth of buried defects, while elaborating on the physical mechanisms of inductive eddy current heating and thermal diffusion in the ECPTT system. By processing infrared thermal sequence images through principal component analysis (PCA), core defect information is concentrated in the PC2 (for contour localization) and PC3 (for layer count discrimination) components, enabling sub-millimeter contour reconstruction (with an error of <0.5 mm) and counting of multilayer cracks. For artificially designed experimental samples, the study achieves the identification of defect inclination angles and depths through both thermal response curves and TSR values. In this research, PCA analysis facilitates the extraction of reliable features from complex thermal sequences, thereby enhancing the system’s noise resistance and feature–background separation capability. Additionally, the introduction of TSR linearizes nonlinear thermal decay, improving the contrast between defective and sound regions and providing support for the quantitative analysis of inclination angles and depths.
Section 2 provides a detailed explanation of the basic principles and methods of the ECPTT system.
Section 3 describes the experimental setup and the design of the specimen.
Section 4 analyzes the experimental results, and
Section 5 summarizes the main findings of this work and discusses potential future research directions.
2. Methodology
2.1. Introduction of ECPTT System
The swept-frequency ECPTT system controls magnetic penetration depth by modulating the excitation frequency, enabling targeted heating of defects at stratified depths for comprehensive RCF defect characterization via thermal sequence analysis.
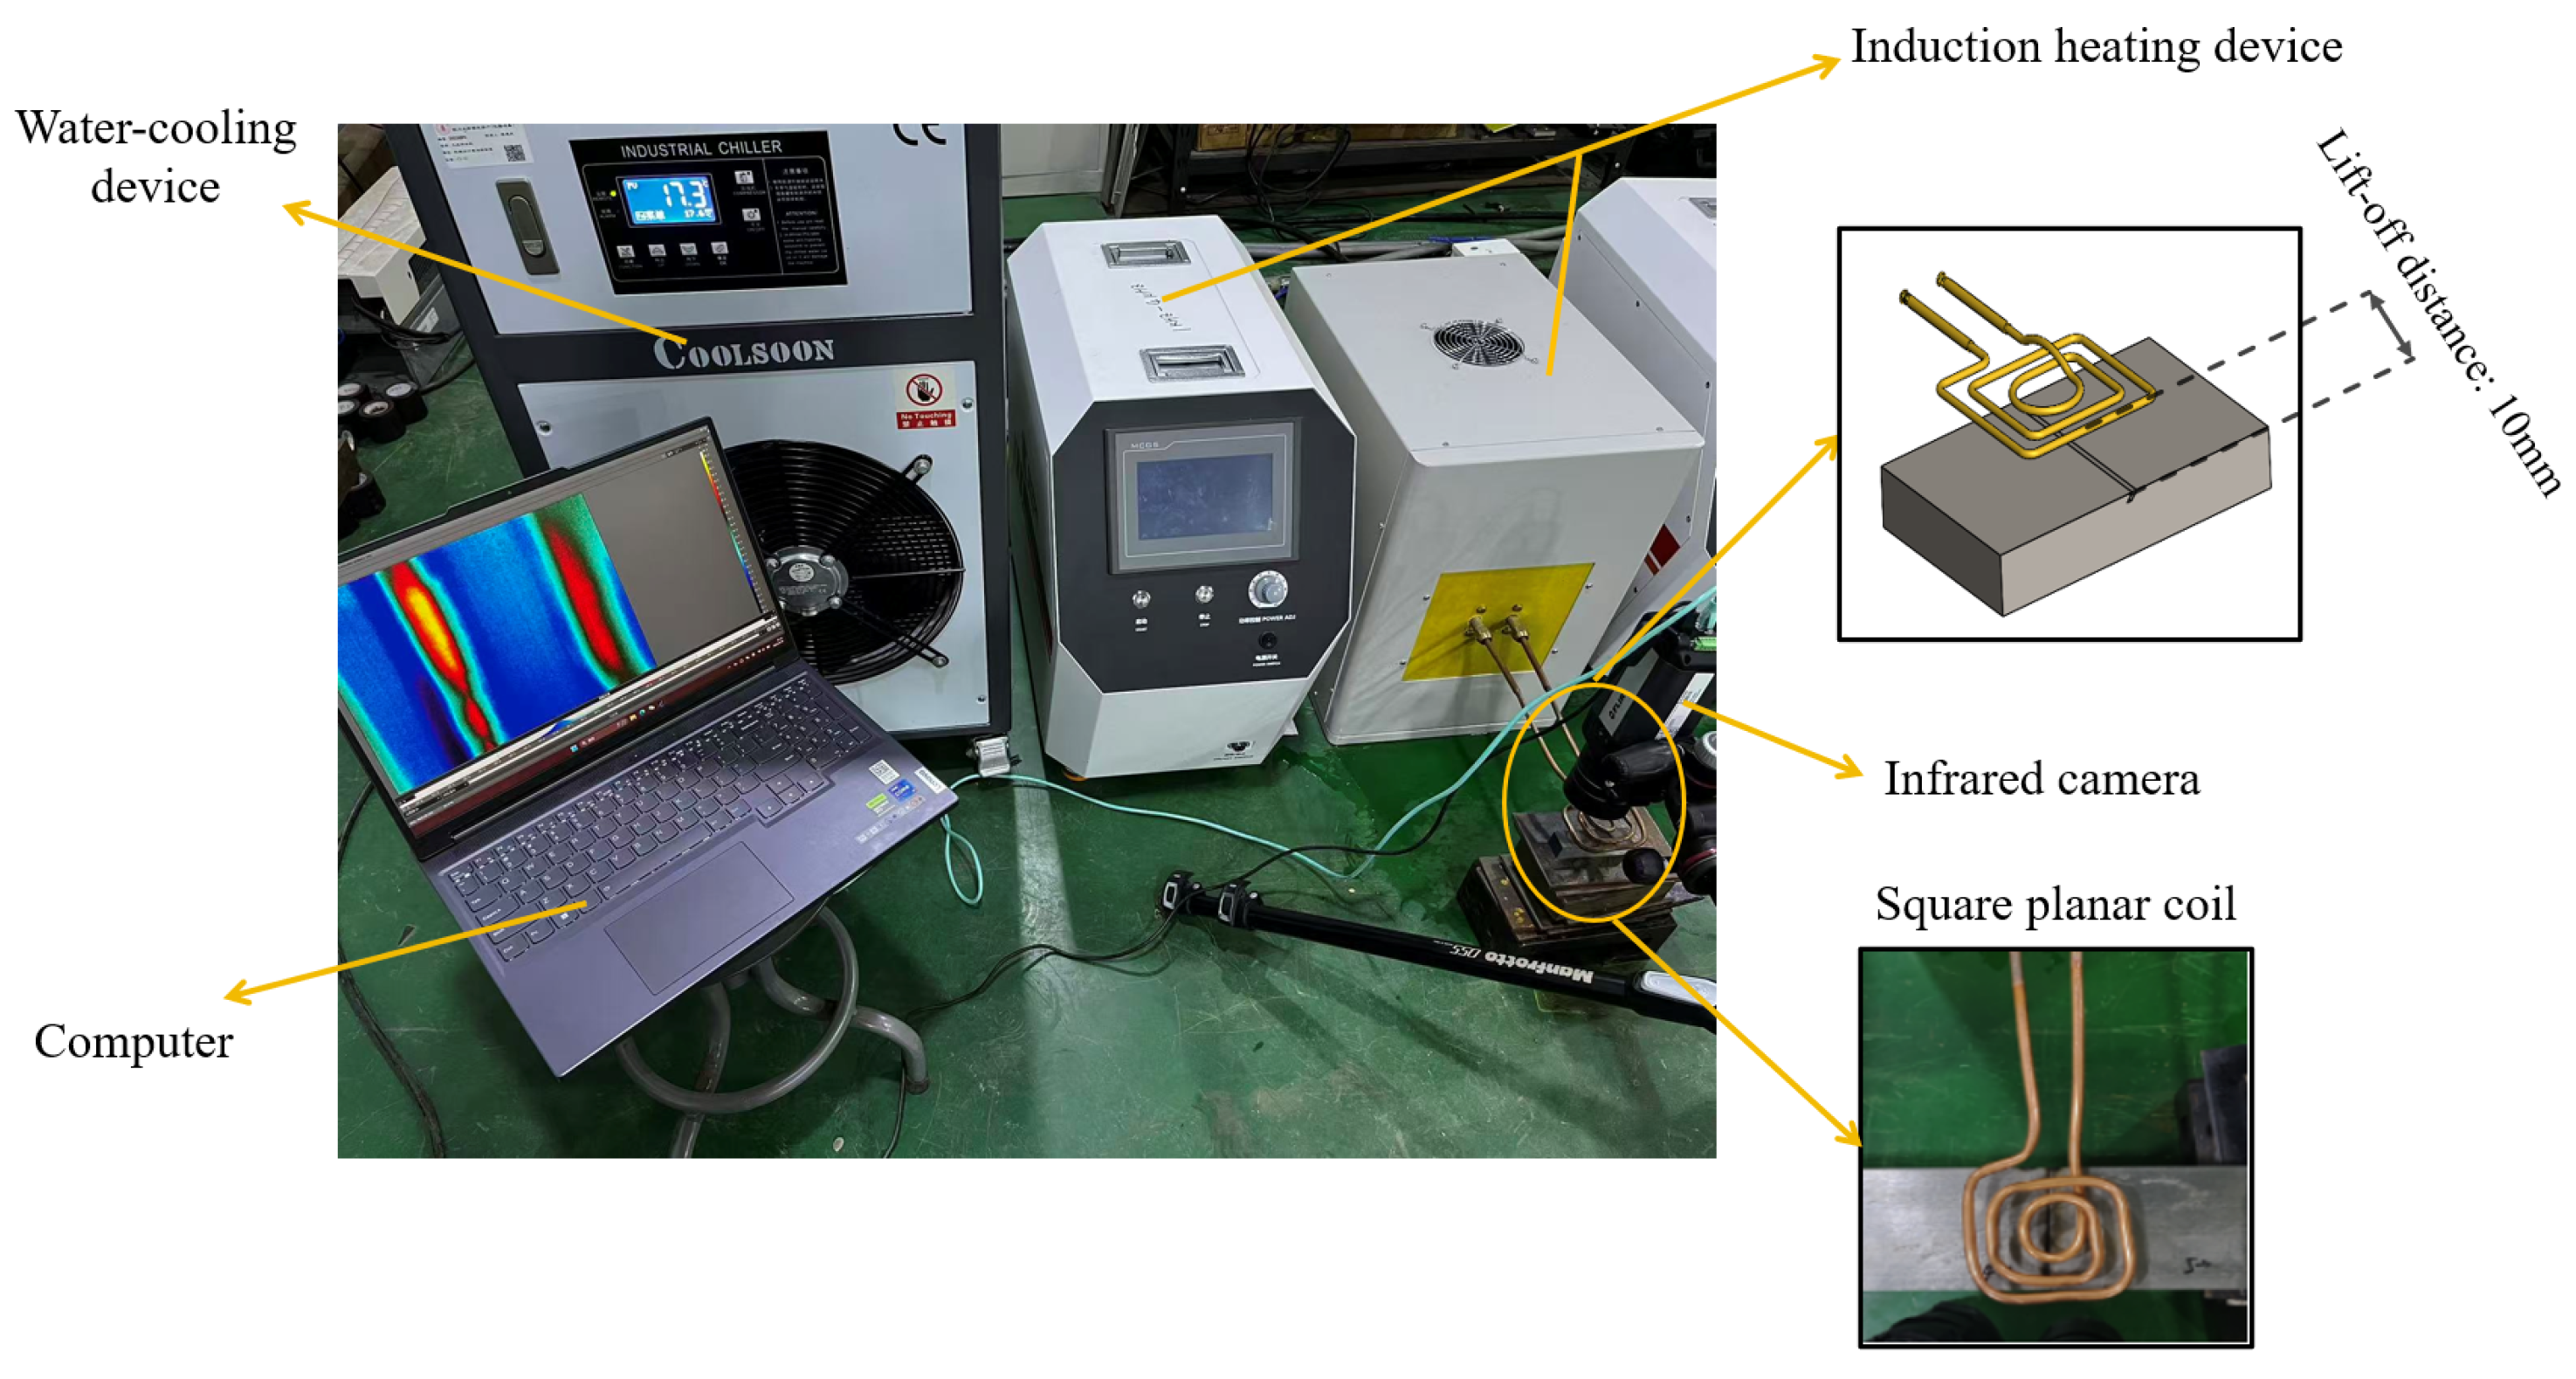
Figure 1 illustrates the schematic diagram of the ECPTT system. A timer relay functions as the input signal switch to precisely control the excitation duration of the high-frequency induction heater. The relay triggers the induction heater to generate an alternating magnetic field within the excitation coil, upon activation of the infrared camera. This induces eddy currents in the surface and near surface of the metallic specimen, producing Joule heating. When heat flow propagation is disrupted by internal defects, the thermal conduction path becomes distorted, resulting in a localized increase in temperature gradient that manifests as anomalous thermal patterns on the specimen surface. The infrared camera records the spatiotemporal evolution of the surface temperature field from a vertical perspective. The acquired thermal image sequences are processed and analyzed on a computer. Additionally, a water-cooling circulation system continuously delivers coolant through the detection coil to mitigate thermal radiation interference from the copper coil.
2.2. Theoretical Background of ECPTT
The ECPTT system involves eddy current induction heating and thermal diffusion, with the electromagnetic–thermal coupling governed by the heat conduction shown in Equation [
16]. The differential form of Fourier’s law is expressed as follows:
where
q denotes the heat flux vector (W/m
2),
k is the thermal conductivity (W/(m·K)), and
represents the temperature gradient (K/m). The negative sign indicates heat flow from high- to low-temperature regions.
where
denotes material density (kg/m
3),
is specific heat capacity (J/(kg·K)),
represents thermal conductivity (W/(m·K)), and
defines the volumetric Joule heating power density (W/m
3), corresponding to the heat generation per unit volume and time. This quantity is determined by the current density distribution.
The spatial distribution of eddy currents within the specimen depends on excitation parameters. Under different excitation frequencies, the maximum heating depth of eddy currents is governed by the skin effect: a physical phenomenon where high-frequency alternating currents exhibit exponential decay in current density along the depth direction, concentrating primarily near the conductor surface. The strength of the skin effect is jointly determined by the excitation frequency f, the electrical conductivity, , and the magnetic permeability, . As excitation frequency increases, the skin effect intensifies, confining eddy currents to surface and subsurface regions.
The skin depth,
, is defined as the penetration depth at which eddy current density decays to 1/e (about 36.8%) of its surface value. Its theoretical formulation is
where
f is the excitation frequency,
is the magnetic permeability of the medium (which is the product of the relative magnetic permeability of the material
and the magnetic permeability of vacuum
), and
is the electrical conductivity. When the lift-off distance and the imaging distance of the infrared camera remain constant, the skin depth corresponding to the metal specimen at an excitation frequency of 31 kHz is as follows:
From Equation (
3), the skin depth
is inversely proportional to the square root of excitation frequency
f. When a high-frequency excitation current is applied to the coil, the induced eddy currents are concentrated near the specimen surface, thereby enhancing the thermal responses from the surface and subsurface defects. Conversely, low-frequency excitation increases skin depth, allowing eddy currents to penetrate deeper material layers and activate thermal signals from deeper defects. For multilayer RCF cracks at varying depths, distinct thermal features can be extracted through multi-frequency excitation. Subsequent feature extraction and PCA enable precise detection and identification of buried RCF cracks in rail heads.
The thermal response in ECPTT systems comprises two distinct phases: inductive heating and cooling. Buried RCF cracks differentially affect these phases.
In the heating phase, cracks filled with air or non-metallic impurities (having an electrical conductivity, , and a thermal conductivity, , that are significantly lower than those of the base metal) substantially perturb electromagnetic field distribution and heat conduction paths. These perturbations manifest as anomalies in the transient surface temperature field.
In the cooling phase, thermal diffusion dominates. For metallic materials, crack depth exhibits an inverse relationship with peak cooling rate [
17]. Consequently, the quantitative comparison of peak cooling rates in defect regions during cooling enables depth discrimination of RCF cracks.
2.3. Principal Component Analysis (PCA)
Principal component analysis is a multivariate statistical method based on orthogonal transformation. Its core idea is to map high-dimensional data to a low-dimensional space via linear projection, achieving dimensionality reduction while maximizing the retention of the original data variance. This method constructs a set of uncorrelated orthogonal eigenvectors (principal components) to convert original variables into a small number of comprehensive variables. Among them, the first principal component maximizes the explanation of the original data variance, and subsequent principal components sequentially capture the remaining variance under the constraint of being orthogonal to the preceding components.
Its mathematical principle is based on the eigen decomposition of the data covariance matrix, which is conducted as follows: first, calculate the covariance matrix that reflects the correlation between variables; second, solve for its eigenvalues and corresponding eigenvectors—eigenvalues characterize the variance contribution (information intensity) of principal components, and eigenvectors determine the direction of principal components; finally, select the eigenvectors corresponding to the first k largest eigenvalues to form a projection matrix, and project the data onto the low-dimensional subspace spanned by them, maximizing the retention of key information while reducing dimensionality (typically retaining >95% cumulative variance).
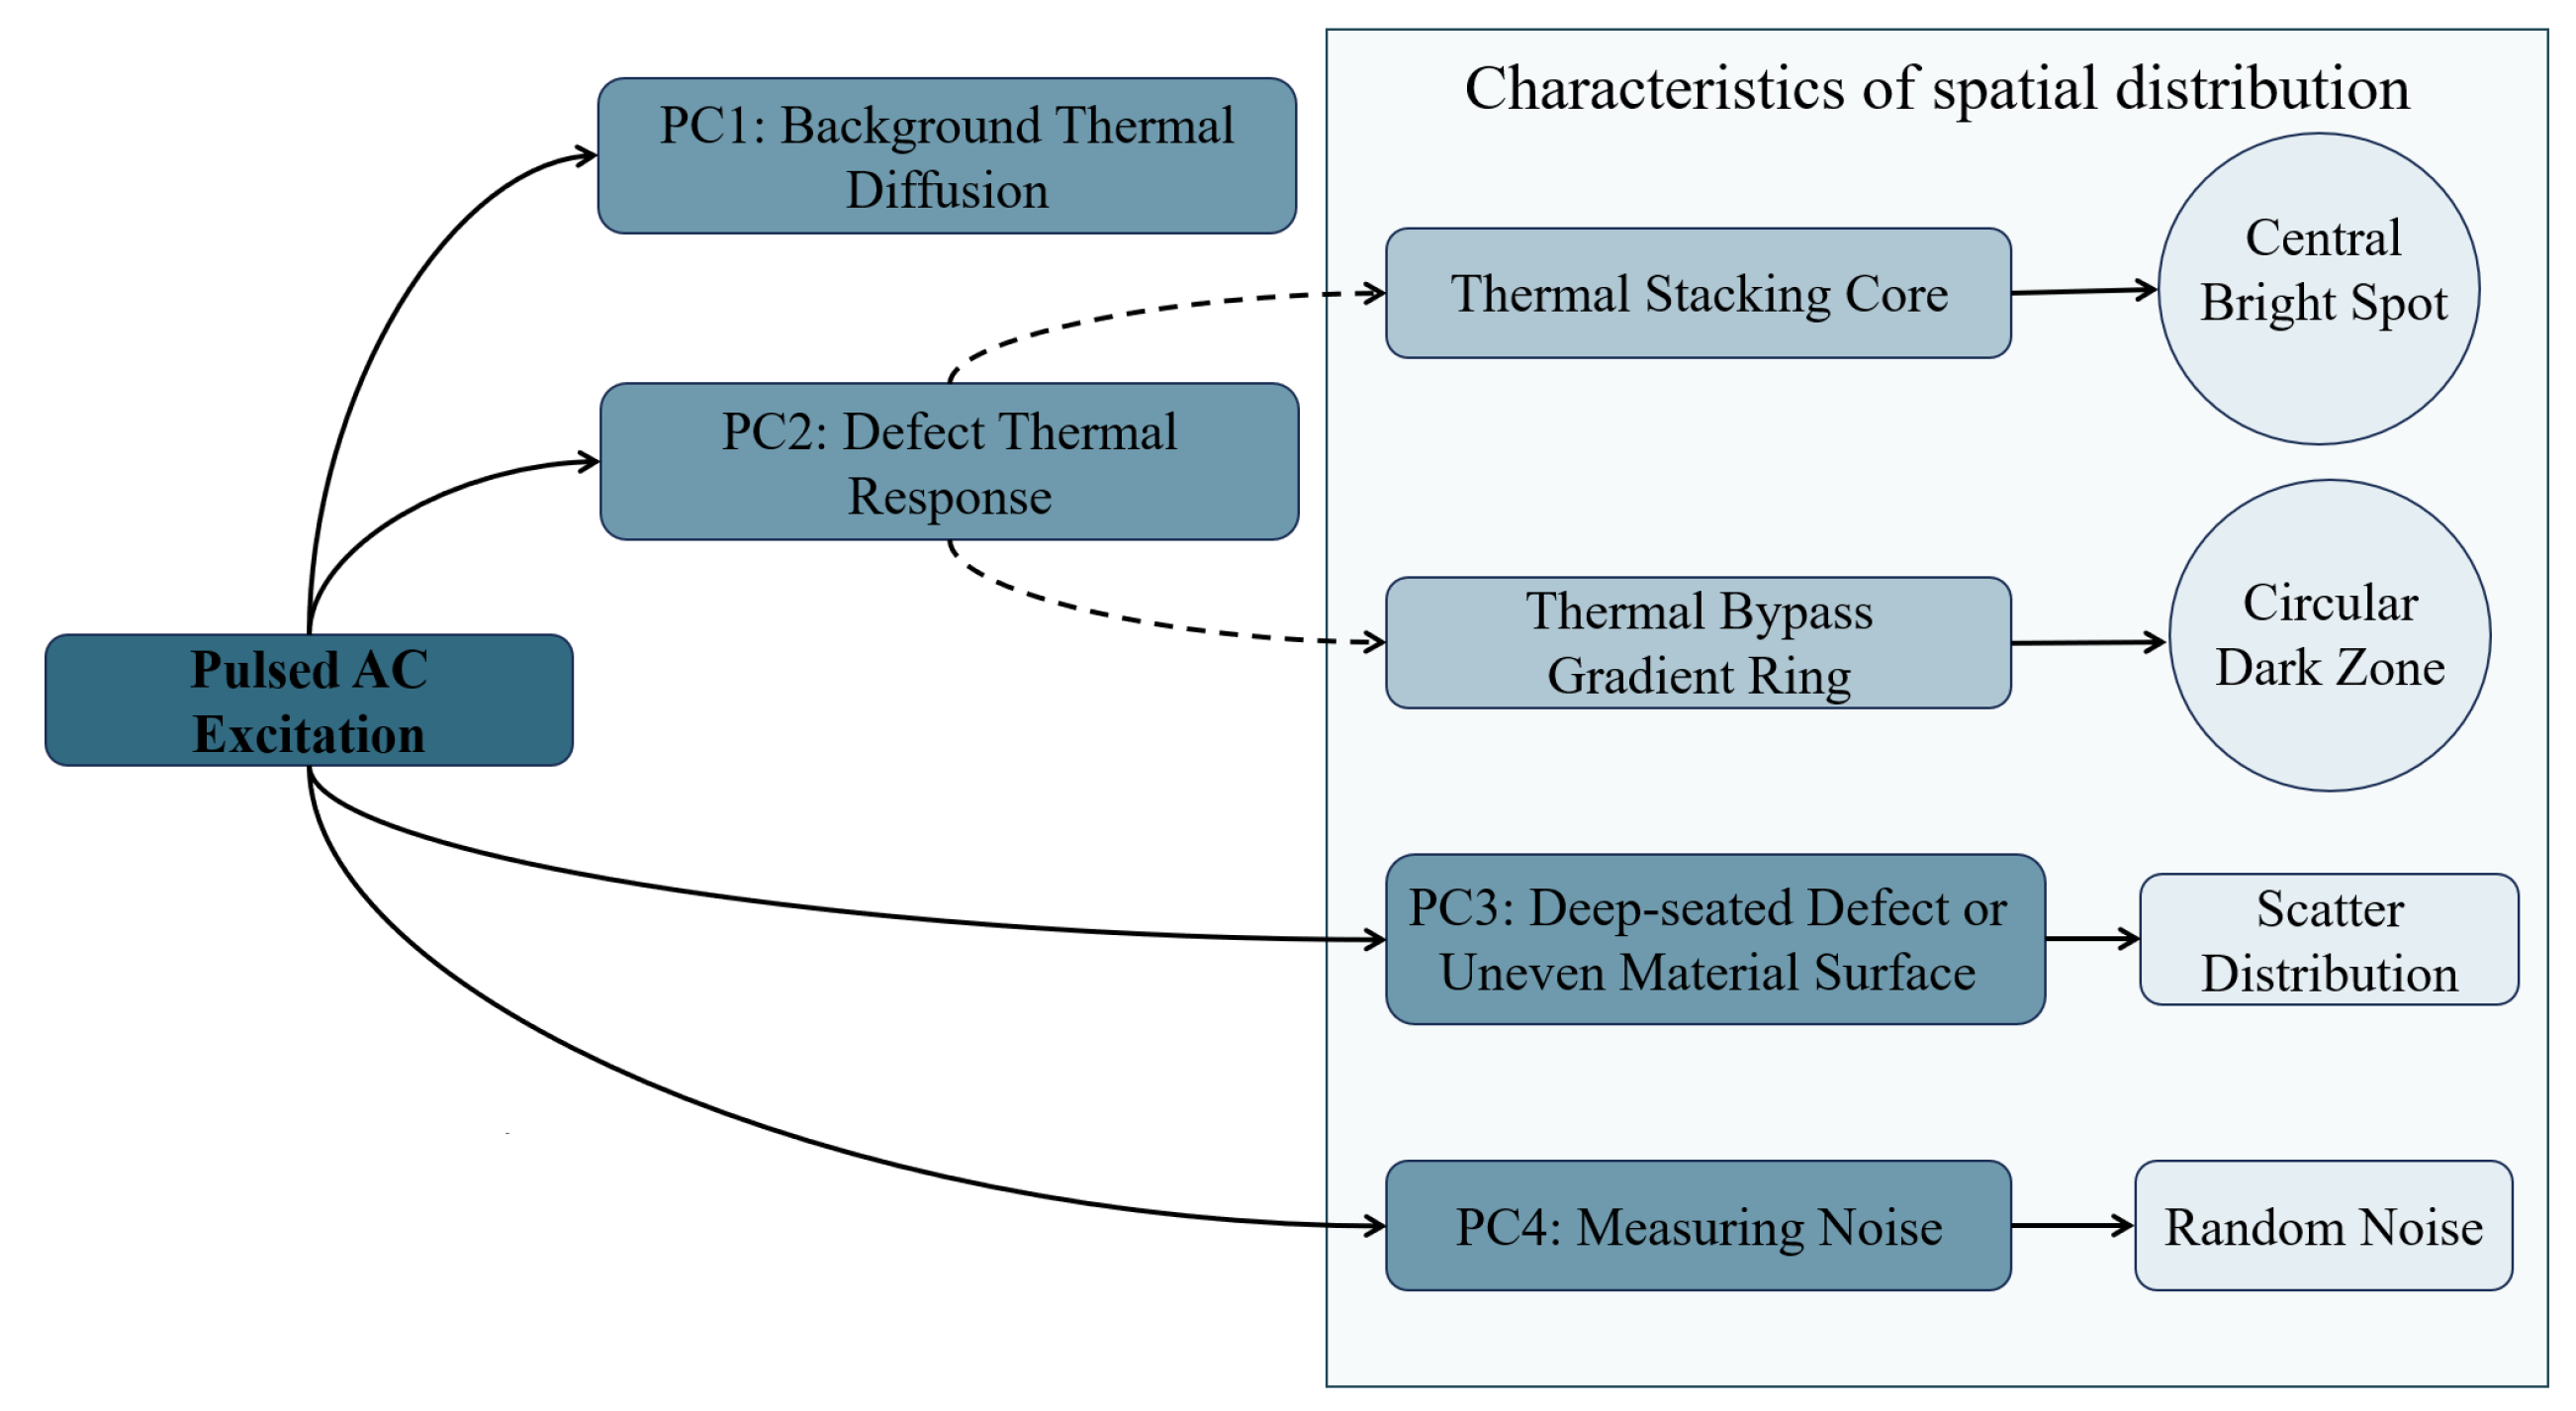
PCA in ECPTT systems serves dual functions: dimensionality reduction/noise suppression and feature–background separation. As illustrated in
Figure 2, the four extracted principal components exhibit distinct roles: the 1st principal component (PC1 > 80% variance) represents global heating/cooling trends induced by electromagnetic excitation; the 2nd principal component (PC2) isolates the thermal diffusion disparities between defects and sound areas via spatial gradient mapping, enabling crack edge localization; the 3rd principal component (PC3) shows increased variance contribution under low-frequency excitation (reaching 11.7% at 17 kHz), capturing micro-thermal perturbations from deep-layer defects; the 4th principal component (PC4 < 1% variance) denotes random measurement noise and is negligible. The first four principal components collectively retain 98% energy, meeting feature extraction requirements.
As the core defect signature, the physical mechanism of PC2 originates from abrupt thermal resistance increase at cracks, which impedes heat flow and causes localized temperature fields to lag behind the background. This spatiotemporal asynchrony is effectively captured by PC2.
2.4. Thermographic Signal Reconstruction (TSR)
In infrared thermography, Thermographic Signal Reconstruction (TSR) characterizes material thermal properties and internal defects by reconstructing dynamic thermal response profiles. Its fundamental principle lies in quantifying spatiotemporal variations in surface temperature fields under electromagnetic excitation, capturing differences in thermal diffusion rates between defect zones and sound areas (or between distinct defect regions). When cracks, inclusions, or disbonds exist, localized changes in thermal conductivity
or specific heat capacity
create thermal barriers that significantly reduce cooling rates. The mathematical definition of TSR is as follows:
where
represents the peak temperature reached during the heating phase, and
represents the initial surface temperature of the specimen before heating.
In this study, PCA primarily enables spatial feature separation and dimensionality reduction. Through orthogonal decomposition, it transforms high-dimensional thermal sequence data into independent principal components, effectively isolating defect-sensitive features from background noise while enhancing the signal-to-noise ratio (SNR) and strengthening spatial demarcation between defect and sound regions. Complementarily, TSR focuses on temporal signal enhancement: its logarithmic transformation model linearizes nonlinear thermal decay, amplifying microsecond-scale thermal contrast between defective and intact zones. Their synergy establishes a multiscale spatiotemporal feature extraction paradigm where PCA captures macroscopic spatial patterns (PC2 gradients for contour localization; PC3 variance for layer discrimination), while TSR refines microscopic temporal dynamics. Thus, by leveraging the predictable thermal responses of known defects, TSR and PCA jointly transform raw thermal data into interpretable features correlated with defect parameters, enabling the identification of defect characteristics.
Under uniform electromagnetic excitation, the surface temperature in defect regions exhibits a linear relationship with the logarithm of response time [
18]. The TSR algorithm converts the nonlinear thermal decay of temperature versus time into linear characteristics by computing the logarithm of the differential temperature between peak and initial background values. This transformation substantially enhances contrast between defective and sound regions. Particularly effective for surface and subsurface defect detection, the method quantifies disparities in thermal diffusion rates while enabling precise identification of delamination defects.
4. Results: Analysis and Discussion
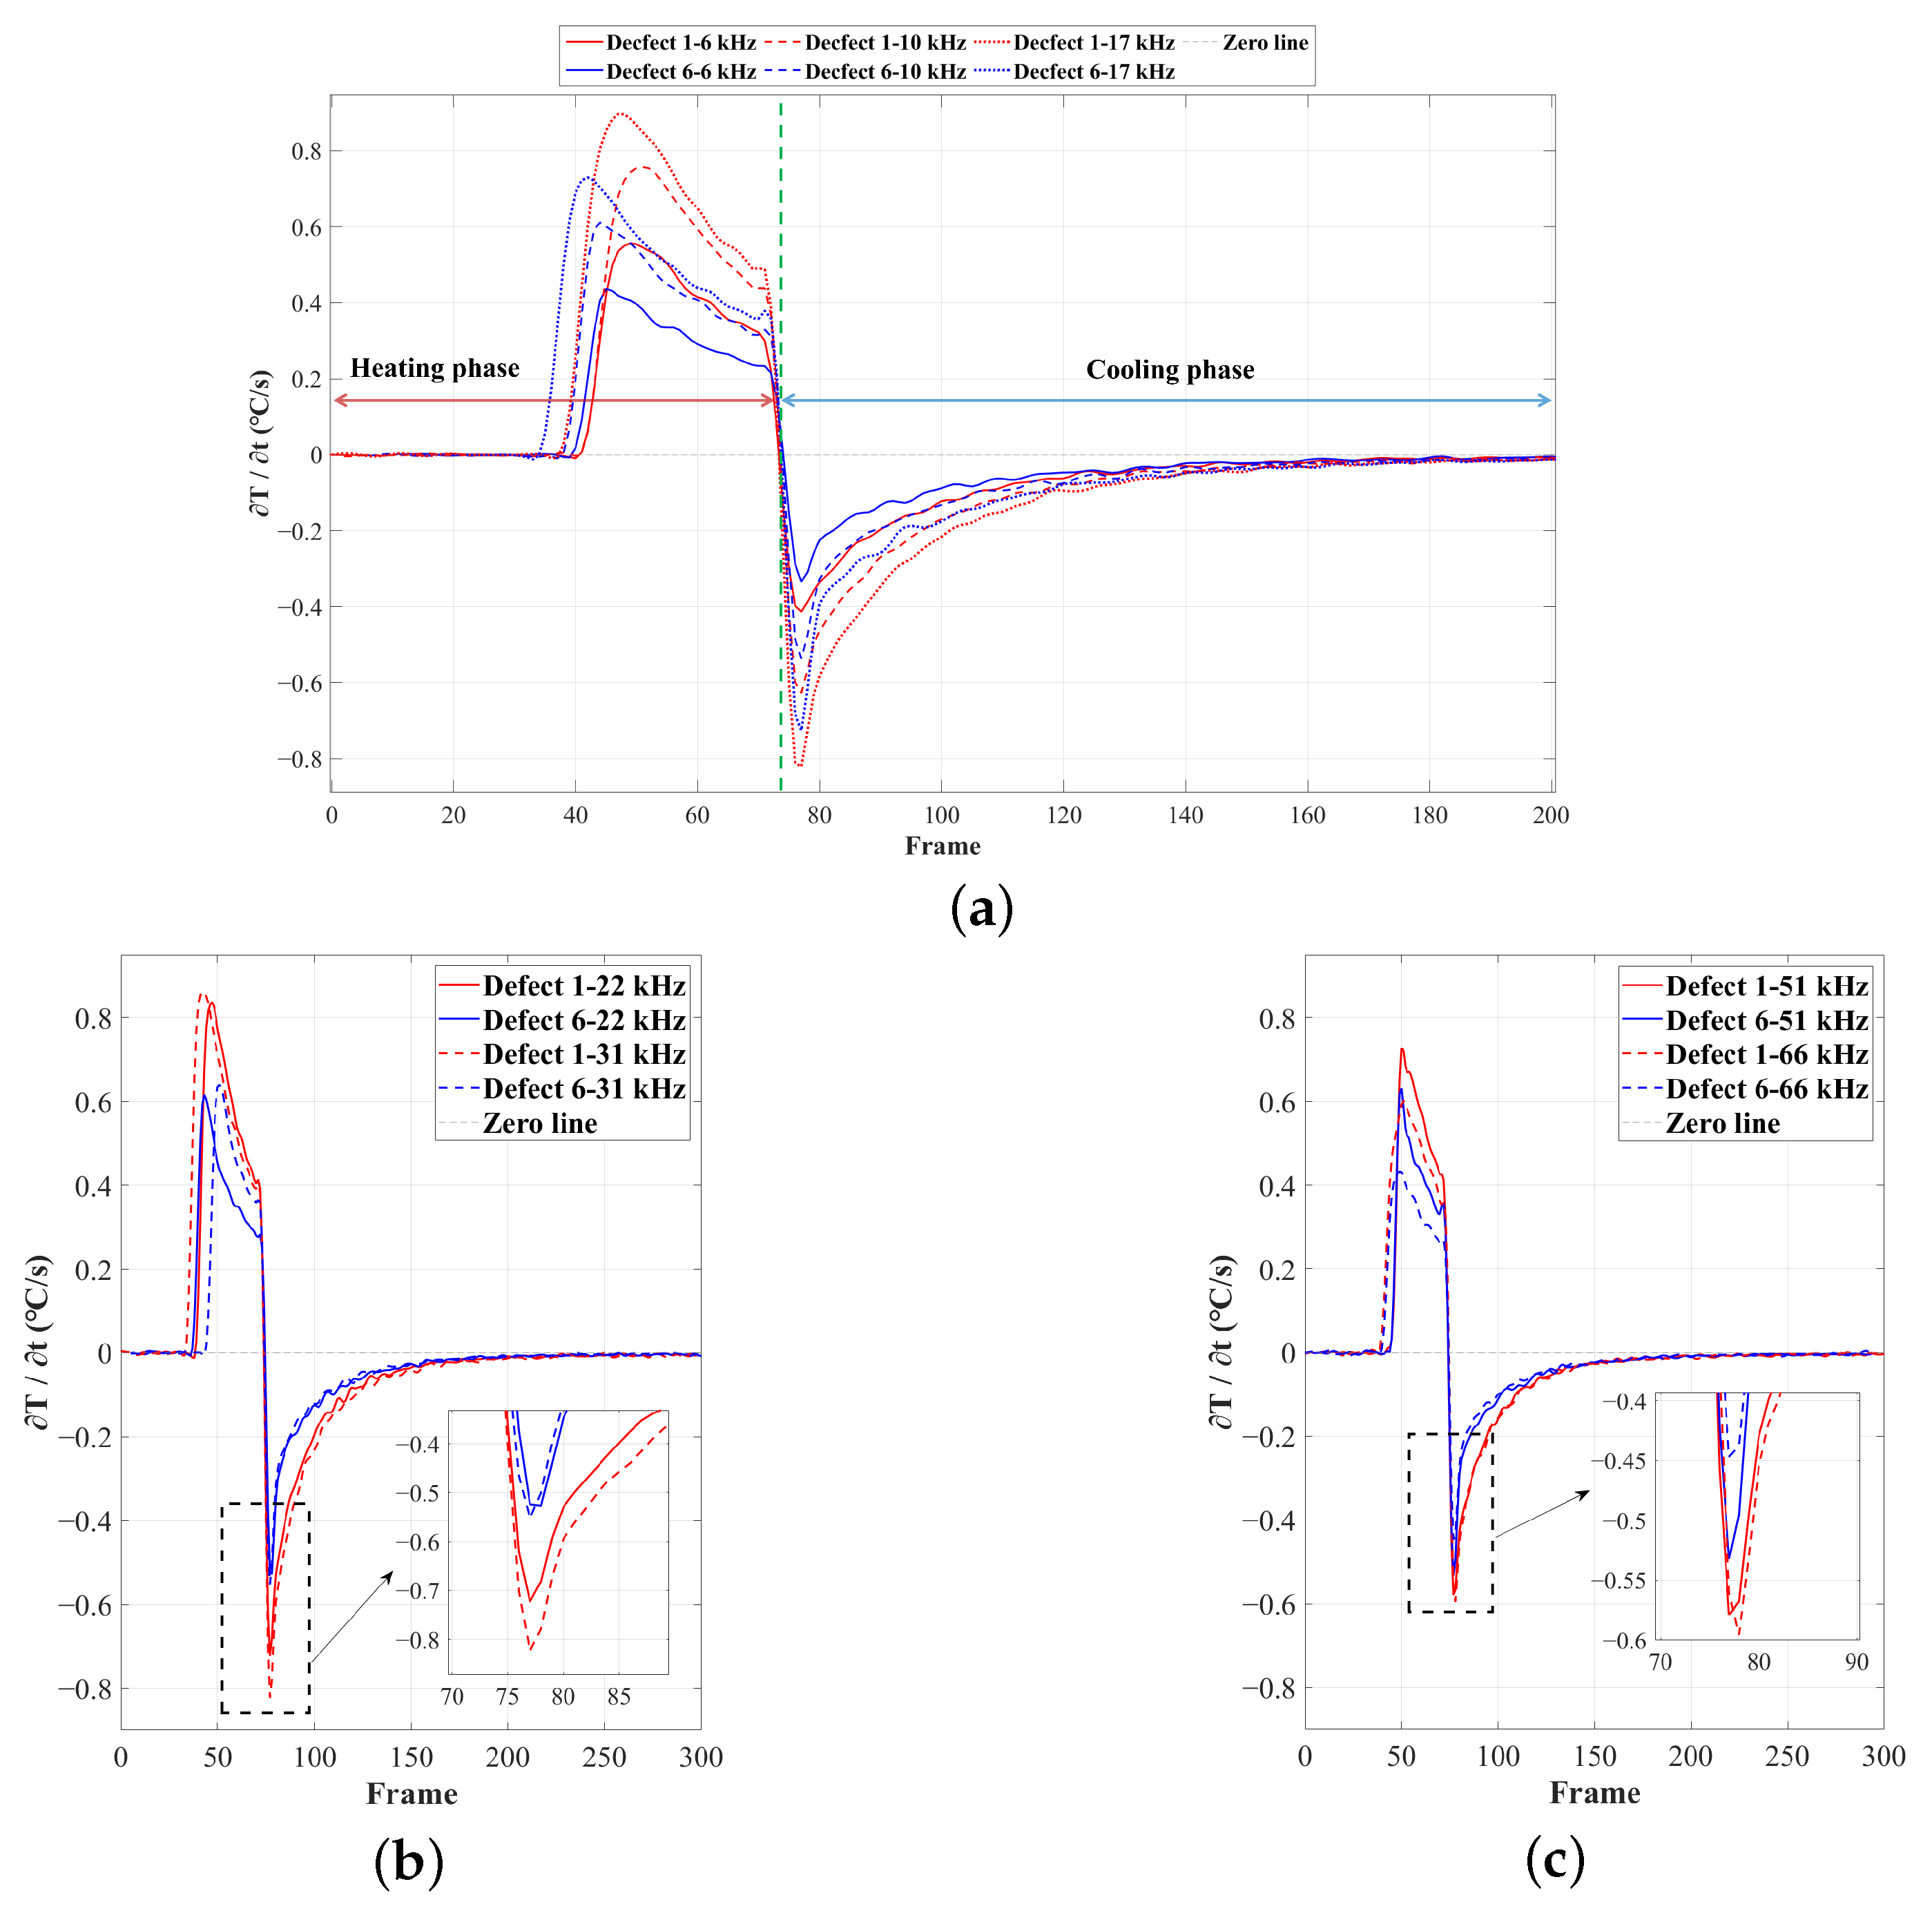
Infrared thermal sequences of six defect groups under seven excitation frequencies were acquired. Thermal sequences (480 × 640 pixels) capture spatiotemporal temperature fields of specimens and coils, with the geometric resolution of the specimens being 0.048 mm/pixel. To characterize defect thermal behavior, a rectangular region at the crack core was selected to extract temperature evolution profiles and their first-order time derivatives. This research systematically conducts five-phase analysis:
Section 4.1 achieves layer-count discrimination of buried defects; based on this foundational discrimination,
Section 4.2 and
Section 4.3 identify defect inclination angles and burial depths, respectively.
Section 4.4 conducts comprehensive analysis of defect characteristics via TSR, while
Section 4.5 provides in-depth discussion on internal heat flux conduction mechanisms within defects.
4.1. Identification of Defect Layers
Principal component analysis decomposes high-dimensional infrared thermal sequences into orthogonal principal components through eigenvalue decomposition of the data covariance matrix, where each principal component represents a linear combination of the original thermal frames weighted by eigenvectors. In the context of multilayer rail cracks, PC2 exhibits the highest variance in regions corresponding to crack boundaries (black rectangle of PC2 state diagram in
Figure 5), which stems from its sensitivity to sharp thermal gradients. Cracks disrupt eddy current distribution, causing localized Joule heating imbalance during excitation and forming a “thermal boundary” between defective and sound regions. PC3 effectively distinguishes single-layer from multilayer cracks (changes in the variance contribution and state profiles of PC3 in different defects under low-frequency excitation in
Figure 5), as its variance contribution correlates with the cumulative thermal resistance of layered defects. Each additional crack layer increases the barrier effect on heat conduction, prolonging the cooling time of the overlying material and generating a unique temporal–spectral signature in the thermal sequence.
The identification of defects with different layers can be achieved, based on the spatial state diagrams of each principal component extracted by PCA. The second and third principal components (PC2 and PC3), extracted via PCA, capture the thermal anomaly signals at different depths, enabling the selective characterization of defects (as shown in
Figure 5). These two components exhibit distinct spatial patterns reflecting their respective capture of shallow thermal accumulation and deep micro-disturbances. PC2 spatial distribution reveals bright spots representing thermal accumulation where defects impede diffusion, surrounded by annular dark bands indicating heat flow detour paths. Conversely, PC3 detects deep local hotspots, reflecting thermal distribution distortion induced by defects.
PC3 spatial distributions and variance contribution rates effectively discriminate defect layer counts based on stratified thermal disturbance intensity.
Table 3 presents the spatial distributions of PC2 and PC3 for three defect groups under low-, medium-, and high-frequency channels. As the excitation frequency increases, the variance contribution rate of PC3 decreases, indicating reduced deep-layer defect information extraction due to the shallower skin depth. At fixed frequencies, PC3 becomes more sensitive to thermal anomalies as the defect layers increase. For instance, a 6 kHz excitation clearly maps thermal perturbations in triple-layer defects, while 17 kHz excitation allows PC2 to capture temperature gradients and micro-thermal anomalies in double-layer defects. Notably, at 31 kHz excitation, PC2 feature values at defect cores peak—showing a more than threefold difference compared to the background region—demonstrating maximal sensitivity to deep thermal states. By analyzing the load distributions and spatial patterns of PC2/PC3 under varying frequencies, the experiment effectively discriminates multilayer defects. At a given frequency, PC3 shows negligible response to single-layer defects (background noise > 92%), but clearly resolves central thermal accumulation and edge high-gradient regions in double-layer/triple-layer defects. Furthermore, as defect layers increase, the growing equivalent thermal resistance significantly hinders longitudinal heat propagation. Additionally, the intensity of thermal responses from deep layer defects diminishes due to the decay of eddy current density with depth.
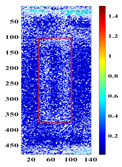
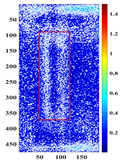
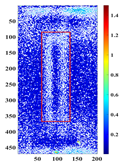
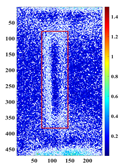
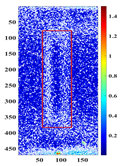
The PC2 component captures the core thermal characteristics of defects, and its gradient magnitude enables the precise localization of defect boundaries. By computing the gradient magnitude of PC2 spatial distributions, the geometric error of boundary localization is reduced to less than 1.0 mm. Eigenvalue comparison quantifies the intensity of the defect’s blocking effect on heat flow, facilitating the characterization of multilayer defects. The gradient magnitude map (
) derived from PC2 spatial distribution (
Table 4) highlights high-value zones (>
/C/mm), which correspond accurately to defect edges. The abrupt diversion of heat flow at defect boundaries creates high-gradient white contours, while low-gradient blue regions (<
/C/mm) indicate uniform heat conduction. This map accurately reconstructs defect geometries, with contour errors less than 1.0 mm, offering reliable spatial references for quantitative defect characterization.
The combination of swept-frequency excitation and PC2 gradient amplitude analysis enhances defect characterization. The planar contour of the defect can be effectively reconstructed via PC2 gradient amplitude calculations. Once the layer number information is obtained, switching the excitation frequency can reduce contour reconstruction error by half. At an excitation frequency of 31 kHz, the corresponding skin depth (
mm) precisely matches the burial depth of the first defect layer, resulting in an optimal thermal response. In contrast, the 17 kHz excitation, with a larger skin depth, increases sensitivity to deeper defects. Under this condition, the second principal component (PC2) effectively captures thermal flux distortions induced by subsurface defects. As shown in
Table 4, when the excitation frequency is held constant, the eigenvalues calculated from the PC2 amplitude increase as the number of defect layers rises, particularly under 31 kHz excitation, where the eigenvalues show a significant increase. This suggests that an increase in defect layers strengthens the thermal blocking effect in the defect region. As the excitation frequency decreases, the skin depth increases, enhancing the heating effect on deeper defects and thereby raising the eigenvalues. In swept-frequency analysis of multilayer defects, the 31 kHz frequency provides better contour reconstruction for single- and double-layer defects. At 17 kHz, the PC2 gradient amplitude’s ability to delineate defect boundaries improves with the number of layers, especially for three-layer defects, where contour error is reduced to less than 0.5 mm. By optimizing the excitation frequency combination, the ECPTT system achieves optimal contour reconstruction across defects with varying layer numbers, overcoming the resolution limitations inherent in single-frequency detection.
4.2. Inclination Angle Estimation
The quantification of defect inclination angles relies on the variance contribution of PC1, a relationship rooted in the physical link between crack orientation and global thermal response uniformity. PCA decomposes thermal sequences into orthogonal components, where PC1 (accounting for >80% of total variance) captures the dominant global heating/cooling trend of the specimen (
Section 2.3). This global trend is inherently sensitive to the symmetry of eddy current distribution and heat diffusion—two processes directly modulated by crack inclination. Thus, the characterization of the inclination angle can be achieved through analyzing the variation patterns of the PC1 variance contribution rate.
For defects with varying inclination angles (Defect 1 and Defect 2:
; Defect 4 and Defect 5:
), the variation patterns of PC1 eigenvalues under different excitation frequencies were identified using a comparative analysis.
Table 5 presents PC1 spatial distributions for four defect types across seven excitation frequencies. The key observations include the following: A central strip-shaped high-temperature zone was observed at all frequencies, confirming effective defect activation. The eigenvalues of PC1, representing variance contribution rates, increased with rising frequency, indicating that the core defect regions decreasingly influenced global heat diffusion (at
inclination angle, the average increase is 10.5%, whereas at
, the increase is only 2.9%, revealing 3.62-fold attenuation at steeper inclinations). This is due to the reduction in skin depth with increasing frequency, which leads to a progressively smaller degree of heating at the defect, resulting in more uniform overall heating and cooling of the defect area. Defects with a larger inclination angle have a relatively greater overall average depth. Under the same excitation conditions, these defects are more difficult to heat effectively, which weakens their influence on the overall temperature variation trend. This combined effect illustrates the decreased influence of defects with larger inclination angles on thermal diffusion within the surrounding material. Enhanced heat accumulation at the specimen boundaries, due to superimposed thermal responses from eddy current distortion [
22,
23], has no significant impact on the heat flow at the defect core.
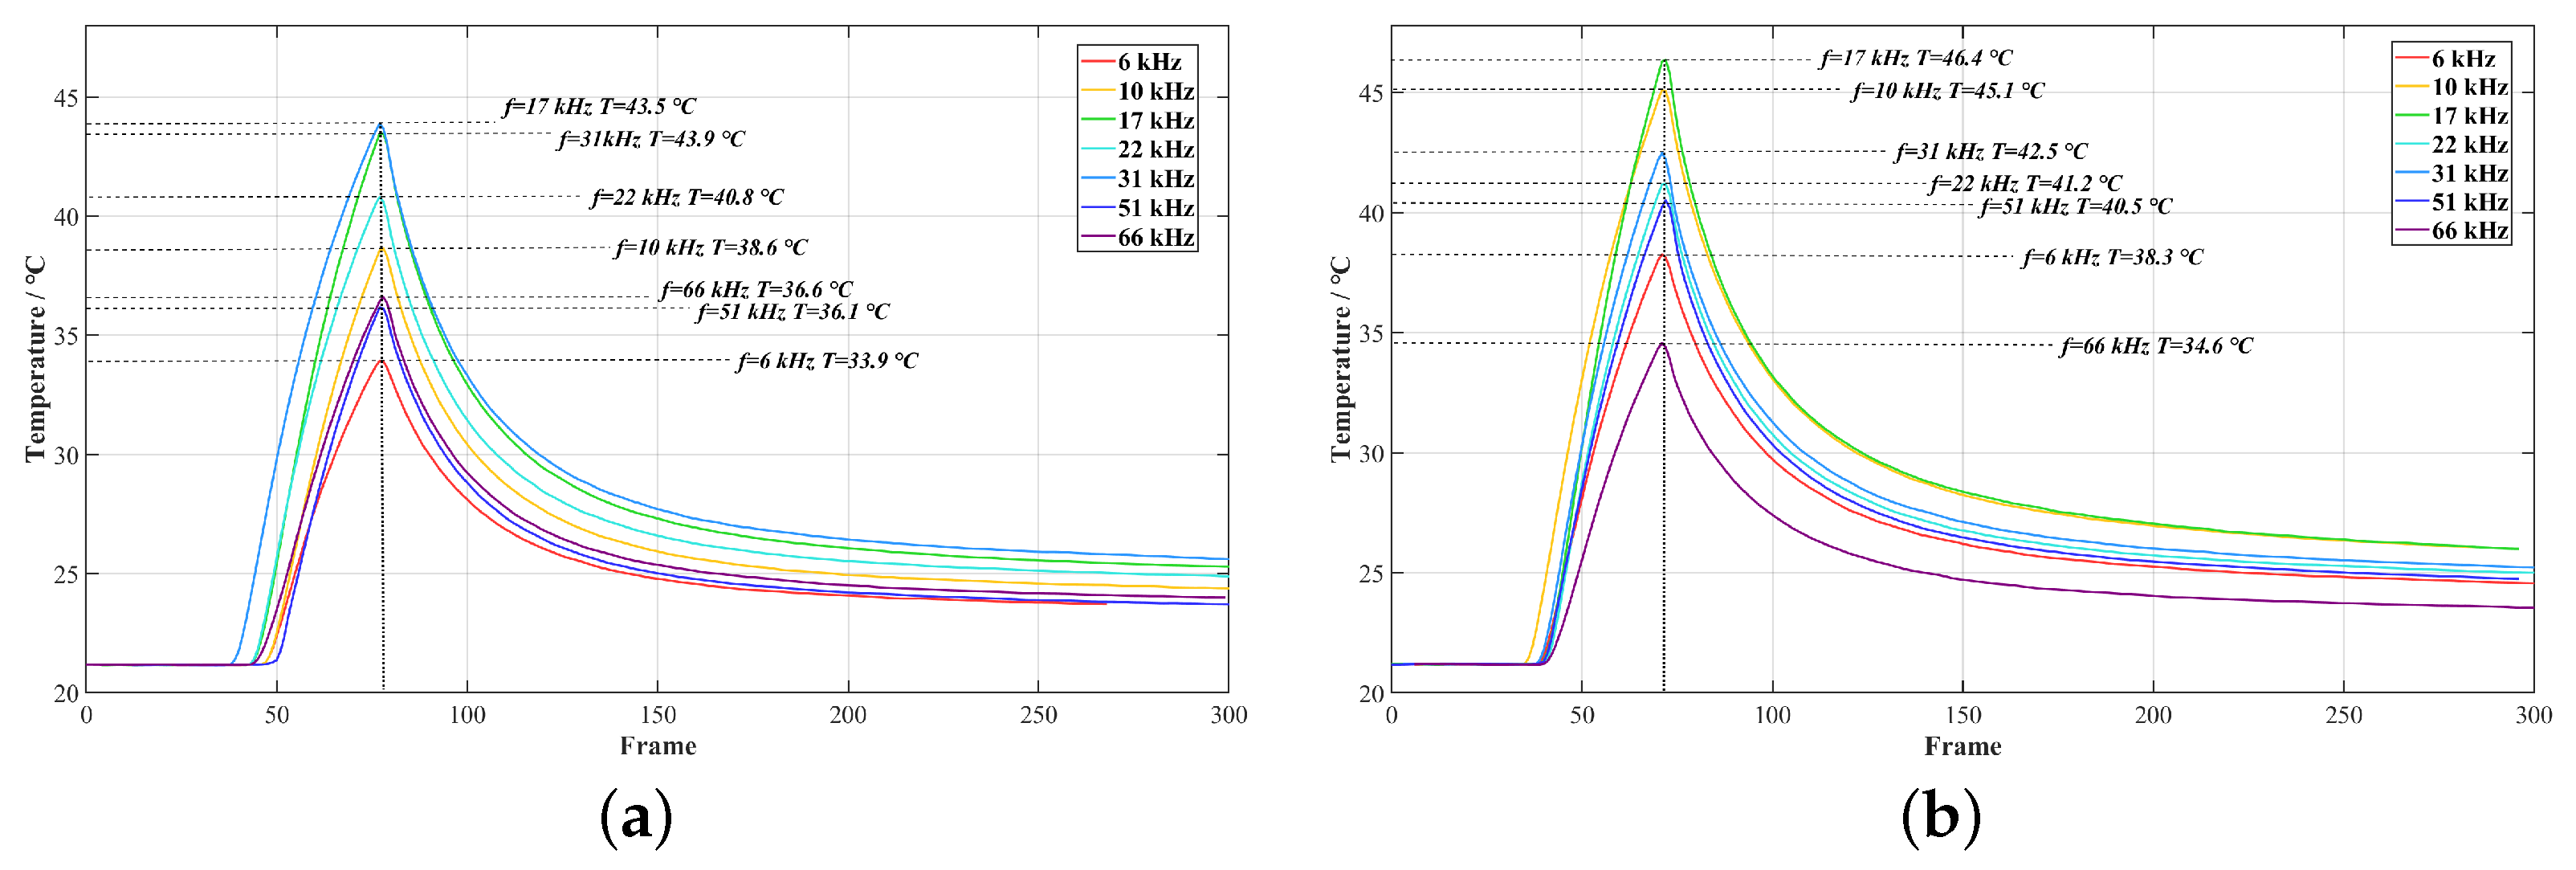
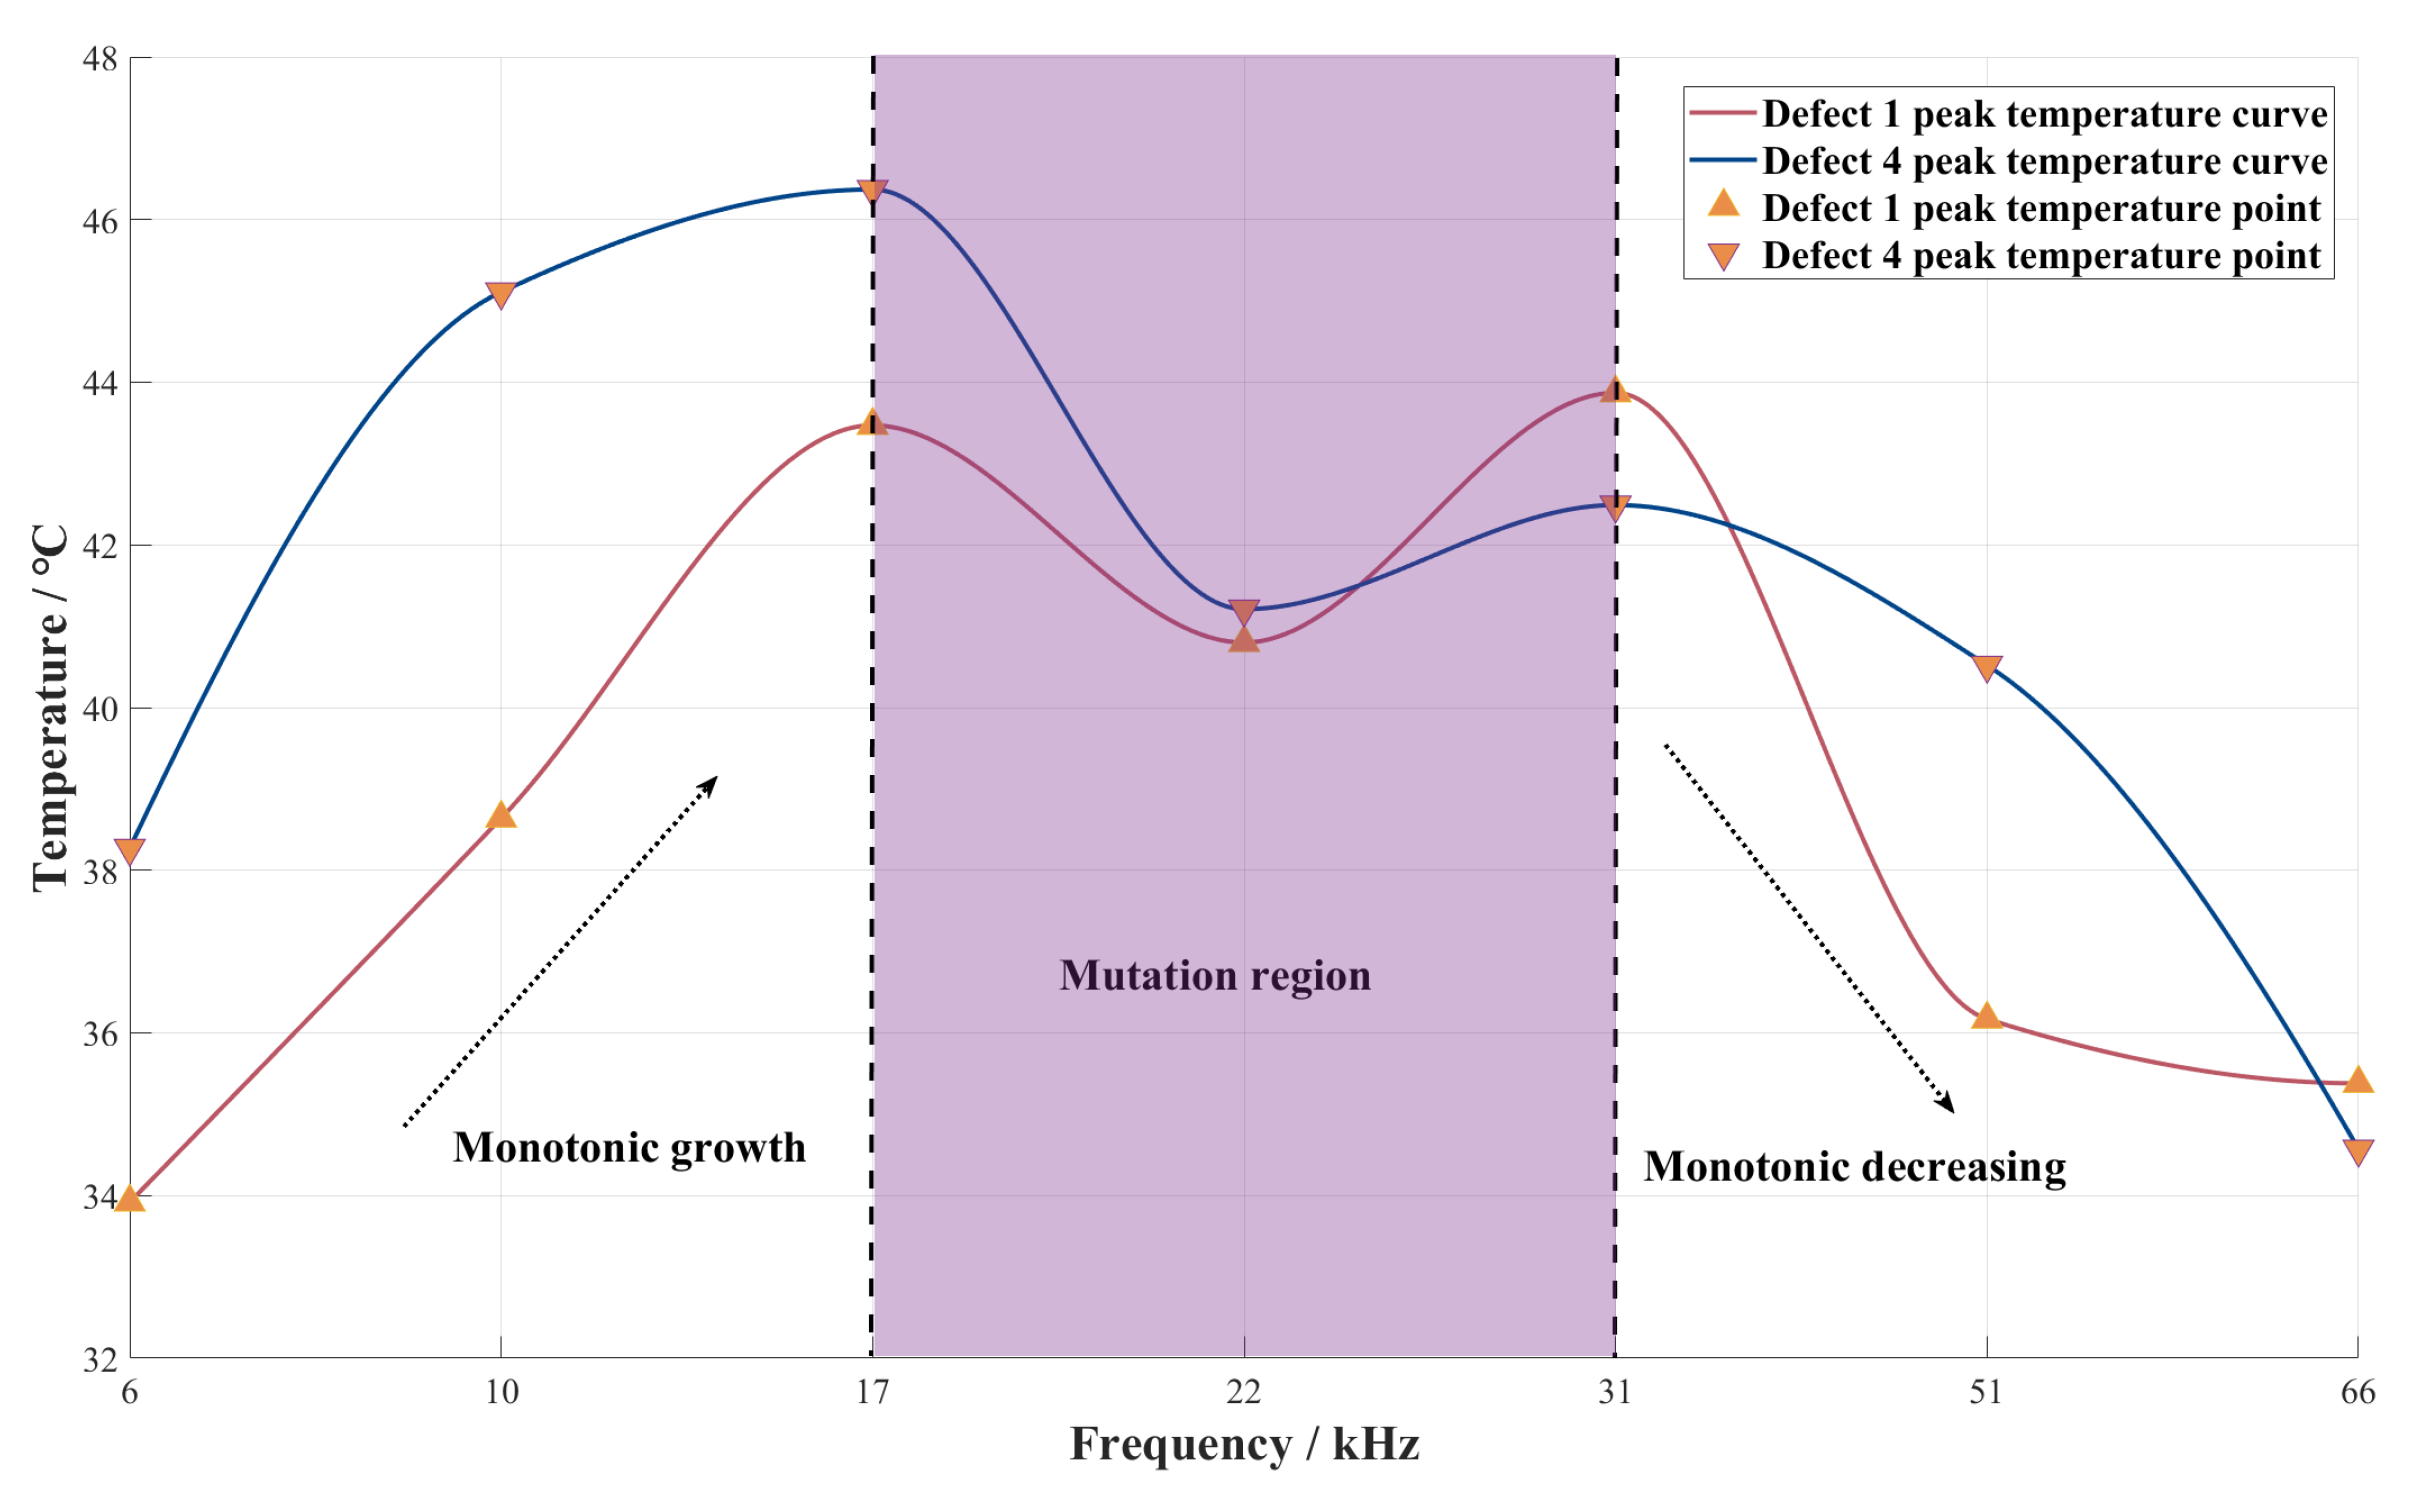
Buried defects exhibit regular non-monotonic dual-peak characteristics in peak temperature response under multi-frequency excitation, with systematic shifts induced by inclination variations.
Figure 6 quantitatively verifies the temperature–frequency correlation in defect core regions: peak temperatures of single-layer defects show local maxima at 17 kHz and 31 kHz, characterized by an initial increase followed by decrease with rising frequency (6–66 kHz). This non-monotonic behavior contrasts with surface-breaking cracks where eddy current penetration along crack tips causes monotonic temperature increase [
15], highlighting fundamental differences in buried defect response mechanisms. Due to tri-phase eddy current evolution, in the 6–17 kHz low-frequency band, increasing excitation frequency reduces the skin depth, prompting eddy currents to concentrate toward the defect location, thereby forming higher Joule heat density at the defect and driving the peak temperature upward. Within the 22–66 kHz mid–high-frequency range, the horizontal thermal gradient between the defect and surrounding intact areas continuously increases, enhancing horizontal thermal diffusion. As the excitation frequency increases, heat loss from the defect region becomes more pronounced, causing the peak temperature to decrease. At the critical 31 kHz point, skin depth corresponding to the excitation frequency precisely matches the defect burial depth, maximizing eddy current energy concentration at defect interfaces and significantly enhancing the detection effect.
4.3. Depth Quantification
Defect burial depth critically governs heat transfer efficiency under uniform volumetric heating, manifested through abrupt changes in heating/cooling rates that enable discriminative depth characterization. The discriminative characterization of depth can be achieved by comparing these values. Defect burial depth governs actual heat transfer efficiency, manifested through significant alterations in heating/cooling rates under uniform volumetric heating.
As evidenced by
Figure 7, comparative analysis between Defect 1 (0.5 mm depth) and Defect 6 (1.0 mm depth) reveals the following findings: During the heating stage, the temperature change rate of Defect 1 exceeds Defect 6 by 28.4% on average; during the cooling stage, the peak cooling rate of Defect 1 is 26.3% higher than Defect 6. This indicates that an increase in defect burial depth weakens the thermal flow hindrance, which is reflected in a reduced maximum surface temperature rise and an accelerated cooling process. Furthermore, the relationship between peak temperature change rates (during heating/cooling) and excitation frequency follows an identical dual-peak distribution (extrema at 17 kHz and 31 kHz) to that of the peak temperature–frequency dependence reported in
Section 4.2.
In the ECPTT system, the eddy current heating depth is directly regulated by the excitation frequency, while the influence of defect burial depth changes on the magnetic field and eddy current distribution gradually attenuates. When the defect is within the heating depth range (), vertical heat conduction is obstructed, forcing the horizontal heat flow component to increase. With increasing burial depth, lateral heat flow dominates energy transfer-triggering accelerated heat dissipation in defect zones. This manifests as follows: sharp reduction in surface temperature rise amplitude, elevated cooling rates, and blurred defect boundaries due to thermal response signal interference.
Based on the temperature response and cooling rate characteristics under pulsed electromagnetic excitation, a burial depth resolution model can be established. Particularly when the skin depth matches the burial depth (), eddy current disturbance is maximized, generating the strongest thermal anomaly signal, which provides a reference point for depth estimation of buried single-layer defects.
4.4. Thermal Signal Reconstruction Analysis
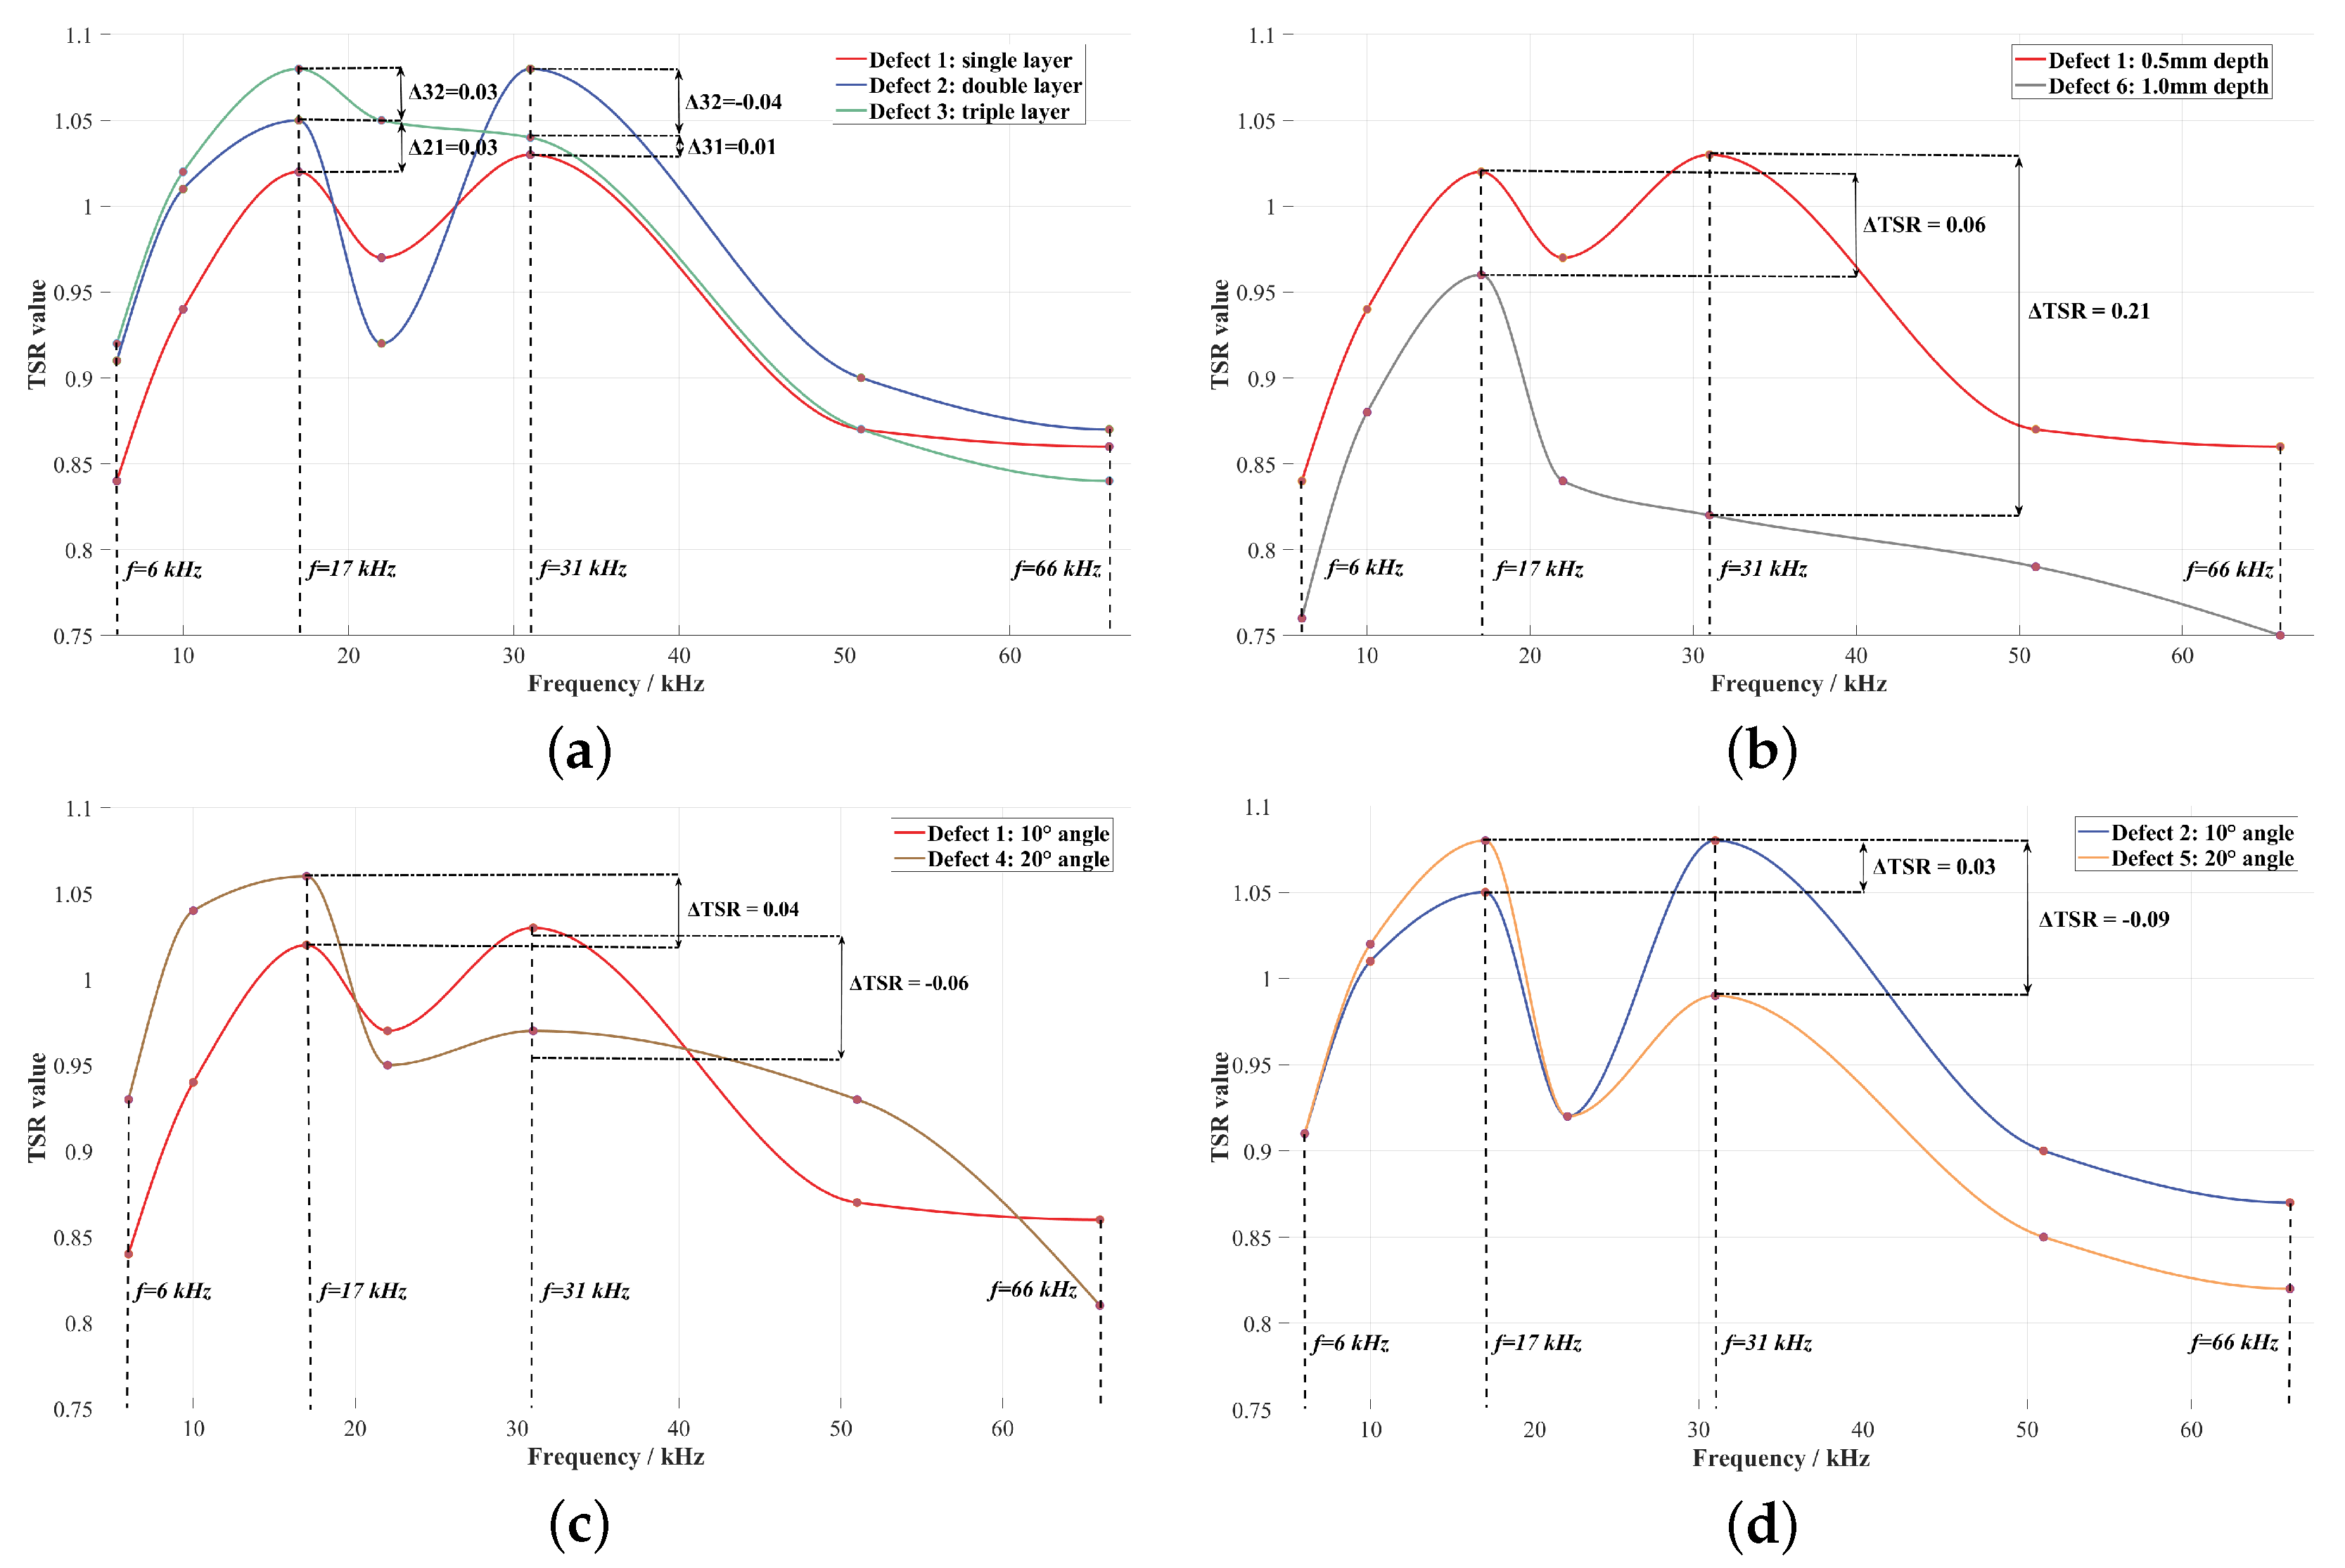
The TSR value, computed as the logarithm of differential temperature (log()), linearizes the nonlinear temperature–time relationship to enable quantitative comparison and discrimination of defect thermal responses.
As shown in
Figure 8, the TSR–frequency relationships reveal the following findings: For multilayer defects, the first layer dominates eddy current/magnetic field perturbation (when the number of defect layers is 3, the TSR increases by 6%, and the peak temperature increases by 11%), with increasing layers enhancing thermal obstruction and elevating TSR values. Increased burial depth attenuates temperature rise in Defect 6, eliminating the dual-peak trend due to the
matching point shifting toward lower frequencies. The inclination angle effects exhibit frequency-dependent characteristics: in the 6–17 kHz frequency band, eddy current distribution dominates the thermal response state, where an increase in inclination angle enhances the disturbance effect (a
inclination angle causes a 17% surge in peak temperature); meanwhile, in the 22–66 kHz frequency band, heat diffusion dominates the temperature response, and large-inclination defects exacerbate horizontal heat dissipation.
Under swept-frequency excitation, TSR values and their evolution trends exhibit significant defect-type dependence in buried defects: increasing layer count monotonically elevates TSR due to cumulative thermal resistance effects, whereas inclination variations induce characteristic shifts at dual-extreme frequencies (17/31 kHz). Ultimately, quantitative assessment of defect burial depth is achieved by decoding the holistic evolution patterns of swept-frequency–TSR curves.
4.5. Discussion
The thermal response characteristics of buried defects under swept-frequency excitation exhibit strong frequency dependence, originating from dynamic transitions in internal heating mechanisms. Pedram et al. [
24] deconstructed the heating process into three phases—simultaneous heat-up, lateral heat flow, and maximum thermal contrast—through studies on heat conduction in defective concrete slabs. In swept-frequency ECPTT systems, excitation frequency dynamically modulates the intensity of these phases by controlling skin depth, thereby inducing systematic shifts in defect thermal signatures.
Figure 9 reveals the frequency-dependent peak temperature characteristics of buried single-layer defects, exhibiting an initial increase followed by decrease—distinct from the monotonic trend of surface-breaking defects—with a pronounced extremes occurring when skin depth approximates defect depth (31 kHz excitation).
When excitation conditions change, the effects of various heat conduction processes within the defect follow a discernible pattern. In the low-frequency range (6–17 kHz), the thermal response intensity increases with frequency, consistent with the behavior observed in surface defects [
15]. Principal component analysis shows that the variance contribution of PC1 remains stable (84%) during this phase, indicating that eddy current distribution dominates the thermal process. As the frequency increases, the skin depth decreases, concentrating eddy currents near the surface. This intensifies Joule heating at the defects, resulting in higher peak temperatures. However, above 17 kHz, the peak temperature starts to decline, while the variance of PC1 rises to 90%, signaling a shift towards thermal diffusion dominance. The vertical temperature gradient (
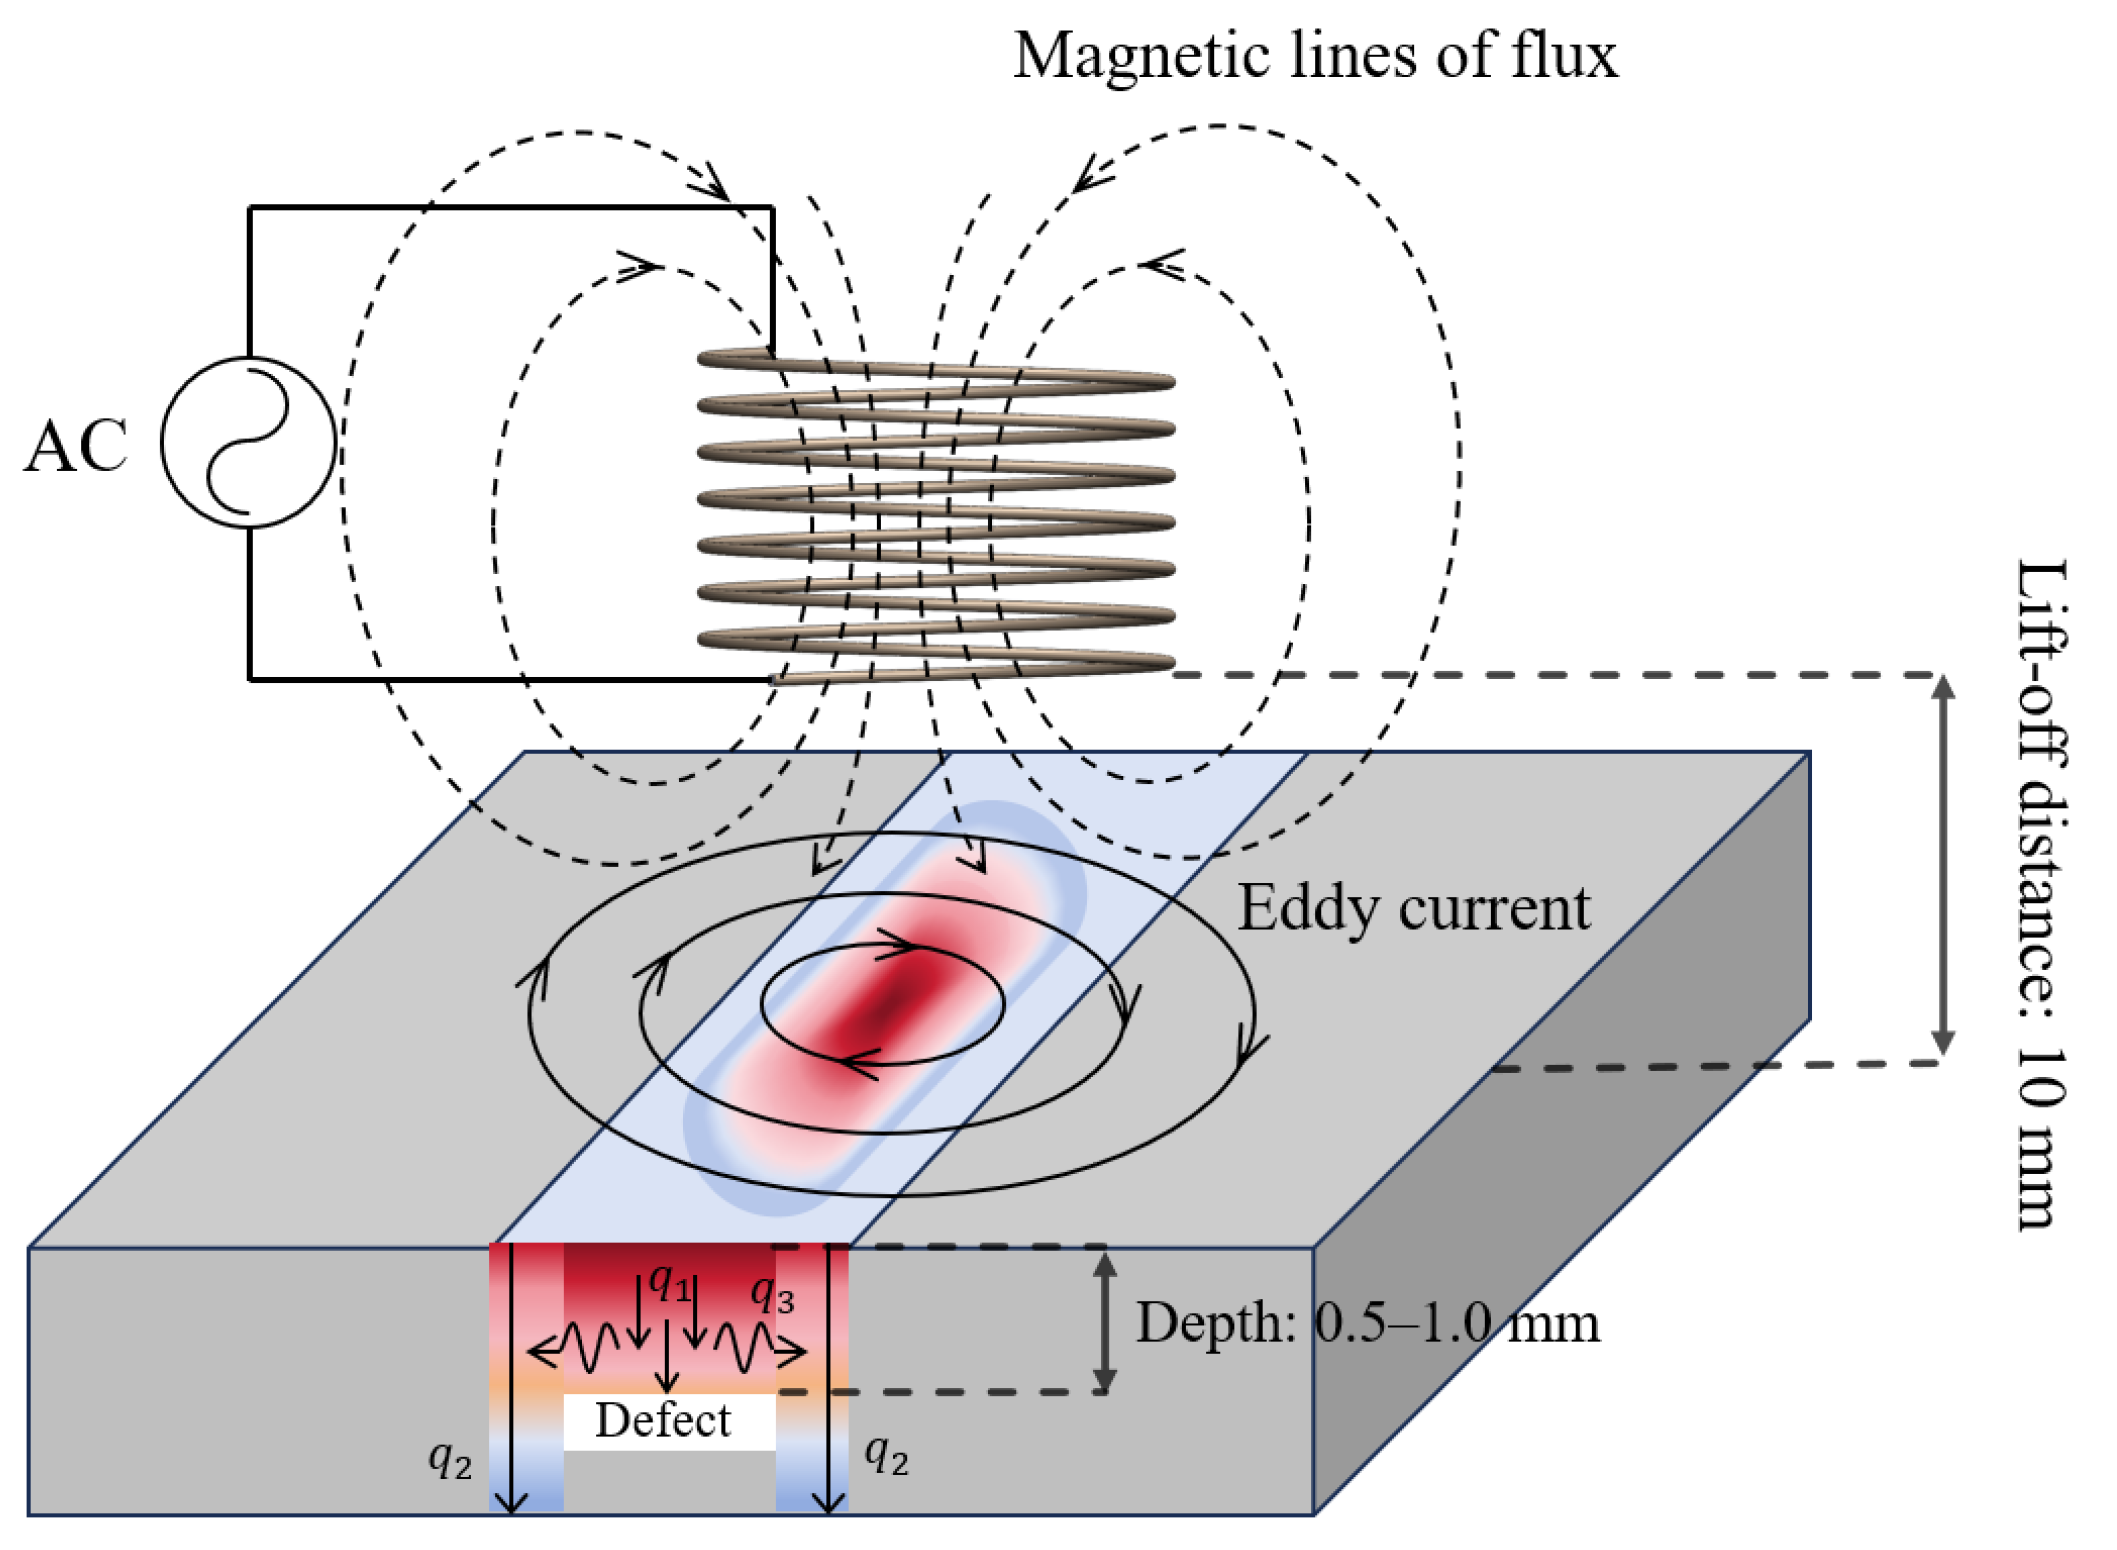
), induced by the skin effect, drives downward-propagating thermal waves. These waves encounter abrupt thermal resistance at the defects, forcing lateral heat diversion (heat flux component
). With constant heating power, heat dissipation from the defect zones to the surrounding sound areas reduces localized energy storage, thus attenuating the peak temperature. The theoretical model in
Figure 10 clearly illustrates this process.
In the simulation experiments, a comparative analysis of the thermal response characteristics between the defects and the surrounding intact regions allows for the quantification of lateral thermal diffusion intensity. In the simulation of Defect 1 at a 17 kHz excitation frequency, the vertical heat flux density at the defect area,
, significantly exceeds that of the non-defect area,
. This discrepancy leads to the development of the horizontal heat flux component,
, facilitating heat diffusion from the defect region. The underlying mechanism stems from abruptly increased thermal resistance at buried defects, severely obstructing vertical heat conduction and causing phase lag relative to surrounding heat transfer. Consequently, heat accumulation between defect and surface creates a distinct high-temperature zone. The simulation results in
Figure 11 quantitatively confirm this mechanism: at the heating end time (t = 0.6 s), the cross-sectional temperature field reveals a distinct low-temperature shadow zone beneath the defect (
), indicating that thermal wave penetration is impeded. Additionally, the top view shows a precise match between the defect contour and the high-temperature region (with a position error of less than 0.2 mm). Notably, when the defect volume-to-depth ratio (
) is less than 2 [
25], the horizontal heat diffusion component,
, dominates the energy distribution, outweighing the effect of vertical heat transfer. This critical condition explains the faster attenuation of thermal signals in deeper defects.
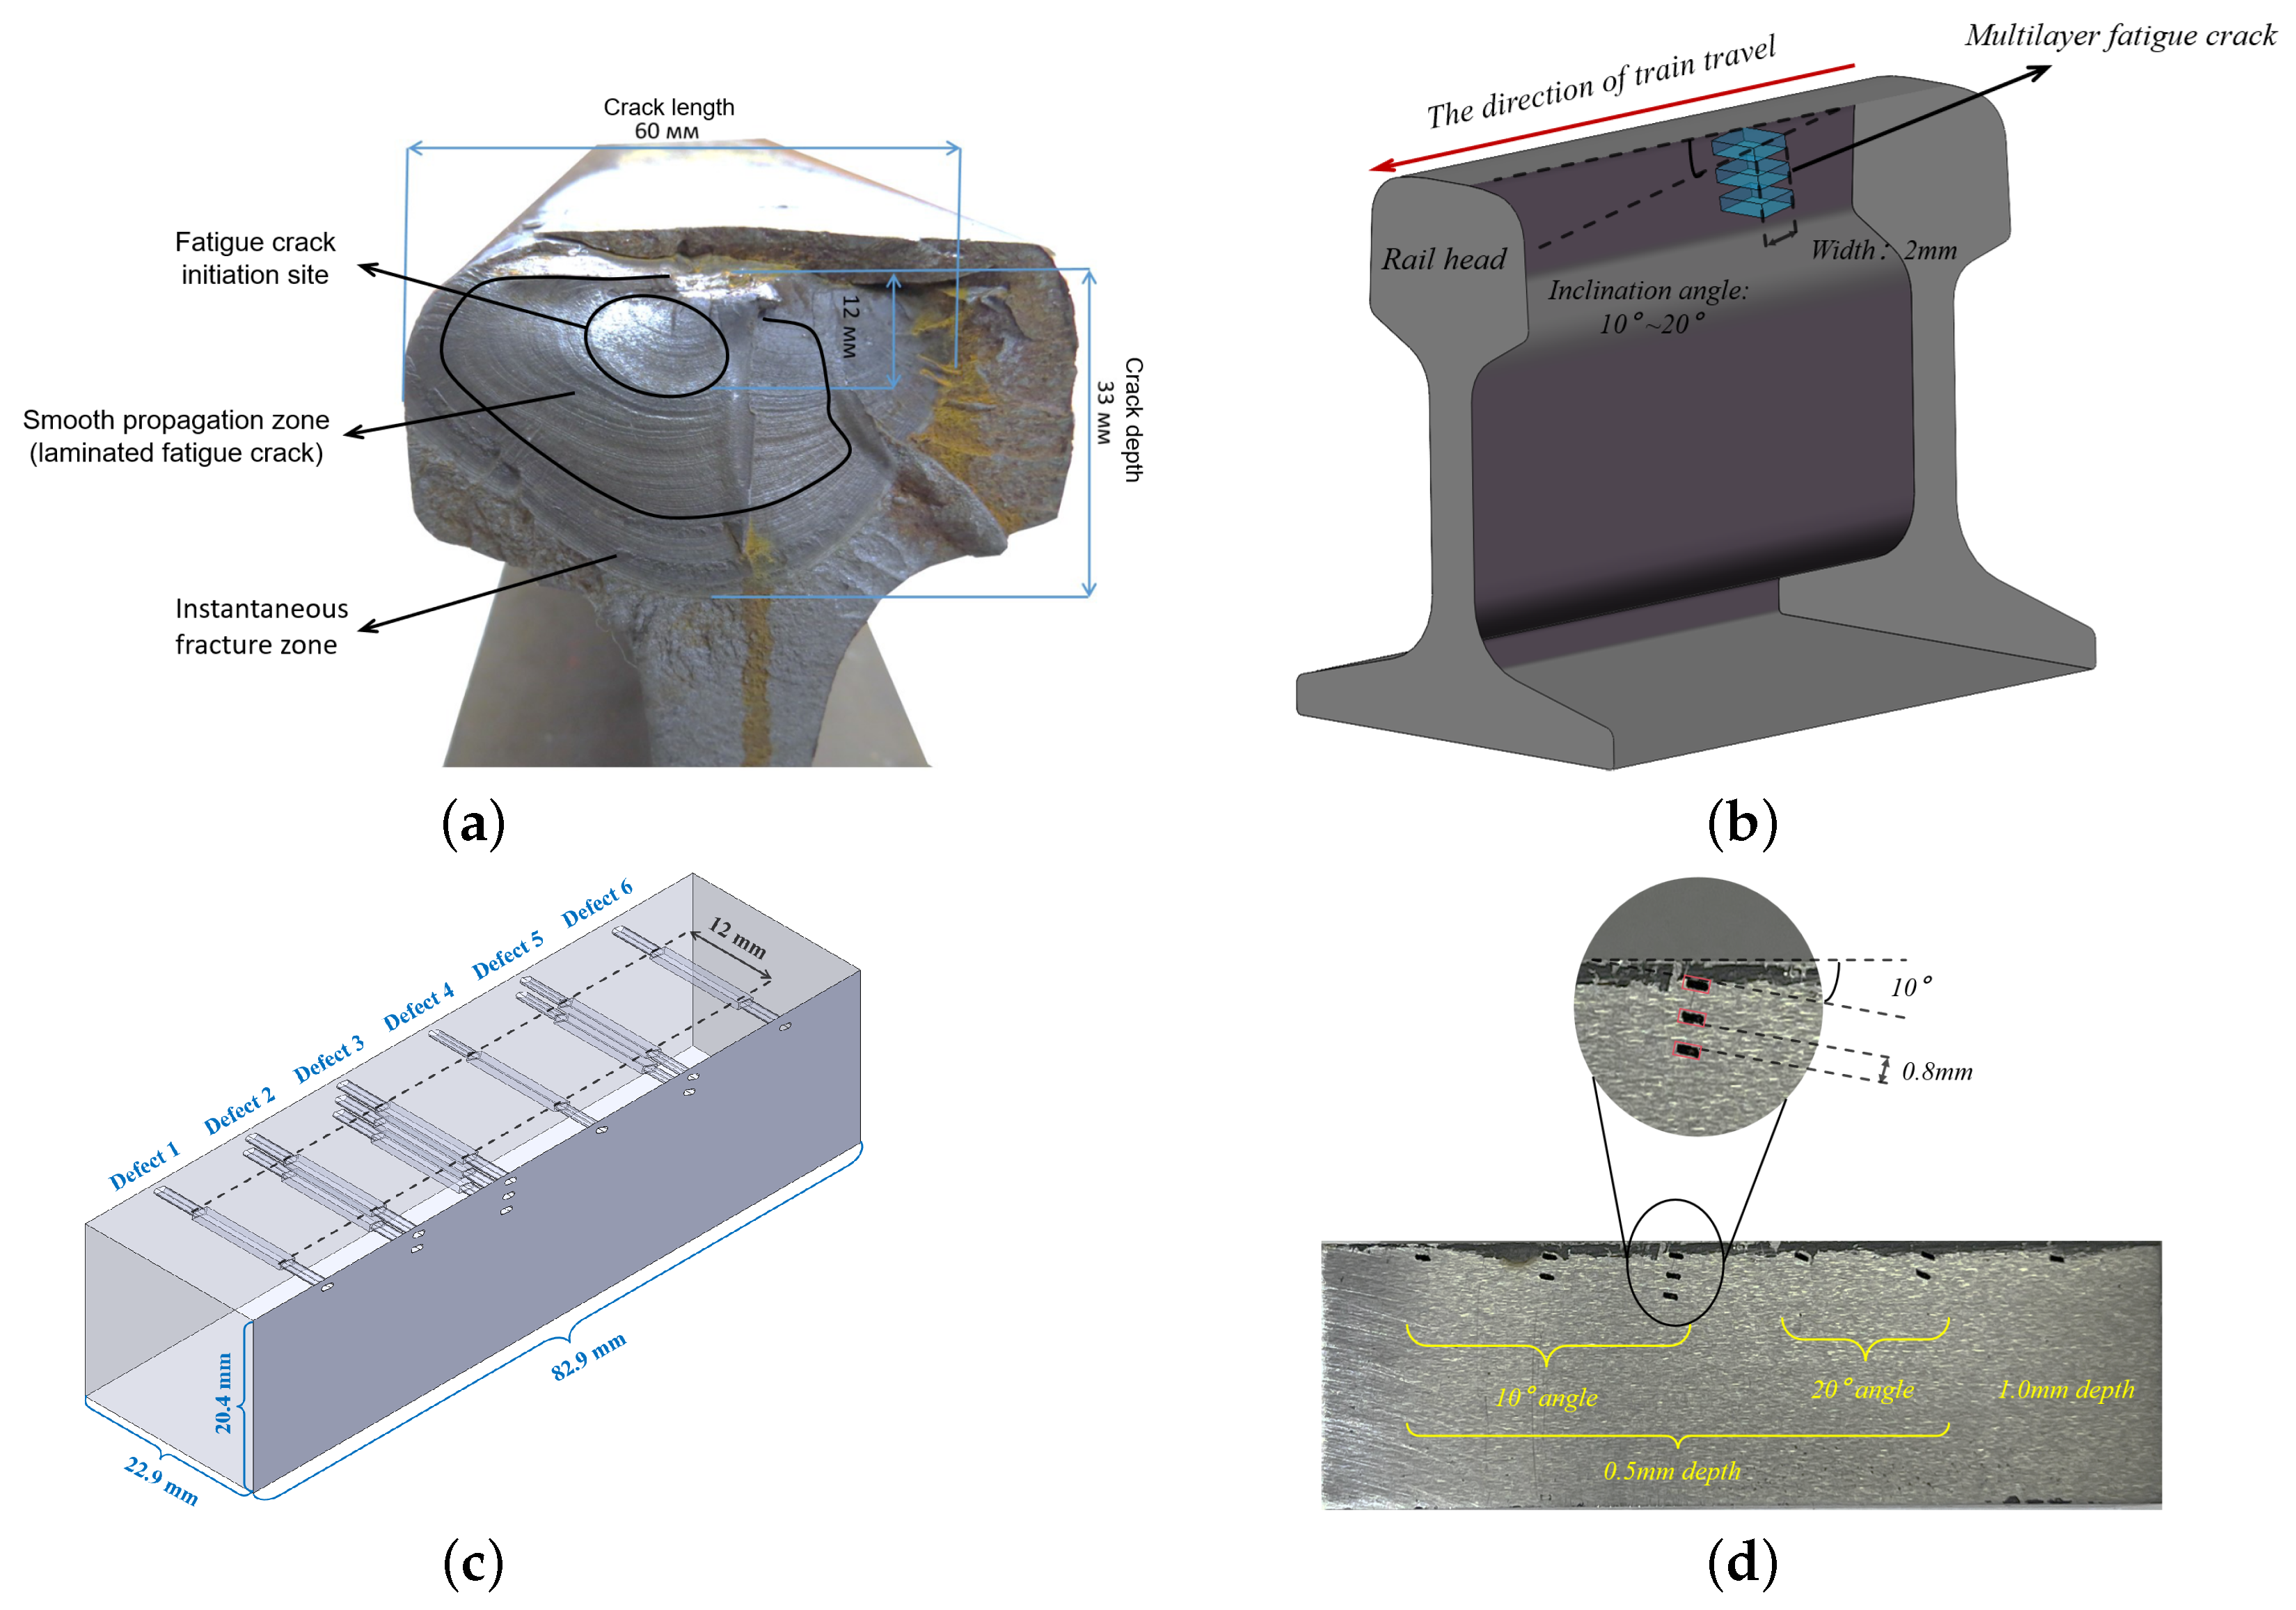
This study focuses on the closed and multilayer features of cracks. Naturally, buried crack samples have obvious limitations: they are not only difficult to obtain, but their internal microfeatures (such as closure degree and interlayer morphology) are also hard to clearly identify via nondestructive methods, failing to meet the needs of targeted analysis. Therefore, this study uses simulated samples with controllable parameters to accurately explore the thermal response laws of the above features. Future research will break through the existing limitations in three ways: first, through the development of bionic sample preparation technology integrated with alternating stress control to simulate real closed states and multilayer interfaces, reducing differences from natural cracks; second, through the combination of high-resolution infrared imaging and ultrasonic tomography for multi-modal detection to realize the visual identification of the internal microfeatures of natural cracks and establish a feature–signal database; third, by establishing a correction model through cross-validation of on-site real rail head crack data and simulated results, improving the method’s practical applicability and bridging laboratory research and on-site inspection.
5. Conclusions
This study establishes a swept-frequency eddy-current-pulsed thermal tomography (ECPTT) framework for the quantitative characterization of multilayer buried RCF cracks in rails by synergizing frequency-modulated electromagnetic excitation with spatiotemporal thermal feature extraction. The conclusions can be drawn as follows:
PCA enables precise discrimination of crack layers through depth-resolved thermal signatures: PC3 captures deep-layer anomalies and can clearly detect the information regarding the number of defect layers, while PC2 gradient magnitude mapping reconstructs defect contours with sub-millimeter accuracy (<0.5 mm error). Crucially, multi-frequency synergy (17 kHz for deep defects, 31 kHz for shallow layers) overcomes the depth-resolution trade-off inherent to single-frequency detection.
Under swept-frequency excitation, the differences in thermal response characteristics among various types of buried defects can be summarized as follows: Triple-layer defects exhibit 6% higher TSR values and 11% greater peak temperatures versus single-layer defects due to cumulative thermal resistance. PC1 variance contribution increases by 8.3–12% for to inclination shifts, reflecting amplified eddy current distortion. Heating/cooling rates decrease by 26–28% when burial depth increases from 0.5 mm to 1.0 mm.
Buried defects exhibit non-monotonic dual-peak thermal responses (maxima at 17/31 kHz), diverging fundamentally from surface defects’ monotonic behavior. This study discusses and analyzes the correlation between frequency and the effects of lateral thermal diffusion and vertical heat conduction during the heating process of buried defects under swept-frequency excitation. Low-frequency regimes (6–17 kHz) are governed by eddy current redistribution concentrating Joule heating at defects; meanwhile, beyond 17 kHz, vertical thermal resistance forces lateral heat diversion, accelerating energy dissipation—validated by the doubled cooling rate enhancement at matched conditions.
Critically, the ECPTT system demonstrates significant potential for in situ railway inspection: its core components (a lightweight excitation coil and a compact infrared camera with 480 × 640 resolution) feature excellent portability, compatibility with track geometry, and require only a 0.5 m clearance above the rail head for operation. Its non-contact nature avoids interference with train operations, while the optimized PCA-TSR algorithm enables real-time processing at 10 frames per second, achieving sub-millimeter precision in contour localization of buried defects and supporting integration into mobile inspection platforms for continuous scanning.

