Article

A Possible Tram–Train System Covering Bratislava Old Bridge—Petrzalka Railway Station

by
Tibor Schlosser
1,
Gabriel Bálint
1,*,
Matúš Korfant
2 and
Peter Schlosser
3
1
Department of Transportation Engineering, Slovak University of Technology Bratislava, 811 07 Bratislava, Slovakia
2
Magistrate of Capital of Slovakia Bratislava, 814 99 Bratislava, Slovakia
3
DOTIS Consult, Ltd., 851 03 Bratislava, Slovakia
*
Author to whom correspondence should be addressed.
Appl. Sci. 2025, 15(16), 9042; https://doi.org/10.3390/app15169042
Submission received: 23 June 2025 / Revised: 21 July 2025 / Accepted: 29 July 2025 / Published: 15 August 2025
(This article belongs to the Section Transportation and Future Mobility)

Abstract

Bratislava is currently experiencing massive development, and its developers are very active. As the city develops, the improvement of its public transport becomes increasingly crucial. Public transport (PT) must be ecological, economical, and accessible to all social groups of the population. Bratislava currently has the opportunity to change the modal split in favor of PT and thus end the decline that began in the early 1990s. Rail transport is an ecological type of PT incorporated into smart cities, contributing to city land use. The current PT rail track in Bratislava comprises tram and train infrastructure. Trains ensure the transportation of people from the municipalities surrounding Bratislava, while trams ensure the transportation of people within the city. Tram and train PT must be merged, as their integration could improve traveling times. Bratislava is suitable for the creation of a dual rail transport system covering the urbanized area. The goal of this article is to present a technical solution for a double-gauge system for operation, considering traffic engineering and planning to aid decision making. Considerable professional and expert work was undertaken, in contrast to the political administration’s “decision making”. Cases from Central Europe are presented.

1. Introduction

For economic reasons, PT lines cannot be introduced everywhere; therefore, when planning PT lines, transfers from one system to another must be considered. For the passenger, attractive PT does not require transfers. In Bratislava, this passenger preference is based on empirical experience from surrounding municipalities. Therefore, people prefer not to use PT and continue using private cars, despite the time spent waiting in queues. In some cases, removing transfers is possible with edge-to-edge platforms in rail transit. Alternatively, a conveyance transport system may be adopted, even for railways and urban tramways. In response to the demand for improved mobility in metropolitan areas, in the 1990s, Europe saw the development of a new transport system known as the tram–train system [1].
Many passengers take the train to Bratislava for their daily commutes. If passengers wish to use tram transport, they must make a transfer. Transfers can take a couple of minutes, while some cover hundreds of meters, complicating accessibility. Another disadvantage is that passengers must wait at the stop or platform for the next connection. In some cases, transferring can be removed by introducing a tram–train (TT) system or building an intercity tram rail track to Bratislava’s surrounding municipalities. This advancement could improve overall transportation, streamline commuting, reduce the reliance on personal vehicles, and enable efficient and convenient transportation for passengers. Therefore, it could promote more sustainable transport habits and strategically discourage private car use [2].
Combined tram–train networks have been developed in Germany and France. In most European cities, the gauge of tram lines measures 1435 mm. If a 1435-mm-gauge tram–train system is introduced, the only obstacle to suitable tram and rail lines is the vehicle wheel profile. In Bratislava, the gauge measures 1000 mm, and the tram–train system will need to be designed with a gauntlet track of four rail strings. This is similar to the tram–train system in Krefeld, Germany. It is economically advantageous to use existing railway track connections on the original tram network to implement tram–trains (TTs), which are hybrid vehicles that can traverse railway infrastructure and urban tracks.
A TT track resembles a classic tramway. The widths of the grooves in the tram rails must also be considered, because tram–trains have railway wheels with a wider band. A smaller chassis distance for classic trams allows for arches with a smaller minimum radius on a classic railway line. Many details must be considered, such as different vehicle widths (TT 2650 mm, tram 2500 mm), platform edges at stops, switches, etc. Problems associated with these details of the Bratislava system are resolved in [3,4], where we present a double-track system considering a narrow gauge (1000 mm) for the tramway and a normal gauge (1435 mm) for the tram–train.
Land operation issues are also resolved in [5,6]. A significant benefit of so-called “sustainable mobility” is a change in the modal split in favor of PT. Relevant analyses are presented in [7,8]. This applies to the city’s territory and also affects the suburbanization of Bratislava and surrounding areas up to 50 km from the city center. The land operation principles of public rail transport were defined in 2011, when the city asked the State and EU about the possibility of financing the project with EU funds [9]. Strategic and technical solutions were defined by 2010 [2], and the Directorate General for Transport in the EU at that time assured Bratislava that sustainable transport and a PT development system linking the main railway station through the city center and the Danube River towards Austria and Hungary was possible. This will be a significant cross-border project for three states and, in particular, a sustainable solution that will benefit operations in Bratislava and support its agglomeration. Tram–trains have been in operation since the 1980s in Zwickau (Germany) and since the 1990s in Karlsruhe (Germany), which represent the best examples of successful cases. Moreover, other TT systems have been planned (or are operated) worldwide, albeit mostly in Europe [10].
In this paper, we aim to highlight the following:
  • The complexity of servicing the built-up area and its agglomeration via urban rail;
  • The possibilities of linking a combined double-gauge system comprising 1000 and 1435 mm gauges—in this case, we examine the urban tramway and the railway infrastructure from a technical point of view;
  • The comprehensive traffic modeling of the city’s PT system to support the proposal, considering a change in the modal split, diverting the use of automobile transport towards PT.
The theoretical foundations lie mainly in examining technical solutions for the integration of the railway line with the tramway, which mainly concerns the rail type. The next problem is the vehicle wheel flange details. For traffic modeling, a stable but robust PTV system is used, as has been used in Bratislava for more than 20 years. The novelty is that a unimodal model for public transport is promoted, into which basic and accurate tram driving parameters from on-board units are fed.

2. Bratislavan Tram–Train Network Development Strategy

Throughout Bratislava, the capital of the Slovak Republic, there are 80 km of 1435-mm-gauge rail tracks, which support the railway. Not all are in operation. The objective of this study is to demonstrate a technical solution, and route alignment is not developed to the level of detail required in design documentation. The aim is to demonstrate a technical solution, after which the city of Bratislava may begin to conduct a comprehensive feasibility study encompassing economic assessment and other technical solutions. BRT is not used in Bratislava. Historically, Bratislava has always had double-track public transport lines, in line with the development of the city. According to a technical and economic study [3], conditions for the following were examined and defined:
  • The design and implementation of parallel-operated railway and tram transport infrastructure;
  • A suitable “designed vehicle” type;
  • The risks and uncertainty resulting from the design, implementation, and operation of transport infrastructure considering the common operation of rail and tramway vehicles;
  • An estimate of the investment and operating costs;
  • An assessment of the economic parameters of the construction.
Basic conditions for the development of conceptual, transportation, operational, building, and technical solutions were considered alongside these operating conditions:
  • A permanent railway vehicle (tram–train) will be built within a construction with “linking corridors” with train lines from Petrzalka:
    A railway station from Bratislava to Filiálka (the subject of the current study) to the Bratislava–Predmestie railway station, possibly followed by continuing movement through the region (Raca borough, Pezinok, Trnava);
    A railway station running from Bratislava to the Nove Mesto borough, Podunajske Biskupice borough, and Dunajska Streda;
    Movement from the Vajnory borough towards Galanta and Nove Zamky (this is a complete review of the Bratislava agglomeration).
  • Locomotion in the opposite direction, from Petrzalka railway station, with possible extension to Austria and Hungary.
The permanent, simultaneous operation of the tramway and railway (train) studied is described as a “dual operation”, where the tram–train vehicle is combined with the city’s surface tram network.
The proposed transit rail infrastructure is reflected in construction objects and operational frameworks. The operation of rail and tram track rolling stock must comply with the following basic (characteristic) technical parameters.
Tramway track:
  • Gauge: 1000 mm;
  • Maximum boarding edge height: 300 mm above the railhead;
  • Traction power system: 750 V DC (at current lines 600 V DC);
  • In common (railway) infrastructure sections, the direction and high-rise route (rail track) design must comply with ON 73 6412 [Geometric position and track arrangement of 1000 mm gauge tracks];
  • In sections outside the common (railway) infrastructure, Standard STN 73 6405 [11] [Designing of tramway tracks] can be used.
Railway track:
  • Gauge: 1435 mm;
  • Traction power system: single-phase 25 kV/50 Hz AC;
  • Maximum boarding edge height: 550 mm above the railhead, with sliding steps at floor level for railway platforms; at the tram stops inside the city, the coach will have a 300 mm step;
  • Maximum axle pressure: 18 t (after testing, that of the TT was defined as 12.5 t);
  • Minimum arc radius: 300 m;
  • Platform length: 80 m (120 m for selected stations); for tram stops inside the city, a maximum platform length of 70 m;
  • Track speed: 80 km.h−1;
  • Cross-section UIC-C;
  • Lightweight station and track security devices;
  • Track equipped with ERTMS (ETCS LEVEL 2, GSM-R);
  • The direction and high-rise route design must comply with STN 73 6360 [12].
Traction power supply system:
  • In order to run on railway or metro lines that have been electrified to a higher voltage, it is necessary to adapt the existing vehicle traction devices to dual voltage [7]. This issue is also described in [10].
The aim of [3] was to define a recommended technical solution while establishing the economic parameters of the infrastructure for the emergence of a modern, integrated rail transport system using common railway and tramway infrastructure. The study described the transport technology and economic evaluation with respect to achieving a modern technical solution and construction feasibility for all affected structural objects (track bottom, upper track, solid traction equipment, railway security devices, notification equipment, stops, platforms), ensuring that they complied with the applicable technical conditions, regulations, and standards. In addition, the infrastructure will simultaneously serve the railway and tramway (dual system); thus, the structural objects concerned must meet the technical conditions for both pathway systems. The time horizon for the initiation of each pathway may not be identical. All relevant details for different track gauges (1435 versus 1000 mm) were considered, as well as the “rail–wheel” relationship, and a dual operation analysis was conducted.
Tram wheels in Bratislava are of the TRAM DPB type, with a 1:40 bevel on the wheel surface. The maximum wheel flange width is 28 mm. The gauge of the classical railway is 1435, and the wheel profile on the classical railway is UIC-ORE, which is used in other countries as well. The surface of the wheel on a classic railway is inclined twice at ratios of 1:10 and 1:20. The maximum width of the wheel flange is 32.5 mm. Both rail wheel profiles are suitable for S49 Vignole rails. For tram wheels, narrow-grooved rails are used, and, for classical railway wheels, wide-grooved rails are used. For Bratislava, a gauntlet track with four 1000-mm-gauge rail tracks for trams and 1435-mm-gauge rail tracks for tram–trains is proposed. For cities that possess a normal-gauge tramway of 1435 mm and are planning a tram–train system, developing a tram–train wheel profile suitable for 1435-mm-gauge tramways and conventional railways is advised. This issue is described in [8]. There is also an effort to develop a wheel profile for the tram–train that is suitable for wide-groove rails and rails on conventional railways. The design company Reming Consult has been working on resolving this issue. This firm has designed a new wheel profile for the tram–train under the working name Tram Reming. The wheel surface is inclined at a ratio of 1:40. In [8], a wheel profile for the tram–train is generated using a generic algorithm. The problem is that, according to this newly developed wheel profile method, it is probably necessary to change the formulas for the calculation of the curve radius design and superelevation. Changing the wheel profile may affect the spacing of the wheel rolling rings. This is the distance of points at which the wheel makes contact with the rails. There are formulas for the distance of the rolling circles to calculate the superelevations and radii of curves. The authors of this publication prefer the wheel profile design for tram–trains developed by Reming because it does not affect the formulas given in the track design standards. Bratislava is unique in that, if the TT system is implemented, the tracks will not be shared by trams and TTs.

Modal Split Problem: Personal Dynamic Car Traffic and Modal Split

To estimate the probable benefit of PT in a modal split, especially for rail PT represented by dual-gauge tramway and TT operation, a huge traffic survey and unimodal traffic model were created, according to [13,14]. The summarized results are shown below. The aim was to quantify the passengers who would use the Carrying Public Transport System (CPTS), which, in the Bratislavan context, is denoted by the rail track infrastructure presented in [15].
Using the unchanged bus line network in the Petrzalka borough was crucial to the model. Thus, the average daily traffic (ADT) value of passengers using bus PT maintains the modal split value for future scenarios as well. Adding comparisons of different schemes, such as various route directions and departure frequencies, is recommended. In Bratislava, the usability of about 80 km of railway lines in connection with tram lines is strategically examined to achieve a network structure to serve the city’s territory and its agglomeration. Alternatives to rail solutions are not considered in the Bratislavan land use development plan. At present, only the tram network is implemented on radial lines in the radial–circular system of the city. In the past (for more than 40 years), the possibility of an underground railway was examined, but this did not come to fruition because of the economic challenges of serving the area.
The development of car transport in the Petrzalka borough exhibits an unsatisfactory trend, mainly due to bridges connecting the left and right banks of the Danube. In passenger transport, the constantly increasing mobility requirement for the population increases the average number of routes per day/inhabitant, while the length of the journey increases significantly. However, with the continuous growth in car use, the problem of territory becomes more pressing. Without the CPTS, the Petrzalka borough will collapse.
Modeling various zones indicated that the construction of other zone units in Petrzalka—Petrzalka City, Matador, Southern City, and New Lido—will bring an additional 42,000 inhabitants and 40,000 employment opportunities. Reference [9] mentioned that, in 2020, the absence of CPTS public investment in the bridges over the Danube would cause a serious collapse. The data are shown in Table 1. In 2020 (before the pandemic mandates—until the beginning of March), it was noted that reaching capacity for all bridges over the Danube led to level of service (LoS) E-F saturation volumes at peak hours. In this traffic model, the first phase of the tramway link towards Petrzalka, which has been in operation since 2015, with only three stops on the Petrzalka side, was not included. Bridge traffic volumes are displayed in Figure 1. In Figure 2, the scenario with investments but without the CPTS to the south of Petrzalka is presented, showing the complete bridge traffic volumes, using the CPTS between Petrzalka and the city of Bratislava through the Old Bridge. Bridge traffic volumes with the CPTS are shown in Table 2. The difference in the average daily traffic flow and that during peak hours is shown in Table 3.
The output from the traffic model shows that up to 57,000 vehicles are used in 24 h (see Table 2 and Table 3) in the average working day. These values reflect the possible passengers using the CPTS in the modal split for the tramway without any resistance functions in the traffic model. According to [2], the personal car occupancy in Bratislava amounts to 1.2 pass./veh. With a simple degree of resistance for the model, we can use −20%—or up to −30%—of the ADT to calculate PT passengers. This applies only to the tramway track in the south of Petrzalka in the middle of the borough, with 110,000 inhabitants, and not to the TT link to the railway station in Petrzalka.
After resolving the technical and technological details, Bratislava could begin to implement the dual-gauge system, with a tram network of 1000 mm and a normal gauge of 1435 mm for TTs. The basic strategy of CPTS operation was approved by the Ministry of Transport (MoT) of the Slovak Republic, as well as the EU DG Move and Jaspers institutions, in 2012.
In Bratislava, it is already possible to use the built dual-gauge system to travel from the city center in the section from Sturova Street (downtown) towards the reconstructed Old Bridge and up to Jungmannova Street in Petrzalka, where infrastructure with a dual-gauge system—with wide-groove rails for 1435-mm-gauge railway wheels and rails for tramway wheels of 1000 mm in length—is present, spanning 2.4 km. This construction was completed in 2015. Since 2014, after a change in city management and a political (not professional) decision from the city level with the support of the MoT, the state and municipality administration stopped work on the dual system. Moreover, after changes to the team at the EU institution in Brussels, the experts from DG Move and Jaspers did not continue to contribute to the modern and meaningful integrated rail transport project. The original feasibility studies [3,4] that resolved the technical and economic details clearly demonstrated the following:
  • The creation of multiple individual radial connections of railway lines entering the city;
  • The ability to link integrated rail transport on the tram track network using the tram–train double-feed vehicle, as well as operating them on the railway infrastructure;
  • The necessity of requirements for the implementation of the subsurface north–south interconnection at the future Filiálka railway station.
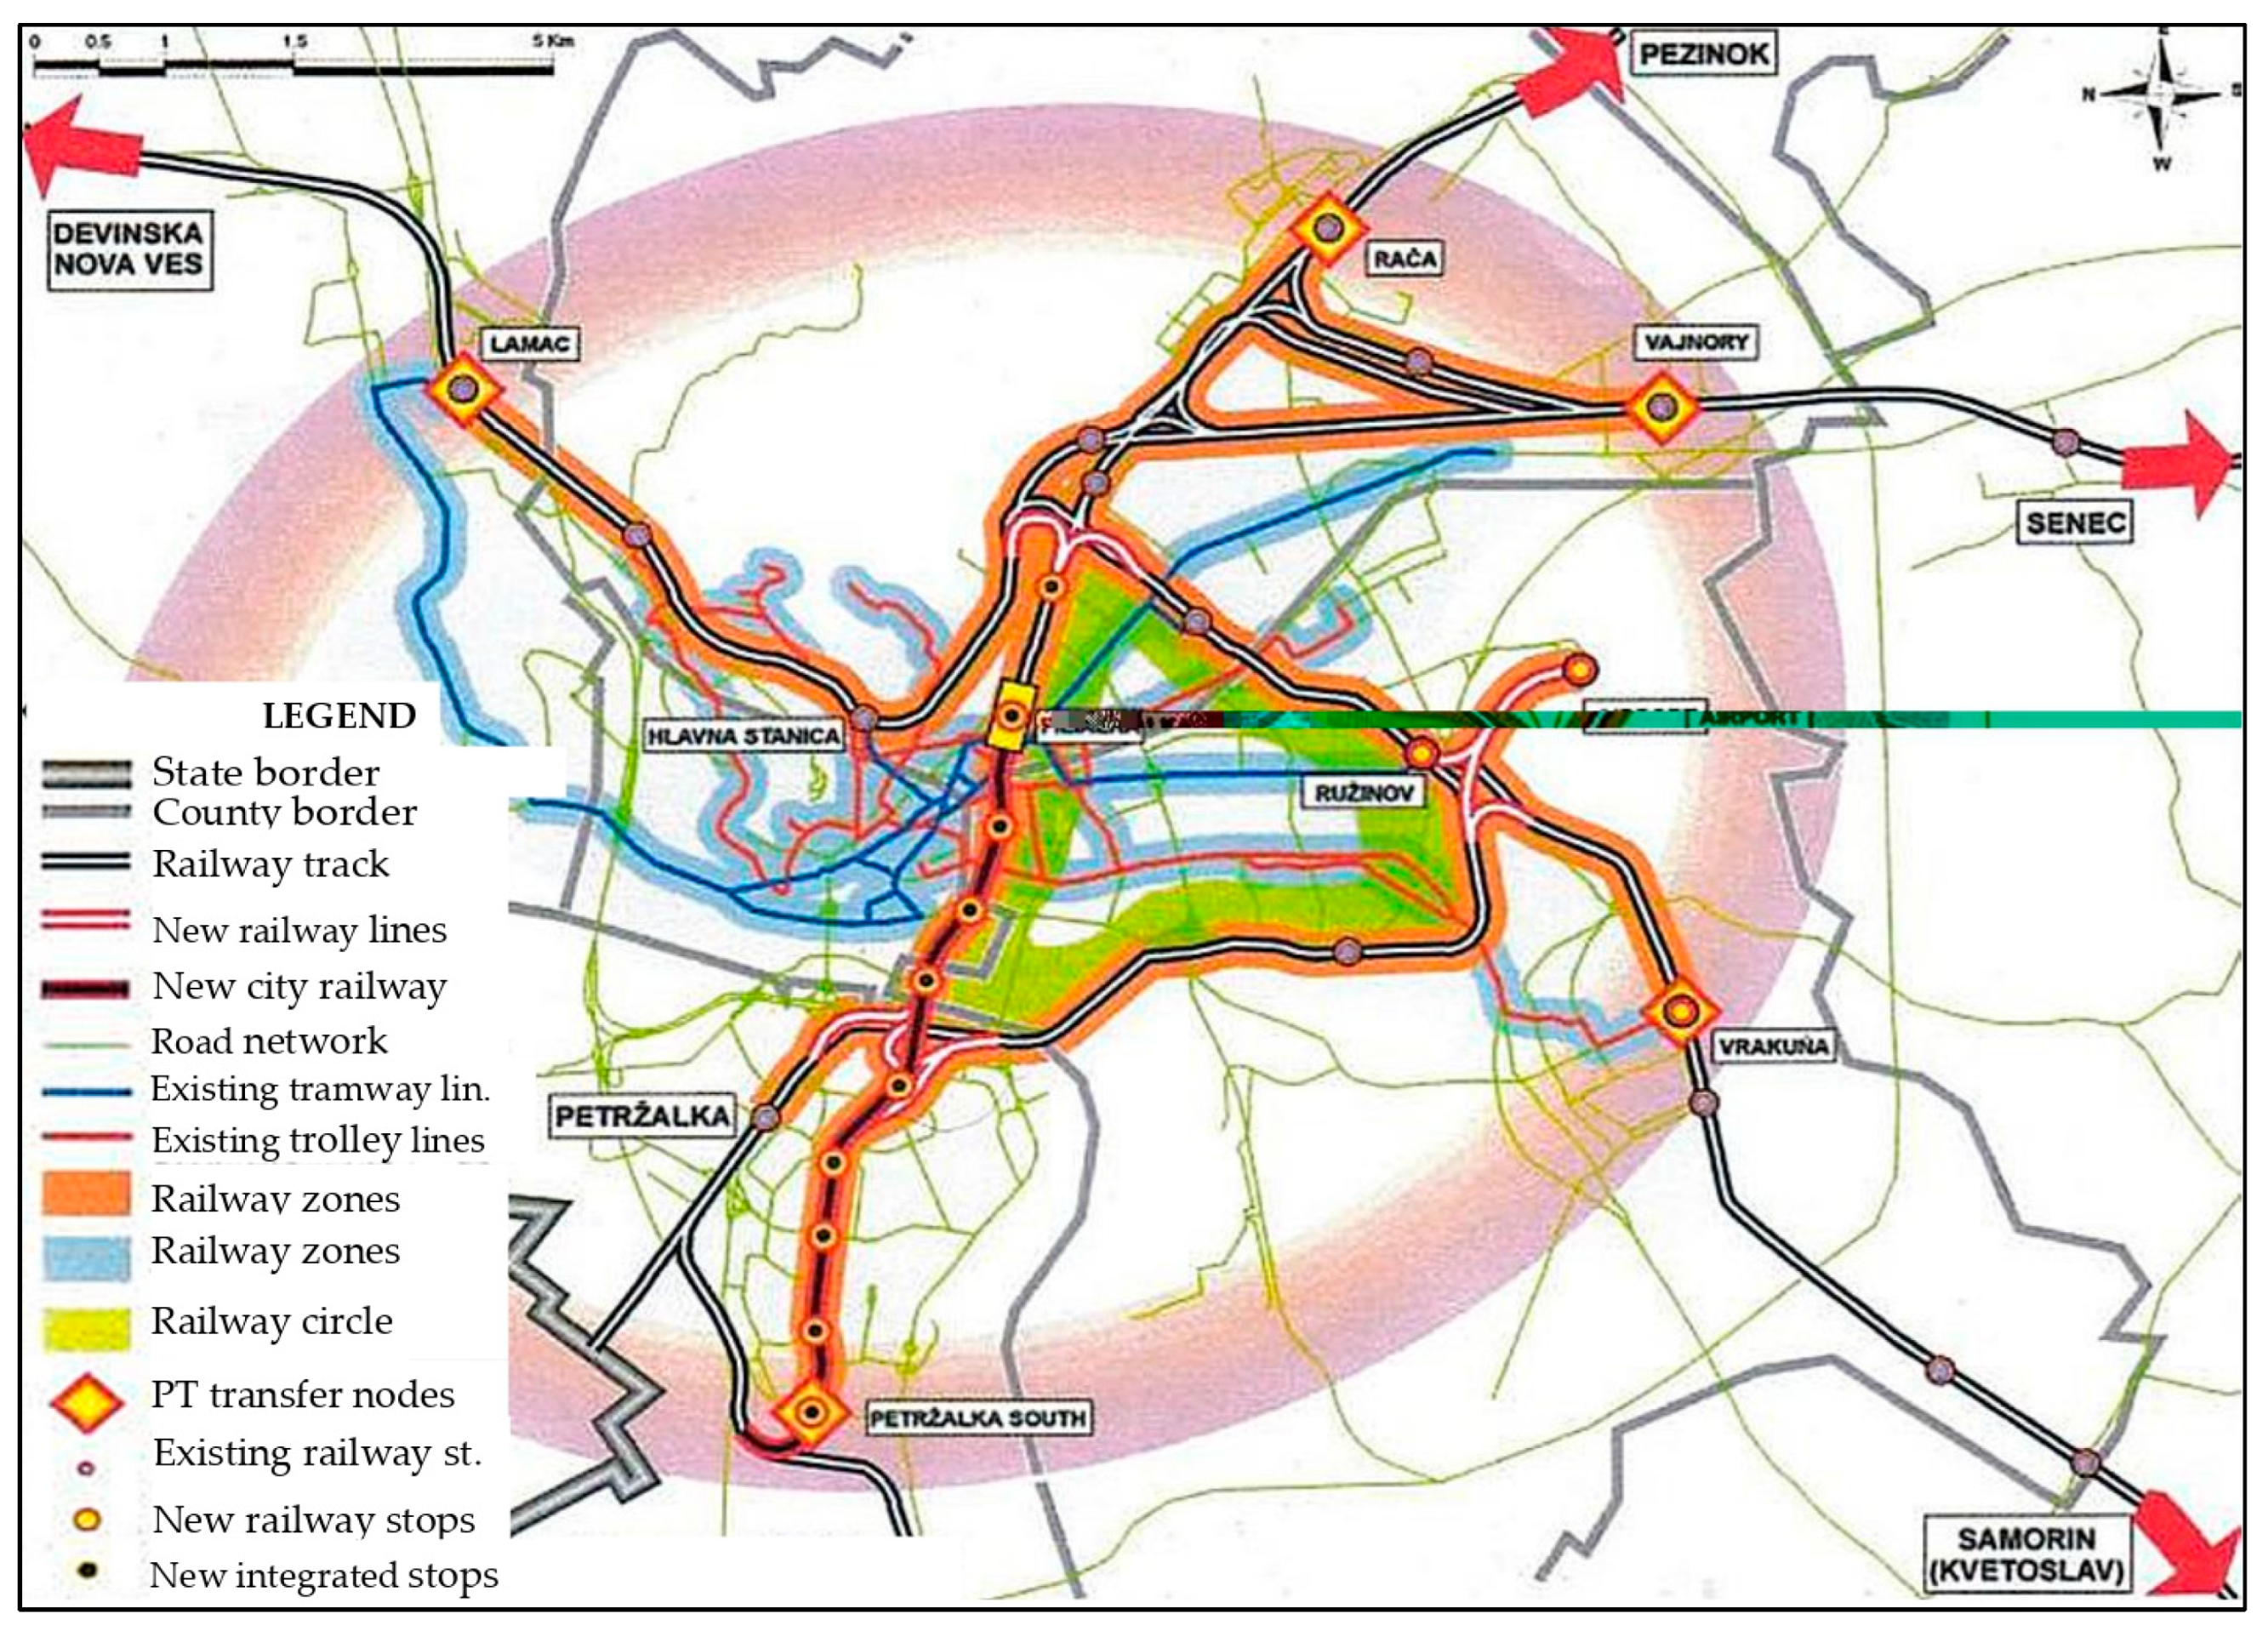
The TT scheme network and its operation in the city and the agglomeration are shown in Figure 3, derived according to [5]. Black double lines indicate the main railway infrastructure directions, blue lines denote the current tramway lines, and red indicates trolleybuses. The future network of TTs is represented by orange lines, and they can be directly connected to the railway infrastructure.

3. Proposed Tram–Train Route for the Filiálka–Petrzalka Project

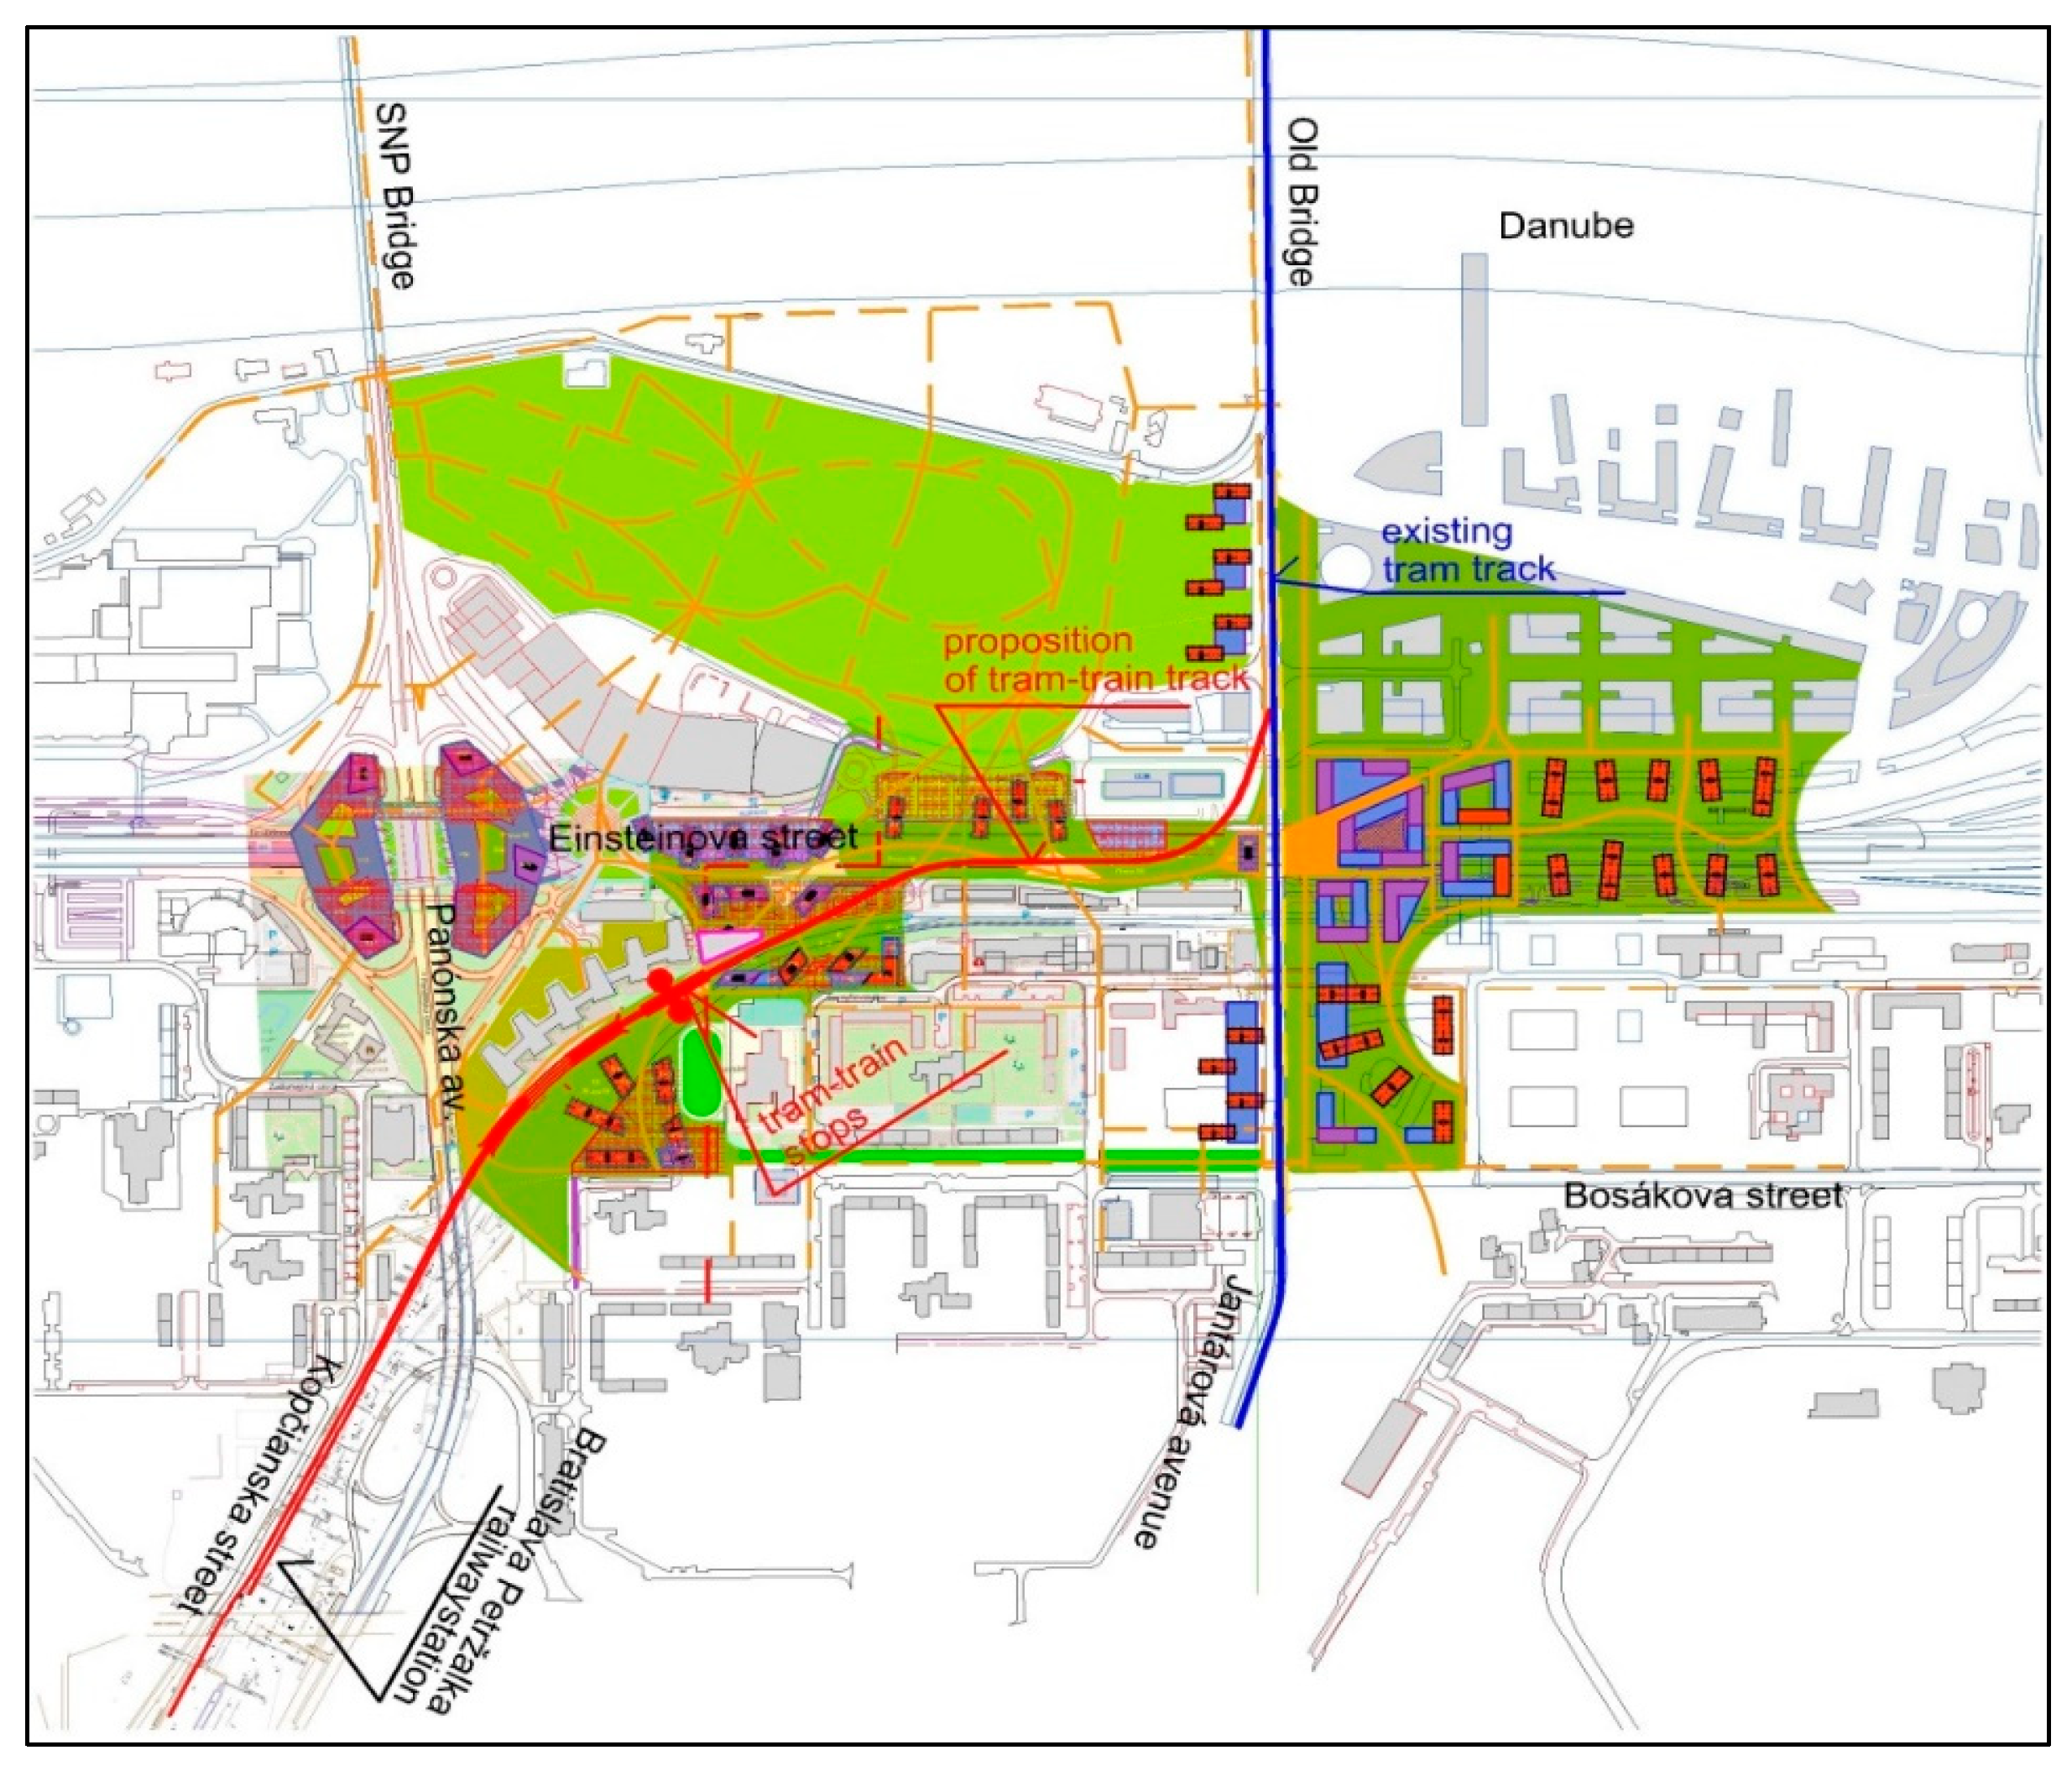
The basic documentation from the study on Upper Bridge Einsteinova Street, prepared by the design company [16], was used to design the TT route from the Petrzalka railway station. This project involves the construction of a large plateau with new functions for the Digital Park shopping center and administration and the Aupark multifunctional shopping center. The original design of the study is shown in Figure 4 [16].
The proposed route for the TTs is connected to the newly built tram line with a dual gauge in urban Petrzalka, in the embankment in front of the flyover over the D1 motorway on Einsteinova Street behind the Old Bridge. The track for the TTs is situated on the proposed plateau above the D1 motorway on Einsteinova Street. TT stops are proposed behind the Digital Park building. The route continues along the ramp below the road overpass and is connected to the existing Petrzalka railway station. The proposed track for the TTs is in a modified plateau above Einsteinova Street, as shown in Figure 4. Figure 5 also displays the Petrzalka railway station for context [17].
From the Old Bridge, with a dual gauge, it is possible to continue with the TT route towards the existing Filiálka railway station. The renewal of the Bratislava–Filiálka railway station in the northern part of the city center is also planned. This station will be used only for regional rail transport by the Slovak railways [18]. The interchange node of Filiálka is the subject of further detailed proposals, the essence of which is to create a pedestrian connection between the existing underpass on Trnavske Myto to the PT terminal and the future underground Filiálka railway station. This will connect to the tram PT. Movement from the underground rail station to the tram (TT) will occur in the underground, without interfering with surface road transport. City bus and trolleybus PT will be located closer to the underground station. This interchange node should be of state and regional importance, providing a transfer between external rail transport and urban PT [4].
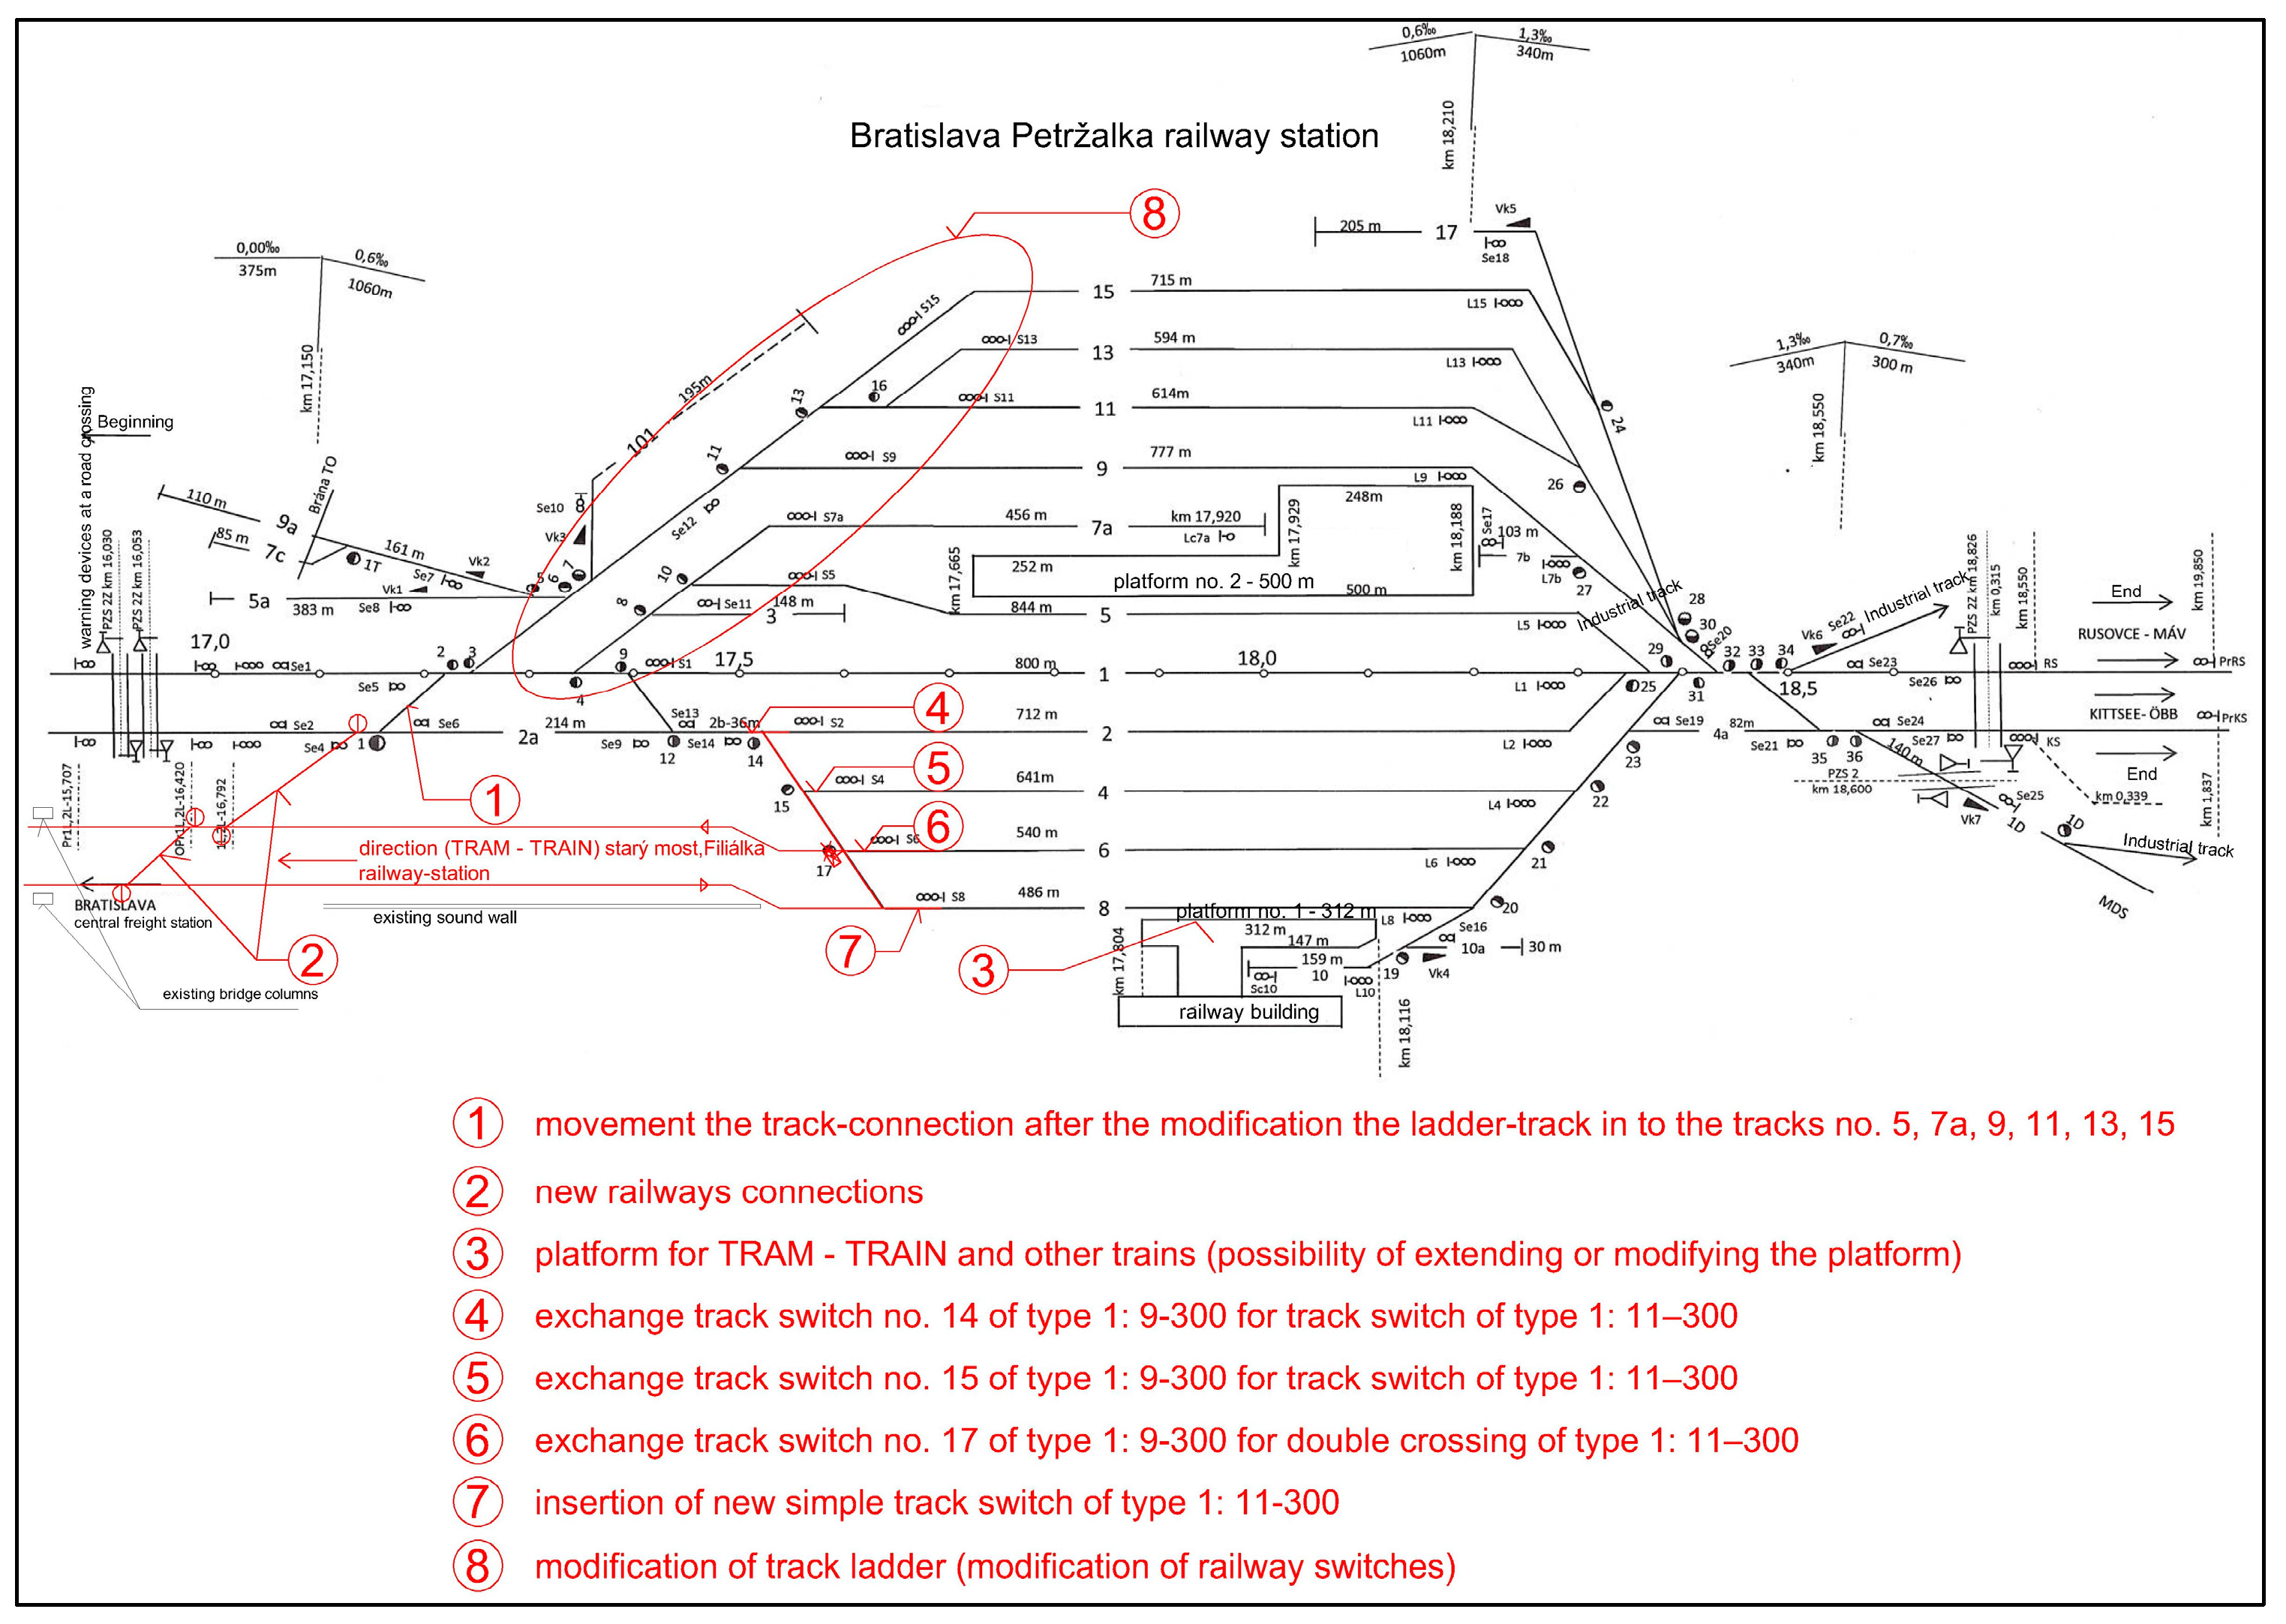
The rail line for the TTs will be connected to the Petrzalka railway station. A diagram of the connections is shown in Figure 5.

4. Transport Model Scenario of Modal Split for New Tram–Train Line

Part of the TT track proposal also includes an assessment of PT in the urban transport model. In general, the macroscopic transport model is used to determine the optimal transport system scenario for a city or region’s development. The main purpose of the transport model is to analyze the current problems in transport and to predict the future state of service in the area [19]. The general systematic issues in the integrated PT system are detailed in [20]. Approaches to nodes–railway stations and PT stops were compared according to the rules in [21]. Macroscopic transport models are often used as tools to qualify various projects and find the most appropriate solutions to transport problems.
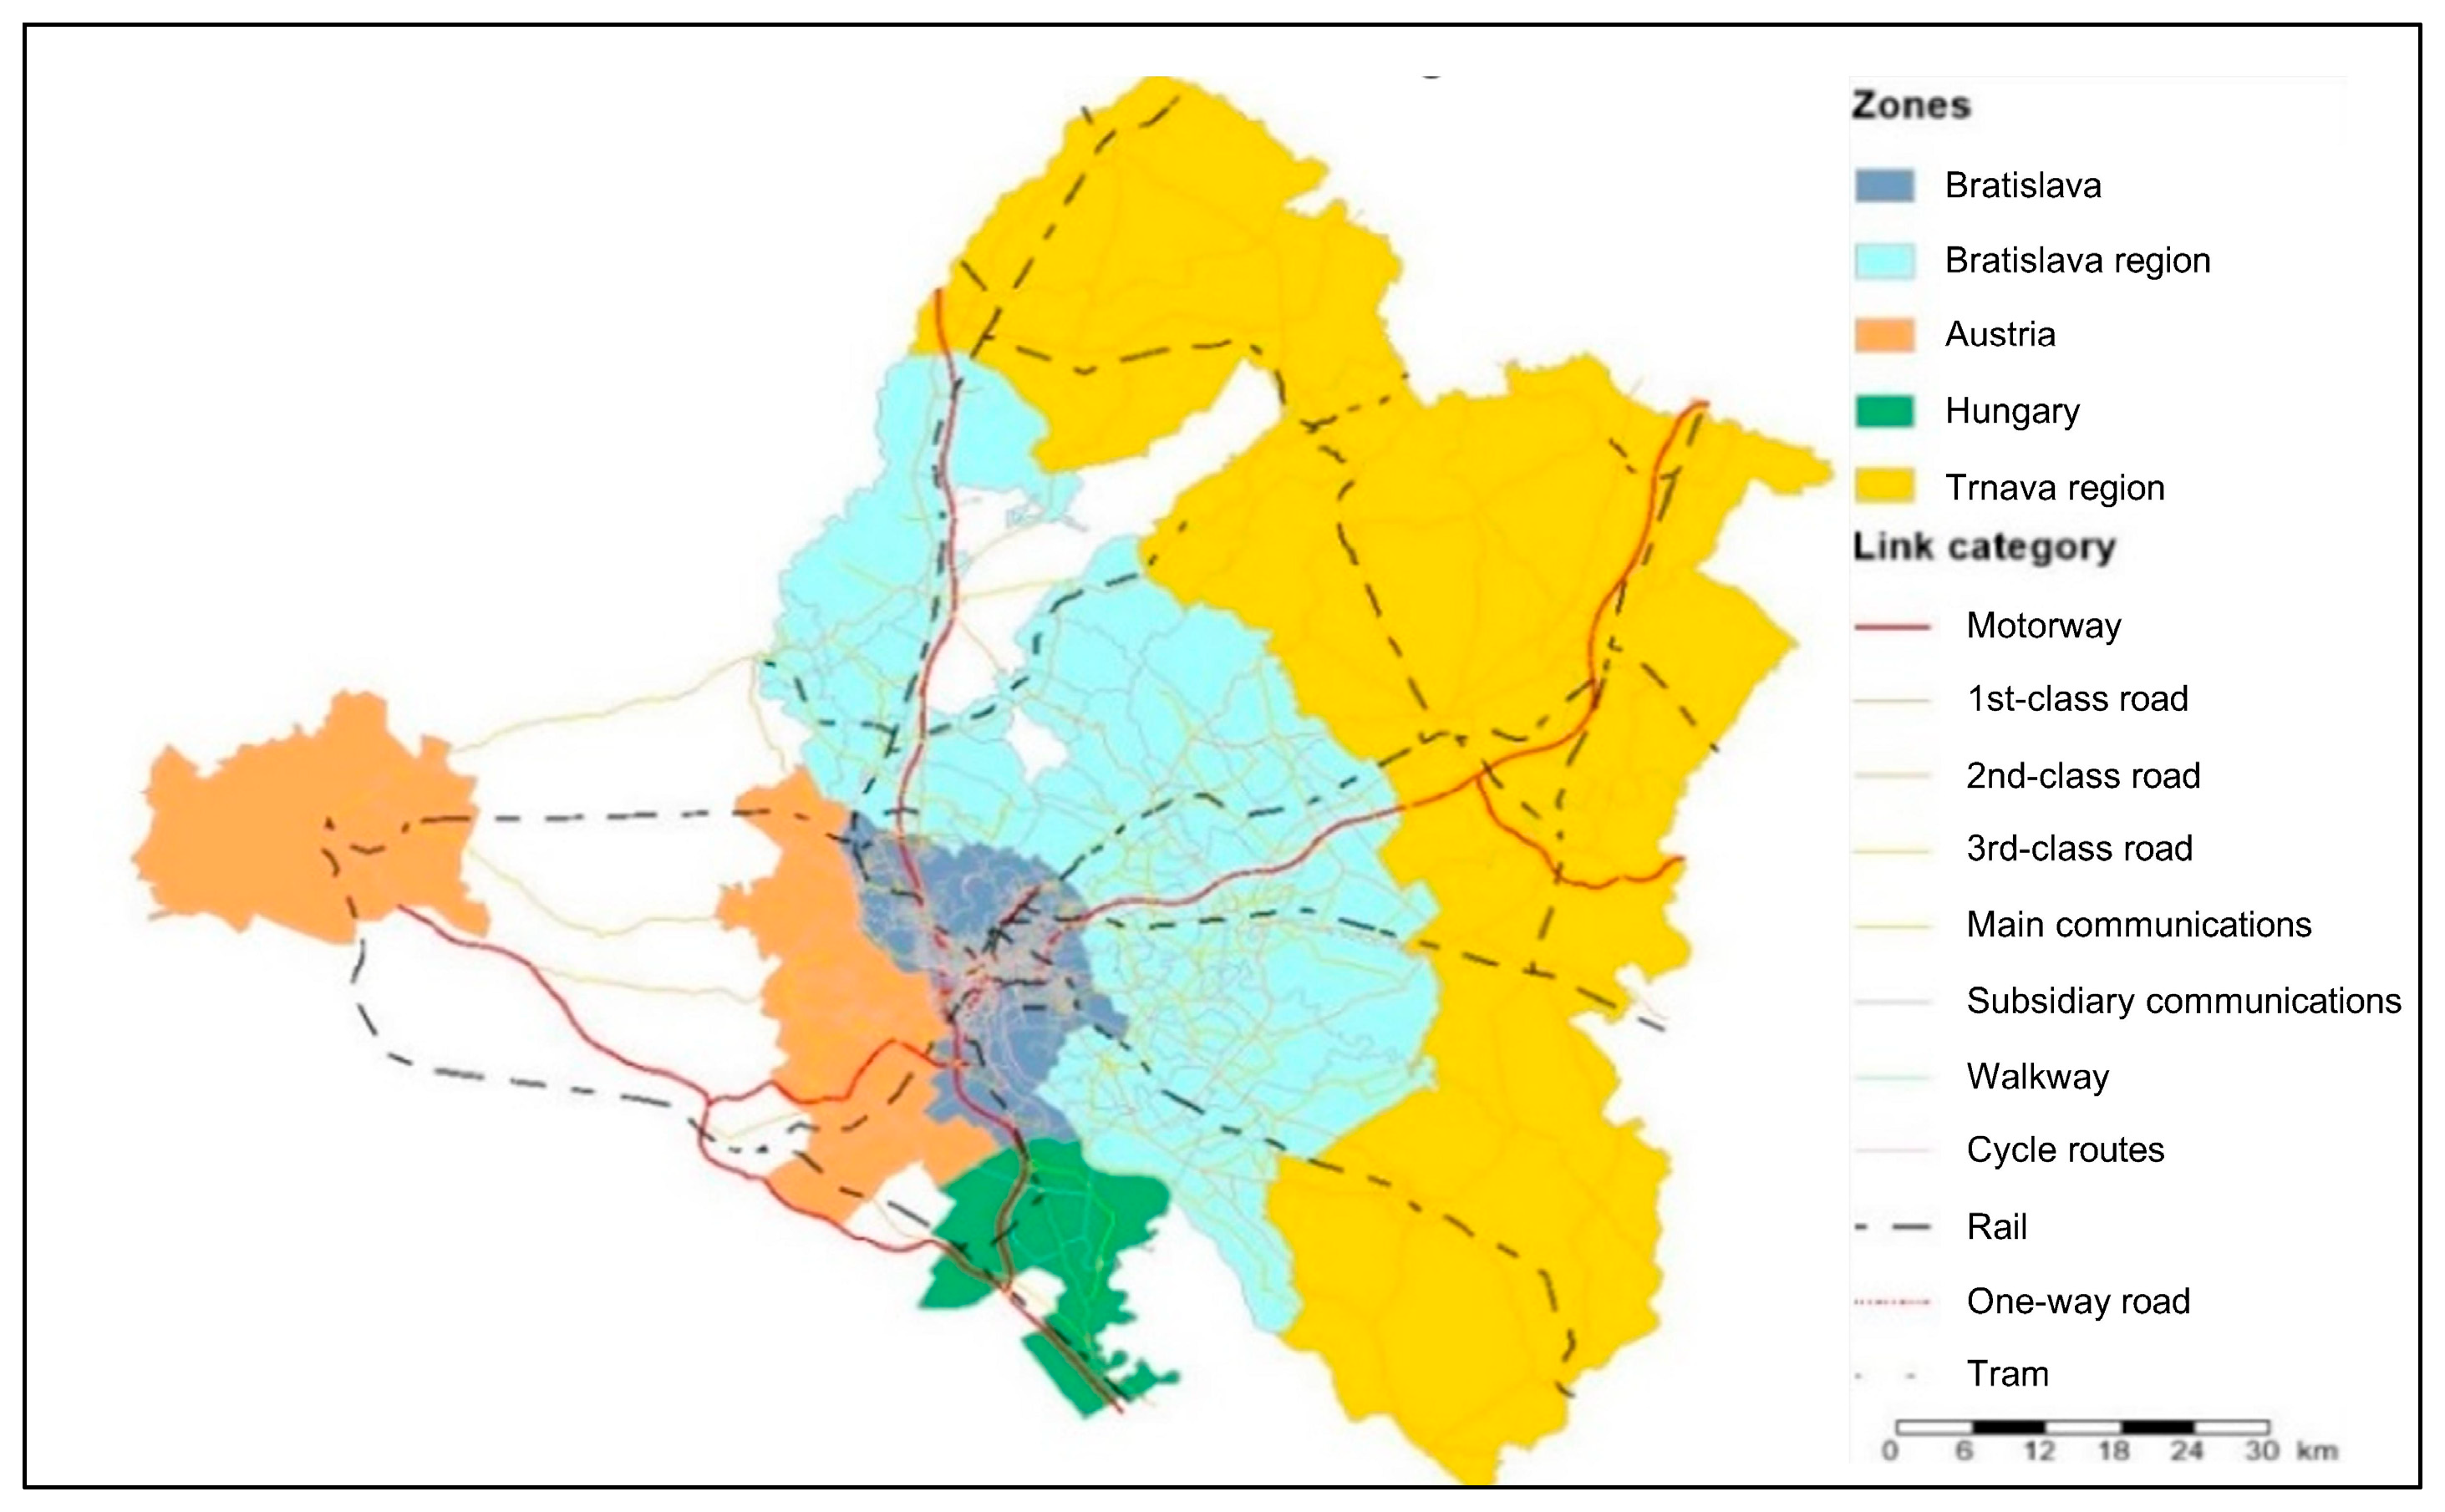
Bratislava’s traffic model and its region are processed in the transport planning software PTV VISUM [22]. The design of the zonal structure of the transport model is based on the definition of territory for the transport model and consists of internal and external zones. These zones serve as origins and destinations for journeys made within one day (or part of a day). The area of Bratislava has 263 internal zones in the transport model, which correspond to basic settlement units.
The external zones include the municipalities of the catchment area of the capital and further aggregated municipalities in more distant areas. In Slovakia, the model covers the entire Bratislava and Trnava regions, which represent 347 zones. The model also includes 16 zones from Austria (part of Lower Austria and Burgenland) and five from Hungary (Moson). At the edges of the region, the model enters/exits traffic using so-called cordon zones. Figure 6 presents the transport model of the city of Bratislava according to [23].
The construction and use of a predictive multimodal transport model depend on the availability of data from many different sources. The data that were used in the process of building and applying this transport model are summarized as follows:
  • Automatic traffic counter (ATC) traffic survey;
  • Static traffic survey;
  • Directional traffic survey;
  • Urban public transport traffic survey;
  • Data on demography;
  • Data on land use;
  • Traffic demand survey data.
A comparison of the modeled and survey-based traffic intensities was performed to validate the individual car traffic results. A total of 110 ASD survey census profiles were included in the comparison.
  • Validation of the number of people transported by public transport
Validation of the results from the predictive transport model for public transport was carried out by comparing the numbers of transported persons from the public transport survey and the modeled values for selected sections of the transport network. These sections were selected in such a way that only those in which the survey was processed completely, in terms of affecting all connections during the day, were taken into account. If a certain line or connection was missing in a section, this section was excluded from the validation process due to the impossibility of comparing the aggregated numbers. At the same time, only sections where more than 2500 persons were transported per day (whether this value was from the survey or modeled) were included in the validation process. In total, the comparison was carried out on 19 sections for tram and trolleybus lines.

Design of Traffic Model—Standard Four-Step Model

  • Trip generation
Trip generation is calculated for both variants of the standard four-step model in a separate procedure. In this stage, the production and attraction rates are calculated for each zone and each demand stratum. These parameters are also called productions and attractions. Productions correspond to either the actual origin traffic of the zone, i.e., the number of trips starting there, or the attractiveness of the zone for the demand stratum, meaning that they have an influence on the probability of trips starting in that zone with the next trip distribution procedure. Determining which of the two cases applies can be achieved through the trip distribution parameter. The same holds for destination traffic.
The productions of a demand stratum in a zone depend on its structural or demographic indicators, describing the intensity of the production activity. For the production activity “Home”, the number of inhabitants of a zone—which, if necessary, can be disaggregated according to age, income, and/or car availability—can be used. For the production activity “Work”, the number of jobs may be appropriate, which can be broken down into different sectors. For such aspects, user-defined zone attributes are the most suitable. First, the production Qi of zone i is calculated with the help of the formula
Q i = g α g   S G g ( i ) ,
Whereby SGg is summed across all structural properties. SGg(i) denotes the value of SGg in zone i. The coefficient αg is a production rate that describes how many trips per structural property unit occur. We specify the production rates per demand stratum and zone attribute used. The same calculation is performed for the attraction Zj.
In most applications, the total production of a demand stratum (summed over all zones) corresponds to the total attractions:
i Q i = j Z j
Suppose that equality has not already resulted from the attributes and production rates used. In this case, it can be set by means of a procedure parameter, where all productions and attractions are scaled so that their totals are equal. As reference values, we can predetermine the total productions or total attractions; alternatively, the minimum, maximum, or mean value of both parameters can be used. We can limit the calculation to the active zones.
  • Trip distribution
The trip distribution procedure is part of the four-step model, with the sequential calculation of the steps. The productions and attractions calculated in the trip generation procedure only determine the constraints on the total demand matrix of a demand stratum. The elements of the matrix themselves are calculated in the trip distribution procedure. On the one hand, the allocation of a certain destination zone to a given origin zone is based on its attractiveness for the demand stratum (measured by its destination demand = attractions); on the other hand, the impedance of the trip from the origin to the destination zone is vital (measured by the matrices for journey times, fares, and other elements reflecting generalized costs). With these input data available, a gravity model is formulated and solved.
  • Mode choice
The mode choice procedure is part of the four-step model, with the sequential calculation of the steps. The single-step mode choice breaks down the total demand (total demand matrix) into the individual transport modes per demand stratum (for example, PrT, PuT) based on mode-specific impedance components (for journey time, costs, etc.).
First of all, for each mode m, the utility is calculated as a linear combination of the impedance parameters:
U i j m = g β g c i j m g
where “cijmg” is the impedance of the cost type g for the trip from zone i to zone j by mode m.
The respective shares of the trips of each relation result from the utilities of the different modes. Hereby, one can choose between several distribution functions:
P i j m = e c U i j m k e c U i j k
T i j m = P i j m T i j
where Tij is the total number of trips of the demand stratum in the relation i-j, Tijm is the number of trips made by mode m, and c is a procedure parameter.
There are two types of demand strata:
  • Those referring directly to a demand matrix allocated to a single demand segment or several demand segments;
  • Those whose demand matrix is not related to any demand segment.
No mode choice will be calculated for demand strata referring directly to a matrix with demand segment(s). For demand strata whose demand matrix is not related to any demand segment, it is determined per mode; to this demand matrix, the demand allocated to that mode has to be added in the mode choice.
  • Gravity model calculation
The gravity model is a mathematical model for trip distribution calculation. It is based on the assumption that the trips made in a planning area are directly proportional to the relevant origin and destination demands in all zones and the values of the utility function between the zones.
The gravity model calculates a complete matrix of traffic relations Fij, using the OD pairs of marginal totals (origin and destination traffic of the individual zones). A consistent utility matrix of the planning region is required.
The gravity model works with distribution parameters and, therefore, with values within the utility function, which map the reactions of road users to distance or time relations. These parameters are determined by comparing the demand per OD pair arising from the model with the counted demand per OD pair (calibration).
The ability of the models to predict future conditions (forecasting) depends on whether they manage to predict the behavior of road users in relation to the network impedances, as well as knowledge of the model input data applicable for the future (for example, the future travel demand).
  • General form of the distribution formula
F i j = k i j Q i Z j f U i j j
where
f U i j = e c U i j
The distribution formula is referred to as an attraction or utility function, with the following parameters:
  • Uij—a value for the utility between zones—for example, the distance or travel time from zone i to zone j;
  • Qi—the origin zone i;
  • Zj—the destination zone j;
  • kij—a scaling factor (attractiveness factor) for OD pair zone i to zone j;
  • n—the number of zones.
Determining the scaling factor kij and formulating the utility function f(Uij) are essential for various modifications and extensions.
The scaling factor kij must be chosen so that the boundary conditions of the distribution models, namely
j = 1 n F i j = Q i
And
i = 1 n F i j = Z j
are (at least approximately) fulfilled.

5. Results

A new line in the direction of Raca-ŽST Petrzalka was created in the transport model of the city of Bratislava for the needs of the proposed line route. This line route copies the line route to Petrzalka, and the continuation of this line is also shown in Figure 7.
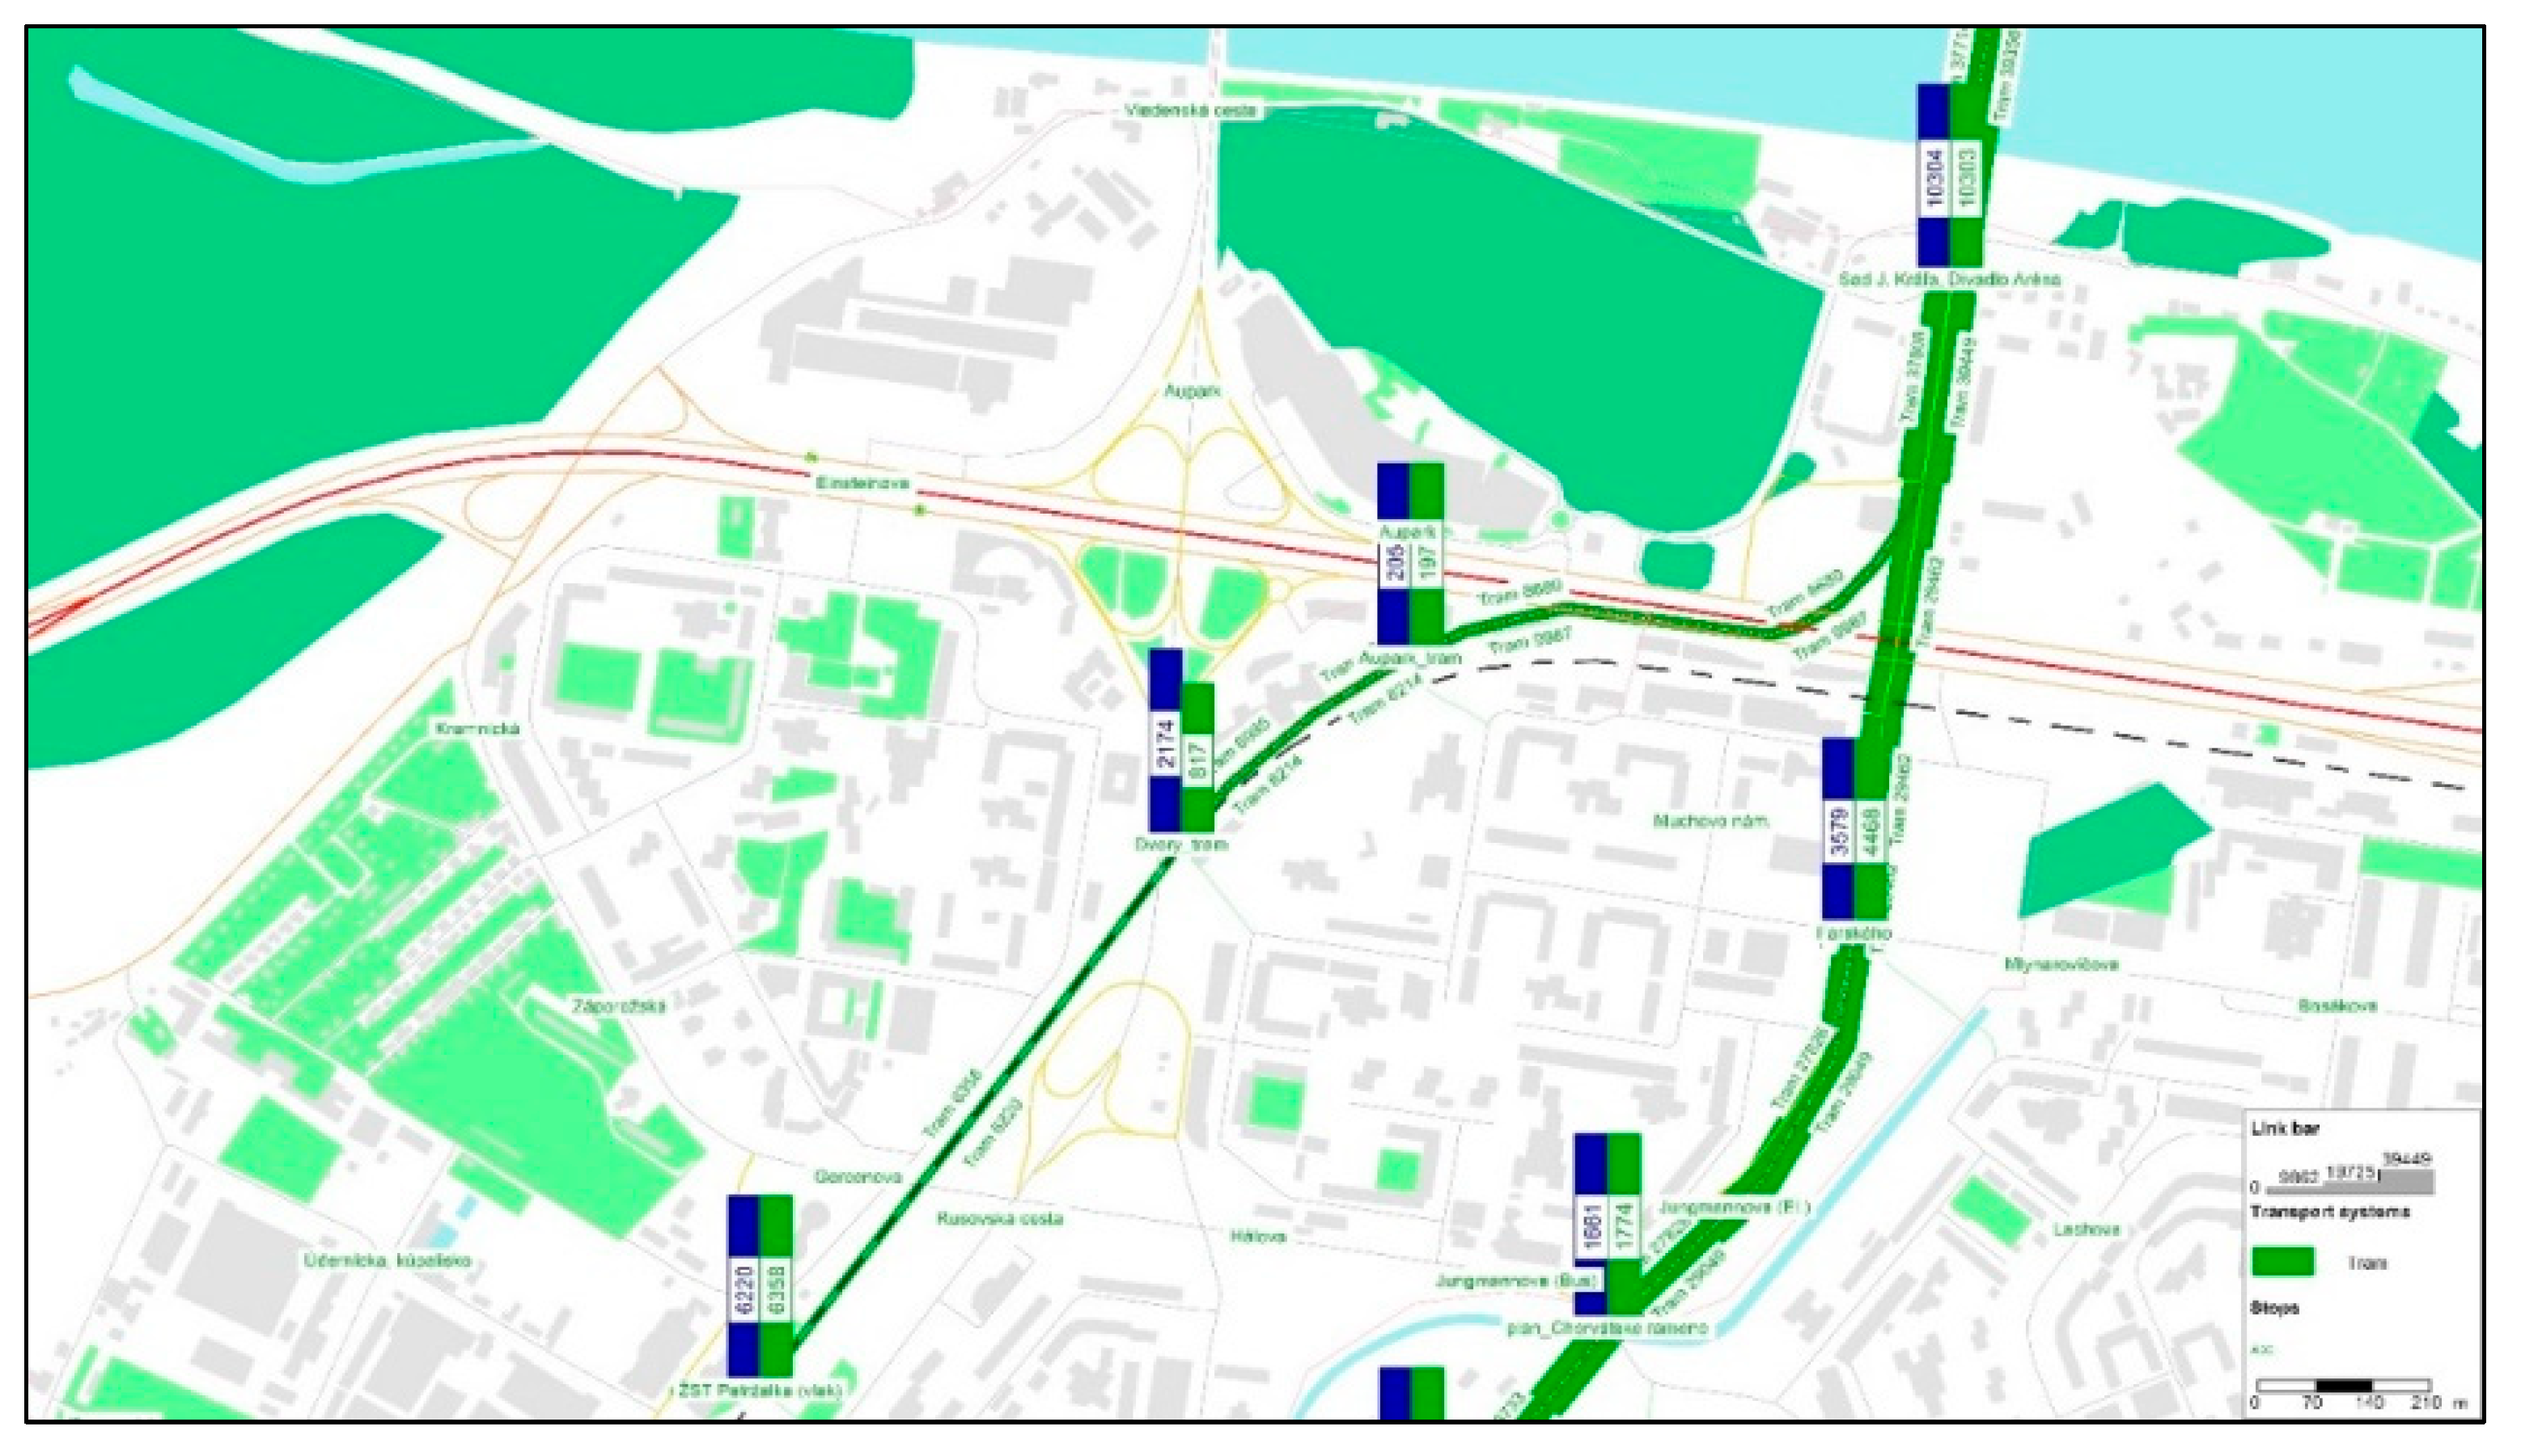
There will be two stops on the proposed line route (see Figure 4), namely Aupark (tram) and Dvory (tram), and the final stop is directly at the Petrzalka railway station (ŽST Petrzalka). The distances between the stops are as follows:
  • Sad J. Krala–Aupark (tram)—990 m;
  • Aupark (tram)–Dvory (tram)—370 m;
  • Dvory (tram)–Petrzalka railway station—860 m.
The scheme of the proposed stops, as well as the line route as an output from the PT traffic model, is shown in Figure 8. After designing a new tram line route and stops, the transport model was recalculated. The result was a cartogram of the volume of passengers transported on the tram line during the average working day. This scenario was included in the unimodal PT model. The maximum volume of transported passengers on the new tram line occurs in the section between Sad J. Krala and Aupark (tram) and represents, in the profile section, up to 18,847 passengers transported in 24 h. The cartogram of the volume of passengers is shown in Figure 8. Figure 8 also shows the number of boarding and alighting passengers at individual stops in the form of a bar graph (blue color—boarding; green color—alighting).
Figure 9 is a cartogram of the transported passengers on the tram line network on an average working day in the monitored area on the side of Bratislava. The schematic output is from the city PT model. The TT stop values in the city network are of note. These are shown in Table 4. The numbers are very high, and this could be important in decision making for the municipality of Bratislava.

6. Conclusions

In a series of technical studies devoted to the development of urban rail transport in Bratislava, a systemic proposal for the development of a modern surface rail PT system in the Bratislava agglomeration was created. If we wish to address the sustainability of mobility and change the modal split in favor of PT, this represents the most promising option.
The possibility of evaluating the feasibility of a TT system is presented in the literature [24]. According to this work, it is also possible to evaluate the TT system for the city of Košice in Slovakia.
It is also important to assess the costs and benefits of the TT system. The methodology for cost–benefit assessment is described in [25]. The Bratislava conurbation is accessible up to around 30 km from the city center. The population density is not high, so the development of an underground urban railway cannot be considered from a generational or long-term perspective. However, one must consider the specificity of Bratislava in terms of the limits of the tramway network’s narrow gauge of 1000 mm and its quality in terms of operation, as well as the durability of the entire supporting PT system, which are defined in strategic documents on rail transport. The use of low-floor tram vehicles under the conditions of Bratislava is also determined by the vehicle width, which is 2500 mm. Thus, basic physical laws are present, which are reflected in the economics of the transport system. This is also reflected in its operation, maintenance, and repair and especially in the quality of the technical and technological aspects of the PT system itself. The existing rail network of the national railway system, including abandoned lines, can be used in the agglomeration. It is also possible to incorporate the dual-gauge system that already partially exists in the city, and the new bridge crosses the Danube River. However, development in Bratislava has been stalled due to an emphasis on detrimental political solutions that ignore appropriate engineering and technical proposals. The aim of this work was to demonstrate the possibility and capabilities of an engineering solution supported by traffic modeling. Strategic planning in Bratislava offers a systemic solution that enables new technical solutions to be proposed as part of the development of the city, and the selection of this line, which links two railway stations, is a promising proposal. This study examined technical solutions to ensure the compatibility of the railway line and tramway. The question of funding or the inclusion of this project in the current master plan for Bratislava was not the subject of this study.
However, the example provided in this paper, which is supported by technical–engineering work, demonstrates the possible strategic development of the city area.

Author Contributions

Conceptualization: T.S. and P.S.; methodology: T.S.; software: M.K. and P.S.; validation: T.S., G.B. and M.K.; formal analysis: P.S.; investigation: T.S. and G.B.; resources: P.S., T.S. and G.B.; data curation: P.S. and M.K.; writing—original draft preparation: T.S. and G.B.; writing—review and editing: G.B. and T.S.; visualization: P.S., M.K. and G.B.; supervision: T.S.; project administration: G.B.; funding acquisition: T.S. and P.S. All authors have read and agreed to the published version of the manuscript.

Funding

This research received no external funding.

Data Availability Statement

The data used in this article are from sources that are publicly available in the references cited. The data supporting the reported results, including references to publicly archived files, were analyzed or produced in individual studies in the Slovak language.

Acknowledgments

This paper was processed within the project VEGA 1/0463/24, “Implementation of innovative solutions and technologies in a systemic approach to pavement design”.

Conflicts of Interest

Author Peter Schlosser was employed by the company DOTIS Consult, Ltd. The remaining authors declare that the research was conducted in the absence of any commercial or financial relationships that could be construed as a potential conflict of interest.

Abbreviations

The following abbreviations are used in this manuscript:
ADTAverage Daily traffic
CPTSCarrying Public Transport System
EU DGEuropean Union Directorate General
MoTMinistry of Transport
PTPublic Transport
TTTram–Train

References

  1. Novales, M.; Orro, A.; Bugarin, M.R. The tram-train: State of the art. Proc. Inst. Mech. Eng. Part F J. Rail Rapid Transit 2002, 216, 1–13. [Google Scholar] [CrossRef]
  2. Nuhamin, G.A.; Carra, M.; Ventura, R.; Richiedei, A.; Barabino, B. Assessing Tram-Train feasibility via multicriteria approach: The case of Brescia (Italy). Res. Transp. Bus. Manag. 2024, 56, 101178. [Google Scholar] [CrossRef]
  3. Kačo, I. Koľajová Trať Na Území Mestskej Časti Bratislava Petrzalka, Technicko-Ekonomická Štúdia (Rail Track in the Area of Bratislava Petrzalka, Technical and Economic Study); Dopravoprojekt, a.s.: Bratislava, Slovakia, 2009. (In Slovak) [Google Scholar]
  4. Podolec, O. Implementácia Integrovaného Dopravného Systému Na Území Bratislavy S Dosahom Na Priľahlé Regióny, Technicko-Ekonomická Štúdia (Implementation of the Integrated Transport System in Bratislava with Connection of Adjacent Regions, Technical and Economic Study); Reming Consult, a.s.: Bratislava, Slovakia, 2010. (In Slovak) [Google Scholar]
  5. Schlosser, T. Rozvoj Elektrickej Trakcie Na Území Hlavného Mesta SR Bratislavy–Príspevok K Rozvoju Bratislavskej Integrovanej Dopravy a Plánu Dopravnej Obslužnosti Bratislavského Samosprávneho Kraja (Development of Electrical Traction in the Capital City of the Slovak Republic Bratislava-Contribution to the Development of Bratislava Integrated Transport and the Plan of Transport Service of the Bratislava Self-Governing Region); Magistrát Mesta Bratislavy: Bratislava, Slovakia, 2012. (In Slovak) [Google Scholar]
  6. Schlosser, T.; Schlosser, P. Suburban public transport network optimization and operation strategy of the new bus station in Bratislava. J. Adv. Eng. 2017, 1, 1–10. [Google Scholar] [CrossRef]
  7. Novales, M.; Orro, A.; Bugarin, M.R. Tram-train: New public transport system. Transp. Res. Rec. 2002, 1793, 80–90. [Google Scholar] [CrossRef]
  8. Novales, M.; Orro, A.; Bugarín, M.R. Use of a genetic algorithm to optimize wheel profile geometry. Proc. Inst. Mech. Eng. Part F. J. Rail Rapid Transit. 2007, 221, 467–476. [Google Scholar] [CrossRef]
  9. Schlosser, T.; Schlosser, P. New Tramway Infrastructure in Bratislava-How Can Influence the Well Prepared Traffic Engineering Analysis and Planning Tools the Decision Making. Procedia Eng. 2016, 161, 247–252. [Google Scholar] [CrossRef]
  10. Novales, M.; Orro, A.; Bugarin, M.R. Madrid tram-train feasibility study conclusions. Proc. Inst. Mech. Eng. Part F J. Rail Rapid Transit 2003, 217, 1–10. [Google Scholar]
  11. STN 73 6405; Projektovanie Električkových Tratí (Designing of Tramway Tracks). UNMS: Bratislava, Slovakia, 1975.
  12. STN 73 6360; Železnice Koľaj Časť 1: Geometrická Poloha a Usporiadanie Koľaje Železničných Dráh Rozchodu 1 435 mm (Railways Track Part 1: Geometric Position and Arrangement of 1 435 mm Gauge Railway Tracks). UNMS: Bratislava, Slovakia, 2015.
  13. Schlosser, P.; Mališová, D.; Schlosser, T. Nosný Systém MHD-Dopravno-Inžinierske Prieskumy Dopravy V Mestskej Časti Petrzalka, I. Etapa, (Carrying Public Transport System–Traffic Engineering Surveys in Petrzalka Borough); Dotis Consult, s.r.o.: Bratislava, Slovakia, 2010. (In Slovak) [Google Scholar]
  14. Schlosser, P.; Mališová, D.; Schlosser, T.; Schlosser, M. Nosný Systém MHD-Prevádzkový Úsek Janíkov Dvor–Šafárikovo Nám. V Bratislave, Časť II. (Carrying Public Transport System—Operational Section Janikov Dvor–Safarikovo Nám., Part II); Dotis Consult, s.r.o.: Bratislava, Slovakia, 2010; 133p. (In Slovak) [Google Scholar]
  15. City of Bratislava. LMP (2007–2021). Územný Plán Mesta Bratislavy (Land Use Master Plan of Bratislava). Available online: https://bratislava.sk/sk/uzemny-plan (accessed on 15 May 2025). (In Slovak).
  16. Šebo, T.; Lichý, I.; Mihálik, J.; Zatlukaj, E.; Matúšová, M. Nová Einsteinova-Mesto Na Úrovni, Urbanistická Štúdia (New Einstein Street-City at Level, Urban Study); Architekti Šebo–Lichý: Bratislava, Slovakia, 2012. (In Slovak) [Google Scholar]
  17. ZZ ŽSR. Jednotná Železničná Mapa Žst. Petrzalka (Unified Railway Map of the Railway Station Petrzalka); Stredisko Železničnej Geodézie: Bratislava, Slovakia, 1992. (In Slovak) [Google Scholar]
  18. Plišková, J. Dopravný Uzol Bratislava–Štúdia Realizovateľnosti (Transport Node Bratislava—Feasibility Study); Združenie Uzol Bratislava: Bratislava, Slovakia, 2019. (In Slovak) [Google Scholar]
  19. Schlosser, T.; Schlosser, P.; Schlosser, M. Traffic model as a tool for changing of modal split in Bratislava new city centre. In Proceedings of the Conference of Transport Science-Technology in Service of Sustainable Transport; Universitas-Győr Nonprofit Kft.: Győr, Hungary, 2018; ISBN 1757-899X. [Google Scholar]
  20. Bálint, G. Modelovanie Dopravného Zaťaženia V Integrovanom Systéme Dopravy (Modelling of Passenger Traffic Flows in Integrated Public Transport System). Ph.D. Thesis, Slovak University of Technology, Bratislava, Slovakia, 2019. (In Slovak). [Google Scholar]
  21. Galkin, A.; Davidich, Y.; Kush, Y.; Davidich, N.; Tkachenko, I. Improving of urban public transportation quality via operator schedule optimization. J. Urban Environ. Eng. 2019, 13, 23–33. [Google Scholar] [CrossRef]
  22. PTV VISUM Manual, Version 15; PTV AG: Karlsruhe, Germany, 2015.
  23. Šenk, P.; Pípa, N.; Lazor, M. Územný Generel Dopravy Hl. M. SR Bratislavy (Transport Master Plan of Capital of Slovakia-Bratislava); Centrum Dopravního Dýskumu: Brno, Czech Republic, 2015. (In Slovak) [Google Scholar]
  24. Ventura, R.; Bonera, M.; Carra, M.; Barabino, B.; Maternini, G. Evaluating the viability of a tram-train system: A case study from Salento (Italy). Case Stud. Transp. Policy 2022, 10, 1945–1963. [Google Scholar] [CrossRef]
  25. De Aloe, M.; Ventura, R.; Bonera, M.; Barabino, B.; Maternini, G. Applying cost-benefit analysis to the economic evaluation of a tram-train system: Evidence from Brescia (Italy). Res. Transp. Bus. Manag. 2023, 47, 100916. [Google Scholar] [CrossRef]
Figure 1. Maximum traffic peak (veh./h) on bridges for 2020 with CPTS [13].
Applsci 15 09042 g001
Figure 2. Maximum traffic peak (veh./h) on bridges for 2020 without investments and CPTS [13].
Applsci 15 09042 g002
Figure 3. Main directions and locations of integrated rail transport in the territory of Bratislava [5].
Applsci 15 09042 g003
Figure 4. Design of a TT route (red color) on the plateau over Einsteinova Street to the Petrzalka railway station.
Applsci 15 09042 g004
Figure 5. Scheme of track connections for TTs at Petrzalka station [7].
Applsci 15 09042 g005
Figure 6. Bratislava’s transport model covering the agglomerations of Vienna–Bratislava in PTV VISUM.
Applsci 15 09042 g006
Figure 7. Scheme of planned tram–train line route (blue color) in PTV VISUM.
Applsci 15 09042 g007
Figure 8. Flow map of transported passengers by planned TT line [pass./24 h] between two railway stations in PTV VISUM.
Applsci 15 09042 g008
Figure 9. Flow map of transported passengers by tram in monitored area [pass./24 h] in PTV VISUM.
Applsci 15 09042 g009
Table 1. Average daily and peak traffic volumes for 2020 without CPTS on Danube bridges.
2020 (ADT veh./24 h)Peak HT—Maximum (veh./h)Peak HT—50th h (veh./h)
Danube BridgeDirection 1Direction 3ProfileDirection 1Direction 3ProfileDirection 1Direction 3Profile
Lafranconi34.98034.67069.6504.5204.5209.0403.6803.6707.350
SNP35.22035.28070.5004.3204.4708.7903.7003.5507.250
Apollo26.58026.47053.0505.1504.3609.5104.2203.7808.000
Port45.83045.27091.1004.5204.8009.3203.8304.2808.110
Sum142.610141.690284.30018.51018.15036.66015.43015.28030.710
Table 2. Average daily and peak traffic volumes for 2020 with investments and CPTS.
2020 (ADT veh./24 h)Peak HT—Maximum (veh./h)Peak HT—50th h (veh./h)
Danube BridgeDirection 1Direction 3ProfileDirection 1Direction 3ProfileDirection 1Direction 3Profile
Lafranconi25.90028.77054.6703.7703.3507.1203.0202.7005.720
SNP27.28028.88056.1603.3803.6907.0702.8802.9105.790
Apollo20.50022.36042.8603.9603.7207.6803.2403.2406.480
Port35.70038.01073.7103.5404.0107.5502.9903.5906.580
Sum109.380118.020227.40014.65014.77029.42012.13012.44024.570
Table 3. Differences in transport intensity values.
2020 (ADT veh./24 h)Peak HT—Maximum (veh./h)Peak HT—50th h (veh./h)
Difference33.23023.67056.9003.8603.3807.2403.3002.8406.140
Table 4. Passenger volume on TT line between Petrzalka and Filiálka railway stations.
Public Transport StopVolume of
Passengers (pass./24 h)
Boarding (pass./24 h)Alighting (pass./24 h)Volume to (pass./24 h)Volume from (pass./24 h)Cross-Section Volume (pass./24 h)
Petrzalka Railway Station12,578622063586220635812,578
Dvory (tram)29912174817
8214699515,209
Aupark (tram)402820581970
9987868018,667
Sad Janka Krala (Stary Most profile)20,60710,30410,303
39,35637,71477,070
SND (Olejkarska profile)13,31466756639
14,87310,37525,248
Twin City939039185472
14,85711,91326,770
Mlynske Nivy553224823050
14,23411,85826,092
Soltesovej335315781775
13,78511,60625,391
Krizna (tram)756337163847
12,33710,28922,626
Bratislava–Filiálka382918471982
Disclaimer/Publisher’s Note: The statements, opinions and data contained in all publications are solely those of the individual author(s) and contributor(s) and not of MDPI and/or the editor(s). MDPI and/or the editor(s) disclaim responsibility for any injury to people or property resulting from any ideas, methods, instructions or products referred to in the content.