Abstract
Spatially intersecting roadways in mines are prone to stress concentration due to disturbances during mining operations, which significantly affects the stability of the inter-roadway surrounding rock between the roadways. Analyzing the stability of underlying roadways under the influence of disturbances from overlying roadways, as well as enhancing the stability of the inter-roadway surrounding rock, is critical for ensuring safe and efficient mining operations. Based on the geological conditions at the spatial intersection of the 5−1 Coal Auxiliary Transportation Roadway and the 5−2 Coal Auxiliary Transportation Roadway in the Hengliao Coal Mine, this study investigates the deformation and failure characteristics of the surrounding rock between roadways under dynamic loading. A stability criterion equation for the inter-roadway surrounding rock is established using the limit equilibrium method. Furthermore, numerical simulations are conducted to analyze the stress–strain distribution in the surrounding rock and supporting structures at the intersection area of the 5−1 roadway under the dynamic loading conditions induced by trackless rubber-tired vehicle operation in the 5−2 roadway. Field applications demonstrate that the proposed combined support scheme effectively controls roadway deformation and ensures the stability of the rock mass between roadways. This study provides valuable insights for stability assessment and support design of spatially intersecting roadways.
1. Introduction
Shallow buried coal seams are commonly found in western China. Thick coal seams are rich in reserves, and large mining height has become the main mining technique for this type of coal seam. However, with the increase in mining height, support resistance is increasing, coal wall flakes are becoming more and more serious, and rock control is facing new challenges.
The coal mine production system is extensive and highly complex, with underground roadways forming an intricate network. Consequently, the occurrence of intersecting roadways is inevitable. This is particularly prominent in the design of multi-seam mines, where spatially intersecting roadways are often arranged in areas such as the main underground transportation hubs, mining district car yards, and near the end lines of working faces. Between adjacent roadways lies an inter-roadway rock mass, referred to as the inter-roadway surrounding rock structure, which plays a critical load-bearing role. In their natural state, rock masses are subjected to inherent in situ stress fields. The excavation of artificial roadways leads to a redistribution of stress within the surrounding rock of both the roadway and the working face. Compared with single roadways, the construction of spatially intersecting roadways causes further disturbances to the surrounding rock stress field, aggravating the instability of both the inter-roadway rock mass and the roadway support structures.
In the early stages of related research, scholars conducted on-site monitoring of roadway deformation behavior—such as convergence of sidewalls, roof subsidence, floor heave, and anchor cable tension—to study the deformation trends of the surrounding rock under disturbance [1,2]. Cao Yaohua et al. [3] combined numerical simulation to analyze the stress distribution and deformation characteristics of the surrounding rock. By establishing numerical models under various intersection conditions, they explored deformation patterns in intersection zones [4].
At present, the primary method for maintaining the stability of intersecting roadways is to reinforce the support structures. Given the variations in intersection conditions, the stress environments in different intersection zones differ, necessitating tailored reinforcement positions and scopes. Song Zhaoyang et al. [5] investigated the mutual disturbance effects during the excavation of weakly cemented sandstone roadways under deep mining conditions, analyzing the influence of factors such as rock strength, spacing between adjacent roadways, relative stratigraphic positions, excavation sequence, and staggered distances on the stability of the surrounding rock. Li Guang et al. [6] examined how the layout patterns and excavation sequences of soft rock roadway groups in deep mines influence stress fields, deformation fields, and plastic zone distributions. Han Jiaguang et al. [7] studied the factors affecting roadway disturbance effects in deep mining, including rock mass strength, horizontal and vertical spacing, and the internal friction angle of the rock.
Some researchers have also focused on the stability of intersection points of inter-roadway rock masses from the perspectives of roadway layout, mutual excavation interaction mechanisms, and control techniques. Numerical coupling techniques that enable in-depth simulation of the dynamic response and failure mechanisms of rock masses under various cross-joint configurations provide an effective means for analyzing roadway interaction problems in jointed rock environments and for investigating the spatial intersection effects of roadways [8,9]. Emmanouil Steiakakis [10] conducted stability analyses based on slip surfaces defined through the combined application of the Limit Equilibrium Method (LEM), Limit Analysis (LA), and the Finite Element Method (FEM). Xu Wenbin et al. [11] studied the stress and deformation distributions in intersecting roadways under various excavation sequences and layout forms, concluding that alternating excavation minimizes disturbances to bottom-structure roadway groups and symmetric configurations offer higher constructional stability. Cao Rihong et al. [12] considered the stability of roadway intersections under strain-softening conditions. He Manchao et al. [13] analyzed the mechanical responses and deformation characteristics of 3D intersecting chamber groups in deep soft rock under different excavation sequences. Feng Guorui et al. [14] conducted a study on the mechanism of asymmetric deformation and corresponding control measures of roadway surrounding rock based on the self-stabilizing hidden arch theory. Their work integrated engineering, geological analysis, theoretical mechanical interpretation, and numerical simulation. Yu Heran et al. [15] developed mechanical models under different clearances, rock conditions, and construction schemes, proposing predictive formulas for the deformation of the surrounding rock and track bed of existing tunnels. Further studies have employed rock mechanics models to examine the mechanical behavior and processes of deep rock masses under mining-induced disturbances [16,17]. Zheng Minzong [18] proposed the 3D Nonlinear Failure Criterion (3DNFC) as a means to characterize the influence of the intermediate principal stress on rock strength. This criterion can be conveniently applied in engineering practice for stability analysis and the evaluation of rock masses when only uniaxial test data are available. Wang Cheng et al. [19] simulated the stress distribution before and after reinforcement at roadway intersections, evaluating how strengthening fractured surrounding rock alters stress concentration zones. Guo Baohua [20] proposed optimal support strategies for roadway intersections by analyzing the influence of intersection type, depth, and surrounding rock strength. Zhao Weisheng [21] examined the effects of principal stress direction and intersection angle on intersection stability, including stress field deflection and displacement evolution prior to excavation.
To address instability at intersections caused by disturbance, targeted reinforcement measures have been proposed. Simulating the dynamic unloading and reloading process using FLAC3D 6.0 to investigate the failure behavior of surrounding rock provides valuable insights for understanding the response of support structures under dynamic loading conditions [22,23]. Lu Xingli et al. [24] analyzed the deformation, cracking characteristics, and failure mechanisms of surrounding rock and support structures in roadway groups. They proposed an integrated support system composed of prestressed anchors (cables), U-shaped steel arches, and stepwise grouting for controlling roof and sidewall stability. Zheng Bingliang et al. [25] introduced a comprehensive reinforcement approach combining grouting and active anchor support to effectively control large deformations under strong dynamic pressure. Meng Qingbin [26] proposed a coupled grouting technique involving deep and shallow holes with high- and low-pressure systems, as well as self-drilling internal grouting anchors to restore rock integrity and enhance self-supporting capacity. Yang Junhui [27] put forward a combined support technique using bolts, shotcrete, and mesh reinforcement. This system employs high-strength, densely arranged bolts in multiple layers, multilayer shotcrete arches, backfill grouting, and cast-in-place concrete columns and walls, effectively controlling deformation and failure at deep, large-section roadway intersections. Guo Zhibiao [28] proposed an optimized roadway layout with a combined support system of bolts, mesh, cables, and 3D trusses to reduce stress concentration and improve stability in deep 3D intersections.
However, due to the complex stress distribution at 3D intersecting roadways, current studies largely remain at the stage of numerical simulation, particularly lacking for closely spaced spatial intersections. A systematic investigation of the stress distribution and deformation patterns of the inter-roadway rock mass, along with an analysis of the failure processes in spatially intersecting roadway systems, contributes to revealing the underlying mechanisms controlling rock mass instability under complex spatial layouts. This, in turn, provides valuable guidance for engineering design and the optimization of support parameters. This study focuses on the close-range spatially intersecting roadways of the Hengliao Coal Mine in Shaanxi Province. Through a combination of engineering case studies and theoretical analysis, the study investigates the roof pressure of intersecting zones, establishes mechanical criteria for instability induced by failure of the inter-roadway rock mass, and conducts a simulation of the stress distribution in 3D intersections. The findings aim to provide effective guidance for support design in close-range spatially intersecting roadways.
2. Engineering Background
Henglian Coal Mine is located in the northern part of Shenmu City, Shaanxi Province. It is a large-scale integrated mine formed through the consolidation of the former Huangtuwan, Shiyaodian, and parts of the Shibian coal mines in the original Shenmu County. The small coal mines involved in the integration mainly mined the 5−1 coal seam, while Henglian Coal Mine primarily extracts coal from the 5−1 and 5−2 seams.
Following integration, Henglian Coal Mine is bordered by Shibian Coal Mine to the west, Shiyaodian Coal Mine to the north, Sunyingcha No. 1 Mine to the south, and Wangta Coal Mine to the east. A schematic diagram of the integrated mine area and the distribution of mined-out areas of the 5−1 seam in the surrounding region is shown in Figure 1.
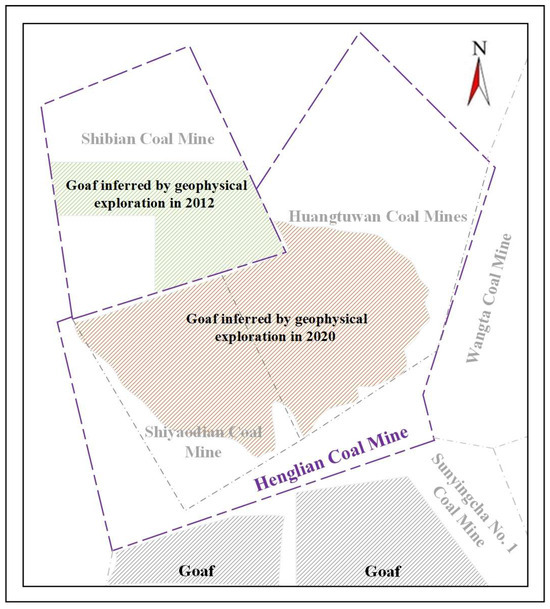
Figure 1.
Schematic diagram of the integrated coal mine area and the distribution of mined-out zones of the 5−1 coal seam in the surrounding region.
Most of the 5−1 coal seam within the mine area has already been mined out, with the remaining extractable zones mainly concentrated in the northeastern part of the mining field. The seam has a recoverable thickness ranging from 0.8 to 1.27 m, with an average of 1.05 m. It is generally free of interbedded rock and has a simple structure.
The 5−2 coal seam remains largely extractable throughout the mine area. Its recoverable thickness ranges from 0.80 to 1.64 m, averaging 1.34 m, classifying it as a medium-thick coal seam. It gradually thins from the northern part of the field toward the southwest. The seam is buried at depths ranging from 13.57 to 140.09 m, with the floor elevation between 1020 and 965 m. The main aquifers affected or disturbed by the mining of the No. 5−2 coal seam in the planned extraction area of the Hengliao Coal Mine include surface water, the weakly water-rich pore aquifer within the Holocene aeolian sands and alluvial deposits of the Quaternary system, the weak aquifer of phreatic water in the pore zones of the Middle Pleistocene loess layer, and the fissure aquifer of the Middle Jurassic Yan’an Formation. The direct roof and floor of the coal seam consist of interbedded siltstone and mudstone, with an average Rock Quality Designation (RQD) value of 69%, indicating moderate rock quality and moderately integrated rock mass.
Due to the complexity of the geological structure and the interaction between multiple coal seams, the stability of the surrounding rock in the inter-seam roadways has become a critical concern for the safe operation of the mine.
During the extraction of the 5−1 and 5−2 coal seams at Henglian Coal Mine, the layout of the roadways features vertically intersecting auxiliary haulage roadways in the upper and lower seams. The auxiliary haulage roadway in the 5−2 seam is responsible for auxiliary transportation within the mine. It has a clear width of 5.0 m and a clear height of 2.8 m and is supported using a combination of rock bolts, mesh, and shotcrete (bolt–mesh–shotcrete support).
The auxiliary haulage roadway in the 5−1 seam is located beneath that of the 5−2 seam and has the same clear width and height. Its support system consists of bolt–mesh–shotcrete combined with cable bolting. The vertical distance between the two intersecting roadways is approximately 5.7 m. The spatial relationship between the two roadways is illustrated in Figure 2.
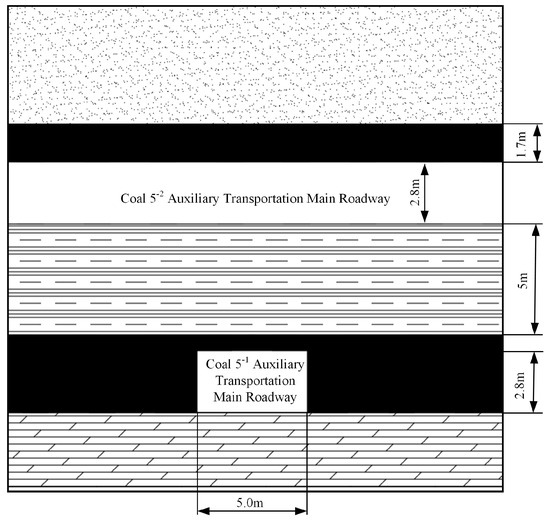
Figure 2.
Spatial relationship between auxiliary transportation main roadways.
3. Analysis of Surrounding Rock Stability Between Spatially Intersecting Roadways
3.1. Mechanical Model of the Inter-Roadway Surrounding Rock in Spatially Intersecting Roadway
The failure of the surrounding rock between spatially intersecting roadways tends to initiate from the upper and lower surfaces of the inter-roadway rock mass and propagate toward its central part. Based on this observation, an equivalent mechanical loading assumption is proposed for the inter-roadway surrounding rock in spatially intersecting roadway systems: the inter-roadway rock mass functions as a load-bearing support structure and is assumed to bear half of the original lateral in situ horizontal stress from the adjacent surrounding rock on each side after roadway excavation. The remaining half of the in situ horizontal stress is assumed to be separately borne by the roof of the upper roadway and the roof of the lower roadway.
Under this hypothesis, elastoplastic mechanical theory and the limit equilibrium method under ultimate shear failure conditions are used to conduct a mechanical analysis of the stresses acting on the inter-roadway surrounding rock. A limit equilibrium model is established to analyze the failure of the load-bearing structure formed by the inter-roadway surrounding rock in spatially intersecting roadways.
To facilitate analysis and calculation, the model is simplified according to elastoplastic mechanical theory by adopting the following fundamental assumptions:
The inter-roadway surrounding rock mass is treated as an ideal elastoplastic medium, and its shear failure behavior conforms to the Mohr–Coulomb strength criterion.
The roadway is subjected to the in situ stress field, with a lateral pressure coefficient of 1.0.
The unfailed surrounding rock is considered to be in an elastic stress state, and stress concentration peaks are assumed to exist at the boundary between the elastic and plastic failure zones due to stress redistribution.
Based on the stress and failure characteristics of spatially intersecting roadways, the three-dimensional stress problem is simplified into a quasi-plane problem that meets engineering accuracy requirements.
In the analysis, the height of the surrounding rock above the roof of the lower roadway is denoted as dy, with a length equal to the roadway width L, and a unit thickness of 1 is assumed for the model element. The inter-roadway rock unit is subjected to a uniformly distributed vertical load and a horizontal lateral load .
Based on the fundamental assumptions of the model, the roof of the lower roadway is selected as the primary object of study to establish a stability analysis model for the inter-roadway surrounding rock in spatially intersecting roadways. A Cartesian coordinate system is positioned at the geometric center of the lower roadway. The mechanical models are shown in Figure 3.
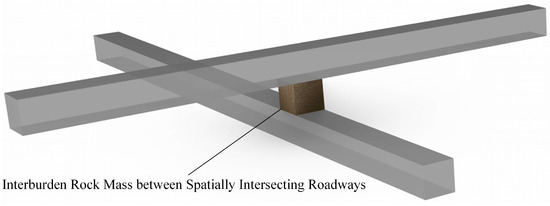
Figure 3.
Three-dimensional view of spatially intersecting roadways.
3.2. Mechanical Analysis of Failure in the Inter-Roadway Surrounding Rock
Taking the lower unit of the surrounding rock mass between the spatially intersecting roadways as the object of study, as shown in Figure 4. A vertical load is applied within this unit, while lateral horizontal loads are distributed along the boundaries of the surrounding rock. The unit deforms downward into the roadway space and is subjected to frictional forces along its lateral boundaries, where the lateral friction force satisfies . The differential equilibrium equation for this unit is established as follows:
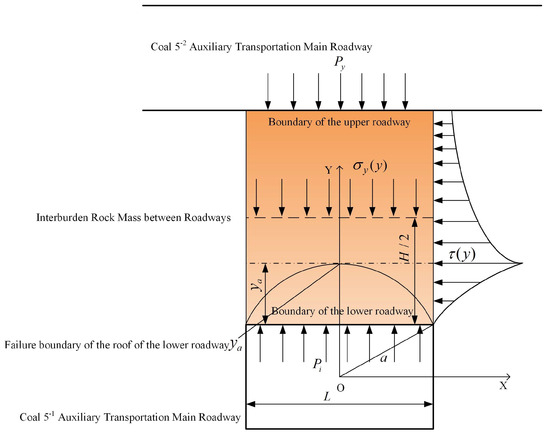
Figure 4.
Mechanical analysis model of the inter-roadway surrounding rock mass.
After simplification, the following is obtained:
where is the span of the lower roadway and is the friction coefficient along the lateral contact surface of the fractured surrounding rock mass.
Based on the limit equilibrium condition for surrounding rock failure:
In the equation, ; ; denotes the span of the underlying roadway; and represent the distributions of horizontal and vertical stresses, respectively, within the failure zone of the surrounding rock mass.
By combining the equations, we obtain the following:
In this section, a mechanical failure analysis is conducted using an inscribed circular roadway cross-section for the lower roadway. The width of the lower roadway is taken as the maximum width of the inscribed circular cross-section, , where is the radius of the inscribed circle corresponding to the lower roadway. The rock mass between the roadways is subjected to a load from a rubber-tired vehicle in the upper roadway, while a support force is applied to the roof of the lower roadway. Therefore, the vertical load at the roof of the lower roadway is given by , and the resulting stress distribution within the failure zone is as follows:
Assuming that the intact surrounding rock remains in an elastic stress state, the vertical and horizontal stress equations at the midline of the lower roadway roof within the elastic zone are expressed as follows:
In the equations, and represent the horizontal and vertical stress distributions, respectively, within the elastic zone of the surrounding rock; denotes the in situ stress at the roadway location; and and are undetermined coefficients.
Let denote the failure depth at the lower boundary of the rock mass between the roadways. The failure boundary is defined by the condition and satisfies the limit equilibrium condition.
At the failure boundary where , rearranging the above equations yields the following:
The solution is as follows:
Based on the equivalent assumption of stress-bearing between surrounding rock masses of spatially intersecting roadways, the lateral load equilibrium equation on one side of the lower roadway is derived as follows:
In the equations, ; ; ; represents the distance between roadways in the spatially intersected roadway.
By setting , Equation (12) is simplified to the following:
Solving the equations yields the failure boundary depth y of the inter-roadway surrounding rock. Substituting this into Equations (5)–(8) allows for determination of the lateral stress distribution in the surrounding rock of the lower roadway.
Failure region of the surrounding rock between roadways:
Elastic region of the surrounding rock between roadways:
The 5−1 coal auxiliary transport roadway and the 5−2 coal auxiliary transport roadway at the Hengliao Coal Mine have identical dimensions. Based on the assumption that the stress state of the surrounding rock between the roadways and the resulting damage exhibit symmetrical characteristics, and considering the failure depth of the surrounding rock induced by the upper roadway, this study focuses on the surrounding rock at the roof of the lower roadway within the inter-roadway zone [29]. A lateral load-bearing equilibrium equation for the surrounding rock stress is then established:
The mechanical failure criterion equation for the surrounding rock of the spatially intersecting roadways at the Hengliao Coal Mine is given by the following:
By analyzing the surrounding rock at the roof of the lower roadway, and based on the symmetrical characteristics of surrounding rock failure, the mechanical criterion to prevent failure of the inter-roadway surrounding rock, which could lead to instability of the rock mass bearing structure, is that the inter-roadway spacing satisfies: .
3.3. Stability Criterion for Support of Inter-Roadway Surrounding Rock
Based on the engineering geological conditions of the spatially intersecting roadways in the Hengliao Coal Mine, a surrounding rock control scheme is proposed, which adopts full-length bolt and cable support in the upper roadway, combined with full bolt support and partial cable support supplemented by I-beam steel sets in the lower roadway [30]. The roadway is located within a rock stratum at a burial depth of 90 m. Conservatively, the in situ stress is taken as = 4.5 MPa. The 5−1 coal auxiliary transport roadway and the 5−2 coal auxiliary transport roadway have identical excavation dimensions, with a net width of 5.0 m and a net height of 2.8 m. The radius of the circumscribed circle of the roadway cross-section is = 2.87 m, and the span is = 5.74 m. The inter-roadway surrounding rock mass is composed of sandy mudstone, with a cohesion of = 3.2 MPa and an internal friction angle of . The spatial intersection angle between the two roadways is 90°, and the friction coefficient at the lateral contact surfaces of the inter-roadway rock mass is = 0.1. The spacing between the two roadways is = 5.7 m.
The inter-roadway surrounding rock mass is subjected to the load imposed by the weight of an explosion-proof rubber-tired vehicle operating in the upper 5−2 coal auxiliary transport roadway, with an equivalent gravitational load of = 0.06 MPa. Active support in the lower roadway roof consists of fully grouted rock bolts arranged at 1000 mm × 1000 mm spacing, with an anchorage force not less than 80 kN. Passive support is provided by a combination of cable bolts and 128a I-beam steel sets (parameters provided in the accompanying Table 1). The above parameters are substituted into the mechanical failure criterion for inter-roadway rock mass to evaluate its stability:

Table 1.
Support parameters of No. 11 I-section steel and accompanying tie rods.
When the inter-roadway spacing is = 5.7 m and the support strength is = 0.4 MPa, the calculated failure depth is = 0.72 m < . Therefore, when the equipment load is = 0.06 MPa and the support strength exceeds 0.4 MPa, the load-bearing stability requirement of the inter-roadway surrounding rock mass can be satisfied.
3.4. Key Influencing Factors of Inter-Roadway Surrounding Rock Stability
Based on the in situ surrounding rock conditions and the spatial position of the inter-roadway rock mass in the spatially intersecting roadways, the initial in situ stress is assumed to be = 4.5 MPa. The upper and lower roadways are identical in size (width: 5.0 m; height: 2.8 m), and the basic surrounding rock parameters are similar to those of the Hengliao geological conditions. The rock mass located on one side of the lower roadway is selected as the study object, aiming to analyze the influence of the inter-roadway spacing and the support resistance on the stability of the rock mass between the roadways.
When the distance between the spatially intersecting roadways is sufficiently large, the failure depth of the inter-roadway rock mass gradually decreases. The peak of the lateral horizontal stress concentration appears at the boundary of the failed zone, and within the failure zone, the lateral horizontal stress shows an increasing trend. Beyond the failure boundary, the lateral horizontal stress gradually decreases with depth, as shown in Figure 5a. When the inter-roadway spacing is 3 m, the failure zone covers the entire inter-roadway rock mass. As illustrated in Figure 5b, the vertical stress within the inter-roadway rock mass increases continuously with the increase in the spacing of the spatially intersecting roadways.
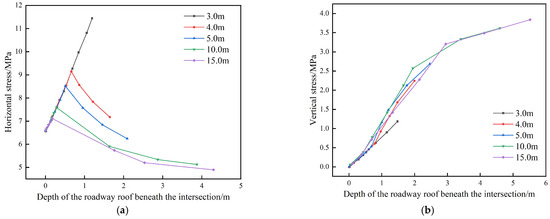
Figure 5.
Influence of inter-roadway spacing on the stress distribution of surrounding rock in spatially intersecting roadways. (a) Horizontal Stress Distribution of the Inter-Roadway Rock, (b) Vertical Stress Distribution of the Inter-Roadway Rock.
From the perspective of support resistance, increasing the support resistance of the inter-roadway rock mass enhances its capacity to bear lateral horizontal stress. This improvement significantly reduces the extent of failure in the composite load-bearing system formed between the rock mass and the support structure, as shown in Figure 6. Enhancing support resistance effectively decreases the failure depth of the inter-roadway rock mass.
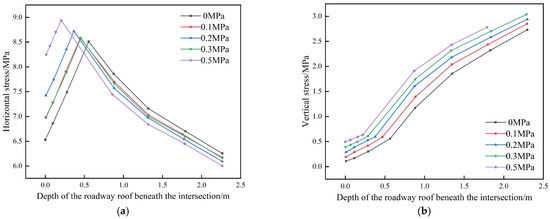
Figure 6.
Influence of support resistance on the stress distribution of surrounding rock in spatially intersecting roadways. (a) Horizontal Stress Distribution of the Inter-Roadway Rock, (b) Vertical Stress Distribution of the Inter-Roadway Rock.
Although the vertical load induced by transportation equipment in the upper roadway is relatively small compared to the in situ stress of the surrounding rock, it can still cause shear failure along the lateral boundaries of the rock mass. This shear effect is detrimental to the long-term structural stability of the inter-roadway rock mass.
Based on the geological conditions of the Hengliao Coal Mine, under an unchanged initial in situ stress environment, improved surrounding rock conditions result in greater bearing capacity of the inter-roadway rock mass in staggered roadway layouts, along with a significantly reduced failure depth. When spatially intersecting roadways are arranged at a certain angle, the mutual disturbance of lateral horizontal stresses becomes more complex. Therefore, selecting locations where the inter-roadway rock mass exhibits relatively better mechanical properties, or implementing engineering measures to enhance its geomechanical characteristics, is more conducive to ensuring the bearing stability of surrounding rock in staggered roadway systems.
4. Effect of Vehicle Movement on the 5−1 Coal Auxiliary Transport Roadway
The 5−2 coal auxiliary transport roadway is responsible for the auxiliary transportation tasks of the mine. It has a net width of 5.0 m and a net height of 2.8 m, and employs a combined support system consisting of left-handed threaded steel bolts, cable bolts, and shotcrete.
The 5−1 coal auxiliary transport roadway is located beneath the 5−2 roadway, with the same net width and height. The planned support system for the 5−1 roadway is to be upgraded from traditional cable bolt support to 128a I-beam steel sets, installed at a spacing of 500 mm and connected by tie rods. The support length is designed to be 15 m. The following section presents a numerical simulation analysis to verify the theoretical calculations.
The auxiliary transport roadways at the Hengliao Coal Mine play a critical role in material transportation and personnel movement. In particular, the operation of explosion-proof rubber-tired vehicles within the upper 5−2 coal auxiliary transport roadway generates significant static and dynamic loads, which are transmitted through the surrounding rock mass to the underlying 5−1 coal auxiliary transport roadway.
Such load transfer may induce secondary deformation in the surrounding rock of the lower roadway, stress concentration in the support structure, and potential instability. Therefore, it is essential to investigate the stress and deformation responses of the 5−1 roadway to vehicle operation in the 5−2 roadway.
This study employs numerical simulation to analyze the stress transfer mechanisms between the upper and lower surrounding rock masses, evaluate the adaptability of the support structures, and assess the overall stability of the rock mass system. Based on the simulation results, optimization of the roadway support design is proposed to minimize deformation and enhance the stability of the roadways.
4.1. Establishment of a Model for Spatially Intersecting Roadways
The roadway models of the 5−1 and 5−2 auxiliary transportation tunnels in the Hengliao Coal Mine were constructed using Rhino 8 modeling software. The generated models were then imported into the finite difference software FLAC3D for numerical simulation. The model integrates the physical and mechanical parameters from geological reports and the in situ support conditions to simulate and analyze the deformation of the surrounding rock mass and the stress state of the support system in the 5−1 roadway under the vehicle load applied in the 5−2 roadway.
Based on relevant geological data from the Hengliao Coal Mine, the model parameters were determined. The model dimensions are 40 m in length, width, and height. The roadway cross-section is rectangular, with a maximum burial depth of 80 m, a span of 5.00 m, and a net height of 2.8 m. The Mohr–Coulomb yield criterion was adopted for the numerical model. The physical and mechanical parameters of the coal seam rock mass used in the simulation are listed in Table 2.
Table 2.
Physical and mechanical parameters of coal (rock) samples.
To reflect actual engineering conditions, boundary constraints were applied to the numerical model. Horizontal displacement was restricted along the side boundaries of the model, while the bottom boundary was fixed to prevent both vertical and horizontal movement.
Considering the burial depth of the coal seam, the overlying soil and rock strata were equivalently represented by applying an initial vertical stress of 1.2 MPa to the top boundary of the model, based on geological survey data. The primary objective of this simulation is to investigate the stress distribution and deformation of the surrounding rock in the 5−1 auxiliary transport roadway during vehicle operation in the upper 5−2 roadway.
The model incorporates the support system according to the mine’s roadway support design. Support parameters used during the simulation were selected from Table 3 and Table 4. The layout of the roadway support structure is shown in Figure 7a, and the final model incorporating the mechanical parameters of the surrounding strata and boundary constraints is illustrated in Figure 7b.
Table 3.
Mechanical parameters of rock support bolts and cables.
Table 4.
Fundamental mechanical properties of the anchored section of bolts and cables.
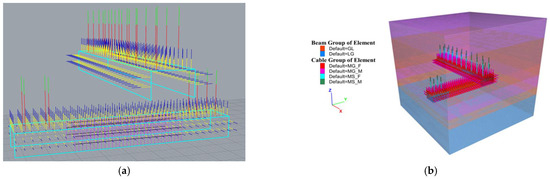
Figure 7.
Establishment of a roadway support model. (a) Support Design for Underground Roadways, (b) Spatial Model Diagram of the Roadway.
4.2. Effects of Vehicle Traffic on the Surrounding Rock of Roadway 5−1
4.2.1. Analysis of Stress Distribution Patterns of the 5−1 Auxiliary Transportation Roadway
As shown in Figure 8, under no vehicle load conditions, the maximum stress in the 5−2 coal roadway is located at the center of the floor. In contrast, the stress in the underlying 5−1 coal roadway is primarily concentrated at the two sidewalls, and the surrounding rock exhibits a relatively low initial stress state. When the vehicle is in motion, as the trackless rubber-tired vehicle travels within the 5−2 roadway, the stress induced by the load is transmitted to the lower 5−1 roadway, gradually increasing the maximum stress in the surrounding rock on both sidewalls. When the vehicle approaches the center of the 5−1 roadway (from a distance of 4 m to 1.5 m), the stress transmission from the roof and floor of the 5−2 roadway is significantly enhanced, resulting in further concentration of stress in the surrounding rock of the lower roadway.
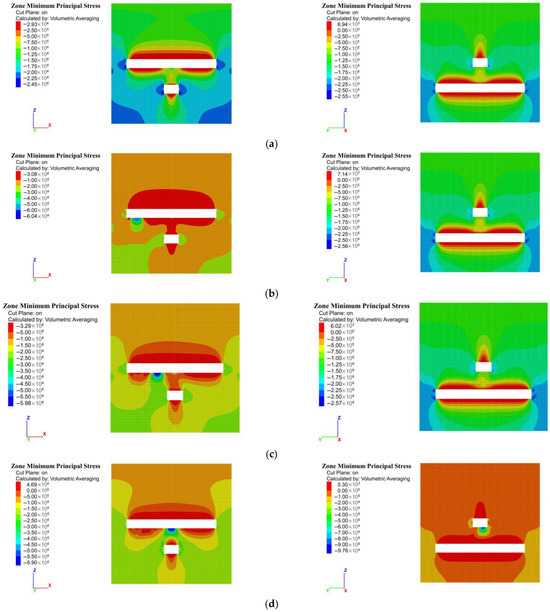
Figure 8.
Stress distribution pattern of the surrounding rock in the 5−1 roadway induced by the movement of the rubber-tired vehicle. (a) No vehicle present, (b) Rubber-tired vehicle located 10 m from the center of the 5−1 roadway, (c) Rubber-tired vehicle located 4 m from the center of the 5−1 roadway, (d) Rubber-tired vehicle passing 1.5 m beyond the center of the 5−1 roadway. (Note: The left figure represents the view along the Y-direction; the right figure represents the view along the X-direction).
Under vehicle loading, the maximum stress in the roof and floor of the 5−2 roadway increases to 6.0 MPa, approximately four times higher than the 1.5 MPa observed under no-load conditions. For the 5−1 roadway, when the vehicle is 1.5 m from the center, the maximum stress at the two sidewalls reaches 2.57 MPa, while the stress concentration in the roof and floor remains relatively minor. This indicates that the stress transfer mechanism between the two roadways under vehicle load primarily affects the horizontal stress field of the surrounding rock. The stress variations induced by the load exhibit an asymmetrical pattern, with more pronounced stress concentration on the side where the vehicle is located. The dynamic change in the stress peak increases progressively as the vehicle approaches the center, reaching a maximum at the center, and then gradually decreases as the vehicle moves past it.
Under no vehicle loading conditions, the stress in the I-beam support system (roof and sidewalls) of the 5−1 coal roadway remains low, indicating a relatively low initial stress state. As the trackless rubber-tired vehicle moves within the 5−2 roadway, the load-induced stress is transmitted to the lower 5−1 roadway, causing a gradual increase in the maximum stress on both sides of the I-beam support. As the vehicle approaches the center of the roadway, the stress transmission through the floor of the 5−2 roadway becomes increasingly significant, leading to further concentration of stress in the I-beam support system of the lower roadway. Under vehicle loading, the maximum stress in the I-beam support of the 5−1 roadway increases to 0.065 MPa, approximately three times higher than the 0.019 MPa observed under no-load conditions.
As illustrated in Figure 9, when there is no vehicle present in the 5−2 roadway, the maximum stress in the sidewalls of the I-beam support in the 5−1 roadway is approximately 0.019 MPa, while the maximum stress in the roof is relatively small, about 9.5 × 10⁻⁶ MPa. The stress distribution across the sidewalls and roof of the I-beam support is uniform. When the rubber-tired vehicle is 10 m from the center of the 5−1 roadway, the maximum stress on the sidewalls of the I-beam support in the 5−2 roadway reaches approximately 0.035 MPa, and the maximum roof stress is about 0.02 MPa. As the vehicle approaches within 4 m of the center, the maximum sidewall stress increases to about 0.065 MPa, and the maximum roof stress is around 0.01 MPa. After the vehicle passes 1.5 m beyond the center of the 5−1 roadway, the maximum stress on the sidewalls of the I-beam support in the 5−2 roadway reaches approximately 0.075 MPa, while the maximum stress in the roof and floor reaches about 0.05 MPa.
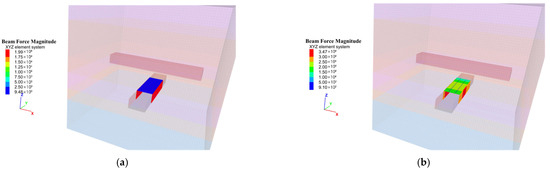
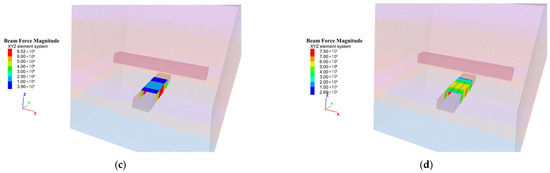
Figure 9.
Stress distribution pattern of I-beams in the 5−1 roadway induced by the movement of the rubber-tired vehicle. (a) No vehicle present, (b) Vehicle located 10 m from the center of the 5−1 roadway, (c) Vehicle located 4 m from the center of the 5−1 roadway, (d) Vehicle passing 1.5 m beyond the center of the 5−1 roadway.
The process of instantaneous unloading and reloading of the surrounding rock induced by dynamic loads leads to increased loading on the support structure. As vehicles pass through the roadway, localized stress concentrations may occur in the I-beam support system, potentially triggering partial failure of the support structure. Therefore, in support design, it is essential to ensure that the support system possesses adequate stiffness to effectively constrain the surrounding rock.
4.2.2. Analysis of the Deformation Distribution Patterns of the 5−1 Auxiliary Transport Roadway
As illustrated in Figure 10, when no vehicle is present, the total horizontal displacement at both sidewalls of the 5−1 roadway is approximately 0.50 mm, and the combined displacement at the roof and floor is about 2.00 mm, indicating minor deformation of the surrounding rock. As the vehicle approaches the center of the roadway, the horizontal displacement of the sidewalls increases to 1.00 mm, while the combined displacement of the roof and floor rises to 2.50 mm, demonstrating a significant expansion in the deformation zone. The greater deformation observed in the roof and floor compared to the sidewalls suggests that the dynamic load of the vehicle is more effectively transmitted through the vertical direction. The deformation distribution is symmetric along the sidewalls but exhibits localized concentration in the roof and floor, depending on the position of the vehicle load. The closer the vehicle is to the roadway center, the larger the deformation, with more pronounced tensile strain occurring at the roof. After the vehicle passes the center of the roadway, the deformation intensity in both the roof/floor and sidewalls gradually decreases; however, the expansion of the plastic deformation zone remains evident.
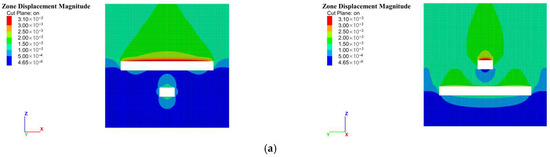
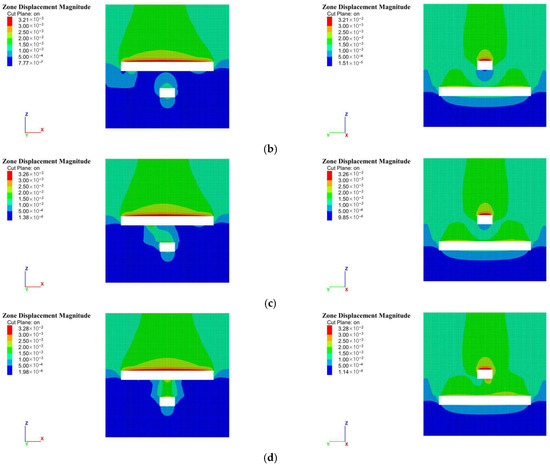
Figure 10.
Deformation distribution pattern of surrounding rock in the 5−1 roadway during rubber-tired vehicle movement. (a) No vehicle present, (b) Rubber-tired vehicle located 10 m from the center of the 5−1 roadway, (c) Rubber-tired vehicle located 4 m from the center of the 5−1 roadway, (d) Rubber-tired vehicle passing 1.5 m beyond the center of the 5−1 roadway. (Note: The left figure represents the view along the Y-direction; the right figure represents the view along the X-direction).
As illustrated in Figure 11, under no vehicle load conditions, the total displacement of the I-beam support at both sidewalls of the 5−1 coal roadway is approximately 0.225 mm, while that of the roof is about 0.3 mm, indicating minimal overall deformation of the support structure. As the vehicle approaches the center of the roadway, the deformation of the roof increases more significantly than that of the sidewalls, suggesting that the dynamic load is transmitted more prominently through the roof and floor. When the rubber-tired vehicle is 10.0 m away from the center of the 5−1 roadway, the total displacement of the sidewalls is about 0.25 mm, and that of the roof is approximately 0.3 mm, indicating negligible variation in the deformation of the I-beam support. At a distance of 4.0 m from the center, the deformation range increases significantly, with the sidewall displacement reaching about 0.4 mm and the roof displacement reaching about 0.5 mm. Moreover, the deformation on the side closer to the vehicle is relatively larger, reaching up to 0.55 mm. When the vehicle is 1.5 m from the center of the 5−1 roadway, the total displacement of the sidewalls remains around 0.4 mm, and that of the roof increases to approximately 0.55 mm, showing a generally symmetrical deformation pattern in the I-beam support structure.
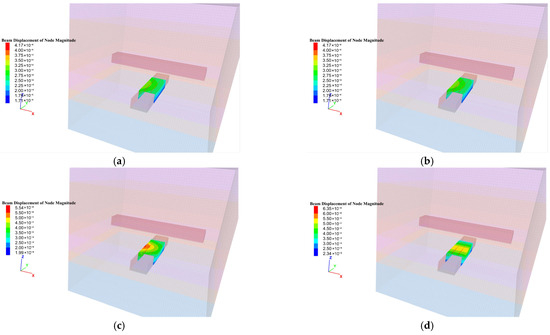
Figure 11.
Deformation distribution pattern of I-beams in the 5−1 roadway during rubber-tired vehicle movement. (a) No vehicle present, (b) Vehicle located 10 m from the center of the 5−1 roadway, (c) Vehicle located 4 m from the center of the 5−1 roadway, (d) Vehicle passing 1.5 m beyond the center of the 5−1 roadway.
5. Conclusions
Under the influence of dynamic vehicle loading, the surrounding rock mass between spatially intersecting roadways is primarily affected by the horizontal stress field. The failure initiates at the surface of the surrounding rock and progressively extends inward. Maintaining the integrity of the surrounding rock mass between intersecting roadways is critical for ensuring the stability of the roadway bearing structure.
The criterion equation for the bearing capacity failure of the surrounding rock mass, induced by the failure of the surrounding rock in spatially intersecting roadways, is expressed as follows:
To prevent the instability of the bearing structure in spatially intersecting roadways, the inter-roadway distance must satisfy the condition .
The effect of vehicle loading significantly intensifies the stress concentration in the surrounding rock. The dynamic load induces an asymmetric stress distribution, with more pronounced stress concentration on the side closer to the vehicle. The vehicle load in the 5−2 coal roadway is transmitted through the surrounding rock to the 5−1 coal roadway, leading to an expansion of the stress concentration zone in the lower roadway. Under the influence of vehicle loading, the deformation of the surrounding rock in both the roof/floor and ribs increases significantly. The tensile deformation of the roof and floor becomes more evident, with the deformation zone concentrated directly beneath the roadway.
A surrounding rock control scheme was proposed for spatially intersecting roadways, in which full-length rock bolt and cable support is applied along the entire upper roadway, while the lower roadway adopts full rock bolt support combined with partial cable reinforcement and supplementary I-beam steel set support. After implementation of the design scheme, no significant deformation was observed in the cross-section of the upper roadway at the intersection zone, and the surrounding rock deformation in the lower roadway was limited to less than 50 mm. The scheme significantly enhanced the integrity of the rock mass between the intersecting roadways.
Author Contributions
Conceptualization, P.Z. and Z.L.; methodology, P.Z. and Z.L.; validation, Z.L. and Y.W.; data curation, Y.W. and L.D.; writing—original draft preparation, Z.L. and Y.C.; writing—review and editing, Z.L. and Y.W. All authors have read and agreed to the published version of the manuscript.
Funding
This research received no external funding.
Data Availability Statement
The data used to support the findings of this study are available from the corresponding author upon request.
Conflicts of Interest
The authors declare no conflicts of interest.
References
- Zhang, M.; Jiang, F.; Wang, J.; Hu, Z.; Liu, J. Space-Time Regularity of Roadway Deformation under Disturbance of Several Coal Seams in Ultra-Deep Mines. Caikuang Yu Anquan Gongcheng Xuebao J. Min. Saf. Eng. 2018, 35, 229–237. [Google Scholar]
- Liu, Q.-S.; Shi, K.; Huang, X. Analysis on Site Monitoring of Roadway under Disturbed Effects by Excavation of Neighboring Roadways. J. China Coal Soc. 2011, 36, 897–902. [Google Scholar]
- Cao, Y.; Li, Y. Deformation Control of Surrounding Rocks of Mining Roadway Indeep and Close Lower Coal Seam. Coal Sci. Technol. 2021, 49, 76–81. [Google Scholar]
- Cao, R.-H.; Cao, P.; Lin, H.; Zhang, K. Deformation Law and Safety Degree of Surrounding Rock in Roadway Intersection. J. Min. Saf. Eng. 2013, 30, 728. [Google Scholar]
- Song, Z.; Ji, H.; Liu, Y.; Sun, L. Influencing Factors of Excavation Disturbance on Neighboring Roadways in Weakly Cemented Rock. J. Min. Saf. Eng. 2016, 33, 806. [Google Scholar]
- Li, G.; Ma, F.; Guo, J.; Zhao, H.; Liu, G. Study on Deformation Failure Mechanism and Support Technology of Deep Soft Rock Roadway. Eng. Geol. 2020, 264, 105262. [Google Scholar] [CrossRef]
- Han, J.; Yang, S.; Zhang, N. Research on Influencing Factors of Excavation Disturbance. J. Min. Saf. Eng. 2014, 31, 932. [Google Scholar]
- Liu, T.; Huang, W.; Xiang, C.; Dong, Q.; Li, X.; Zhang, C. Three-Dimensional Numerical Simulation of Dynamic Strength and Failure Mode of a Rock Mass with Cross Joints. Int. J. Coal Sci. Technol. 2024, 11, 17. [Google Scholar] [CrossRef]
- Zabuski, L. Three-Dimensional Analysis of a Tunnel Excavation in a Jointed Rock Mass. Arch. Hydro-Eng. Environ. Mech. 2024, 71, 123–134. [Google Scholar] [CrossRef]
- Steiakakis, E.; Xiroudakis, G.; Lazos, I.; Vavadakis, D.; Bazdanis, G. Stability Analysis of a Multi-Layered Slope in an Open Pit Mine. Geosciences 2023, 13, 359. [Google Scholar] [CrossRef]
- Xu, W.; Song, W.; Du, J.; Mei, L.; Liu, B. Influence on the Stability of Bottom Structure Openings by Excavation in Metal Mines. Chin. J. Undergr. Space Eng. 2014, 10, 689–696. [Google Scholar]
- Cao, R.-H.; Cao, P.; Zhang, K.; Lin, H. Stability Analysis of Roadway Intersection Considering Strain Softening. Rock Soil. Mech. 2013, 34, 1760–1821. [Google Scholar]
- He, M.; Li, G.; Ren, A.; Yan, J. Analysis of the Stability of Intersecting Chambers in Deep Soft-Rock Roadway Construction. Zhongguo Kuangye Daxue Xuebao 2008, 37, 167–170. [Google Scholar]
- Feng, G.R.; Hao, C.L.; Wang, P.F.; Guo, J.; Qian, R.P.; Wen, X.Z.; Liu, J.N. Asymmetric Deformation Mechanism and Control Measures for Mining Roadway under Gob in Close Proximity. J. China Univ. Min. Technol. 2022, 51, 617–631. [Google Scholar]
- Yu, H.; Zhou, X.; Hu, H. Influence Threshold Analysis on Railway Over-Cross Tunnels. J. Civ. Archit. Environ. Eng. 2015, 2014, 44–51. [Google Scholar]
- Yue, X.Z.; Tu, M.; Li, Y.F.; Zhang, J.S.; Gao, L. Calculation of Subsidiary Mining Stress in Floor Roadway under the Remaining Boundary Pillar of Close Coal Seam Mining. J. Min. Saf. Eng. 2021, 38, 246–252, 259. [Google Scholar]
- Xie, H.; Gao, F.; Ju, Y. Research and Development of Rock Mechanics in Deep Ground Engineering. Chin. J. Rock Mech. Eng. 2015, 34, 2161–2178. [Google Scholar]
- Zheng, M.; Li, S. A Non-Linear Three-Dimensional Failure Criterion Based on Stress Tensor Distance. Rock Mech. Rock Eng. 2022, 55, 6741–6760. [Google Scholar] [CrossRef]
- Wang, C.; Zhang, N.; Li, G. Numerical Simulation and Support of Roadway Intersection. J. Min. Saf. Eng. 2008, 25, 384–388. [Google Scholar]
- Guo, B.; Lu, T.; Tian, C. Numerical Simulation of Influencing Factors on Stability of Flat Roadway Intersection. J. Nal. Min. Saf. Eng. 1990, 19, 19–25. [Google Scholar]
- Zhao, W.-S.; Han, L.-J.; Zhao, Z.-N.; Meng, Q.-B.; Liu, H.-Q. Influence of Principal Stress on Surrounding Rock Stability of Roadway Intersection. Rock Soil Mech. 2015, 36, 1752–1760. [Google Scholar]
- Liu, X.; Ma, J.; Tang, H.; Zhang, S.; Huang, L.; Zhang, J. A Novel Dynamic Impact Pressure Model of Debris Flows and Its Application on Reliability Analysis of the Rock Mass Surrounding Tunnels. Eng. Geol. 2020, 273, 105694. [Google Scholar] [CrossRef]
- Jia, C.; Li, S.; Fan, C.; Tang, J. Numerical Simulation of Mechanical Characteristics of Roadway Surrounding Rock under Dynamic and Static Loading. Shock Vib. 2021, 2021, 1869583. [Google Scholar] [CrossRef]
- Lu, X.L.; Liu, Q.S.; Su, P.-F.; Cui, W.T. Instability Mechanism and Bracing Optimization for Roadway Groups with Soft and Fractured Surrounding Rock in Pan’er Coal Mine. Chin. J. Geotech. Eng. 2013, 35, 97–102. [Google Scholar]
- Zheng, B. Study on Surrounding Rock Reinforcement Technology of Strong Mine Dynamic Pressure Large Deformation Roadway Group. Coal Sci. Technol. 2015, 43, 27–37. [Google Scholar]
- Meng, Q.B.; Qian, W.H.; Li, J. Stability Control Technology of Roadway Surrounding Rock in Soft Ore Body and Its Application. J. Min. Saf. Eng. 2019, 36, 906–915. [Google Scholar]
- Yang, J.; Jiang, Z.; Xie, S. Stability Analysis and Control Technology of Surrounding Rocks at Deep Large Cross-Section Roadway. Coal Sci. Technol. 2020, 48, 49–56. [Google Scholar]
- Guo, Z.; Zhang, Y.; Wang, J. Study on Failure Mechanism and Control Measure of Deep Intersecting Roadway. China Min. Mag. 2015, 24, 150–153. [Google Scholar]
- Zhang, P.; Li, Z.; Wei, Y.; Chen, Y.; Dong, L. Analysis of the Roof Damage Range in Close-Proximity Gently Inclined Coal Seams Mining and the Feasibility of Upward Mining. Sci. Rep. 2025, 15, 5324. [Google Scholar] [CrossRef]
- Sun, X.M.; Zhao, W.C.; Shen, F.X.; Zhang, Y.; Jiang, M. Study on Failure Mechanism of Deep Soft Rock Roadway and High Prestress Compensation Support Countermeasure. Eng. Fail. Anal. 2023, 143, 106857. [Google Scholar] [CrossRef]


Disclaimer/Publisher’s Note: The statements, opinions and data contained in all publications are solely those of the individual author(s) and contributor(s) and not of MDPI and/or the editor(s). MDPI and/or the editor(s) disclaim responsibility for any injury to people or property resulting from any ideas, methods, instructions or products referred to in the content. |
© 2025 by the authors. Licensee MDPI, Basel, Switzerland. This article is an open access article distributed under the terms and conditions of the Creative Commons Attribution (CC BY) license (https://creativecommons.org/licenses/by/4.0/).