Article

A Novel Hyperbolic Unsaturated Bistable Stochastic Resonance System and Its Application in Weak Signal Detection

School of Automation Engineering, University of Electronic Science and Technology of China, Chengdu 611731, China
*
Author to whom correspondence should be addressed.
Appl. Sci. 2025, 15(16), 8970; https://doi.org/10.3390/app15168970
Submission received: 24 June 2025 / Revised: 25 July 2025 / Accepted: 3 August 2025 / Published: 14 August 2025

Abstract

Stochastic resonance (SR) systems possess the remarkable ability to enhance weak signals by transferring noise energy into the signal, and thus have significant application prospects in weak signal detection. However, the classic bistable SR (CBSR) system suffers from the output saturation problem, which limits its weak signal enhancement ability. To address this limitation, this paper proposes an under-damped unsaturated SR system called the UDHQSR system. This SR system overcomes the output saturation problem through a piecewise potential function constructed by combining hyperbolic sine functions and quadratic functions. Additionally, by introducing a damping term, its weak signal detection performance is further improved. Furthermore, the theoretical output SNR of this proposed SR system is derived to quantitatively represent its weak signal detection performance. The particle swarm optimization (PSO) algorithm is used to dynamically optimize the parameters of the UDHQSR system. Finally, the simulated signal and different real bearing fault signals from public datasets are used to verify the effectiveness of the proposed UDHQSR system. Experimental results demonstrate that this UDHQSR system has better abilities for both weak signal enhancement and noise suppression compared with the CBSR system.

1. Introduction

Detecting weak signals submerged in strong noise is a fundamental challenge encountered in various scientific and industrial applications, such as underwater vehicle detection [1], electroencephalogram (EEG) signal processing [2], communication systems [3], and bearing fault diagnosis [4]. In particular, in bearing fault diagnosis applications, the effective diagnosis of early faults is essential to ensure normal operation and personnel safety [5]. However, the characteristic signals generated by early faults generally have very low amplitude and are obscured by strong vibration noise, resulting in a low signal-to-noise ratio (SNR). Traditional signal processing methods typically treat noise as interference, and they also weaken the energy of useful signals while filtering out noise [6]. Unlike traditional methods, the stochastic resonance (SR) method, first proposed by Benzi et al. [7], can transfer part of the energy from noise to the weak signal to enhance it.
Due to these signal enhancement properties, the SR-based weak signal detection methods have been extensively studied by researchers [8,9,10]. The classic bistable SR (CBSR) system is the most commonly used SR system for weak signal detection [11]. Wang et al. proposed a two-dimensional coupled CBSR system [12] for bearing fault diagnosis under α -stable noise. Yang et al. studied an adaptive CBSR system combined with empirical mode decomposition (EMD) [13], which realized nonlinear frequency modulation for weak signal detection in variable-speed bearing fault diagnosis scenarios. Gong et al. proposed a CBSR system combined with wavelet transform [14] for the detection of multi-frequency weak signals. Zhao et al. designed a detection method for weak linear modulation signals by integrating the CBSR system with the fractional Fourier transform [15].
Despite these advances, the inherent output saturation problem [16] of the CBSR system, which is caused by its excessively steep potential walls, limits further improvement of its weak signal enhancement ability. To overcome this issue, many improved unsaturated potential functions have been proposed. Based on the piecewise structure, Liu et al. proposed an unsaturated bistable potential function [5] by replacing the steep potential walls of the CBSR system with a linear function, and its slope can be independently adjusted, which eliminates the output saturation issue. Che et al. proposed a potential function [17] combining the classic bistable potential function of the CBSR system, cosine function, and logarithmic function. The potential walls of this potential function have a smaller slope compared to that of the CBSR system, which weakens the output saturation problem. However, the potential function proposed by Che et al. still contains the x 4 term, and it does not fundamentally eliminate the output saturation issue from the structure of the potential function. Shi et al. proposed a piecewise unsaturated bistable potential function [11], and it has better bearing fault diagnosis performance than the CBSR system. Ref. [18] proposed an unsaturated potential function entirely composed of linear functions, yielding better noise suppression and weak signal enhancement than the classic CBSR system.
Currently, the most widely studied SR systems are over-damped, described by first-order differential equations that neglect the inertial term. The under-damped SR systems are described by a second-order differential function retaining both inertial and damping terms, generally providing better weak signal detection performance than over-damped systems [19]. Zhang et al. proposed an under-damped tristable SR system [20], whose weak signal enhancement performance on bearing fault signals is significantly better than that of the over-damped CBSR system. Cui et al. proposed an under-damped multi-stable SR system [21], which maintains excellent weak signal detection performance under the α -stable noise. Ref. [22] proposed an asymmetric under-damped bistable SR system based on the exponential function.
To overcome the limitations of the CBSR system and further enhance weak signal detection performance, a new under-damped unsaturated bistable stochastic resonance system is proposed. This unsaturated potential function is a combination of a hyperbolic sine function and a quadratic function. The potential’s depth, width, and slope of potential walls can be dynamically and almost independently adjusted. The structure of the proposed potential function exhibits diversity, facilitating the matching of its structure to weak periodic signals. Also, the adjustable slope of the potential walls can effectively eliminate the output saturation problem. Based on this proposed unsaturated potential function, a damping term is also introduced to enhance the noise suppression performance of the SR system.
The remainder of this paper is organized as follows. In Section 2, the output saturation problem of the CBSR system is analyzed in detail. In Section 3, the new under-damped unsaturated bistable SR system is proposed, and the theoretical output SNR of this proposed SR system is derived. Also, the impact of system parameters on the theoretical output SNR is also analyzed. In Section 4, the process of the proposed unsaturated bistable SR system-based weak signal detection algorithm is introduced. In Section 5 and Section 6, both the simulated signal and practical bearing fault signals are used to verify this proposed algorithm.

2. The Output Saturation of the CBSR

The CBSR system can be expressed by the Langevin equation [11], which describes the periodic motion of a Brown particle between potential walls under the joint excitation of the periodic force and noise.
d x d t = d U c ( x ) d x + s ( t ) + n ( t )
In this formula, s ( t ) = A cos ( 2 π f t ) is the weak periodic signal, x ( t ) is the output of the CBSR system. n ( t ) = 2 D δ ( t ) is the white Gaussian noise (WGN), and it satisfies
n ( t ) = 0 n ( t ) n ( t + τ ) = 2 D δ ( τ )
where D is the noise density. The term U c ( x ) inside Formula (1) is the potential function of the CBSR system expressed by
U c ( x ) = a 2 x 2 + b 4 x 4
where a > 0 , b > 0 are the system parameters. The potential function U c ( x ) is shown in Figure 1. This classic bistable potential function has two stable points x s 1 , s 2 = ± a / b , and one unstable point x u n = 0 . When | x | > a / b , the potential walls become steep due to the x 4 term inside the potential function U c ( x ) , causing the force applied to the Brown particle by the potential function to increase rapidly in the direction opposite to the particle’s velocity. This restricts the motion range of the particle and results in the output saturation problem.
Assuming that there is no input ( A = D = 0 ) applied to the CBSR system in Equation (1), the output x ( t ) can be obtained by
x ( t ) = ± a exp ( 2 a t ) 1 + b exp ( 2 a t )
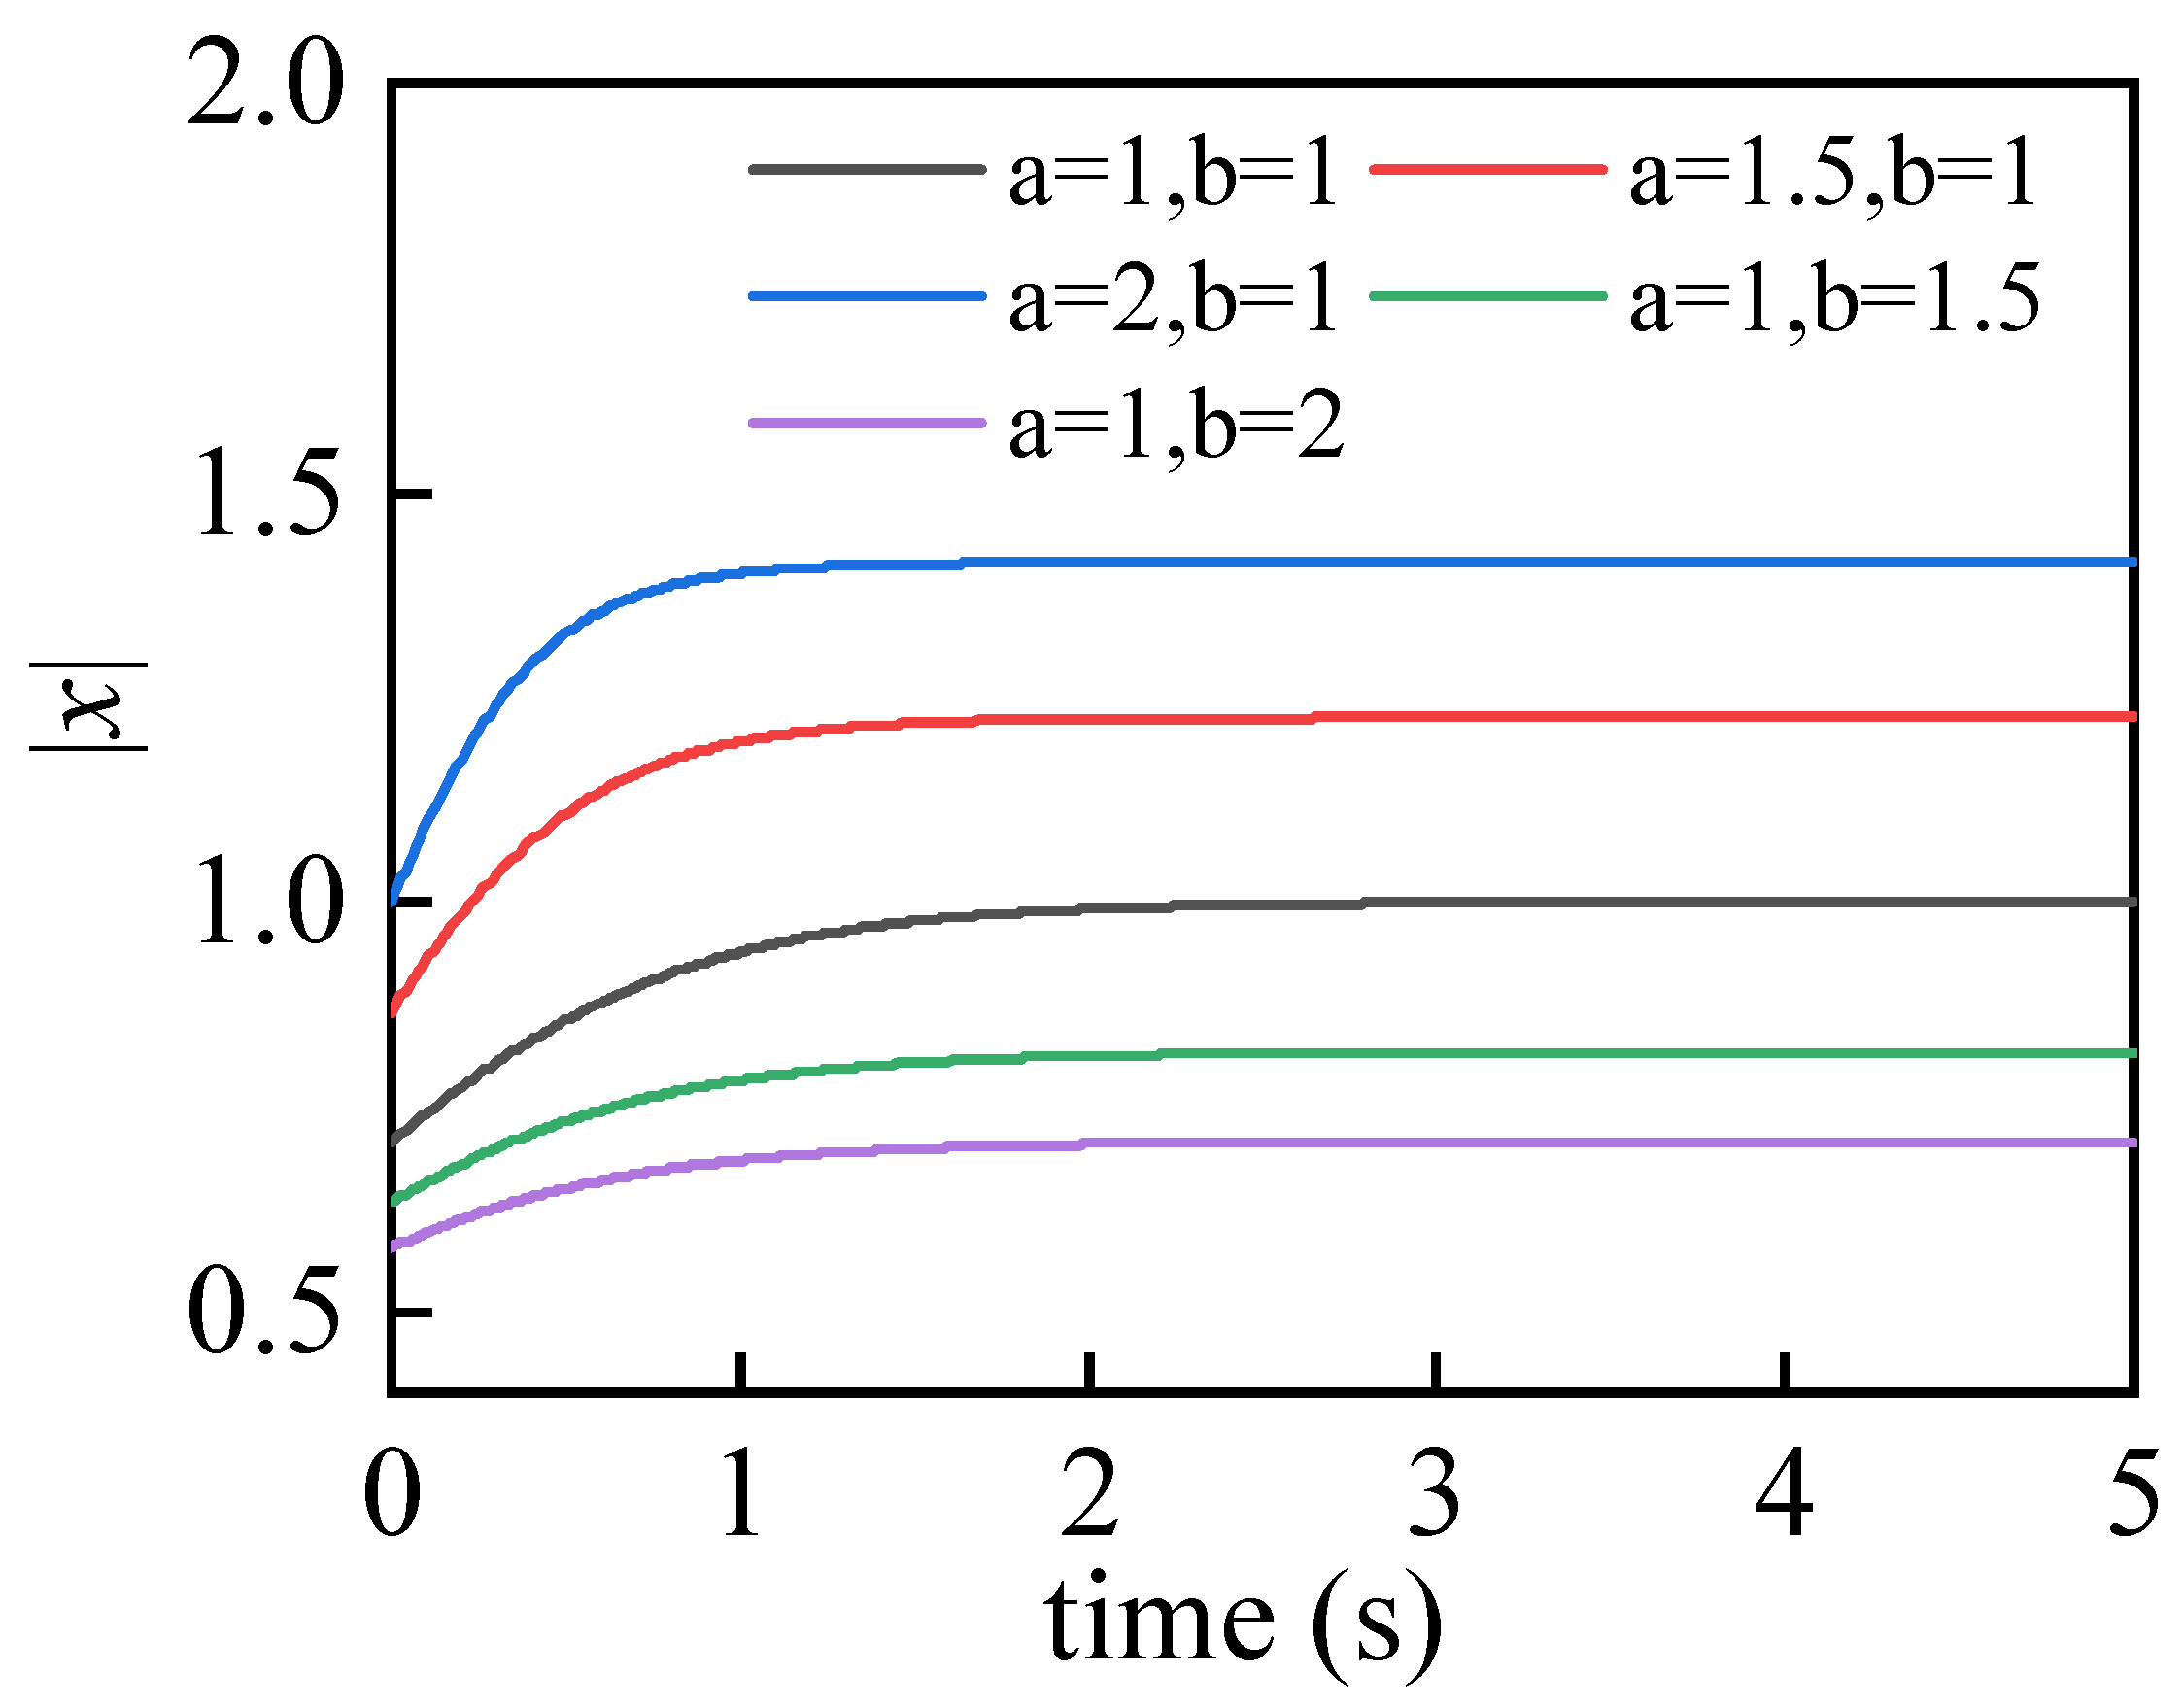
Based on Equation (4), as time increases, the output | x ( t ) | of the CBSR system gradually rises from a / ( a + b ) to a / b , and eventually reaches the stable state. Some examples of this output saturation problem under different parameters a and b are shown in Figure 2. As shown in Figure 2, the absolute value | x | increases simultaneously with the increase in parameter a, whereas it decreases as parameter b increases.
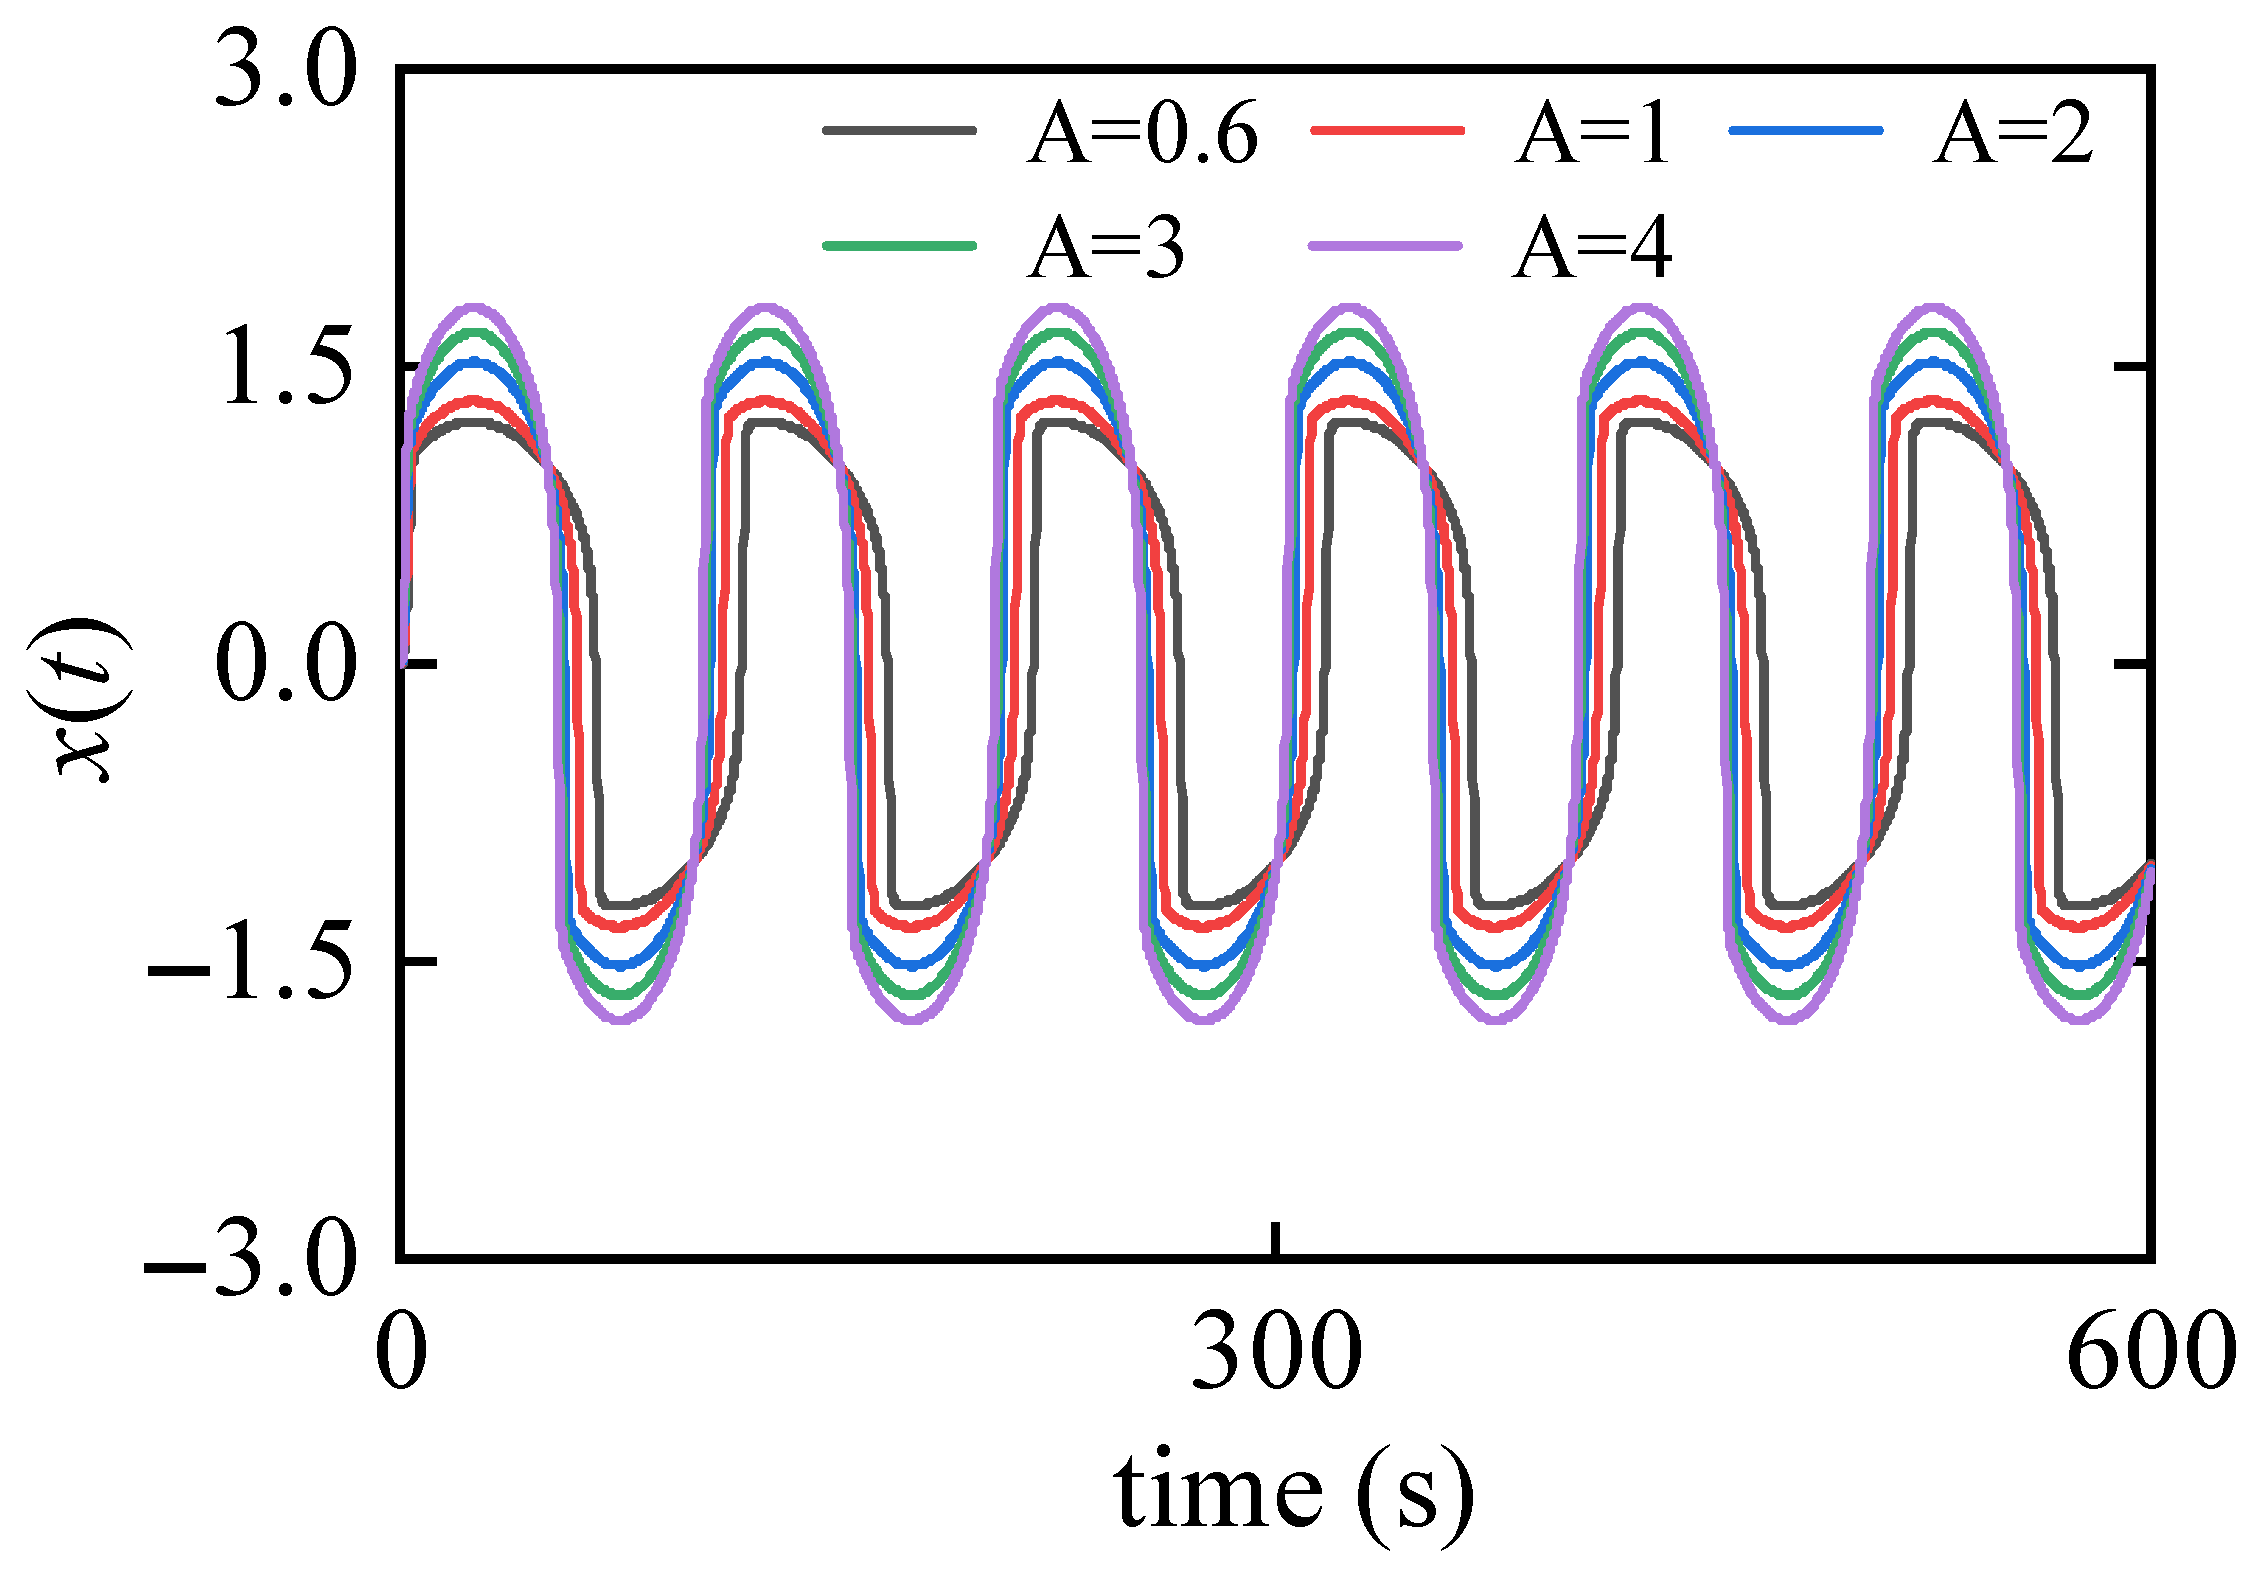
Considering the situation that only weak periodic signal s ( t ) is applied to the CBSR system ( a = b = 1 ), whose frequency is f = 0.05 Hz . According to the fourth-order Runge–Kutta (RK4) numerical integration algorithm, the output x ( t ) of the CBSR system under different values of signal amplitude A is shown in Figure 3. When the input amplitude increases, the amplitude of output x ( t ) does not increase proportionally, but instead gradually approaches a steady state. This output saturation problem caused by the potential function structure limits the weak signal detection ability of the CBSR system.

3. The Analysis of the Proposed UDHQSR System

3.1. The Unsaturated Piecewise Bistable Potential Function

It is noticed that the steep potential wall caused by the x 4 term inside the potential function U c ( x ) is responsible for the output saturation of the CBSR system. To overcome this issue, a novel piecewise bistable potential function U H Q ( x ) combining the hyperbolic sine functions and the quadratic functions is constructed:
U H Q ( x ) = a b 4 c 2 ( x + x p ) ( x + 3 x p ) a 2 4 , x < x p a 2 4 sinh ( x 2 ) sinh ( a 4 b ) , | x | x p a b 4 c 2 ( x x p ) ( x 3 x p ) a 2 4 , x > x p
where x p = 1 2 a / b denotes the partition point. The sinh ( x ) = ( e x e x ) / 2 is the hyperbolic sine function. The shape of the proposed potential function U H Q ( x ) can be adjusted by real positive system parameters a, b, and c. A typical curve of the proposed potential function U H Q ( x ) is shown in Figure 4. This bistable potential function also has two stable points x s 1 , s 2 = ± a / b , and one unstable point x u n = 0 , like the potential function U c ( x ) of the CBSR system.
Comparing the CBSR’s potential function shown in Figure 1 and the proposed potential function shown in Figure 4, it can be seen that when | x | > a / b , the slope of the potential wall of the proposed U H Q ( x ) is gentler, which can increase the output amplitude of the SR system.
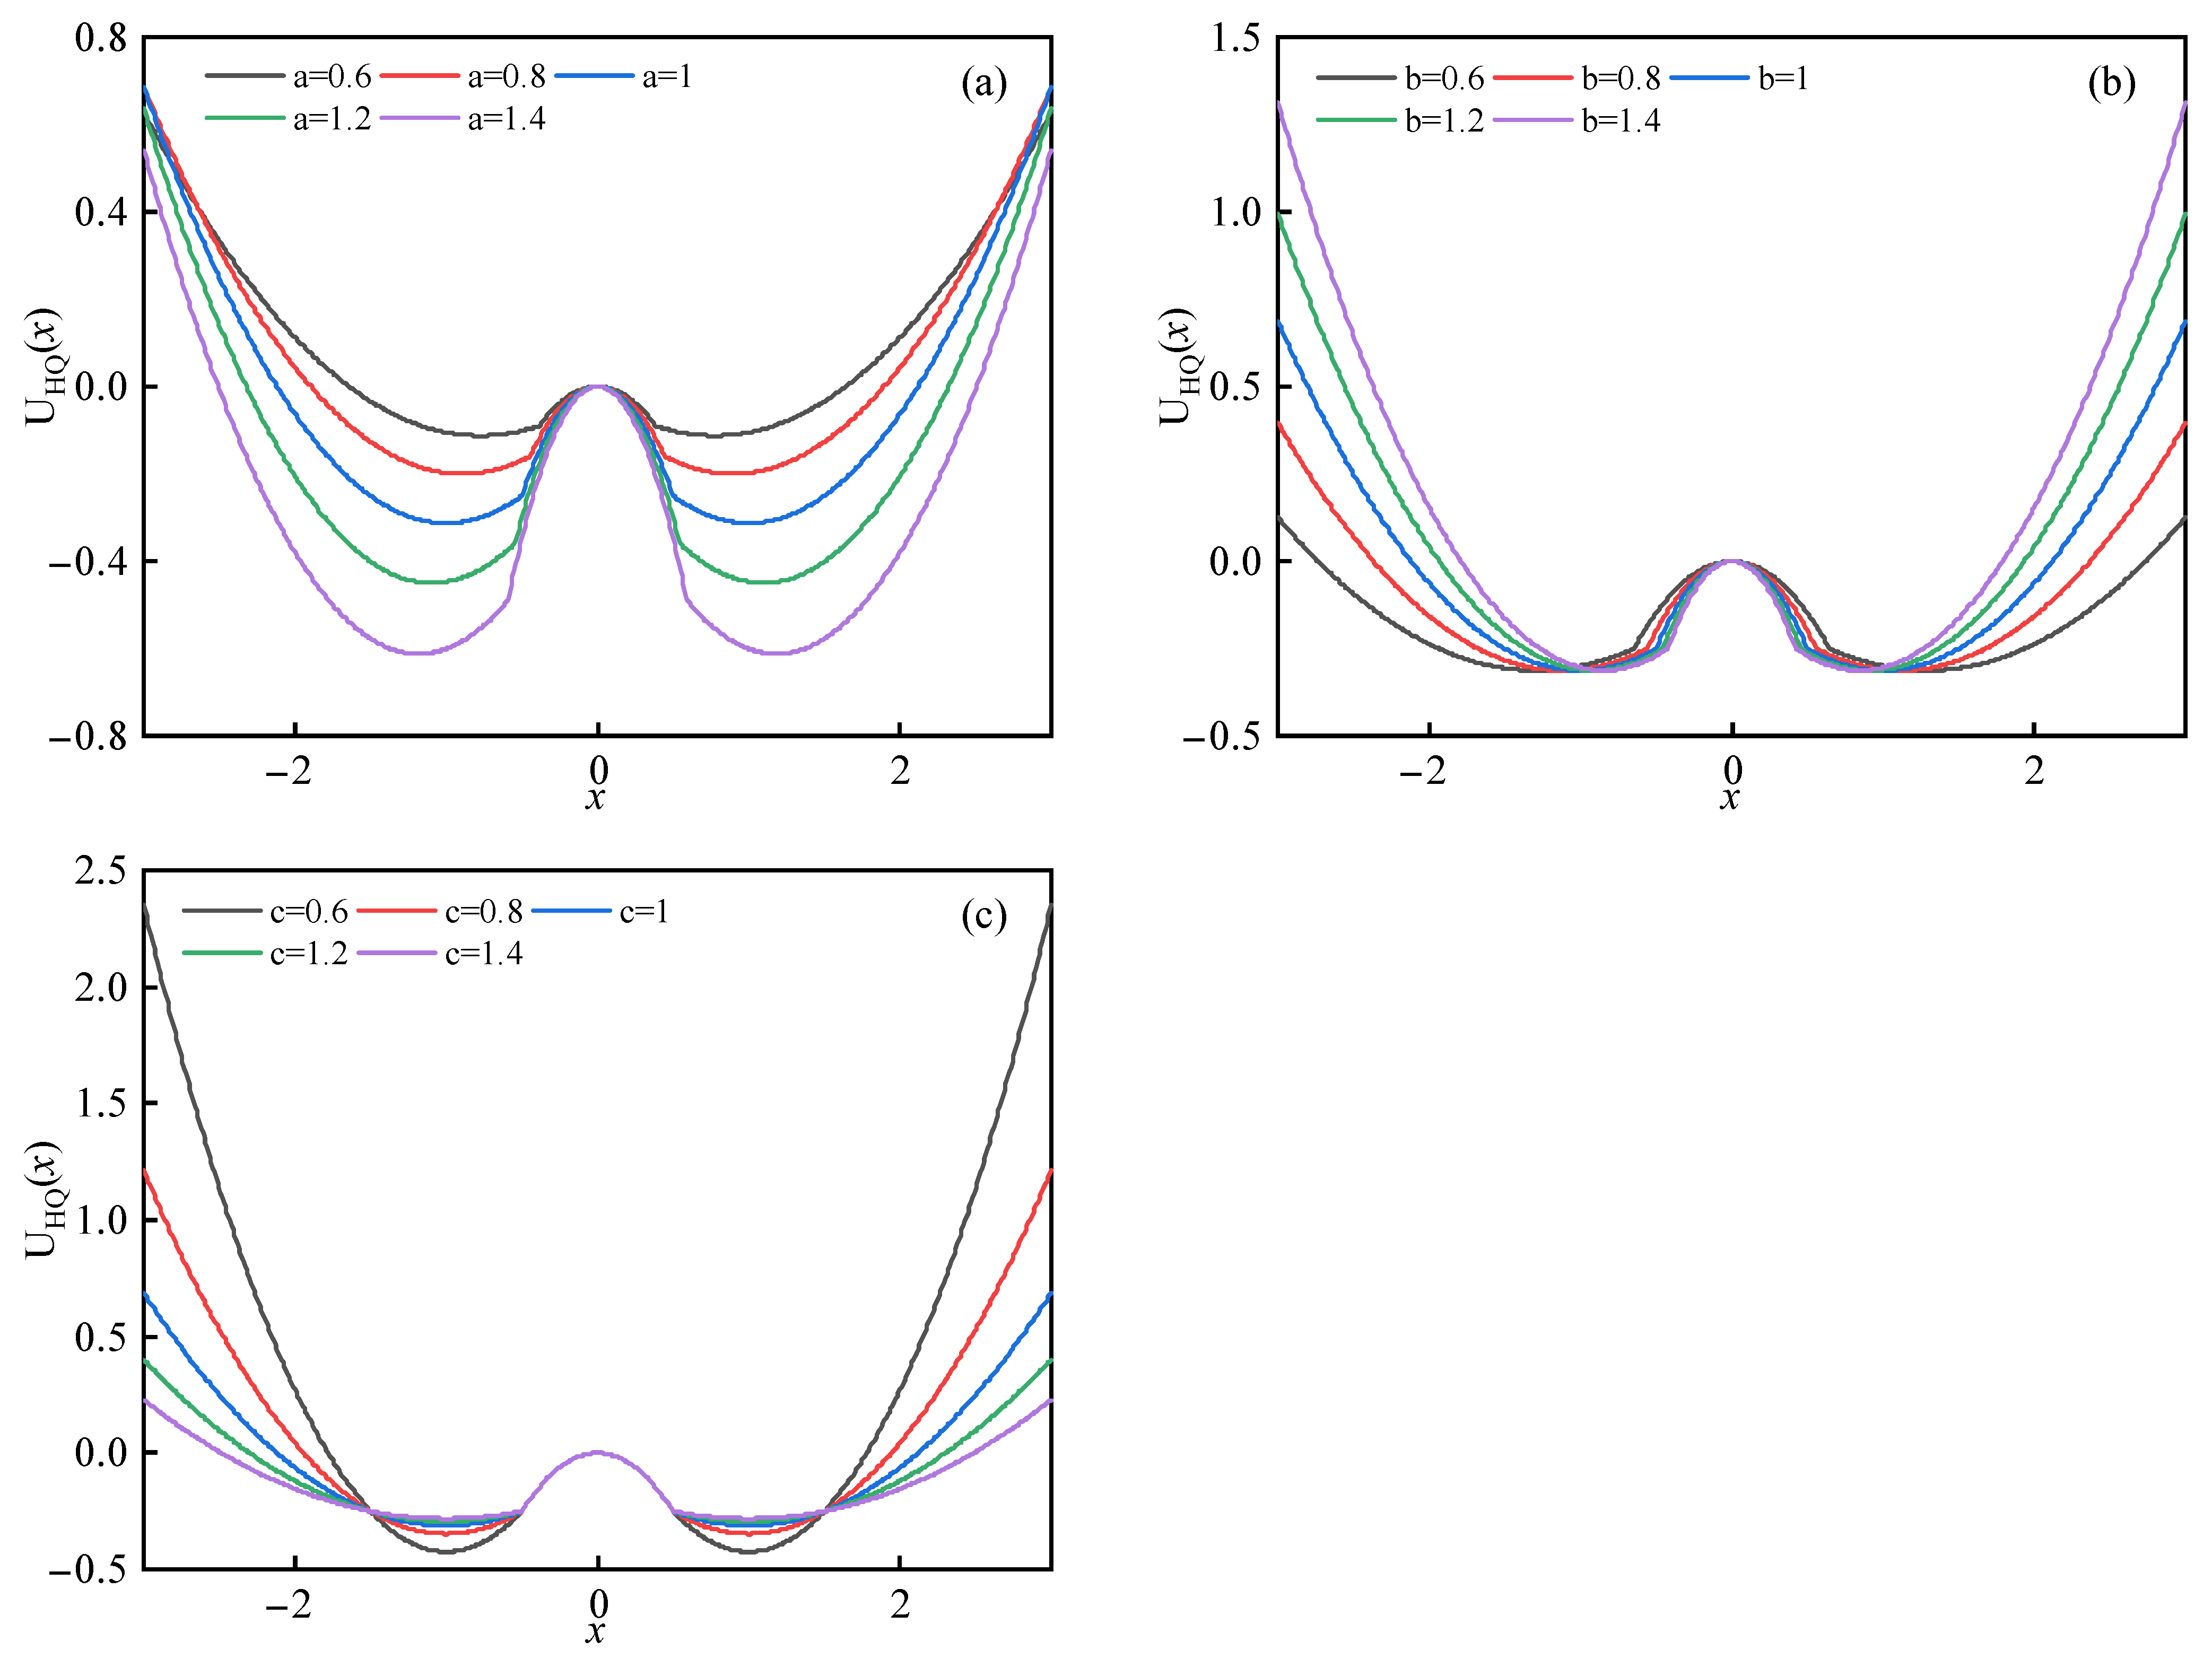
Figure 5 demonstrates the impact of system parameter values on the shape of the proposed potential function U H Q ( x ) . In Figure 5a, only parameter a increases from 0.6 to 1.4; the depth of the potential wall increases significantly, and the proposed potential function also broadens slightly. A deeper potential wall means that the Brown particle requires more energy to move from one potential wall to another, making the SR more difficult to occur. The width of the potential wall in the proposed U H Q ( x ) is mainly controlled by parameter b, as shown in Figure 5b. When only parameter b increases, the width of the potential walls gradually decreases, and the slope of the potential walls slightly increases. From Figure 5c, the slope of the potential walls of the proposed U H Q ( x ) decreases with the increase in parameter c. By adjusting parameter c, the slope of the potential walls can be independently adjusted, which means the proposed potential function overcomes the output saturation problem of the CBSR system.
Based on the proposed potential function (5), the proposed under-damped unsaturated bistable SR (abbreviated as the UDHQSR) system can be expressed by the second-order Langevin equation:
d 2 x d t 2 + β d x d t = d U H Q ( x ) d x + A cos ( 2 π f t ) + 2 D δ ( t )
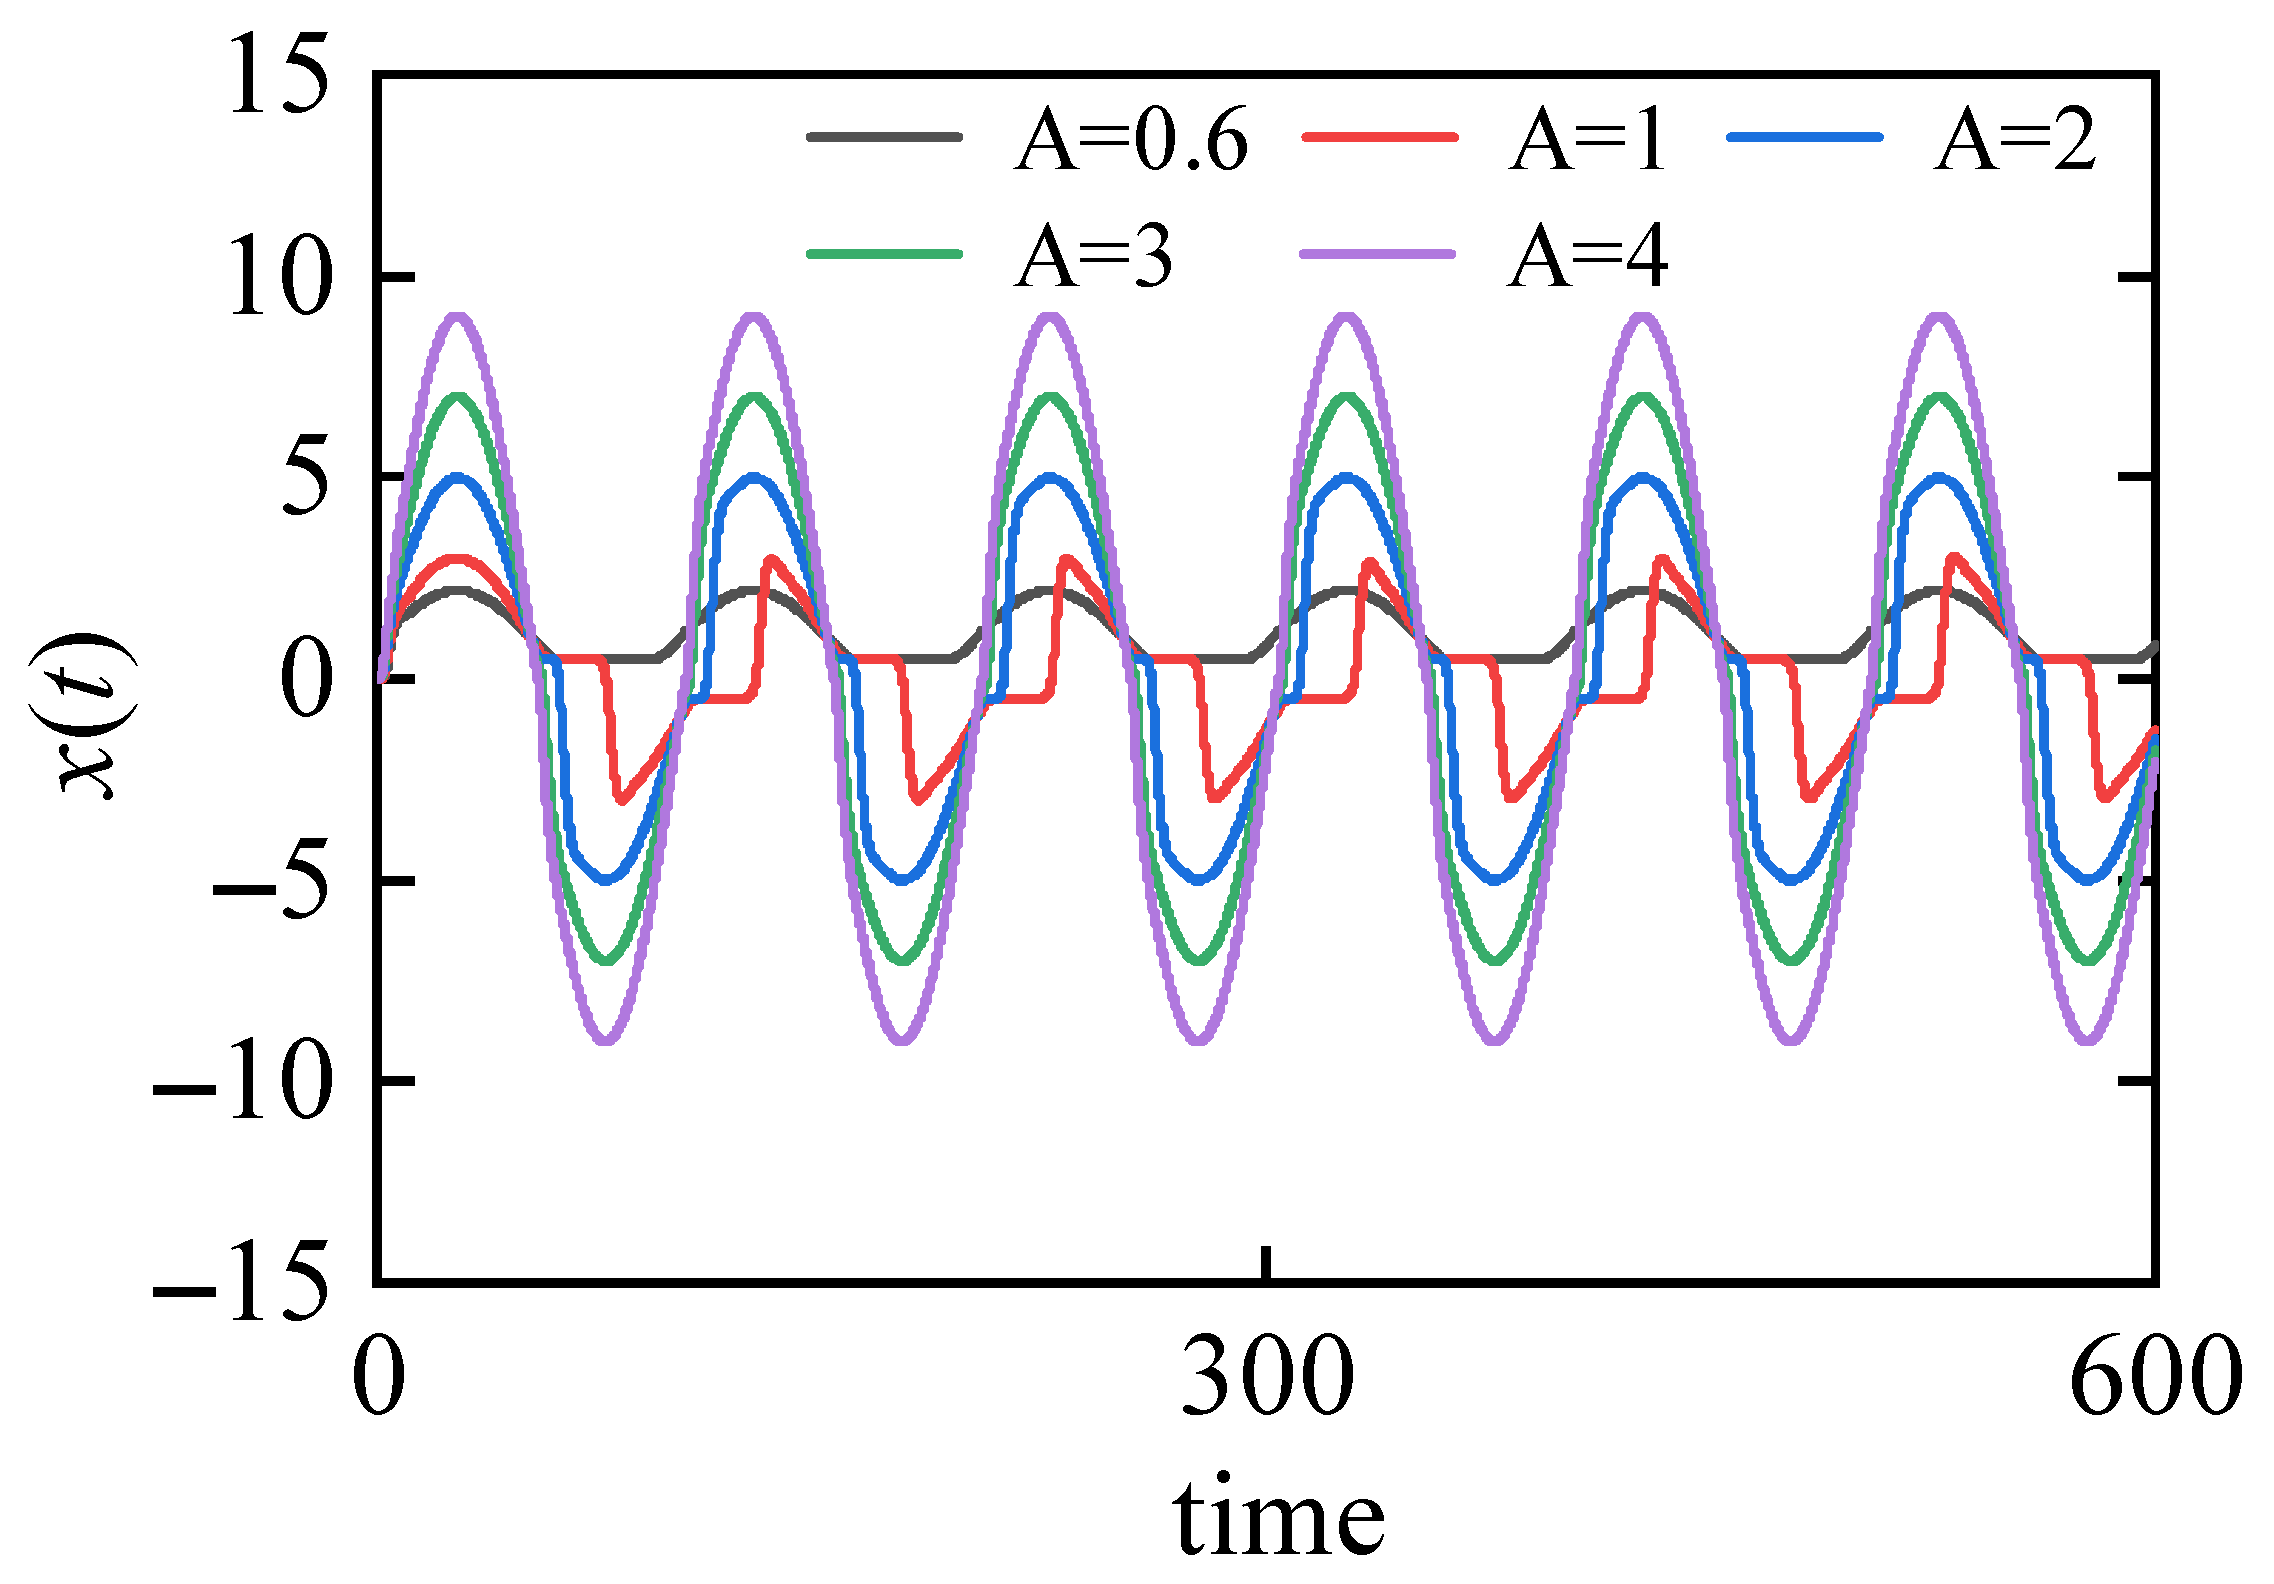
where β is the damping ratio. When only considering weak periodic signals, and neglecting noise ( A 0 , D = 0 ), the output x ( t ) of the proposed UDHQSR system under different input amplitudes is shown in Figure 6. When the input amplitude A increases from 0.6 to 4, the output amplitudes increase proportionally and synchronously, unlike the CBSR system shown in Figure 3. Moreover, for all input signals with amplitudes A greater than 1, the output amplitudes of the proposed UDHQSR system are larger than that of the CBSR system. This also indicates that the proposed UDHQSR system solves the output saturation problem.

3.2. Derivation of the Theoretical Output SNR

The output SNR is a key metric for evaluating the weak signal detection performance of an SR system, and is also particularly important for analyzing the impact of different system parameters on the detection ability of the SR system.
Let y = d x / d t ; the proposed UDHQSR system can be rewritten as
d x d t = y d y d t = β y d U H Q ( x ) d x + A c o s ( 2 π f t ) + 2 D δ ( t )
Then, three singularities of Equation (7) can be obtained by determining d x / d t = d y / d t = 0 under static conditions A = D = 0 :
E s 1 = ( x s 1 , 0 ) E s 2 = ( x s 2 , 0 ) E u n = ( x u n , 0 )
From Equation (7), the Hessian matrix of the proposed UDHQSR system can be obtained as
H = 0 1 g ( x ) β
where g ( x ) = d 2 U H Q ( x ) / d x 2 . Combing the Hessian matrix (Equation (9)) and three singularities (Equation (8)), the eigenvalues of the two stable points and one unstable point are
λ i ± = β ± β 2 + 4 g ( x i ) 2 , ( i = s 1 , s 2 , u n )
The Fokker–Planck equation (FPE) of this proposed UDHQSR system can be represented as [22]
t ρ ( x , y , t ) = x y ρ ( x , y , t ) + D 2 x 2 + 2 y 2 ρ ( x , y , t ) x β y d U H Q d x + A c o s ( 2 π f t ) ρ ( x , y , t )
where ρ ( x , y , t ) is the probability density function (pdf) describing the motion of the Brown particle in the proposed potential function U H Q ( x ) . If the input signal s ( t ) satisfies the adiabatic approximation condition [23] ( A 1 and f 1 ), the steady-state pdf is represented by solving Equation (11) [24]:
ρ s t ( x , y , t ) = N exp ( U ˜ H Q ( x , y , t ) D )
where N is a normalization constant that ensures the sum of probability to 1. U ˜ H Q ( x , y , t ) is the generalized potential function expressed as
U ˜ H Q ( x , y , t ) = β 1 2 y 2 + U H Q ( x ) x A c o s ( 2 π f t )
The theoretical output SNR can be calculated by the Kramer escape rates [25] r ± , which describe the probability of the Brown particle transitioning from one potential wall to another within a potential function [26]. The Kramer escape rates can be represented by [27]
r + ( t ) = λ s 1 + λ s 1 2 π λ u n + λ u n exp U ˜ H Q ( E s 1 , t ) U ˜ H Q ( E u n , t ) D
r ( t ) = λ s 2 + λ s 2 2 π λ u n + λ u n exp U ˜ H Q ( E s 2 , t ) U ˜ H Q ( E u n , t ) D
where
λ s 1 + λ s 1 = λ s 2 + λ s 2 = a b 2 c 2 λ u n + λ u n = | sinh ( a 4 b ) | 2 a 2 × β + β 2 + a 2 2 sinh ( a 4 b ) 2
Then, under the adiabatic approximation condition, the Kramer escape rates are simplified by the Taylor expansion:
r + ( t ) = μ 1 α 1 A c o s ( 2 π f t ) + o ( A ) r ( t ) = μ 2 + α 2 A c o s ( 2 π f t ) + o ( A )
The variables μ 1 , μ 2 , α 1 , and α 2 are defined as
μ 1 = r + ( t ) | A cos ( ω t ) = 0 = λ s 1 + λ s 1 2 π λ u n + λ u n exp β a 2 ( 1 + 4 c 2 ) 16 c 2 D α 1 = d r + ( t ) d ( A cos ( ω t ) ) | A cos ( ω t ) = 0 = β x s 1 μ 1 D μ 2 = r ( t ) | A cos ( ω t ) = 0 = λ s 2 + λ s 2 2 π λ u n + λ u n exp β a 2 ( 1 + 4 c 2 ) 16 c 2 D α 2 = d r ( t ) d ( A cos ( ω t ) ) | A cos ( ω t ) = 0 = β x s 2 μ 2 D
According to this expanded form of Kramer escape rates r ± ( t ) , the theoretical output SNR of the proposed UDHQSR system is formulated as [22]
SNR = π A 2 ( μ 1 α 2 + μ 2 α 1 ) 2 4 μ 1 μ 2 ( μ 1 + μ 2 )
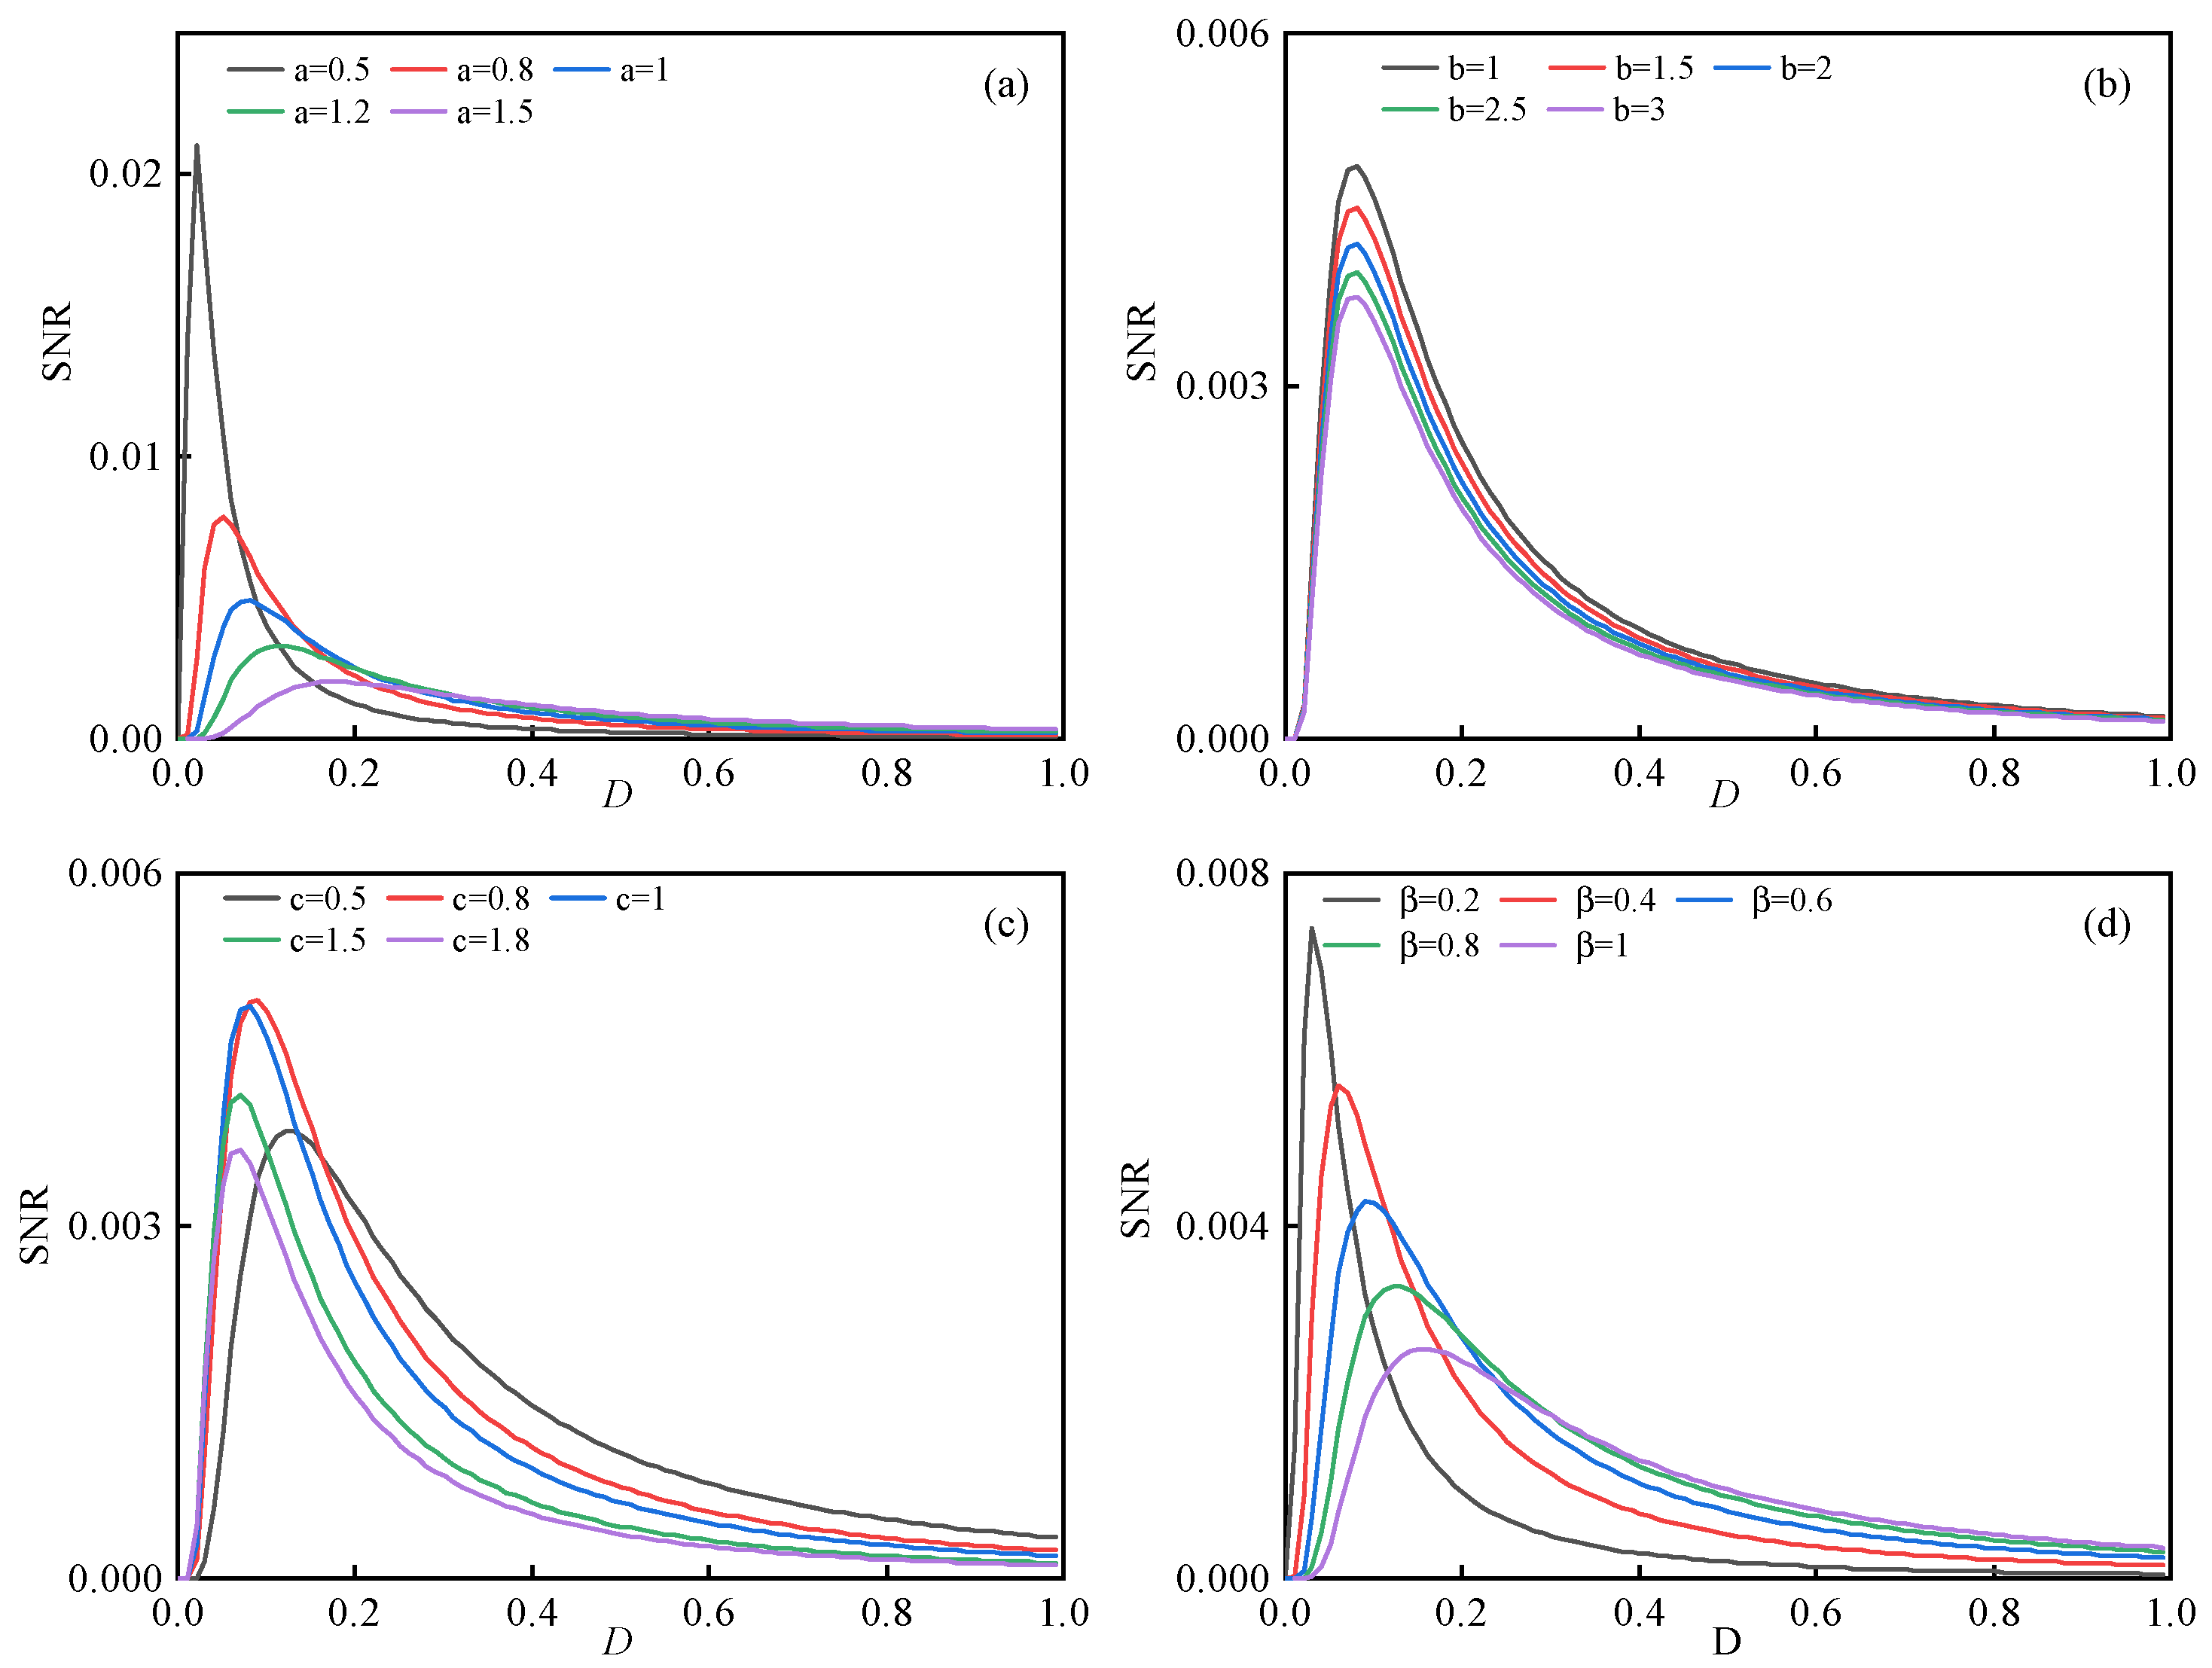
Combining the equations from Equation (15) to Equation (18), the theoretical output SNR of the proposed UDHQSR system is jointly determined by system parameters (a, b, c, and β ), the signal amplitude A, and the input noise density D. For this complex relationship, Figure 7 shows the curves of the theoretical output SNR versus input noise density D under different system parameters. The SNR curves shown in Figure 7 all exhibit a unimodal characteristic, and these peaks mean that the weak signal, noise, and the nonlinear potential function are optimally matched. Figure 7a shows that when only parameter a changes, the larger the value of a, the lower the output SNR value. This is because the proposed potential function with a large parameter a has deeper potential walls, making it more difficult for a Brown particle to move between potential walls.
As shown in Figure 7b, when parameter b increases, the input noise density D at which the output SNR reaches its peak remains unchanged, but the peak amplitude gradually decreases. As parameter b increases, the slight increase in the slope of the potential walls makes the occurrence of the SR more difficult, thereby leading to a decrease in the SNR peak amplitude shown in Figure 7b.
Figure 7c shows the effect of parameter c on the output SNR. When c increases from 0.5 to 1, the peak value of the SNR gradually increases and shifts toward low noise density D. This is because the potential walls become flatter with increasing c, making it more likely for SR to occur. However, when c increases further from 1 to 1.8, the potential walls become excessively flat, which suppresses the occurrence of SR. As a result, the peak SNR value decreases and shifts further toward lower D.
In Figure 7d, the peak amplitude of the SNR gradually decreases with increasing parameter β . A larger β means that the system has greater damping; the Brown particle requires more energy to move between potential walls, which leads to a decrease in the SNR peak amplitude. However, at high input noise density D, the UDHQSR system with a larger damping ratio β exhibits a higher output SNR compared to that with smaller β . Therefore, a large β helps improve the weak signal detection ability of the proposed UDHQSR system under high noise density D.

4. Weak Signal Detection Algorithm Based on the UDHQSR System

Based on the above output SNR analysis of the proposed UDHQSR system, its weak signal enhancement ability is jointly determined by system parameters and noise density. However, in practical weak signal detection applications, the noise density D of the input signal is impossible to obtain accurately. Therefore, it is necessary to adaptively adjust the system parameters of the proposed UDHQSR system according to the characteristics of the input signal.
The practical output SNR is used to evaluate the weak signal enhancement performance of the proposed UDHQSR system under a given set of parameters. The output SNR is calculated directly from the Fourier transform X ( k ) of the output x ( t ) :
SNR o u t = 20 log 10 X ( k 0 ) k = 0 N / 2 1 X ( k ) X ( k 0 )
where k 0 = N f / f s , N is the length of output x ( t ) , and f s is the sampling frequency. The Fourier transform X ( k ) is represented by Equation (21), and calculated by the Fast Fourier Transform (FFT) algorithm.
X [ k ] = n = 0 N 1 x [ n ] e j 2 π n k N ( 0 k N 1 )
Then, the PSO algorithm invented by Eberhart and Kennedy [28] is used to optimize the parameters of the UDHQSR system. The PSO algorithm is a population-based optimization method that mimics the foraging behavior of birds. It contains M particles, and each particle i , ( i [ 1 , M ] ) has a position vector X i , representing a potential solution, and a velocity vector V i :
X i = [ x i , 1 , x i , 2 , , x i , L ] V i = [ v i , 1 , v i , 2 , , v i , L ]
where L is the dimension of the solution to the optimization problem. The updated formulas of the position vector and the velocity vector are
V i , j t + 1 = ω V i , j t + c 1 × r 1 × ( p b e s t i , j X i , j t ) + c 2 × r 2 × ( g b e s t j X i , j t )
X i , j t + 1 = X i , j t + V i , j t + 1
where j [ 1 , L ] . t [ 1 , T ] is the iteration number, and T is the maximum number of iterations. r 1 and r 2 are random numbers uniformly distributed in ( 0 , 1 ) . The p b e s t i vector is the personal best position of a particle i during iterations, and g b e s t vector is the global best position of the population. c 1 and c 2 are the learning rates. ω is the inertial weight, which is represented by the linear decreasing form (25) to balance the local search ability and the global search ability [29].
ω = ω m a x t T ( ω m a x ω m i n )
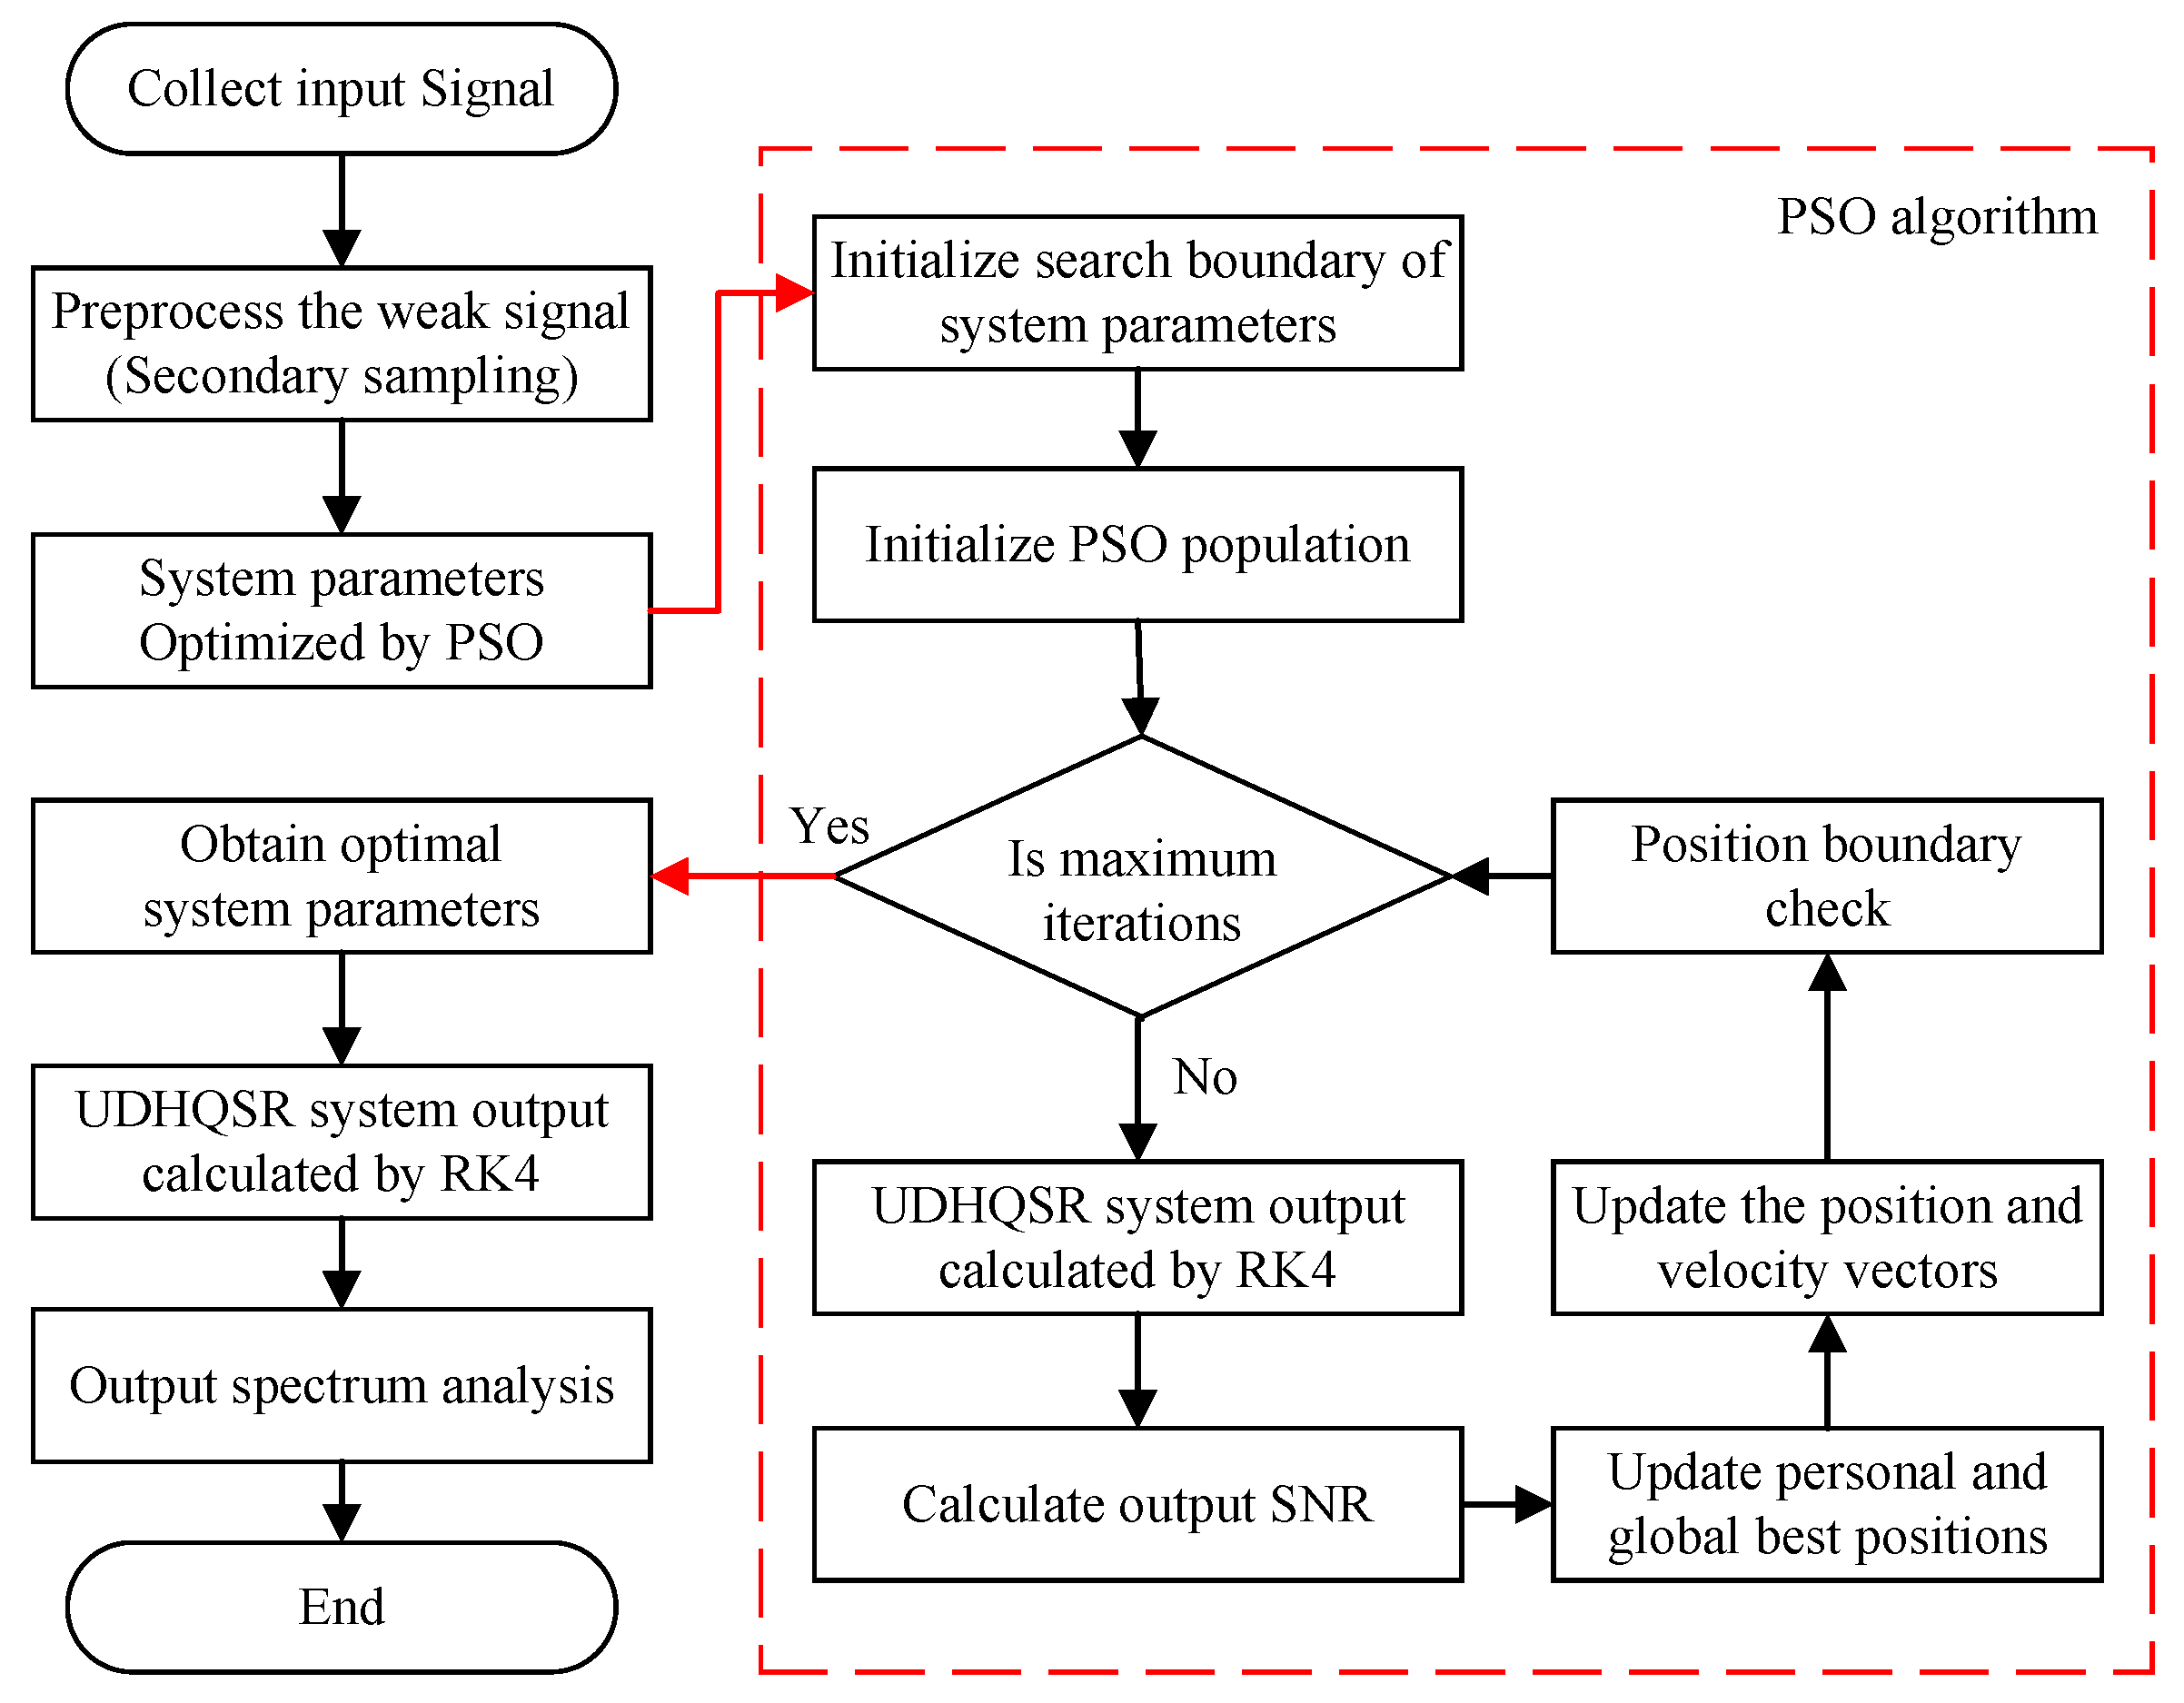
Combing the PSO algorithm and the output SNR calculation Formula (20), the flowchart of the proposed UDHQSR system-based weak signal detection method is shown in Figure 8. The input weak signal first undergoes a preprocessing step, because the actual weak signal’s frequency is often much greater than 1, violating the adiabatic approximation condition. Therefore, the secondary sampling method [30] is used in this preprocessing step to numerically transform the large frequency value to a small one. The scale factor of this secondary sampling method is defined as R. Then, for a signal with a frequency of f and sampling frequency of f s , its secondary sampled signal frequency and sampling frequency are f d = f / R and f s d = f s / R , respectively.
After the secondary sampling, the PSO method will optimize the system parameters. The position vector of a particle i is expressed as X i = [ a , b , c , β ] . And the boundary conditions for each element of the position vector X i are also determined. After each update of position vector X i and velocity vector V i using Equations (23) and (24), a boundary check is performed to ensure that elements of both vectors remain within the feasible solution space. Finally, when the PSO algorithm is completed, the output x ( t ) of the proposed UDUBSR system can be calculated by the RK4 algorithm with the optimal parameters.
Some necessary parameters for the PSO algorithm are shown in Table 1. In Figure 8, the PSO population is initialized randomly, using the following initialization formula:
X i , j 0 = X m i n , j + r j × ( X m a x , j X m i n , j )
where X i , j 0 is the initial value of the particle i in the j-th dimension; X m i n , j and X m a x , j are the lower and upper bounds of the j-th dimension, respectively. The random number r j is uniformly distributed in ( 0 , 1 ) .

5. Simulation Verification

In this section, the weak signal detection performance of the proposed UDHQSR system (7) is verified by simulated weak signals.
First, assume a weak periodic signal with an amplitude of A = 0.1 and a frequency of f = 0.05 Hz, and its sampling frequency is f s = 5 Hz. Then, by increasing the noise density D in Equation (7), the SNR of the test weak signal is set to 29 dB. The original test weak signal is shown in Figure 9a; the periodic signal represented by the red curve has been completely submerged by strong noise and cannot be distinguished in the time domain. Similarly, from the frequency domain, it can also be seen that the frequency component of the periodic signal is drowned out by the widely distributed WGN.
Based on the process shown in Figure 8 and some necessary parameter settings shown in Table 1, the output result of the proposed UDHQSR system for small-frequency weak signal is illustrated in Figure 9c,d. Since the small-frequency test weak signal satisfies the adiabatic approximation requirement, the scale factor R of the secondary sampling method is set to 1. From the time-domain waveform in Figure 9c, it can be seen that the output of the UDHQSR system (blue curve) exhibits a periodic characteristic similar to that of the input weak signal (red curve, original amplitude multiplied by 10). Moreover, the amplitude of the UDHQSR system’s output is much greater than that of the input weak signal. By comparing the output spectrum in Figure 9d of the proposed UDHQSR system with the spectrum in Figure 9b of the input signal, the proposed UDHQSR system has a strong enhancement capability for the weak periodic signal, while effectively suppressing broadband noise. The output result of the CBSR system used for comparison is shown in Figure 9e,f. The amplitude of the CBSR system’s output in the time domain (Figure 9e) is smaller than that of the proposed UDHQSR system, and output saturation evidently appears. Furthermore, in the spectrum in Figure 9f of the CBSR output, there is still considerable noise in the low-frequency range, and the amplitude at the signal frequency is much smaller than the amplitude achieved by the proposed UDHQSR system. According to Equation (20), the output SNR of the proposed UDHQSR system is S N R o u t = 4.18 dB. The SNR gain is S N R G a i n = 33.18 dB. Similarly, the output SNR of the CBSR system is S N R o u t = 9.8 dB, and the SNR gain is S N R G a i n = 19.2 dB. Therefore, the proposed UDHQSR system demonstrates excellent enhancement ability for a weak periodic signal with small frequency.
The iteration processes of both the proposed UDHQSR system and the CBSR system are shown in Figure 10a,b, respectively. As shown in Figure 10, the proposed UDHQSR system quickly converges to the optimal solution after 5 iterations, while the CBSR system takes more than 28 iterations to converge. This indicates that the proposed UDHQSR system has a faster convergence speed than the CBSR system. However, comparing the potential function in Equation (5) of the proposed UDHQSR system to the CBSR’s potential function in Equation (3), the proposed UDHQSR system has a more complex potential function. Both systems were processed in Matlab on a Thinkbook laptop from Lenovo (China) with a Ryzen 7480H processor manufactured by AMD (USA) and 32GB of RAM.. One iteration of the proposed UDHQSR system takes about 0.68 s, while one iteration of the CBSR system takes about 0.3 s. The long single-iteration time of the proposed UDHQSR system is mainly due to the complexity of its potential function. However, the proposed UDHQSR system takes approximately 3.4 s to converge to the stable state, while the CBSR system takes about 8.4 s to converge. This implies that the proposed UDHQSR system still remains highly efficient.
Furthermore, the frequency of the test weak signal is set to f = 100 Hz to simulate a practical weak signal detection scenario. The sampling frequency is f s = 10 kHz, and the SNR of the test weak signal is still 29 dB. Because this measured weak signal does not satisfy the adiabatic approximation requirement, the scale factor of the secondary sampling method is set to R = 2000 .
The large frequency test weak signal is shown in Figure 11a,b. The weak periodic signal is completely submerged by the strong white noise, making it indistinguishable in both the time domain and the frequency domain. The processing result of the proposed UDHQSR system is shown in Figure 11c,d. In the spectrum in Figure 11d, a peak with an amplitude of 46.54 appears at 100 Hz, which is much greater than the amplitude of the input weak periodic signal, indicating that the input weak signal has been effectively enhanced. The output SNR of the proposed UDHQSR system is S N R o u t = 3.2 dB, and the SNR gain is S N R G a i n = 32.2 dB. The proposed UDHQSR system demonstrates good detection performance for both large-frequency and small-frequency weak signals.

6. Bearing Fault Signal Verification

In this section, bearing fault signals are used to verify the weak signal detection ability of the proposed UDHQSR system in practical engineering applications.

6.1. Fault Diagnosis Verification via the CWRU Dataset

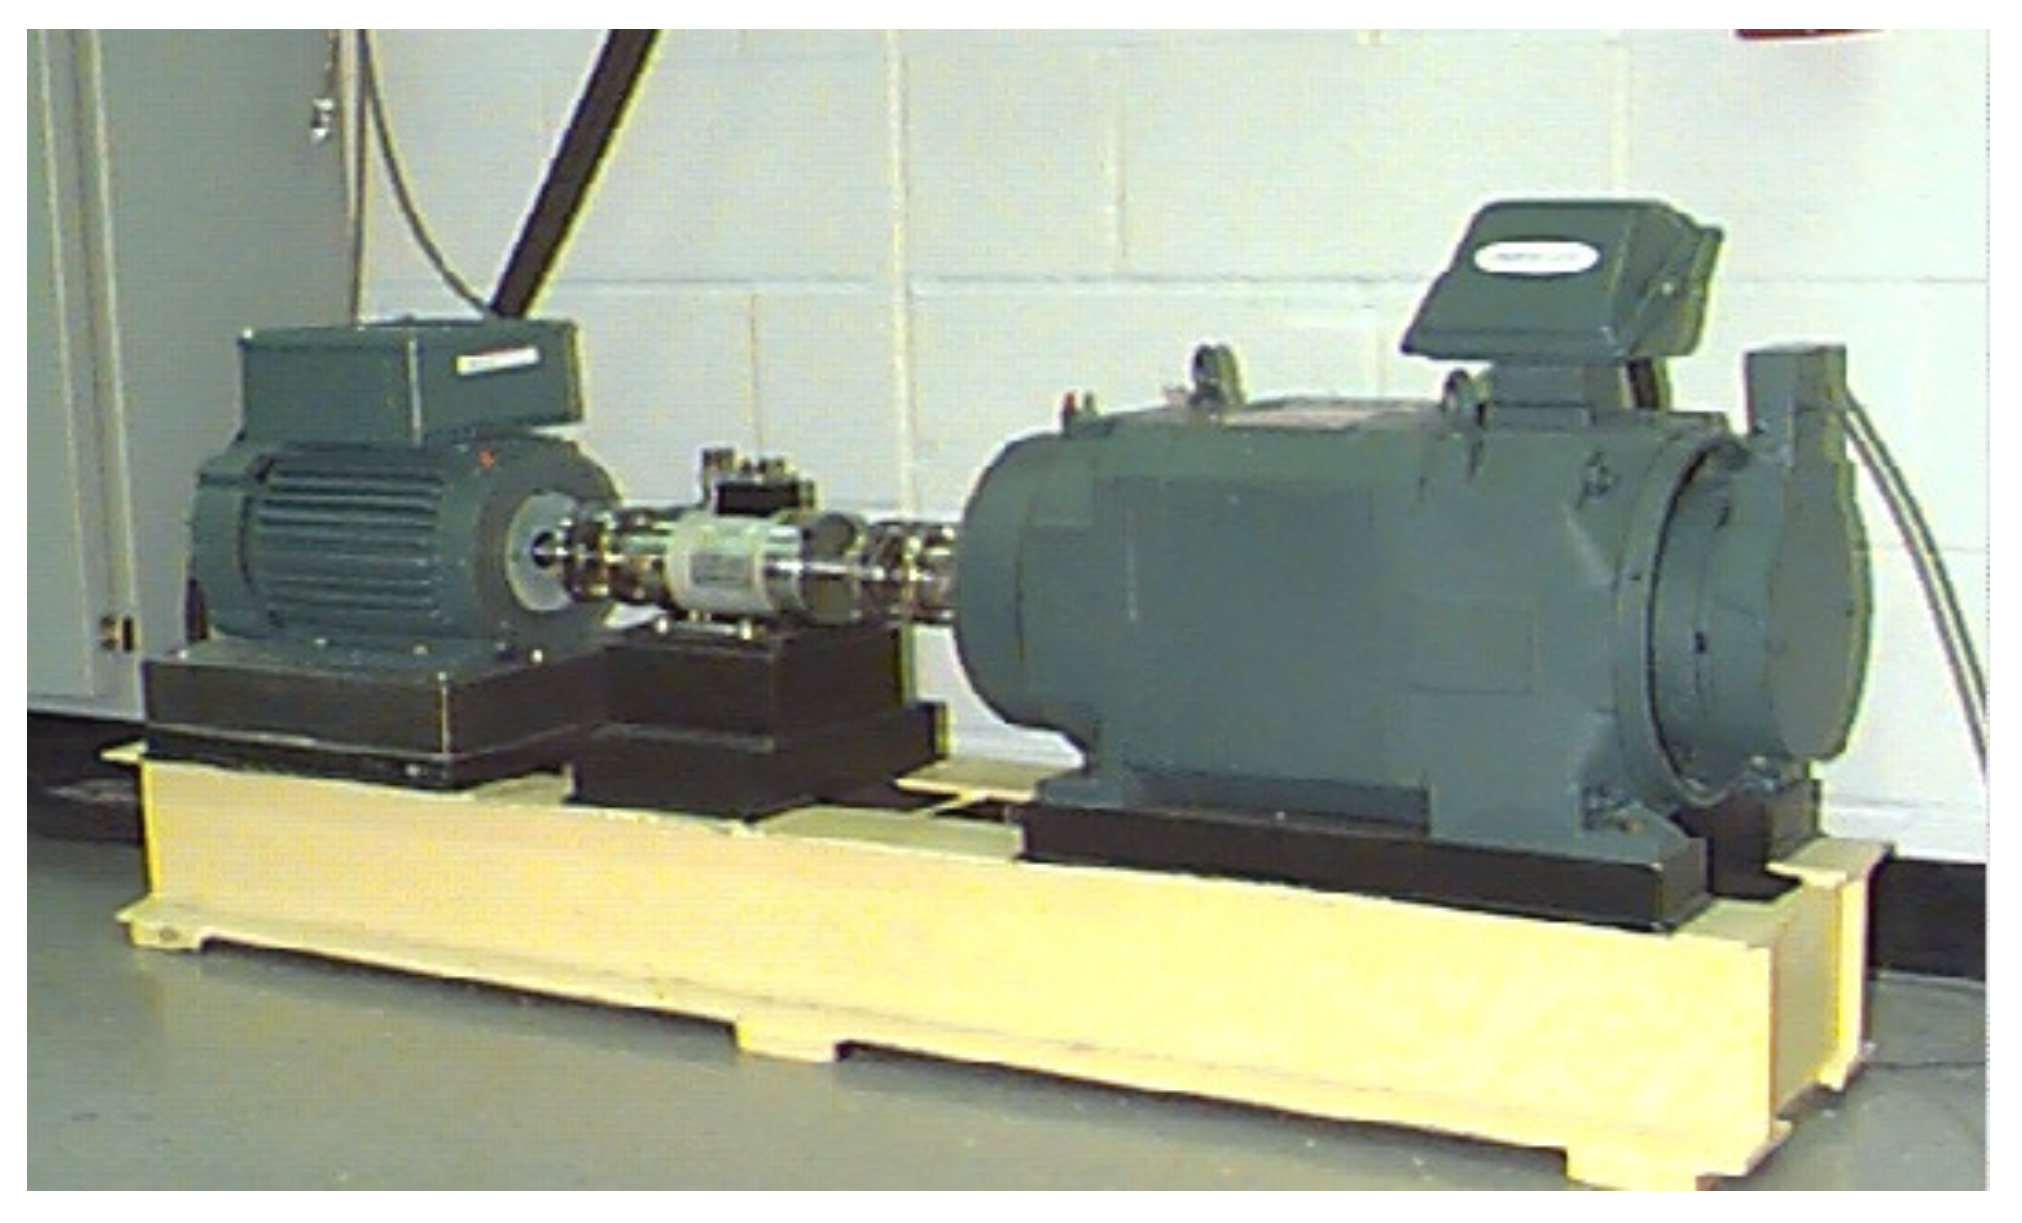
The first bearing fault dataset CWRU is from the Case Western Reserve University [31], which is collected from a deep groove ball bearing. The bearing fault collection platform is shown in Figure 12, and some necessary parameters are listed in Table 2.
The characteristic frequencies of the inner ring fault and the outer ring fault can be calculated by [22]
f BPFI = 0.5 N f r ( 1 + d D cos α ) f BPFO = 0.5 N f r ( 1 d D cos α )
where f BPFI and f BPFO are the inner ring fault frequency and the outer ring fault frequency, respectively. f r = 1750 / 60 = 29.167 Hz is the rotation frequency of the bearing. In Equation (27), α = 0 is the contact angle. d and D are the diameter of the rolling element and the bearing pitch as shown in Table 2, respectively. Then, the fault frequencies of both the outer ring fault and the inner ring fault can be calculated by Equation (27), which are f B P F O = 104.6 Hz and f B P F I = 157.9 Hz.
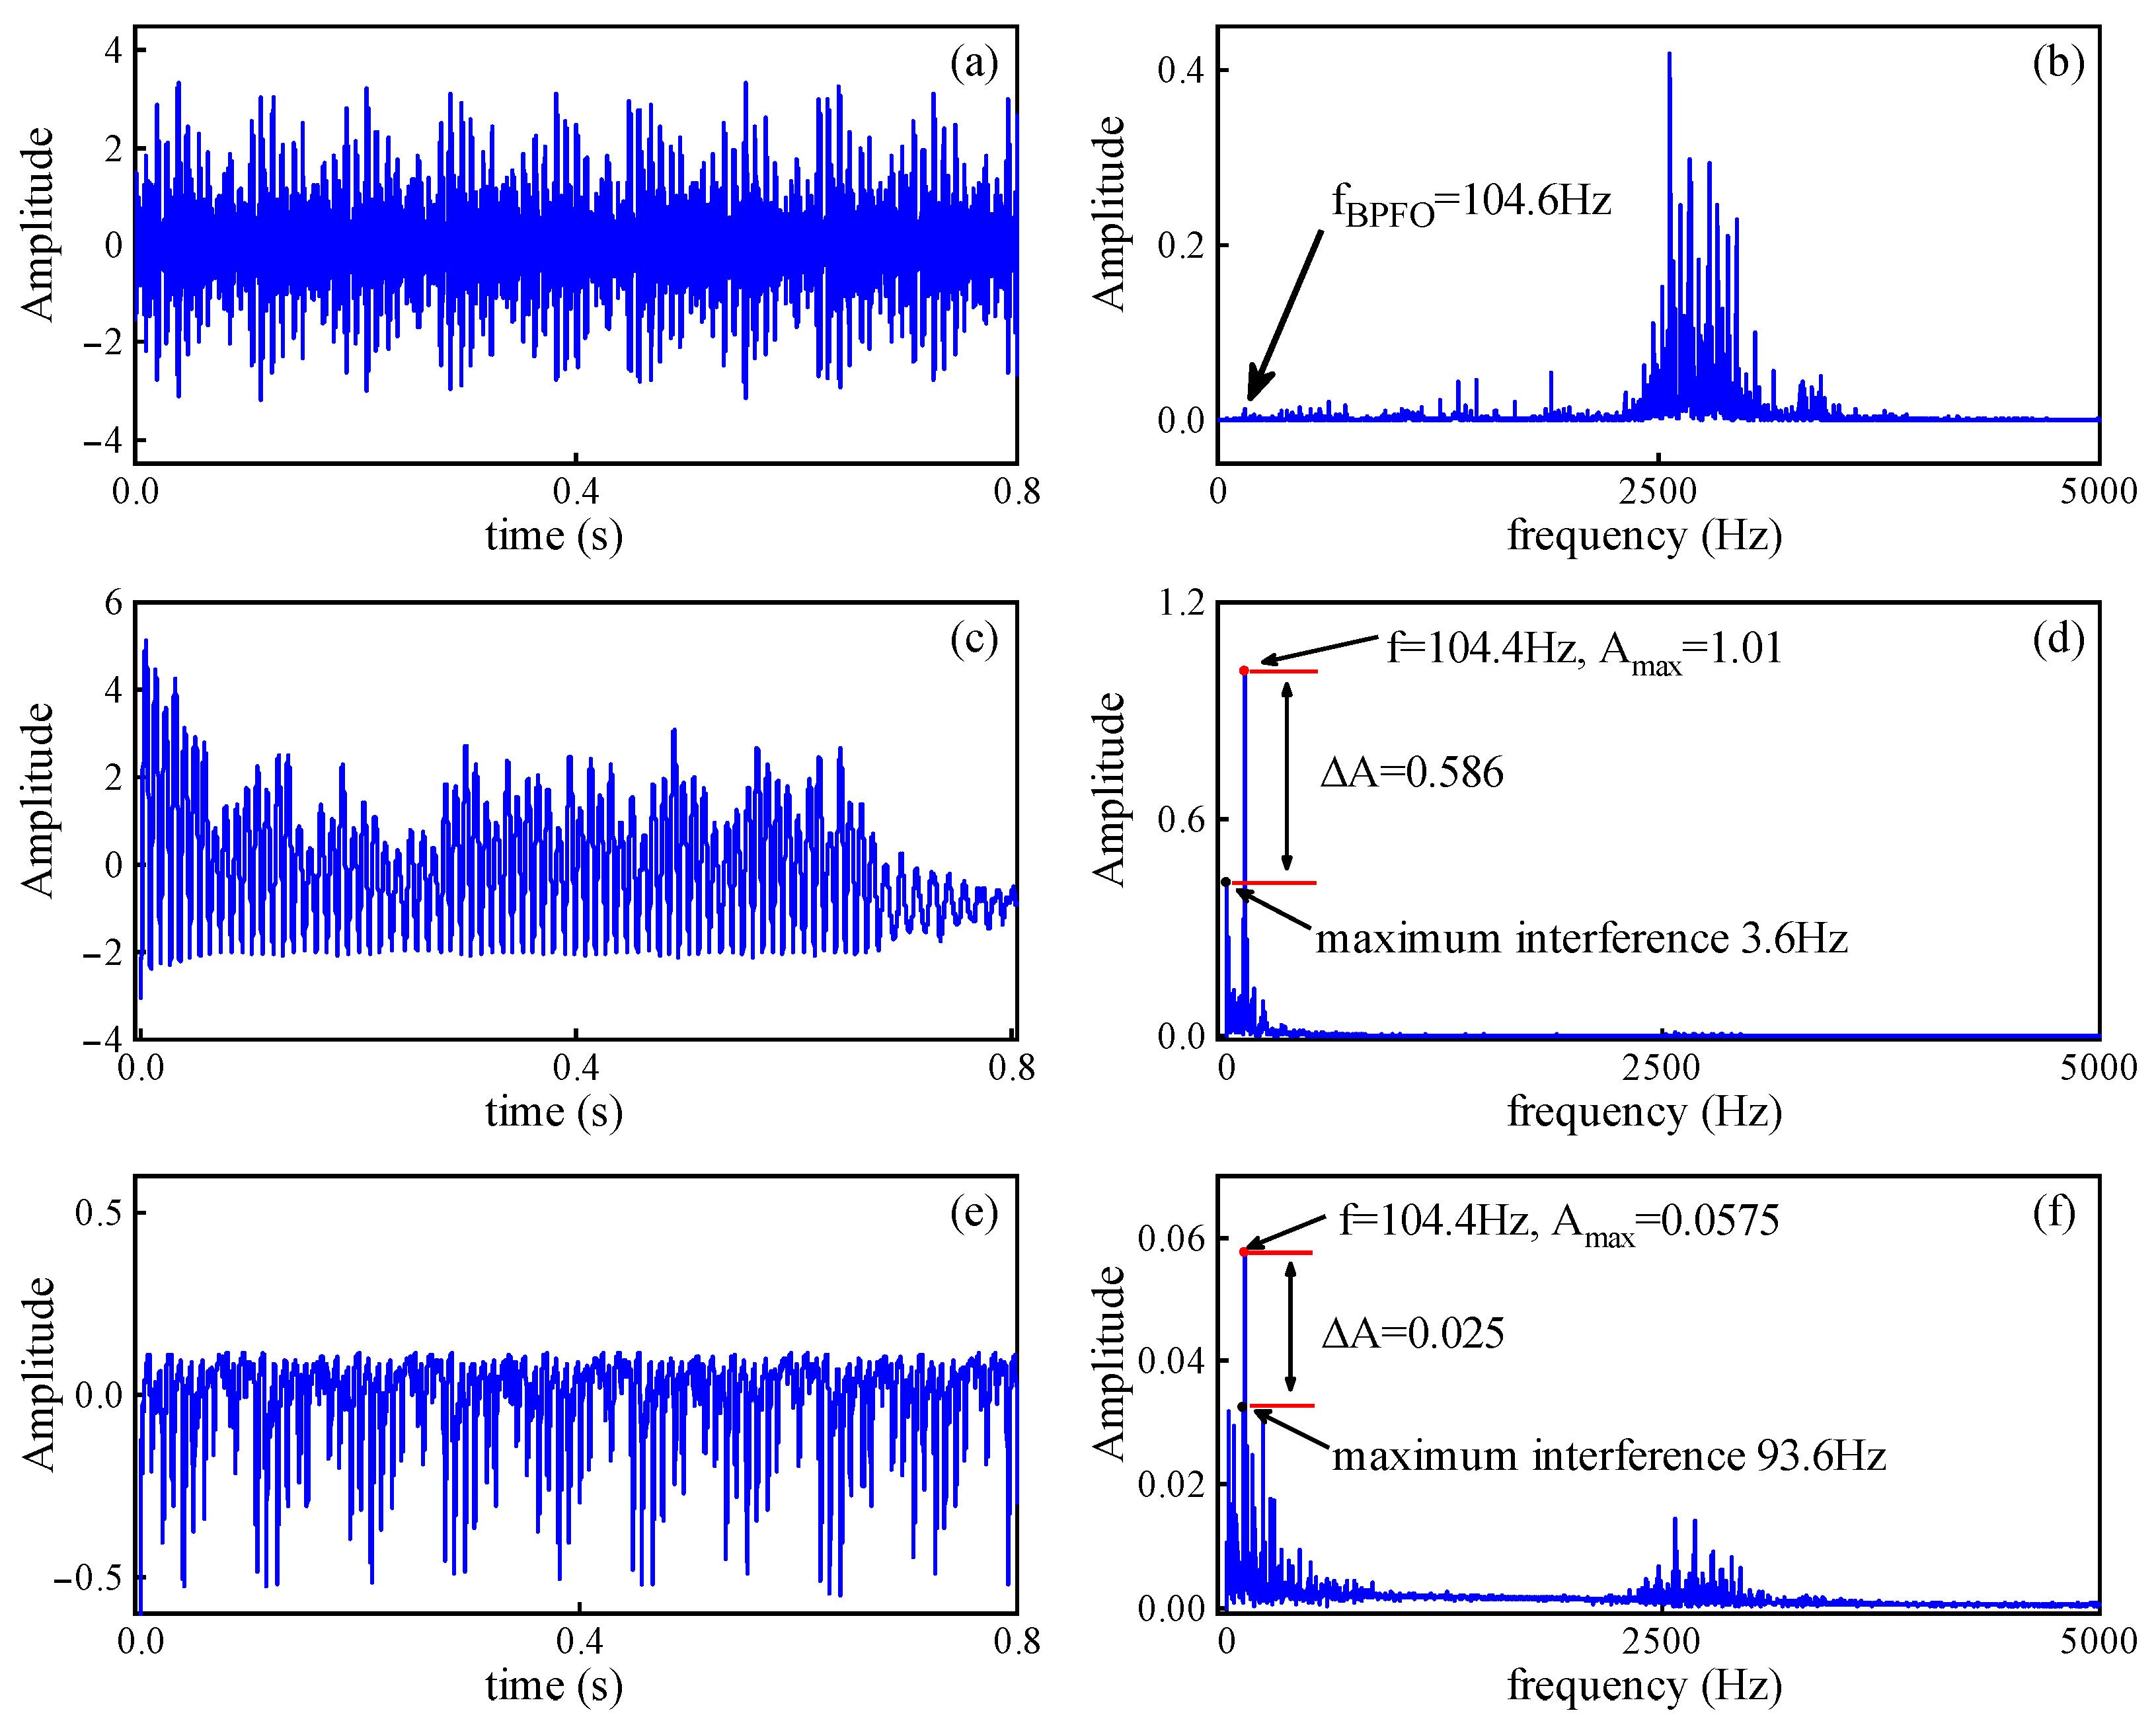
The outer ring fault signal from the CWRU dataset is shown in Figure 13a,b. From the frequency domain of this fault signal, it can be observed that there are a large number of interference components in the high-frequency range around 2500 Hz, and the amplitude of the fault characteristic frequency is low, making it difficult to directly identify the fault feature from the frequency domain.
Then, this outer ring fault signal is processed by the proposed UDHQSR system (Figure 8). Since the characteristic frequency of the outer ring fault, f BPFO = 104.6 Hz, is high, the scale factor R of the secondary sampling method is set to R = 2400 . The result of the proposed UDHQSR system is shown in Figure 13c,d. The time-domain waveform of the UDHQSR system’s output exhibits a clear periodic characteristic, indicating the proposed method can effectively enhance the weak periodic signal and suppress other interferences. Furthermore, the UDHQSR system’s output shows a peak with an amplitude of A m a x = 1.01 at a frequency of 104.4 Hz. The frequency difference between this peak value and the theoretical calculated value f BPFO is only 0.2 Hz, which is mainly due to the actual speed variation of the bearing and the limited frequency resolution of the FFT. The largest interference in the UDHQSR system’s output appears at a frequency of 3.6 Hz, and the amplitude difference between this and the outer ring fault characteristic frequency is Δ A = 0.586 . According to Equation (20), the output SNR of the proposed UDHQSR system for this outer ring fault signal is S N R o u t = 3.8 dB. To quantitatively describe the enhancement of the characteristic signal and the noise suppression performance of the SR systems, we define the ratio of the peak amplitude to the amplitude difference as the PDR:
PDR = A m a x Δ A
Then, the PDR of the proposed UDHQSR system’s output is PDR = 0.58.
The output of the CBSR system is shown in Figure 13e,f for comparison. The time-domain waveform (Figure 13e) of the CBSR system output also exhibits periodic characteristics, but contains a large amount of interference components. Moreover, in the spectrum of the CBSR system output, a large amount of noise still exists around the fault characteristic frequency f BPFO and in the high-frequency band. The peak amplitude is only A m a x = 0.0575 , and the amplitude difference between it and the maximum interference appearing at 93.6 Hz is Δ A = 0.025 . Then, the output SNR of the CBSR system is 8.82 dB, and the PDR is 0.435 .
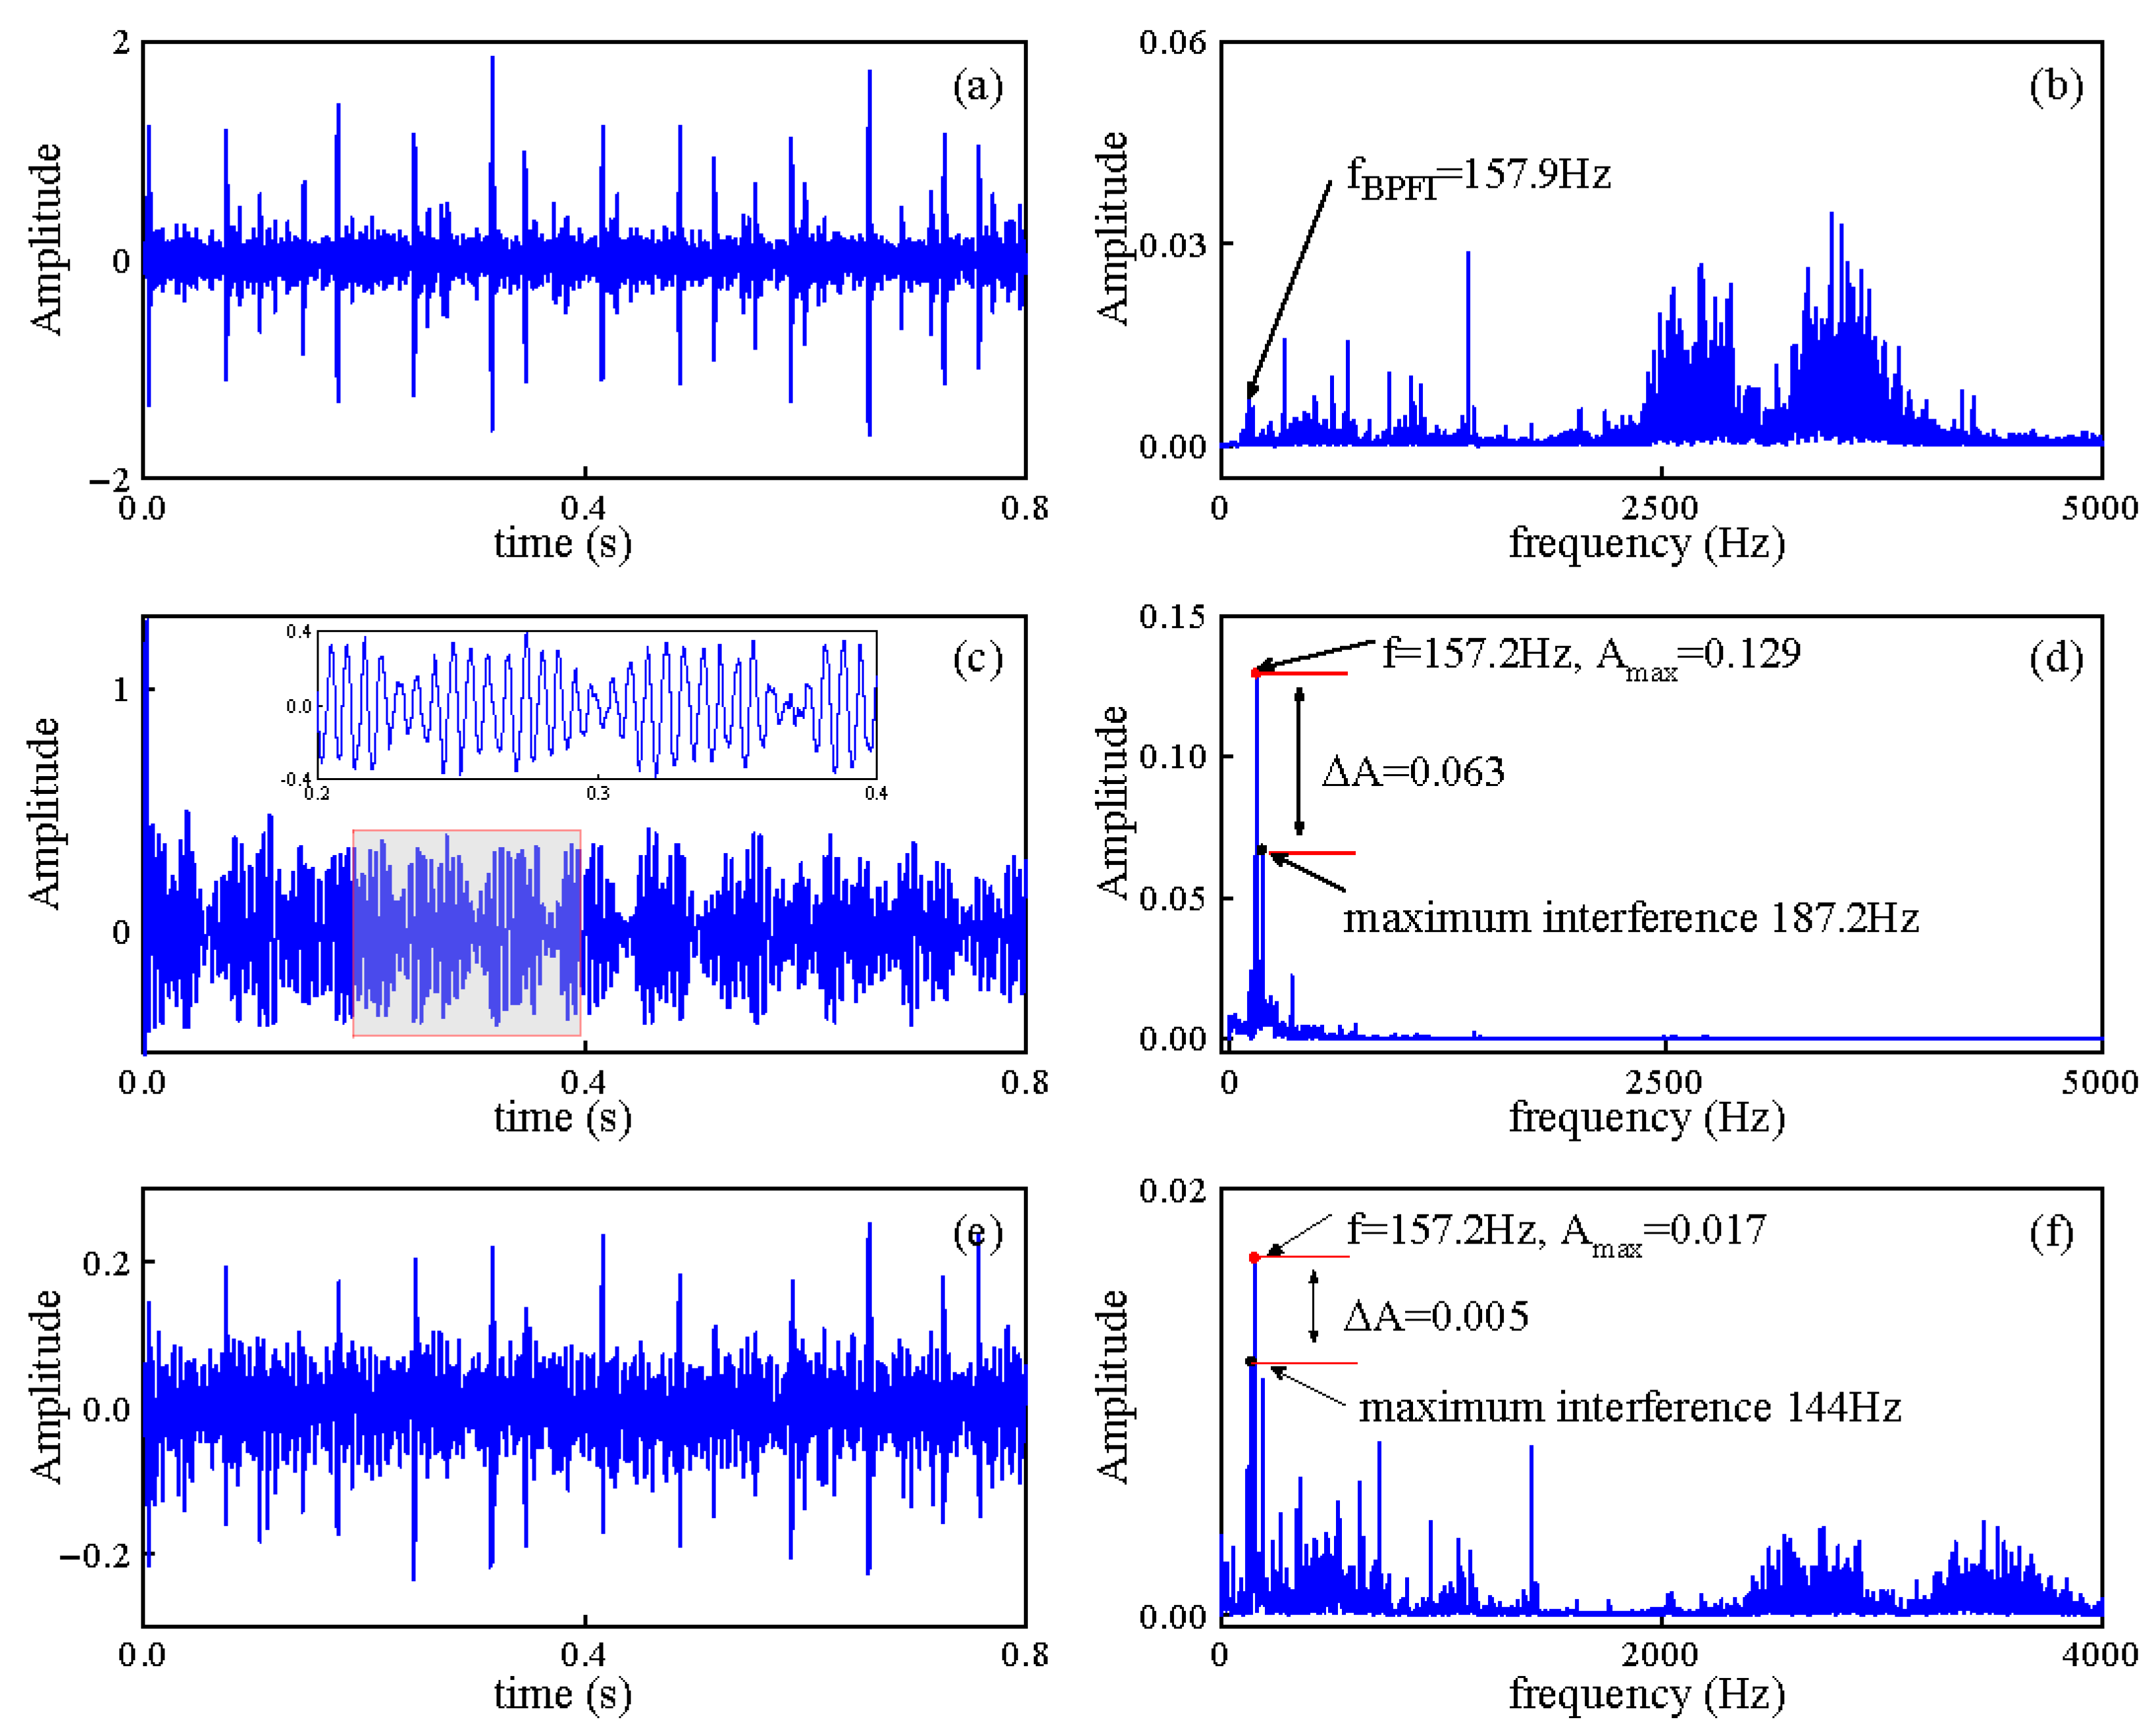
The inner ring fault signal from the CBSR system is shown in Figure 14a,b. It can be seen that the inner ring fault signal contains significant impulsive noise and has a large amount of noise and interference in the high-frequency range above 2500 Hz. There is also considerable noise with high amplitude present near the characteristic frequency f BPFI .
The processing result of the inner ring fault signal by the proposed UDHQSR system is shown in Figure 14c,d. A peak with an amplitude of A m a x = 0.129 appears at 157.2 Hz in the output of the UDHQSR system, indicating that the inner ring fault signal has been effectively amplified. Moreover, the time domain of the output also exhibits a distinct periodic characteristic. The amplitude difference is Δ A = 0.063 , and the PDR is 0.488 . The output SNR of the proposed method is S N R o u t = 2.51 dB.
The output of the CBSR system for the inner ring fault signal is shown in Figure 14e,f. The CBSR system has a relatively poor ability to suppress impulsive noise in the inner ring fault signal, and a large amount of noise remains in its output. The amplitude of the CBSR system at the fault frequency is only A m a x = 0.017 , and the amplitude difference between this and the maximum interference at 144 Hz is Δ A = 0.005 . The PDR of the CBSR system’s output is 0.294 , and its output SNR is 10.18 dB.
By comparing Figure 13 and Figure 14, it can be seen that under the impulsive noise of the inner ring fault signal, the noise suppression performance of the proposed UDHQSR system decreases slightly, whereas the performance degradation of the CBSR system is significant.

6.2. Fault Diagnosis Verification via the XJTU-SY Dataset

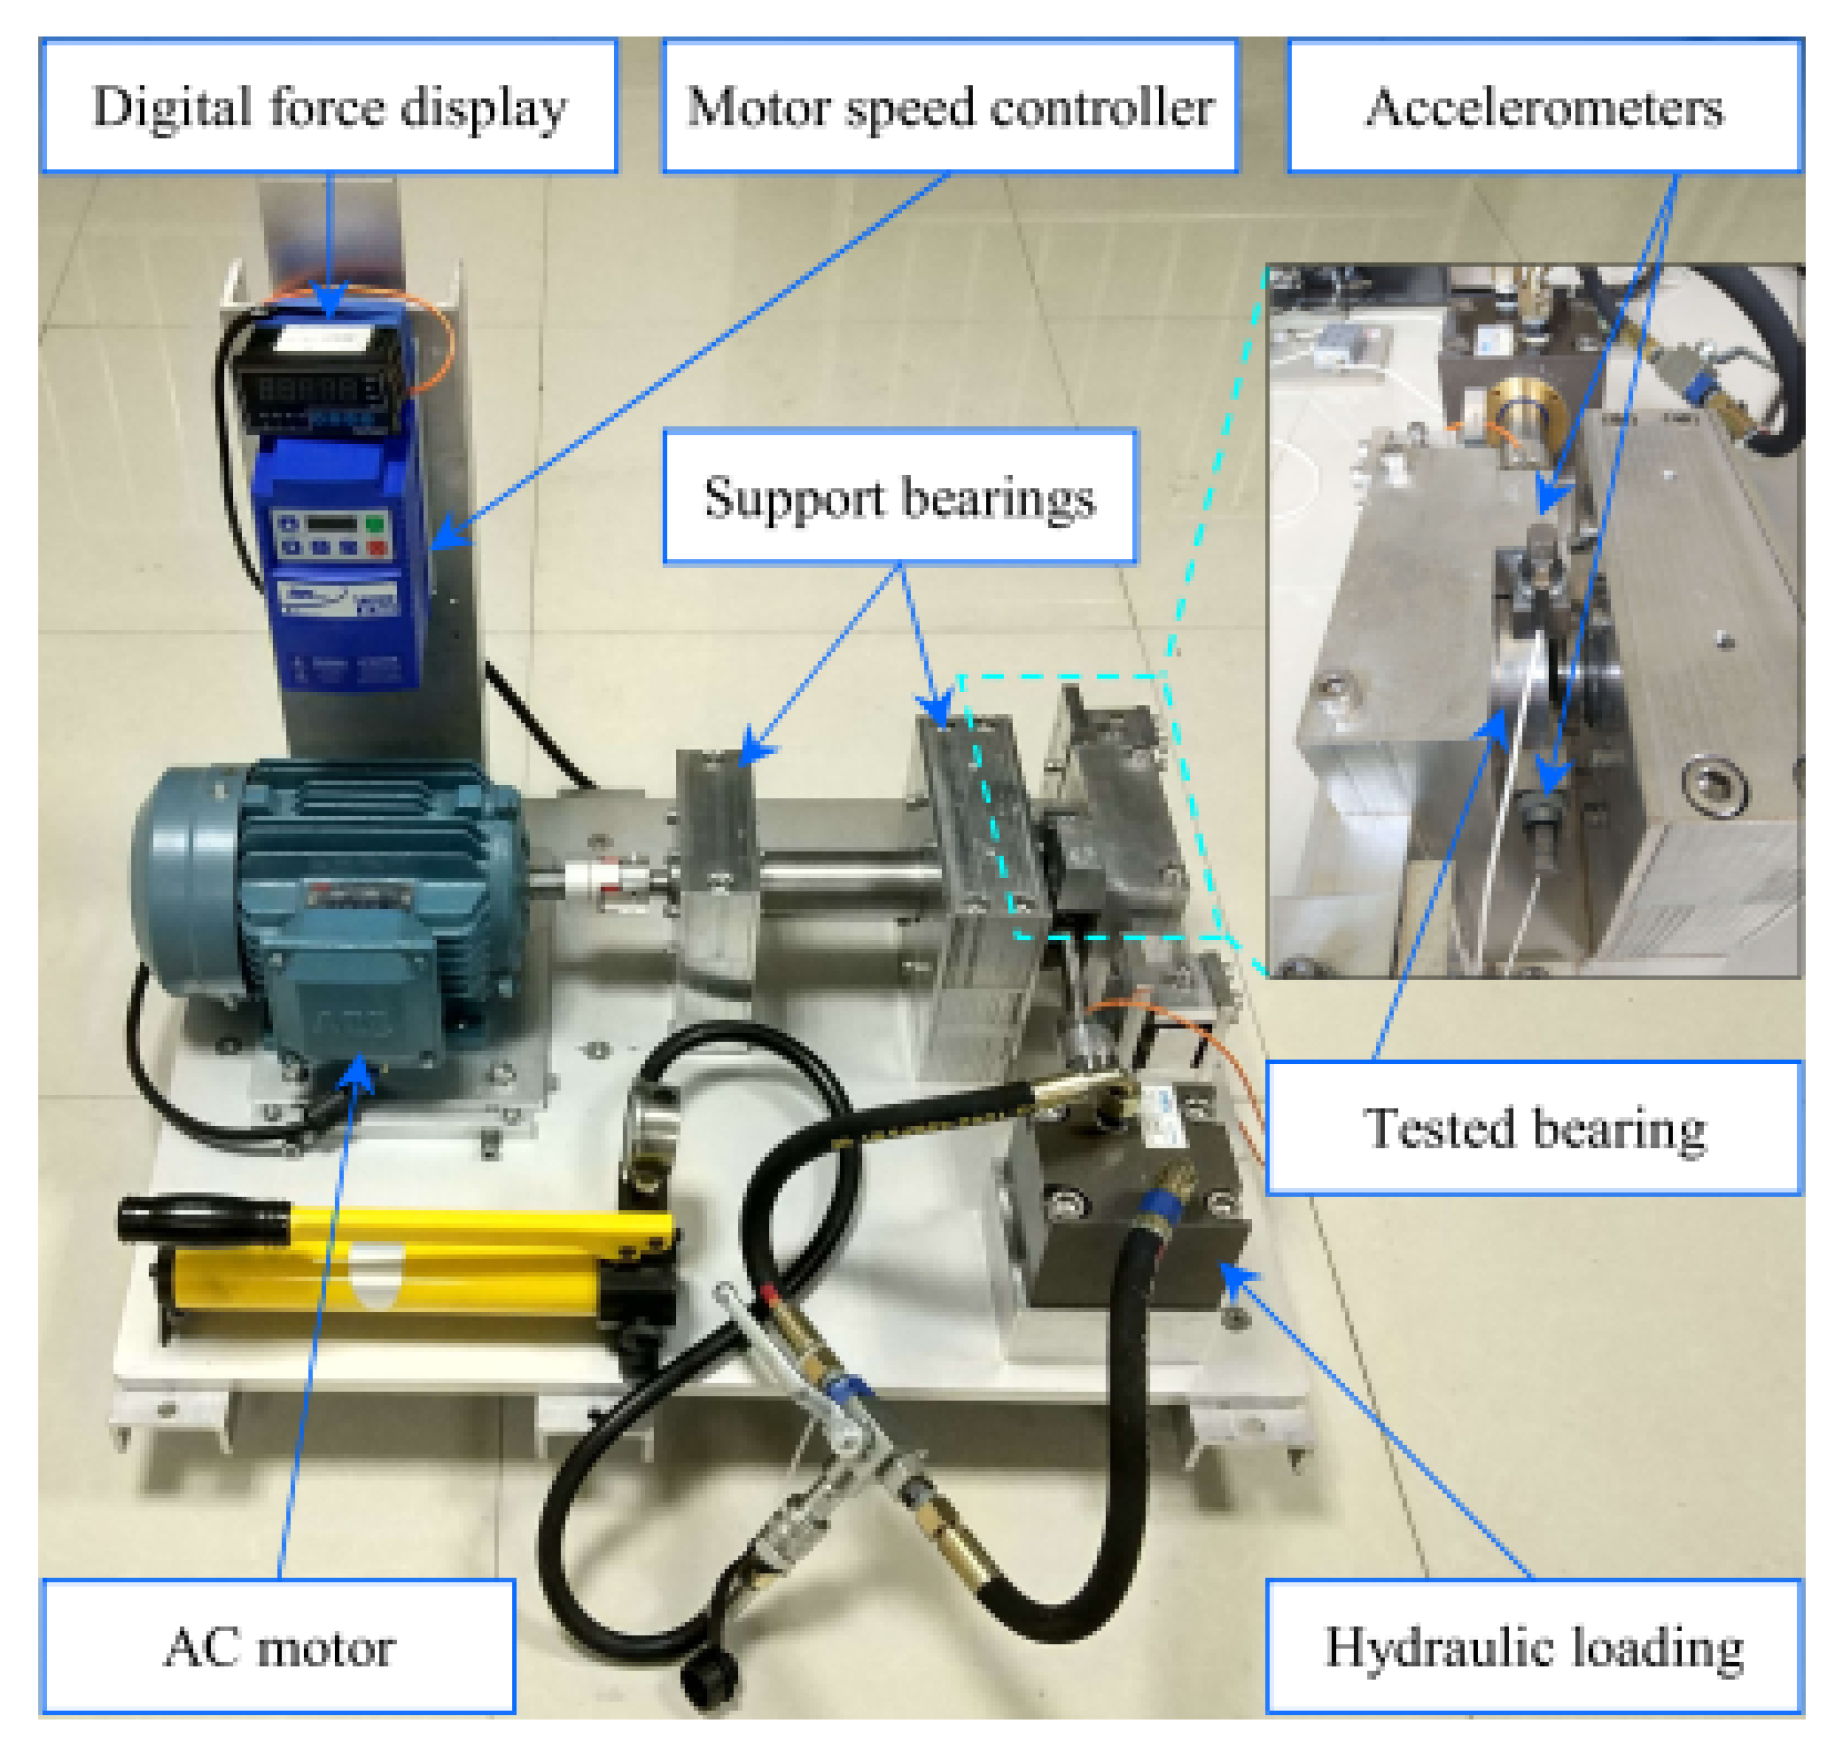
To verify the adaptability of the proposed UDHQSR system, the XJTU-SY bearing fault dataset [32] from Xian Jiaotong University and the Changxing Sumyoung Technology Co.Ltd is used. The fault signal acquisition platform is shown in Figure 15. This platform uses a LDK UER204 rolling bearing and its necessary parameters are listed in Table 3.
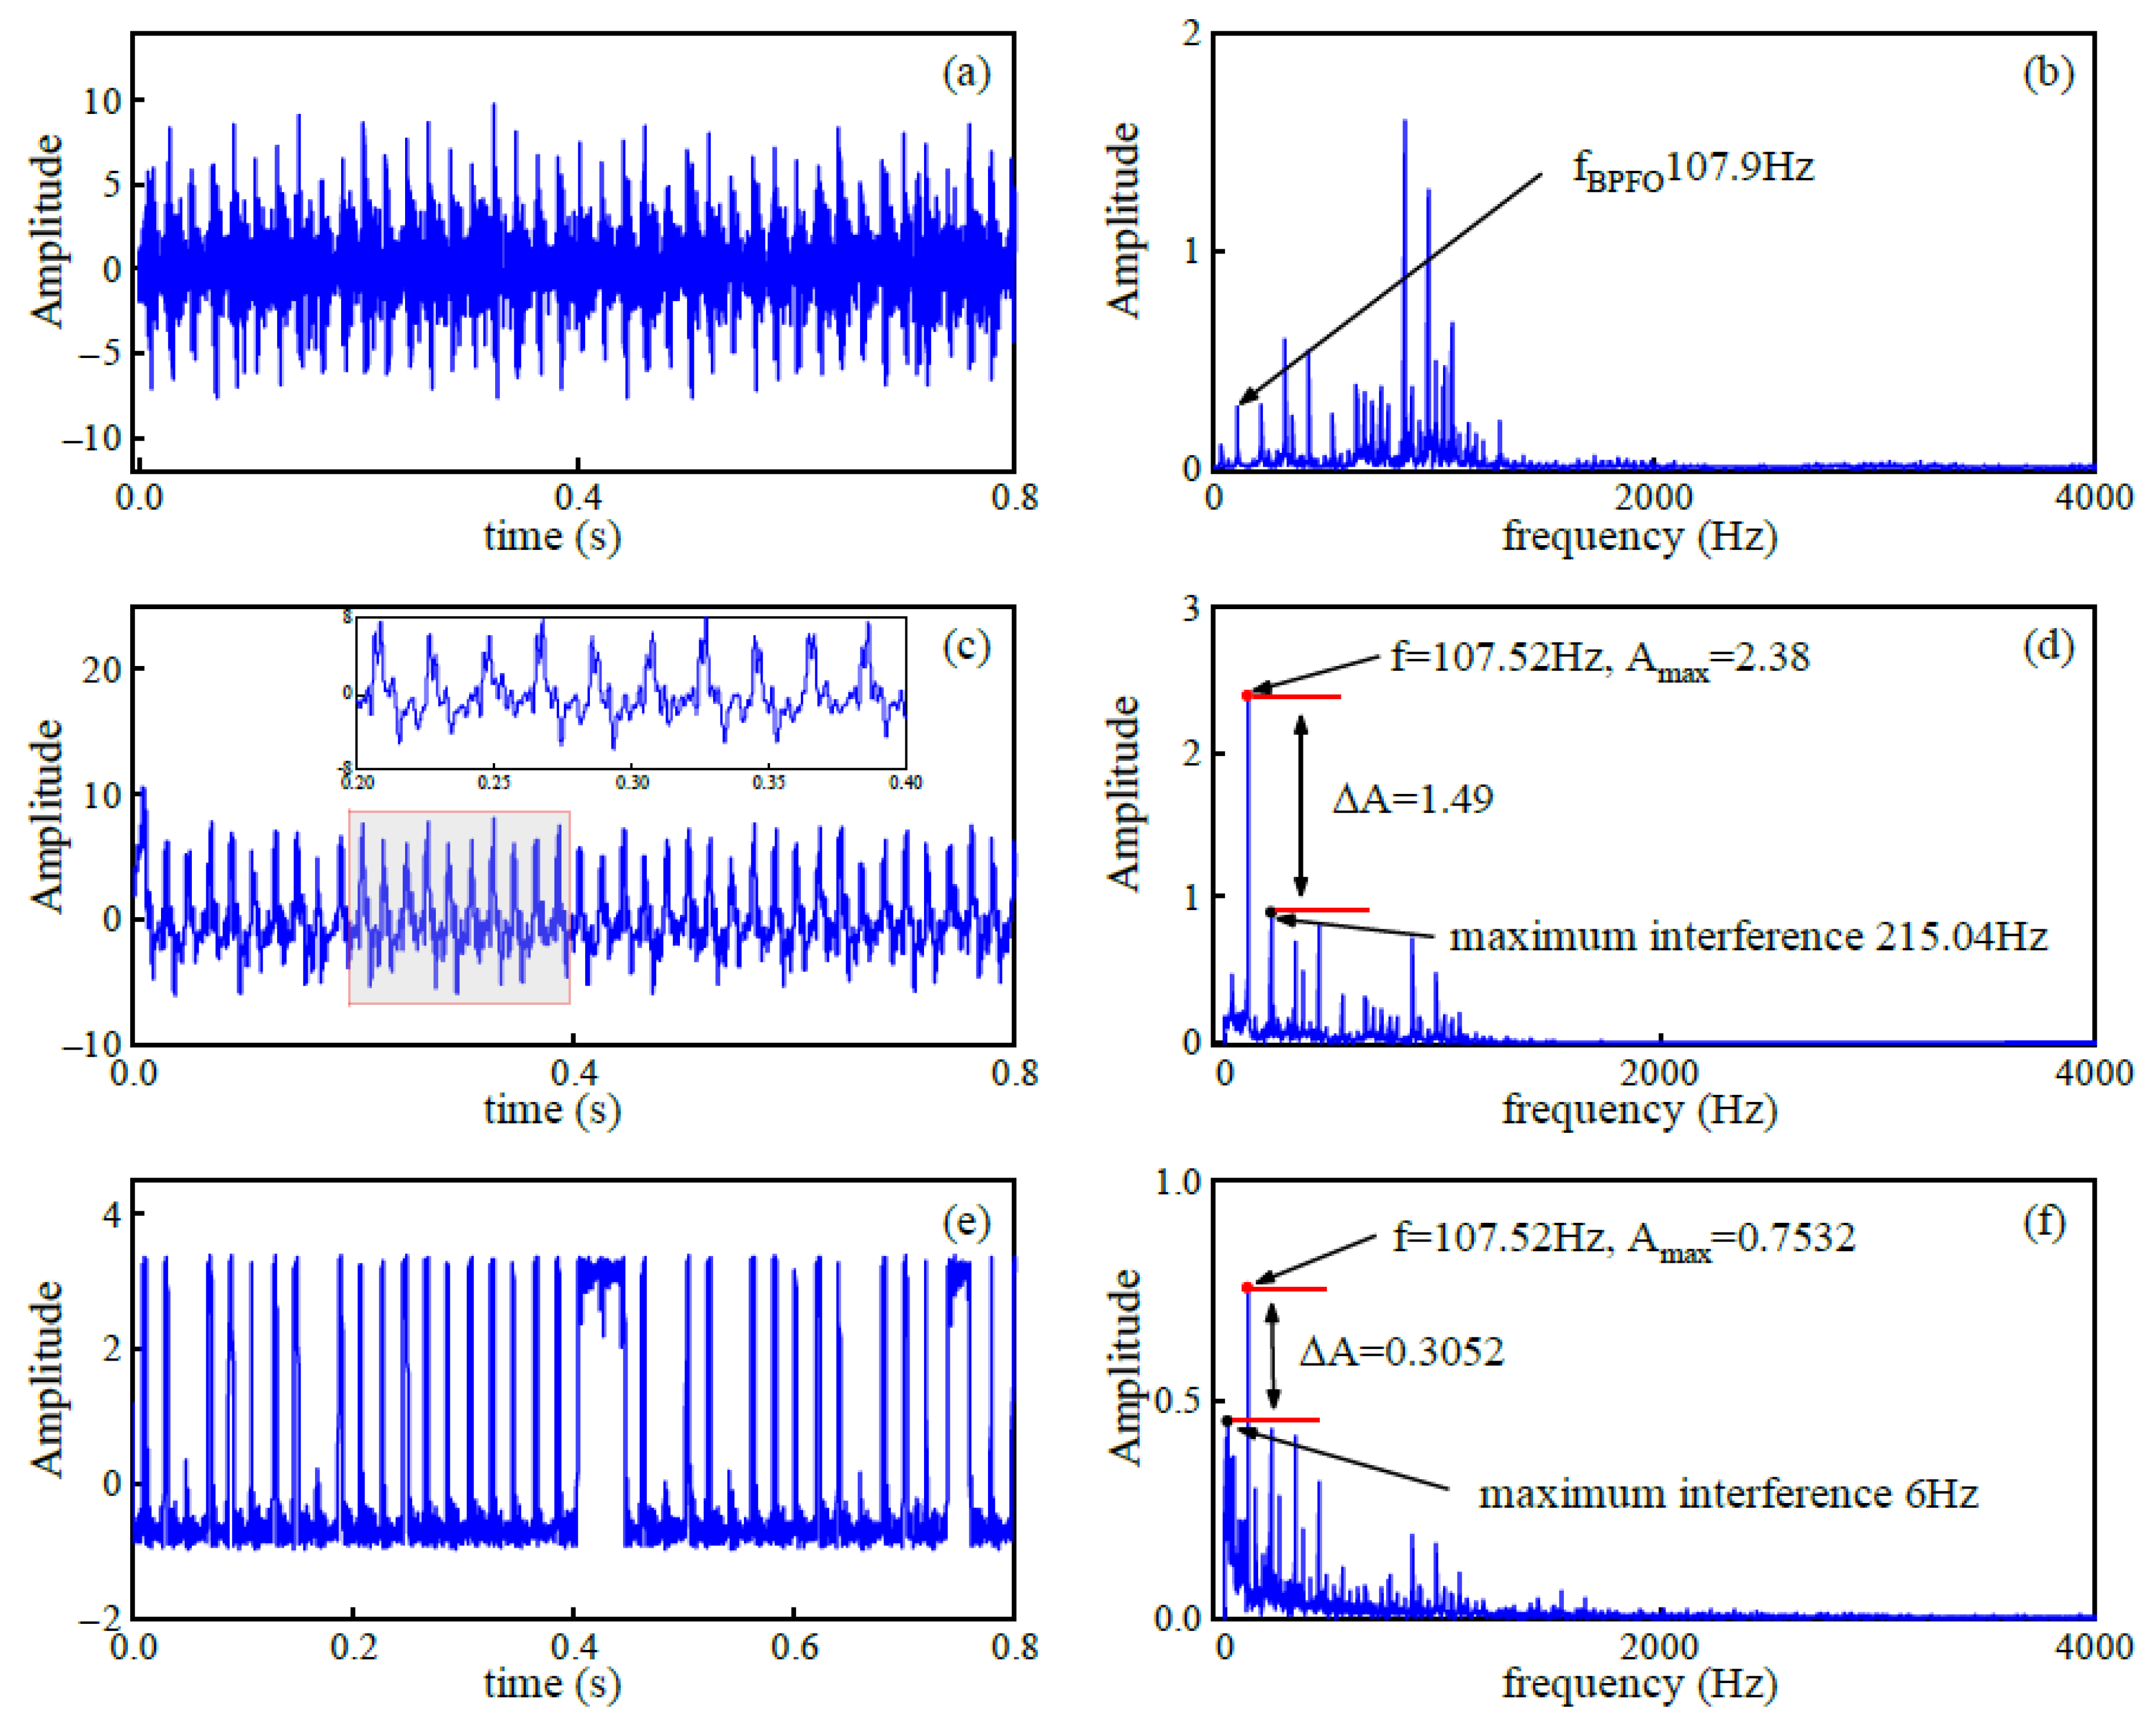
A set of the outer ring fault signal is used to verify the proposed UDHQSR system, and according to Equation (27), its characteristic frequency is f BPFO = 107.9 Hz. The outer ring fault signal is shown in Figure 16. It can be seen from the time-domain waveform (Figure 16a) that this outer ring fault signal contains high-level impulsive noise. Moreover, a large amount of interference is present in the range below 1500 Hz, as shown in Figure 16b. Because the characteristic frequency f BPFO = 107.91 Hz does not satisfy the adiabatic approximation requirement, the scale factor of the secondary sampling method is set as R = 4000 .
Based on the processing flowchart (Figure 8), the output of the proposed UDHQSR system is shown in Figure 16c,d. In the spectrum (Figure 16d), there is a peak with an amplitude of A m a x = 2.38 appearing at the frequency of 107.52 Hz, which is regarded as the characteristic frequency of the outer ring fault. The maximum interference is at 215.04 Hz, and the amplitude difference between it and the peak is Δ A = 1.49 . Then, the PDR can be calculated as 0.626 , and the output SNR is S N R o u t = 1.487 dB.
The output of the comparative CBSR system is shown in Figure 16e,f. The CBSR system’s time-domain waveform (Figure 16e) exhibits an obvious output saturation phenomenon. In its spectrum (Figure 16f), the amplitude of the peak at a frequency of 107.52 Hz is A m a x = 0.7532 , which is much smaller than the peak amplitude of the proposed UDHQSR system. The amplitude difference between the peak and the maximum interference at 6 Hz is Δ A = 0.3052 . The PDR and the output SNR of the CBSR system’s output are P D R = 0.405 and S N R o u t = 7.98 dB, respectively.
To further compare detection performances, an unsaturated bistable SR system [16] (called the ASUBSR system) was also used for comparative testing. And their detection performances are summarized in Table 4.
By comparing various indicators such as the output SNR and PDR, the proposed UDHQSR system demonstrates advantages over the CBSR system and the ASUBSR system in both characteristic frequency enhancement and noise suppression. Furthermore, the output SNR of the proposed UDHQSR system of each test fault signal is greater than 5 dB, indicating its excellent ability to utilize the noise energy to enhance the weak periodic signal. A comparison of the UDHQSR system’s results for inner and outer ring fault signals from the CWRU dataset reveals that the weak signal enhancement performance of the UDHQSR system is slightly degraded in the presence of impulsive noise. Meanwhile, as shown in Table 4, the peak amplitude A m a x of the UDHQSR system’s output is ten times greater than that of the CBSR system. This indicates that the proposed UDHQSR system overcomes the output saturation observed in the CBSR system, and thus exhibits a large output amplitude and superior weak signal enhancement performance. The ASUBSR system also exhibits improved detection ability compared to the CBSR system due to its unsaturated potential function, but its detection performance remains inferior to the proposed UDHQSR system.

7. Conclusions

In this work, a novel under-damped unsaturated bistable SR system, UDHQSR, has been proposed to meet the requirement of detecting weak periodic signals against strong noise. Based on the piecewise structure, an unsaturated bistable potential function combining a hyperbolic sine function and a quadratic function is proposed. This potential function achieves a dynamic slope adjustment of the potential walls by introducing a slope control parameter, thereby structurally eliminating the cause of the output saturation problem. Based on this proposed unsaturated potential function, a second-order UDHQSR system has been proposed considering the inertial term to further improve the weak signal enhancement ability. Under the adiabatic approximation limitation, the joint influence of system parameters on the theoretical output SNR of the proposed UDHQSR system has been analyzed in detail.
Based on the theoretical analysis, a weak signal detection algorithm based on the UDHQSR system is designed by adaptively adjusting the system parameters using the PSO algorithm according to the measured signal. Then, its weak signal detection performance is verified through both simulation weak signals and bearing fault signals from public datasets. In both simulation signals and bearing fault signals, the output SNR, peak amplitude at the fault characteristic frequency, and the amplitude difference between the fault characteristic frequency and the surrounding noise of the proposed UDHQSR system are greater than those of the CBSR system. The verification results show that the proposed UDHQSR system has better weak signal detection performance than the CBSR system, and exhibits broad application prospects in the field of weak signal detection.
Our proposed UDHQSR system demonstrates excellent enhancement and noise suppression capabilities for weak periodic signals. However, it has not been applied to detections of non-stationary weak signals, such as variable-frequency weak signal and weak pulse signal. Expanding the types of detectable signal and further improving the weak signal detection performance of the proposed UDHQSR system will be the focus of our future work.

Author Contributions

Conceptualization, Y.W. and L.W.; Formal analysis, Y.L. (Yiting Lu); Funding acquisition, L.W.; Methodology, Y.W. and Y.L. (Yao Li); Project administration, L.W.; Resources, L.W.; Software, Y.W. and Y.L. (Yao Li); Supervision, L.W.; Validation, Y.W., Y.L. (Yiting Lu) and Z.Z.; Writing—original draft, Y.W.; Writing—review and editing, L.W. and Z.Z. All authors have read and agreed to the published version of the manuscript.

Funding

This work was supported in part by the National Natural Science Foundation of China (Grant U2230206), Sichuan Province Science and Technology Planning Project (Grant 2023NSFSC1962 and DQ202412), Industry-Academia Collaborative Education Program of the Ministry of Education (Grant No.231003084073047), and Fundamental Research Funds for the Central Universities (Grant No.ZYGX2024K017).

Informed Consent Statement

Not applicable.

Data Availability Statement

The original contributions presented in this study are included in the article. Further inquiries can be directed to the corresponding author.

Conflicts of Interest

The authors declare no conflicts of interest.

References

  1. Shi, Y.; Piao, S.; Guo, J. Line Spectrum Detection and Motion Parameters Estimation for Underwater Moving Target. J. Phys. Conf. Ser. 2024, 2718, 012090. [Google Scholar] [CrossRef]
  2. Zhang, K.; Xu, G.; Du, C.; Wu, Y.; Zheng, X.; Zhang, S.; Han, C.; Liang, R.; Chen, R. Weak Feature Extraction and Strong Noise Suppression for SSVEP-EEG Based on Chaotic Detection Technology. IEEE Trans. Neural Syst. Rehabil. Eng. 2021, 29, 862–871. [Google Scholar] [CrossRef] [PubMed]
  3. Zhang, D.; Ding, W.; Zhang, B.; Liu, C.; Han, J.; Doermann, D. Learning Modulation Filter Networks for Weak Signal Detection in Noise. Pattern Recognit. 2021, 109, 107590. [Google Scholar] [CrossRef]
  4. Zhang, X.; Ma, Y.; Pan, Z.; Wang, G. A Novel Stochastic Resonance Based Deep Residual Network for Fault Diagnosis of Rolling Bearing System. ISA Trans. 2024, 148, 279–284. [Google Scholar] [CrossRef] [PubMed]
  5. Liu, J.; Tang, C.; Hu, B.; Guo, J.; Qiao, Z.; Liao, Z. A Novel Exponential Unsaturated Bistable Stochastic Resonance-Boosted Incipient Fault Identification in Rotating Machineries. Meas. Sci. Technol. 2024, 35, 116140. [Google Scholar] [CrossRef]
  6. Zhang, G.; Zhu, X.; Jiang, Z. Research and Application of a Novel Combined Asymmetric Tristable Stochastic Resonance System. Fluct. Noise Lett. 2022, 21, 2250050. [Google Scholar] [CrossRef]
  7. Benzi, R.; Parisi, G.; Sutera, A.; Vulpiani, A. Stochastic Resonance in Climatic Change. Tellus 1982, 34, 10–16. [Google Scholar] [CrossRef]
  8. Zhang, J.; Peng, J.; Li, J.; Meng, Z. Stochastic Resonance in an Underdamped Duffing Bistable System Embedded with Overdamped Feedback Control for Rolling Bearing Fault Detection. Meas. Sci. Technol. 2025, 36, 036128. [Google Scholar] [CrossRef]
  9. Zhao, H.; Jiang, X.; Wang, B.; Cheng, X. Bearing Fault Feature Extraction Method: Stochastic Resonance-Based Negative Entropy of Square Envelope Spectrum. Meas. Sci. Technol. 2024, 35, 045102. [Google Scholar] [CrossRef]
  10. Ma, Q.; Cao, S.; Gong, T.; Yang, J. Stochastic Resonance in Strong Poisson White Noise Excited System and Its Application in Multi-Features Identification. Pramana 2024, 98, 41. [Google Scholar] [CrossRef]
  11. Shi, P.; Li, M.; Zhang, W.; Han, D. Weak Signal Enhancement for Machinery Fault Diagnosis Based on a Novel Adaptive Multi-Parameter Unsaturated Stochastic Resonance. Appl. Acoust. 2022, 189, 108609. [Google Scholar] [CrossRef]
  12. Wang, Y.; Jiao, S.; Yang, H.; Liu, H.; Song, N.; Li, Q. Adaptive Two-Dimensional Coupled Bistable Stochastic Resonance and Its Application in Bearing Fault Diagnosis. Chaos Solitons Fractals 2025, 194, 116245. [Google Scholar] [CrossRef]
  13. Yang, C.; Yang, J.; Zhou, D.; Zhang, S.; Litak, G. Adaptive Stochastic Resonance in Bistable System Driven by Noisy NLFM Signal: Phenomenon and Application. Philos. Trans. R. Soc. A 2021, 379, 20200239. [Google Scholar] [CrossRef]
  14. Gong, S.; Li, S.; Wang, H.; Ma, H.; Yu, T. Multi-Frequency Weak Signal Detection Based on Wavelet Transform and Parameter Selection of Bistable Stochastic Resonance Model. J. Vib. Eng. Technol. 2021, 9, 887–906. [Google Scholar] [CrossRef]
  15. Zhao, D.; Luo, M. A Novel Weak Signal Detection Method for Linear Frequency Modulation Signal Based on Bistable System and Fractional Fourier Transform. Optik 2016, 127, 4405–4412. [Google Scholar] [CrossRef]
  16. Cheng, W.; Xu, X.; Ding, Y.; Sun, K.; Li, Q.; Dong, L. An Adaptive Smooth Unsaturated Bistable Stochastic Resonance System and Its Application in Rolling Bearing Fault Diagnosis. Chin. J. Phys. 2020, 65, 629–641. [Google Scholar] [CrossRef]
  17. Che, L.; Ao, K.; Jiang, L. AEEFCSR: An Adaptive Ensemble Empirical Feed-Forward Cascade Stochastic Resonance System for Weak Signal Detection. Meas. Sci. Technol. 2024, 35, 126108. [Google Scholar] [CrossRef]
  18. Li, Z.; Liu, X.; Han, S.; Wang, J.; Ren, X. Fault Diagnosis Method and Application Based on Unsaturated Piecewise Linear Stochastic Resonance. Rev. Sci. Instruments 2019, 90, 065112. [Google Scholar] [CrossRef] [PubMed]
  19. Xia, P.; Xu, H.; Lei, M.; Zhang, S. An Improved Underdamped Asymmetric Bistable Stochastic Resonance Method and Its Application for Spindle Bearing Fault Diagnosis. IEEE Access 2020, 8, 46824–46836. [Google Scholar] [CrossRef]
  20. Zhang, G.; Tan, C.; He, L. Piecewise Unsaturated Under-Damped Tri-Stable Stochastic Resonance System and Its Application in Bearing Fault Diagnosis. J. Vib. Eng. Technol. 2021, 9, 1869–1884. [Google Scholar] [CrossRef]
  21. Cui, W.; Jiao, S.; Gao, R.; Zhang, Q.; Wang, C.; Li, Y.; Zhang, Y. Continuous Unsaturated Second-Order Hybrid Multi-Stable Stochastic Energy Resonance and Its Application in Rolling Bearing Fault Diagnosis. Appl. Acoust. 2025, 228, 110298. [Google Scholar] [CrossRef]
  22. Zhang, G.; Tan, C.; He, L. Piecewise Asymmetric Exponential Potential Under-Damped Bi-Stable Stochastic Resonance and Its Application in Bearing Fault Diagnosis. Mod. Phys. Lett. B 2021, 35, 2150280. [Google Scholar] [CrossRef]
  23. Li, Z.; Shi, B. An Adaptive Stochastic Resonance Method for Weak Fault Characteristic Extraction in Planetary Gearbox. J. Vibroeng. 2017, 19, 1782–1792. [Google Scholar] [CrossRef]
  24. Xu, P.; Jin, Y.; Zhang, Y. Stochastic Resonance in an Underdamped Triple-Well Potential System. Appl. Math. Comput. 2019, 346, 352–362. [Google Scholar] [CrossRef]
  25. Cui, L.; Yang, J.; Wang, L.; Liu, H.; Xiao, Y. An Adaptive Improved Unsaturated Bistable Stochastic Resonance Method Based on Weak Signal Detection. Int. J. Adapt. Control. Signal Process. 2021, 35, 2314–2327. [Google Scholar] [CrossRef]
  26. Casado-Pascual, J.; Gómez-Ordóñez, J.; Morillo, M. Stochastic Resonance: Theory and Numerics. Chaos Interdiscip. J. Nonlinear Sci. 2005, 15, 026115. [Google Scholar] [CrossRef]
  27. Tang, J.; Shi, B. Asymmetric Second-Order Stochastic Resonance Weak Fault Feature Extraction Method. Meas. Control 2020, 53, 788–795. [Google Scholar] [CrossRef]
  28. Eberhart, R.; Kennedy, J. A New Optimizer Using Particle Swarm Theory. In Proceedings of the MHS’95 Sixth International Symposium on Micro Machine and Human Science, Nagoya, Japan, 4–6 October 1995; pp. 39–43. [Google Scholar] [CrossRef]
  29. Du, Y.; Xu, F. A Hybrid Multi-Step Probability Selection Particle Swarm Optimization with Dynamic Chaotic Inertial Weight and Acceleration Coefficients for Numerical Function Optimization. Symmetry 2020, 12, 922. [Google Scholar] [CrossRef]
  30. Zhao, S.; Shi, P.; Han, D. A Novel Mechanical Fault Signal Feature Extraction Method Based on Unsaturated Piecewise Tri-Stable Stochastic Resonance. Measurement 2021, 168, 108374. [Google Scholar] [CrossRef]
  31. CWRU. Available online: https://engineering.case.edu/bearingdatacenter/download-data-file (accessed on 2 November 2024).
  32. Wang, B.; Lei, Y.; Li, N.; Li, N. A Hybrid Prognostics Approach for Estimating Remaining Useful Life of Rolling Element Bearings. IEEE Trans. Reliab. 2020, 69, 401–412. [Google Scholar] [CrossRef]
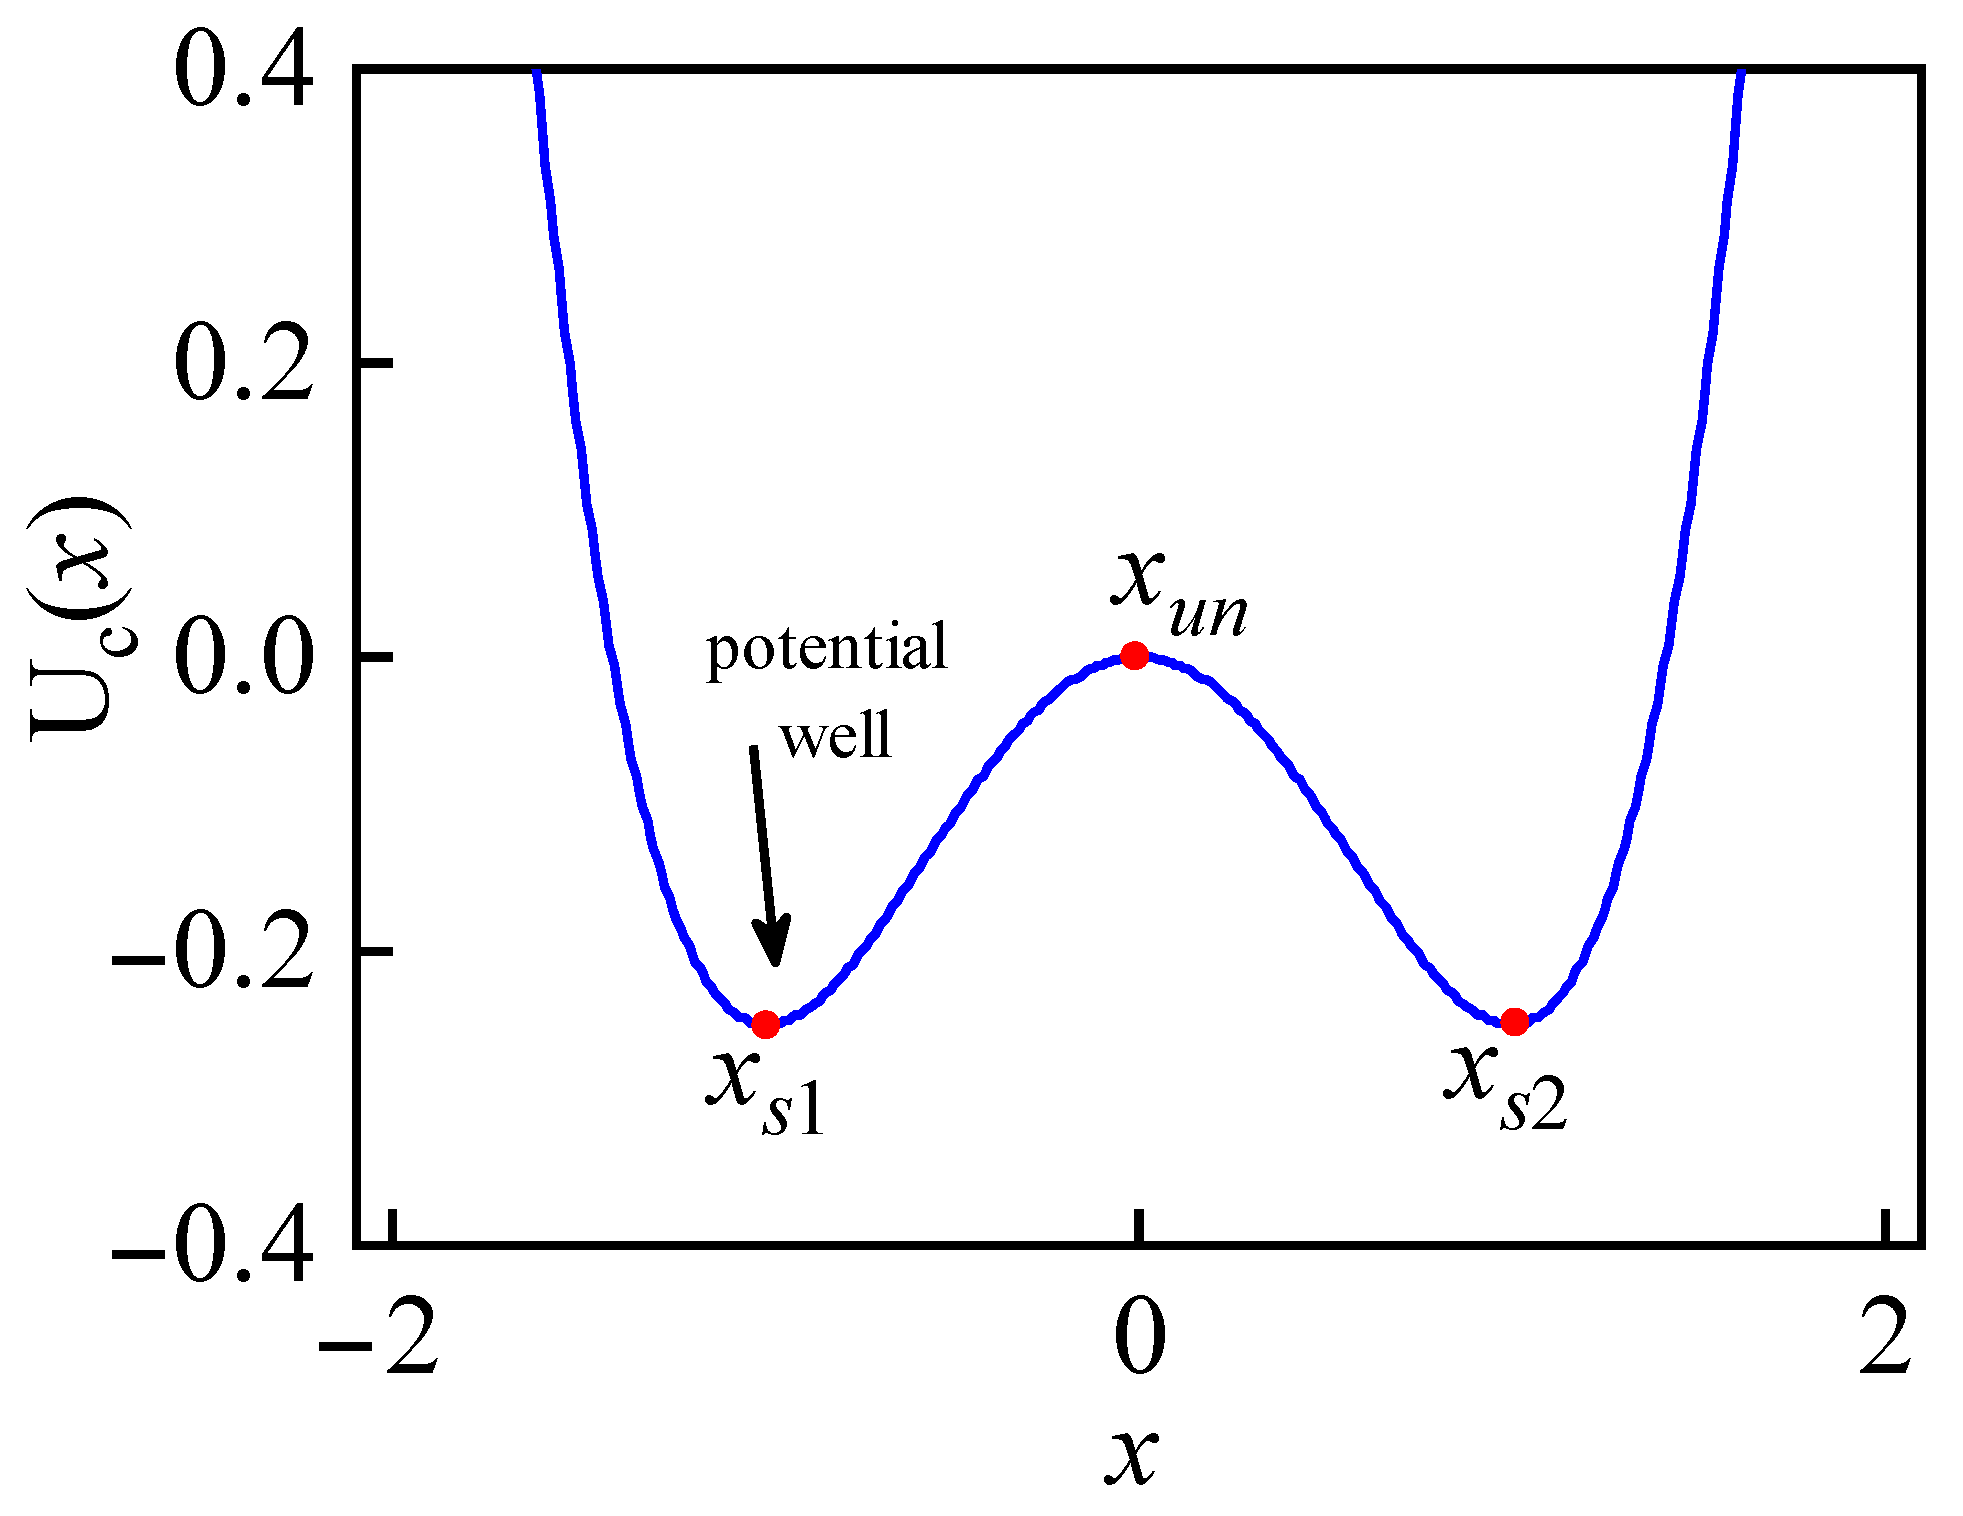
Figure 1. The potential function of the CBSR system.
Applsci 15 08970 g001
Figure 2. The output saturation of the CBSR system without input signal.
Applsci 15 08970 g002
Figure 3. The output saturation of the CBSR system with input signal ( A 0 and D = 0 ).
Applsci 15 08970 g003
Figure 4. A typical curve of the proposed potential function U H Q ( x ) .
Applsci 15 08970 g004
Figure 5. The shape of the proposed potential function U H Q ( x ) under different parameters. (a) b = c = 1 , and different a; (b) a = c = 1 , and different b; (c) a = b = 1 , and different c.
Applsci 15 08970 g005
Figure 6. The output of the proposed UDHQSR system with different input amplitudes A ( a = b = c = β = 1 ).
Applsci 15 08970 g006
Figure 7. The theoretical output SNR of the proposed UDHQSR system ( A = 0.2 ). (a) b = c = 1 , β = 0.5 , and different a, (b) a = c = 1 , β = 0.5 , and different b, (c) a = b = 1 , β = 0.5 , and different c, (d) a = b = c = 1 , and different β .
Applsci 15 08970 g007
Figure 8. Flowchart of the proposed UDHQSR system-based weak signal detection algorithm.
Applsci 15 08970 g008
Figure 9. Small-frequency weak signal detection results. (a) Time series of the test weak signal. (b) Spectrum of the test weak signal. (c) Time series of the output of the proposed UDHQSR method. (d) Spectrum of the output of the proposed UDHQSR method. (e) Time series of the output of the CBSR method. (f) Spectrum of the output of the CBSR method.
Applsci 15 08970 g009
Figure 10. The iteration processes of the proposed UDHQSR system and the CBSR system for small-frequency weak signal detection. (a) Proposed UDHQSR system; (b) CBSR system.
Applsci 15 08970 g010
Figure 11. Large-frequency weak signal detection results. (a) Time series of the test weak signal. (b) Spectrum of the test weak signal. (c) Time series of the output of the proposed UDHQSR method. (d) Spectrum of the output of the proposed UDHQSR method.
Applsci 15 08970 g011
Figure 12. The fault signal collection platform [31] of the CWRU dataset.
Applsci 15 08970 g012
Figure 13. Detection results of the outer ring fault signal from the CWRU dataset. (a,b) The outer ring fault signal and its spectrum. (c,d) The output of the proposed UDHQSR system and its spectrum. (e,f) The output of the CBSR system and its spectrum.
Applsci 15 08970 g013
Figure 14. Detection results of the inner ring fault signal from the CWRU dataset. (a,b) The inner ring fault signal and its spectrum. (c,d) The output of the proposed UDHQSR system and its spectrum. (e,f) The output of the CBSR system and its spectrum.
Applsci 15 08970 g014
Figure 15. The fault signal collection platform [32] of XJTU-SY dataset.
Applsci 15 08970 g015
Figure 16. Detection results of the outer ring fault signal from the XJTU-SY dataset. (a,b) The outer ring fault signal and its spectrum. (c,d) The output of the proposed UDHQSR system and its spectrum. (e,f) The output of the CBSR system and its spectrum.
Applsci 15 08970 g016
Table 1. The parameter settings of the proposed UDHQSR-based weak signal detection method.
DescriptionSymbolValue
PSO settingspopulation sizeM50
iteration timesT50
self-learning factor c 1 1.2
group-learning factor c 2 1.2
inertial weight ω [ 0.4 ,   0.8 ]
UDHQSR
parameter setting
aa 0.01 ,   3
bb 0.01 ,   3
cc 0.01 ,   3
damping factor β 0.01 ,   1
Table 2. The necessary parameters of the CWRU dataset.
ParameterValue
Inner ring diameter25.001 mm
Outer ring diameter51.999 mm
Thickness15.001 mm
Rolling element diameter7.940 mm
Pitch diameter diameter39.04 mm
Number of bearing balls9
Rotation speed1750 r/min
Sampling frequency12 kHz
Table 3. The main parameters of the outer ring fault signal from the XJTU-SY dataset [32].
ParameterValue
Inner ring diameter29.30 mm
Outer ring diameter39.80 mm
Rolling element diameter7.92 mm
Pitch diameter34.55 mm
Number of bearing balls8
Rotation speed2100 r/min
Sampling frequency25.6 kHz
Table 4. Comparison of weak signal detection performance.
Fault TypeMethod A max Δ A PDR SNR out  (dB)
CWRU Outer ringUDHQSR system1.010.5860.58−3.8
CBSR system0.05750.0250.435−8.82
ASUBSR system0.03870.0210.543−7.8
CWRU Inner ringUDHQSR system0.1290.0630.488−2.51
CBSR system0.0170.0050.294−10.18
ASUBSR system0.0210.00750.357−7.95
XJTU-SY Outer ringUDHQSR system2.381.490.626−1.487
CBSR system0.75320.30520.405−7.98
ASUBSR system0.3550.2070.583−5.45
Disclaimer/Publisher’s Note: The statements, opinions and data contained in all publications are solely those of the individual author(s) and contributor(s) and not of MDPI and/or the editor(s). MDPI and/or the editor(s) disclaim responsibility for any injury to people or property resulting from any ideas, methods, instructions or products referred to in the content.