Article

Speed Climbing Analysis System Based on Spatial Positioning and Posture Recognition: Design and Effectiveness Assessment

by
Pingao Huang
1,3,
Tianzhan Huang
1,3,
Zhihong Xu
1,3,
Yuankang Zhang
4 and
Hui Wang
2,*
1
School of Electronic Engineering and Automation, Guilin University of Electronic Technology, Guilin 541004, China
2
Guangdong-Hong Kong-Macao Joint Laboratory of Human-Machine Intelligence-Synergy Systems, Shenzhen Institutes of Advanced Technology, Chinese Academy of Sciences, Shenzhen 518055, China
3
Key Laboratory of Intelligence Integrated Automation, Guangxi University, Guilin 541004, China
4
Shenzhen RunYiTaiYi Technology Co., Ltd., Shenzhen 518055, China
*
Author to whom correspondence should be addressed.
Appl. Sci. 2025, 15(16), 8959; https://doi.org/10.3390/app15168959
Submission received: 3 June 2025 / Revised: 17 July 2025 / Accepted: 21 July 2025 / Published: 14 August 2025

Abstract

The human body posture and trajectory are important parameters of the optimal path in speed climbing, and current researchers are focused on them. However, the performance of the newly developed analysis tools for synchronously and accurately analyzing climbing posture and trajectory is limited. This study develops an innovative speed climbing analysis system (SCAS) that integrates three-dimensional trajectory tracking using HTC Vive trackers and full-body posture capture with BlazePose. And the system is validated. Climbing trials were recorded from twelve professional athletes (speed climbers, eight males and four females; age 22 ± 2.2 years, all with ≥1 year of competitive experience) on a standard International Federation of Sport Climbing (IFSC) speed wall. The SCAS’s accuracy was analyzed by comparing its trajectory measurements to a video-based reference: the mean deviation was 0.061 ± 0.005 m (mean ± SD, 95% confidence interval [0.058, 0.064] m), indicating high precision. Trajectory metrics between genders were compared using independent-sample t-tests, revealing that male climbers had significantly shorter average path lengths (p < 0.05) and fewer movement inflections than female climbers. Finally, the group-optimal path derived from the data showed only slight deviations from the top-performing climbers’ paths. The proposed SCAS enables synchronous, millimeter-level tracking of climbing trajectory and posture, and can provide coaches with quantitative feedback for each athlete’s climbing strategy.

1. Introduction

Speed climbing is an extreme sport that combines human strength, explosiveness, and agility [1]. Athletes must ascend a standardized 15 m artificial wall as quickly as possible, requiring not only maximal anaerobic capacity but also optimized movement trajectories and precise posture control [2,3,4,5,6]. As a rapidly emerging sport, speed climbing was officially included in the 2024 Paris Olympic Games and continues to grow in popularity and influence [2,3]. This growing interest has driven the need for advanced training methodologies and performance analysis tools tailored specifically to the biomechanical demands of the sport.
Multiple factors influence performance in speed climbing, including physical conditioning, technical skill, and trajectory planning, of which the latter is often considered the most critical [4,5,6,7,8]. The concept of an “optimal path” refers to a trajectory that minimizes total distance and movement time while maximizing mechanical efficiency within the constraints of a fixed route [9,10,11]. Researchers have explored various strategies to optimize these factors, such as strength and conditioning programs [4,12], footwork-focused technical drills [6], and real-time feedback systems [13].
Traditional video-based analysis has long been employed to assess climbing movements, using multi-angle footage to reconstruct two-dimensional (2D) trajectories [14,15,16,17,18]. However, such methods are limited by perspective distortion, inconsistent lighting, and a lack of depth information, making it difficult to accurately capture subtle three-dimensional motion characteristics [19]. To address these limitations, recent studies have adopted optical motion-capture systems [20] and wearable inertial measurement units (IMUs) [21].
Marker-based motion-capture systems, such as those provided by Vicon or Qualisys, offer sub-centimeter accuracy in tracking joint trajectories and have been effectively used to study kinematics and joint torques in controlled indoor climbing environments [20,22,23]. Nevertheless, their application in speed climbing is restricted due to the impracticality of attaching reflective markers to athletes engaged in rapid, full-body movement during real-world conditions. IMUs present a more mobile alternative and have been used to investigate limb acceleration and inter-limb coordination. Still, these devices are subject to signal drift and offer limited capacity for full-body posture reconstruction [21].
In recent years, markerless pose estimation techniques powered by deep learning have gained significant traction in sports biomechanics [24,25]. Algorithms such as OpenPose, BlazePose, and DeepLabCut enable the real-time extraction of human keypoints from monocular or multi-view videos with increasing spatial accuracy [26,27,28]. For instance, Stenum et al. [29] validated a markerless pose estimation pipeline using BlazePose by comparing its output with that of a Vicon optical motion capture system, demonstrating competitive accuracy under controlled laboratory conditions. Zheng and Nogueira et al. [30,31] provide a comprehensive survey of multi-view, markerless 3D human pose estimation, outlining the strengths and limitations of various model architectures when applied to dynamic human movement.
Despite these technological advancements, only a few studies have explored the use of synchronized trajectory and posture capture in the context of speed climbing. In particular, the fusion of spatial and anatomical data to produce interpretable, performance-related metrics—such as trajectory smoothness, movement inflections, or deviations from an optimal path—remains underdeveloped. Furthermore, the variation in these metrics by gender or skill level remains poorly understood [5,16]. While Pandurevic et al. [16] conducted statistical analyses of time-split parameters in competitive speed climbing, and Paijens et al. [22] evaluated the spatial accuracy of VR-based localization systems in sports contexts, no existing studies have combined spatial tracking and full-body pose data to generate synchronized, anatomically detailed profiles of elite climbers.
To address these gaps, we developed an innovative speed climbing analysis system (SCAS, as shown in Figure 1) that integrates HTC Vive trackers for 3D trajectory capture with BlazePose for full-body posture recognition. The SCAS synchronizes both data streams and uses group-optimal path analysis to compare individual performance against empirically derived ideal trajectories. Drawing on principles from human adaptability and motor control theories [32,33,34], we hypothesize that the group-optimal path tends to resemble the path of elite athletes. Analyzing this integrated data will reveal systematic differences between group-optimal paths and elite athlete patterns, as well as differences in climbing strategies based on gender.
The SCAS was validated in two experiments conducted on a standard IFSC speed climbing wall with 12 professional athletes (8 males, 4 females; mean age: 22 ± 2.2 years; all with ≥1 year of competitive experience). Experiment 1 evaluated the SCAS’s measurement accuracy against a video-based reference. Experiment 2 investigated gender differences in climbing trajectories and deviations from the group-optimal path using statistical analysis. The results demonstrate that SCAS achieves millimeter-level measurement accuracy while allowing for natural movement, providing statistically significant insights into individual and gender-specific movement strategies.

2. Materials and Methods

2.1. Experimental Design

This study was designed as a validation experiment for a novel speed climbing analysis system. It aims to verify the system’s effectiveness, validate our hypotheses, perform group optimal path analysis, and examine gender-based differences. Two independent experiments were conducted on a standard IFSC regulation speed climbing wall [35]:
Experiment 1 (System Validation): A single experienced climber performed controlled climbing movements while equipped with the integrated tracking and posture-capture system. The goal was to evaluate the spatial accuracy of the system by comparing its output against a synchronized video-based reference.
Experiment 2 (Practical Application): Twelve professional climbers each completed three climbs under standardized conditions. The fastest attempt from each athlete was selected, and the group average path was calculated as the group-optimal path. The differences between individual and group optimality, as well as gender differences, were studied.

2.2. Participants

Twelve elite speed climbers (8 males, 4 females), all members of the National Climbing Team, took part in this study. Participants were recruited through the Competitive Sports Department of the Guizhou Provincial Sports Bureau. Inclusion criteria included active competition status and no musculoskeletal injuries within the past 6 months. Table 1 displays the number (n), mean ± SD of age, height, and weight for the male (n = 8), female (n = 4), and total (n = 12) groups, along with their competitive experience. The group consisted of 8 males and 4 females, all elite speed climbers and members of the national team. The combined group had an average age of 22.0 ± 2.2 years, height of 1.69 ± 0.04 m, and weight of 62.3 ± 4.6 kg, with all participants having at least one year of competitive experience. Males were, on average, slightly younger and heavier than females.
All participants electronically provided their consent. The study was approved by the Institutional Review Board of Shenzhen Institutes of Advanced Technology, Chinese Academy of Sciences. Approval Code: SIAT-IRB-240115-H0708.

2.3. System Setup and Data Acquisition

2.3.1. Three-Dimensional Trajectory Measurement

Three-dimensional trajectory tracking was achieved using the HTC Vive Pro 2.0 Lighthouse motion positioning system (HTC Corp., New Taipei City, Taiwan, China), which enables real-time localization through infrared laser sweeps and time-of-flight measurement [22]. The setup included four Lighthouse base stations (positioners) strategically positioned on both sides of the climbing wall (at 3 m, 7.5 m, 12 m, and 16.5 m) to ensure full coverage. An HTC Vive Tracker was attached to the climber’s waist to record their center of mass trajectory during ascents. The positions of the tracker and the Positioner are shown in Figure 1.
The system utilizes built-in dual-axis laser emitters HTC Vive Pro 2.0 Lighthouse motion positioning system and synchronized LED flashes to calculate the position of each tracker through time-difference triangulation. Reflective markers enhance tracking stability by increasing the return of infrared light, thereby improving the accuracy of the position data. This passive optical tracking architecture provides accurate position data with sub-centimeter precision [36], without restricting the athlete’s natural movement.

2.3.2. Motion Posture Capture

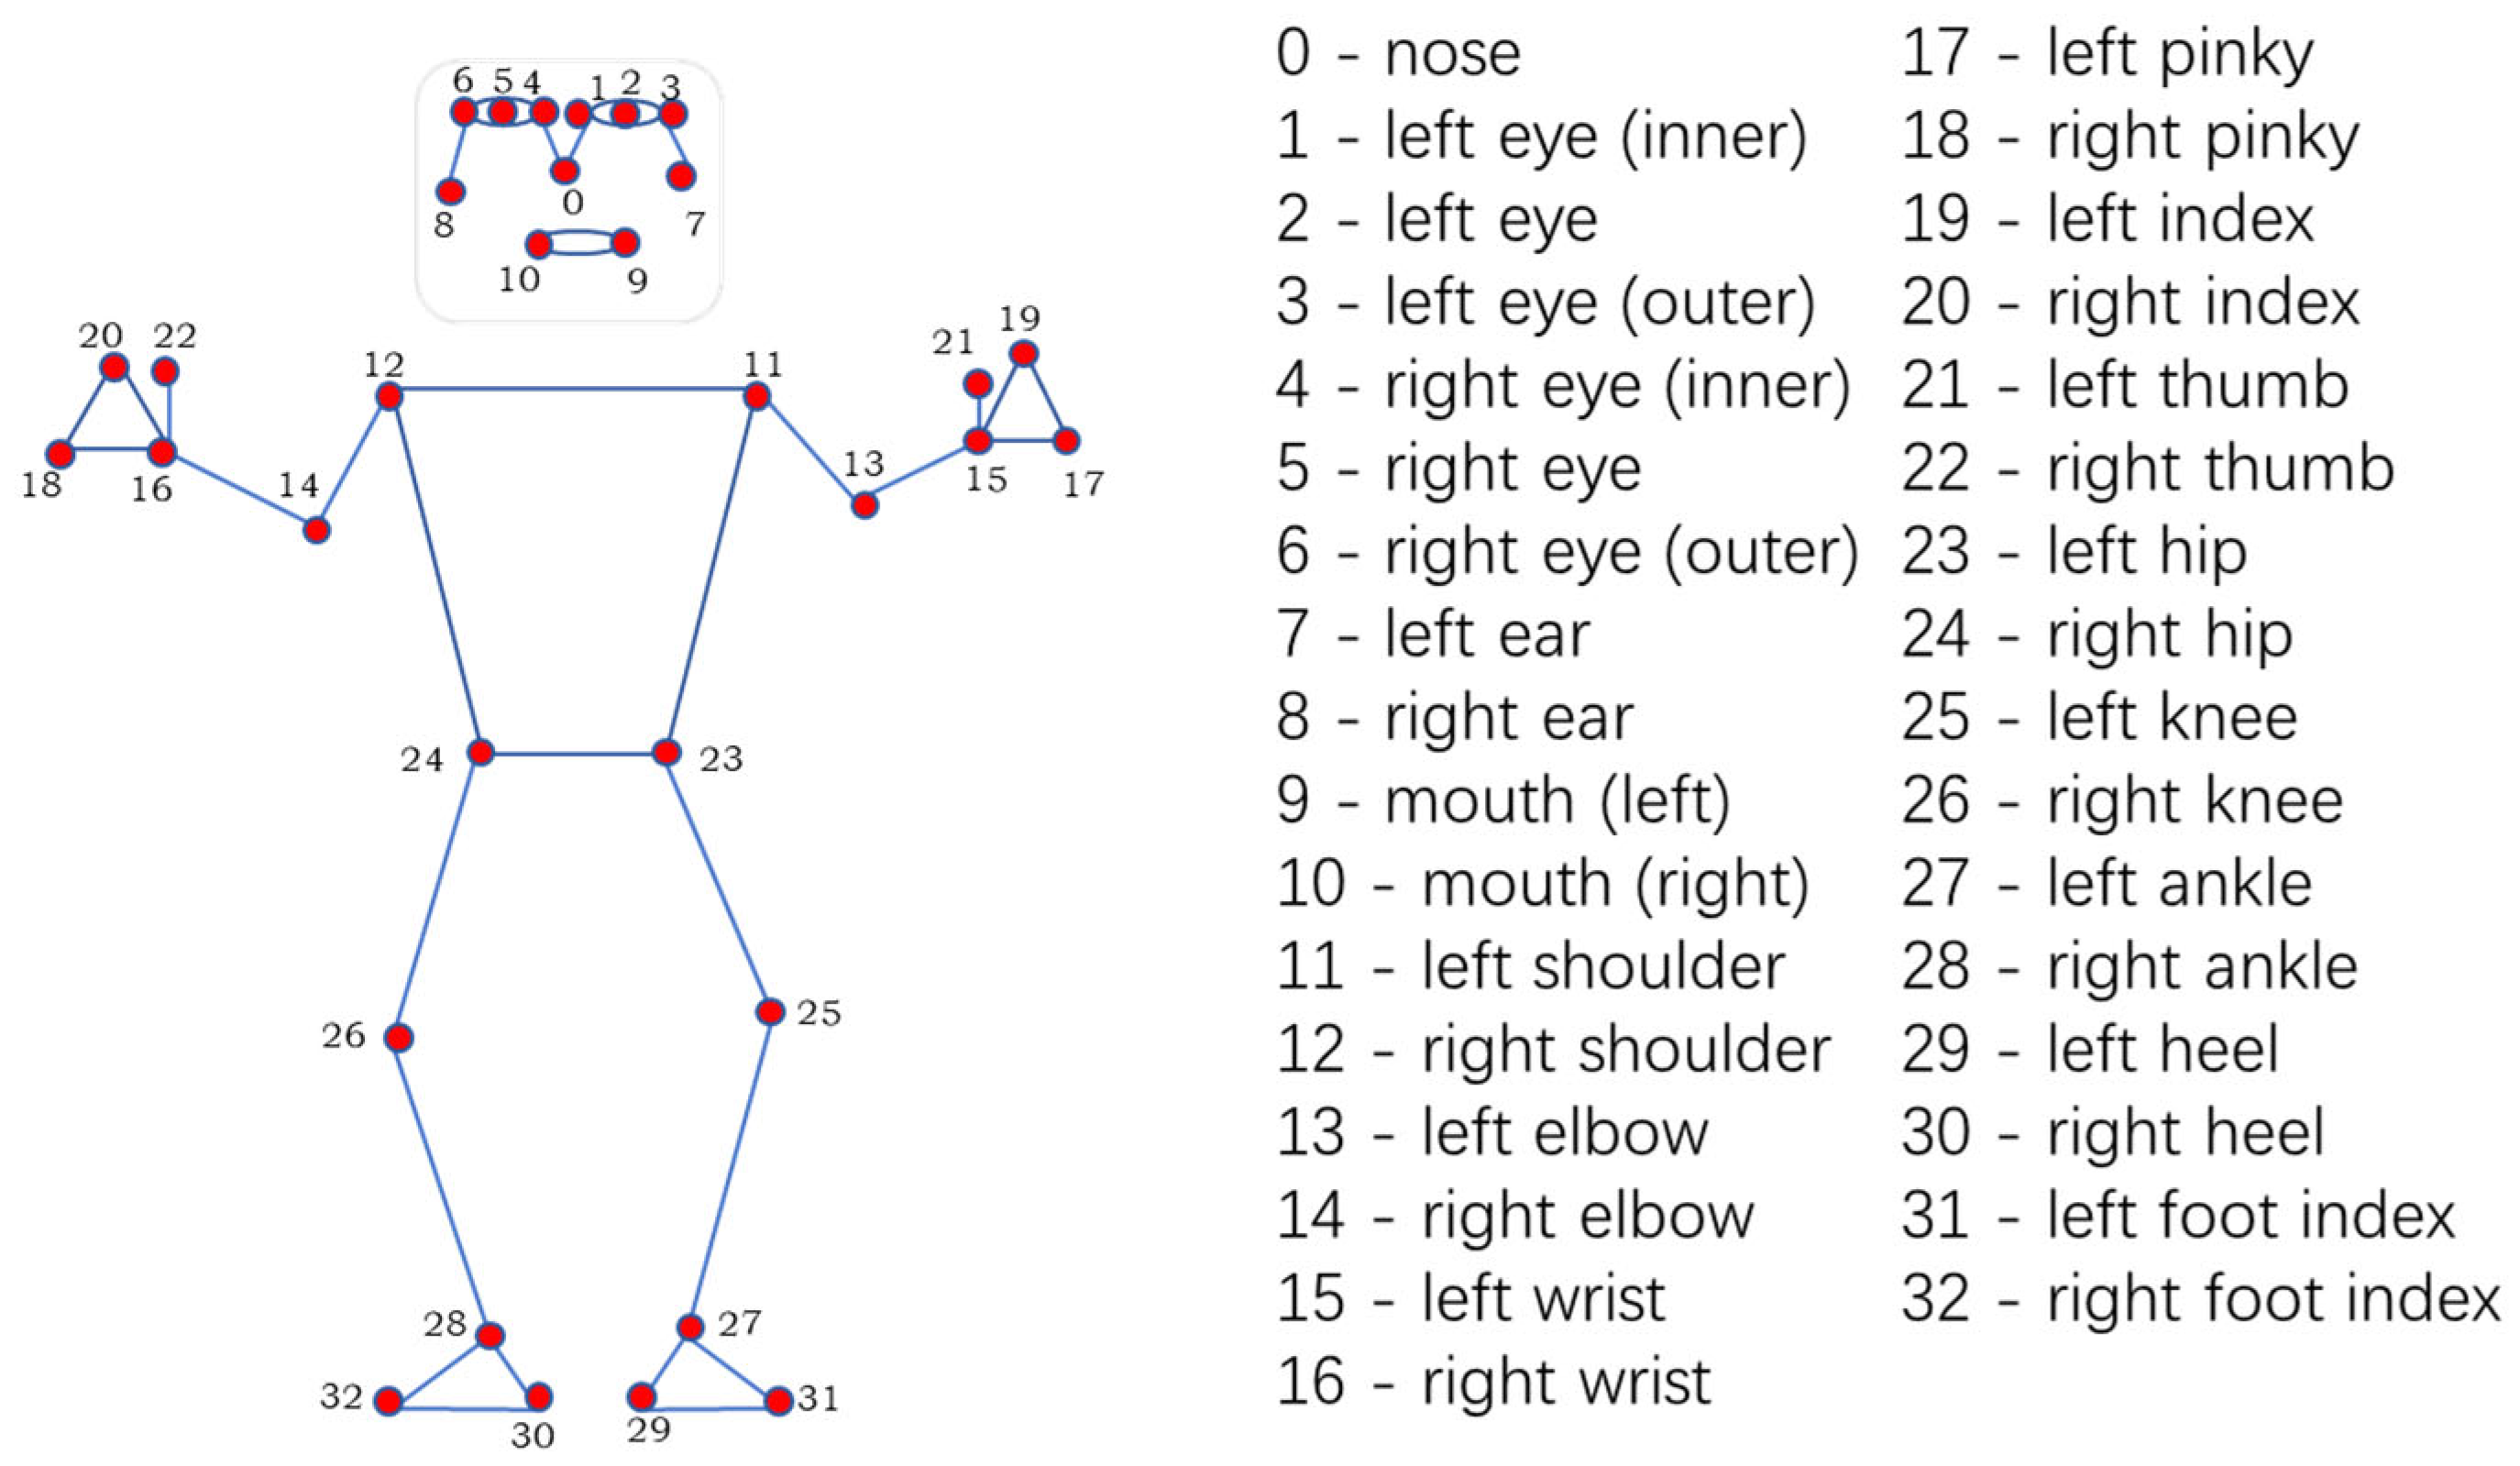
Posture capture was performed using a high-definition monocular camera (5 megapixel, 1920 × 1080 resolution at 60 fps) mounted at the base of the wall, capturing full-body climbing motions in the frontal plane. The system employed BlazePose, a convolutional neural network architecture optimized for real-time, markerless pose estimation [21]. BlazePose detects 33 anatomical keypoints per frame.
While BlazePose has demonstrated competitive accuracy in controlled environments, known limitations include reduced robustness to occlusion, perspective distortion, and lighting variation [9]. To mitigate these issues, video capture was performed under fixed lighting conditions, and athletes were instructed to avoid overlapping body segments during warm-up trials.
The extracted joint coordinates were integrated with the spatial data from the Vive system to enable synchronized analysis of trajectory and posture. Figure 2 illustrates the BlazePose keypoints.

2.3.3. System Calibration

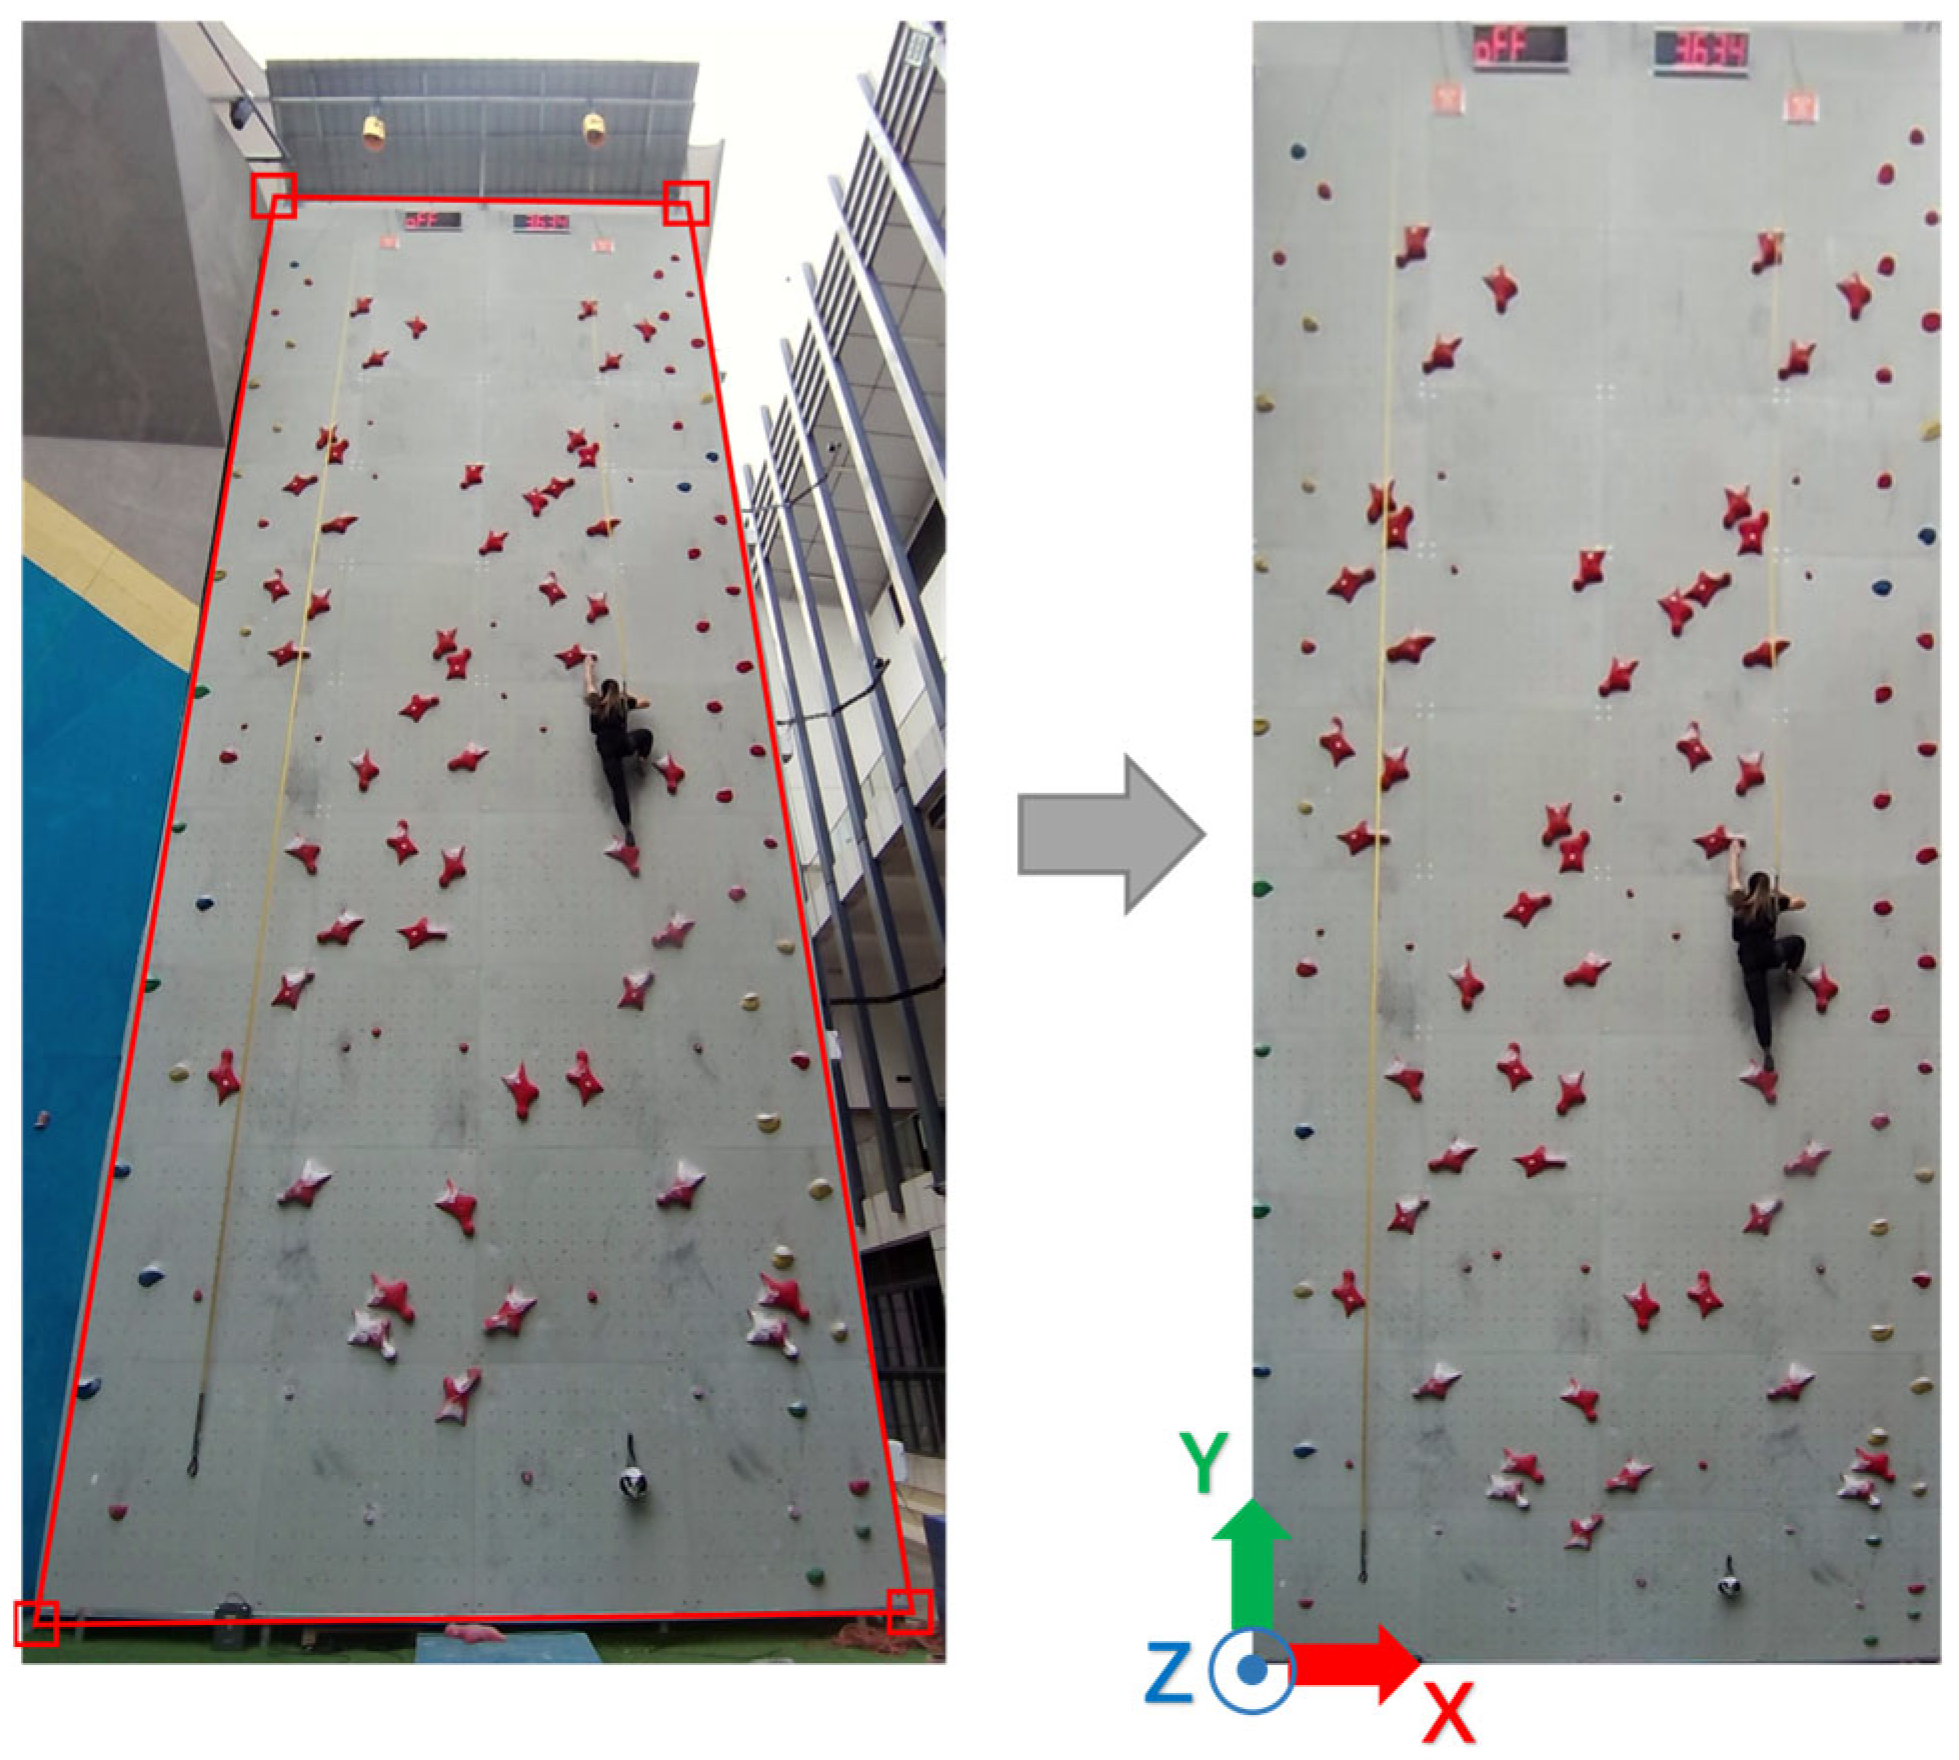
The coordinate system for trajectory and posture data fusion was defined, with the global origin point (0, 0, 0) located at the lower-left corner of the climbing wall (Figure 3). Real-time data from the HTC Vive Tracker was processed through the Vive software SDK (version: 4.0.0.0), which provided absolute 3D positioning based on lighthouse triangulation. These waist-mounted tracker coordinates served as the primary known 3D reference throughout the climbing sequence.
To ensure consistent spatial alignment between the two sensor systems (tracker and image-based), a comprehensive calibration protocol was developed to ensure accurate alignment. This included the following:
Physical calibration markers: Placed at known 3D coordinates on the climbing wall to serve as anchors for aligning both camera and tracker data.
Perspective alignment: A custom trapezoidal correction algorithm was applied to address lens distortion and oblique viewing angles from the monocular camera.
Camera perspective distortion was corrected using a transformation matrix M = K × R, where K is the camera’s intrinsic matrix (encoding focal lengths and optical center) and R is a manually estimated rotation matrix aligning the image plane with the climbing wall. The transformation was computed using four coplanar reference points forming a quadrilateral on the wall to assess the homography. This ensured that BlazePose keypoints, initially expressed in 2D screen coordinates, could be rectified to approximate real-world 3D positions on the wall surface.
The formula for the perspective transformation is as follows:
Let P (x, y) be a pixel in the original image, Q (u, v) be the projected pixel in the transformed space, and M be the 3 × 3 perspective transformation matrix. Then,
Q = M × P with P = [x, y, 1] T, Q = [u, v, w] T, (u′, v′) = (u/w, v/w).
This allowed for the correction of trapezoidal distortion and the alignment of the 2D image plane with the wall’s 3D coordinate plane. Figure 4 illustrates the effect of the trapezoidal correction.

2.3.4. Data Fusion

Once both data streams—the three-dimensional (3D) trajectory from the HTC Vive Tracker and the two-dimensional (2D) posture keypoints from BlazePose—were calibrated within a shared spatial reference frame, a fusion procedure was conducted to synchronize and integrate the datasets.
The two data streams were aligned based on hardware-generated timestamps recorded during acquisition. Both the tracker and video data were resampled to a uniform frequency of 90 Hz using linear interpolation, ensuring frame-by-frame correspondence between the trajectory and posture observations. Following trapezoidal correction to transform BlazePose 2D keypoints into a rectified, wall-aligned coordinate space, rigid-body registration was applied to align these with the 3D Vive Tracker trajectory. The waist-mounted tracker provided a reliable 3D spatial anchor and was used to guide the alignment of torso-level or hip-level keypoints from BlazePose.
To further refine this alignment, the Iterative Closest Point (ICP) algorithm was employed. A subset of anatomically stable keypoints (such as the climber’s waist) was used to compute an optimal transformation matrix that minimized point-to-point distances between the modalities.
Before fusion, the performance of the HTC Vive tracking system has been validated in several studies [37,38,39]. Reported positional accuracy for static objects is typically below 1 mm, while under dynamic, high-speed movement or non-ideal conditions, the accuracy ranges within the centimeter level [38]. Similarly, BlazePose accuracy has been benchmarked using the Percentage of Correct Keypoints (PCK@0.2) metric, achieving 97.5% on the AR dataset and 93.5% on the Leeds Sports Pose (LSP) dataset. These values correspond to 2D localization errors within 20% of the torso size, typically less than or equal to 30 mm [25,26]. In this study, the fusion process achieved sub-centimeter spatial alignment, with a mean residual error of 0.002 ± 0.001 m between matched points across all frames. This high-precision alignment demonstrated strong consistency between image-based and sensor-based measurements.
Figure 5 illustrates the overall workflow of the data fusion pipeline. The resulting fused dataset enabled the generation of temporally aligned, anatomically consistent 3D motion sequences, which formed the basis for subsequent trajectory efficiency analysis and group-optimal path modeling.

2.4. Statistical Analysis

Data analyses were performed using IBM SPSS Statistics v27.0. Before analysis, the Shapiro–Wilk test was used to assess normality of all primary metrics. All variables met the normality assumption (p > 0.05).
Descriptive statistics were reported as mean ± standard deviation. Gender differences were assessed using two-tailed independent-sample t-tests (α = 0.05). The following metrics were evaluated:
- Climb time (s);
- Number of trajectory inflections;
- Mean deviation from the group-optimal path (m).
Effect sizes (Cohen’s d) and 95% confidence intervals were computed for each significant result to contextualize the magnitude of differences.

3. Results

3.1. System Validation Experiments

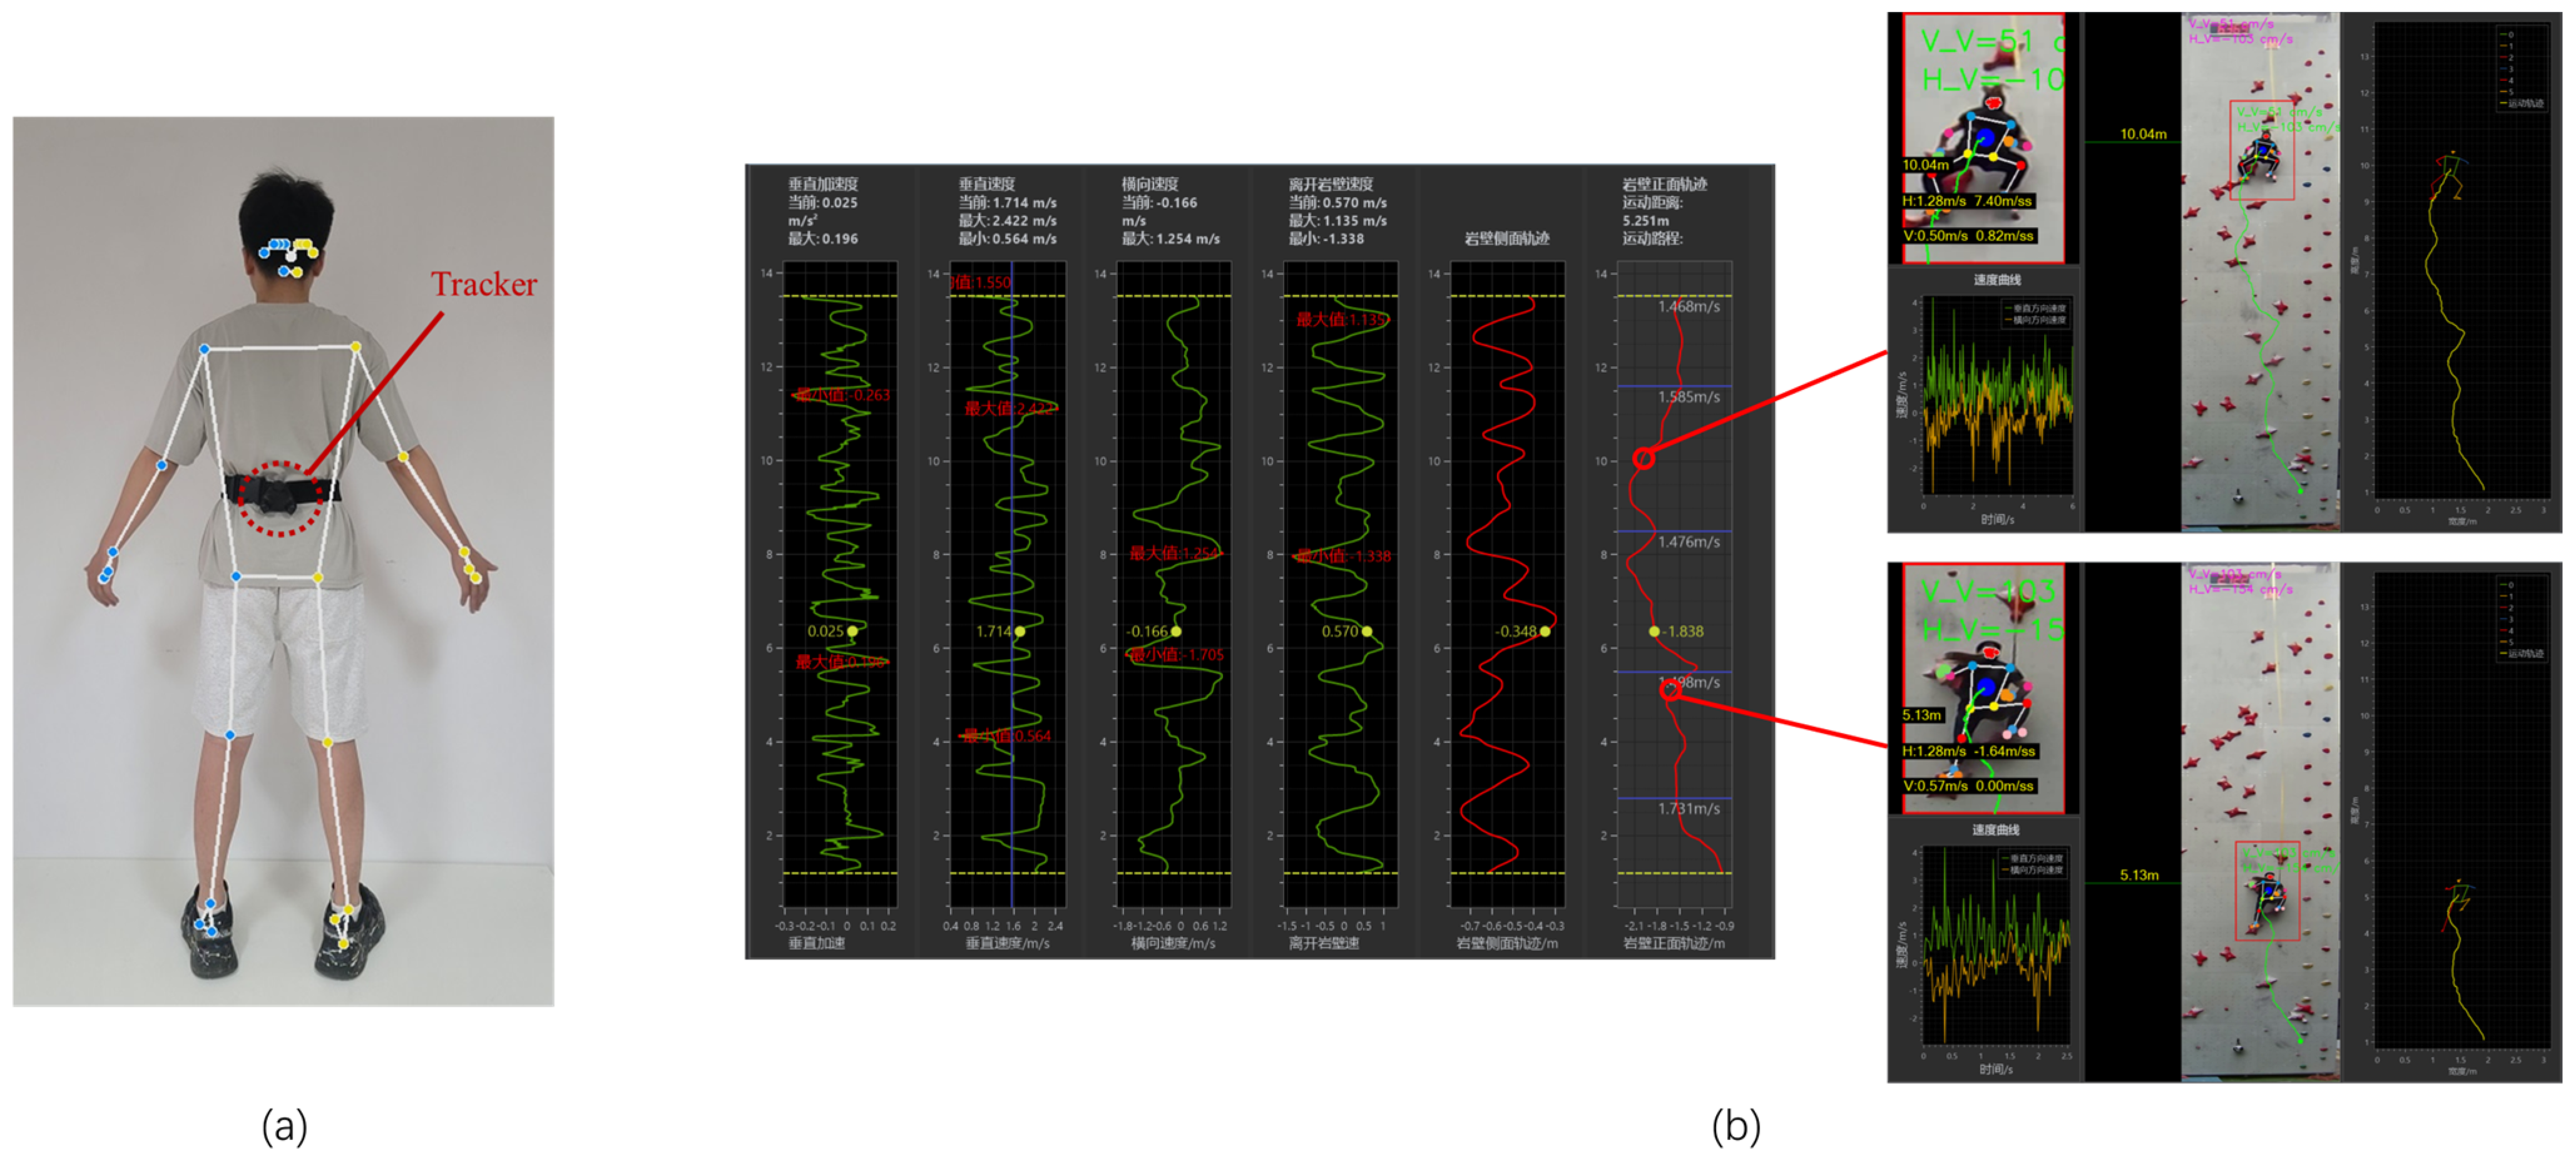
The primary objective of Experiment 1 was to evaluate the spatial accuracy of the integrated system by comparing its 3D trajectory output with a video-based reference. Figure 6a illustrates the placement of the spatial tracker on the athlete and the identification of key posture points. Figure 6b displays snapshots of motion trajectories and posture overlays captured by the CSAS’s interface. After synchronizing timestamps and performing spatial alignment using the Iterative Closest Point algorithm, we calculated point-wise deviation between the trajectory data from the HTC Vive Tracker and posture data derived from BlazePose.
- Mean deviation: 0.061 ± 0.005 m (mean ± SD);
- Confidence interval at 95%: [0.058, 0.064] m;
- Residual alignment error (ICP): 0.002 ± 0.001 m.
These results confirm that the CSAS achieved sub-centimeter-level accuracy in tracking climbing trajectories while maintaining temporal synchronization with posture recognition data. Furthermore, the error distribution was uniform across climbing segments and did not differ significantly among subjects (one-way ANOVA, F(11, 108) = 1.12, p = 0.35), suggesting consistent measurement performance.

3.2. Practical Use Experiments

In Experiment 2, performance metrics from 12 professional climbers (8 males, 4 females) were analyzed. For each athlete, the best climb was selected for statistical evaluation, and the group average path was calculated as the group-optimal path.

3.2.1. Statistical Analysis of Climbing Performance

Descriptive statistics and group comparisons for key performance metrics are shown below. Climb time (the time to complete the 15 m climb), trajectory inflections (number of directional changes), and average deviation from the group-optimal path were calculated for each climber’s fastest trial. Table 2 presents the group mean ± SD for these metrics by gender, along with the results of independent-sample t-tests comparing males and females.
Both groups completed the climb successfully under the same conditions. Male climbers (n = 8) had significantly faster climb times than female climbers (n = 4). Specifically, the average climb time for males was 5.97 ± 0.21 s, compared to 6.65 ± 0.31 s for females (t(10) = 4.28, p = 0.002, Cohen’s d = 2.47; Table 2). This large effect indicates a clear gender difference in ascent time. Similarly, male climbers made fewer trajectory inflections on average: 10.1 ± 0.6 inflections for males versus 12.0 ± 0.7 for females (t(10) = 5.66, p < 0.001, d = 3.27), again a very large effect. Lastly, males had a smaller mean deviation from the group-optimal path (0.157 ± 0.007 m) than females (0.190 ± 0.012 m) (t(10) = 6.46, p < 0.001, d = 3.73). In all cases, Levene’s test confirmed that the variances were equal. These findings demonstrate statistically significant and practically meaningful gender differences in performance metrics.

3.2.2. Group-Optimal Path Analysis

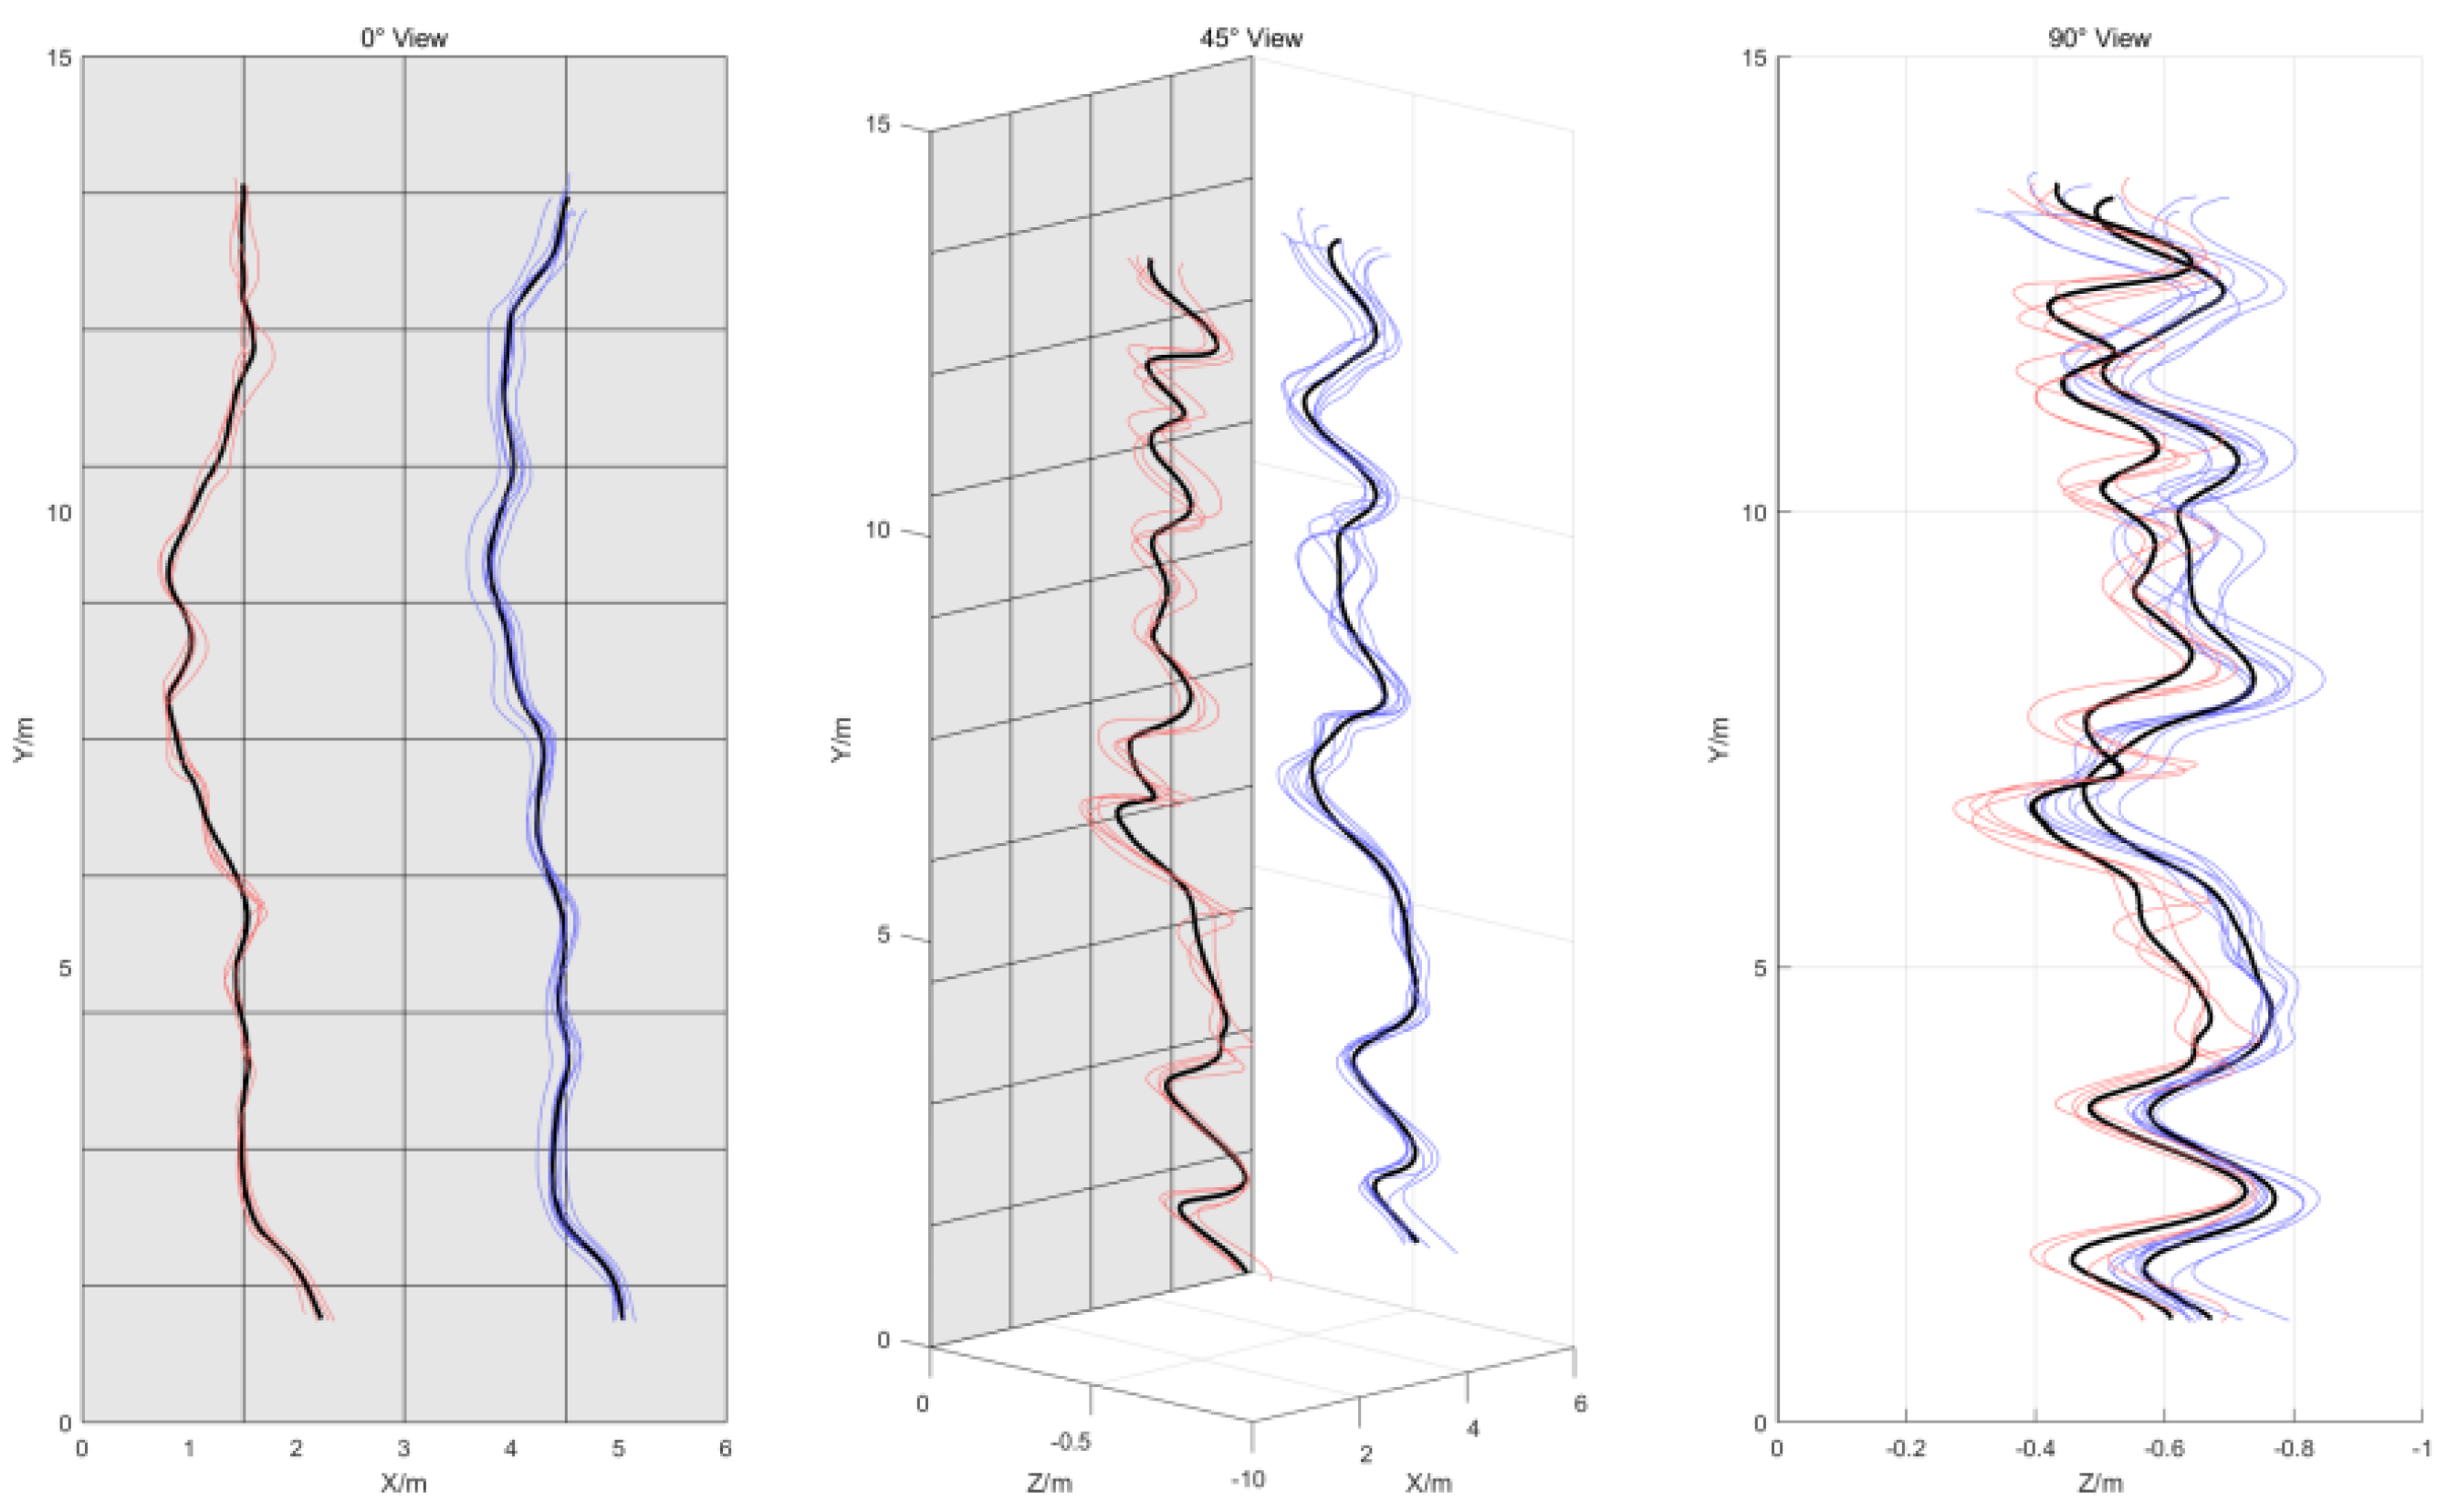
The group-optimal path was calculated separately for each gender using time-normalized curve fitting. Figure 7 displays the 3D trajectories of all athletes: blue lines indicate male climbers, and red lines represent female climbers. The black lines show the optimal paths within each group, and the gray surface depicts the climbing wall. The plot is viewed from multiple angles (0°, 45°, and 90°) to illustrate path variation. Figure 7 reveals that female athletes exhibited more inflection points on the Z-axis, indicating greater use of vertical adjustments for stability. In contrast, male athletes demonstrated higher velocity, reflecting more explosive, dynamic movements. This highlights the importance of gender-specific analysis when determining optimal path strategies. To maintain consistency in point count and path structure, all trajectories were resampled and aligned before averaging. Each athlete’s trajectory was compared to the group-optimal path using Euclidean and Fréchet distance metrics. Athletes who were closest to the group-optimal path generally recorded faster climb times.
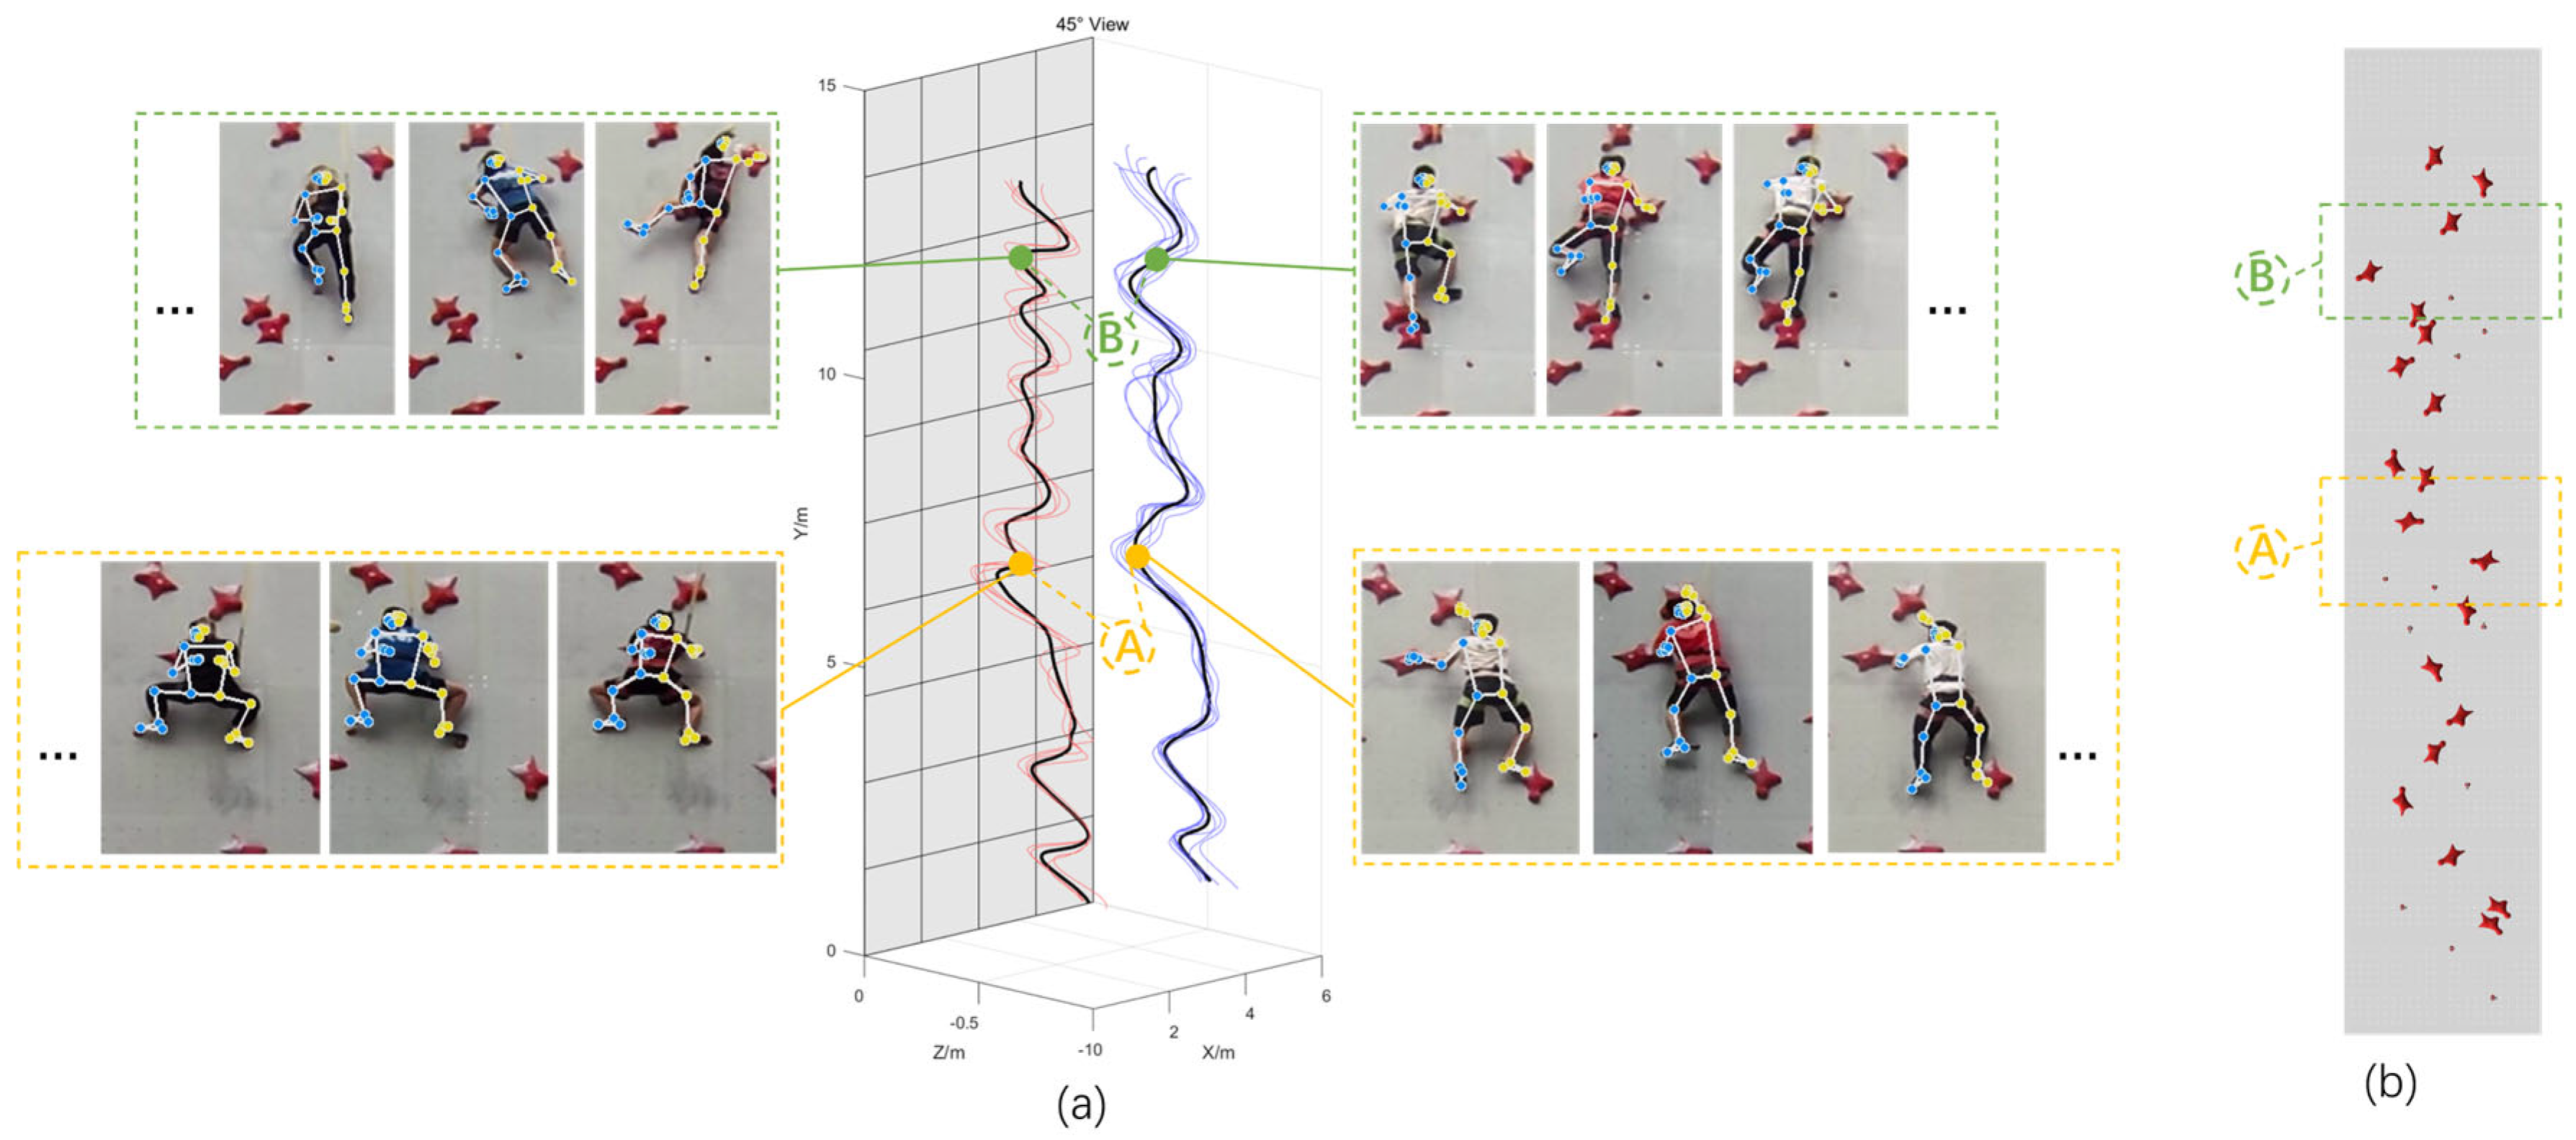
Figure 8 identifies two technical divergence nodes (A and B) on the trajectory curves. At node A, female climbers typically chose the left path between rock holds, leading to greater knee flexion, whereas male climbers chose a longer but more linear right-side route, maintaining straighter leg posture. At node B, female climbers again selected a wider right-hand path with increased lateral displacement, while male athletes retained a more compact center of gravity. These findings suggest that female athletes tend to favor strategies that prioritize stability and flexibility, whereas male athletes tend to emphasize power and direct trajectory.
These results support the effectiveness of the group-optimal path framework as a tool for identifying performance gaps and guiding personalized coaching strategies based on movement efficiency.

4. Discussion

This study developed and validated a new speed climbing analysis system (CSAS) that combines millimeter-level 3D trajectory tracking with HTC Vive Trackers and full-body pose recognition using BlazePose. The CSAS was tested for accuracy and applied in real-world settings to analyze climbing strategies. The findings supported our hypotheses: the group-optimal path tends to resemble the path of elite athletes, and it showed systematic differences between group-optimal paths and elite athlete patterns, as well as differences in climbing strategies by gender.
In Experiment 1, the CSAS showed a mean trajectory error of 0.061 ± 0.005 m and an ICP-based post-fusion residual error of 0.002 ± 0.001 m. This accuracy level is comparable to that of marker-based motion-capture systems, such as Vicon, which are widely used in biomechanical research but require extensive calibration and can interfere with natural athlete movement [20,22,23]. CSAS maintains movement authenticity while enabling synchronized posture and trajectory recording in unconstrained settings, advancing field-based biomechanics. Compared to traditional video-based or inertial sensor systems, the current setup provides higher spatial resolution and overcomes issues related to occlusion and lighting changes [9,25]. The dual data streams—trajectory and pose—were successfully synchronized via timestamp alignment and frame interpolation, creating a solid basis for performance analysis and coaching interventions.
In Experiment 2, athletes who stayed closest to the optimal group path usually climbed faster. This also suggests that the group-optimal path tends to resemble the path of elite athletes. Statistically significant gender differences were found in climbing performance, particularly in climb time, the number of trajectory inflections, and deviation from the group-optimal path. Male climbers followed more direct trajectories, made fewer movement changes, and completed climbs more quickly, while female climbers took slightly longer and showed more lateral movement. The differences were not only statistically significant (p < 0.005) but also had large effect sizes (Cohen’s d > 2.0). These results are consistent with previous research on gender differences in climbing ability. For instance, Němá et al. found that male climbers outperformed females in explosive power tests [40], such as the squat jump and countermovement jump, as well as in their rate of force development. This aligns with our finding of shorter completion times for men. Overall, these findings support earlier studies suggesting that male athletes tend to favor explosive, power-oriented climbing strategies, whereas female athletes rely more on flexibility and stability [41,42].
The group-optimal path framework allowed for the identification of efficient trajectory templates within each gender. The mean deviation from this path was 0.157 ± 0.007 m for males and 0.190 ± 0.012 m for females, indicating a consistent difference in movement precision. Although the numerical difference appears small, in the context of a 15 m climb, a 0.03 m increase in average deviation may correspond to a delay of 0.5 to 0.7 s, which is decisive in high-level competition.
In contrast, women generally exhibit greater flexibility and muscular endurance, which are advantageous for climbing. Carroll notes that women are typically more flexible than men on average [43], and that this flexibility plays a crucial role in rock climbing. Increased joint mobility enables female climbers to execute more complex maneuvers and reach holds that require significant body contortion. Additionally, women tend to have a higher proportion of slow-twitch muscle fibers, which gives them greater endurance [40], enabling sustained isometric contractions and stable postural control. These traits may explain the female climbers’ tendency for more lateral displacement and knee flexion at key route points (as observed in our optimal path analysis). In summary, our data support a model where male climbers emphasize power and directness, while female climbers emphasize stability and flexibility. Other research has also suggested these complementary strategies [40,43], which can inform gender-specific training—such as focusing on explosive power for women and stability drills for men. Furthermore, this study showcases a practical, non-invasive method for multimodal data fusion. The combined use of rigid-body registration, homographic projection, and ICP refinement resulted in stable, real-time alignment between vision-based and tracker-based systems.
Several limitations should be acknowledged. First, the sample was relatively small (n = 12) and unbalanced by gender (eight males, four females), which could affect generalizability. Future studies should include a larger sample of climbers, in particular more female athletes, to validate these findings. Second, our system validation (Experiment 1) employed a video-based reference rather than a traditional motion-capture gold standard, such as Vicon. While the high precision (0.061 m mean error) is promising, further validation with multiple systems and dynamic movements is needed. Third, all testing was performed indoors under controlled lighting; field tests in outdoor or less-controlled settings would be valuable for assessing system robustness. Finally, although our system runs at high speed (<100 ms latency), we did not implement real-time feedback to athletes. Future work could integrate live coaching cues or haptic feedback, leveraging the millimeter-level tracking demonstrated here.
Future research should also explore different populations and tasks. For example, including recreational climbers, adolescent athletes, or analyzing lead/bouldering disciplines could extend the system’s applicability. Other promising directions include developing personalized optimal-path models or integrating wearable sensors (IMUs) to further enrich the biomechanical data stream. With these enhancements, our fused tracker–pose system could evolve into a real-time coaching tool.

5. Conclusions

This paper presents a validated, portable system that combines real-time posture recognition and trajectory tracking to analyze speed climbing performance. The system attains sub-centimeter fusion accuracy and provides statistically reliable insights into specific climbing strategies. Key contributions include (1) a multimodal measurement framework suitable for unconstrained environments, (2) group-optimal path modeling for performance benchmarking, and (3) evidence of actionable biomechanical differences between male and female climbers. Its low latency and portability make it a useful tool for practical coaching, athlete monitoring, and future sports biomechanics research.

Author Contributions

Conceptualization, P.H. and T.H.; methodology, P.H.; software, Y.Z.; validation, P.H., T.H. and Z.X.; formal analysis, H.W.; investigation, P.H.; resources, H.W.; data curation, T.H.; writing—original draft preparation, T.H.; writing—review and editing, P.H.; visualization, Z.X.; supervision, H.W.; project administration, P.H.; funding acquisition, H.W. All authors have read and agreed to the published version of the manuscript.

Funding

This work was supported in part by grants from the National Natural Science Foundation of China (#62363006) and the Shenzhen Science and Technology Program (#KCXFZ202307311093300001), Shenzhen Medical Research Fund (#A2303065).

Institutional Review Board Statement

The study was conducted in accordance with the Declaration of Helsinki, and approved by the Institutional Review Board of Shenzhen Institutes of Advanced Technology, Chinese Academy of Sciences. Approval Code: SIAT-IRB-240115-H0708.

Informed Consent Statement

Informed consent was obtained from all subjects involved in the study.

Data Availability Statement

The data that support the findings of this study are available from the corresponding author upon reasonable request.

Conflicts of Interest

Yuankang Zhang was employed by the Shenzhen RunYiTaiYi Technology Co., Ltd. The remaining authors declare that the research was conducted in the absence of any commercial or financial relationships that could be construed as a potential conflict of interest.

References

  1. Winkler, M.; Künzell, S.; Augste, C. Competitive Performance Predictors in Speed Climbing, Bouldering, and Lead Climbing. J. Sports Sci. 2023, 41, 736–746. [Google Scholar] [CrossRef]
  2. De La Cruz, V.M.; Carranza, V.R.; González Ravé, J.M. Road to Paris 2024: Force-Velocity Profile in Different Speed Climbers’ Abilities. Biol. Sport 2024, 41, 131–137. [Google Scholar] [CrossRef] [PubMed]
  3. Lutter, C.; Tischer, T.; Schöffl, V.R. Olympic Competition Climbing: The Beginning of a New Era—A Narrative Review. Br. J. Sports Med. 2021, 55, 857–864. [Google Scholar] [CrossRef]
  4. Ehiogu, U.D.; Krawczyk, M.; Tallent, J. Strength and Conditioning Considerations for Speed Climbing. Strength Cond. J. 2022, 45, 259–271. [Google Scholar] [CrossRef]
  5. Pandurevic, D.; Sutor, A.; Hochradel, K. Towards Statistical Analysis of Predictive Parameters in Competitive Speed Climbing. Sports Eng. 2023, 26, 42. [Google Scholar] [CrossRef]
  6. Orth, D.; Davids, K.; Seifert, L. Coordination in Climbing: Effect of Skill, Practice and Constraints Manipulation. Sports Med. 2016, 46, 255–268. [Google Scholar] [CrossRef]
  7. Langer, K.; Simon, C.; Wiemeyer, J. Physical Performance Testing in Climbing—A Systematic Review. Front. Sports Act. Living 2023, 5, 1130812. [Google Scholar] [CrossRef]
  8. Draper, N.; Dickson, T.; Blackwell, G.; Fryer, S.; Priestley, S.; Winter, D.; Ellis, G. Self-Reported Ability Assessment in Rock Climbing. J. Sports Sci. 2011, 29, 851–858. [Google Scholar] [CrossRef]
  9. Seifert, L.; Cordier, R.; Orth, D.; Courtine, Y.; Croft, J.L. Role of Route Previewing Strategies on Climbing Fluency and Exploratory Movements. PLoS ONE 2017, 12, e0176306. [Google Scholar] [CrossRef]
  10. Legreneur, P.; Rogowski, I.; Durif, T. Kinematic Analysis of the Speed Climbing Event at the 2018 Youth Olympic Games. Comput. Methods Biomech. Biomed. Eng. 2019, 22, S264–S266. [Google Scholar] [CrossRef]
  11. Grant, S.; Hynes, V.; Whittaker, A.; Aitchison, T. Anthropometric, Strength, Endurance and Flexibility Characteristics of Elite and Recreational Climbers. J. Sports Sci. 1996, 14, 301–309. [Google Scholar] [CrossRef] [PubMed]
  12. Abt, G.; Jobson, S.; Morin, J.-B.; Passfield, L.; Sampaio, J.; Sunderland, C.; Twist, C. Raising the Bar in Sports Performance Research. J. Sports Sci. 2022, 40, 125–129. [Google Scholar] [CrossRef] [PubMed]
  13. Badiola-Bengoa, A.; Mendez-Zorrilla, A. A Systematic Review of the Application of Camera-Based Human Pose Estimation in the Field of Sport and Physical Exercise. Sensors 2021, 21, 5996. [Google Scholar] [CrossRef] [PubMed]
  14. Yan, M.; Wang, X.; Dai, Y.; Shen, S.; Wen, C.; Xu, L.; Ma, Y.; Wang, C. CIMI4D: A Large Multimodal Climbing Motion Dataset under Human-Scene Interactions. In Proceedings of the 2023 IEEE/CVF Conference on Computer Vision and Pattern Recognition (CVPR), Vancouver, BC, Canada, 17–24 June 2023; IEEE: New York, NY, USA, 2023; pp. 12977–12988. [Google Scholar]
  15. Richter, J.; Beltrán, R.B.; Heinkel, U. Camera-Based Climbing Analysis for a Therapeutic Training System. Curr. Dir. Biomed. Eng. 2020, 6, 20202010. [Google Scholar] [CrossRef]
  16. Pandurevic, D.; Draga, P.; Sutor, A.; Hochradel, K. Analysis of Competition and Training Videos of Speed Climbing Athletes Using Feature and Human Body Keypoint Detection Algorithms. Sensors 2022, 22, 2251. [Google Scholar] [CrossRef]
  17. Chen, R.; Liu, Z.; Li, Y.; Gao, J. A Time-Motion and Error Analysis of Speed Climbing in the 2019 IFSC Speed Climbing World Cup Final Rounds. Int. J. Environ. Res. Public Health 2022, 19, 6003. [Google Scholar] [CrossRef]
  18. Askari Hosseini, S.; Wolf, P. Performance Indicators in Speed Climbing: Insights from the Literature Supplemented by a Video Analysis and Expert Interviews. Front. Sports Act. Living 2023, 5, 1304403. [Google Scholar] [CrossRef]
  19. Reveret, L.; Chapelle, S.; Quaine, F.; Legreneur, P. 3D Visualization of Body Motion in Speed Climbing. Front. Psychol. 2020, 11, 2188. [Google Scholar] [CrossRef]
  20. Iguma, H.; Kawamura, A.; Kurazume, R. A New 3D Motion and Force Measurement System for Sport Climbing. In Proceedings of the 2020 IEEE/SICE International Symposium on System Integration (SII), Honolulu, HI, USA, 12–15 January 2020; IEEE: New York, NY, USA, 2020; pp. 1002–1007. [Google Scholar]
  21. Shiao, Y.; Chen, G.-Y.; Hoang, T. Three-Dimensional Human Posture Recognition by Extremity Angle Estimation with Minimal IMU Sensor. Sensors 2024, 24, 4306. [Google Scholar] [CrossRef]
  22. Paijens, A.F.M.; Huang, L.; Al-Jumaily, A.M. Measurement of the Positions of Light Sensors on a Mobile Frame Being Tracked with a Lighthouse Localization System. Sens. Actuators A Phys. 2021, 331, 112979. [Google Scholar] [CrossRef]
  23. Vrzáková, H.; Koskinen, J.; Andberg, S.; Lee, A.; Amon, M.J. Towards Automatic Object Detection and Activity Recognition in Indoor Climbing. Sensors 2024, 24, 6479. [Google Scholar] [CrossRef]
  24. Xie, Y.; Li, S.; Lin, P. Producing a Standard Dataset of Speed Climbing Training Videos Using Deep Learning Techniques. arXiv 2023, arXiv:2305.13858. [Google Scholar] [CrossRef]
  25. Kosourikhina, V.; Kavanagh, D.; Richardson, M.J.; Kaplan, D.M. Validation of Deep Learning-Based Markerless 3D Pose Estimation. PLoS ONE 2022, 17, e0276258. [Google Scholar] [CrossRef] [PubMed]
  26. Mathis, A.; Mamidanna, P.; Cury, K.M.; Abe, T.; Murthy, V.N.; Mathis, M.W.; Bethge, M. DeepLabCut: Markerless Pose Estimation of User-Defined Body Parts with Deep Learning. Nat. Neurosci. 2018, 21, 1281–1289. [Google Scholar] [CrossRef] [PubMed]
  27. Cao, Z.; Hidalgo, G.; Simon, T.; Wei, S.-E.; Sheikh, Y. OpenPose: Realtime Multi-Person 2D Pose Estimation Using Part Affinity Fields. IEEE Trans. Pattern Anal. Mach. Intell. 2021, 43, 172–186. [Google Scholar] [CrossRef] [PubMed]
  28. Bazarevsky, V.; Grishchenko, I.; Raveendran, K.; Zhu, T.; Zhang, F.; Grundmann, M. BlazePose: On-Device Real-Time Body Pose Tracking. arXiv 2020, arXiv:2006.10204. [Google Scholar] [CrossRef]
  29. Stenum, J.; Rossi, C.; Roemmich, R.T. Two-Dimensional Video-Based Analysis of Human Gait Using Pose Estimation. PLoS Comput. Biol. 2021, 17, e1008935. [Google Scholar] [CrossRef]
  30. Zheng, C.; Wu, W.; Chen, C.; Yang, T.; Zhu, S.; Shen, J.; Kehtarnavaz, N.; Shah, M. Deep Learning-Based Human Pose Estimation: A Survey. ACM Comput. Surv. 2020, 56, 1–37. [Google Scholar] [CrossRef]
  31. Nogueira, A.F.R.; Oliveira, H.P.; Teixeira, L.F. Markerless Multi-View 3D Human Pose Estimation: A Survey. Image Vis. Comput. 2025, 155, 105437. [Google Scholar] [CrossRef]
  32. Mulder, T.; Hochstenbach, J. Adaptability and Flexibility of the Human Motor System:Implications for Neurological Rehabilitation. Neural Plast. 2001, 8, 131–140. [Google Scholar] [CrossRef]
  33. Yasukouchi, A. A Perspective on the Diversity of Human Adaptability. J. Physiol. Anthropol. 2005, 24, 243–247. [Google Scholar] [CrossRef]
  34. Glazier, P.S.; Davids, K.; Bartlett, R. Dynamical systems theory: A relevant framework for performance-oriented sports biomechanical research. Sportscience 2003, 7, 2–18. [Google Scholar]
  35. International Federation of Sport Climbing (IFSC). Speed Licence Rules—Speed Walls. IFSC. 2022. Available online: https://www.ifsc-climbing.org/ (accessed on 10 April 2025).
  36. Ikbal, M.S.; Ramadoss, V.; Zoppi, M. Dynamic Pose Tracking Performance Evaluation of HTC Vive Virtual Reality System. IEEE Access 2021, 9, 3798–3815. [Google Scholar] [CrossRef]
  37. Niehorster, D.C.; Li, L.; Lappe, M. The Accuracy and Precision of Position and Orientation Tracking in the HTC Vive Virtual Reality System for Scientific Research. i-Perception 2017, 8, 2041669517708205. [Google Scholar] [CrossRef]
  38. Borges, M.; Symington, A.; Coltin, B.; Smith, T.; Ventura, R. HTC Vive: Analysis and Accuracy Improvement. In Proceedings of the 2018 IEEE/RSJ International Conference on Intelligent Robots and Systems (IROS), Madrid, Spain, 1–5 October 2018; IEEE: New York, NY, USA, 2018; pp. 2610–2615. [Google Scholar]
  39. Astad, M.A.; Hauan Arbo, M.; Grøtli, E.I.; Tommy Gravdahl, J. Vive for Robotics: Rapid Robot Cell Calibration. In Proceedings of the 7th International Conference on Control, Mechatronics and Automation (ICCMA), Delft, The Netherlands, 6–8 November 2019; pp. 151–156. [Google Scholar]
  40. Němá, K.; Gilić, B.; Vrdoljak, D.; Kozák, T.; Berta, P.; Kováč, M. Physical Fitness of Elite Youth Sports Climbers: Gender Differences and Correlates of Climbing Ability. Biomed. Hum. Kinet. 2025, 17, 197–207. [Google Scholar] [CrossRef]
  41. Elias, P.; Skvarlova, V.; Zezula, P. SPEED21: Speed Climbing Motion Dataset. In Proceedings of the 4th International Workshop on Multimedia Content Analysis in Sports, Virtual, 20 October 2021; ACM: New York, NY, USA, 2021; pp. 43–50. [Google Scholar]
  42. Mora-Fernandez, A.; Argüello-Arbe, A.; Tojeiro-Iglesias, A.; Latorre, J.A.; Conde-Pipó, J.; Mariscal-Arcas, M. Nutritional Assessment, Body Composition, and Low Energy Availability in Sport Climbing Athletes of Different Genders and Categories: A Cross-Sectional Study. Nutrients 2024, 16, 2974. [Google Scholar] [CrossRef] [PubMed]
  43. Carroll, C. Female Excellence in Rock Climbing Likely Has an Evolutionary Origin. Curr. Res. Physiol. 2021, 4, 39–46. [Google Scholar] [CrossRef]
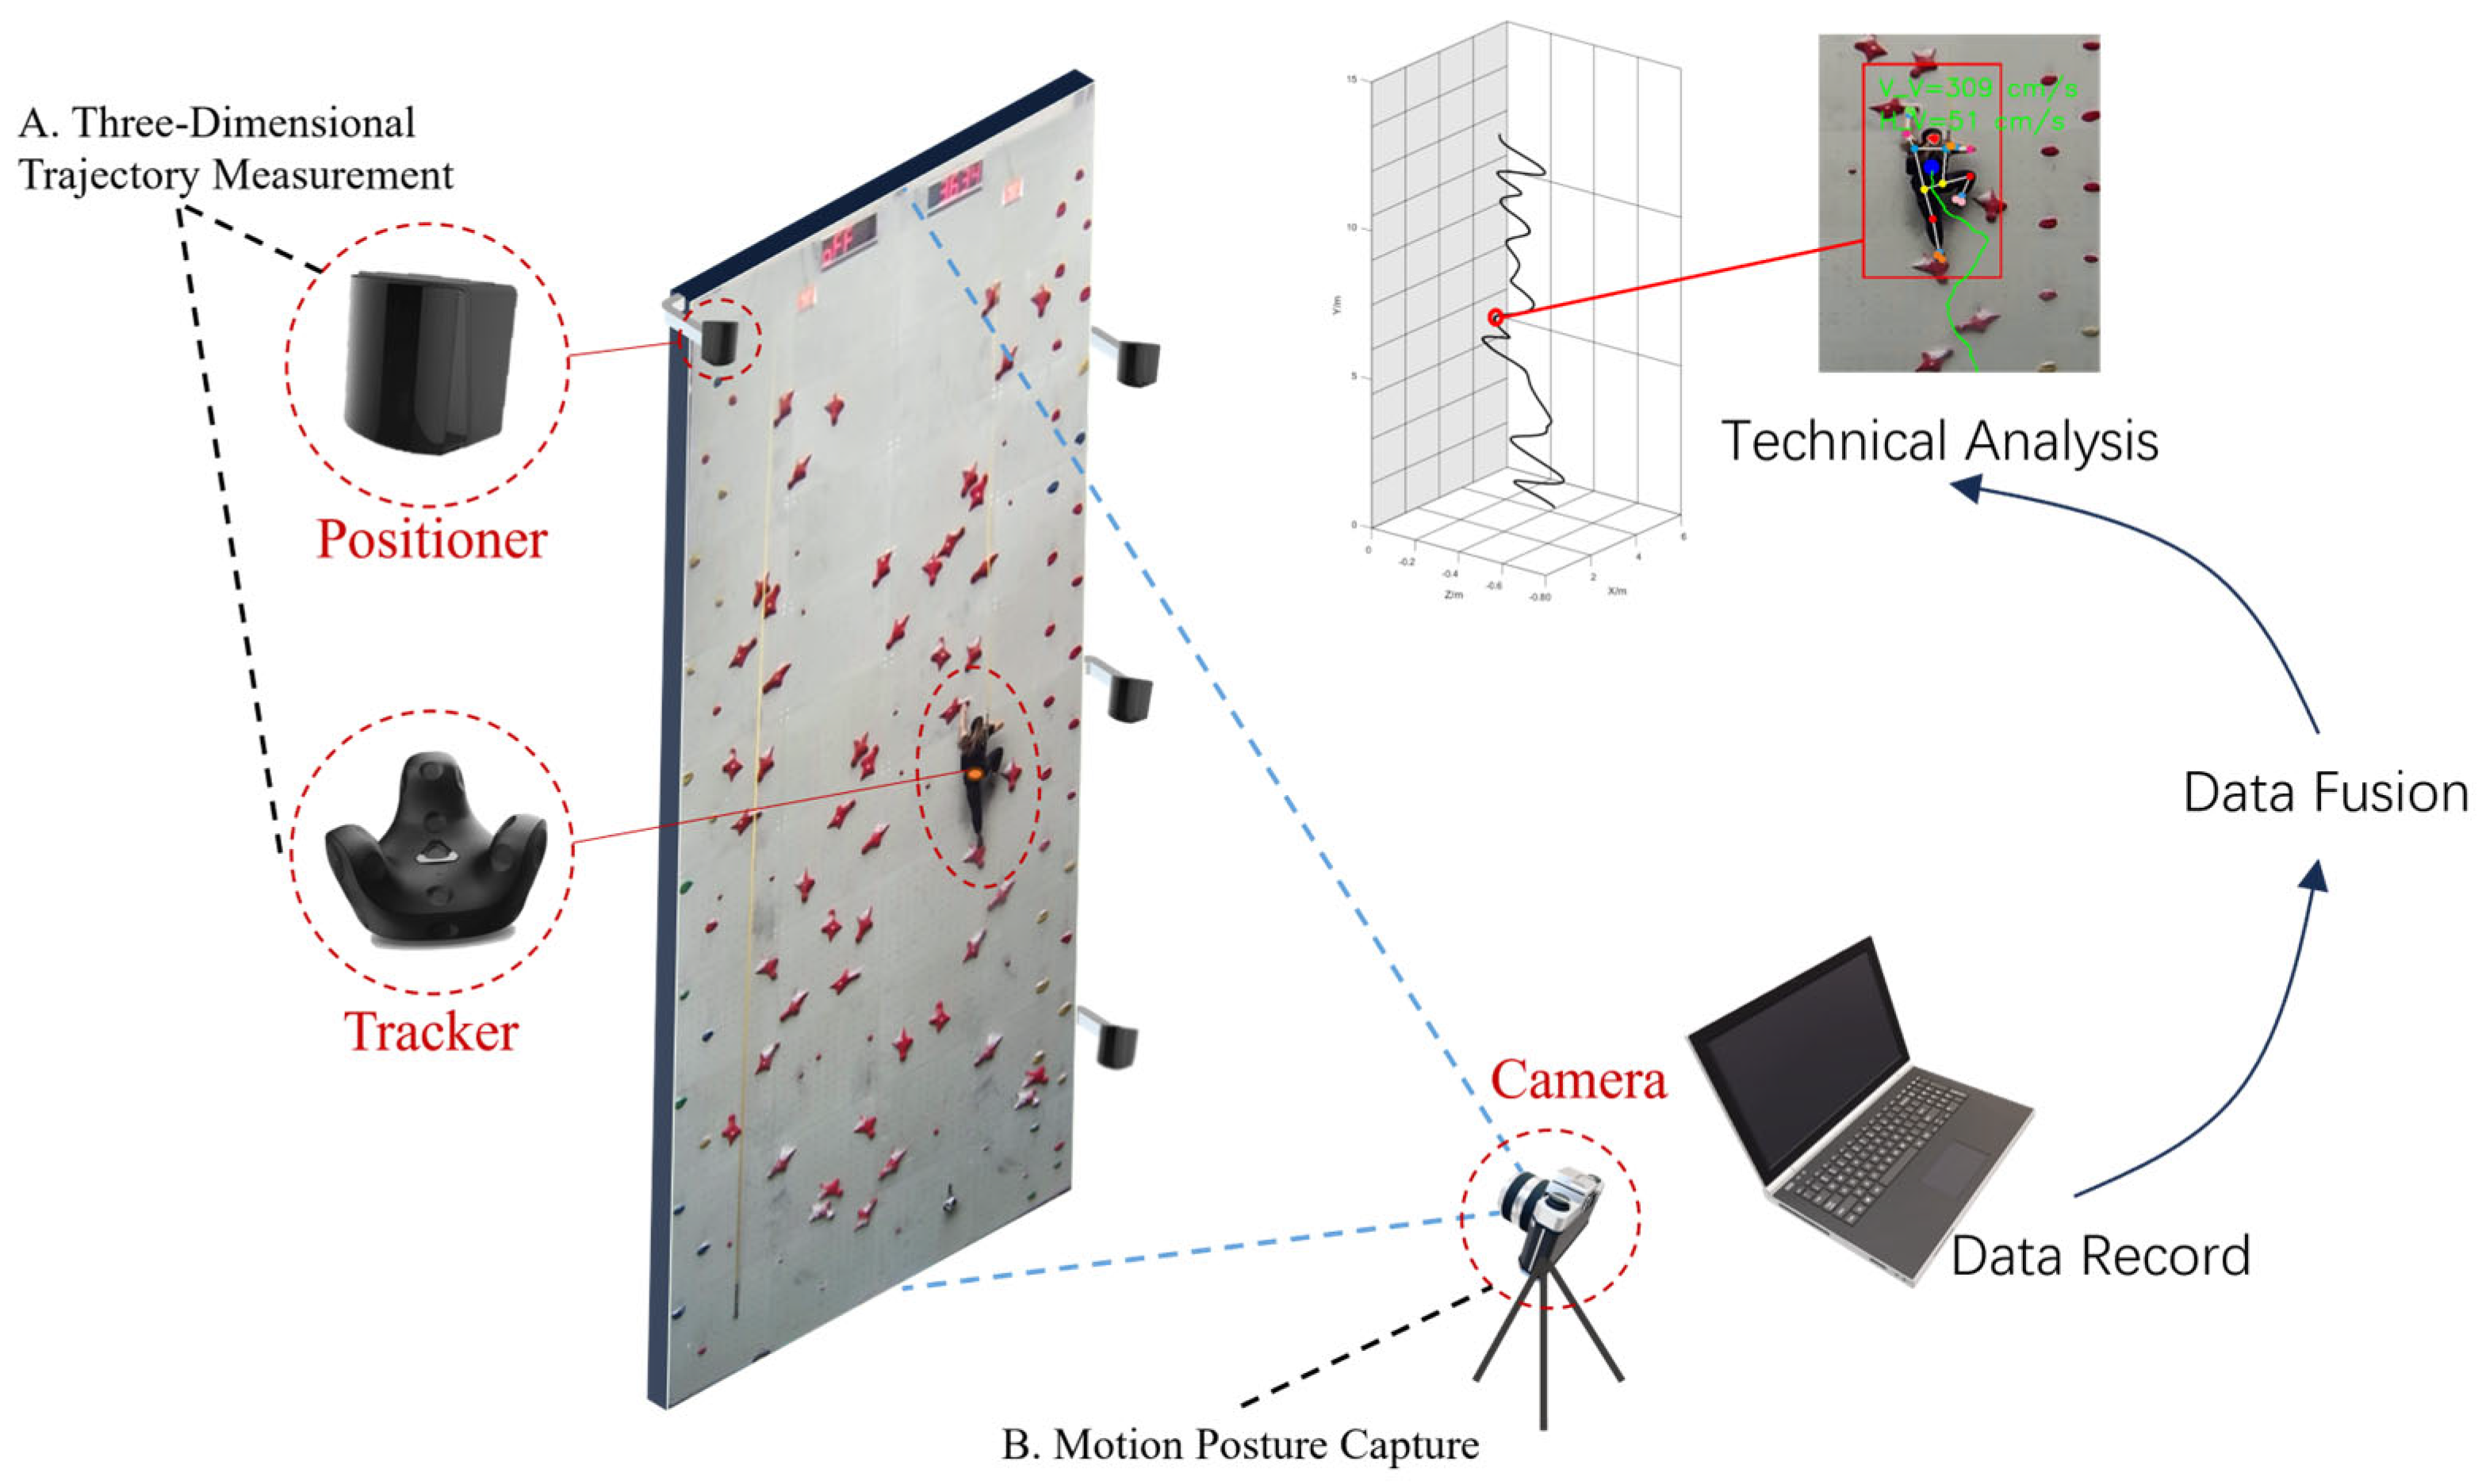
Figure 1. System structure diagram: It includes (A) three-dimensional trajectory measurement and (B) motion posture capture. Data fusion is performed after recording, enabling more advanced technical analysis.
Applsci 15 08959 g001
Figure 2. Thirty-three keypoints of the human body.
Applsci 15 08959 g002
Figure 3. Schematic diagram illustrating the establishment of the coordinate system for the climbing wall.
Applsci 15 08959 g003
Figure 4. Trapezoidal correction, the transformation was computed using four coplanar reference points forming a quadrilateral on the wall, as shown by the red box in the picture.
Applsci 15 08959 g004
Figure 5. Schematic diagram of data fusion process.
Applsci 15 08959 g005
Figure 6. (a) Placement of the tracker on the athlete, along with a diagram identifying crucial posture points. (b) Snapshots of the athlete’s trajectory and posture during climbing. Panels illustrate the vertical acceleration, vertical velocity, lateral velocity, speed away from the wall, side view trajectory, and front view trajectory during the climb. Clicking on a specific point (5.13 m and 10.04 m shown) in the front view trajectory accesses the corresponding posture interface, displaying the athlete’s pose at that location.
Applsci 15 08959 g006
Figure 7. A 3D data plot displays all trajectories along with the group’s best paths. Female athletes’ trajectories are shown in red, while male athletes’ trajectories are represented in blue. The plot provides three viewing angles: 0 degrees, 45 degrees, and 90 degrees. The black lines indicate the best performance paths for each gender, and the gray surface represents the climbing wall.
Applsci 15 08959 g007
Figure 8. In the interval comparison of all trajectories and the group’s best path, two key technical difference nodes have been identified: (a) the positions of key technical difference nodes A and B on the curve, as well as the posture of certain athletes; (b) the locations of key technical difference nodes A and B on the standard climbing wall.
Applsci 15 08959 g008
Table 1. Participant demographics (mean ± SD). All values except experience are mean ± standard deviation. Experience is given as years of competitive climbing.
CharacteristicMale (n = 8)Female (n = 4)Total (n = 12)
Age (years)21.5 ± 2.223 ± 2.122.0 ± 2.2
Height (m)1.70 ± 0.031.66 ± 0.041.69 ± 0.04
Weight (kg)63.6 ± 4.558.7 ± 3.262.3 ± 4.6
Experience (years)2.4 ± 1.13.7 ± 1.3≥1 year
Table 2. Gender differences in performance metrics. Values are mean ± SD for each group; t, p, and Cohen’s d are from independent-sample t-tests (two-tailed, df = 10).
MetricMale (mean ± SD)Female (mean ± SD)t (df)pCohen’s d
Climb time (s)5.97 ± 0.216.65 ± 0.314.28 (10)0.0022.47
trajectory inflections10.1 ± 0.5912 ± 0.715.66 (10)<0.0013.27
Mean Deviation from Optimal (m)0.157 ± 0.0070.190 ± 0.0126.46 (10)<0.0013.73
Disclaimer/Publisher’s Note: The statements, opinions and data contained in all publications are solely those of the individual author(s) and contributor(s) and not of MDPI and/or the editor(s). MDPI and/or the editor(s) disclaim responsibility for any injury to people or property resulting from any ideas, methods, instructions or products referred to in the content.