Article

Comparative Analysis of Multispectral LED–Sensor Architectures for Scalable Waste Material Classification

1
Department of Industrial, Electronic and Mechanical Engineering, Università Roma Tre, 00146 Rome, Italy
2
Eye4NIR S.r.l., 23801 Calolziocorte, Italy
3
Department of Physics, Politecnico di Milano, 22100 Como, Italy
*
Author to whom correspondence should be addressed.
Appl. Sci. 2025, 15(16), 8964; https://doi.org/10.3390/app15168964
Submission received: 16 July 2025 / Revised: 1 August 2025 / Accepted: 10 August 2025 / Published: 14 August 2025

Abstract

We present a comprehensive study of LED-based optical sensing systems for the classification of waste materials, analyzing recent developments in the field. Accurate identification of materials such as plastics, glass, aluminum, and paper is a crucial yet challenging task in waste management for recycling. The first approach uses short-wave infrared reflectance spectroscopy with commercial Germanium photodetectors and selected LEDs to keep data complexity and cost at a minimum while achieving classification accuracies up to 98% with machine learning algorithms. The second system employes a voltage-tunable Germanium-on-Silicon photodetector that operates across a broader spectral range (400–1600 nm), in combination with three LEDs in both the visible and short-wave infrared bands. This configuration enables an adaptive spectral response and simplifies the optical setup, supporting energy-efficient and scalable integration. Accuracies up to 99% were obtained with the aid of machine learning algorithms. Across all systems, the strategic use of low-cost LEDs as light sources and compact optical sensors demonstrates the potential of light-emitting devices in the implementation of compact, intelligent, and sustainable solutions for real-time material recognition. This article explores the design, characterization, and performance of such systems, providing insights into the way light-emitting and optoelectronic components can be leveraged for advanced sensing in waste classification applications.

1. Introduction

Light-emitting diodes (LEDs) are essential components in optical sensing and classification systems owing to their small size, low power consumption, low cost, spectral versatility, and extended lifespan. In applications for material identification, LEDs serve as stable and controllable light sources across a broad range of wavelengths, including the visible (VIS) and the short-wave infrared (SWIR) bands. Their ability to emit specific, relatively narrowband radiation makes them ideal for reflectance-based sensing, where different materials exhibit unique spectral signatures. Compared to older, power-intensive broadband light sources such as halogen or incandescence lamps, LEDs significantly reduce system complexity and energy requirements while enabling rapid and repeatable measurements [1].
As waste management relies more and more on automated, real-time classification of diverse media such as plastics, glass, paper and metals, various sensor-based and mechanical sorting systems have been developed to improve efficiency and throughput in recycling facilities. Early automation efforts often utilized near-infrared (NIR) spectroscopy and air-jet ejectors, as well as machine vision algorithms, to detect and separate materials on conveyor belts [2,3,4]. While these systems were a major advancement over manual sorting, they often relied on bulky hyperspectral imaging platforms and broadband halogen light sources, resulting in high power consumption, limited portability and large maintenance demands [5,6,7,8].
In response to these limitations, LED-based illumination systems have emerged as a viable alternative. Their ability to deliver stable, discrete-wavelength emission across a broad spectral range makes them well suited for reflectance-based material classification. Unlike conventional broadband sources, LEDs enable simplified system architectures and facilitate the development of compact, embedded sensing platforms [9,10]. When combined with machine learning algorithms, which excel at extracting patterns from limited but discriminative spectral data, these systems can achieve highly accurate, real-time material identification [11]. This allows for efficient spectral interrogation, making LEDs a cornerstone in the evolution of intelligent, scalable, and sustainable waste-sorting technologies. These systems are applicable not only in large-scale industrial recycling plants but also in portable or decentralized settings.
Several studies have explored LED-based setups for material classification using optical sensing. An approach utilizes an LED-based dome to project optimized spectral patterns, enabling efficient per-pixel classification of raw materials such as metals, plastics, ceramics, fabrics, and wood while achieving high accuracy and an improved signal-to-noise ratio through multiplexed, discriminative illumination [12]. Another system uses a Raspberry Pi, an RGB-IR micro-camera, and an eight-wavelength LED array spanning from UV to NIR to perform real-time reflectance imaging. It has been applied to fruit quality inspection, plastics classification and water analysis, demonstrating its effectiveness for rapid, on-site material recognition [13]. In a related study, a low-cost, multispectral near-infrared sensor capable of measuring 18 discrete wavelengths was combined with ten machine learning algorithms to classify six common plastic types from household waste. This system achieved a recognition accuracy of up to 83.5% and demonstrated strong potential for affordable and portable plastics classification in real-world environments [14]. A handheld system was developed for plastics identification using discrete near-infrared reflectance spectroscopy combined with machine learning. The system successfully distinguishes between polyethylene terephthalate (PET), high-density polyethylene (HDPE), polypropylene (PP) and polystyrene (PS), demonstrating its viability for plastics classification [15].
Beyond waste, LED-based spectroscopy has also been applied to the food and agricultural domain. An approach employed a multi-LED fluorescence system to classify green and black teas and assess their quality, demonstrating LEDs’ potential for food evaluation [16]. Two other methods were developed to distinguish tobacco types [17] and honeys of different botanical origins [18] using LED-induced fluorescence spectroscopy, expanding the classification of food and agricultural products.
Building on the potentials outlined above, we present two LED-based optical systems developed specifically for waste material classification, both optimized for rapid, contactless, and power-efficient sensing. The first adopts discrete spectroscopy with a set of ten short-wave infrared LEDs and a Germanium photodiode: it is designed to identify materials from their reflectance at specific wavelengths [19]. The second utilizes a dual-band voltage-tunable Ge/Si photodetector paired with three LEDs in the VIS and SWIR; it exploits bias-controlled responsivity to achieve spectral discrimination without requiring multiple light sources [20]. Both setups demonstrate the effectiveness of limited spectral information, strategically chosen by simulation and able to accurately classify key waste materials, including plastics, paper, glass and Aluminum. By analyzing photocurrent responses and reflectance ratios and by applying machine learning techniques, these systems are able to achieve a classification accuracy comparable to that of more complex and expensive solutions.
This work aims to provide a unified view of LED-driven sensing for material classification, highlighting how careful design, wavelength selection and detector architecture can yield high-performance, scalable solutions well suited for smart waste management in both recycling plants and consumer-level applications. Here we focus on clean, single-type plastic samples, in the form of millimeter-sized flakes, without contamination or mixing, to establish a baseline performance of the proposed sensing systems. While this controlled setting enables accurate validation of the methodology, forthcoming work will address the challenges posed by mixed and contaminated waste streams common in real-world scenarios.

2. Materials

In this study, the classification system targets widely encountered waste materials, including paper, glass, Aluminum and four plastic types: polyethylene terephthalate (PET); polypropylene (PP) in both transparent and white forms; AB400L, a biodegradable composite polymer with polylactic acid (PLA); and polybutylene succinate. The plastic samples were commercially available, food-grade, extruded materials representative of typical post-consumer waste. Aluminum samples were obtained from standard beverage cans with colored outer coatings and were completely cleaned and dried to remove residual moisture. Glass samples were collected from consumer packages, including clear and colored beverage bottles. Paper samples consisted of standard white office/printer sheets.
All material categories were consistently used across all three referenced systems, primarily in the form of clean flakes or pellets to ensure controlled experimental conditions. However, due to the limitations of SWIR spectroscopy in analyzing dark-colored or heavily contaminated surfaces, only white and transparent plastic variants were selected [21]. Figure 1 illustrates the materials used in this study.

3. Methods

3.1. Method 1: SWIR Discrete Spectroscopy

In the pursuit of a compact and energy-efficient alternative to traditional spectroscopic systems, this method employs a discrete SWIR LED-based approach to capture material-specific reflectance signatures using minimal power and hardware complexity.

3.1.1. Experimental Setup

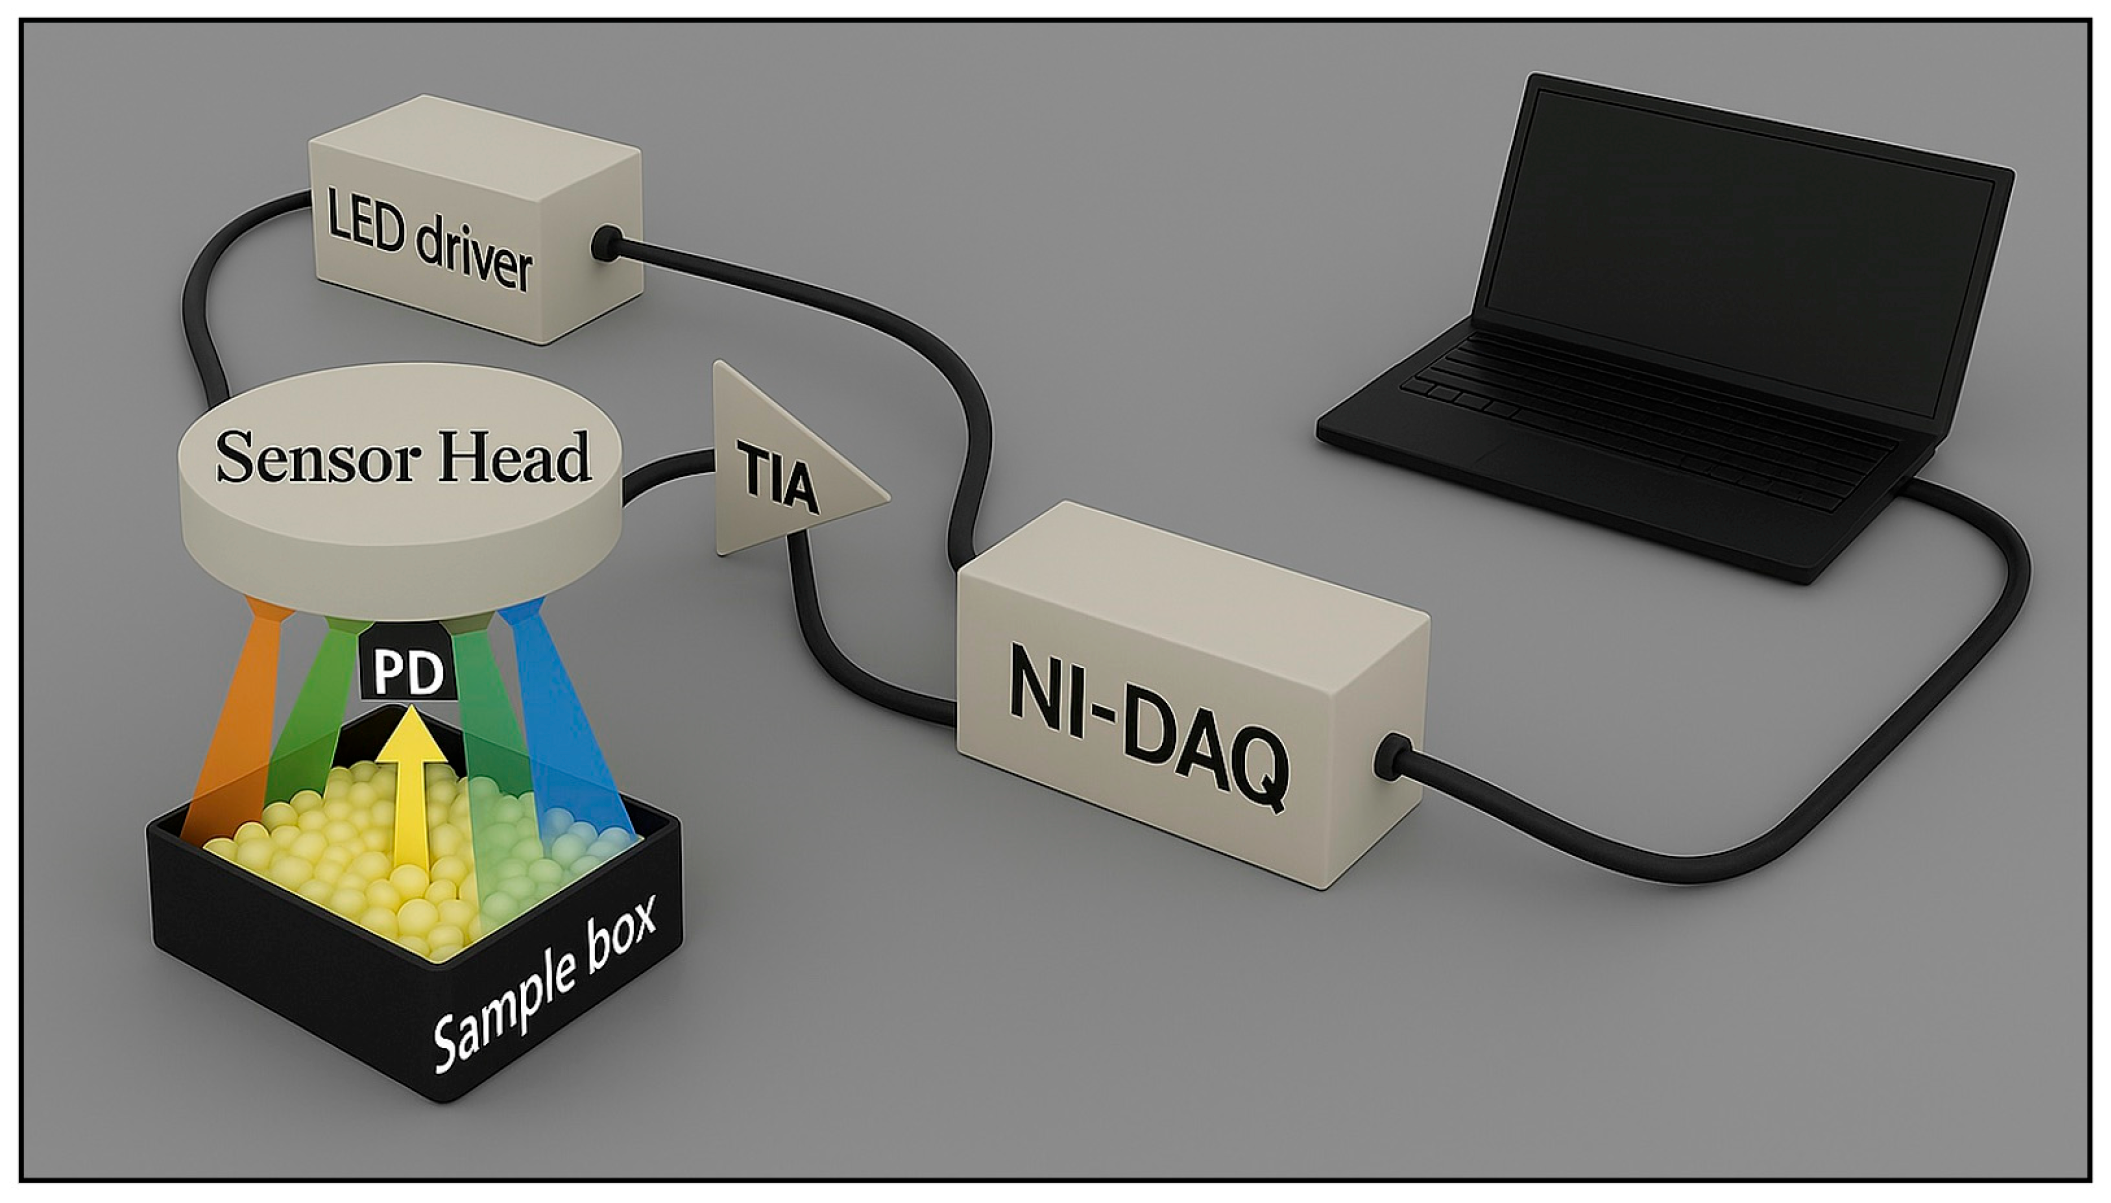
The experimental setup consists of a 3D-printed sensor head, an analog front-end, and a computer interface (Figure 2). The sensor head houses a Germanium photodiode (700–1800 nm) surrounded by ten uniformly spaced LEDs (in the 910–1600 nm range) arranged to prevent direct illumination. The analog front-end includes ten current drivers and a variable-gain transimpedance amplifier connected to an NI USB6009 DAQ for LED control and photodiode signal acquisition at 14-bit resolution at 1 kS/s. A LabVIEW-based graphicuser interface (GUI) was used to control the measurement parameters while visualizing and storing data. Each sample was placed in a black box, illuminated for 10 ms per LED, and measured from a fixed 7 cm distance. The reflectance was evaluated using pre-calibrated incident light values. Each LED illuminated a spot approximately 2.5–3 cm in diameter, with a total sample area of about 20 cm2 to ensure uniform coverage. A 5 V power supply was used to feed the system; the latter and the sample under measurement were enclosed in a dark box. Each sample was measured 10 times; then, the data were averaged. To minimize artifacts caused by preferential reflection angles due to the material grains, the sample container was gently shaken for a few seconds before each measurement. Each sequence cycle lasted for a total acquisition time of approximately 100 ms, resulting in a total acquisition time of about 1 s per sample.

3.1.2. LED Optimization and Simulation

To cover the SWIR spectrum, 17 commercially available LEDs were initially considered, from which the 10 best were selected using a sequential forward selection (SFS) algorithm [22], a feature selection that iteratively adds the LED providing the largest improvement in classification performance. This approach balanced complexity and accuracy.
Figure 3b presents the normalized irradiance spectra of the selected 10 LEDs (as extracted from the relevant datasheets) highlighting the spectral coverage provided across the SWIR range used to estimate their interaction with various materials. These irradiance spectra were interpolated and matched against material reflectance to compute the expected spectra of reflected light via overlap integrals. Figure 3a shows the typical (averaged) reflectance spectra of the materials used in the experiments, measured using a HORIBA monochromator and a Tungsten lamp over the 700–1750 nm range with a 10 nm resolution. To enhance signal quality, the spectra were preprocessed using the Savitzky–Golay smoothing algorithm with a frame length of three samples and a second-order polynomial. Given the 10 nm sampling interval, the chosen window size corresponds to a smoothing range of 30 nm [23]. As observed, glass is easily distinguishable due to its high transparency. White and transparent PP have similar spectral profiles but differ in their reflectance levels. AB400L shows high, consistent reflectance with broad spectral features. PET exhibits distinct dips with noticeable peaks from 900 nm to 1600 nm, while Aluminum shows minimal variation and only a faint response. Paper presents a peak around 960 nm, a smooth minimum near 1420 nm and a distinct pattern beyond, displaying a unique spectral signature.
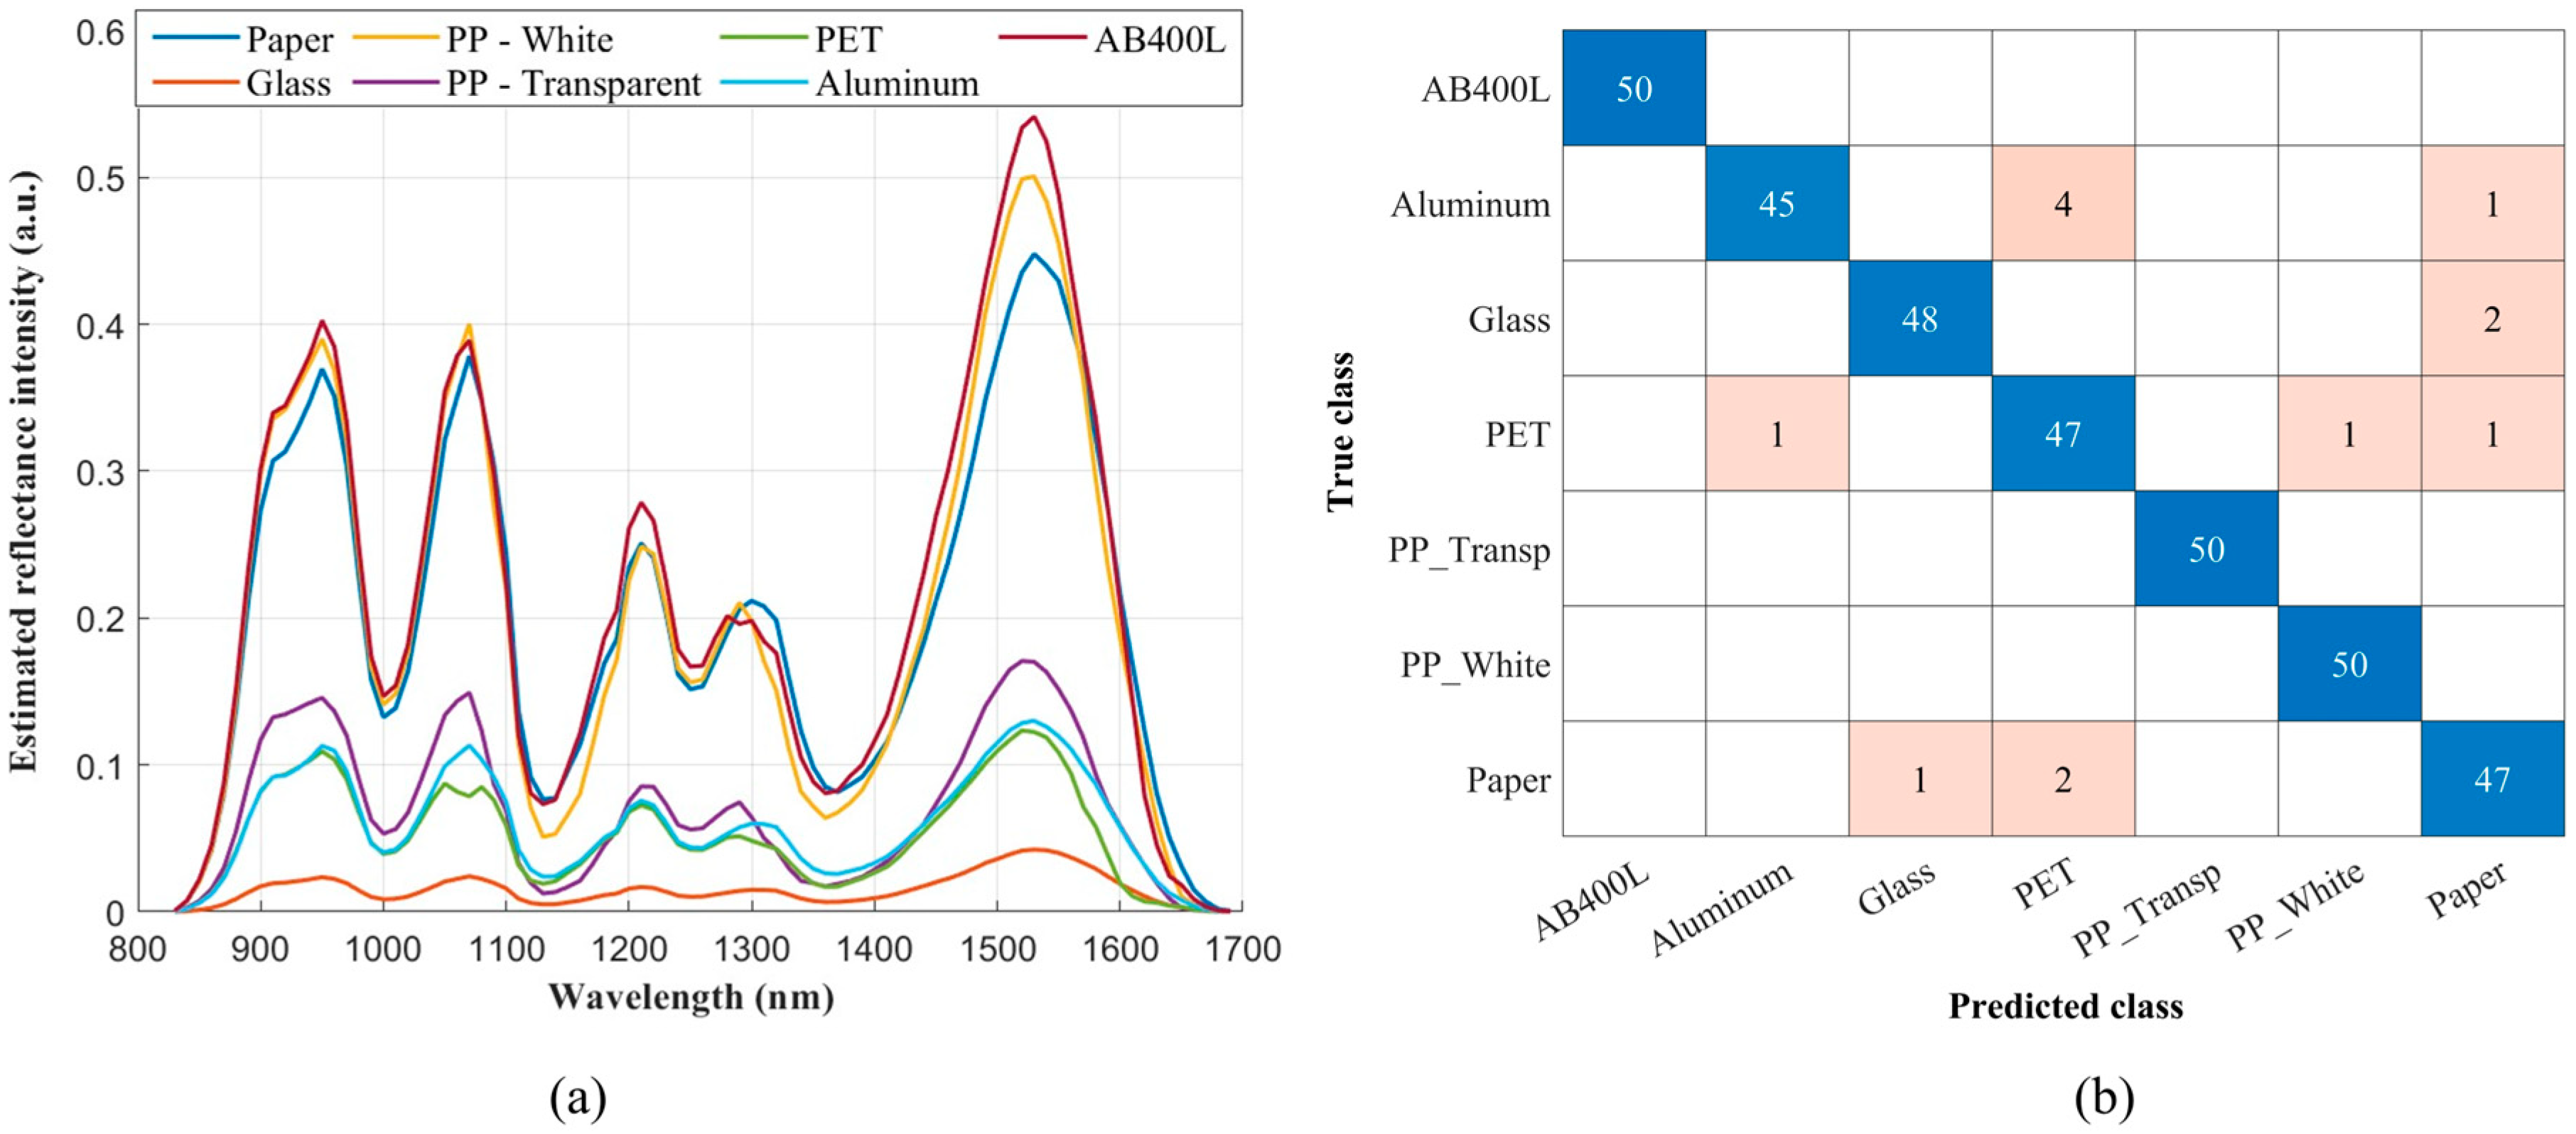
Figure 4a displays the estimated spectra of the light reflected by all the considered materials, illustrating the variation in light intensity reflected by each material under the same LED illumination. A dataset of 50 reflectance spectra per material (across seven materials) was employed in this analysis, allowing us to identify the informative LEDs to be included in the final experimental setup.
This simulation-based selection approach achieved a classification accuracy of 96.1%, evaluated using five-fold cross-validation [24], with accuracy being defined as the ratio of correctly predicted samples to the total number of predictions across all classes. Figure 4b displays the corresponding confusion matrix for the simulation approach using the k-nearest neighbors (KNN) classifier [25], which provided the highest accuracy during feature selection. Each row represents the actual class and each column the predicted class. Correct classifications are colored in blue, while misclassifications are in red. Aluminum is the most frequently misclassified material, followed by PET and paper, which also exhibit some confusion with other classes.

3.1.3. Results and Discussion

A total of 150 reflectance spectra per material were collected across seven materials over 72 hours. To evaluate the effectiveness of the LED-based classification, two strategies were implemented. The first used the data from one day for training and the data from another day for testing, while the second randomly mixed data from all three days and split them into training (80%) and testing (20%) sets. Classifiers including support vector machines (SVM), linear discriminant analysis (LDA), KNN, and random forest (RF) were tested, with SVM consistently outperforming the others. The results showed that when using day-specific training and testing, accuracy varied significantly, with lower performance observed when day 1 data were involved, likely due to changes in the environmental conditions.
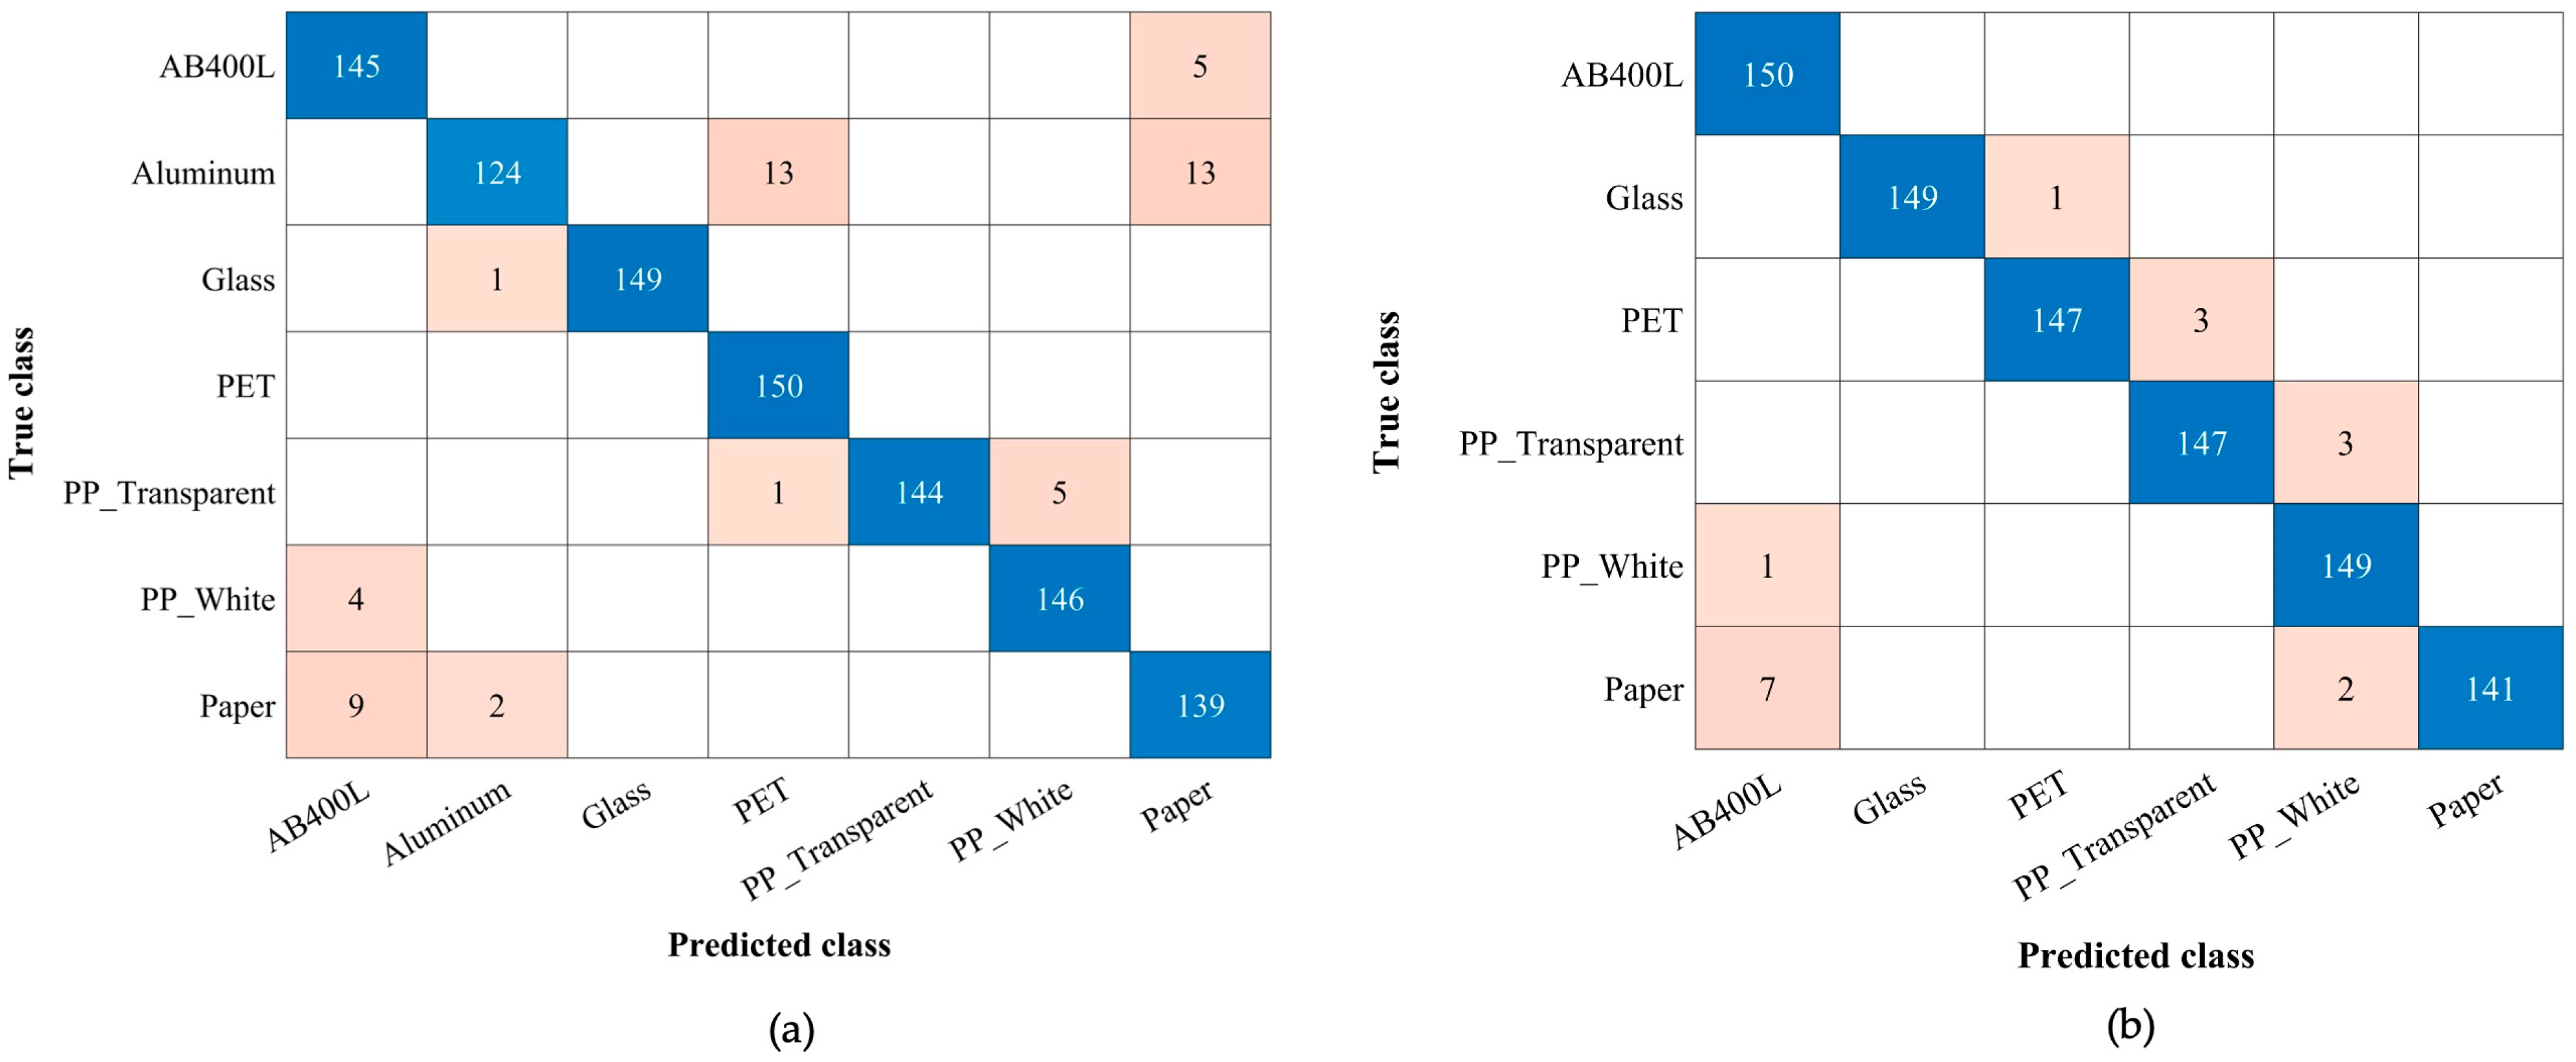
Notably, the Aluminum class exhibited the highest misclassification rate due to its dual-surface structure and internal coatings, which introduced inconsistency in reflectance readings. When Aluminum was excluded from the dataset, classification performance improved significantly. Table 1 shows a comparative analysis of classification accuracy using the SVM and LDA methods across various datasets, highlighting those that achieved higher accuracy compared to other techniques. The results for the dataset with the best performance are shown in bold and further illustrated by the confusion matrix in Figure 5a (including all seven materials) and Figure 5b (excluding Al).
Using the second data division strategy (shuffled data) and excluding Al, the system achieved a peak classification accuracy of 98.3%, compared to 95% when Aluminum was included. These results highlight the robustness of the system for classifying plastics, glass and paper; they also suggest that Aluminum may require a specific wavelength for reliable detection.

3.1.4. Classification Performance with Four LEDs

Building upon the promising results from the Ten-LED configuration, we investigated whether a smaller subset of LEDs could achieve comparable classification accuracy. To this end, a hybrid feature selection approach combining correlation-based feature selection (CFS) and SFS was implemented [26], aiming to enhance system efficiency while maintaining performance.
Hybrid Feature Approach
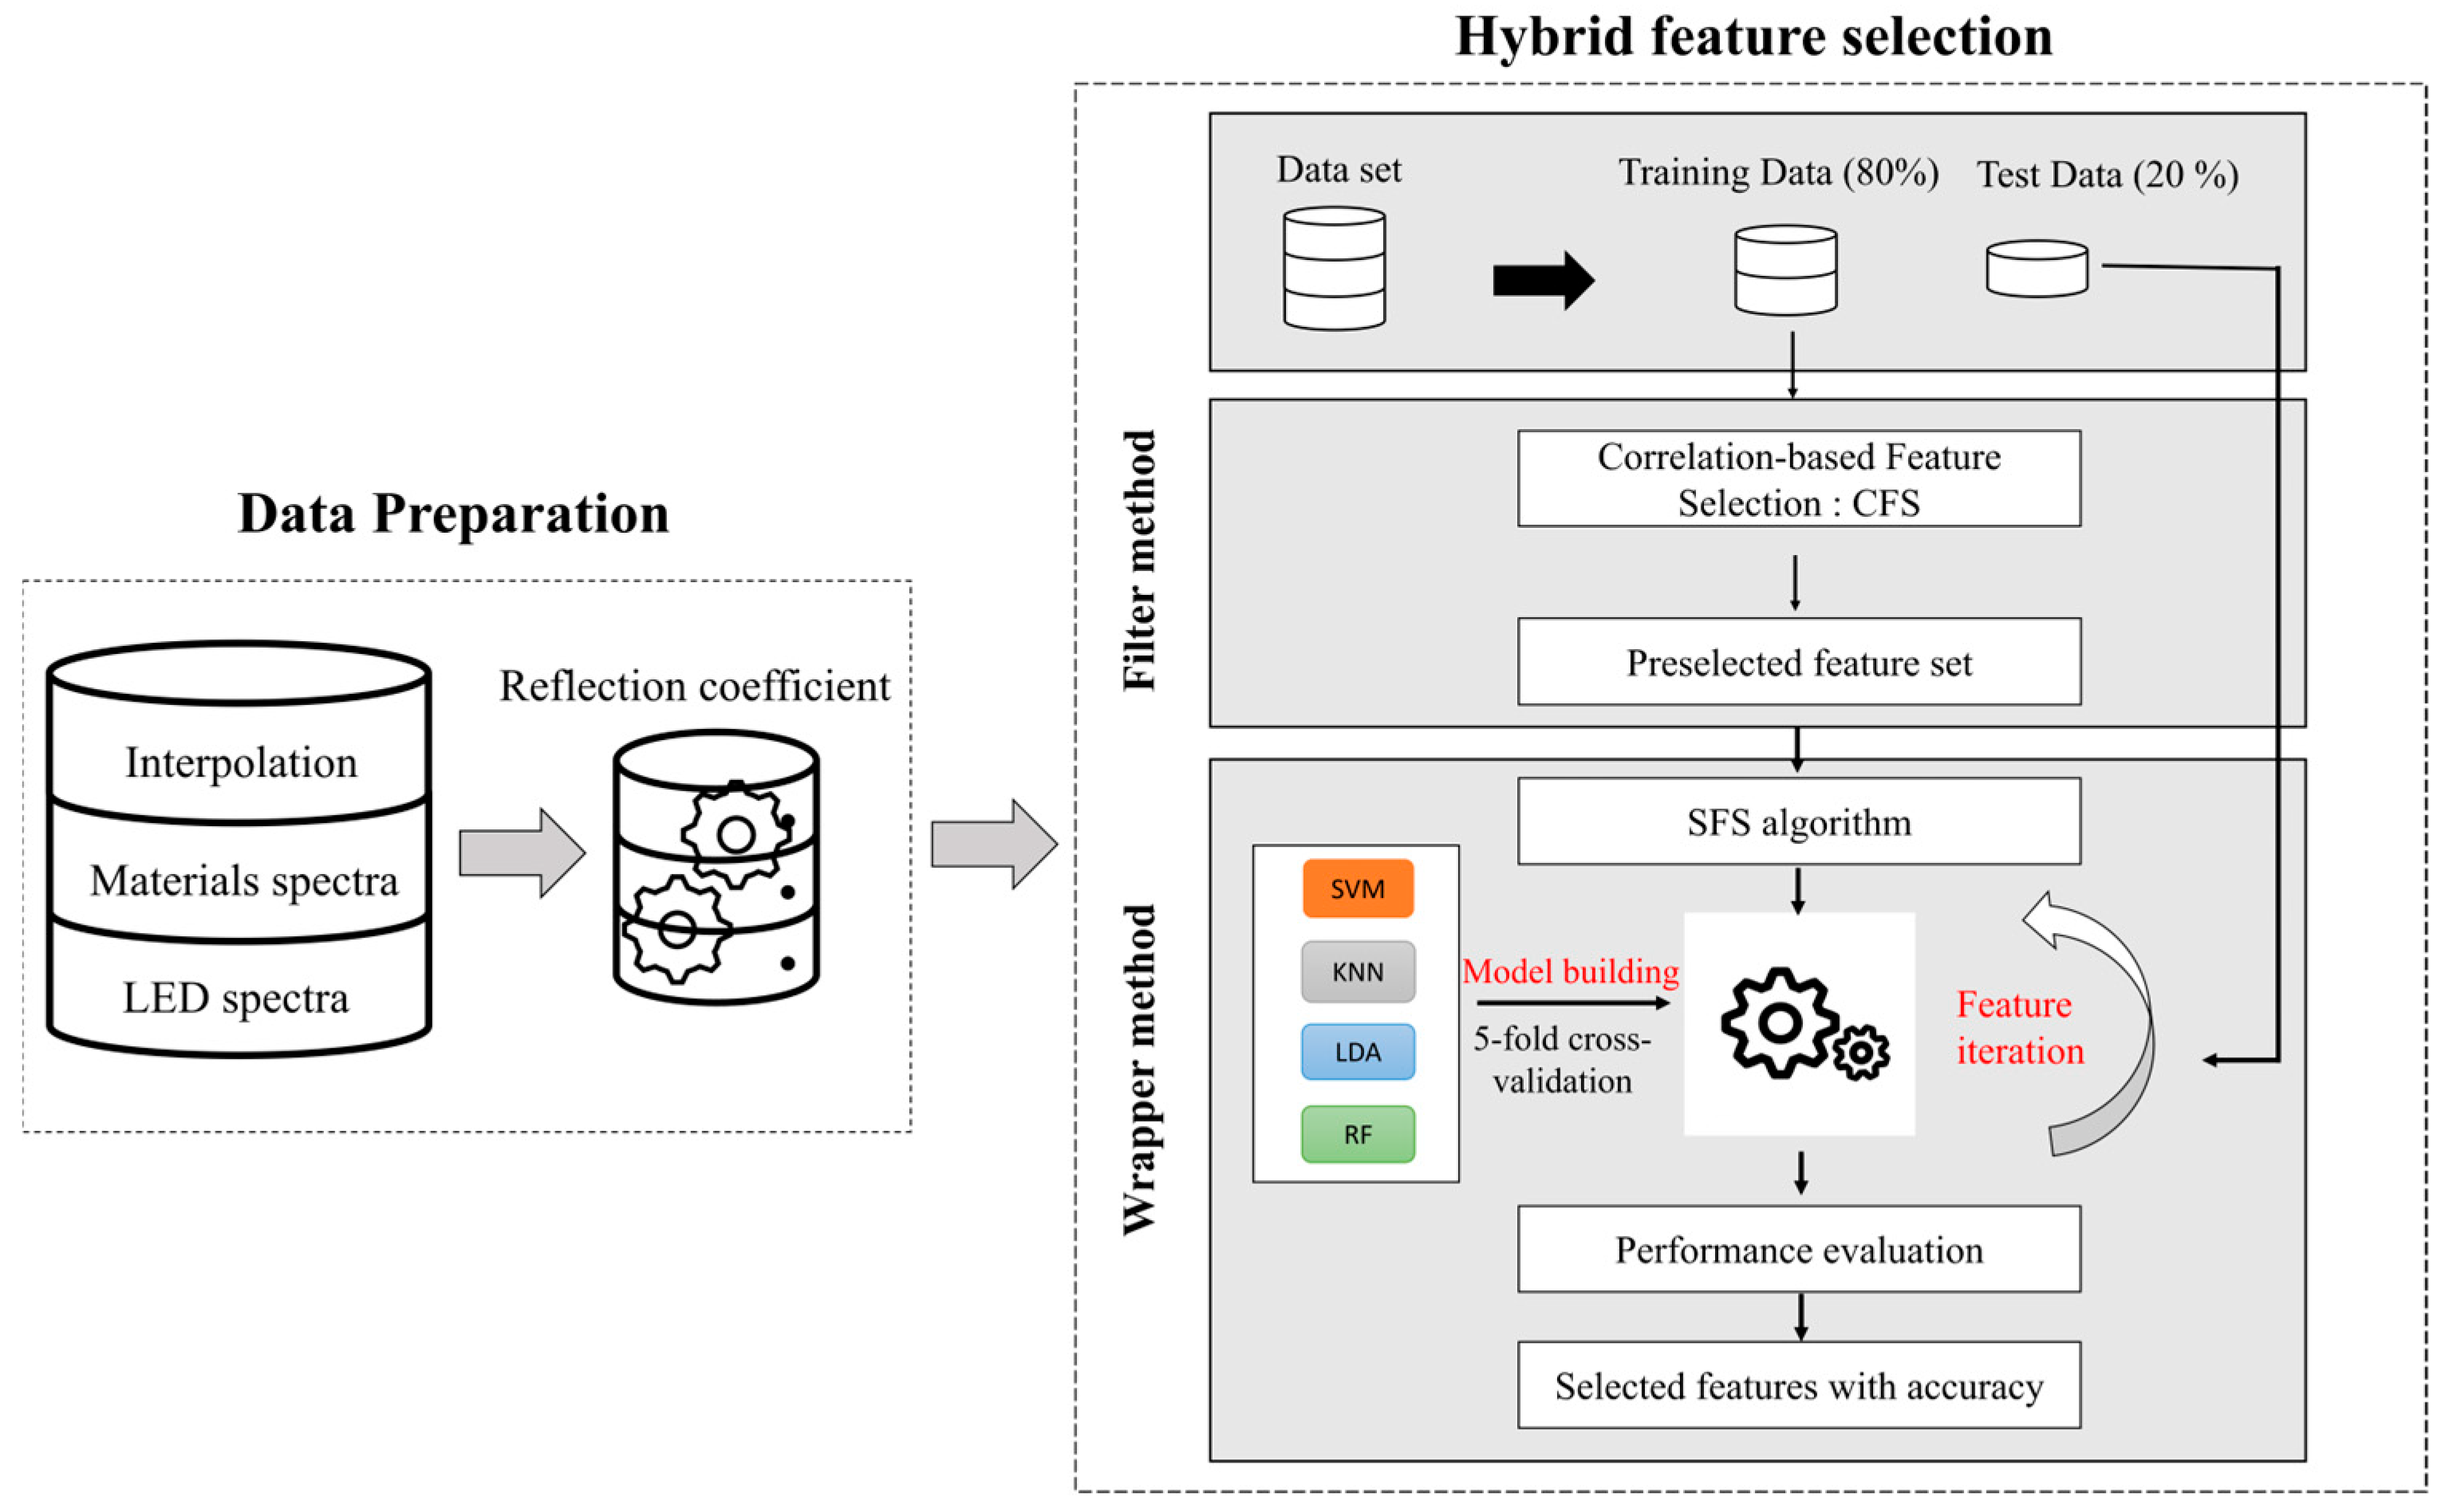
Figure 6 illustrates the LED selection process, encompassing data preparation and optimization methods. This approach began by scoring the 14 available LEDs using CFS to assess their relevance based on feature intercorrelation and redundancy. The top 10 LEDs were then input into an SFS wrapper model with 5-fold cross-validation to identify the most informative subset. As a result, four LEDs at 910 nm, 1085 nm, 1300 nm and 1600 nm were pinpointed. This more compact configuration simplifies the system and reduces the acquisition time and computational cost while maintaining strong classification capabilities. It also offers practical benefits in terms of hardware integration and power efficiency, making it more suitable for scalable and field-deployable solutions.
Data Analysis
The measurements were collected over three days, with 50 spectra per material per day. To assess the model performance under varying conditions, we evaluated classification results for each day’s dataset individually, as well as for a merged dataset created by shuffling data from all three days. Table 2 presents the classification accuracies obtained across three experimental days, using an 80 to 20% split for training and testing datasets, evaluated over the four selected classification algorithms.
Among the classifiers, SVM consistently yielded the highest accuracy across all four datasets, demonstrating robust and stable performance under different conditions. Although LDA also exhibited outstanding results, SVM outperformed it in terms of consistency and overall accuracy. In this study, we primarily report the results based on the shuffled dataset, as it offers a more comprehensive assessment of the model’s generalizability by incorporating variability from all the acquisition sessions.
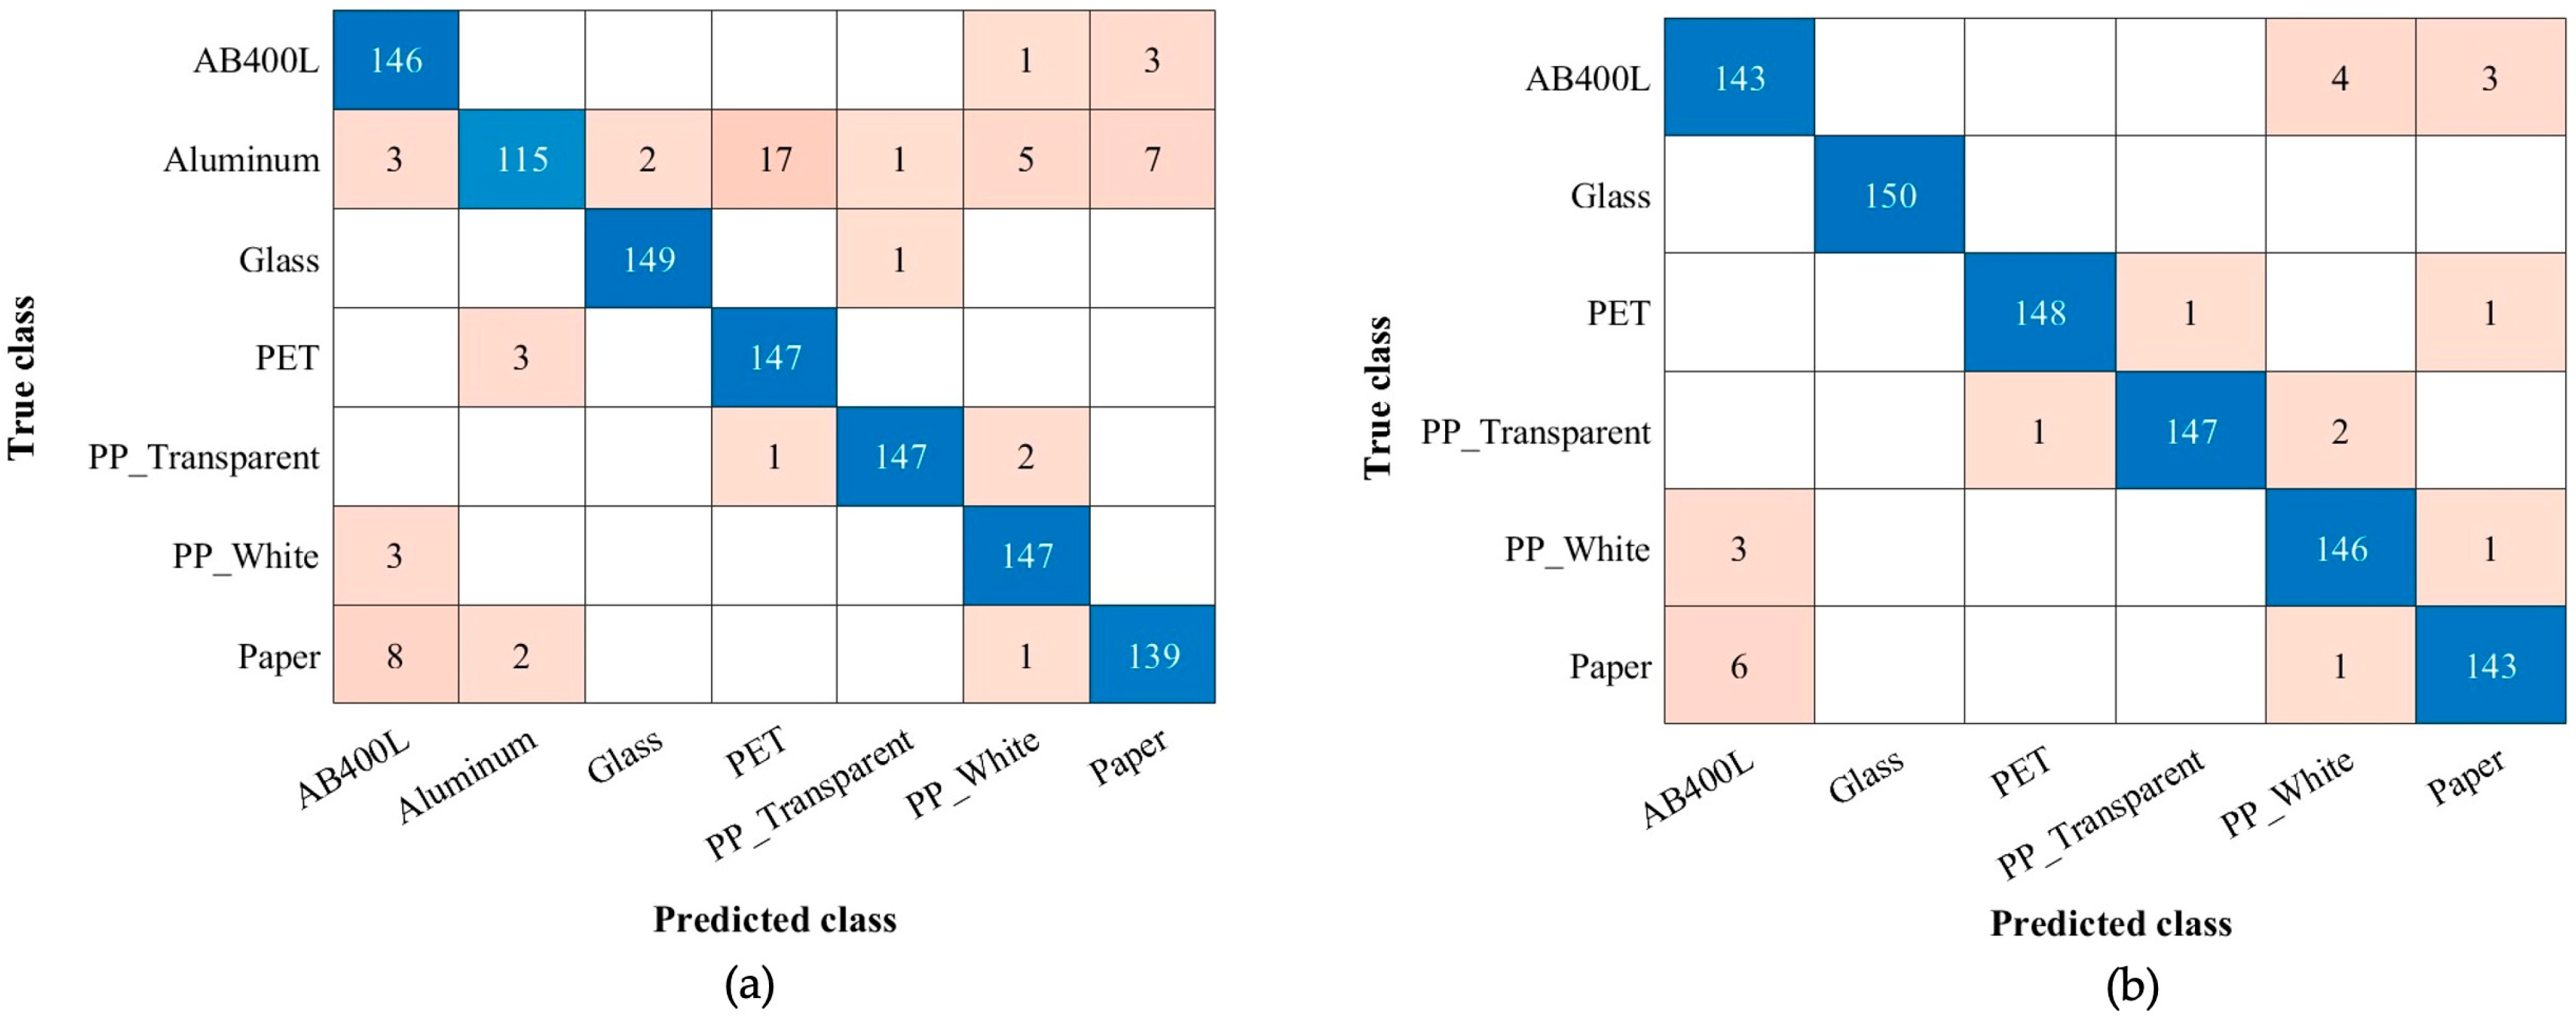
The confusion matrix for the shuffled dataset achieved an overall accuracy of 94.3% (Figure 7a) when all materials were included. When the Aluminum data were excluded, the accuracy improved to 97% (Figure 7b). In the shuffled dataset with all materials, Aluminum had a 23% misclassification rate, highlighting the difficulty of accurately classifying this material under varying conditions. This significantly affected the overall model performance.
In contrast, glass consistently reached 100% accuracy, while materials like PP (both white and transparent) and PET approached nearly 98% accuracy in both scenarios (with and without Al). These results suggest that such materials have distinct spectral signatures, making them easier to classify reliably. Notably, all materials except Al achieved over 90% accuracy across both approaches in the shuffled scenario. This demonstrates the strong ability to distinguish between most materials, reinforcing the reliability of accurate classification except in the case of Aluminum, which remains challenging.

3.2. Method 2: Voltage-Tunable Sensor Approach

In this study, we present a compact approach with a set of three low-power LEDs, each selected to target distinct spectral signatures of the materials. The voltage-tunable responsivity of the photodetector enables spectral discrimination without the need for time- or source-multiplexing, as different spectral regions can be accessed electronically. This LED-based setup significantly reduces complexity, size and power consumption, offering a robust, scalable and cost-effective solution for practical waste classification.

3.2.1. Dual-Band Photodetector

Germanium on Silicon technology has long been considered very appealing for near-infrared detection and for the possibility of integration with Silicon electronics [28,29]. The Ge/Si photodetector features a pinip structure with two back-to-back photodiodes—Ge for SWIR detection and Si for VIS—integrated into a surface-illuminated, single-pixel, normal-incidence design with a 300 µm active area [30]. Spectral separation is achieved through the distinct absorption characteristics of Ge and Si. By reversing the bias polarity, the device selectively activates either the Si photodiode (VIS, positive bias) or Ge photodiode (SWIR, negative bias), enabling electrically tunable dual-band detection in a single device. Figure 8 shows the responsivity from 390 nm to 1600 nm, tunable via a low bias from −0.5 V to +0.45 V. Increasing the reverse bias enhances the SWIR responsivity (1000–1600 nm) while suppressing the VIS range (400–1100 nm), allowing for selective spectral discrimination.

3.2.2. Photocurrent Simulation

To evaluate the performance of the Ge/Si photodetector, the most suited LEDs were selected based on simulated photocurrent features. These were derived by integrating the photodetector’s responsivity spectrum (R), material reflectance spectra (S), and normalized irradiance spectra (P) of 36 different LEDs covering the range from VIS to SWIR. The spectral responsivity R was measured using a Horiba Triax 550 monochromator; then, the reflectance spectra for seven materials (Figure 9b) were collected using two Ocean Optics spectrometers (400–1700 nm). The LED emission spectra P were obtained from the device datasheets. Responsivity was measured over a bias from −0.5 V to +0.5 V in 0.01 V steps (Figure 9a). For each material, the reflectance was obtained from 50 measurements at 1 nm intervals. Using responsivity and reflectance data, the photocurrent (Iph) across the bias interval was calculated from the following expression:
I p h ¯ = R = · S ¯ · P ¯ .  
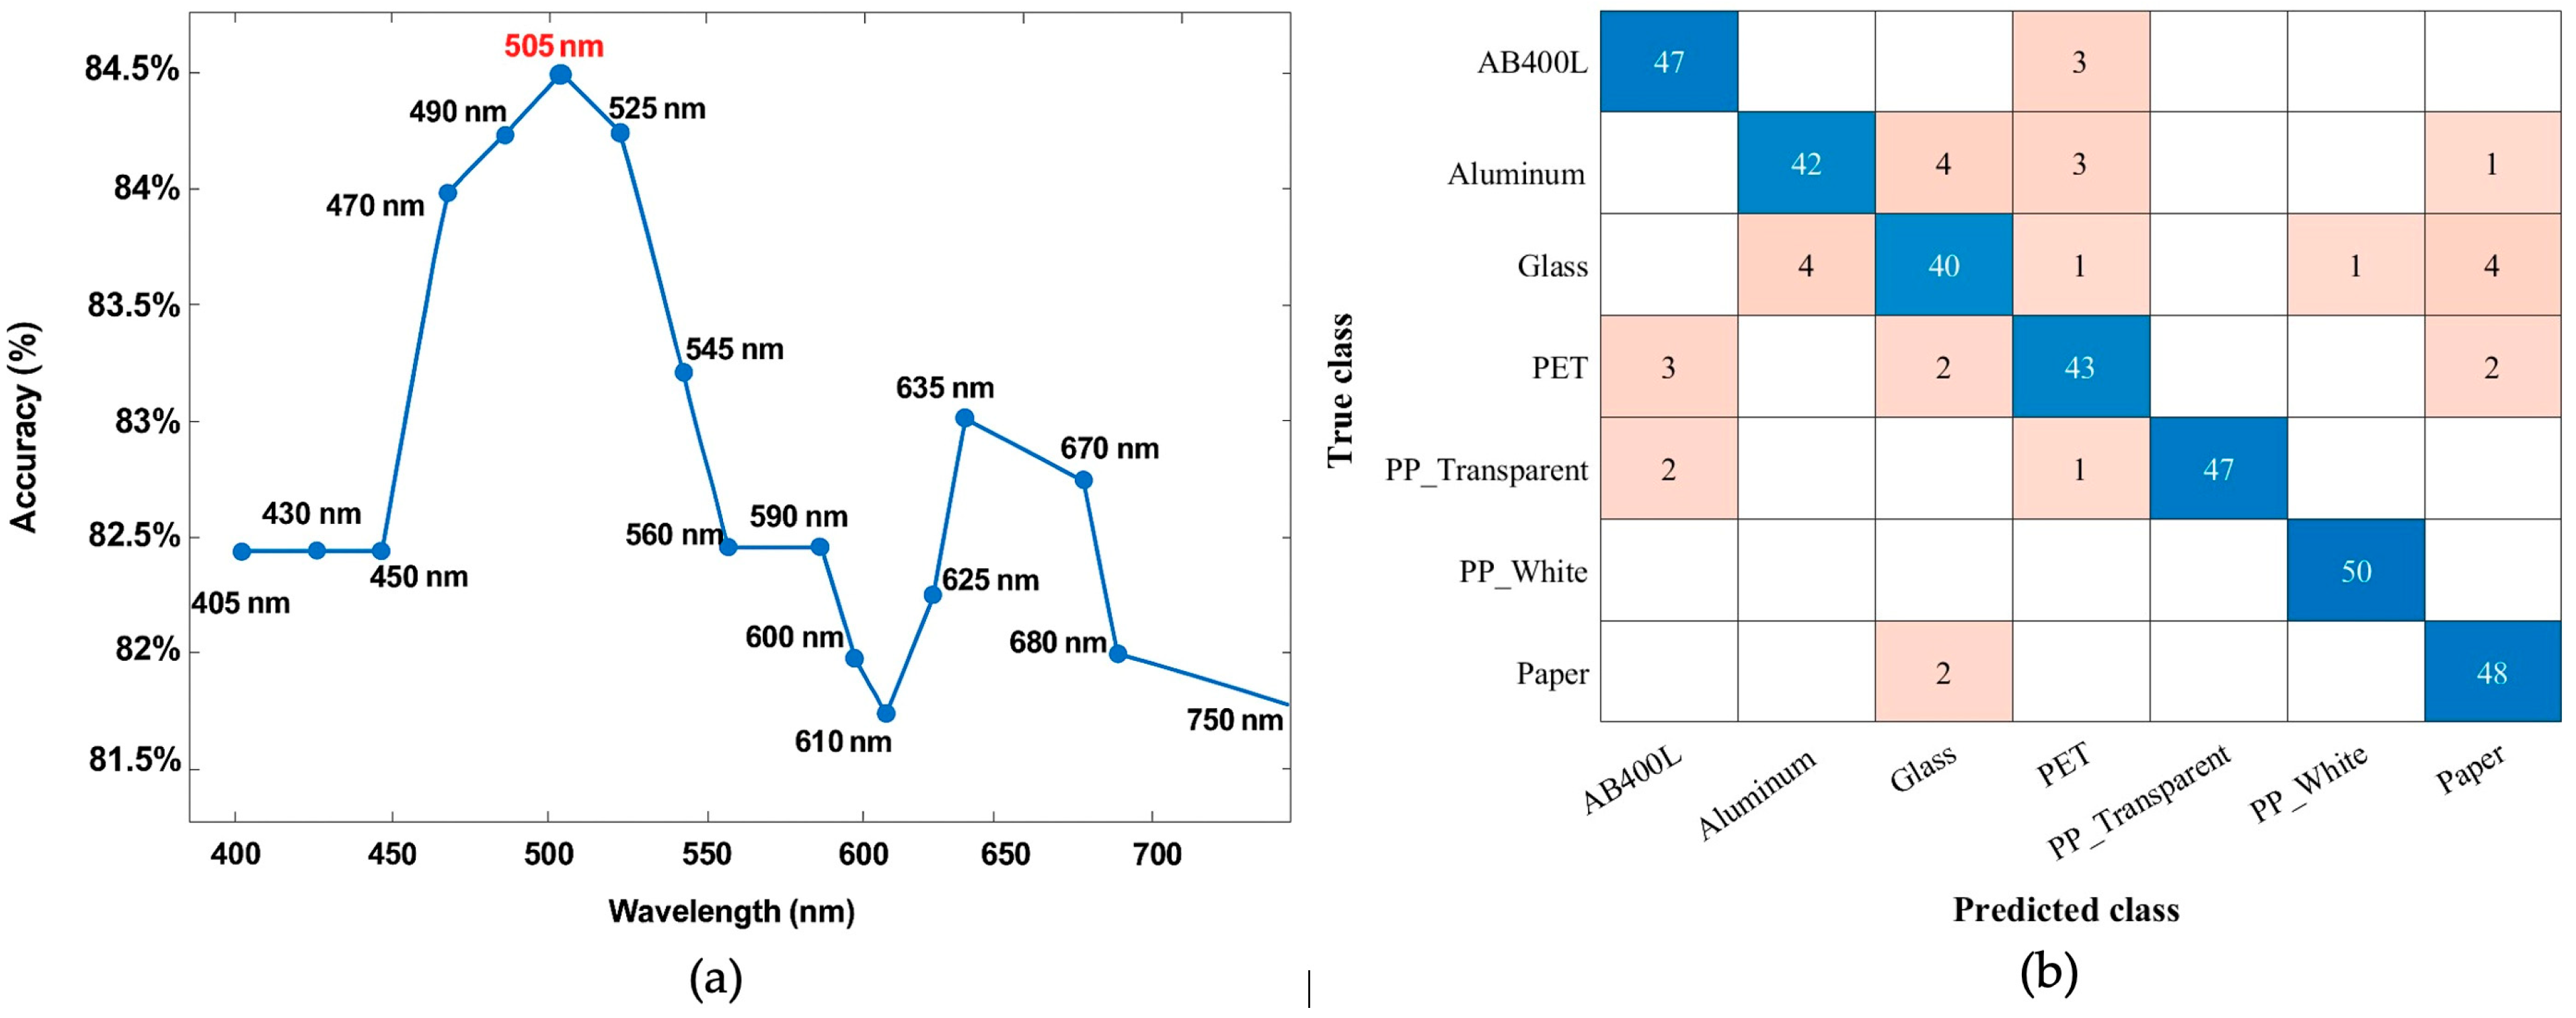
Figure 9c illustrates the estimated photocurrent of various materials in the simulation. Feature selection was performed using SFS with four classifiers—QDA, SVM, KNN, and RF—to identify the most informative LEDs. The 505 nm and 1200 nm LEDs were consistently chosen across all models. Figure 10b shows the SVM confusion matrix of the simulated data with 93.6% accuracy. The simulations with the SVM classifier showed a high classification accuracy: 98% for AB400L, white PP (PP_White), paper, and PET; 96% for transparent PP (PP_Transparent) and glass; and 90% for Al, which had the highest misclassification rate. Overall, the results confirm the strong potential of the dual-band Ge/Si photodetector for material differentiation.
Multiple classification models were employed to evaluate feature selection performance. Notably, across all of them, the 1200 nm SWIR LED was consistently chosen, highlighting its strong discriminative capability. The analysis aimed to determine the most effective VIS LED to pair with the selected 1200 nm wavelength. Among the tested combinations, the pairing of the 505 nm VIS LED with the 1200 nm NIR LED yielded the highest classification accuracy. Figure 10a presents the classification accuracy obtained using various VIS LEDs in combination with a fixed SWIR LED at 1200 nm.
To further enhance classification performance, an additional LED at 1300 nm was incorporated into the system. This wavelength was selected due to its significance in the SWIR region, where many polymers exhibit distinct absorption features related to C–H overtone vibrations. Prior research demonstrated that wavelengths within the 1200–1500 nm range provide improved spectral contrast among different plastics [31], aiding in their differentiation. Based on feature selection results, the 1300 nm LED emerged as the second most informative SWIR wavelength after 1200 nm, justifying its inclusion to complement the existing spectral bands and improve overall material classification accuracy, particularly for plastics. Table 3 summarizes the top two SWIR LEDs and the selected VIS LED chosen by SFS for each classifier. The 1200 nm LED is consistently the primary SWIR feature, with 1300 nm often selected as the second. The VIS LED is mostly 505 nm across models, highlighting the key wavelengths for effective material classification.

3.2.3. Experimental Setup

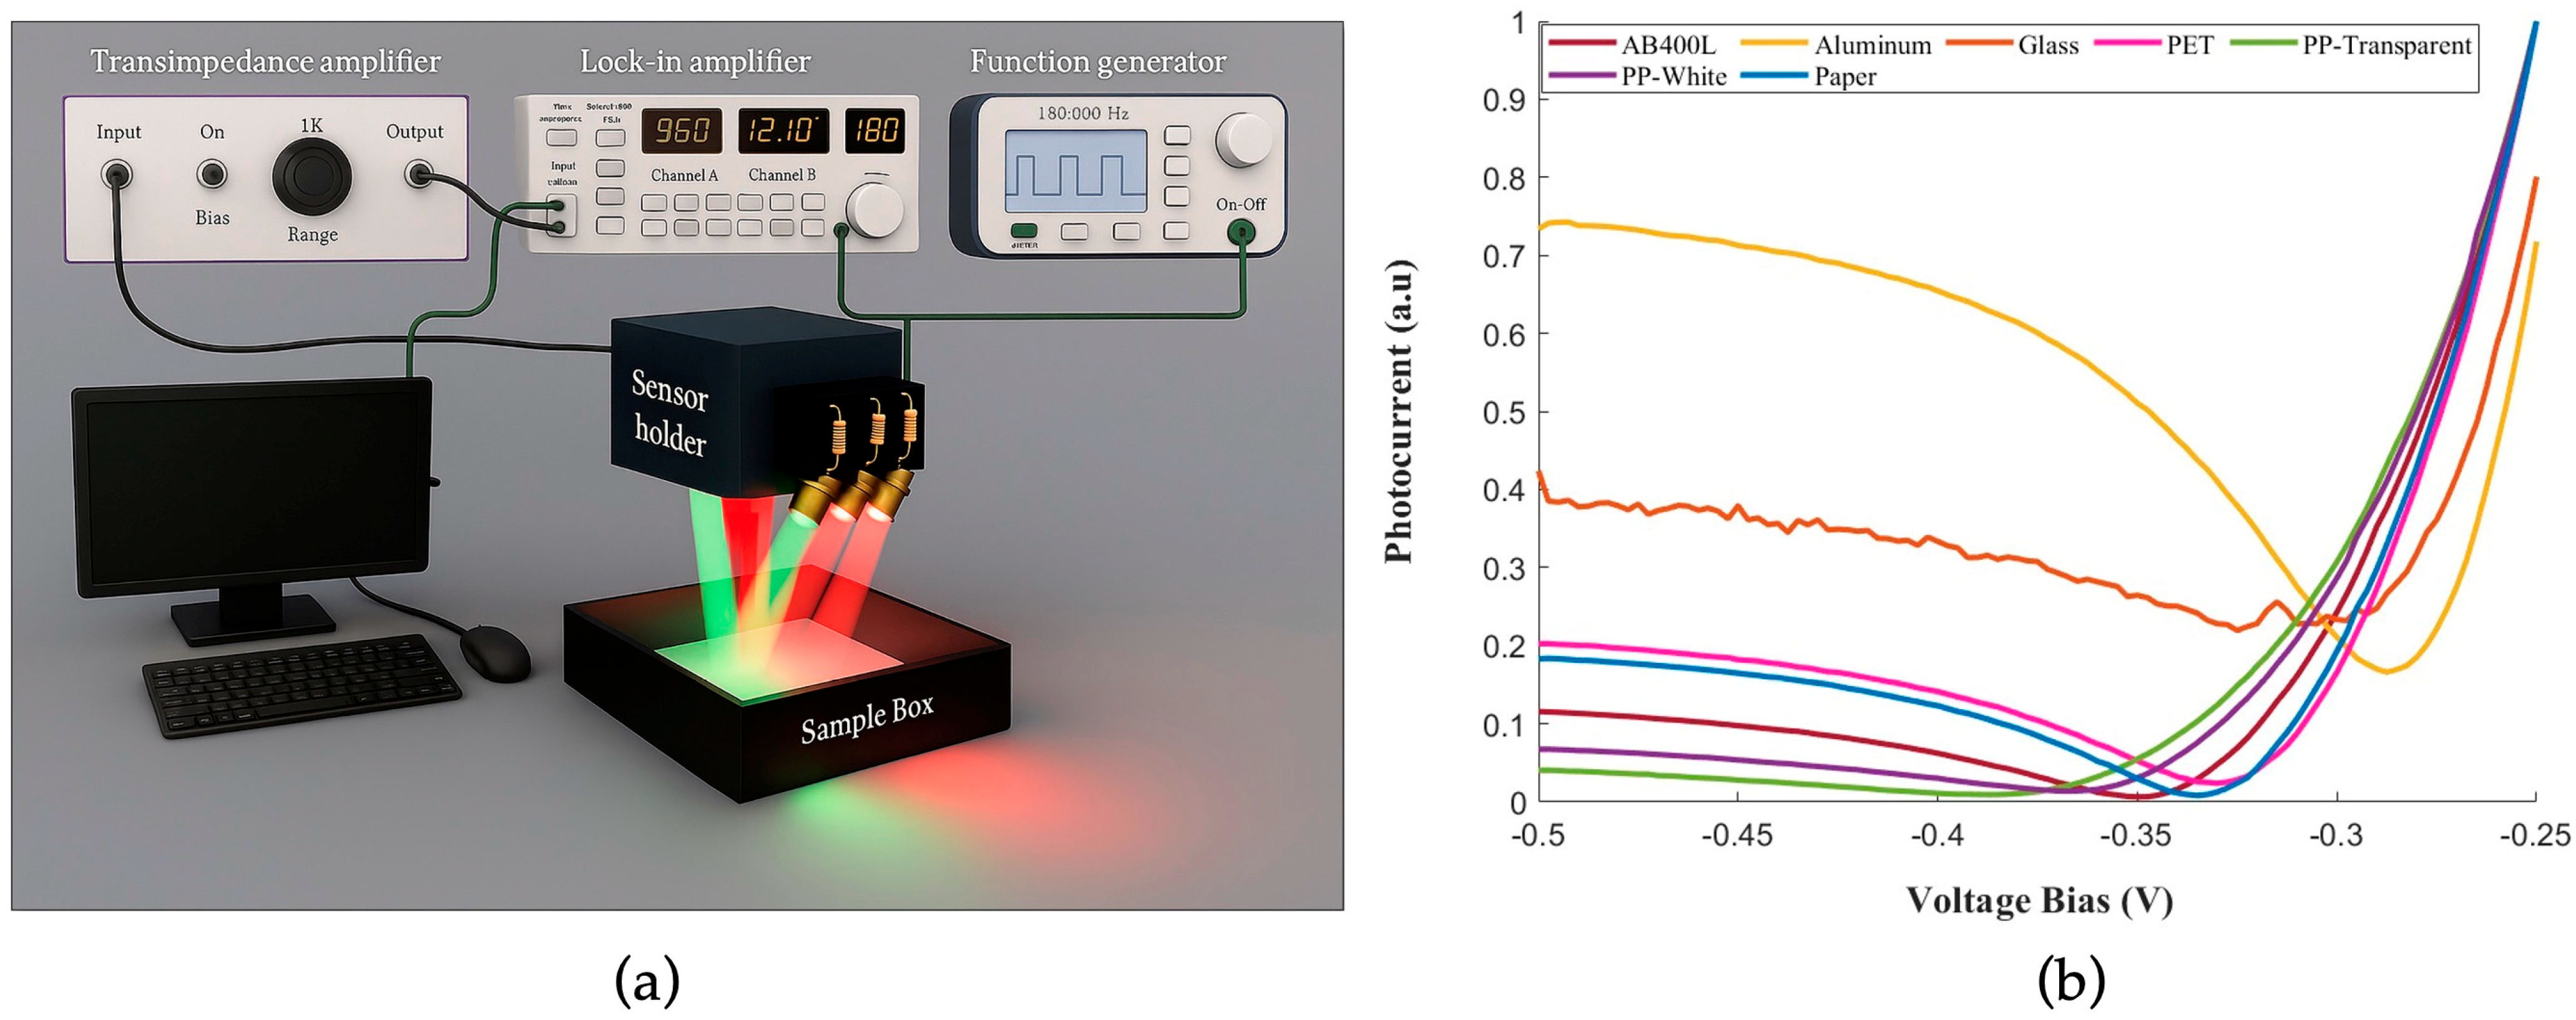
Figure 11a illustrates the experimental setup for material classification, incorporating three selected LEDs at 505, 1200 and 1300 nm. The LEDs and the photodetector were mounted side by side and oriented toward the sample, with the angle of incidence maximizing the light reflected onto the detector. This diffused reflected light, modulated at 180 Hz using a 0–5 V square, was detected by the Ge/Si photodetector, and the resulting photocurrent was amplified using a transimpedance amplifier (TIA).
A lock-in amplifier was used for signal demodulation in order to enhance the signal-to-noise ratio and reject the ambient light contribution. The total power consumption of the three LED sources was 440 mW, significantly lower than the 20 W typically required when using a Halogen lamp, as in typical spectroscopy setups. The combined illumination from the three LEDs covered a spot approximately 3–4 cm in diameter at a working distance of 7 cm. A LabVIEW-based PC controlled parameters such as the 300 ms integration time and 1 s delay, while current–voltage measurements were taken across a −0.5 V to −0.25 V interval in 2.5 mV steps, based on prior sensor calibration. The measurement process—including integration time, delay, lock-in amplification and voltage sweeping—required less than 2 min per sample.

3.2.4. Data Acquisition and Processing

To classify materials under varying conditions, we collected four datasets on different days, each comprising 25 reflectance measurements per material, resulting in a total of 700 measurements. Samples were stored in separate black boxes to prevent cross-contamination and containers were gently shaken before each measurement. Spectral data underwent min-max normalization prior to classification [32].
Figure 11b presents the normalized photocurrent responses of various materials, measured using the tunable dual-band photodetector, demonstrating the photodetector’s ability to distinguish them. These variations in photocurrent confirm the material-specific response of the device. PP samples share similar curve shapes but differ in reflectance intensity. Aluminum and glass yield distinctly higher photocurrent values due to their unique spectral features. AB400L shows a clearly distinct profile, making it easily identifiable. Paper and PET have more comparable curves but remain distinguishable upon a detailed analysis. Although the photocurrent voltage characteristics may appear broadly similar for some materials, they exhibit distinct features such as zero-crossing voltage and photocurrent ratios at various bias levels that can be effectively leveraged by classification algorithms

3.2.5. Results and Discussion

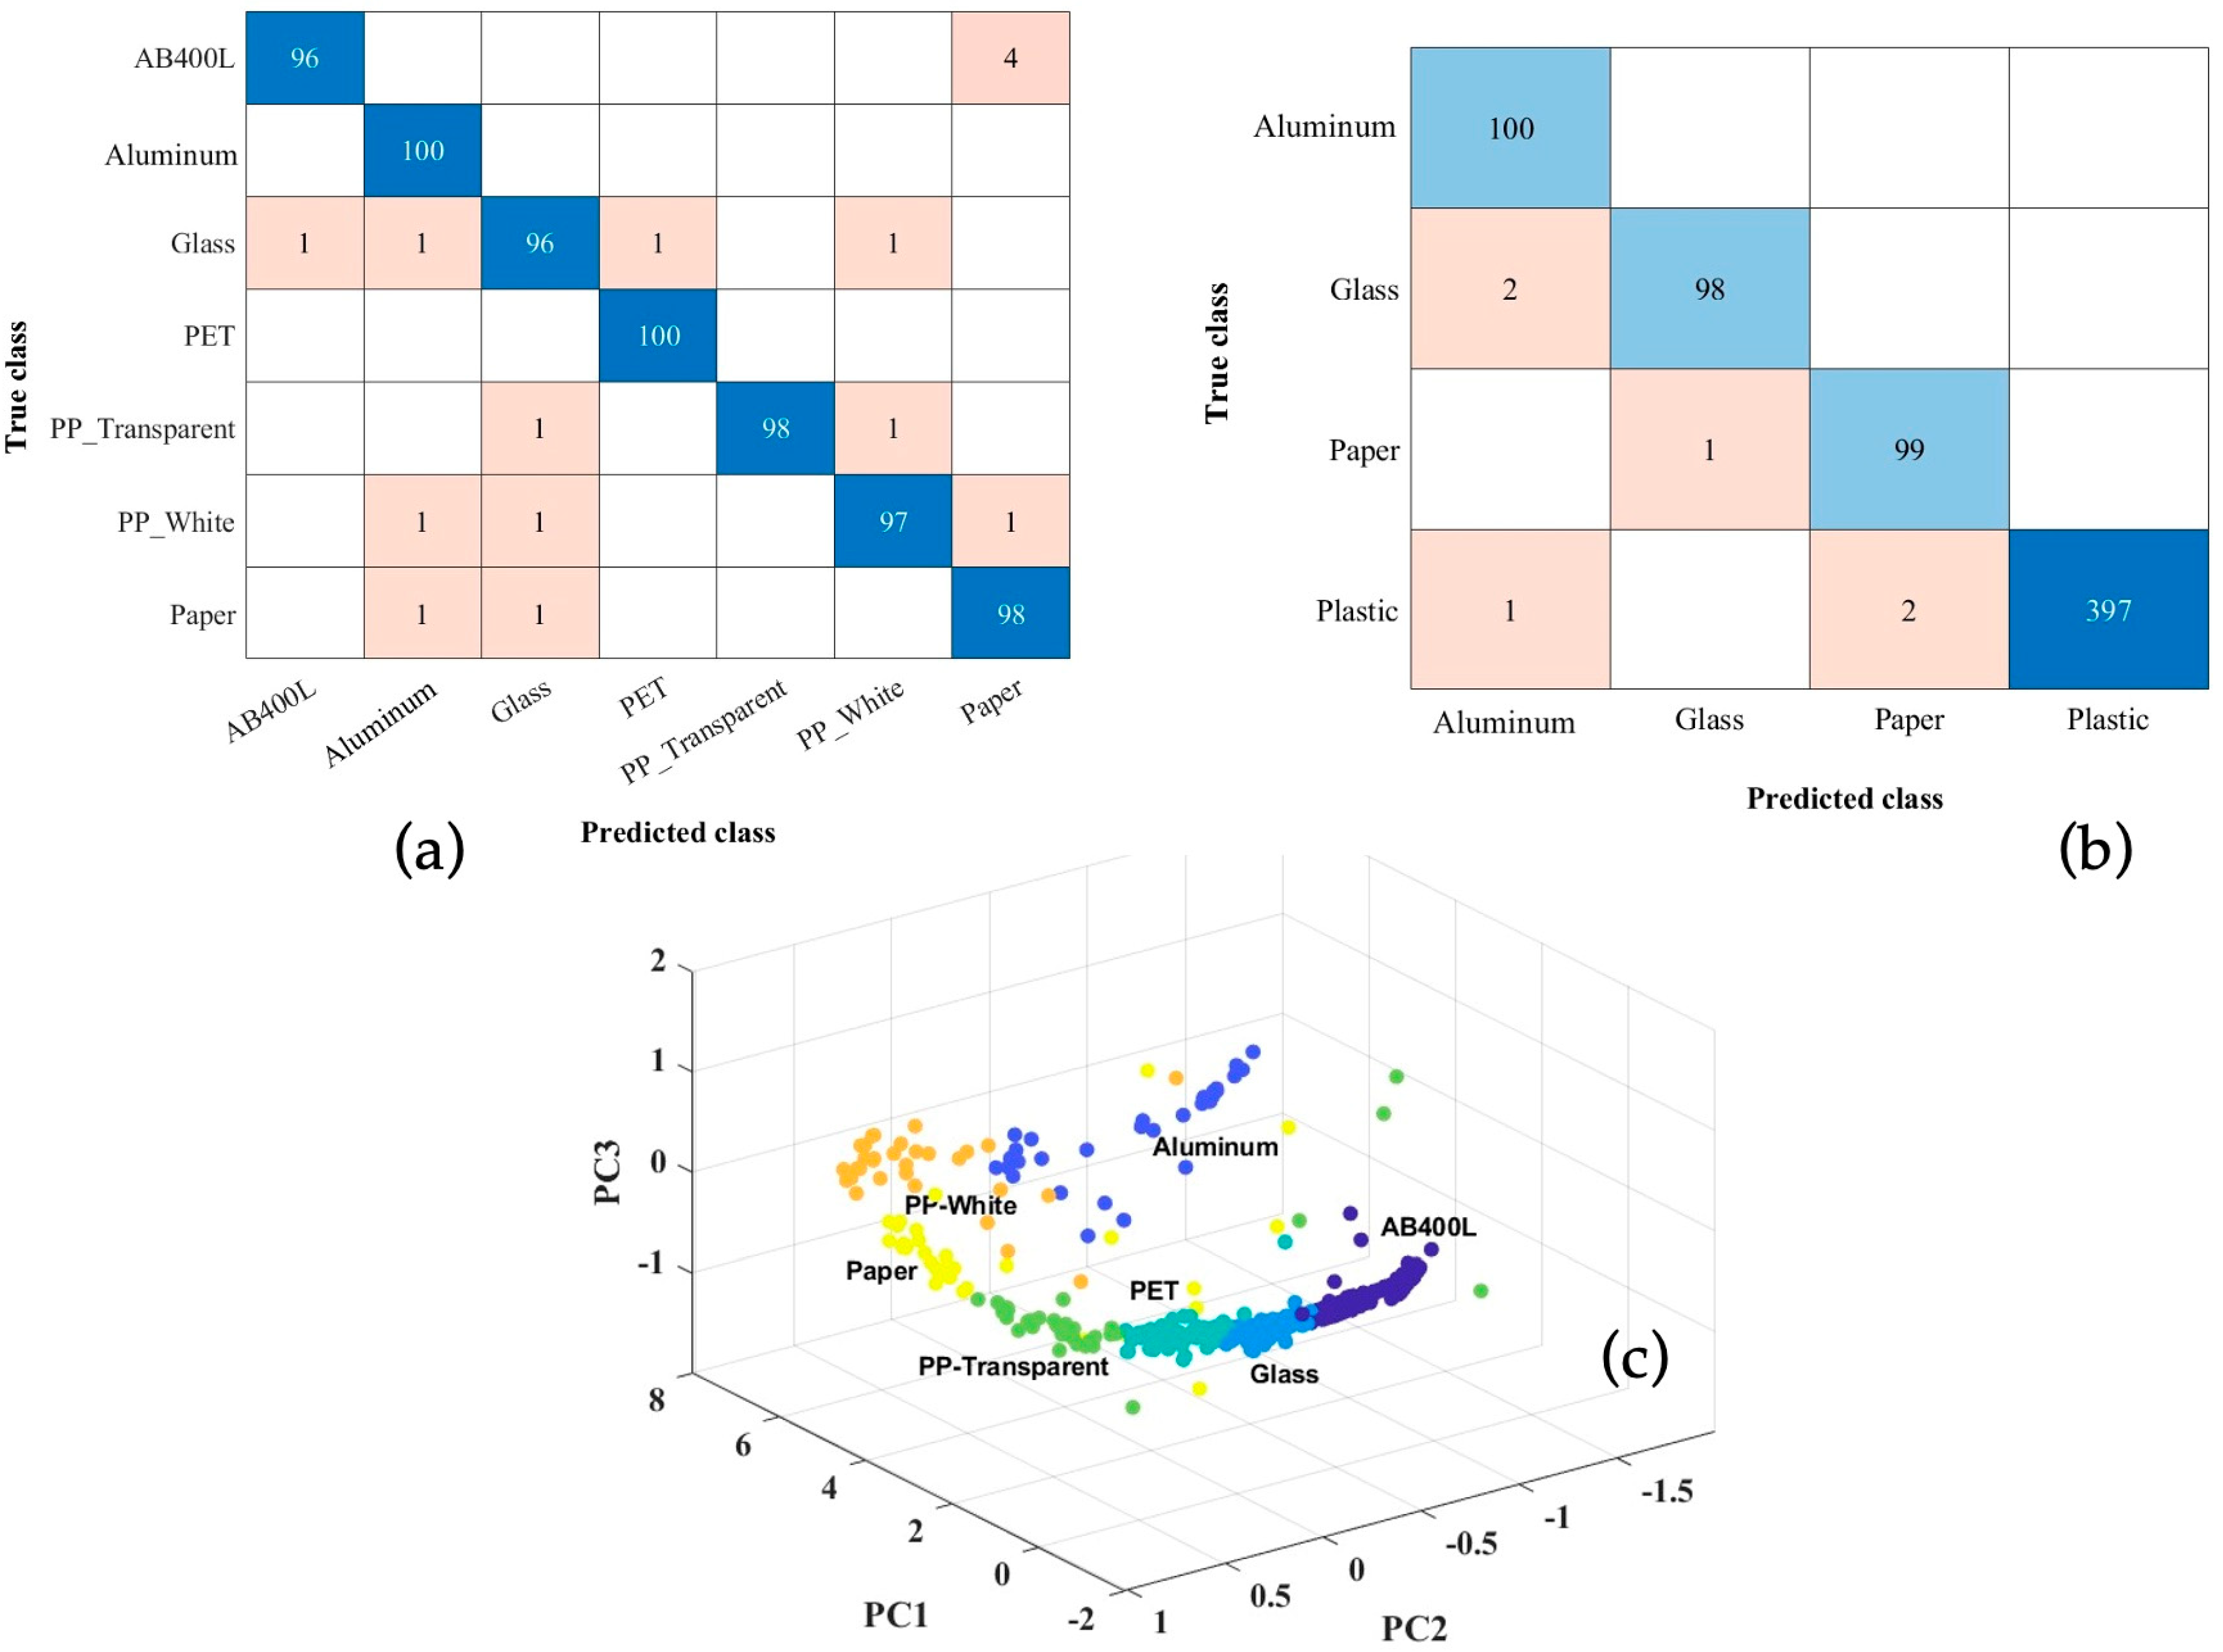
The classification system was trained in two stages: initially using all material types, then by combining four plastic datasets into a single generic class to match typical waste categorization at the end-user level. To improve performance and reduce overfitting, feature selection and 5-fold cross-validation were applied. Various machine learning algorithms were tested, with SVM achieving the highest accuracy of 97.9% at the first stage (seven materials). Notably, Aluminum and PET reached 100% accuracy; PP_White and paper 98%; while PP_Transparent, AB400L, and glass ranged from 96–97%, indicating strong overall classification performance. All materials achieved classification accuracies above 95%, confirming the system’s effectiveness in reliably distinguishing between different material types. Figure 12a shows the confusion matrix of the SVM classification model for the seven-class dataset, while Figure 12b shows the corresponding matrix for the four-class grouping, as also detailed in Table 4.
In the second stage, using a four-class classification, the system achieved an overall accuracy of 99.1% with the SVM model. The Al was classified with 100% accuracy, while paper and glass achieved 99% and 98% accuracy, respectively. When all polymer types were grouped into a single category, the overall accuracy slightly improved to 99.2%, with only minor misclassifications occurring between Aluminum and paper. Figure 12c illustrates the clustering results of the seven-class SVM model, visualized using the first three principal components [33], which together explain 95% of the dataset’s variance. During both classification stages, all models achieved an accuracy above 90%, with QDA showing good performance alongside SVM. Such consistently high accuracy across classifiers underscores the robustness and reliability of the system in distinguishing materials under various class definitions.
This setup improves Aluminum classification by leveraging both broader spectral illumination and adaptive detection as compared to the previous system. The inclusion of a 505 nm VIS LED enables the detection of strong reflectance contrasts, particularly effective for identifying the shiny, colored external surface of soda cans, which reflects more strongly in the VIS than in the SWIR alone. Simultaneously, the dual SWIR LEDs at 1200 nm and 1300 nm cover regions where subtle absorption features associated with internal coatings (e.g., epoxy or BPA-NI liners) may appear. Furthermore, the voltage-tunable Ge/Si photodetector allows dynamic adjustment of responsivity, enhancing contrast in spectral regions where Al response diverges from that of plastics or coated surfaces. This combination of VIS–SWIR coverage and tunable detection makes the second system more robust to reflectance variability introduced by the dual-surface nature of Al cans, thereby reducing misclassification compared to the SWIR-only setup.
The effectiveness of the sensor system, despite a limited set of wavelengths, is apparent from its ability to accurately distinguish between materials based on their photocurrent characteristics. Aluminum, in particular, exhibits highly distinctive photocurrent responses, making it easily identifiable during both stages of classification. Similarly, the clear differentiation between the photocurrent profiles of paper and glass further enhances the model’s performance.

4. Comparative Analysis and Design Insights

This work presented and compared two LED-based optical sensor systems developed for material classification, offering complementary strengths in terms of design, complexity, and performance. By analyzing their architectures, sensing mechanisms and classification outcomes, this study provided insights into how different system choices can impact real-world sensing applications.
The first system utilized a discrete SWIR LED array in combination with a Germanium photodetector. Through strategic LED selection and compact hardware, it achieved high accuracy in classifying key materials such as plastics, paper, and glass. Its relatively simple, low-power design makes it well suited for portable or embedded applications. However, it struggles to consistently classify Aluminum due to its complex behavior in reflectance.
The second system introduced a bias-tunable Ge/Si photodetector paired with three LEDs covering both VIS and SWIR. This configuration supported spectral tuning via electric biasing, achieving superior overall accuracy (over 99%) and good classification of Aluminum. Though currently reliant on laboratory-grade electronics, this design proves the potential of tunable optoelectronic systems.
Several key design principles emerged from this comparison:
  • Optimized LED selection can reduce system complexity while maintaining performance.
  • Bias-tunable photodetectors can replace more complex hardware for spectral adaptability.
  • Material-specific surface characteristics (e.g., Aluminum) impact sensor architecture.
Table 5 provides a comparative summary of the proposed LED-based systems alongside traditional sensing techniques such as HSI/MSI, Raman spectroscopy, XRF and LIBS. Key parameters including spectral range, power consumption, classification accuracy and application scenarios are presented to highlight the practical advantages of our systems for real-time, low-power and portable waste classificators.

5. Conclusions

Both compared systems demonstrate strong potential for real-time, intelligent material classification using compact LED-based sensing platforms. The discrete SWIR system is already portable and suitable for integration into low-power devices, while the tunable dual-band approach offers higher performance and flexibility, particularly for materials such as Aluminum. Either system achieved high classification accuracy, exceeding 95% anddemonstrating the effectiveness of the design. This study highlights that careful system engineering—incorporation of optimized LED wavelength selection, integration of a bias tunable photodetector and the use of machine learning algorithms—enables the efficient extraction of discriminative spectral features. This approach not only improves classification accuracy but also minimizes the number of LEDs required, thereby reducing the overall hardware complexity.
Looking ahead, both classification systems are well positioned for miniaturization and integration into embedded electronics. The discrete system could be readily deployed in smart waste bins or handheld scanners while the tunable one may benefit from further advances in CMOS-compatible photonic integration. With continued development, these designs could evolve into fully embedded, scalable solutions for use in industrial automation, household recycling and other real-world sensing scenarios including food quality inspection, agricultural sorting and portable medical diagnostics. These results underscore the viability of LED-based optical systems as low-cost, scalable equipment for smart material classification across multiple domains.

Author Contributions

Conceptualization, A.D.I., G.A. and L.C.; methodology, A.M.K., A.D.I. and L.C.; software development, A.M.K.; validation, A.M.K., R.E. and A.D.I.; formal analysis, A.M.K.; investigation, A.M.K. and R.E.; SiGe device development and fabrication, A.B., J.F. and G.I.; resources, G.A. and L.C.; data curation, A.M.K. and R.E.; writing—original draft preparation, A.M.K.; writing—review and editing, A.M.K., A.D.I., G.A. and L.C.; project administration and funding acquisition, L.C. All authors have read and agreed to the published version of the manuscript.

Funding

This work was partially supported by the Italian Ministry of Research under PRIN Project Grant n. F83C21000170001 (for Horiba spectrometer, SiGe photodiode development, and consumables) and partially supported by the Italian National Operational Programme (PON) on Research and Innovation 2014–2020—Action IV.6 (PON# 999900_PON_RTD_A7G99_INGEGNERIA IEM), by COST Action 19108, and by Rome Technopole PNRR Grant M4C2-Inv 1.5 (for Ocean spectrometers and measurement instrumentation).

Institutional Review Board Statement

Not applicable.

Informed Consent Statement

Not applicable.

Data Availability Statement

The data presented in this study are available upon request from the corresponding author. The data are not publicly available due to their large dimensions.

Acknowledgments

We thank M. Barletta and C. Aversa for providing the plastic samples and E. Maiorana for insightful discussions and valuable suggestions on the classification algorithms.

Conflicts of Interest

A. Ballabio, A. De Iacovo, J. Frigerio, G. Isella and L. Colace are the inventors of patent IT20200001876A1 on the dual-band photodiode employed in this work. These authors retain shares of the EYE4NIR s.r.l. company that owns an exclusive license on the patent. The remaining authors declare that the research was conducted in the absence of any commercial or financial relationships that could be construed as a potential conflict of interest.

References

  1. Hardie, K.; Agne, S.; Kuntz, K.B.; Jennewein, T. Inexpensive LED-Based Spectrophotometer for Analyzing Optical Coatings. arXiv 2016, arXiv:1606.02774. [Google Scholar]
  2. Bonifazi, G.; Gasbarrone, R.; Serranti, S. Detecting Contaminants in Post-Consumer Plastic Packaging Waste by a Nir Hyperspectral Imaging-Based Cascade Detection Approach. Detritus 2021, 15, 94–106. [Google Scholar]
  3. Bonifazi, G.; Serranti, S. Imaging Spectroscopy Based Strategies for Ceramic Glass Contaminants Removal in Glass Recycling. Waste Manag. 2006, 26, 627–639. [Google Scholar] [CrossRef] [PubMed]
  4. Kutila, M.; Viitanen, J.; Vattulainen, A. Scrap Metal Sorting with Colour Vision and Inductive Sensor Array. In Proceedings of the Proceedings—International Conference on Computational Intelligence for Modelling, Control and Automation, CIMCA 2005 and International Conference on Intelligent Agents, Web Technologies and Internet, Vienna, Austria, 28–30 November 2005; Volume 2, pp. 725–729. [Google Scholar]
  5. Nansen, C.; Kolomiets, M.; Gao, X. Considerations Regarding the Use of Hyperspectral Imaging Data in Classifications of Food Products, Exemplified by Analysis of Maize Kernels. J. Agric. Food Chem. 2008, 56, 2933–2938. [Google Scholar] [CrossRef] [PubMed]
  6. Geladi, P.; Burger, J.; Lestander, T. Hyperspectral Imaging: Calibration Problems and Solutions. Chemom. Intell. Lab. Syst. 2004, 72, 209–217. [Google Scholar] [CrossRef]
  7. Rahman, M.O.; Hussain, A.; Scavino, E.; Hannan, M.A.; Basri, H. Segregating Recyclable Waste Papers Using Co-occurrence Features. In Proceedings of the 9th WSEAS international Conference on Applied Computer Science, ACS ’09, Genova, Italy, 17–19 October 2009; pp. 187–191. [Google Scholar]
  8. Wang, O.; Gunawardane, P.; Scher, S.; Davis, J. Material Classification Using BRDF Slices. In Proceedings of the 2009 IEEE Conference on Computer Vision and Pattern Recognition, CVPR 2009, Miami, FL, USA, 20–25 June 2009; pp. 2805–2811. [Google Scholar]
  9. Mukunda, D.C.; Joshi, V.K.; Mahato, K.K. Light Emitting Diodes (LEDs) in Fluorescence-Based Analytical Applications: A Review. Appl. Spectrosc. Rev. 2022, 57, 1–38. [Google Scholar] [CrossRef]
  10. Bui, D.A.; Hauser, P.C. Analytical Devices Based on Light-Emitting Diodes—A Review of the State-of-the-Art. Anal. Chim. Acta 2015, 853, 46–58. [Google Scholar] [CrossRef]
  11. Magnus, I.; Virte, M.; Thienpont, H.; Smeesters, L. Combining Optical Spectroscopy and Machine Learning to Improve Food Classification. Food Control 2021, 130, 108342. [Google Scholar] [CrossRef]
  12. Liu, C.; Gu, J. Discriminative Illumination: Per-Pixel Classification of Raw Materials Based on Optimal Projections of Spectral BRDF. IEEE Trans. Pattern Anal. Mach. Intell. 2014, 36, 86–98. [Google Scholar] [CrossRef]
  13. Lopez-Ruiz, N.; Granados-Ortega, F.; Carvajal, M.A.; Martinez-Olmos, A. Portable Multispectral Imaging System Based on Raspberry Pi. Sens. Rev. 2017, 37, 322–329. [Google Scholar] [CrossRef]
  14. Martinez-Hernandez, U.; West, G.; Assaf, T. Low-Cost Recognition of Plastic Waste Using Deep Learning and a Multi-Spectral Near-Infrared Sensor. Sensors 2024, 24, 2821. [Google Scholar] [CrossRef] [PubMed]
  15. Straller, A.; Gessler, B. Identification of Plastic Types Using Discrete Near Infrared Reflectance Spectroscopy, Preprint 2019. Available online: https://www.researchgate.net/publication/337868860 (accessed on 9 August 2025).
  16. Dong, Y.; Liu, X.; Mei, L.; Feng, C.; Yan, C.; He, S. LED-Induced Fluorescence System for Tea Classification and Quality Assessment. J. Food Eng. 2014, 137, 95–100. [Google Scholar] [CrossRef]
  17. Zhong, W.; Dong, Y.; Liu, X.; Lin, H.; Mei, L.; Yan, C. Classification Evaluation of Tobaccos Using LED-Induced Fluorescence Spectroscopy. In Proceedings of the Light-Emitting Diodes: Materials, Devices, and Applications for Solid State Lighting XVIII, San Francisco, CA, USA, 1–6 February 2014; SPIE: Bellingham, WA, USA, 2014; Volume 9003, p. 9003. [Google Scholar]
  18. Lastra-Mejías, M.; Torreblanca-Zanca, A.; Aroca-Santos, R.; Cancilla, J.C.; Izquierdo, J.G.; Torrecilla, J.S. Characterization of an Array of Honeys of Different Types and Botanical Origins through Fluorescence Emission Based on LEDs. Talanta 2018, 185, 196–202. [Google Scholar] [CrossRef] [PubMed]
  19. Manakkakudy, A.; De Iacovo, A.; Maiorana, E.; Mitri, F.; Colace, L. Material Classification Based on a SWIR Discrete Spectroscopy Approach. Appl. Opt. 2023, 62, 9228–9237. [Google Scholar] [CrossRef]
  20. Manakkakudy Kumaran, A.; De Iacovo, A.; Ballabio, A.; Frigerio, J.; Isella, G.; Colace, L. Waste Material Classification Based on a Wavelength-Sensitive Ge-on-Si Photodetector. Sensors 2024, 24, 6970. [Google Scholar] [CrossRef]
  21. Rozenstein, O.; Puckrin, E.; Adamowski, J. Development of a New Approach Based on Midwave Infrared Spectroscopy for Post-Consumer Black Plastic Waste Sorting in the Recycling Industry. Waste Manag. 2017, 68, 38–44. [Google Scholar] [CrossRef]
  22. Rückstieß, T.; Osendorfer, C.; Van Der Smagt, P. Sequential Feature Selection for Classification. In Proceedings of the Lecture Notes in Computer Science (Including Subseries Lecture Notes in Artificial Intelligence and Lecture Notes in Bioinformatics); Springer: Berlin/Heidelberg, Germany, 2011; pp. 132–141. [Google Scholar]
  23. Savitzky, A.; Golay, M.J.E. Smoothing and Differentiation of Data by Simplified Least Squares Procedures. Anal. Chem. 1964, 36, 1627–1639. [Google Scholar] [CrossRef]
  24. Jung, Y. Multiple Predicting K-Fold Cross-Validation for Model Selection. J. Nonparametr. Stat. 2018, 30, 197–215. [Google Scholar] [CrossRef]
  25. Theodoridis, S. Machine Learning: A Bayesian and Optimization Perspective, 2nd ed.; Academic Press: Cambridge, MA, USA, 2015. [Google Scholar]
  26. Cateni, S.; Colla, V.; Vannucci, M. A Hybrid Feature Selection Method for Classification Purposes. In Proceedings of the IEEE European Modelling Symposium, Pisa, Italy, 21–23 October 2014; pp. 39–44. [Google Scholar]
  27. Manakkakudy, A.; De Iacovo, A.; Maiorana, E.; Mitri, F.; Colace, L. Waste Material Classification: A Short-Wave Infrared Discrete-Light-Source Approach Based on Light-Emitting Diodes. Sensors 2024, 24, 809. [Google Scholar] [CrossRef]
  28. Colace, L.; Assanto, G. Germanium on Silicon for Near-Infrared Light Sensing. IEEE Photonics J. 2009, 1, 69–79. [Google Scholar] [CrossRef]
  29. Masini, G.; Cencelli, V.; Colace, L.; De Notaristefani, F.; Assanto, G. Linear Array of Si-Ge Heterojunction Photodetectors Monolithically Integrated with Silicon CMOS Readout Electronics. IEEE J. Sel. Top. Quantum Electron. 2004, 10, 811–815. [Google Scholar] [CrossRef]
  30. Simola, E.T.; De Iacovo, A.; Frigerio, J.; Ballabio, A.; Fabbri, A.; Isella, G.; Colace, L. Voltage-Tunable Dual-Band Ge/Si Photodetector Operating in VIS and NIR Spectral Range. Opt. Express 2019, 27, 8529–8539. [Google Scholar] [CrossRef]
  31. Zhu, S.; Chen, H.; Wang, M.; Guo, X.; Lei, Y.; Jin, G. Plastic Solid Waste Identification System Based on near Infrared Spectroscopy in Combination with Support Vector Machine. Adv. Ind. Eng. Polym. Res. 2019, 2, 77–81. [Google Scholar] [CrossRef]
  32. Patro, S.G.K.; Sahu, K.K. Normalization: A Preprocessing Stage. Int. Adv. Res. J. Sci. Eng. Technol. 2015, 2, 20–22. [Google Scholar] [CrossRef]
  33. Kurita, T. Principal component analysis (PCA). In Computer Vision: A Reference Guide; Springer International Publishing: Cham, Switzerland, 2021; pp. 1013–1016. [Google Scholar]
Figure 1. B/W photographs of materials captured using a SWIR camera.
Applsci 15 08964 g001
Figure 2. Setup for SWIR LED discrete spectroscopy.
Applsci 15 08964 g002
Figure 3. (a) Average reflectance spectra of seven materials and (b) irradiance spectra of 10 selected LEDs. Reprinted with permission from [19], © Optica Publishing Group.
Applsci 15 08964 g003
Figure 4. (a) Example of estimated reflectance spectra of materials used and (b) confusion matrix obtained during the feature selection process by applying the k-nearest neighbors classifier to simulated LEDs. Reprinted with permission from [8], © Optica Publishing Group.
Applsci 15 08964 g004
Figure 5. Confusion matrices of shuffled data with (a) and without aluminum (b) using the SVM model. Reprinted with permission from [19], © Optica Publishing Group.
Applsci 15 08964 g005
Figure 6. LED optimization process.
Applsci 15 08964 g006
Figure 7. Confusion matrix of shuffled data acquisition sessions with (a) and without (b) aluminum for SVM. Reproduced with permission from [27], published by MDPI Sensors, 2024.
Applsci 15 08964 g007
Figure 8. Spectral responsivity of the Ge/Si photodetector at various bias voltages, as in the legend. Reproduced with permission from [20], published by MDPI Sensors, 2024.
Applsci 15 08964 g008
Figure 9. (a) Ge/Si photodetector responsivity R in the −0.5 V–0.5 V voltage range, (b) average reflectance spectra S, and (c) estimated photocurrent Iph of various waste materials.
Applsci 15 08964 g009
Figure 10. (a) Classification accuracy for visible LEDs in combination with a fixed NIR LED at 1200 nm and (b) SVM confusion matrix of the simulated data.
Applsci 15 08964 g010
Figure 11. (a) Schematic diagram of the experimental setup and (b) average normalized photocurrent for each material as a function of voltage bias.
Applsci 15 08964 g011
Figure 12. SVM confusion matrix for (a) 7 classes, (b) 4 classes, and (c) clustering results of the classification model based on the first three principal component analyses across 4-day datasets.
Applsci 15 08964 g012
Table 1. Comparative analysis of classification accuracy using SVM and LDA methods in different datasets.
Data Division ApproachAll Materials
(SVM)
Without Aluminum
(SVM)
All Materials
(LDA)
Without Aluminum
(LDA)
1st (Training) and 2nd (Testing)79%96.0%73.4%84.0%
1st (Training) and 3rd (Testing)86%93.0%62.0%94.0%
2nd (Training) and 1st (Testing)81%87.0%67.4%80.0%
2nd (Training) and 3rd (Testing)94%95.0%81.0%93.7%
3rd (Training) and 1st (Testing)76%83.0%67.0%89.0%
3rd (Training) and 2nd (Testing)87%95.0%84.3%90.0%
Shuffled Data95.0%98.1%86.0%98.0%
Table 2. Classification accuracies using optimized LEDs across four methods over a three-day dataset. Bold values indicate the best results per session.
DatasetSVMLDAKNNRF
1st day95.7%96.0%94.3%92.9%
2nd day94.6%93.4%92.6%88.6%
3rd day93.4%92.9%89.7%90.0%
Shuffled94.3%93.0%88.0%90.3%
Table 3. Feature selection results showing ranked SWIR and VIS LEDs per classifier.
ClassifierRank 1 SWIR LED (nm)Rank 2 SWIR LED (nm)VIS LED (nm)
SVM12001300505
KNN1300970505
QDA12001300505
RF12001070545
Table 4. Classification accuracy comparison across four different methods over the considered dataset.
DatasetSVMKNNQDARF
7 Class97.9%92.0%97.0%95.0%
4 Class99.1%92.9%95.6%94.7%
Table 5. Comparison of proposed LED-based systems with traditional material classification techniques.
ParameterSystem 1: Discrete SWIRSystem 2: Dual-Band PDHSI/MSI (Hyperspectral/Multispectral Imaging)LIBS (Laser-Induced Breakdown Spectroscopy Raman SpectroscopyXRF (X-Ray Fluorescence)
Spectral Range910–1600 nm505–1300 nm400–2500 nm (broadband)UV-VIS-NIRVisible/NIRX-ray
PortabilityHighMedium to highLow to mediumMedium to highLow to mediumLow to medium
Power ConsumptionLowLowHighHighMediumHigh
Component ComplexityLowLowHighHighHighHigh
CostLow to moderateLow to moderateHighHighHighHigh
Classification AccuracyUp to 98%Up to 99.1%High (dependent on setup)High (elemental precision)High (material-specific)High (element-specific)
Material RangePlastics, paper, glass, AlPlastics, paper, glass, aluminumWide, including complex mixturesMainly metals, some non metalsWide, but sensitive to fluorescenceElemental composition
SpeedFastModerateModerateFast (single point), slower for scanningModerateModerate
Application ExamplesSmart waste bins, small-scale industrial recyclingSmart waste bins, industrial recyclingLaboratory analysis, industrial sortingElemental analysis in metallurgy, recyclingChemical/material identificationElemental analysis, recycling
Disclaimer/Publisher’s Note: The statements, opinions and data contained in all publications are solely those of the individual author(s) and contributor(s) and not of MDPI and/or the editor(s). MDPI and/or the editor(s) disclaim responsibility for any injury to people or property resulting from any ideas, methods, instructions or products referred to in the content.