Article

Vision-Based Closed-Loop Control of Pulsed MAG Welding Using Otsu-Segmented Arc Features

1
Graduate School of Science and Engineering, Saitama University, Saitama 338-8570, Japan
2
School of Automation, Nanjing University of Information Science and Technology, Nanjing 210044, China
3
School of Automation, Nanjing University of Science and Technology, Nanjing 210094, China
*
Author to whom correspondence should be addressed.
Appl. Sci. 2025, 15(16), 8950; https://doi.org/10.3390/app15168950
Submission received: 11 July 2025 / Revised: 11 August 2025 / Accepted: 12 August 2025 / Published: 13 August 2025

Abstract

While modern power sources have improved process stability, real-time monitoring and feedback control remain essential for ensuring consistent weld quality under dynamic conditions. To address this need, a vision-based closed-loop control system was developed for pulsed Metal-Active Gas (MAG) welding. The system dynamically adjusts the welding speed based on real-time visual feedback in the welding process. Otsu thresholding combined with morphological operations was applied to molten pool images for brightness-based feature extraction. These features, representing the dynamic behavior of the molten pool, were incorporated into a feedback loop for real-time control. Without relying on complex model-based prediction or sensor fusion, the proposed method reduces fluctuations in weld bead geometry and lowers the occurrence of defects. The experimental results showed that, under optimized control conditions and after a steady welding state was achieved, the weld bead’s height deviation exhibited an average standard deviation of 0.08 mm, and a process stability rate of 92%. The combination of conventional hardware and straightforward image processing makes the proposed approach practical for industrial implementation.

1. Introduction

Gas Metal Arc Welding (GMAW) is a welding technology in which a continuous solid wire electrode is fed through a welding gun and melted by an electric arc to form a molten pool on the base metal [1,2,3,4]. GMAW has been extensively adopted in industrial production due to its high efficiency and automation potential [5]. Among its variants, pulsed GMAW—where the welding current is modulated in pulses—offers benefits such as reduced spatter, improved arc stability, and better thermal control, making it especially suitable for automated and robotic welding systems. Pulsed MAG welding is a subtype of pulsed GMAW that uses active shielding gases, typically CO2 or Ar–CO2 mixtures. Although pulsed GMAW has been studied widely, relatively few works focus specifically on pulsed MAG welding, despite its widespread use. Ohara et al. examined how gas composition affects metal transfer in pulsed MAG welding, highlighting its industrial relevance. These studies suggest that pulsed MAG is a valuable yet underexplored process [6]. At the same time, as manufacturers seek higher precision and face shortages in skilled welders, automation and intelligent control have become increasingly important [7].
Despite advances in power source technology, pulsed GMAW welding remains sensitive to fluctuations in arc behavior, droplet transfer, and heat input, which may cause weld pool instability or inconsistent penetration [8,9,10]. To address these challenges, numerous studies have explored data-driven and sensor-based control methods. For example, Pan et al. used a convolutional neural network (CNN) architecture and Gradient-weighted Class Activation Mapping (Grad-CAM) to correlate molten pool oscillations with weld penetration using laser vision [11], while Rezende et al. investigated how droplet detachment modes influence deposition geometry and mechanical properties in pulsed DED-arc [9]. Chen et al. further demonstrated that arc voltage fluctuations could indicate changes in penetration depth during the base current phase [12]. These studies underscore the potential of sensing and analysis techniques for process optimization.
In recent years, researchers have also emphasized real-time monitoring and control in pulsed GMAW welding. For example, optical sensing [13], arc acoustics [14], structured light [15], and infrared imaging [16] have all been employed to detect penetration states or molten pool dynamics. Meanwhile, deep learning has been extensively applied to welding tasks such as defect detection and process state classification [17,18,19,20]. However, its high computational cost and reliance on large training datasets often hinder real-time industrial deployment. In contrast, traditional image processing techniques—such as edge detection, contour analysis, and arc tracking—offer lightweight and interpretable solutions [21,22], making them better suited for real-time welding control. Although their application to pulsed GMAW remains relatively limited, these techniques have demonstrated effectiveness in both seam tracking and penetration control tasks across various arc welding processes [23,24]. For instance, Xu et al. [25] developed a passive vision-based feedback system that utilizes grayscale and texture features of the weld pool to regulate penetration depth through PI control, achieving reliable results without requiring complex models or active sensors. Similarly, Biber et al. [26] proposed a camera-based robotic welding system that performs adaptive control of wire feed speed and torch path using morphological analysis of weld pool images, maintaining consistent bead geometry in response to process disturbances. These findings reinforce the viability of traditional image-based methods for implementing closed-loop control in practical, real-time welding environments.
In this study, we propose a vision-based feedback control system for pulsed MAG welding, which regulates welding speed by tracking a spatial feature—referred to here as the arc center—extracted from molten pool images. This approach is motivated by the hypothesis that the arc’s center position reflects variations in molten pool geometry and heat input, and can thus serve as a responsive visual indicator for adaptive speed control. The extracted center is directly used as the control signal to adjust torch movement in real time. To evaluate the system under realistic joint conditions, the root gap was varied from 4 to 8 mm. Although the initial gap is defined during joint preparation, deviations often arise during welding due to assembly tolerances or thermal distortion, potentially increasing the risk of burn-through under high heat input. Rather than measuring the gap explicitly, our method seeks to indirectly account for such variations through arc center tracking. This study builds upon our previous work on seam tracking in lap joint welding using Gaussian fitting [27] and shifts the focus toward arc-centered feedback control for a more flexible and geometry-aware welding strategy. The main contribution of this work lies in the development of a real-time closed-loop control system that achieves stable welding under varying root gap conditions without relying on explicit modeling or external sensors. In contrast to existing vision-based systems that emphasize feature extraction or offline optimization, our approach directly links a physically interpretable feature—the arc’s center position—with control execution. This enables on-the-fly adaptation to gap variations, offering a low-cost and easily deployable solution for industrial pulsed MAG welding.

2. Designed Welding Control System and Utilized Materials

Figure 1 illustrates the setup of the developed robotic welding system, which integrates a six-axis industrial robot with a controller, a welding power source (Panasonic YD-400VP1) equipped with a wire feeder, a CMOS-based visual detection unit, and a data acquisition device for monitoring process parameters. The system operates under the control of two programmable logic controllers (PLCs): PLC1 controls the servo-driven XY-axis movement of the torch and base metal, while PLC2 manages the camera, arc voltage, and wire feeding speed. A computer communicates with the PLCs via an RS-232C interface, enabling both data transmission and the real-time adjustment of welding parameters. The shielding gas used in the process is a mixture of 80% argon and 20% carbon dioxide.
For visual detection and process monitoring, a CMOS industrial camera (IDS UI-3240CP-NIR-GL Rev.2; IDS Imaging Development Systems GmbH, Obersulm, Germany) and a digital data acquisition unit (CONTEC DIO-1616LN-USB) were employed. The camera features a 1.3 MP CMOS sensor (e2v EV76C661), supports near-infrared sensitivity, and was mounted at a 45° angle relative to the welding direction. It provided 8-bit grayscale images at a resolution of 1280 × 1024 pixels (px), with a maximum frame rate of 60 fps under full resolution. It features a high dynamic range (HDR) function, which extends the effective dynamic range by combining multiple frames captured at varying exposure levels, thus improving visibility under intense arc illumination. Simultaneously, the CONTEC DIO-1616LN-USB device, connected via USB, was used to record process parameters such as welding current, arc voltage, and wire feed speed. The acquisition was synchronized with the image capture via external triggering to ensure temporal alignment of visual and electrical data. The synchronization and signal flow relationships between these components are illustrated in Figure 1c. This diagram clarifies how the trigger signals for image acquisition are generated based on the pulsed current from the welding power source, and how image-derived control commands are transmitted to the motion system.
SM400A rolled steel plates were selected as the base metal to meet the manufacturing requirements of a specific engineering application. These plates conform to the JIS G3106 standard [28] and are commonly used for general structural purposes. They are 12 mm thick. And the backing plates are made of ceramic. As is shown in Figure 2, in every welding experiment, a V-groove joint was employed, with a groove angle of 45° and a root gap ranging from 4 mm to 8 mm. This configuration is commonly adopted in industrial welding of medium-thickness plates, and the groove angle of 45° falls within the general recommendation range (40–60°) in ISO 9692-1:2013 [29]. The range of 4 mm to 8 mm is defined as the focus of our experiments. The used wire is KC-26 and the diameter is 1.2 mm. The typical chemical compositions of the utilized base metal and wire are listed in Table 1 and Table 2, respectively. At each start time of the welding process, the wire extension length is set to about 20 mm. The electrode wire feed speed is 97 mm/s, and the weaving frequency is 2 Hz. The weaving width is set to be equal to the root gap. And the root gap width in the experiments is estimated from image processing method.
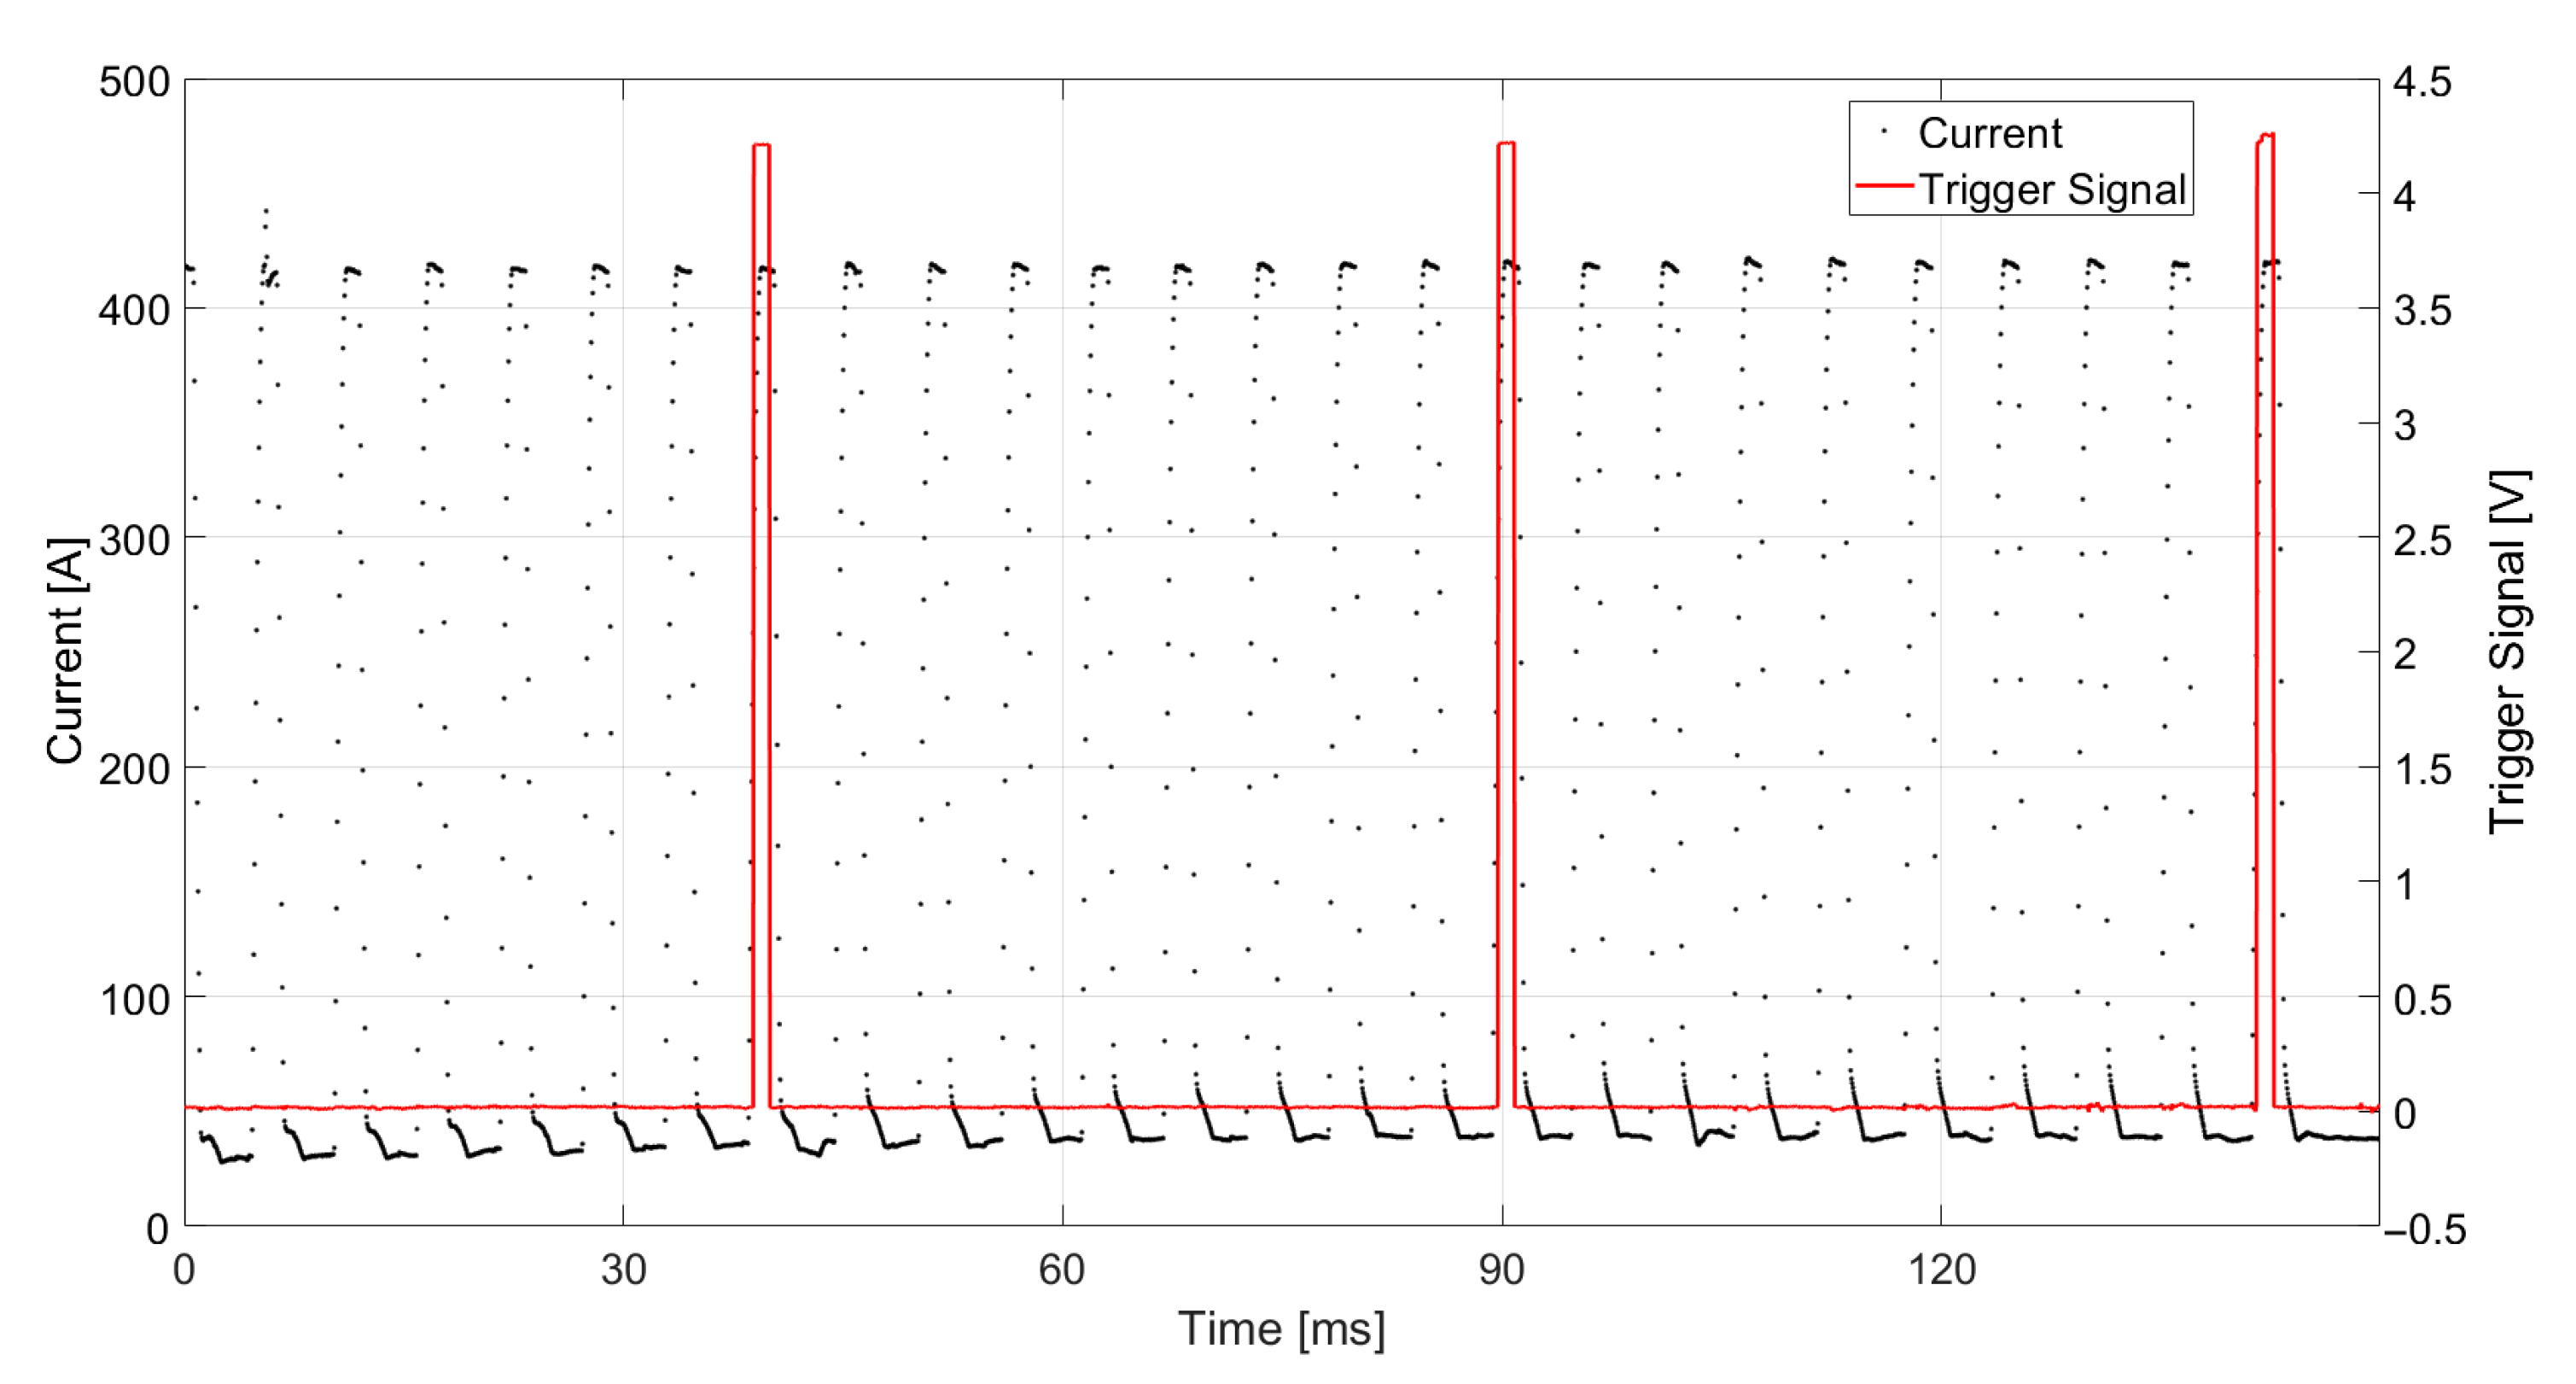
In the experiments, after detecting the current signal, a trigger signal was generated as is depicted in Figure 3, when the camera shutter opened, and an image was captured. The welding current pulse frequency was approximately 200 Hz. The trigger signal was generated at every tenth rising edge of the pulsed current, upon which the CMOS camera shutter was activated to capture molten pool images in synchronization with the welding process. Images were acquired at 20 Hz (one frame per 50 ms) with a fixed exposure time of 2.0 ms. Based on the weaving frequency, approximately 10 frames correspond to half a weaving cycle, and 20 frames correspond to a full cycle.

3. Molten Pool Observation and Image Processing for Arc Center Position

3.1. Basic Physical Phenomenon Analysis of the Molten Pool

In the pulsed GMAW process, the wire is melted intermittently by alternating high- and low-current pulses. An ideal pulsed GMAW cycle typically consists of four distinct phases, as shown in Figure 4: droplet formation, droplet detachment, droplet transition, and arc maintenance. In the droplet formation phase, the wire end melts under peak current, primarily driven by electromagnetic contraction forces, forming a molten droplet. During the droplet detachment phase, the droplet is separated axially as the current drops to the base level, due to necking effects and surface tension imbalance. The droplet transition phase follows, where the detached droplet travels steadily toward the molten pool in the form of a jet, driven by arc force and plasma flow. Finally, the arc maintenance phase ensures arc stability using base current, regulates the dynamic behavior of the molten pool, and preheats the pool for the next cycle. In this way, droplets drop in a correct position to form a good bead. As pulsed MAG welding is a specific subtype of pulsed GMAW, the underlying principle remains applicable and can be referenced accordingly.
Since the filler wire melts and forms the weld bead, the welding speed is influenced by the root gap through its effect on the relationship between the filler wire deposition rate and the cross-sectional area of the weld bead. This relationship was derived in this study by equating the volume of deposited filler metal to the cross-sectional volume of the weld bead. It allows the welding speed to be determined using the following equation:
v w = v f · π r 2 g + h · tan θ · h
where v w [mm/s] is denoted as the welding speed, while v f [mm/s] represents the wire feeding speed. The gap is denoted as g [mm], the wire radius is denoted as r [mm], the half of the groove angle is denoted as θ [°], and the target bead height is represented as h [mm]. This formula is derived based on the principle of volume conservation between the deposited metal and the groove geometry. In this formulation, the cross-sectional area of the weld bead is approximated as a trapezoid defined by the groove angle and root gap, which allows the welding speed to be estimated consistently within the assumed joint configuration and deposition parameters.
Under appropriate welding conditions, the welding speed is well-matched to the droplet transfer rate, allowing molten droplets to fall precisely onto the desired position and form a uniform and smooth weld bead. In this study, we define a term, arc center, which refers to the vertical distance from the center of the arc to the edge of the image, as illustrated in Figure 5b. Typically, under stable welding conditions, the arc center is located near the center of the molten pool, which helps ensure a stable heat supply and effective fusion. From a frontal perspective, the arc center appears near the middle region of the captured molten pool image.
But as the welding speed varies, the arc’s center position and heat distribution change accordingly, potentially leading to different welding states. As illustrated in Figure 5a, when the welding speed is excessively slow, the wire tip remains positioned over the previously solidified bead, causing prolonged heat accumulation in a localized area. This may result in insufficient penetration and lack of fusion. The arc center also shifts upward, concentrating heat in the upper region of the molten pool. Conversely, as shown in Figure 5c, an excessively high welding speed causes the wire to move too fast, reducing the duration of heat transfer and leading to local overheating and potential burn-through. In this case, the arc center shifts downward, with heat focused on the lower region of the molten pool. These defects correspond to observable changes in arc’s center position and brightness distribution from the front view. At lower speeds, imbalanced lateral heat dissipation, excessive molten pool spreading, and instability of the solidification front contribute to fusion defects. At higher speeds, limited convective heat loss, arc-force-driven metal displacement, and transient conduction failure cause thermal concentration and deep penetration. Thus, the variation in arc’s center position can be regarded as a meaningful indicator for assessing the suitability of the welding speed.
In this study, the physical principle described above serves as the theoretical basis for the proposed approach. Specifically, during the experiments, images of the molten pool are captured and processed to track variations in the arc’s center position. These variations are then used to infer and adjust the welding speed in real time.

3.2. Proposed Image Processing Method for Detecting the Arc’s Center Position

To ensure accurate geometric interpretation of the molten pool from the oblique-view images, a series of preprocessing steps were conducted prior to segmentation and analysis. A CMOS camera was rigidly mounted on the welding torch and captured images from an approximately 45° oblique angle. Due to this configuration, direct measurement of distances and shapes in the image was not reliable without geometric correction. Therefore, camera calibration was performed using a planar checkerboard target with known dimensions. Multiple images were captured from different orientations, and intrinsic parameters (focal length, principal point, and distortion coefficients) and extrinsic parameters (rotation and translation vectors) were estimated using HALCON 12.11’s calibration functions. These parameters were then used to rectify image distortions and re-project the images to a virtual front-view perspective.
Moreover, since both the CMOS camera and the welding torch were mounted on a shared servo-driven mechanical structure that executed a controlled weaving motion to ensure adequate groove filling. Although the camera and torch were not rigidly connected, they moved synchronously via the same rotational axis, resulting in lateral displacement of the molten pool within the image frames. This periodic motion introduced non-negligible spatial variation across consecutive images, which could interfere with consistent feature extraction and morphological analysis. To address this, a motion correction strategy was applied. First, the molten pool was segmented using Otsu’s thresholding method, which determines an optimal grayscale threshold by maximizing inter-class variance. To improve robustness against noise, only the largest connected component in the binary mask was retained as the molten pool region. The horizontal centroid of this region was then computed for each frame to obtain the displacement caused by the weaving motion. By aligning this centroid to a fixed reference position through spatial translation, the molten pool location was stabilized across the image sequence. As illustrated in Figure 6, this correction effectively reduced inter-frame deviations and ensured that subsequent analysis would focus on intrinsic variations in molten pool shape and behavior, rather than motion-induced artifacts. The deviation was calculated as follows:
y ' = a 2 y
where y denotes the horizontal centroid coordinate of the segmented region, a represents the image width, and y ' indicates the calculated deviation along the horizontal axis.
To accurately determine the arc’s center position, irrelevant regions in the image must first be removed. Otsu’s thresholding method is applied to the full-grayscale image to obtain an initial segmentation. Among the resulting binary regions, the one with the largest area is selected as the molten pool candidate, as it typically exhibits the most stable and prominent brightness profile. All subsequent analysis is restricted to this region to reduce the influence of background interference. Within the segmented molten pool, the arc is assumed to occupy the brightest subregion. To isolate it, the maximum grayscale value I m a x within the pool is computed, and a secondary threshold is applied at I m a x 55 . This fixed offset 55 was empirically determined and shown to reliably distinguish the arc core from surrounding high-intensity gradients under stable imaging conditions. While the segmentation does not guarantee px-level precision, it sufficiently captures the arc region needed for robust center localization. To eliminate spatter and reflective noise, a morphological opening is applied using a circular structuring element with a radius of 5 px. Connected components are extracted from the filtered region and sorted by area. The arc is identified as the region with the largest area using indexed access. The horizontal centroid coordinate of this region is then computed and defined as the arc’s center position for each frame. In rare ambiguous cases, additional constraints based on the known position of the wire tip are incorporated. To reduce the effect of frame-to-frame fluctuations and improve robustness, a temporal smoothing operation is applied to the arc center trajectory using a moving average over the recent frames. This step suppresses local noise while preserving the overall displacement trend, ensuring a more stable control input. The complete detection process is illustrated in Figure 7.
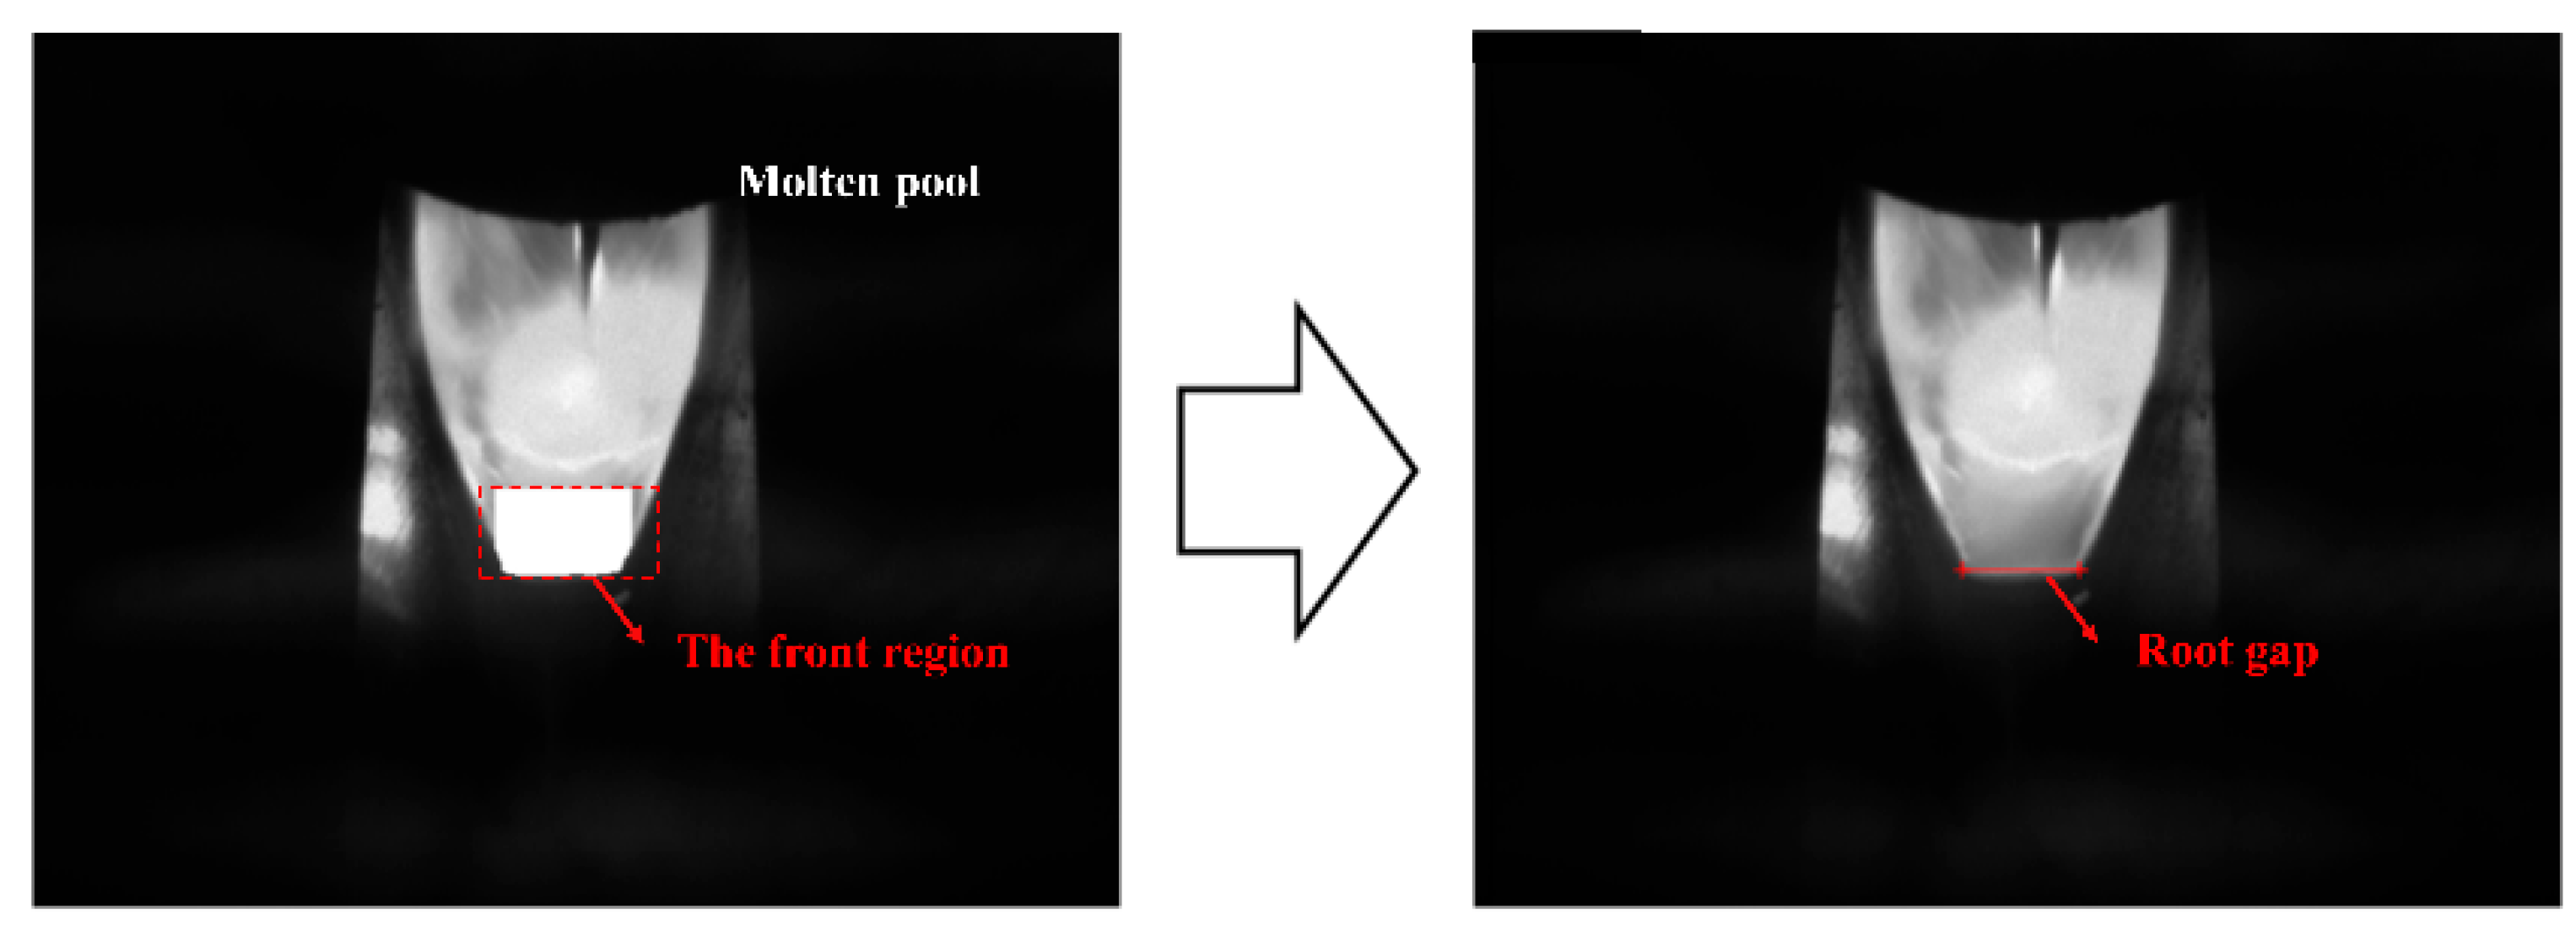
Furthermore, the same segmented molten pool region is used to estimate the groove width in order to adaptively control the weaving amplitude. Specifically, the largest inscribed rectangle within the lower part of the molten pool is extracted, and its lateral span is used as a reliable estimate of the root gap. This measurement is then mapped to the corresponding weaving amplitude, enabling adaptive motion planning based on image-derived gap information, as illustrated in Figure 8.

3.3. Proposed Control Method

In our study, the primary focus is on the relationship between the arc’s center position and the welding speed. The proposed control approach is derived from the conventional PID controller. In light of the system’s characteristics, a PI controller was selected to eliminate steady-state errors without compromising stability or dynamic response. The corresponding PI control law is given as follows [30]:
u t = K p e t + K i e ( t ) d t
where u t represents the control output, e t is the control error, K p is the proportional gain, and K i is the integral gain.
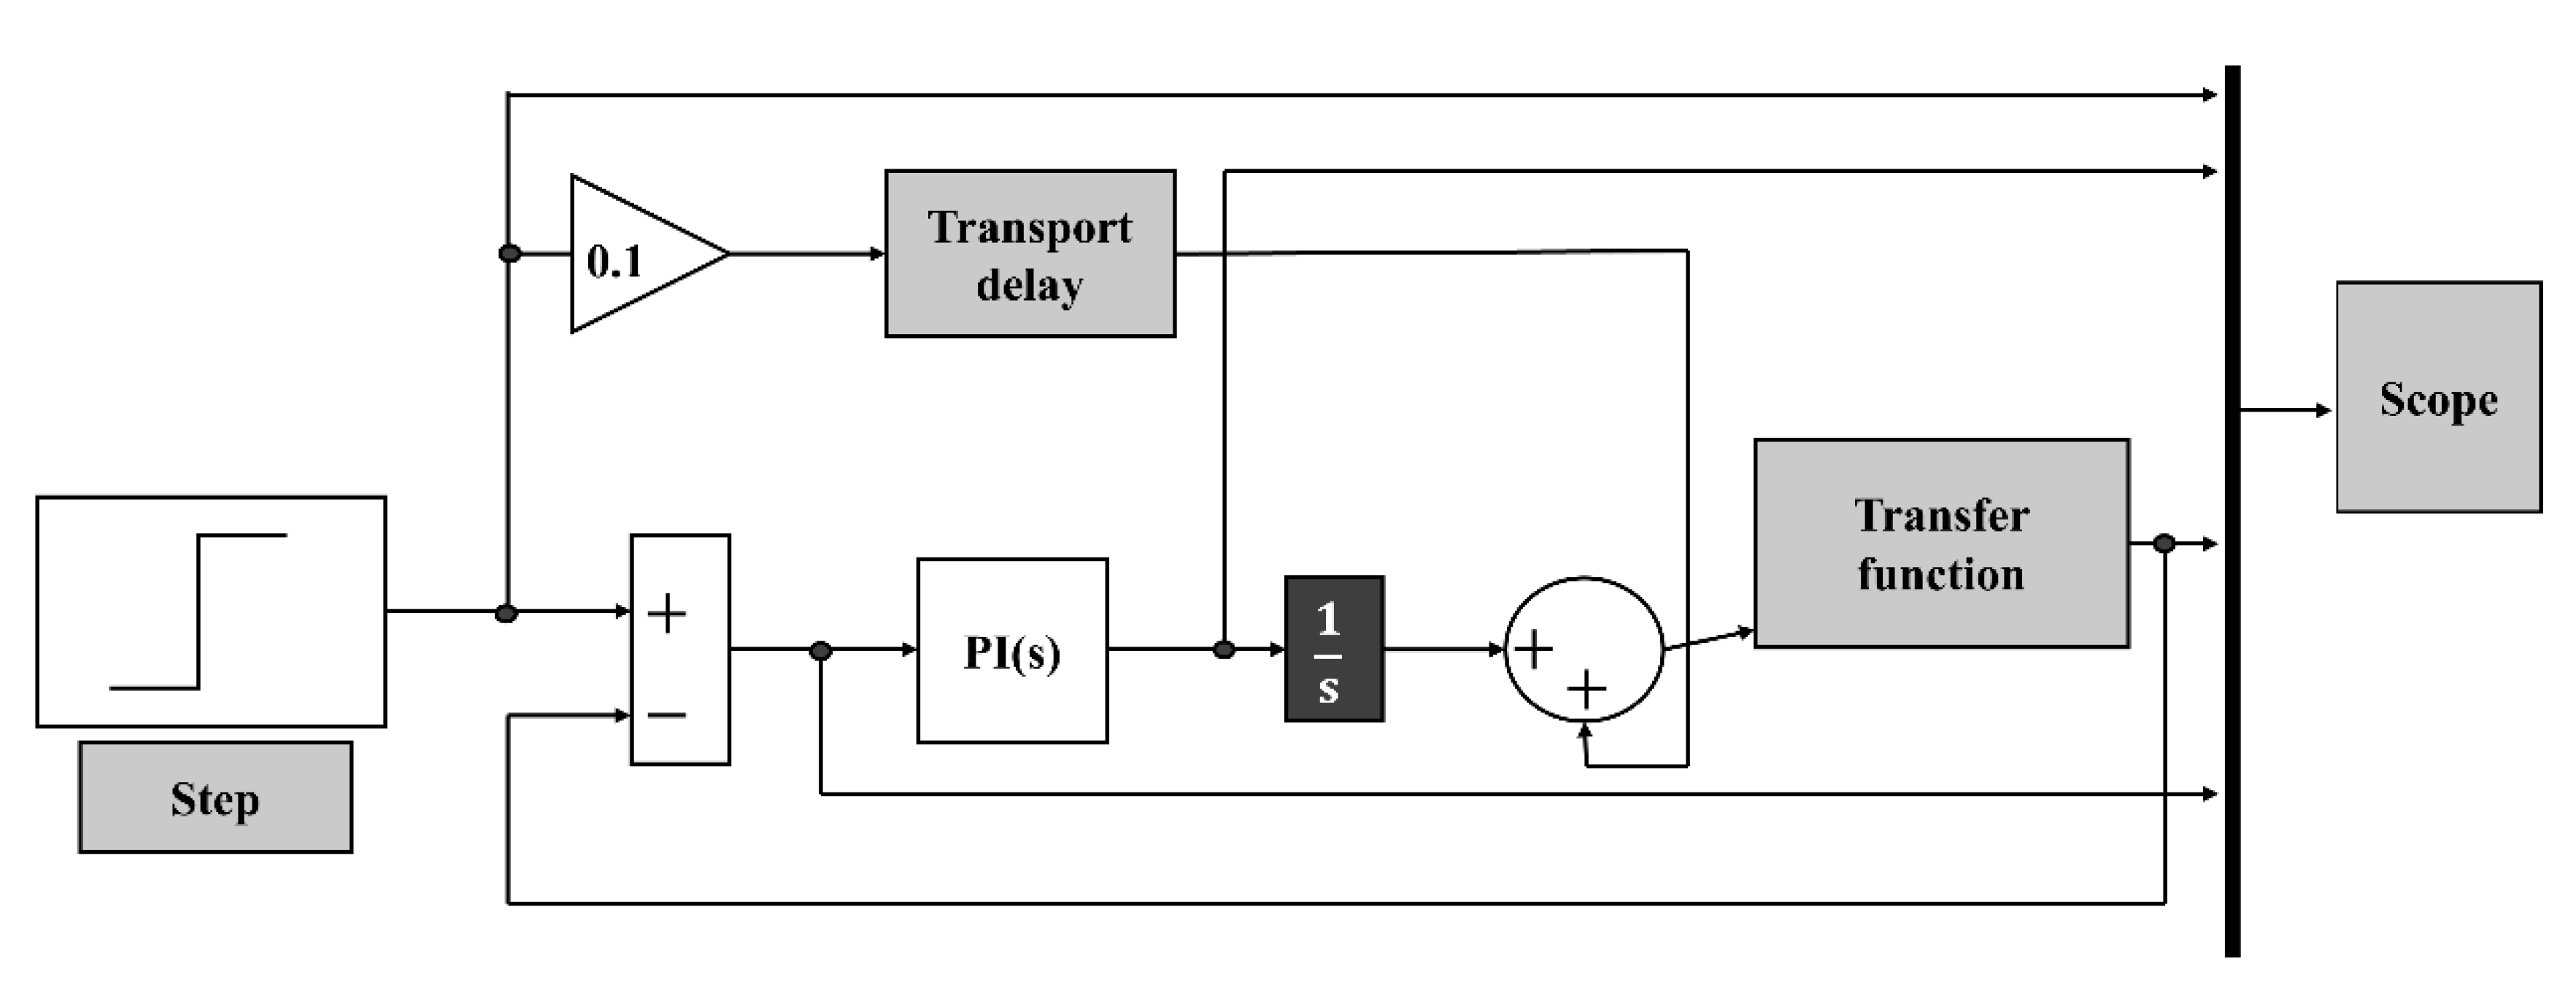
In the simulation system, the arc’s center position serves as the input, while the welding speed is the output. To determine appropriate proportional and integral gains, simulation based on experimentally obtained data is essential. Figure 9 illustrates the block diagram used for simulating the control system and tuning the PI controller parameters. The system is modeled in MATLAB R2023a Simulink (MathWorks, Natick, MA, USA) to represent the closed-loop control of welding speed in response to variations in the arc’s center position. A step input is applied to simulate a sudden disturbance during the welding process. The PI controller processes deviations in the arc’s center position, and its output is used to regulate the welding speed. The adjusted welding speed then influences the arc’s center position in the subsequent frame, thus completing the feedback loop. A transfer function, which is derived through system identification, characterizes the dynamic behavior of the welding process. To better approximate real-world conditions, transport delay and additive disturbance are incorporated to simulate external noise and inherent system delays. The system response is observed via a Scope block, and the PI gains are iteratively tuned to achieve stable control performance with minimal overshoot and negligible steady-state error.

4. Control-Oriented System Design and Experiment Validation

The experimental procedure was conducted in three stages. First, a series of fundamental experiments were carried out to obtain essential parameters and collect data for simulation. Based on the extracted data, a simulation model was developed to determine appropriate PI control parameters. These parameters were then applied in a series of control experiments. In real-time control experiments, the welding speed was adaptively adjusted using arc position information extracted in real time from image processing. A total of 50 weld samples were prepared during the study, including both preliminary trials for parameter confirmation and controlled experiments for evaluating the proposed system.

4.1. Fundamental Pulsed MAG Experiments

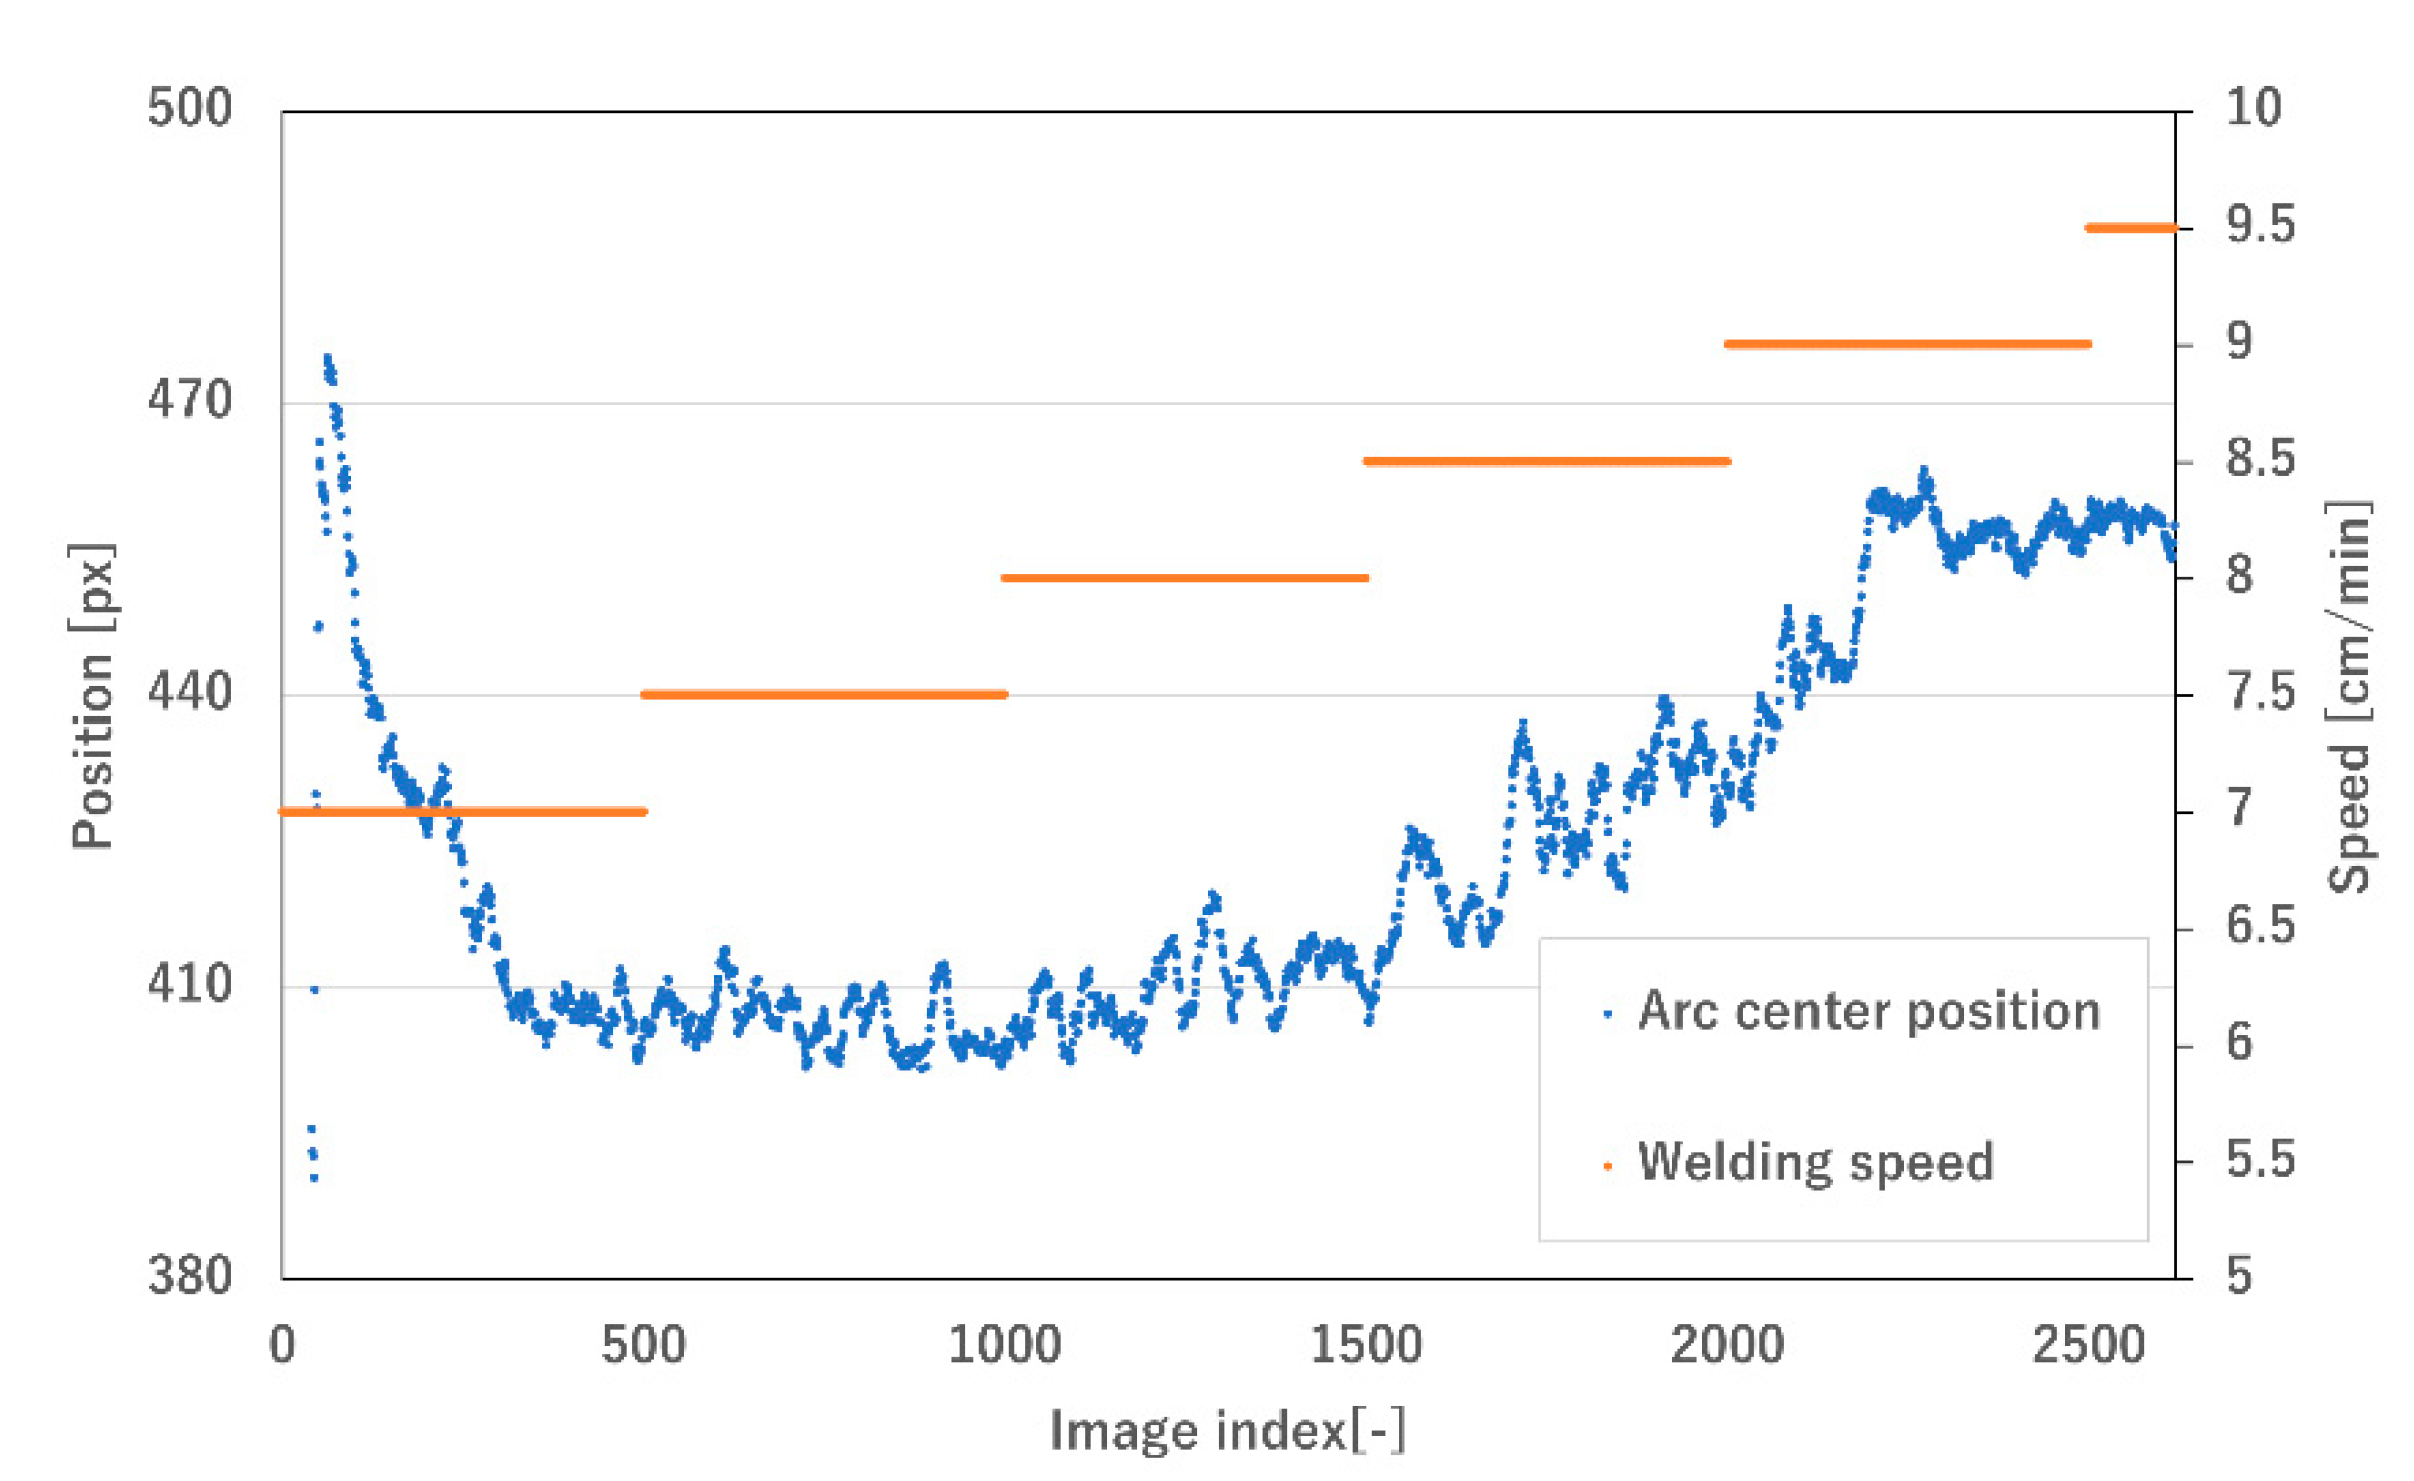
Before the control experiments, fundamental welding trials were carried out to determine appropriate process parameters and to generate reference data for the subsequent simulation and system identification. As shown in Figure 10, a clear correlation was observed between the arc’s center position and the welding speed, which underpins the proposed control strategy. The welding speed increased in a stepwise manner, with steady-state periods between the steps. During the initial transition phase, the arc’s center position first decreased and then stabilized around 400 px before gradually increasing as the welding speed continued to rise.
In addition, a target bead height of 8.0 mm was selected as an initial reference value for stable welding, based on the results of the fundamental experiments. This value was also subsequently adopted as a reference in the following control experiments. Table 3 shows validated suitable welding conditions.

4.2. Proposed Control Experiment Simulation Based on PI Controller

Based on the experimental data shown in Figure 10, the relationship between welding speed and the arc’s center position was analyzed using MATLAB Simulink. To avoid the influence of initial transient behavior on the modeling process, only data after frame 500 were used for system identification, ensuring that the model accurately represents the steady-state characteristics of the welding process. A continuous-time transfer function was then estimated using MATLAB’s System Identification Toolbox, employing the transfer function estimation (tfest) method based on prediction error minimization. As a result, the following fourth-order continuous-time transfer function was obtained to represent the system dynamics:
G s = 1.037 e 04 s 3 + 1469 s 2 52.45 s + 7.932 s 4 + 511.2 s 3 + 30.74 s 2 + 4.783 s + 0.1498
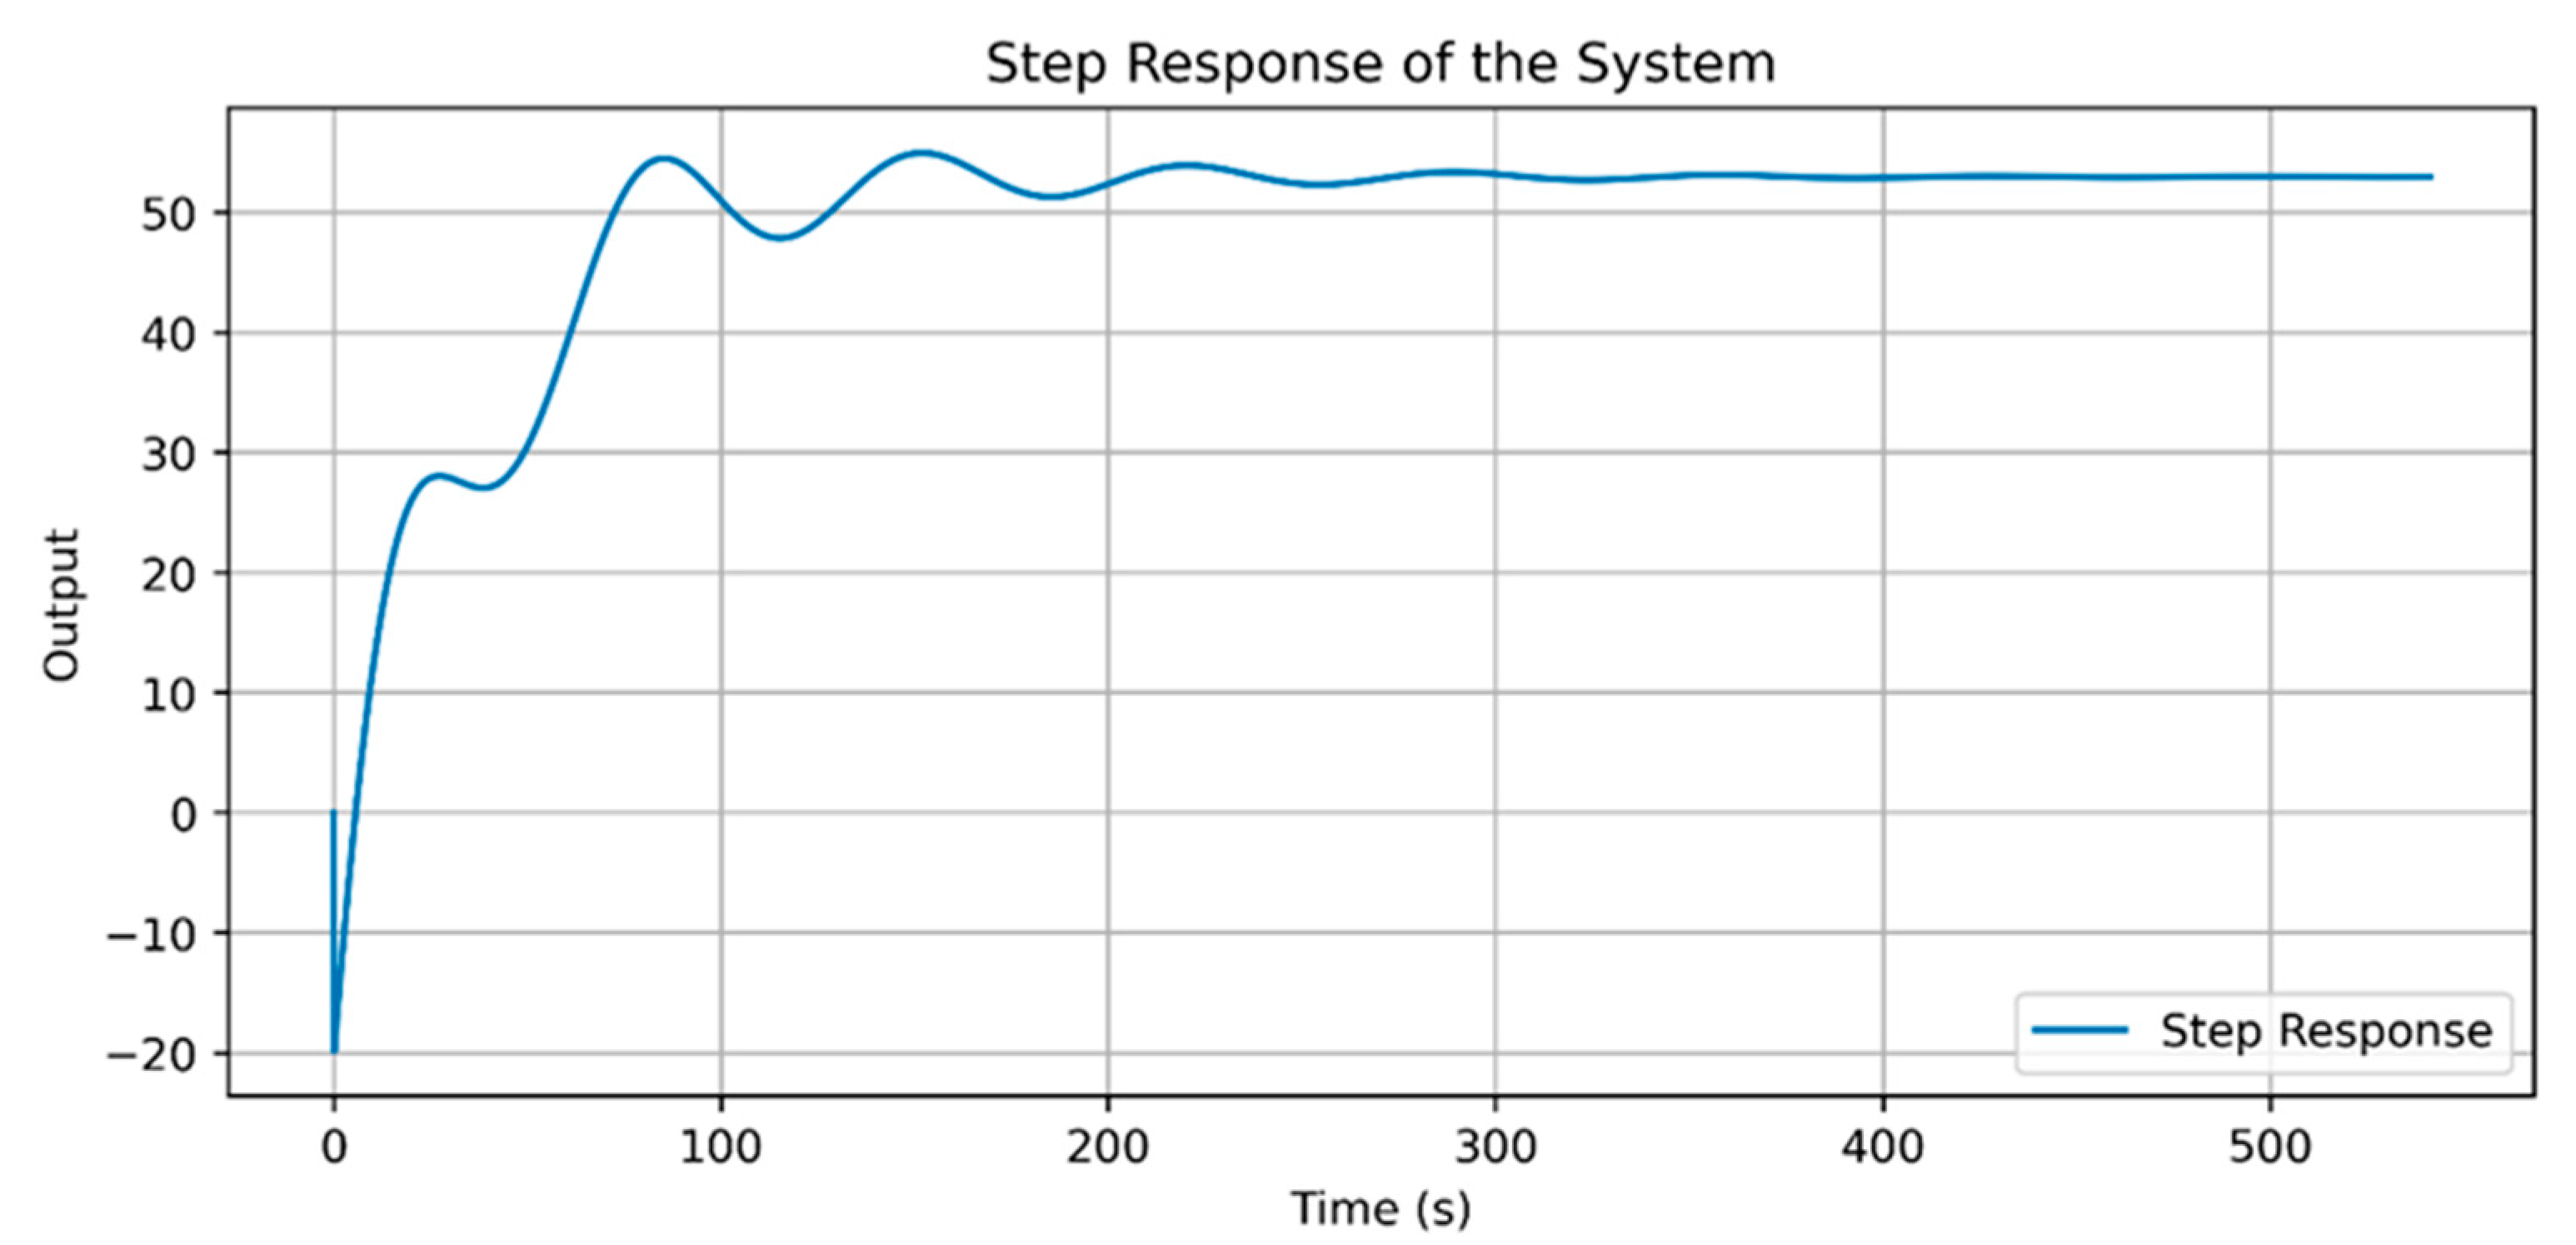
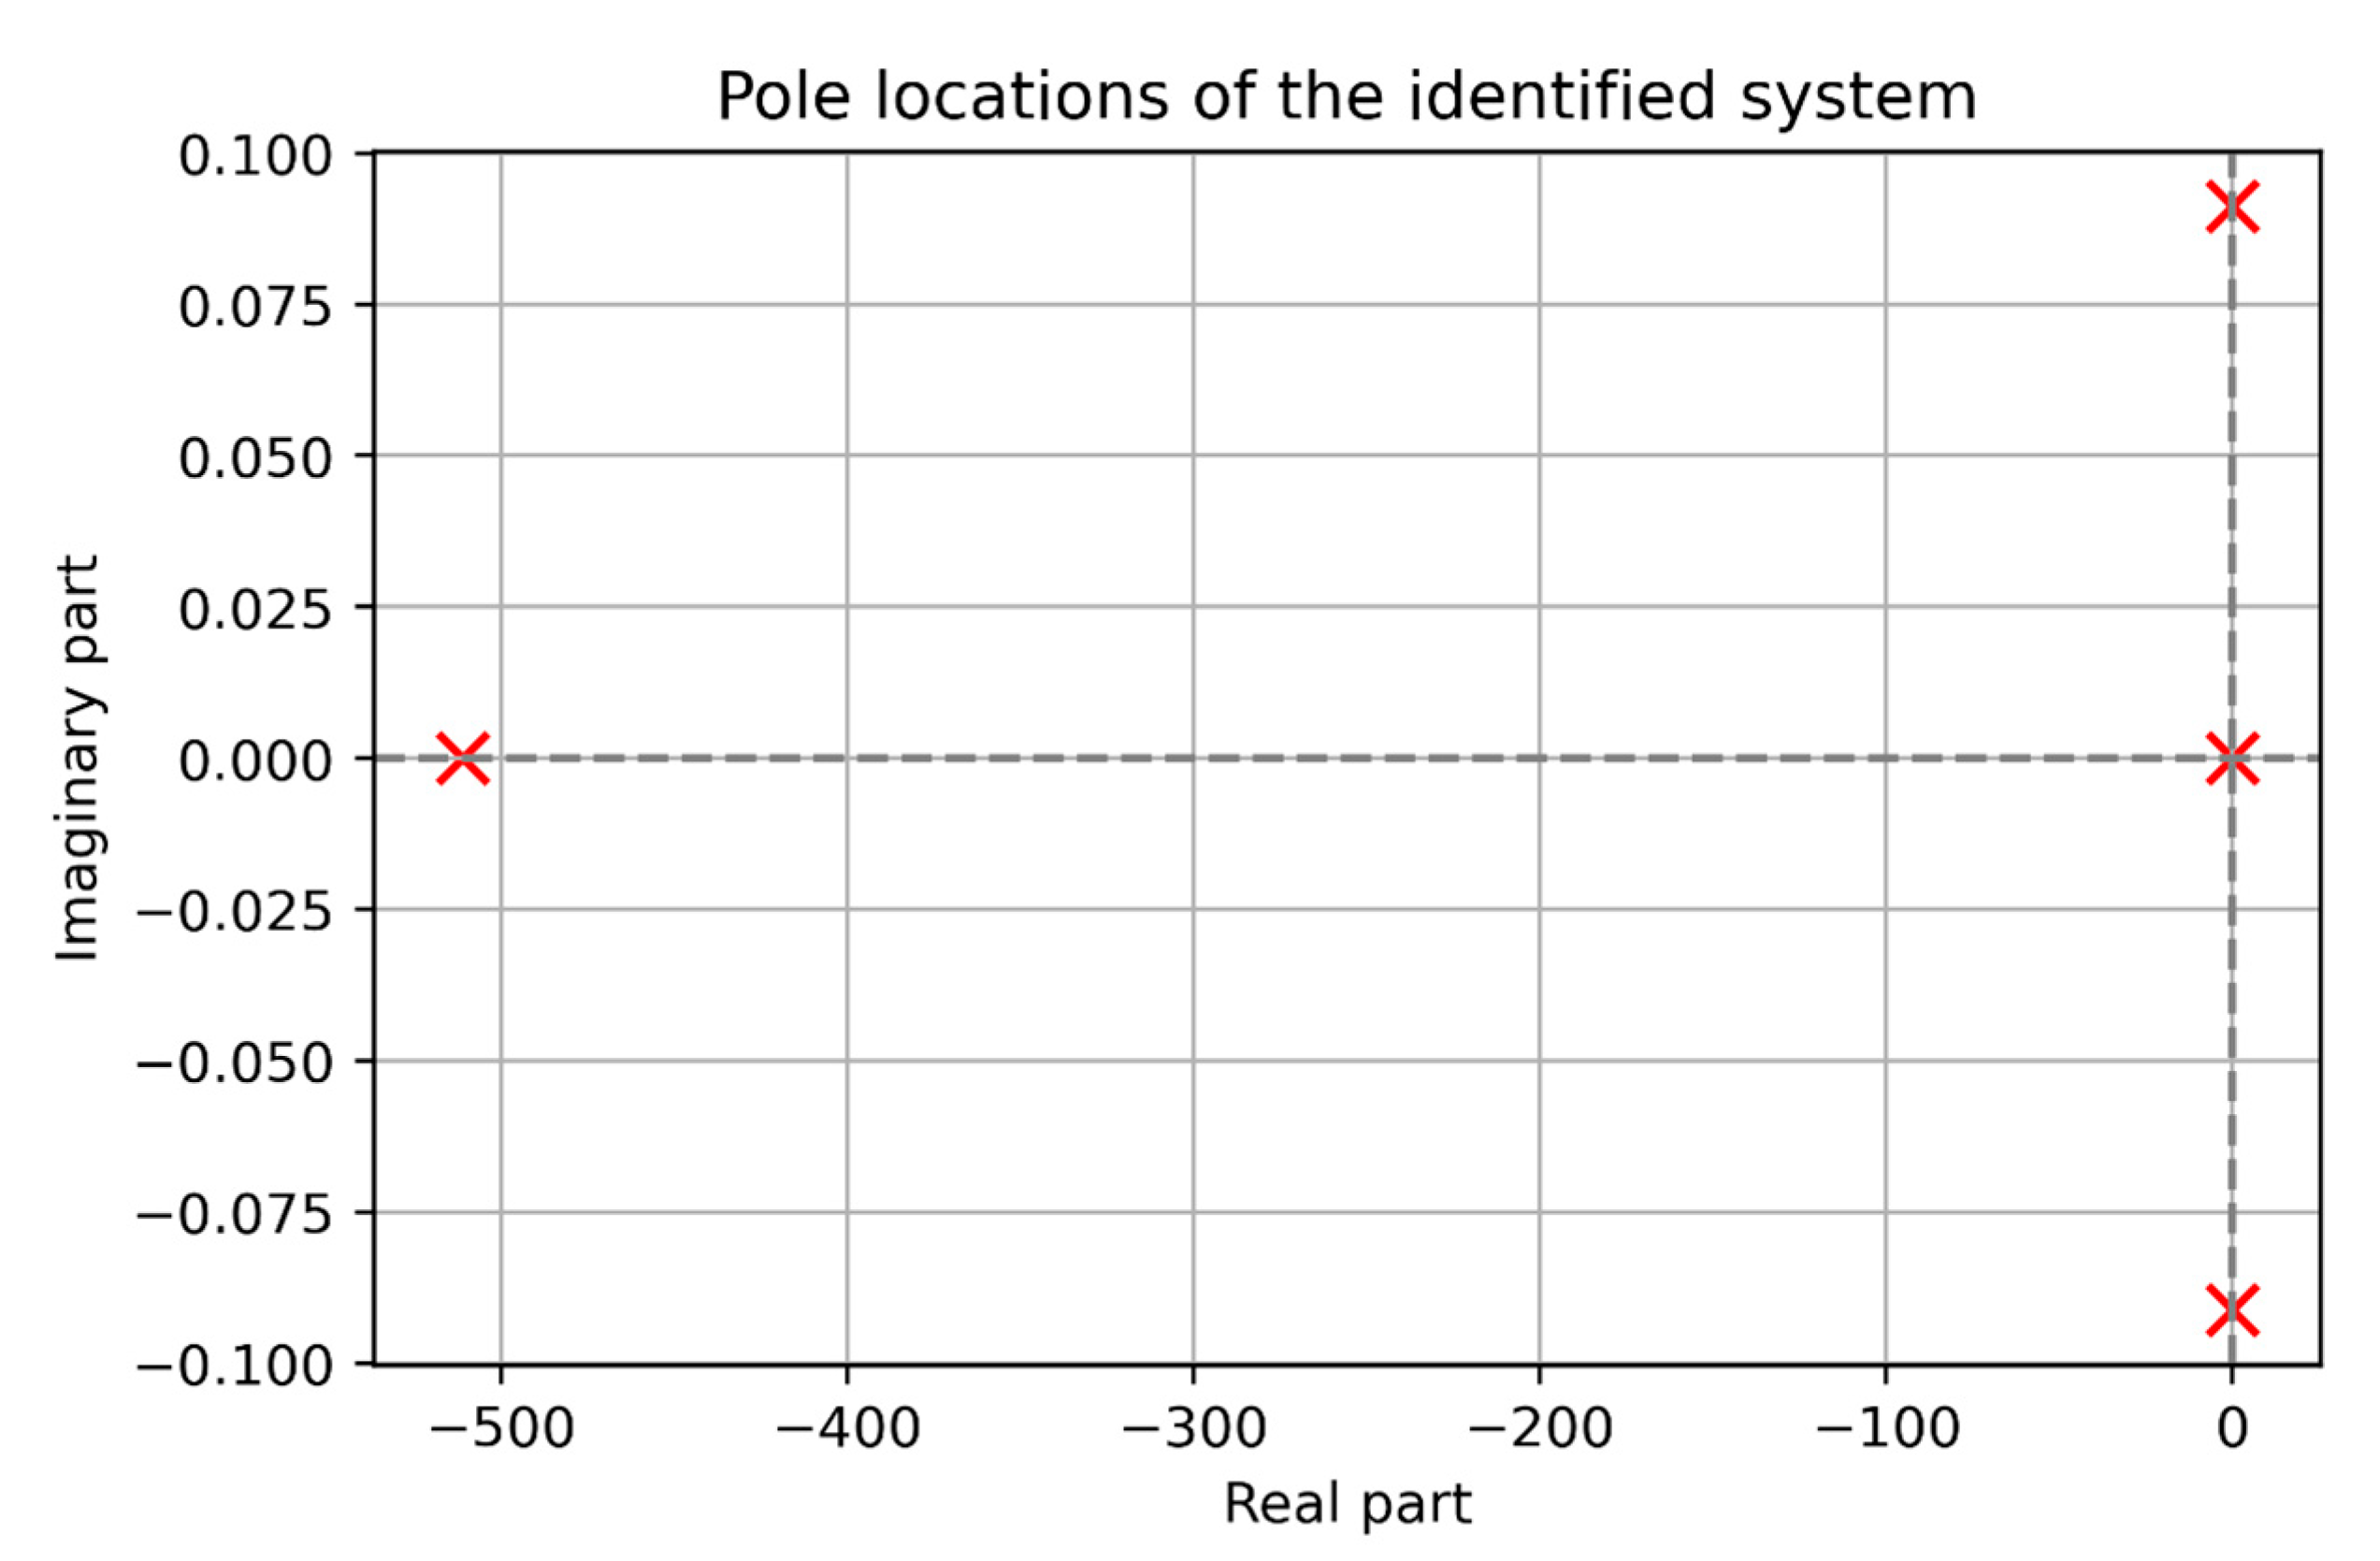
The dynamic behavior of the identified model was analyzed through step response simulation and pole location analysis. As shown in Figure 11, the step response exhibited stable, monotonic behavior without oscillation or overshoot. Pole distribution analysis (Figure 12) further confirmed system stability, with all poles located in the left-half plane. One dominant pole located near the imaginary axis indicated slow response characteristics, aligning with the physical behavior observed in the welding process.
To evaluate the dynamic characteristics and stability of the identified model, a pole analysis and time domain step response were conducted. As shown in Figure 12, the identified transfer function exhibits one fast real pole on the far left of the complex plane, one real pole close to the origin, and a pair of complex–conjugate poles near the imaginary axis. These dominant poles result in a slow and lightly oscillatory system response, consistent with the step response behavior observed in Figure 11. As all poles are located in the left-half complex plane, the system is confirmed to be stable and suitable for use in controller design.
While the numerical fitting accuracy of the model was limited (40.38%), its dynamic behavior closely matched the physical response of the system, and was more consistent than models with higher fitting accuracy but unrealistic or oscillatory dynamics. Therefore, this model was adopted for subsequent PI controller design.
The proportional (P) and integral (I) gains were obtained using Simulink’s automatic tuning function, applied to the identified system model under a unit negative feedback configuration, as illustrated in Figure 9. The resulting PI parameters are listed in Table 4.
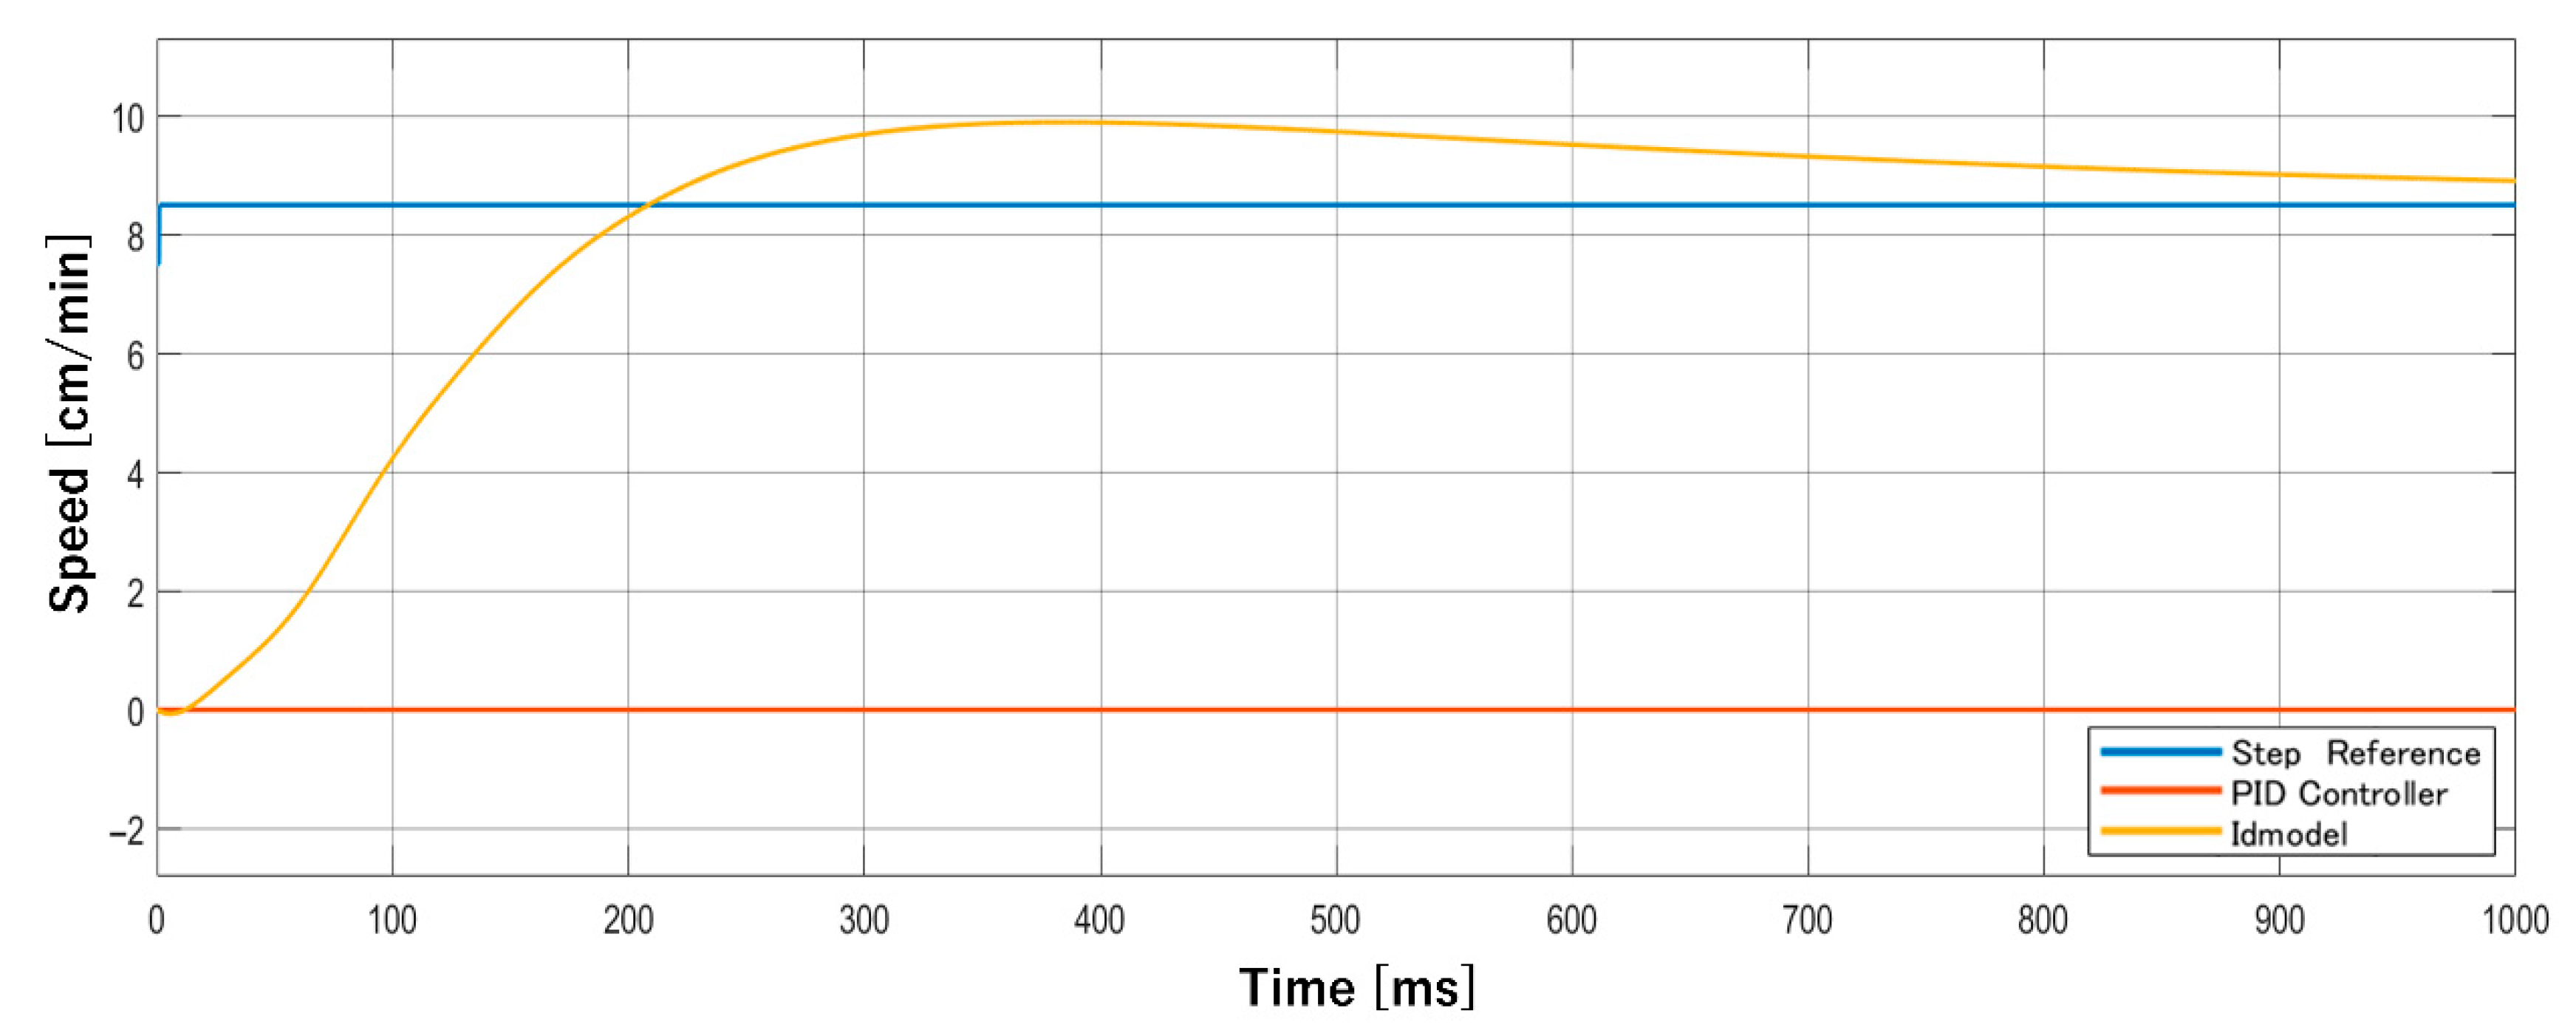
Both K P and K I are set to relatively low values to accommodate the system’s requirement for gradual changes in the output. To validate the stability of the closed-loop system, a step response analysis was conducted. In the simulation, the reference input was stepped from 7.5 cm/min to 8.0 cm/min, which corresponds to typical operating values observed in the experimental data (see Figure 10), ensuring the test scenario reflects realistic conditions. As illustrated in Figure 13, the system achieved stable convergence without significant overshoot. The response time was intentionally tuned to remain within a moderate range, preventing excessive or abrupt variations that could potentially compromise system stability.

4.3. Real-Time Welding Visual Feedback Control Experiments

The control experiments were conducted on the HALCON platform, where the welding speed was dynamically adjusted according to the arc’s center position feedback. Based on the fundamental experiments’ parameters, a series of experiments were conducted to verify the feasibility of the proposed control system. In the following descriptions, the x-axis labeled “Image” indicates the index of captured frames during the welding process. Since images were recorded at 50 ms intervals, this axis can also be interpreted as a time axis.
The image processing was implemented in HALCON and executed on a PC equipped with an AMD Ryzen 9 7950X CPU. Using HALCON’s count_seconds() function, the average processing time per frame was measured to be approximately 4.5 ms. The control action was updated every 50 frames (i.e., every 2.5 s), based on the extracted arc center trends. Since both the image processing and control execution were completed well within the 50 ms image acquisition interval, the system satisfies the real-time performance requirements for closed-loop operation.
The control experiment workflow is illustrated in Figure 14. Before the welding control experiments, a transmission serial is sent to verify whether the communication system is functioning properly. Once a valid response is received, the experiment proceeds. The image processing steps follow the method described earlier. The system checks whether the current welding speed is appropriate by calculating the deviation between arc’s center position and reference position. If the deviation exceeds a certain threshold, the reference position is adjusted, and the updated value is sent to the controller in real time. Due to the system’s response delay, the judgment is made after accumulating 50 images, so that the speed adjustment is based on more stable data. As a result, real-time monitoring of welding state and adaptive speed control can be achieved.
In the preliminary stage, a series of welding experiments were conducted using base metals with a root gap ranging from 5 mm to 7 mm. Figure 15 shows a result of 5.3 mm to 7.3 mm root gap. The reference arc’s center position was set to 400 px, and a control response of ±5 px was applied every 50 frames in accordance with changes in the arc’s center position. The initial welding speed was set to 9.6 cm/min. The evolution of key welding parameters is illustrated in Figure 15. Although Figure 15a shows an increase in the arc’s center position around Image 1700, no burn-through occurred. The welding process remained stable throughout the trial. However, due to the limited variation in root gap (5.3 mm to 7.3 mm), the required speed adjustments were relatively minor. Therefore, additional experiments with a wider gap range were performed to further evaluate the effectiveness and robustness of the proposed control method.
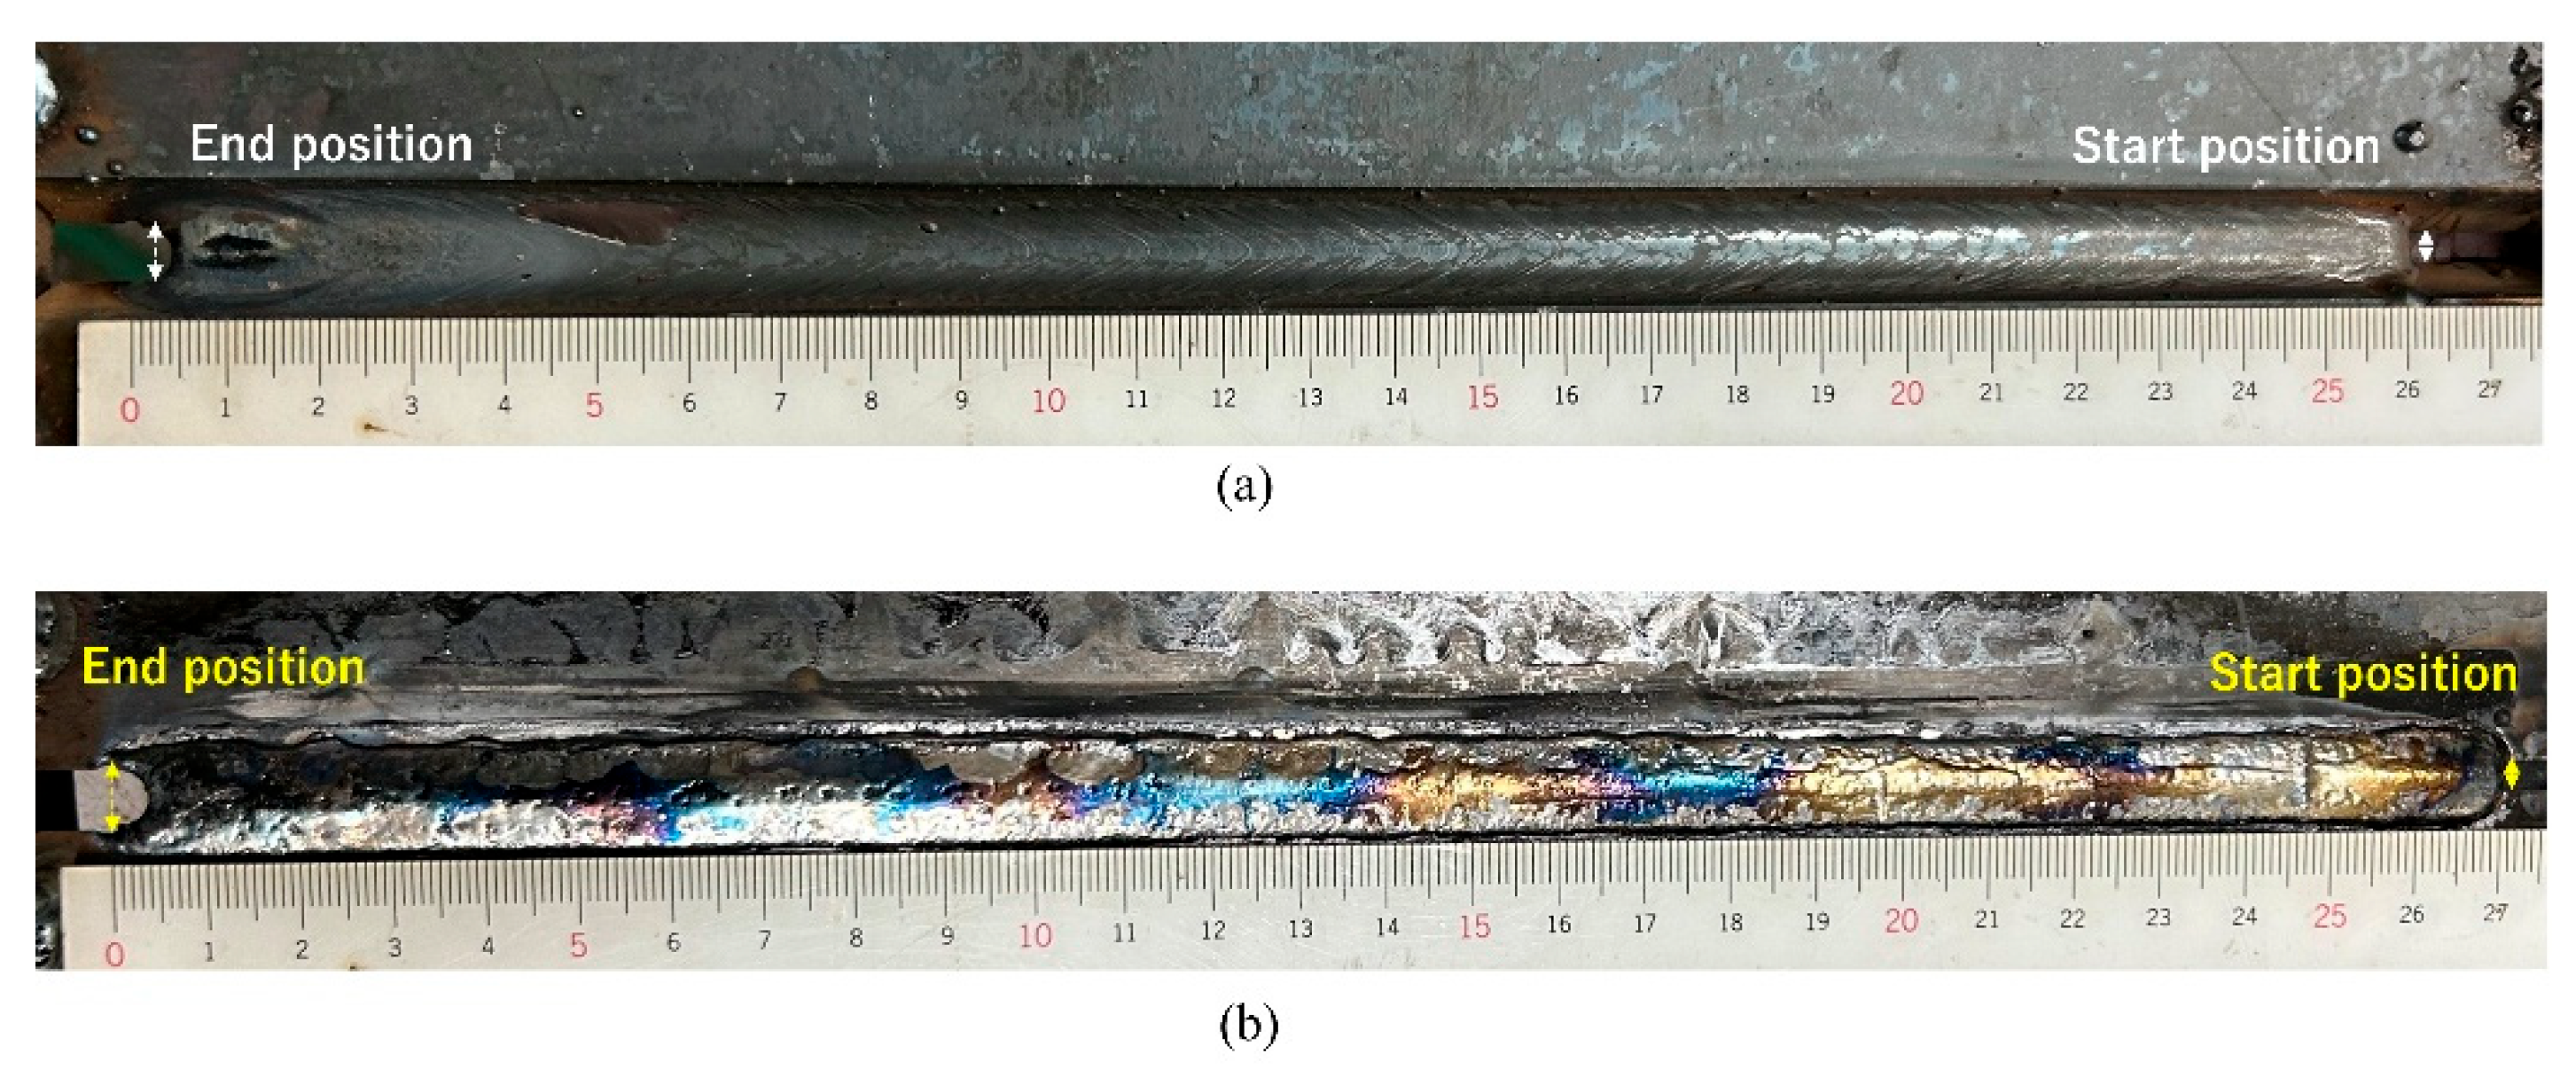
Building upon the previous trial, a series of welding experiments were conducted using a wider root gap range of 4 mm to 8 mm to further evaluate the adaptability of the proposed control strategy. To prevent overcorrection observed in earlier trials, the adjustment magnitude of the reference arc center was reduced to ±2 px per 50 frames. All other welding parameters remained unchanged. Across the entire set of experiments, the welding process remained stable, with no signs of lack of fusion or burn-through. Figure 16 presents one representative result, in which only two reference updates were required, and the arc’s center position consistently oscillated within a narrow range around the target value. This behavior was consistently observed across repeated trials, confirming the robustness and repeatability of the control system. The corresponding weld bead, shown in Figure 17, demonstrates uniform and continuous deposition, with a total length of approximately 26.1 mm. The initial root gap position is marked by the dashed line.
To demonstrate the effectiveness of the proposed closed-loop control system, a comparative welding experiment was conducted without feedback regulation. As shown in Figure 18, the weld bead under open-loop control exhibits severe instability. The bead profile is irregular, and clear signs of excessive heat input, such as discoloration and local collapse, can be observed, particularly near the end of the weld. Due to the severity of the defects, the welding process could not be completed along the entire seam. The experiment was terminated after the occurrence of burn-through, as continuing the process would have further compromised the integrity of the workpiece. Although only one open-loop result is presented, similar instability and weld defects were consistently observed across repeated trials under the same uncontrolled conditions. This comparison highlights the necessity of implementing visual feedback in maintaining weld consistency and reliability.

5. Analysis of Control Experimental Results and Discussion

5.1. Bead Fluctuation Analysis After Visual Feedback Control Implementation

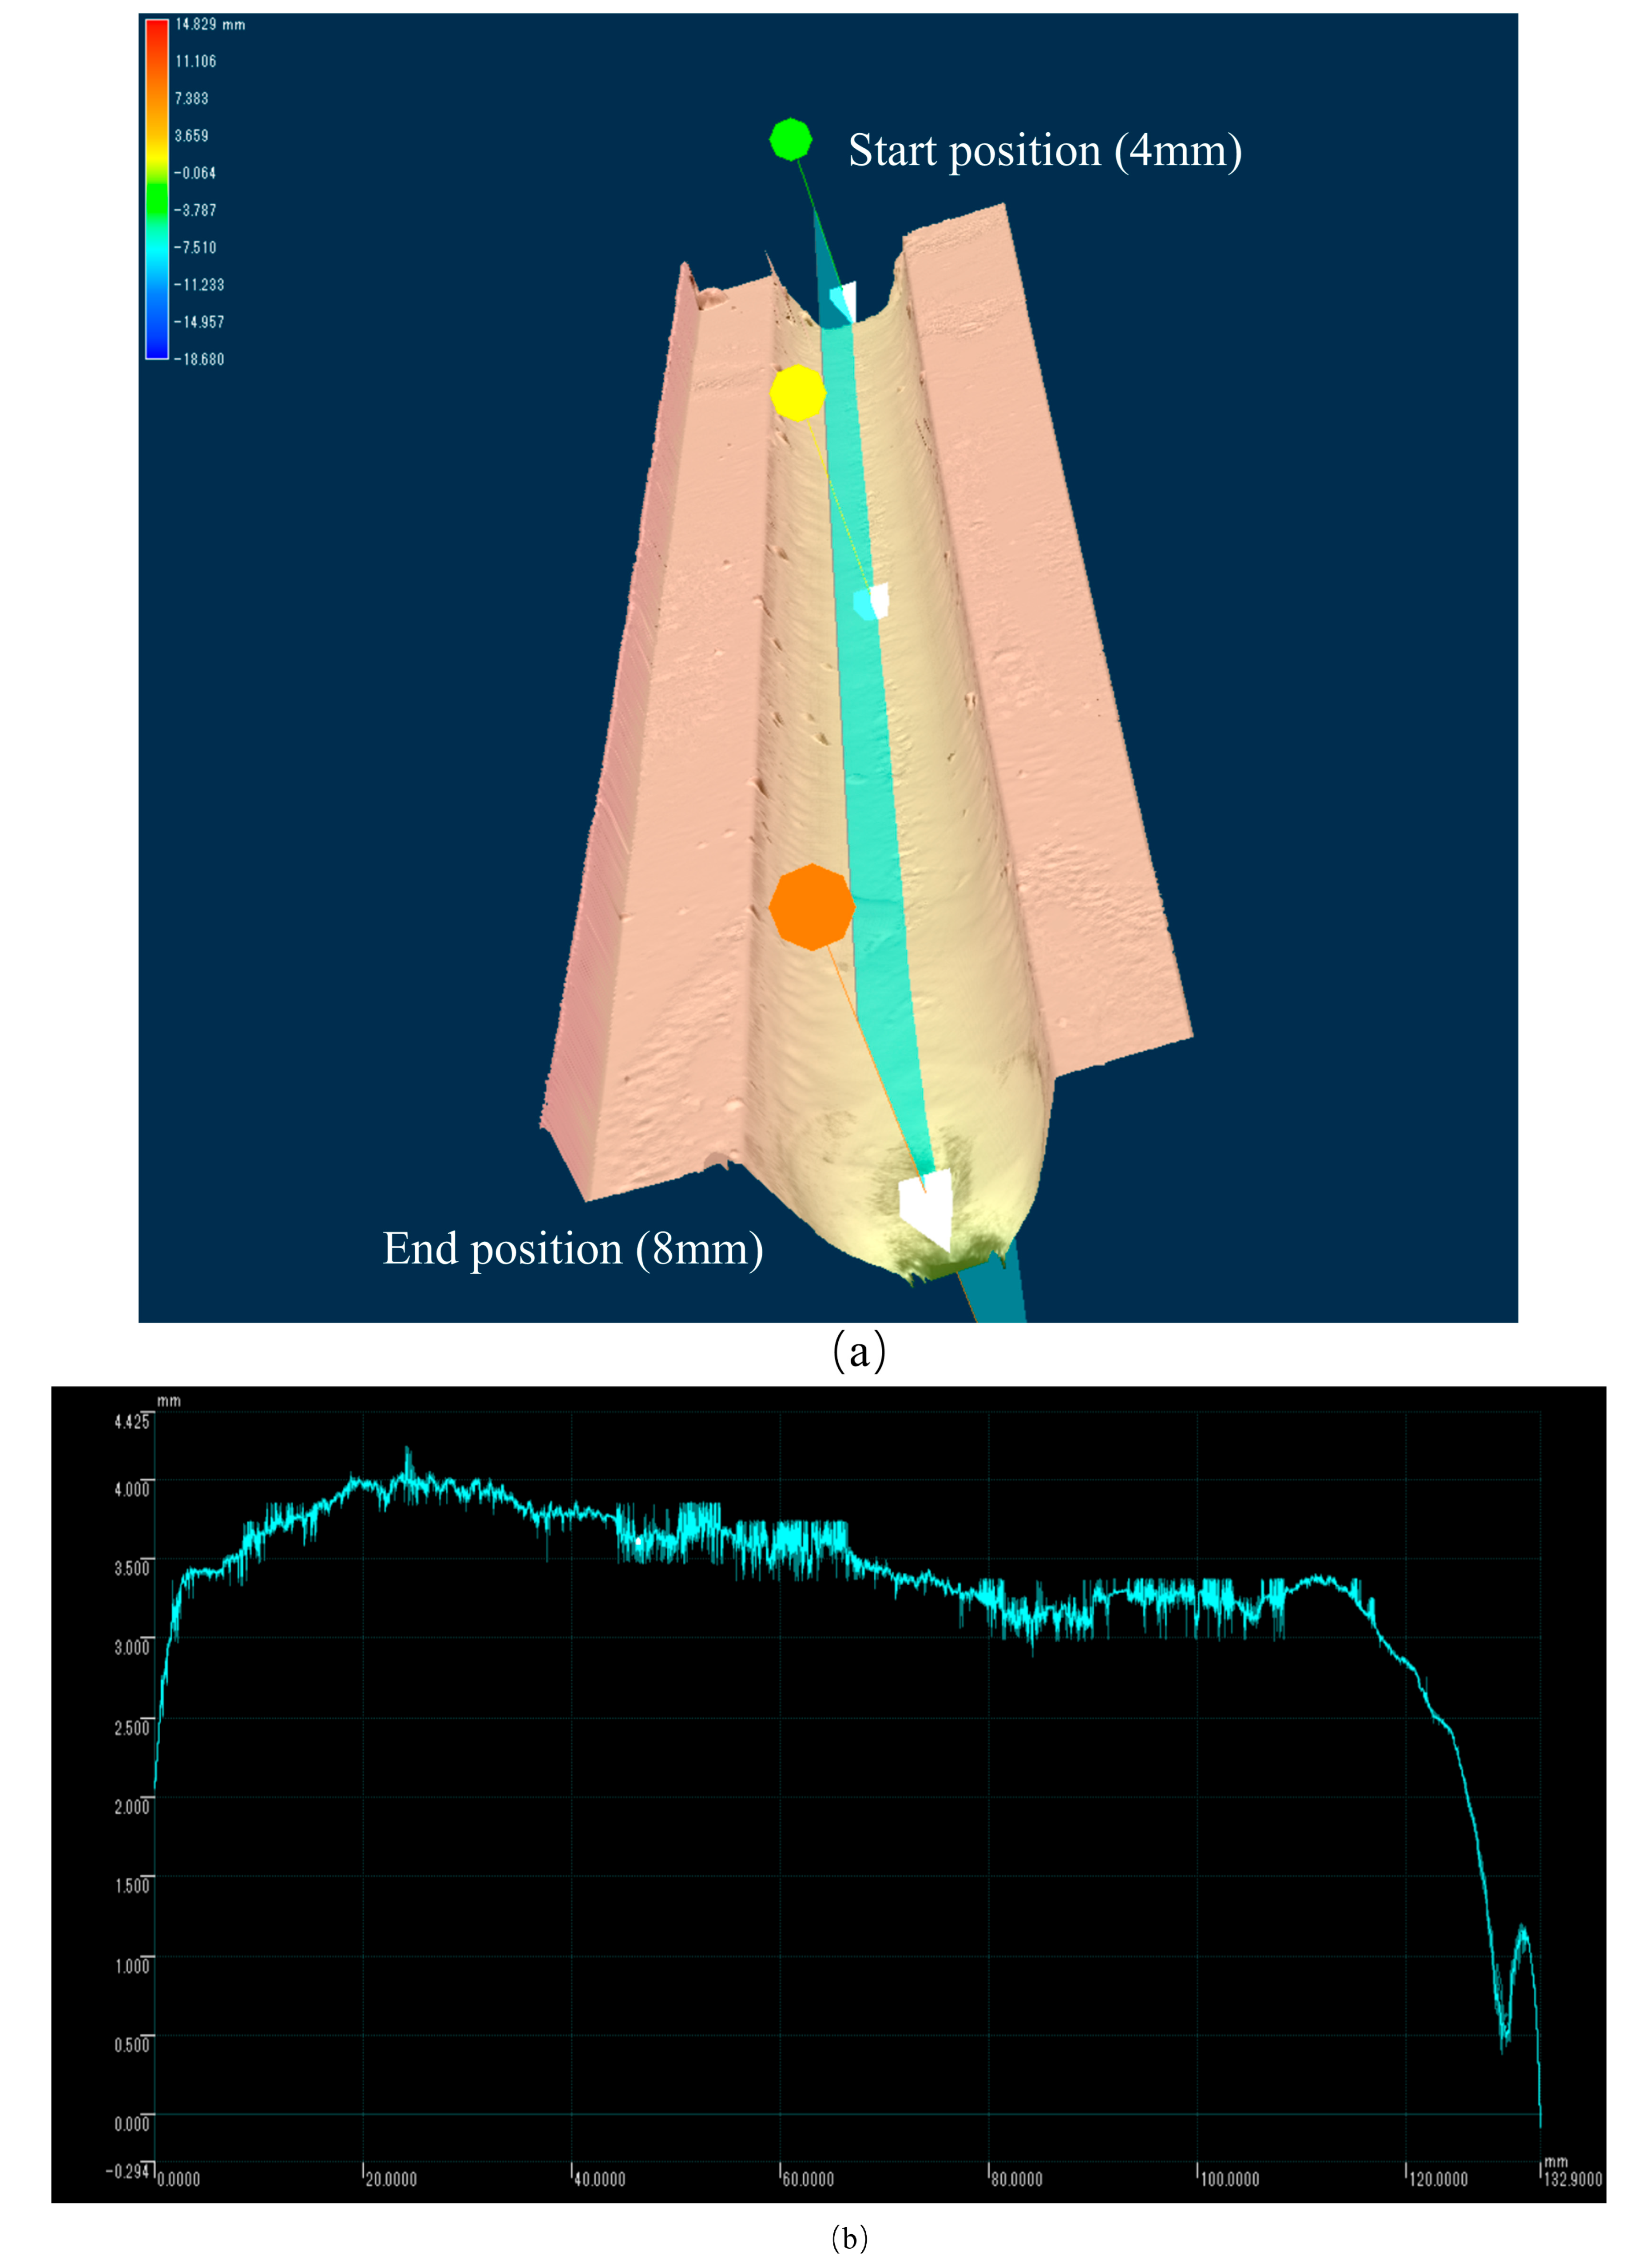
In this study, a visual feedback-based system was developed to maintain stable welding conditions under variable environments. Real-time image processing techniques were applied to dynamically analyze molten pool characteristics, enabling the clarification of the relationship between arc behavior and welding speed. To further evaluate the welding results achieved under active control, both the surface morphology and the smoothness of the weld bead were analyzed. A 3D laser displacement sensor (LJ-X8000A; KEYENCE CORPORATION, Osaka, Japan) was employed to scan the bead surface, with the centerline of the weld bead selected as the observation target. Depending on the model used, the system offers a Z-axis repeatability of about ±0.22 mm, enabling reliable detection of height deviations along the weld seam. Figure 19 presents the laser scanning results. Since the root gap gradually increased from 4 mm to 8 mm along the welding path, direct analysis of variance across the entire bead would be inappropriate. Therefore, the scanned data were divided into four equal segments after excluding the initial and final transitional regions corresponding to the unwelded areas. A total of 1950 valid sample points (from index positions 500 to 2449) were used, with 487 points per segment. For each segment, mean variance, mean standard deviation, and mean deviation were calculated. The first two metrics follow standard statistical definitions [31], while the third (mean deviation) is defined in this study as an auxiliary measure. The corresponding formulas are shown below:
Mean variance = 1 n 1 i = 1 n x i x ¯ 2
Mean standard deviation = 1 n i = 1 n x i x ¯ 2
Mean deviation = 1 n i = 1 n x i x ¯
where n denotes total number of samples, x i is an individual measurement value, and x ¯ denotes the mean value of all the measurement values. Specifically, the mean variance was calculated using the unbiased estimator (denominator n − 1), while the standard deviation used the biased form (denominator n), which is commonly adopted in practical signal processing.
Based on the calculated parameters, the variation of the weld bead could be analyzed, as displayed in Table 5. The mean variance quantifies overall fluctuation intensity and is sensitive to outliers. The mean standard deviation indicates the typical magnitude of variation and is derived from the variance. The mean deviation measures the average absolute offset and provides a robust indicator of data consistency. All three metrics exhibited a trend of larger fluctuation at the beginning, suggesting that the welding state was initially unstable. As the process continued, a gradual decrease in fluctuation was observed. At the 5–7 mm interval, all calculated values approached their minimum levels. The allowable height fluctuation can be defined with reference to the ISO 5817 Level B criterion (maximum excess weld metal ≤ 1.0 mm for 12 mm plate thickness) [32]. The average deviation (0.08 mm) and variance (0.02 mm2) were calculated by first analyzing each weld segment individually, then averaging across all segments. These metrics were calculated on segment-wise basis and averaged across all segments, so they are not directly related via s2. These results indicate that 92% of the allowable tolerance margin was preserved, reflecting consistent control of the weld pool throughout the process. Furthermore, the close agreement between the standard and absolute deviations suggests that the data distribution remained stable, with no obvious spiking or large disturbances observed. The bead exhibited uniform morphology and high consistency, indicating reliable welding quality. These findings show the proposed framework may provide a basis for developing control strategies to improve weld quality through continuous monitoring and feedback.
Compared to conventional seam tracking approaches, which primarily rely on groove geometry [33], arc signal fluctuations [34], or passive electrode tip tracking [35], the present method monitors and regulates molten pool behavior through arc center position deviations. While previous studies mainly focus on trajectory following or joint alignment, the proposed strategy emphasizes weld formation stability across varying root gaps. Experimental results suggest that this approach helps suppress bead fluctuation and adapt to joint variations in real time.

5.2. Experimental Observations and Practical Considerations

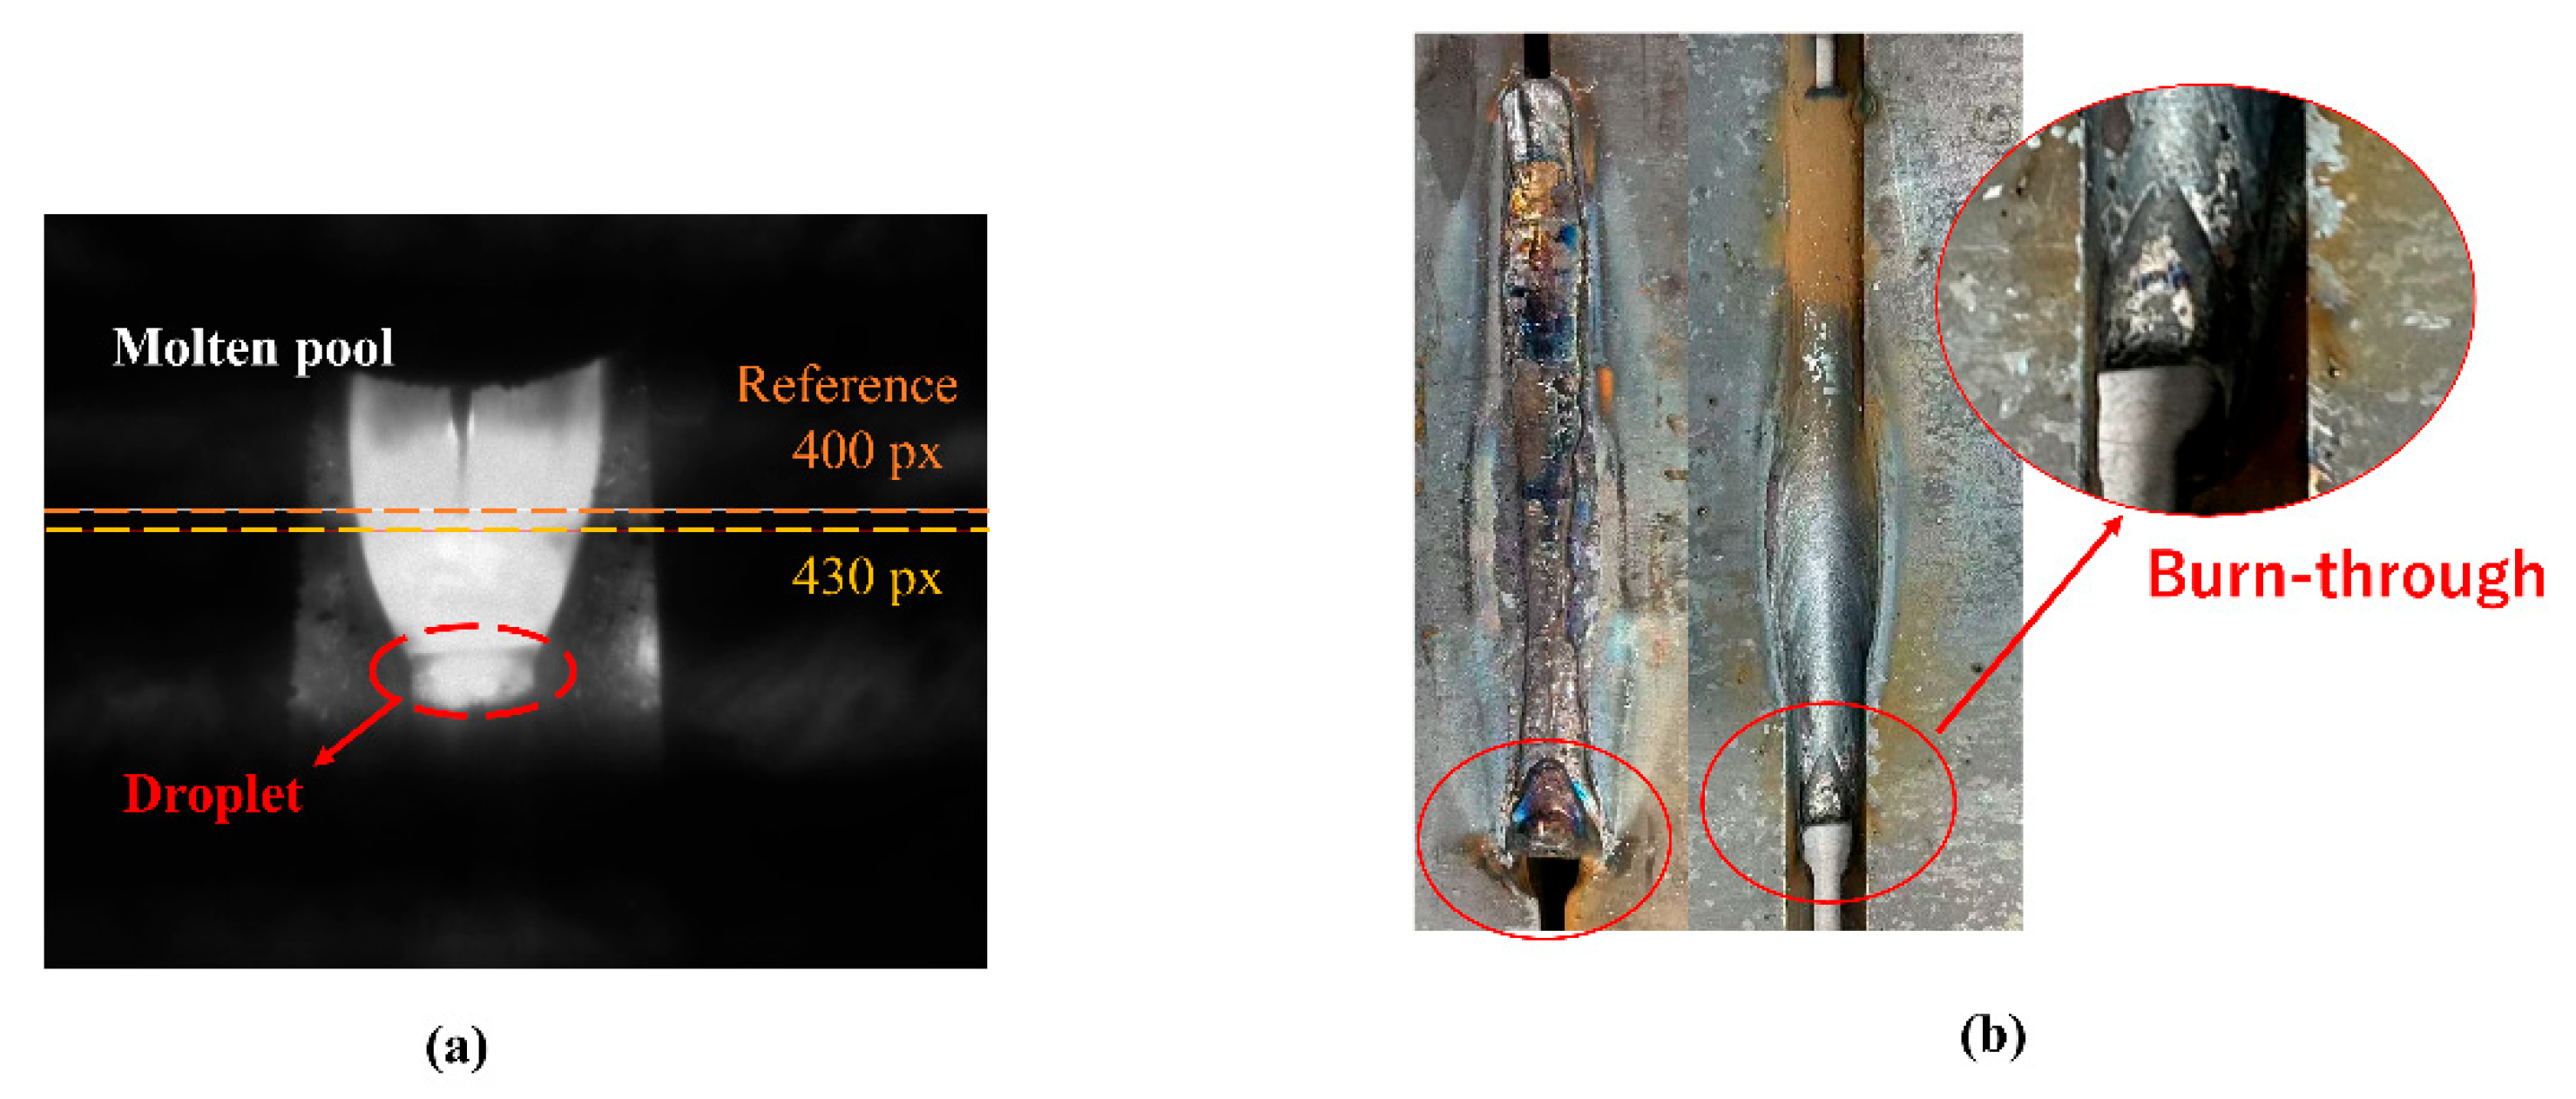
When implementing real-time control in pulsed MAG welding, it is crucial to avoid the occurrence of severe defects during welding. At the fundamental experiments stage, severe burnout phenomenon was detected as displayed in Figure 20. Once this condition develops, it becomes extremely difficult to recover and return to a stable welding process. Referring to Figure 5, that is because excessive welding speed increases droplet formation time, resulting in larger droplets that detach prematurely and may fall ahead of the molten pool. These oversized droplets can collapse under their own weight or electromagnetic forces, disrupting the arc and causing instability in the metal transfer process, ultimately degrading weld quality. In contrast, a near-burn-through condition, such as the one depicted in Figure 21, allows for timely corrective action. In such cases, adjusting the welding speed can promptly restore the molten pool to a stable state. The successfully controlled trend described above occurred during the previously discussed experiment with a root gap range of 5.3 mm to 7.3 mm. As shown in Figure 21b, no surface defects developed on the bead as a result of the observed phenomenon. In addition, the arc’s center position deviation from the reference position was approximately 30 px in the case of uncontrolled burn-through, whereas it was about 15 px in the case of controllable burn-through. This contrast further supports the suitability of the 400 px reference position.
Since the reference position depends on the system configuration (e.g., camera resolution and optical setup), it was necessary to perform empirical calibration under the specific conditions used in this study. In the experiments conducted, the reference value was set to 400 px. To verify this setting, average arc’s center positions were calculated from several preliminary experiments under stable welding conditions, as shown in Figure 22. The 4–5 mm, 5–7 mm, and 4–6 mm experiments involved gradual root gap transitions, while the 8 mm experiment maintained a constant root gap. In all cases, the overall average arc’s center position was close to 400 px, confirming the validity of the reference setting. Figure 23 demonstrates that, under varying root gap conditions, the 400 px target consistently aligns with the center of the arc in the molten pool. This supports the appropriateness of the 400 px reference, which provides a solid basis for implementing arc-centered control strategies in subsequent experiments.

6. Conclusions

This study developed a visual feedback control system specifically targeting the pulsed MAG welding of V-groove thick plates with gradually varying root gaps. The system addresses the difficulty of maintaining a stable welding state under varying gap conditions by dynamically adjusting the welding speed. As a result of the developed control system, uniform and defect-free weld beads were achieved. After reaching steady-state conditions, the fluctuation in weld height was reduced to only 0.08 mm, corresponding to an error of less than 8% relative to the 1 mm segment width, indicating minimal surface irregularities. The integration of real-time visual monitoring with closed-loop speed control significantly enhanced welding stability and overall weld quality. However, this study was limited to a single joint configuration (V-groove thick plates), and the image processing strategy—including the denoising and alignment method—was developed specifically for the current hardware and lighting conditions. Further generalization to other welding setups may require additional adaptation.
The main contributions are summarized as follows: First, a visual feedback system capable of the real-time monitoring of molten pool dynamics was developed. By incorporating HDR imaging techniques, the system enhanced brightness representation, enabling more precise image analysis. Second, the image processing pipeline combined Otsu thresholding, camera distortion calibration, and a principle-driven molten pool alignment method. Unlike learning-based approaches, the proposed method compensates for arc oscillations by directly adjusting welding speed based on arc displacement, offering a simple yet effective control mechanism. Third, a robust control framework was established, which adjusts welding conditions based on real-time visual feedback to ensure stable welding states throughout the process. Finally, the reference target value was determined not only through basic experiments under stable conditions but also validated by analyzing the resulting weld quality. This study proposes a geometry-aware control strategy that complements existing seam-tracking systems and demonstrates the potential of arc feature feedback in improving real-time welding stability. In future work, this system could be extended to multi-pass welding scenarios and integrated into robotic welding platforms to further improve process adaptability and online stability.

Author Contributions

Conceptualization and supervision, S.Y.; material preparation, S.Y.; experiments and data collection, Y.L., R.T. and K.O.; data analysis and manuscript draft writing, Y.L.; review and editing, S.Y., W.W. and Y.L.; discussion support, J.L. and Y.X. All authors have read and agreed to the published version of the manuscript.

Funding

This research was supported by the National Natural Science Foundation of China (No. 62303229), the Natural Science Foundation of Jiangsu Higher Education Institutions of China (No. 23KJB460024), the China Postdoctoral Science Foundation (No. 2021M701724), and the Japan Society for the Promotion of Science (No. 19K05076).

Data Availability Statement

The original contributions presented in this study are included in the article. Further inquiries can be directed to the corresponding author.

Conflicts of Interest

The authors declare no conflicts of interest.

References

  1. Scotti, F.M.; Pudenz, M.; Perrin, S.; Siewert, E.; Bergmann, J.P. Heat input control in horizontal lap joint welding through active wire preheating in GMAW-P. Weld. World 2024, 68, 893–904. [Google Scholar] [CrossRef]
  2. Li, T.; Cao, Y.; Zhang, Y. Analysis of weld pool region constituents in GMAW for dynamic reconstruction through characteristic enhancement and LSTM U-Net networks. J. Manuf. Process. 2024, 127, 573–588. [Google Scholar] [CrossRef]
  3. Cao, Y.; Zhang, Y. Control of DE-GMAW through human–robot collaboration. Weld. World 2025, 69, 1459–1468. [Google Scholar] [CrossRef]
  4. Wang, Z.; Zhang, C.; Pan, Z.; Wang, Z.; Liu, L.; Qi, X.; Mao, S.; Pan, J. Image Segmentation Approaches for Weld Pool Monitoring during Robotic Arc Welding. Appl. Sci. 2018, 8, 2445. [Google Scholar] [CrossRef]
  5. Montero Puñales, E.M.; Absi Alfaro, S.C. Stability on the GMAW Process. In Welding—Modern Topics; Kovacevic, R., Ed.; IntechOpen: London, UK, 2021; pp. 1–12. [Google Scholar]
  6. Ohara, T.; Kuroda, S.; Tanaka, M. A new approach to controlling metal transfer by dynamic modification in gas composition of arc atmosphere—Studies on pulsed gas MAG welding. Weld. World 2020, 64, 1185–1195. [Google Scholar] [CrossRef]
  7. Wang, B.; Hu, S.J.; Sun, L.; Freiheit, T. Intelligent welding system technologies: State-of-the-art review and perspectives. J. Manuf. Syst. 2020, 56, 373–391. [Google Scholar] [CrossRef]
  8. Zhai, P.; Xue, S.; Wang, J.; Tao, Y.; Chen, T.; Ji, S. Comparative Study of Droplet Transfer Modes on Appearance, Microstructure, and Mechanical Properties of Weld during Pulsed GMAW. Metals 2020, 10, 611. [Google Scholar] [CrossRef]
  9. Rezende, R.F.; Arias, A.R.; Lima, E.J.; Coelho, F.G.F. Pulsed GMAW-Based WAAM–Influence of droplet detachment mode on the geometry and mechanical properties of 308 L stainless steel. J. Adv. Join. Process. 2025, 11, 100286. [Google Scholar] [CrossRef]
  10. Pal, K.; Pal, S.K. Effect of Pulse Parameters on Weld Quality in Pulsed Gas Metal Arc Welding: A Review. J. Mater. Eng. Perform. 2011, 20, 918–931. [Google Scholar] [CrossRef]
  11. Pan, Y.; Li, C.; Shi, Y.; Dai, Y.; Wang, W. Predictive analysis and feature extraction of weld penetration in P-GMAW based on interpretable deep learning. J. Manuf. Process. 2024, 124, 1506–1518. [Google Scholar] [CrossRef]
  12. Chen, T.; Xue, S.; Zhai, P.; Wang, B.; Long, W. Study on Penetration Sensing Method Based on Pool Oscillation and Arc Voltage during Pulsed GMAW. Appl. Sci. 2020, 10, 2735. [Google Scholar] [CrossRef]
  13. Zhang, Y.M.; Song, H.S.; Saeed, G. Observation of a dynamic specular weld pool surface. Meas. Sci. Technol. 2006, 17, L9. [Google Scholar] [CrossRef]
  14. Pal, K.; Pal, S.K. Monitoring of Weld Penetration Using Arc Acoustics. Mater. Manuf. Process. 2011, 26, 684–693. [Google Scholar] [CrossRef]
  15. Bai, P.; Wang, Z.; Hu, S.; Ma, S.; Liang, Y. Sensing of the weld penetration at the beginning of pulsed gas metal arc welding. J. Manuf. Process. 2017, 28, 343–350. [Google Scholar] [CrossRef]
  16. Yu, R.; Han, J.; Bai, L.; Zhao, Z. Identification of butt welded joint penetration based on infrared thermal imaging. J. Mater. Res. Technol. 2021, 12, 1486–1495. [Google Scholar] [CrossRef]
  17. Cheng, Y.; Yu, R.; Zhou, Q.; Chen, H.; Yuan, W.; Zhang, Y. Real-Time sensing of gas metal arc welding process—A literature review and analysis. J. Manuf. Process. 2021, 70, 452–469. [Google Scholar] [CrossRef]
  18. Mattera, G.; Polden, J.; Norrish, J. Monitoring the gas metal arc additive manufacturing process using unsupervised machine learning. Weld. World 2024, 68, 2853–2867. [Google Scholar] [CrossRef]
  19. Li, C.; Wang, J.; Dai, Y.; Shi, Y. Experimental validation of saliency maps for understanding deep neural networks for weld penetration prediction. J. Manuf. Process. 2023, 88, 22–33. [Google Scholar] [CrossRef]
  20. Chen, C.; Lv, N.; Chen, S. Welding penetration monitoring for pulsed GTAW using visual sensor based on AAM and random forests. J. Manuf. Process. 2021, 63, 152–162. [Google Scholar] [CrossRef]
  21. Wang, W.; Yamane, S.; Wang, Q.; Shan, L.; Zhang, X.; Wei, Z.; Yan, Y.; Song, Y.; Numazawa, H.; Lu, J.; et al. Visual sensing and quality control in plasma MIG welding. J. Manuf. Process. 2023, 86, 163–176. [Google Scholar] [CrossRef]
  22. Yang, W.; Xiao, Y.; Shen, H.; Wang, Z. Generalized weld bead region of interest localization and improved faster R-CNN for weld defect recognition. Measurement 2023, 222, 113619. [Google Scholar] [CrossRef]
  23. Dai, W.; Li, D.; Zheng, Y.; Wang, D.; Tang, D.; Wang, H.; Peng, Y. Online quality inspection of resistance spot welding for automotive production lines. J. Manuf. Syst. 2022, 63, 354–369. [Google Scholar] [CrossRef]
  24. Xia, L.; Zhou, J.; Xue, R.; Li, X.; Liu, H. Real-Time seam tracking during narrow gap GMAW process based on the wide dynamic vision sensing method. J. Manuf. Process. 2023, 101, 820–834. [Google Scholar] [CrossRef]
  25. Xu, C.; Zhang, Z.; Li, Y.; Wang, P. Weld penetration control using passive vision sensing and image processing. J. Manuf. Process. 2021, 64, 679–688. [Google Scholar]
  26. Biber, A.; Sharma, R.; Reisgen, U. Robotic welding system for adaptive process control in gas metal arc welding. Weld. World 2024, 68, 2311–2320. [Google Scholar] [CrossRef]
  27. Wang, W.; Zhang, X.; Zhang, Z.; Yamane, S.; Wang, Q.; Shan, L.; Zheng, B.; Xia, Y.; Wang, D. Seam tracking and visual welding control in lap joint welding with Otsu’s thresholding and Gaussian line detection. Weld. World 2025, in press. [Google Scholar] [CrossRef]
  28. JIS G 3106:2017; Rolled Steels for Welded Structure. Japanese Standards Association: Tokyo, Japan, 2017.
  29. ISO 9692-1:2013; Welding and Allied Processes—Recommendations for Joint Preparation—Part 1: Manual Metal Arc Welding, Gas-Shielded Metal Arc Welding, Gas Welding and Beam Welding of Steels. International Organization for Standardization: Geneva, Switzerland, 2013.
  30. Ogata, K. Modern Control Engineering, 5th ed.; Prentice Hall: Upper Saddle River, NJ, USA, 2010. [Google Scholar]
  31. Hayter, A.J. Probability and Statistics for Engineers and Scientists, 4th ed.; Duxbury: Boston, MA, USA, 2012. [Google Scholar]
  32. ISO 5817:2014; Welding—Fusion-Welded Joints in Steel, Nickel, Titanium and Their Alloys—Quality Levels for Imperfections. International Organization for Standardization (ISO): Geneva, Switzerland, 2014.
  33. Li, D.; Wang, M.; Wang, S.; Zhao, H. Research and development of weld tracking system based on laser vision. Meas. Control. 2022, 55, 1124–1133. [Google Scholar] [CrossRef]
  34. Seo, B.W.; Kim, D.Y.; Kim, C.; Kim, S.; Cho, Y.T. Development of seam tracking device in asynchronous tandem welding with arc sensing. Sci. Rep. 2022, 12, 18637. [Google Scholar] [CrossRef]
  35. Sharma, N.; Gupta, P.; Bansal, A.; Yadav, A.; Singh, H. Image processing-based seam tracking system for robotic welding applications. Sensors 2021, 21, 84. [Google Scholar]
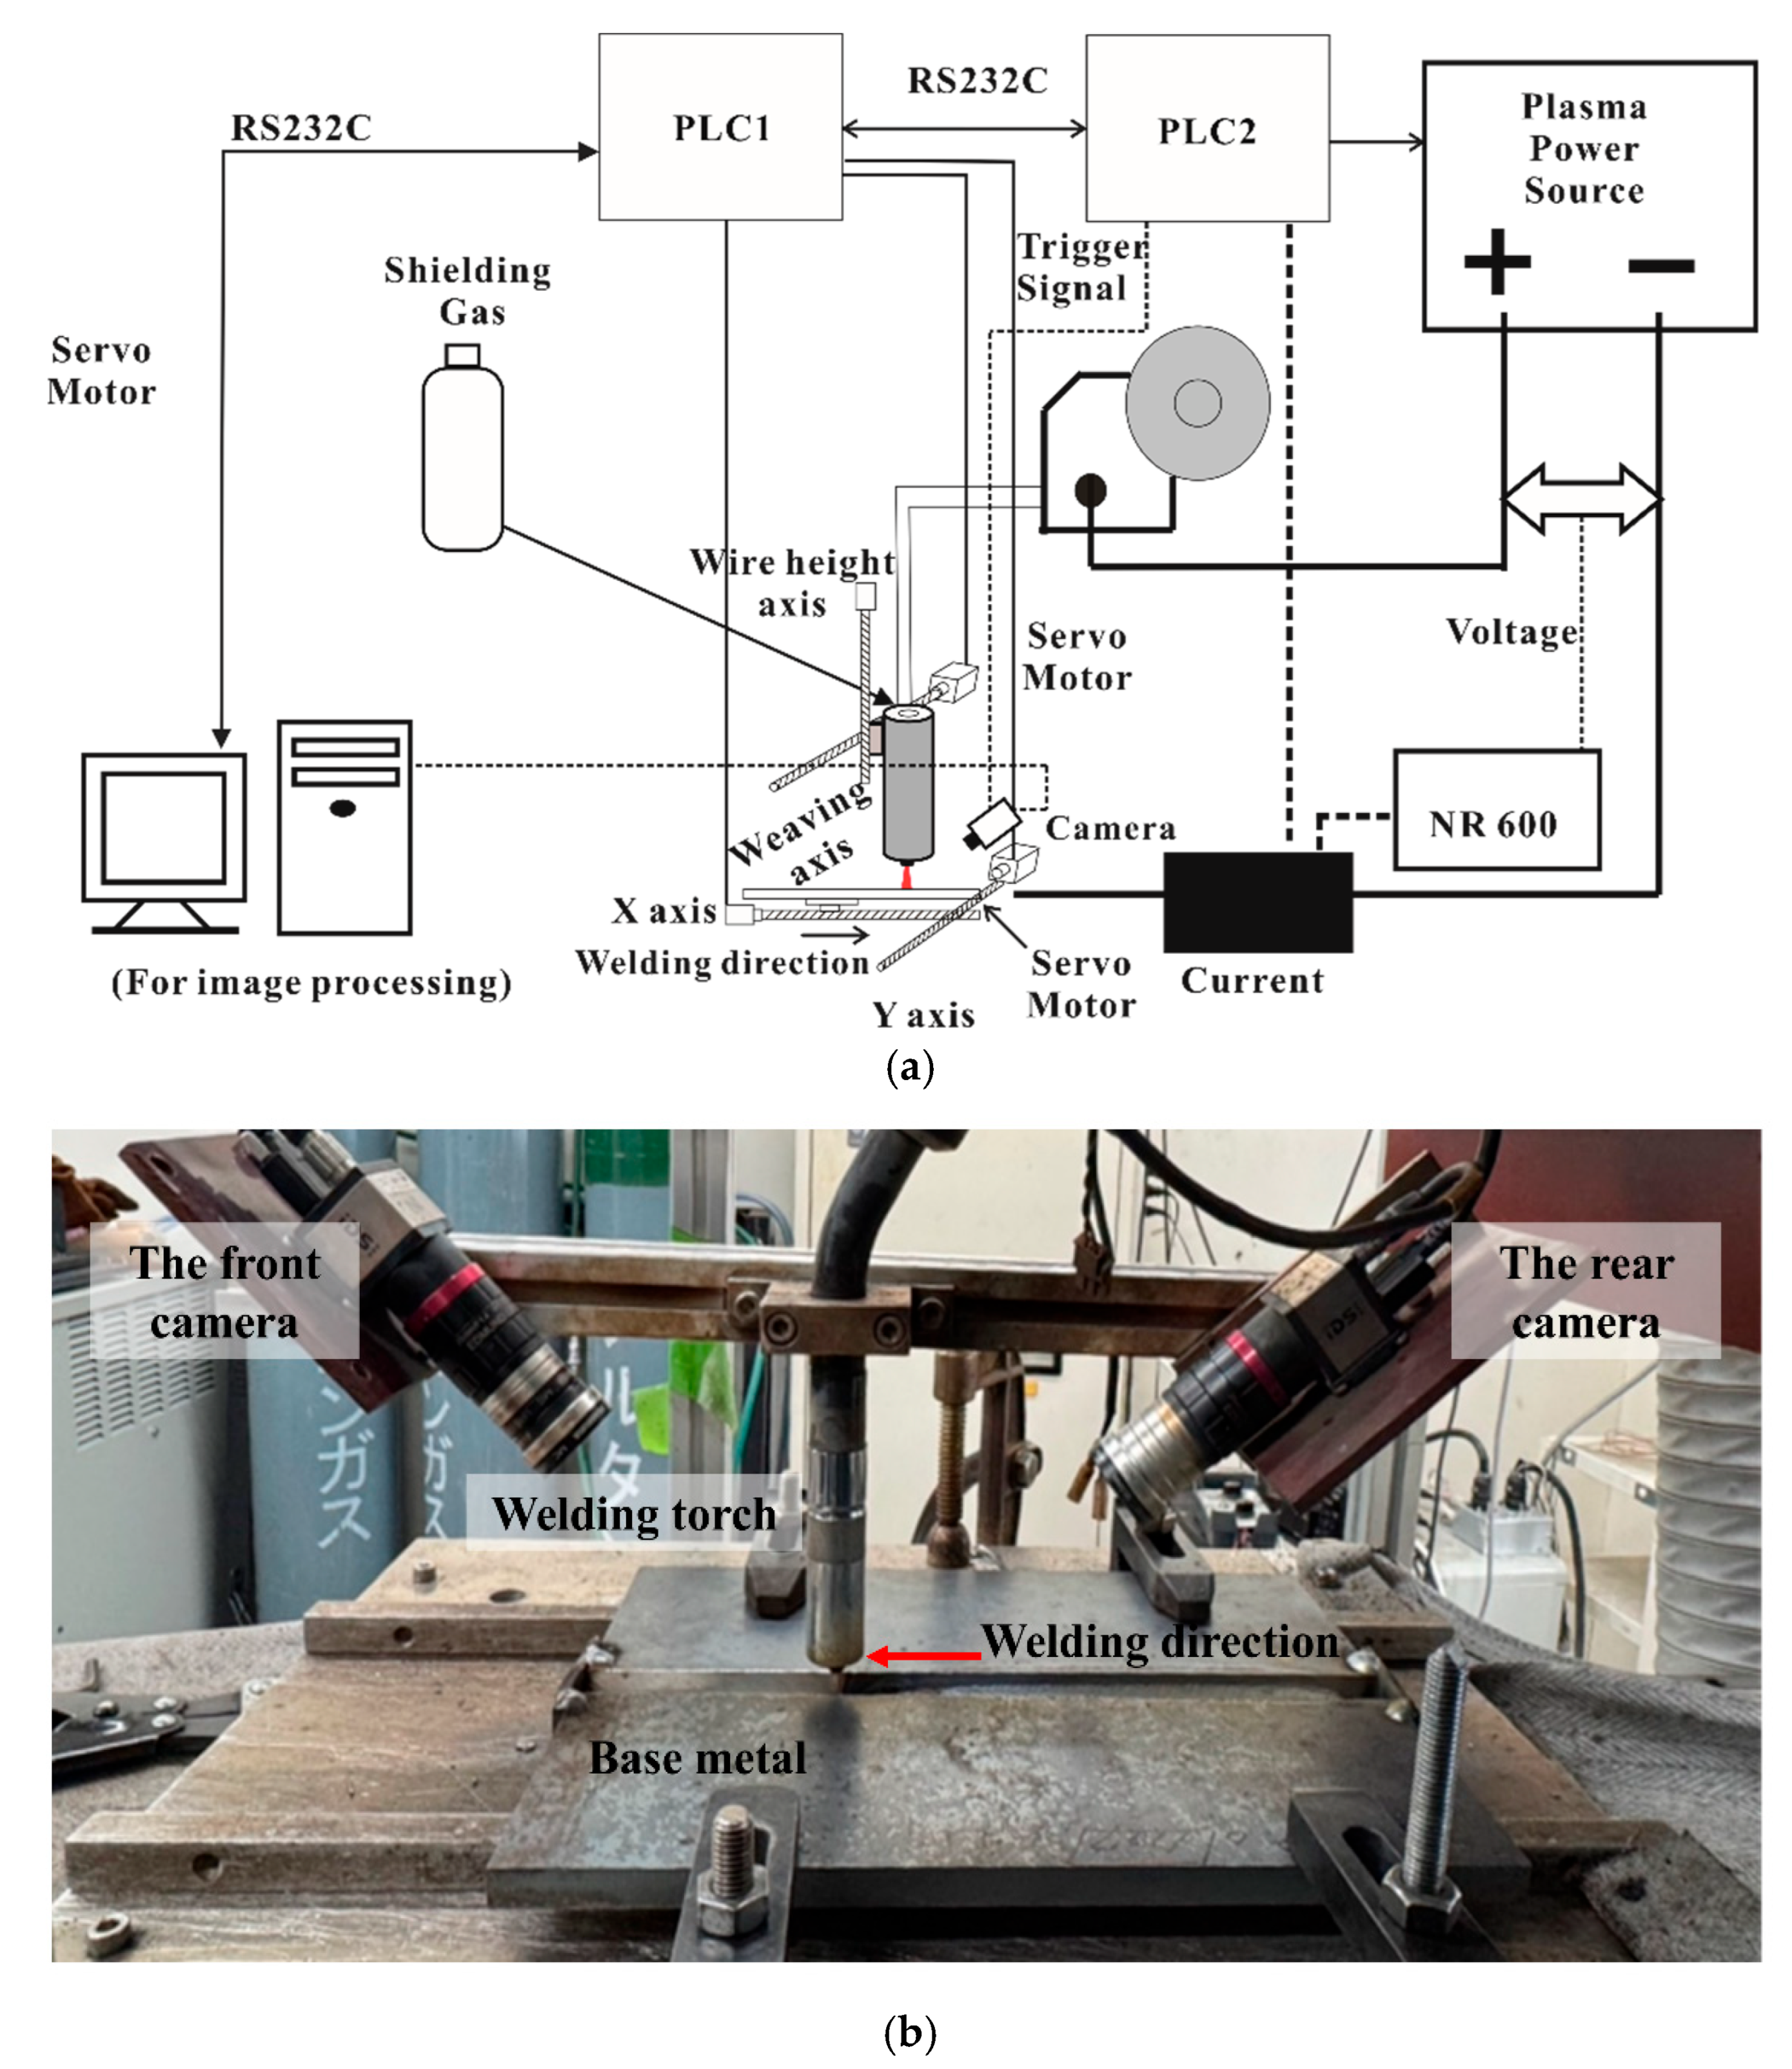
Figure 1. Overview of the designed welding control system: (a) designed system schematic; (b) general view of physical object; (c) block diagram of synchronization signals and data flow.
Applsci 15 08950 g001aApplsci 15 08950 g001b
Figure 2. The welding configuration from the front view.
Applsci 15 08950 g002
Figure 3. Relationship between the camera trigger signal and welding current.
Applsci 15 08950 g003
Figure 4. An ideal pulsed GMAW cycle: (a) droplet formation; (b) droplet detachment; (c) droplet transition; (d) arc maintenance.
Applsci 15 08950 g004
Figure 5. Variations in arc’s center position and molten pool characteristics under increasing welding speed: (a) at slower speed; (b) at suitable speed; (c) at higher speed.
Applsci 15 08950 g005
Figure 6. The procedure of correcting the molten pool’s movement in the images: (1–3) before transformation; (4–6) after transformation.
Applsci 15 08950 g006
Figure 7. An example of arc center detection: (a) original image; (b) output of Otsu’s thresholding; (c) extracted high-intensity region, including both arc and molten pool; (d) retained high-intensity region after background removal; (e) arc region obtained through further segmentation; (f) calculated center of the arc region.
Applsci 15 08950 g007
Figure 8. An example of detecting a root gap.
Applsci 15 08950 g008
Figure 9. Control simulation system block diagram.
Applsci 15 08950 g009
Figure 10. Relationship between welding speed and arc’s center position.
Applsci 15 08950 g010
Figure 11. Step response of the identified transfer function.
Applsci 15 08950 g011
Figure 12. Pole positions of the identified transfer function.
Applsci 15 08950 g012
Figure 13. The step response image.
Applsci 15 08950 g013
Figure 14. Control experiment workflow for monitoring molten pool image and visual-based control.
Applsci 15 08950 g014
Figure 15. Variation of key parameters during control experiment (root gap: 5.3–7.3 mm): (a) relationship among arc’s center position, reference position, and welding speed; (b) root gap detection results.
Applsci 15 08950 g015
Figure 16. Variation of key parameters during control experiment (root gap: 4.0–8.0 mm): (a) relationship among arc’s center position, reference position, and welding speed; (b) root gap detection results.
Applsci 15 08950 g016
Figure 17. The final bead appearance of the control experiment (root gap: 4.0 mm–8.0 mm): (a) face side of the weld bead; (b) root side of the weld bead.
Applsci 15 08950 g017
Figure 18. Weld appearance under open-loop (uncontrolled) condition: (a) back side of the weld showing discoloration and burn-through; (b) front side of the same weld seam, with irregular bead morphology and local collapse.
Applsci 15 08950 g018
Figure 19. Laser scanner’s scanned results: (a) 3D profile of the weld bead; (b) height variation along the centerline indicated by the blue line in (a).
Applsci 15 08950 g019
Figure 20. Visualization of molten pool image and potential defects: (a) uncontrolled burn-through image; (b) associated defects.
Applsci 15 08950 g020
Figure 21. Controlled burn-through and subsequent weld bead formation: (a) controllable burn-through molten pool image; (b) good weld bead after control.
Applsci 15 08950 g021
Figure 22. Average arc center positions during stable welding.
Applsci 15 08950 g022
Figure 23. Images showing 400 px position in a stable molten pool under different root gap conditions.
Applsci 15 08950 g023
Table 1. Typical chemical composition of SM400A steel [wt.%].
ElementC (max)Mn (min)P (max)S (max)
Content0.23≥2.5C0.0350.035
Table 2. Typical chemical composition of KC-26 filler wire [wt.%].
ElementCSiMnPSTi
Content0.060.81.530.0140.010.18
Table 3. Welding conditions validated through fundamental experiments.
Root Gap [mm]45678
Welding speed
[cm/min]
11.29.908.808.007.30
Wire feeding speed [mm/s]9797979797
Table 4. Optimal value of K P and K I .
Proportional   Gain   ( K P ) Integral   Gain   ( K I )
Optimal value 1.5768 × 10 4 2.7476 × 10 7
Table 5. Calculated parameters for analyzing the fluctuation of the bead.
4 mm–5 mm5 mm–6 mm6 mm–7 mm7 mm–8 mmAverage
Mean variance [mm2]0.017780.0004260.0087910.051650.01966
Mean standard deviation [mm]0.09430.01460.06630.16070.0840
Mean deviation [mm]0.09430.01460.06630.16070.0840
Disclaimer/Publisher’s Note: The statements, opinions and data contained in all publications are solely those of the individual author(s) and contributor(s) and not of MDPI and/or the editor(s). MDPI and/or the editor(s) disclaim responsibility for any injury to people or property resulting from any ideas, methods, instructions or products referred to in the content.