Article

Elevated Concentrations of Carbon Dioxide (CO2) on the Harbechy Plateau (Moravian Karst) Reveal a Gas-Rich Soil Layer (GRSL)

1
Department of Geological Sciences, Faculty of Science, Masaryk University, Kotlářská 267/2, 61137 Brno, Czech Republic
2
Czech Geological Survey, Leitnerova 22, 65869 Brno, Czech Republic
3
Czech Geological Survey, Klárov 131/3, 11821 Praha 1, Czech Republic
4
Department of Biology, Faculty of Education, Masaryk University, Poříčí 623/7, 60300 Brno, Czech Republic
5
Institute of Geonics, Academy of Sciences of the Czech Republic, Studentská 1768/9, 70800 Ostrava-Poruba, Czech Republic
6
Nature Conservation Agency of the Czech Republic, Svitavská 29, 67801 Blansko, Czech Republic
*
Author to whom correspondence should be addressed.
Appl. Sci. 2025, 15(16), 8907; https://doi.org/10.3390/app15168907
Submission received: 21 June 2025 / Revised: 27 July 2025 / Accepted: 30 July 2025 / Published: 13 August 2025
(This article belongs to the Section Ecology Science and Engineering)

Abstract

Precipitation leaches soil organic matter (SOM), transporting it downward where it accumulates at the soil–bedrock interface. Intensive agriculture, particularly tillage, accelerates this process. Microbial decomposition of SOM generates CO2, forming a gas-rich soil layer (GRSL)—a phenomenon long hypothesized but never directly confirmed until now. Drilling on the Harbechy Plateau (Moravian Karst) revealed a GRSL with a thickness of ~0.8 m, CO2 concentrations averaging 1.5–3 vol. % (peaks of 4–6 vol. %), and isotopic signatures (δ13C) indicating a mix of biogenic (−25‰) and atmospheric (−8‰) CO2. These findings necessitate re-evaluation of carbon cycling models in karst agroecosystems.

1. Introduction

CO2 links soil respiration and photosynthesis as part of the global carbon cycle [1]. Beyond its biological role, CO2 influences weathering processes [2] and regulates natural water pH [3]. In soils, CO2 originates from root respiration [4] and SOM microbial decomposition [5,6]. The main elements of SOM are C, H, O; minor elements are N, P, S [7]. For example, the chemistry of decomposition of polysaccharide (cellulose) is described by the summary equation:
( C 6 H 10 O 5 ) n + 6 n   O 2 6 n   C O 2 + 5 n   H 2 O
The CO2 pathway of this process (Equation (1)) is cellulose → aldehydes/ketones → carboxylic acids → CO2 [8,9]. For lignin, the pathway is: lignin → phenols → aldehydes → humic substances → carboxylic acids → CO2 [10]. CO2 production in soil exhibits an exponential dependence on temperature and a linear relationship with soil moisture [11]. CO2 drives carbonate dissolution, governing speleothem formation [12] and terrestrial-to-ocean calcium transfer. Forward/reverse reactions controlling speleothem growth/dissolution are
C a C O 3 + C O 2 + H 2 O     C a 2 + + 2   H C O 3
Subprocesses covered in Equation (2) are discussed in more detail in [13] and references therein.
The epikarst hydraulic barrier supports the formation of perched aquifers [14] and may trap SOM, facilitating GRSL formation. Recent soil drilling down to the soil–bedrock interface (to a depth of 2 to 3 m) proved the GRSL with a CO2 concentration up to 6 vol. %. We hypothesize that the moderate temperatures (8–9 °C, at >1.5 m depth) derived from the mean annual temperature in the studied region facilitate SOM degrading to CO2. CO2 accumulates at the soil–bedrock interface, forming the GRSL. Supporting evidence includes (1) elevated CO2 levels in Harbechy Cave lying beneath the studied soils [15], (2) CO2 concentration gradient in soil profile, (3) discrepancies between drip-water-modeled CO2 concentrations [16,17,18] and topsoil-measured CO2 [19].
The goal of this work is (1) to characterize the GRSL through field and laboratory measurements, (2) to find conditions necessary for the formation of the GRSL, (3) to detail a conceptual model, and (4) to summarize the consequences of GRSL creation. To meet the objectives of the work, we chose a multi-instrumental approach using methods such as electric resistivity tomography (ERT), soil drilling (SD), X-ray diffractometry (XRD), scanning electron microscopy with energy dispersive X-ray analysis (SEM/EDXA), field IR spectrometry, gas chromatography, analysis of stable isotopes, and hydrogeochemical modeling.

2. Site of Study

The Moravian Karst (MK) is by far the most extensive karst area in the Czech Republic [20]. It is built mainly from middle Devonian to Lower Mississippian limestones. These limestones were deposited in two formations. The Eifelian to Frasnian Macocha Fm. is made up of more than 1000 m of limestone and dolomite deposits of the cyclic reef of Vilémovice Lst. and lagoonal Lažánky Lst. These older shallow-water deposits are overlain by Famenian to Viséan Líšeň Fm. They comprise calciturbidites of the Hády-Říčka Lst. and more shallow-water Křtiny Lst. Granitoid rocks of the Brno massif (proterozoic age) together with mostly Givetian basal clastics form the basement of this limestone sequence. This paraautochthonous unit is thrust over Variscan flysch units (so-called Culmian facies). Younger strata, which form a patchwork of small erosional relicts, complete the sedimentary evolution of the Moravian Karst. These include Jurassic sandstones and limestones, Cretaceous sediments of the Rudice beds, and several cycles of Miocene deposits. The youngest sediments that cover much of the older deposits are Pleistocene (Middle and Upper) loess and loess loam deposits. These sediments usually fill older valleys, karrens, and other karst phenomena. The area focused on this study, i.e., the Harbechy-Vilémovice plateau, is built mainly of the Vilémovice Lst. of the Macocha Fm. Only a small portion of the plateau in the west is built from the underlying Lažánky Lst. and in the east from overlying Křtiny Lst. Limestones are gently dipping toward the east and are folded into NNE-SSW trending, almost upright folds with wavelengths of hundreds of meters. The fault network is dominated by two systems of faults (NE-SW and NW-SE), which were crucial for underground water migration, karstification, and cave generation. These two systems are apparent from the sinkhole distribution. The Harbechy Cave lies on a NE-SW-orientated series of 15 sinkholes. A map of the study site with part of the Harbechy Plateau is shown in Figure 1. ERT profiles and positions of individual soil boreholes are also indicated.
Based on Köppen [21], MK, as part of the Czech Republic, belongs to the humid continental climate zone Dfb. Quitt [22] further divided this climate into seven climate groups, with MK itself falling into groups MT3 and MT5 (moderately warm areas) and CH7 (cold climate area). According to the Nature Conservation Agency of the Czech Republic [23], the MK can be divided into three parts, where the southern part, the central part, and the northern part show mean temperatures of 8.4 °C. 7.7 °C, and 6.5 °C and precipitation of 550 mm, 600 mm, and 700 mm, respectively. Temperatures could be slightly higher on karst plateaus. Data from the Macocha Weather Station on the neighboring Macocha Plateau (2 km as the crow flies with almost the same altitude, mean of 499.3 m for Harbechy Plateau vs. mean of 500.4 m for Macocha Plateau) show a mean temperature T(average) = 10.2 °C with a total precipitation of 490 mm, calculated for the period between 2019 and 2025.

3. Methods

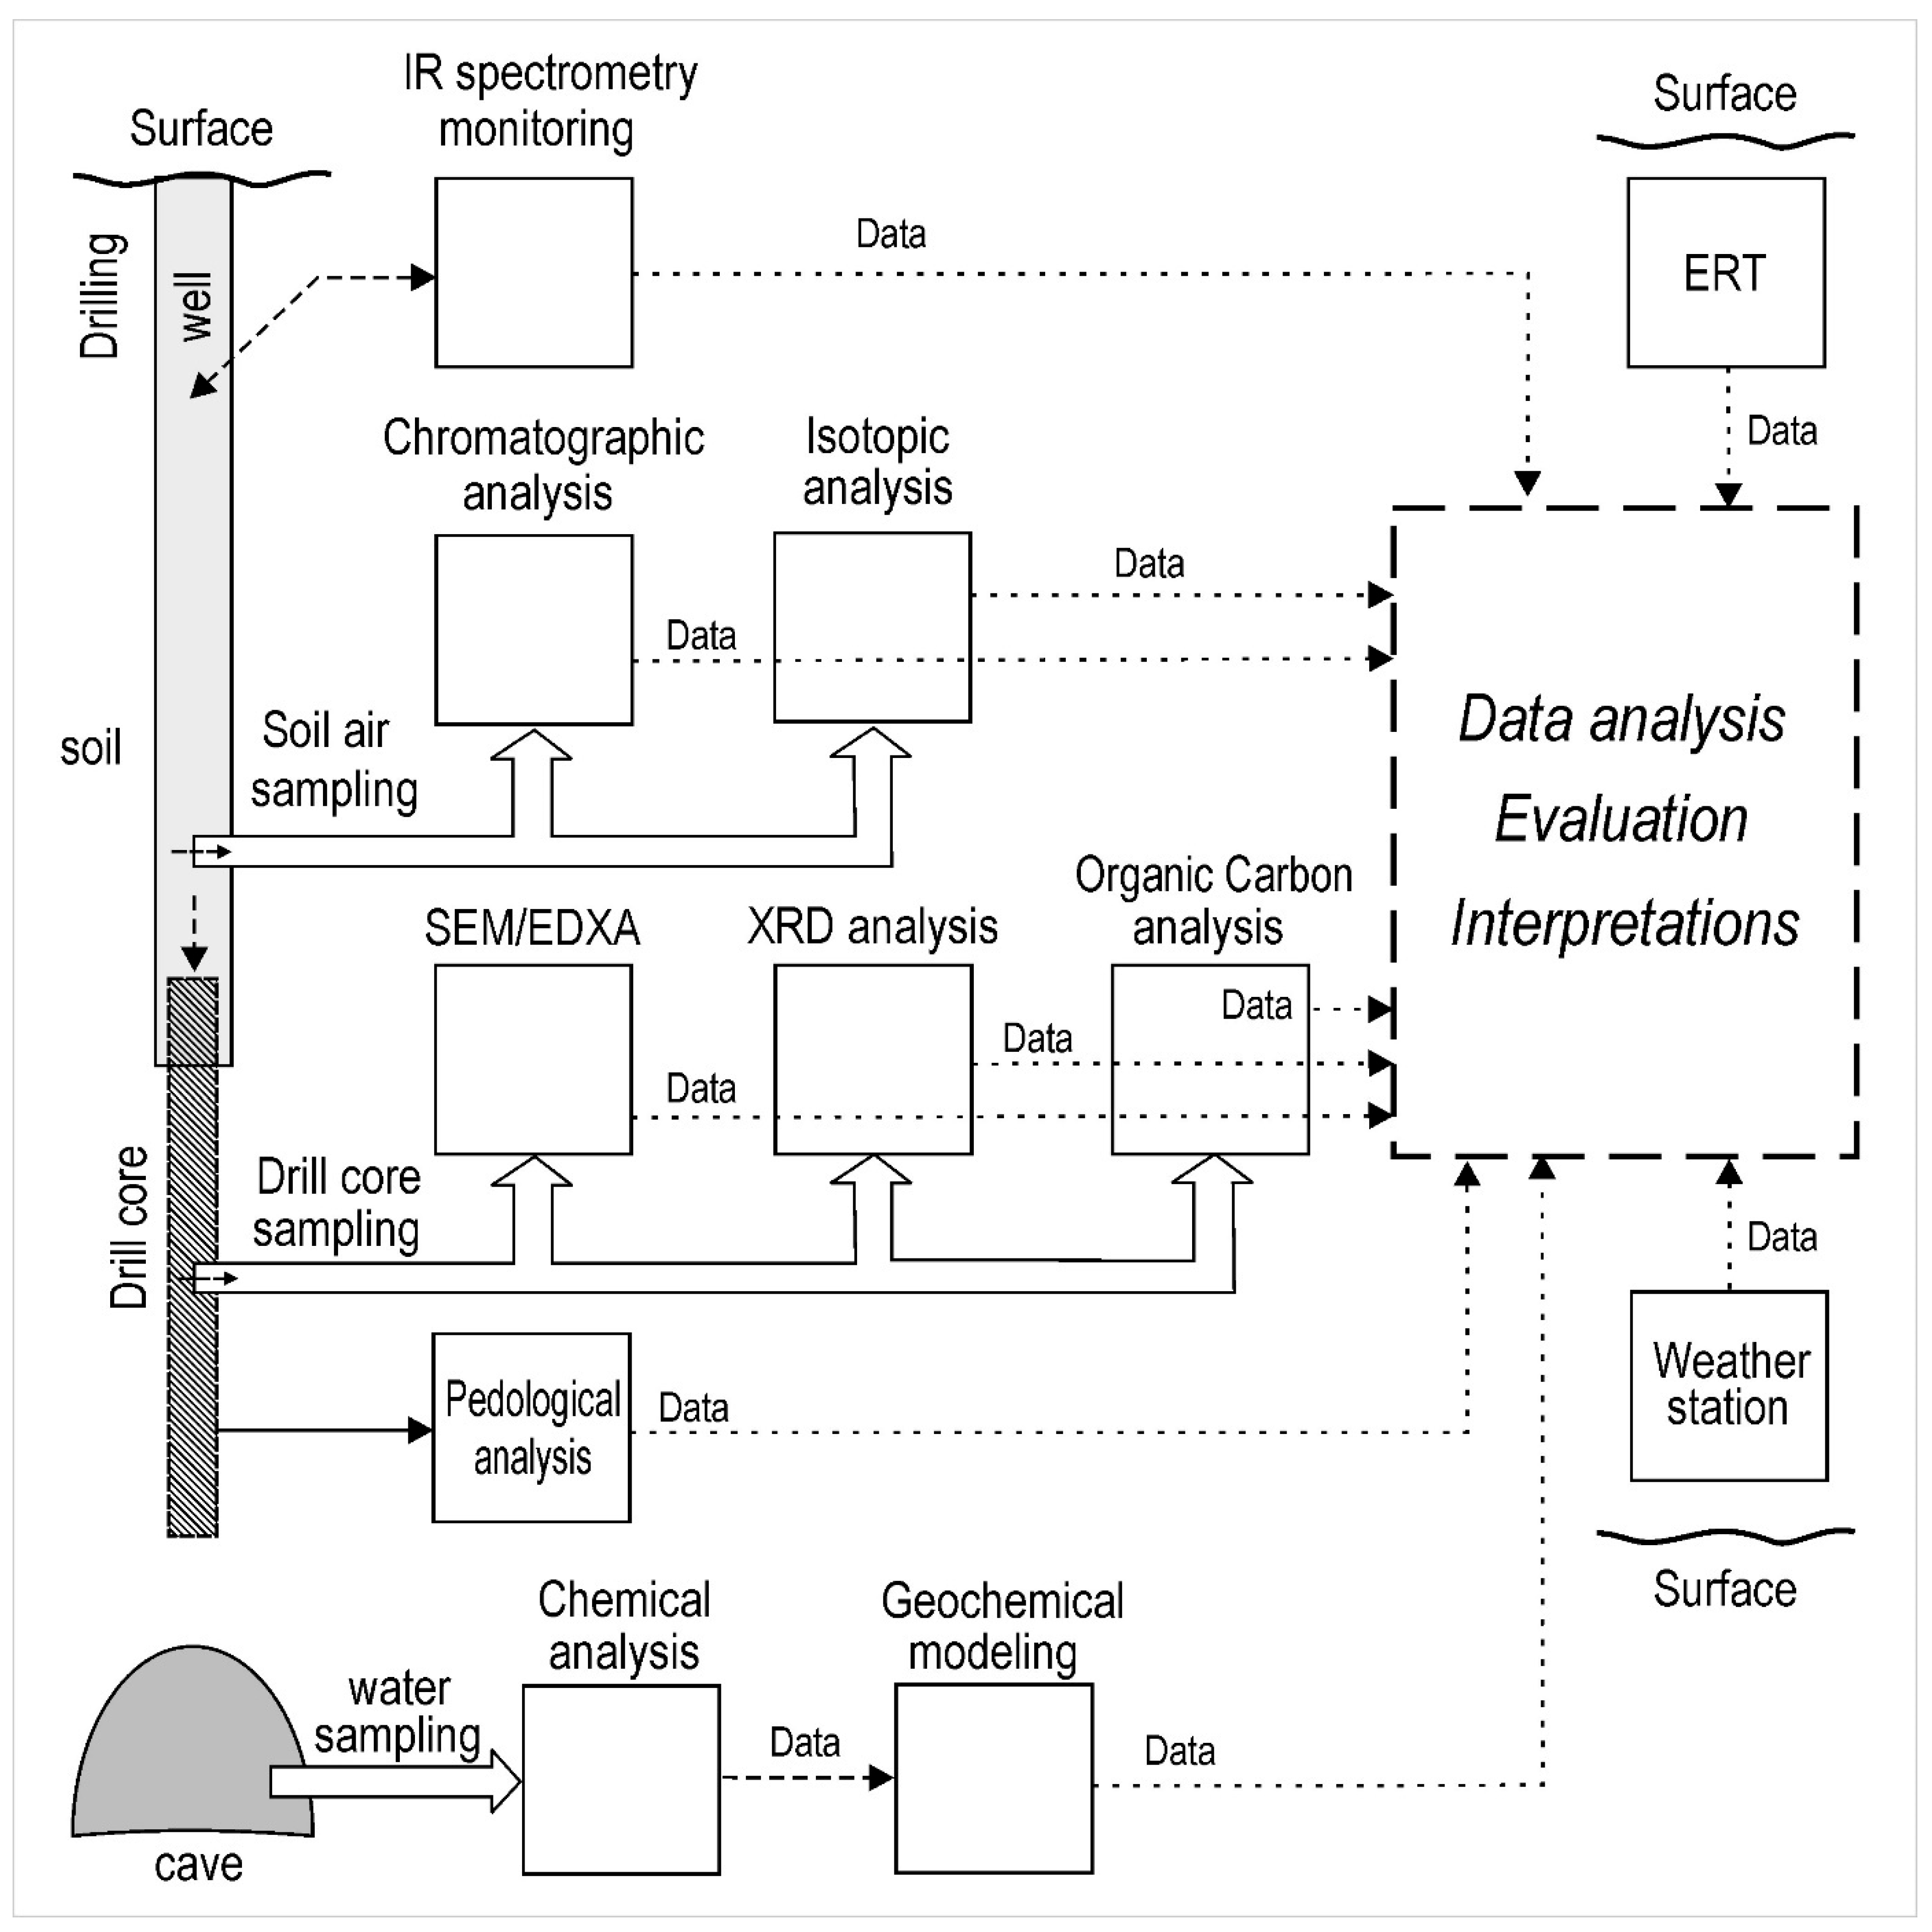
A multi-instrumental approach was applied for the characterization of well air and the conditions of GRSL formation. The hierarchy of the used method is depicted in Figure 2.

3.1. Electrical Resistivity Tomography

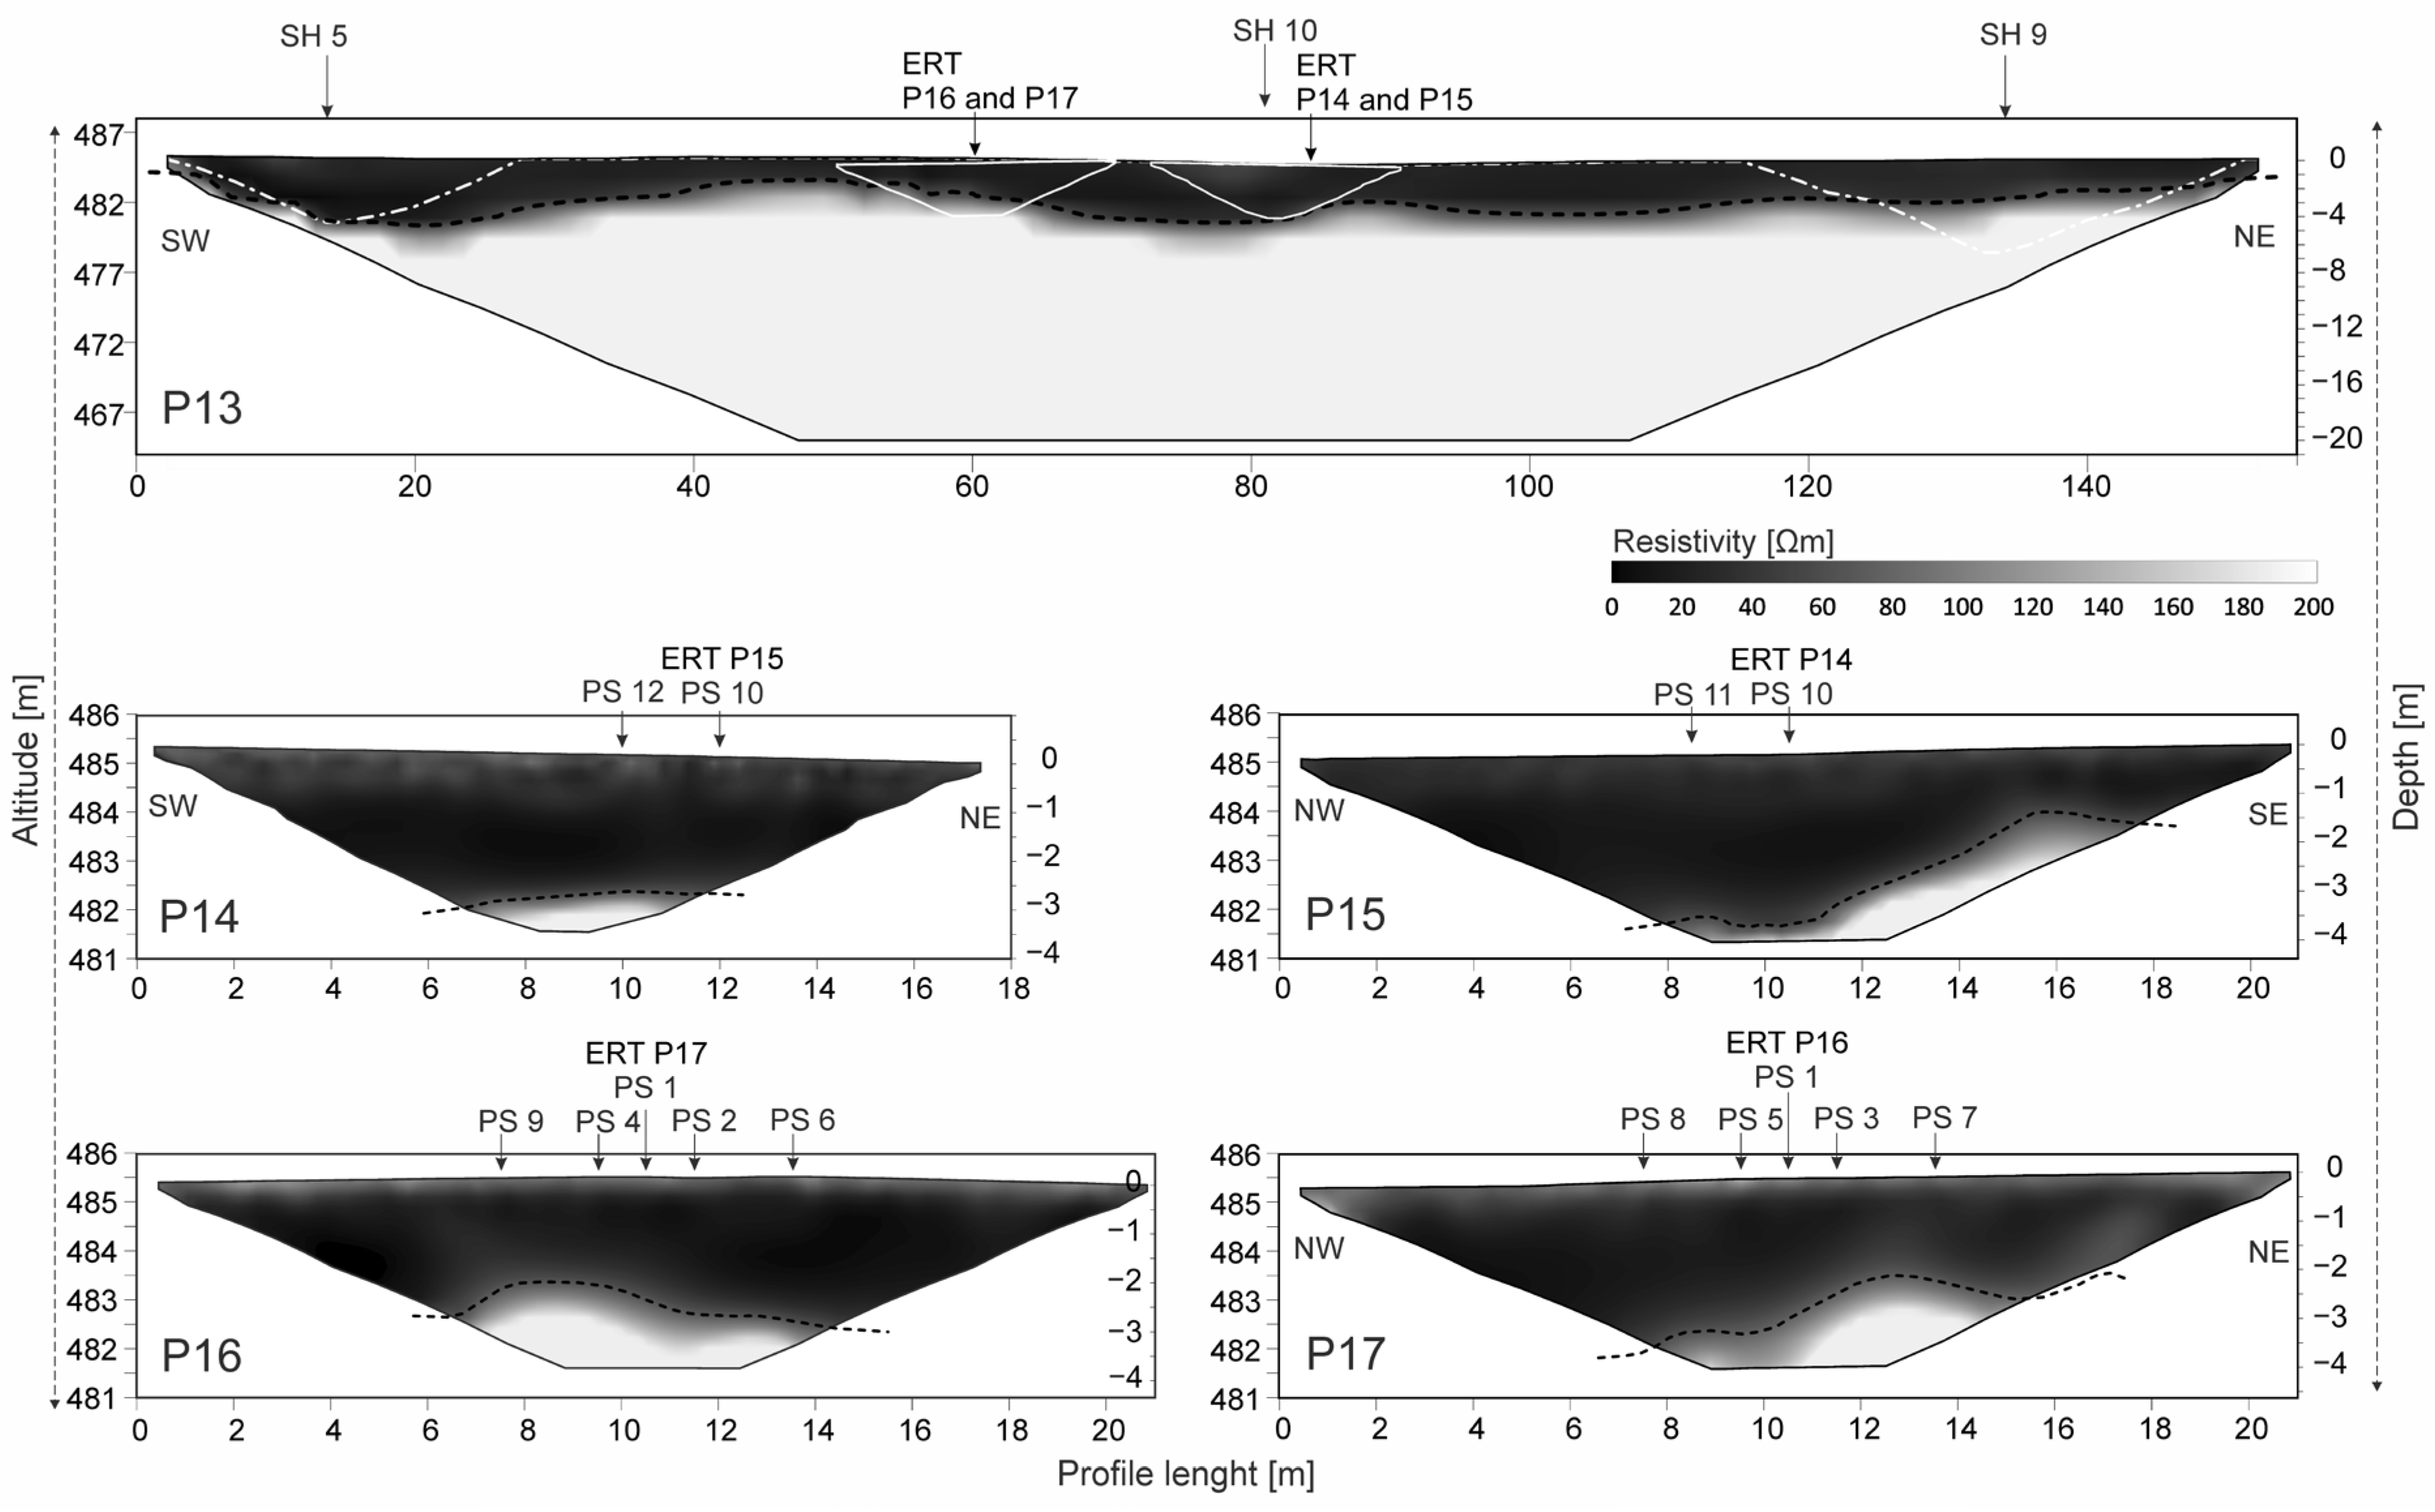
Five ERT profiles (P13–P17) were measured using an ARES II system [24]. P13 (106.5 m length, 1.5 m step) imaged the subsurface relief to a depth of 20 m, while P14–P17 (17.75 m length, 0.25 m step) resolved shallow vadose zone geomorphology.

3.2. Soil Drilling

Soil drilling is still the main method for directly verifying the presence of gas in the soil cover. The soils and loess layer were drilled through to the underlying limestones with a percussion drilling set with gouges (1 m long, 40 and 75 mm in diameter) with an RD-32 connection (Royal Eijkelkamp, Nijverheidsstraat 9, 6987 EN Giesbeek, The Netherlands) to a depth of about 3 m (down to the limestone bedrock). Coordinates (S-JTSK Krovak EastNorth; WKID 5514) of the resulting boreholes are shown in Table 1.

3.3. Gas Analysis

For detailed analysis of air from boreholes, the gas chromatography method was chosen for its accuracy and precision. The samples of air were taken in some wells, in addition to the annulus at the entrance to the cave, all at depths of 1 to 3 m. Samples were collected into Tedlar bags using a portable Ecoprobe-5 (RS Dynamics, LLC Technoparkstrasse 1, 8005 Zurich, Switzerland). Subsequently, all samples were analyzed in the laboratory by gas chromatography on HP 5890A instruments with TCD detection (He and H2) or an Agilent 7890A with TCD and FID detection (CO2, Ar, O2, N2, CO, CH4, and hydrocarbons C2 to C6).

3.4. Organic Carbon in Drill Cores

An organic carbon analysis was performed from the bottom of the drill core to check the organic carbon content (SOM) in the deeper parts of the soil profile. Samples were oxidized in an oxygen stream at 1350 °C after previous removal of carbonates by dissolution in HCl (in 1:2 and 1:1 dilutions). Elemental composition was determined using a Metalyt CS 1000S (ELTRA) instrument with an infrared detector (IR).

3.5. Stable Isotopes

The values of δ13C-CO2 were verified in soil air to find possible sources of the carbon. The carbon isotopes were determined on a Delta V Advantage GC IsoLink (ThermoFisher. Bremen, Germany). The gas sample was injected into a gas chromatograph. After separation in the column, it passed through a conversion reactor (in the case of CO2 without temperature), followed by removal of water with a Nafion desiccant. The CO2 was then passed through a ConFlo IV to the IRMS. The measurement was calibrated using reference gases. Data were evaluated using ISODAT software; Std used: carbon dioxide: UN1956 50% mol/mol, XO2AI50CA58C002 Airgas and Air Liquide company certified value: −40.1 ± 0.3‰ vs. VPDB.

3.6. XRD Analysis

X-ray diffraction was used to determine the composition or degree of transformation of the loess as a soil-forming substrate. Two soil samples labeled Harbechy (dark) and Harbechy (light) were analyzed by powder X-ray diffraction (XRD). Analyses were performed using a Panalytical X’Pert PRO MPD apparatus with a cobalt anode and an RTMS detector (X’Celerator) in conventional reflection geometry. Measurement parameters of a representative part of the samples: step size: 0.033° 2θ, time per step: 320 s, measured angular range: 4–100° 2θ, total scan duration: 2 h.
To accurately identify clay and related minerals, orientated mounts were created from the clay fraction (<2 μm) of the sample obtained by ultrasonic dissociation in an aqueous suspension and centrifugation [25]. The orientated mounts were dried in air at 25 °C and subsequently subjected to saturation with ethylene glycol vapors at a temperature of 60 °C and fired at 400 °C with an isothermal hold of 45 min. The oriented mounts were analyzed three times using XRD in the angular range 3.7–50° 2θ: (1) after drying in air, (2) after saturation with ethylene glycol vapors, and (3) after firing. Measurement parameters of the orientated mounts: step: 0.033° 2 Θ, time per step: 100 s, measured angular range: 3.7–50° 2θ. The acquired data were processed using the Bruker DIFFRAC plus EVA 2 and Topas 4 software. Quantitative phase analysis was performed using the Rietveld method.

4. Results

4.1. Electrical Resistivity Tomography (ERT)

Processed ERT profiles are shown in Figure 3. Dark areas indicate low resistivity (typical for wet sediments), while light areas correspond to high resistivity (typical for impermeable limestones). The longest profile, P13, orientated in a southwest–northeast direction and measured at 1.5 m intervals, shows the terrain structure down to a depth of 20 m. The shorter ERT profiles, P14, P15, P16, and P17, with a measuring step of 0.25 m, extend to a depth of 4 m. These profiles were designed to detail imaging of the subsoil.

4.2. Soils

The A-horizon of the soil profile, about 0.4 m deep, is associated with long-term agricultural activity, especially intensive plowing and fertilization. The subhorizon below (the confluent B- to C-horizons) with a thickness of 2–4 m is formed by loess, the original rock substrate.
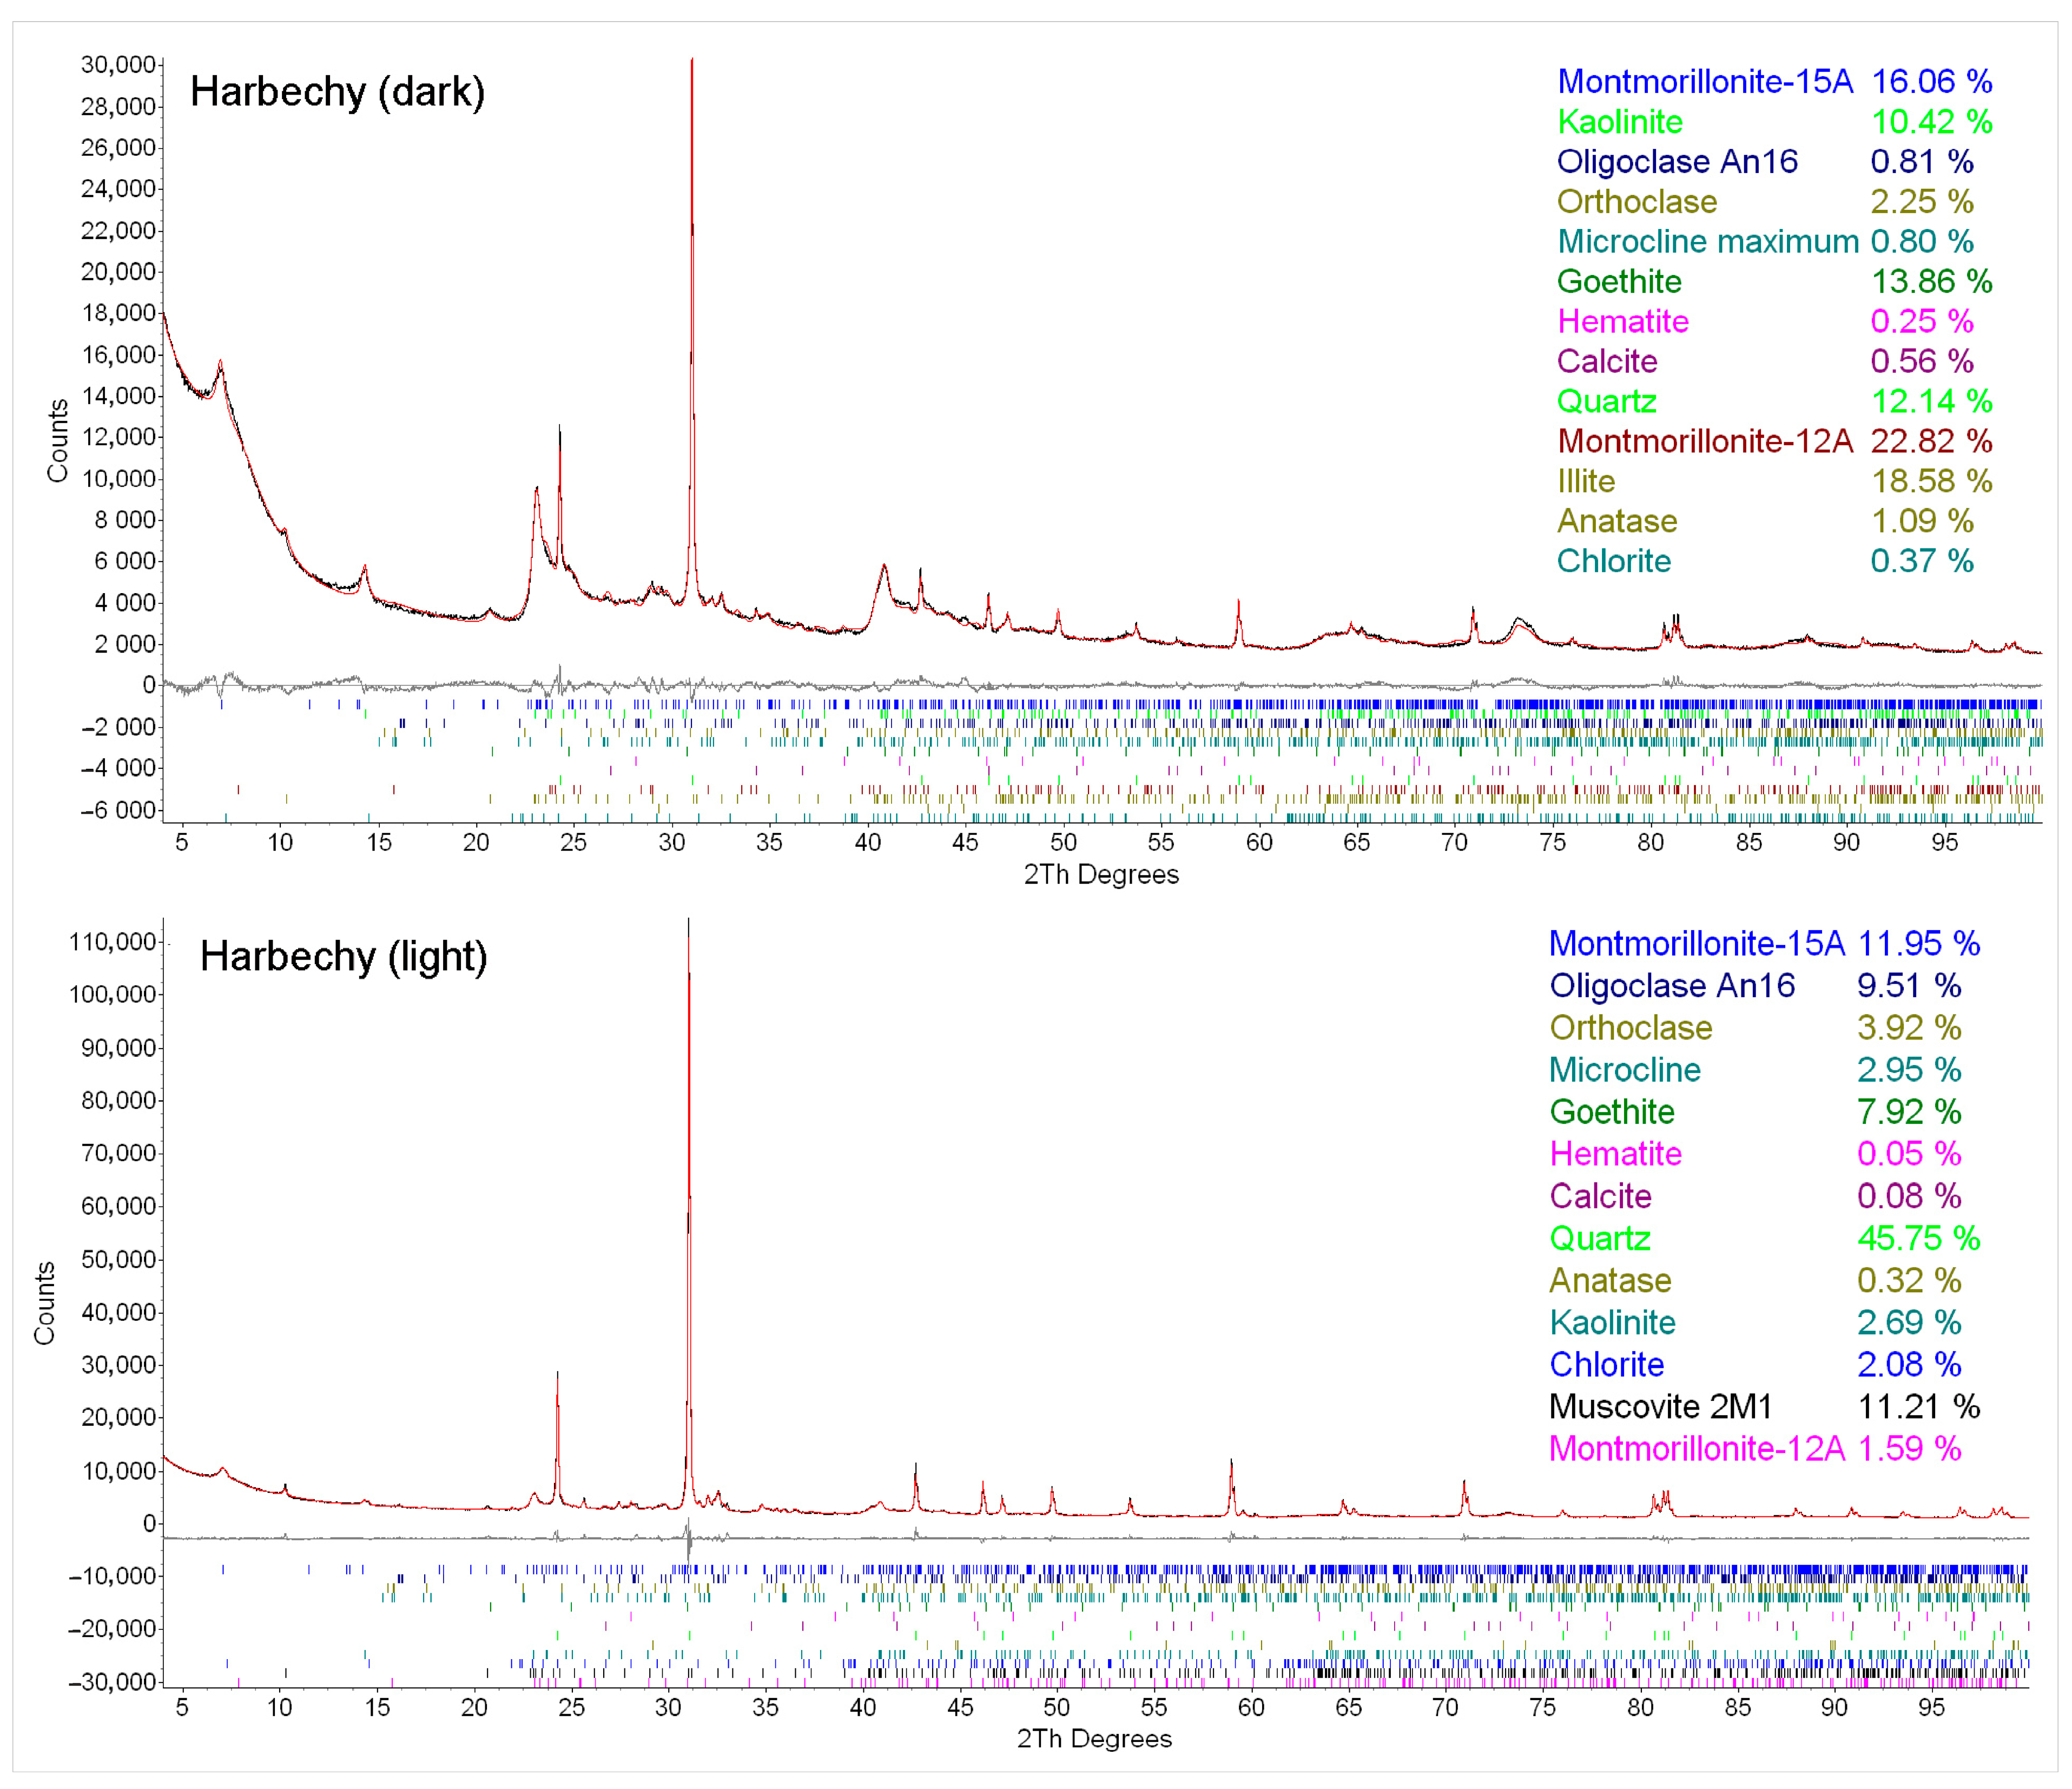
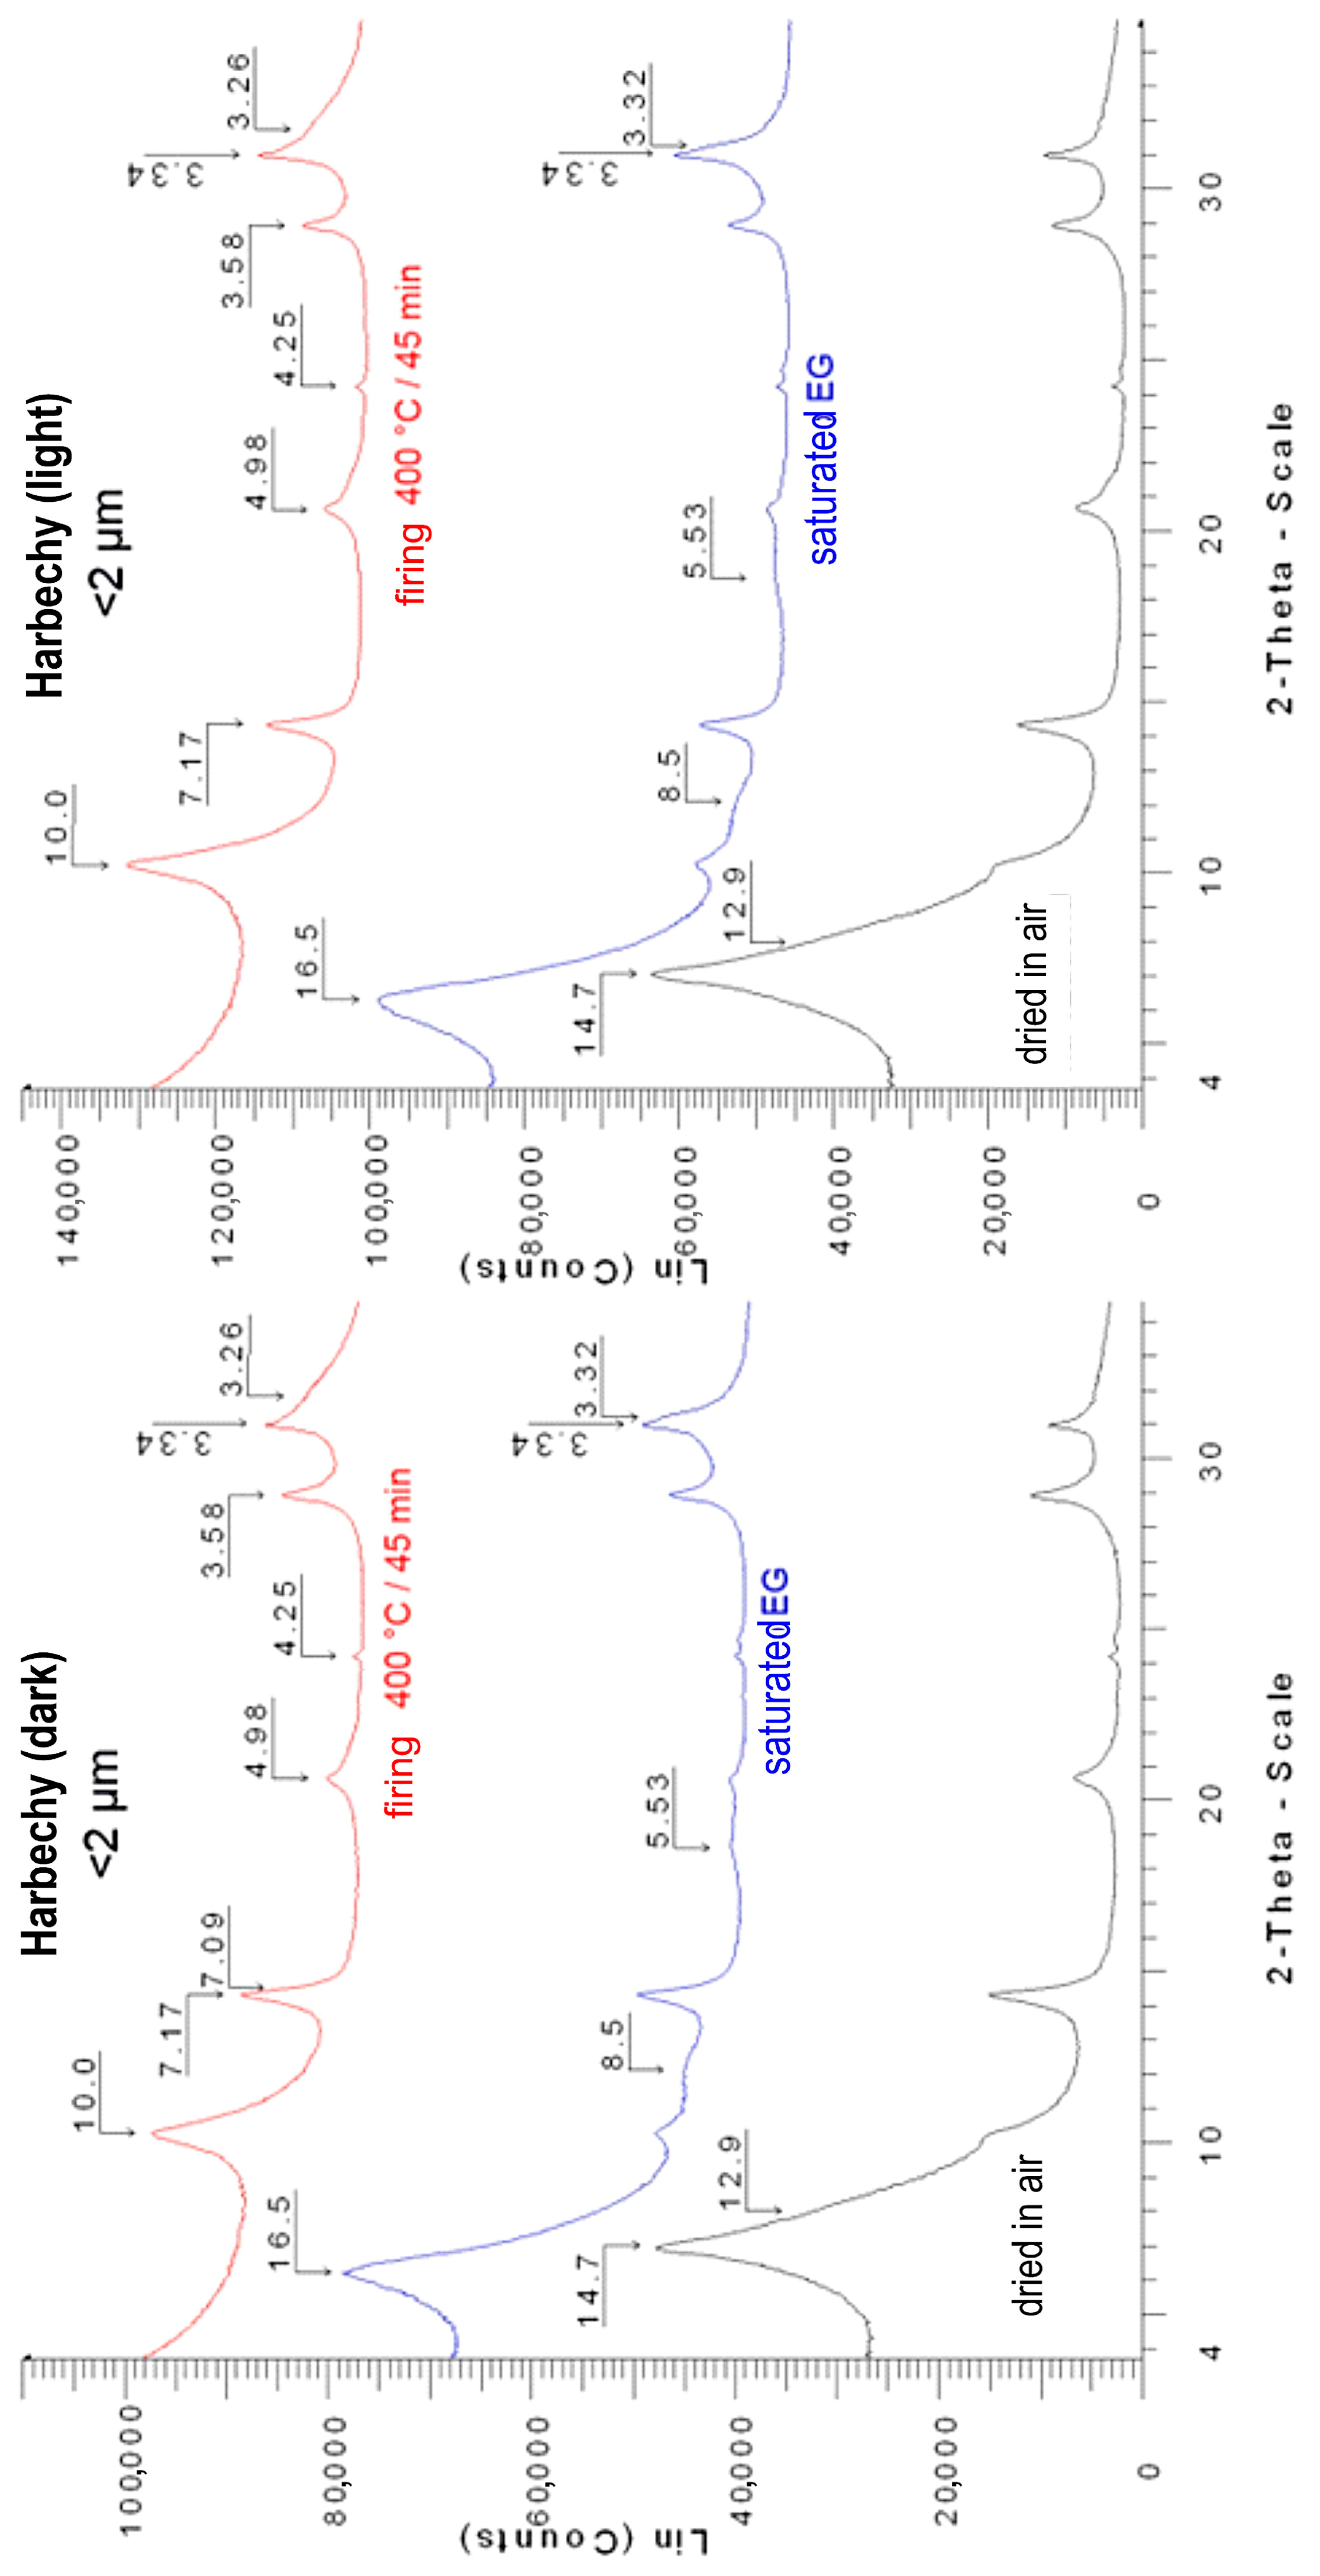
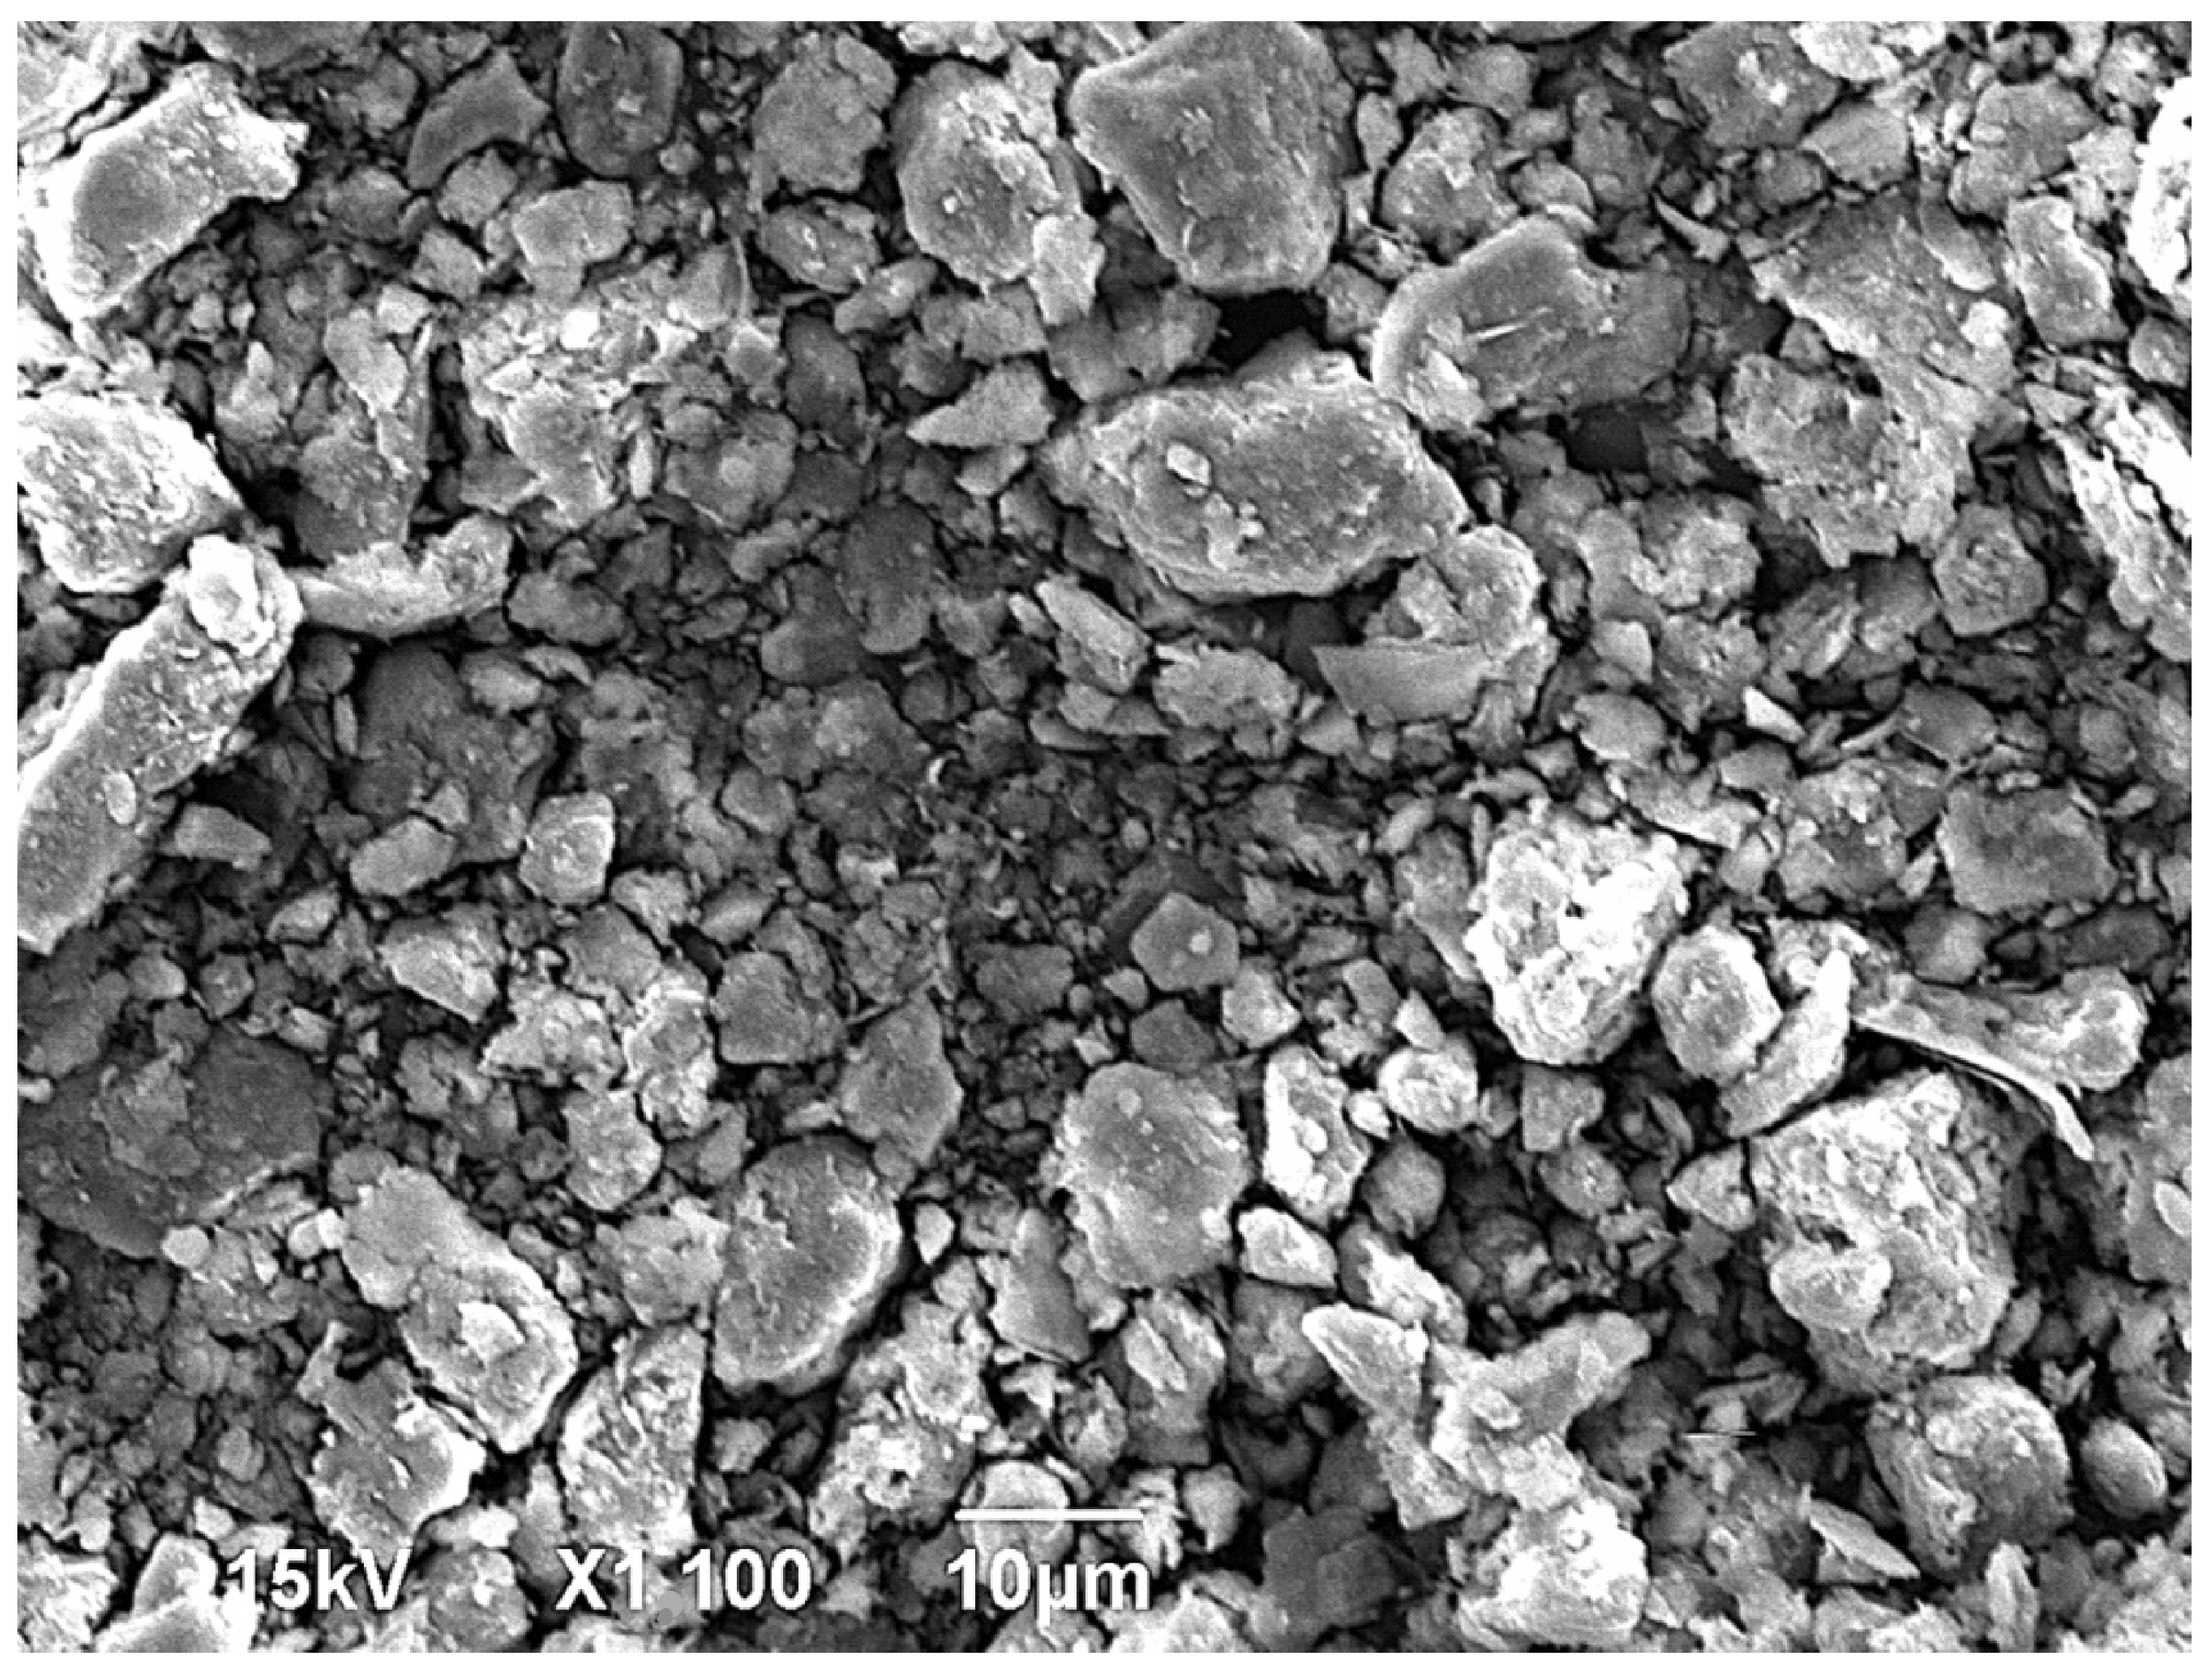
Particles of the loess prepared from a drill core of Harbechy soil are shown in Figure 4. Spot analyses of the particles are in Table 2. The qualitative phase compositions of two analyzed loess samples are nearly consistent. On the contrary, the quantitative phase analysis showed significant differences; see the details in Table 3. The qualitative identification of clay and related minerals was achieved through an analysis of an orientated mount of the clay fraction, as demonstrated in Appendix A.2. The profile of the diffraction line, which shows maximums at 14.7 and 12.9 Å after air drying and expanding to approximately 16.5 Å after ethylene glycol vapor saturation, suggests two distinct smectite structures. Montmorillonite structural models were used for their quantification. Upon firing, these reflections collapsed to about 10 Å. Reflections at 8.5, 5.53, and 3.32 Å, appearing after glycocolation, are also attributed to smectite. The diffraction lines at 10.0 and 4.98 Å, whose positions remain unaffected by any procedure carried out, belong to the basal planes of mica, probably illite. The reflections at 7.17 and 3.58 Å, with stable positions, correspond to the basal planes of kaolinite. In the Harbechy loess dark sample, the reflection at 7.09 Å, attributed to chlorite, becomes discernible with magnification. Considering the limited visibility of chlorite in the diffractograms of orientated mounts, as opposed to the records of a representative sample portion, it is apparent that most chlorite particles exceed 2 μm in size. Reflections at 3.34 and 4.25 Å are linked to quartz, present as a particle within the clay fraction. Diffractograms of randomly oriented representative portions of the analyzed samples are illustrated in Appendix A.1, while diffractograms for orientated mounts are shown in Appendix A.2.

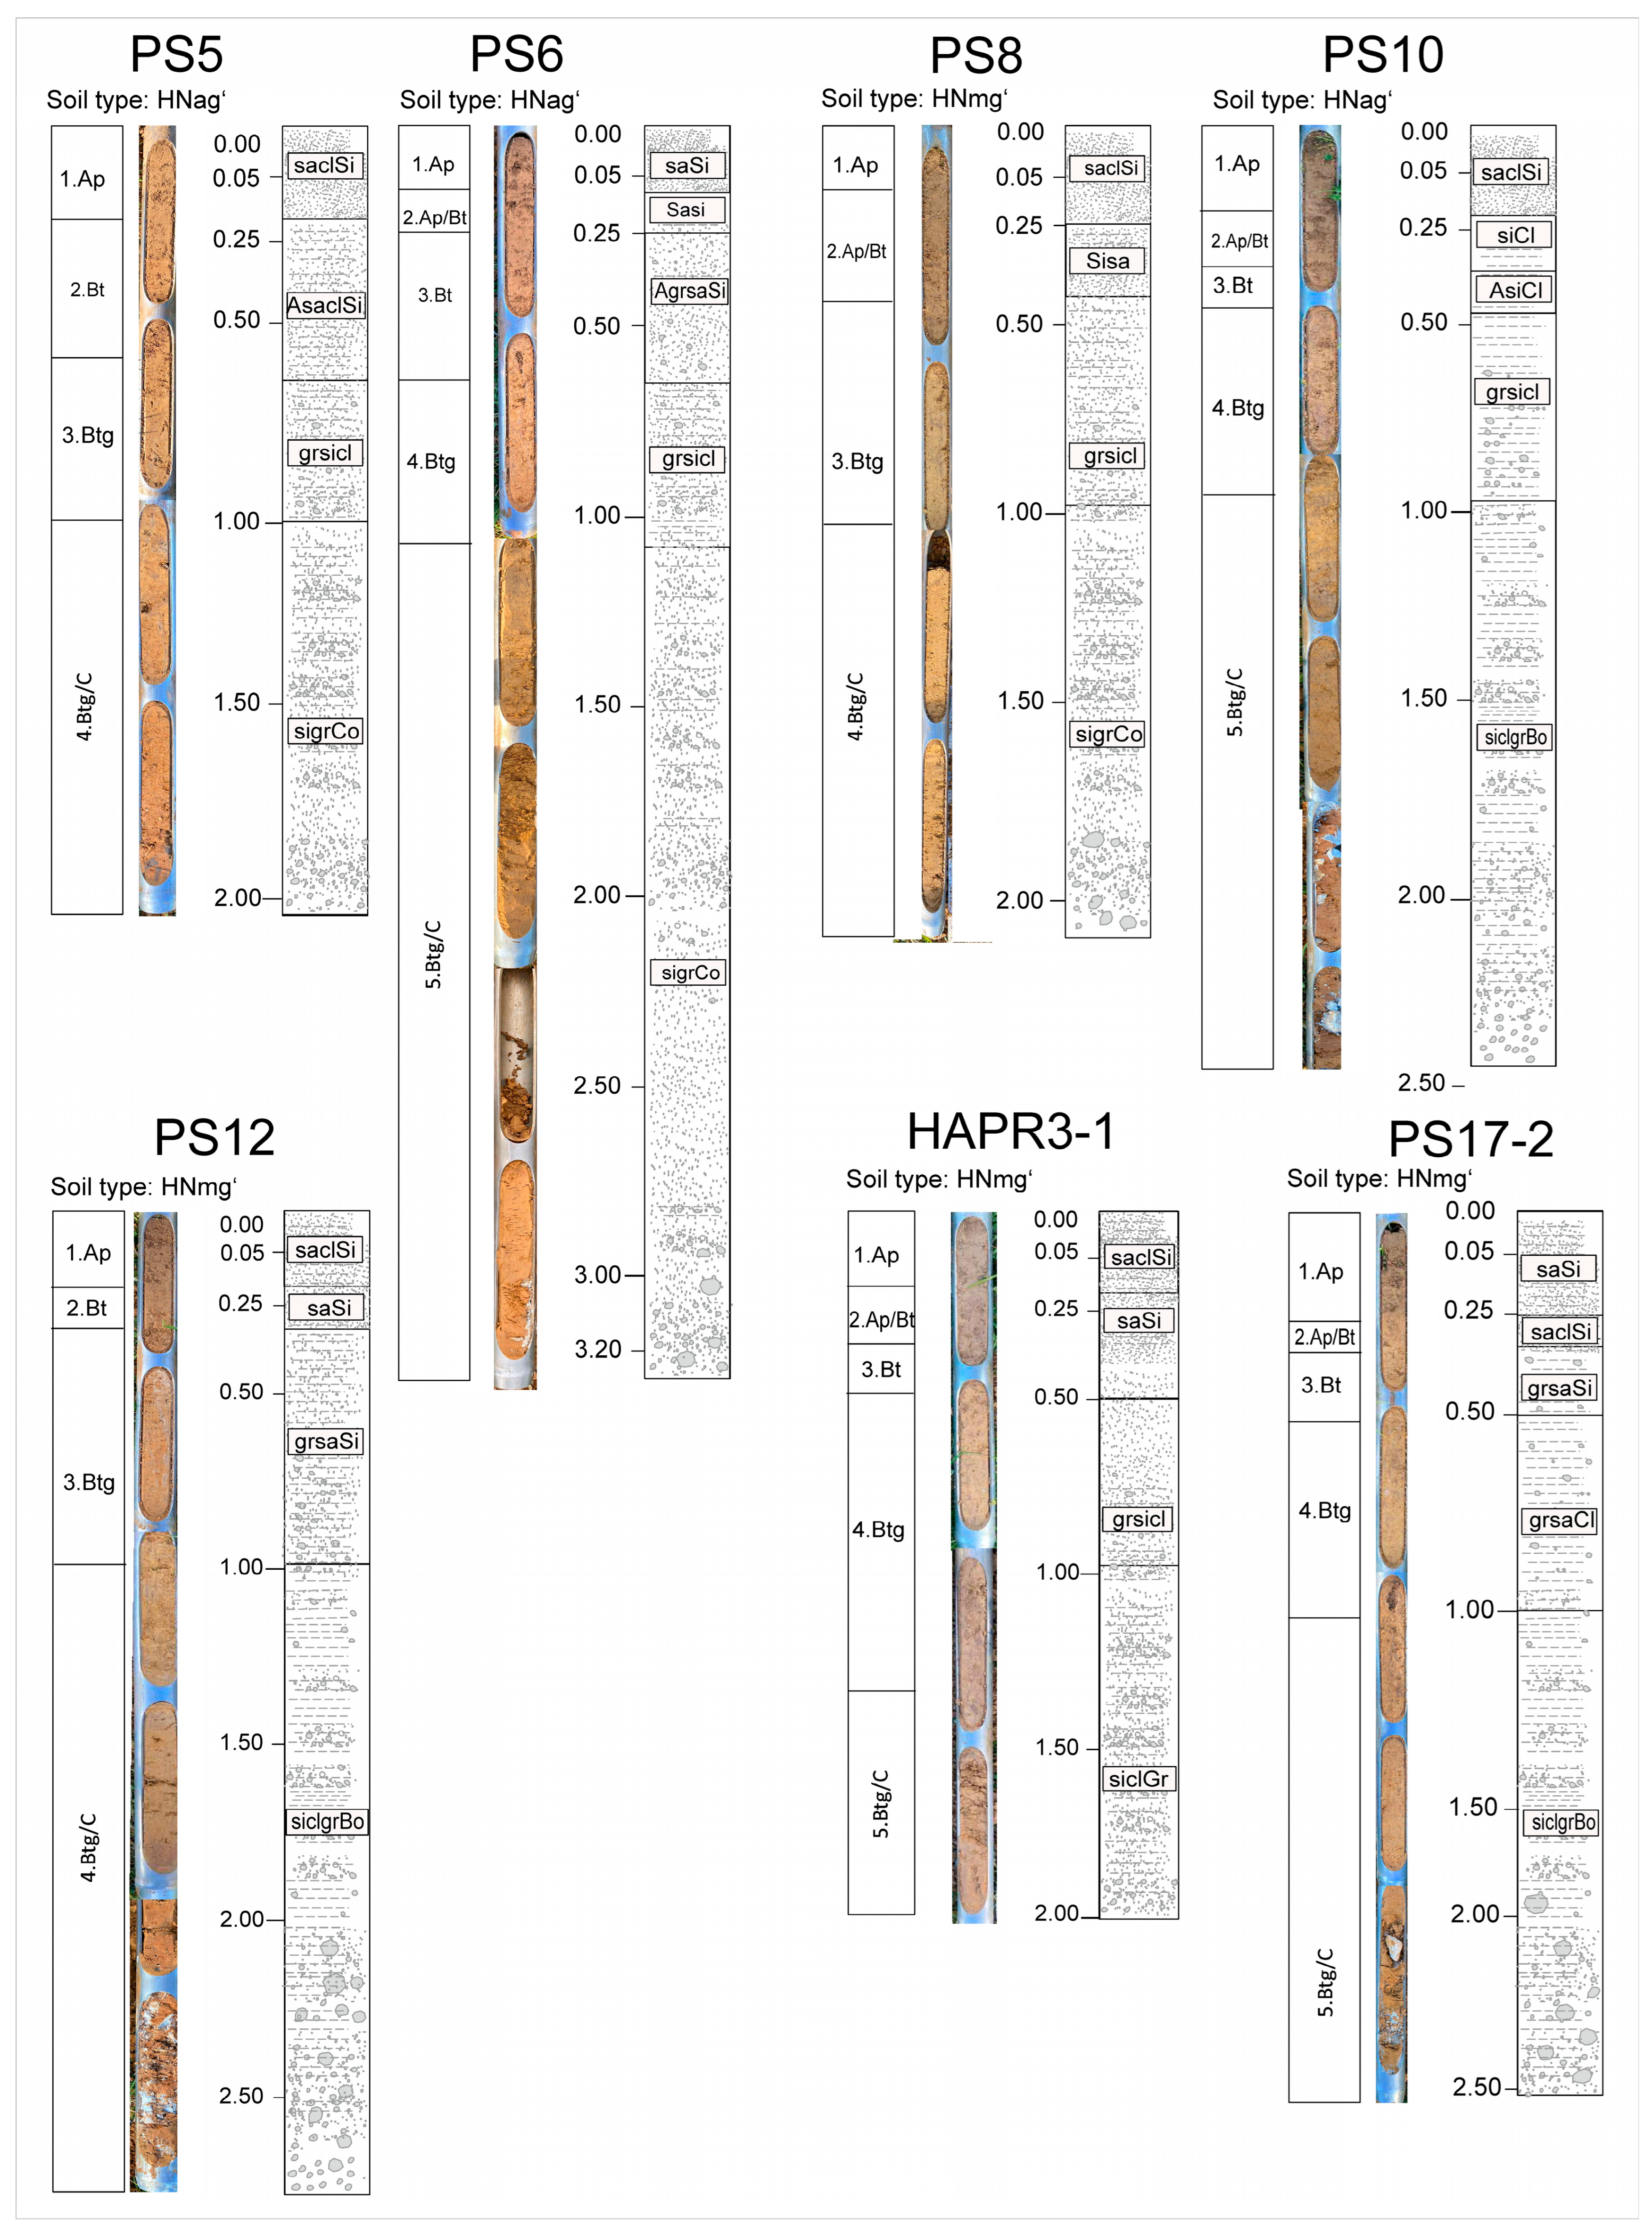
4.3. Drill Cores

Descriptions of drill cores with explanations are in Appendix A.3. The lower part of the drill core analyzed (loess sample SP03) contained only a low organic matter content with a concentration of 0.12 ± 0.024 wt. %.

4.4. Underground Water

In general, an alternative way to test CO2 concentrations in soil/epikarst is to reconstruct the concentrations from the water composition. Faimon et al. [16], Peyraube et al. [17,18], Milanolo and Gabrovšek [26], and Pracný et al. [27] established this method. In the calculation, virtual CO2 is gradually added to degassed karst water until equilibrium is achieved again. For these purposes, drip water was sampled in the Harbechy Cave Gallery located below the studied area. The chemical composition of the water is presented in Table 4. As expected in karst water, the main components are calcium and alkalinity (HCO3), although the extreme nitrate content is also worth mentioning.

4.5. Composition of Soil Air in Wells

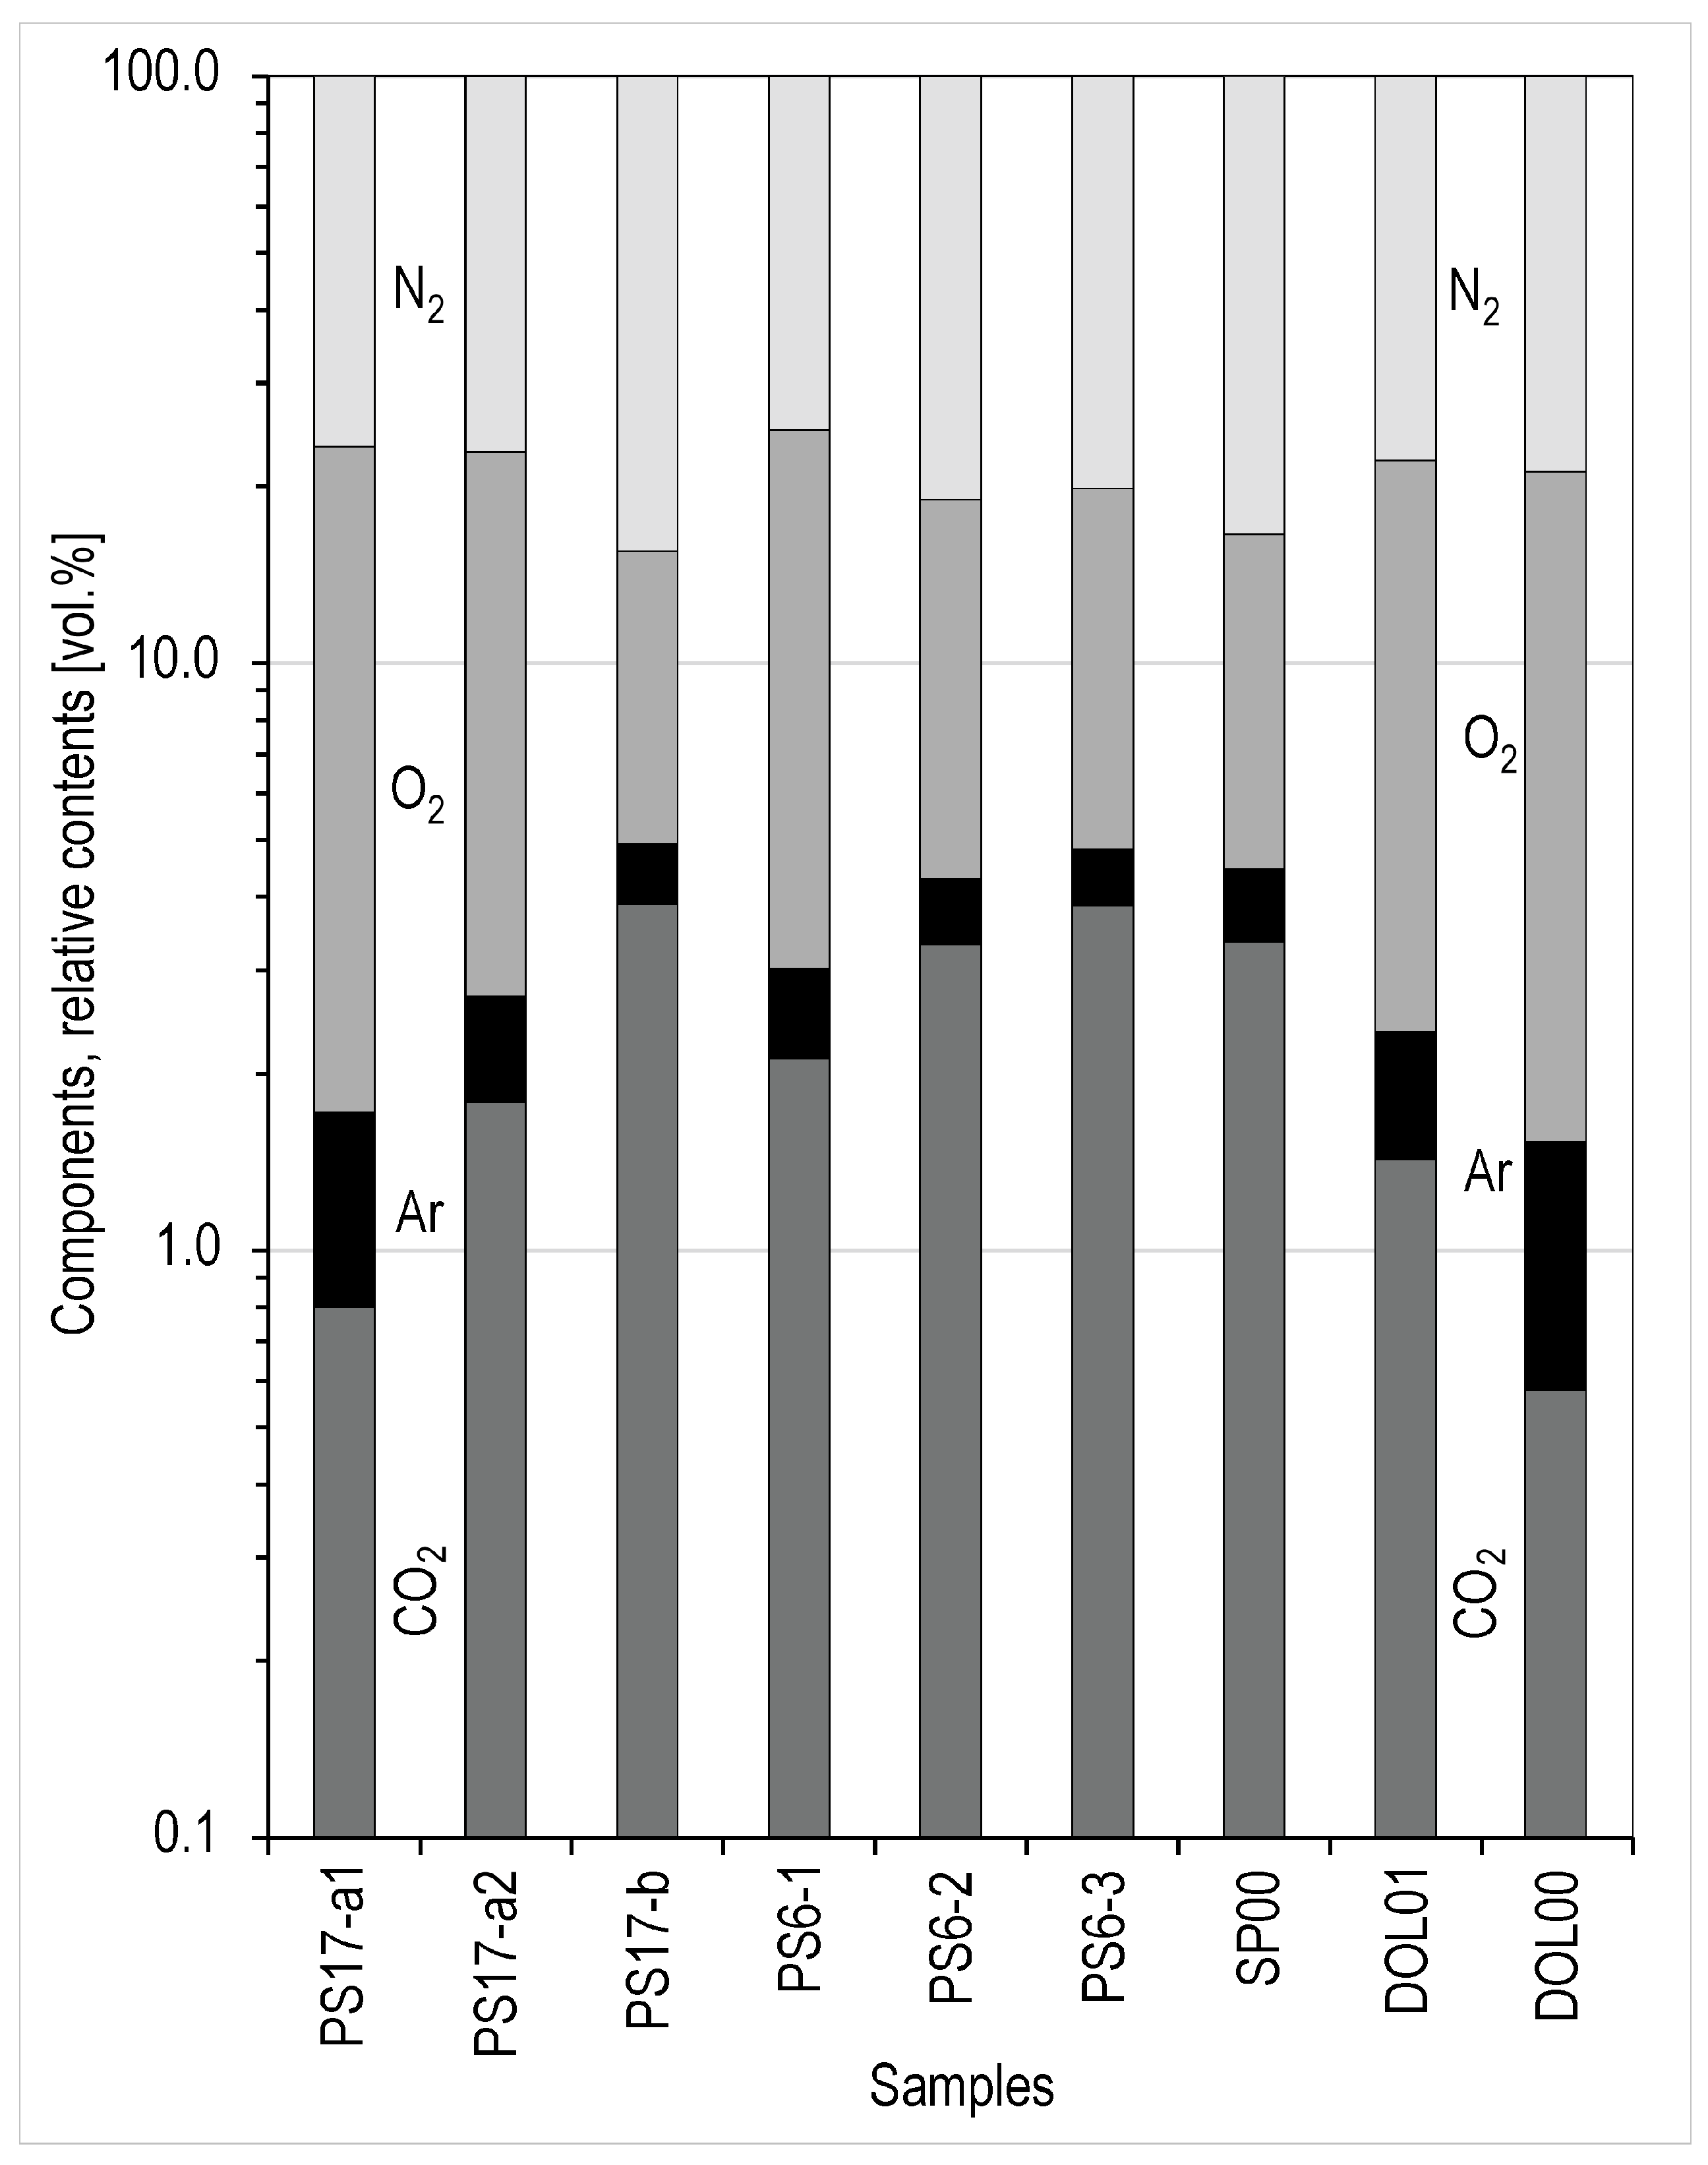
CO2 concentrations measured in the topsoil of Harbechy Plateau (to a depth of 0.3–0.4 m) show standard values below 1 vol. %. which is a value typical for the entire Moravian Karst region [19]. The composition of the borehole air is shown in Figure 5. It shows the distribution of the main components in the boreholes on a logarithmic scale. In some places, the CO2 concentration significantly exceeds the concentration in the topsoil. Another interesting feature is the fluctuating ratios of O2 and N2.
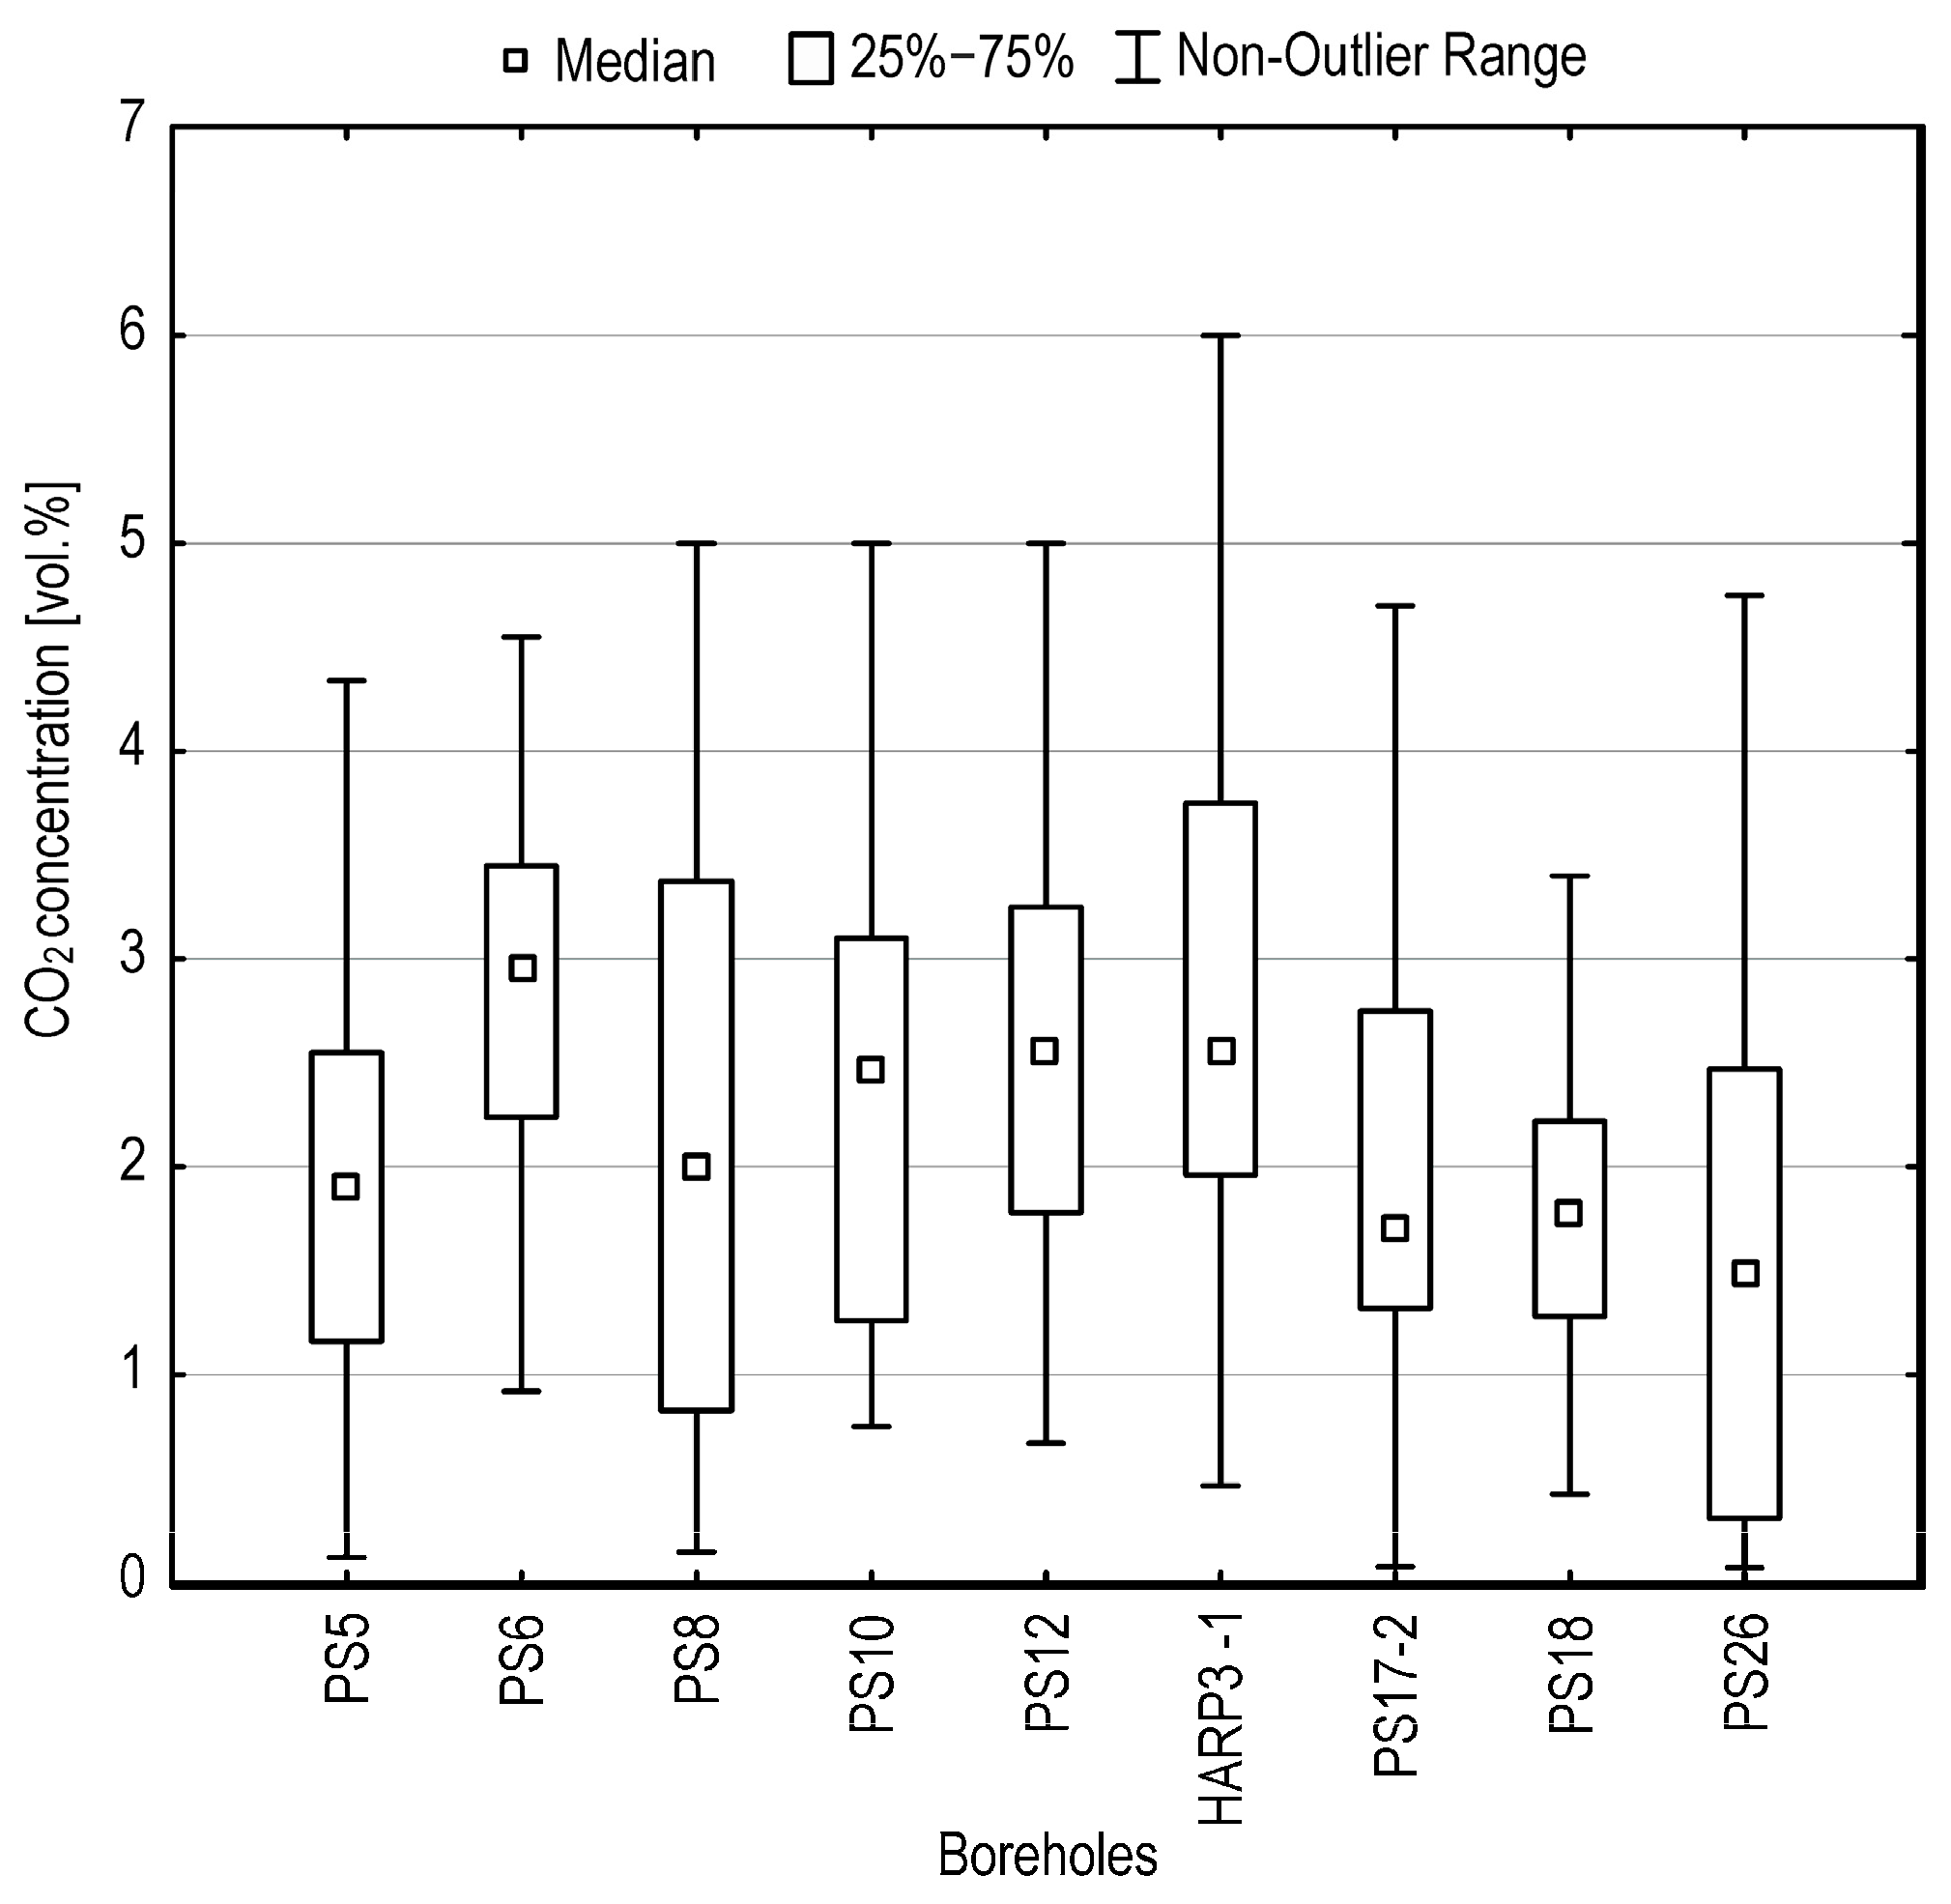
The CO2 concentrations directly measured in the air of boreholes with a handheld IR spectrometer during the period 2022 to 2025 (12 to 35 individual measurements) are given in Figure 6. The median of values ranges from 1.5 to almost 3 vol. %. Maxima exceeds 4 vol. % (except for the PS18 well). The maximum in the HAPR3-1 borehole reaches 6 vol. %.
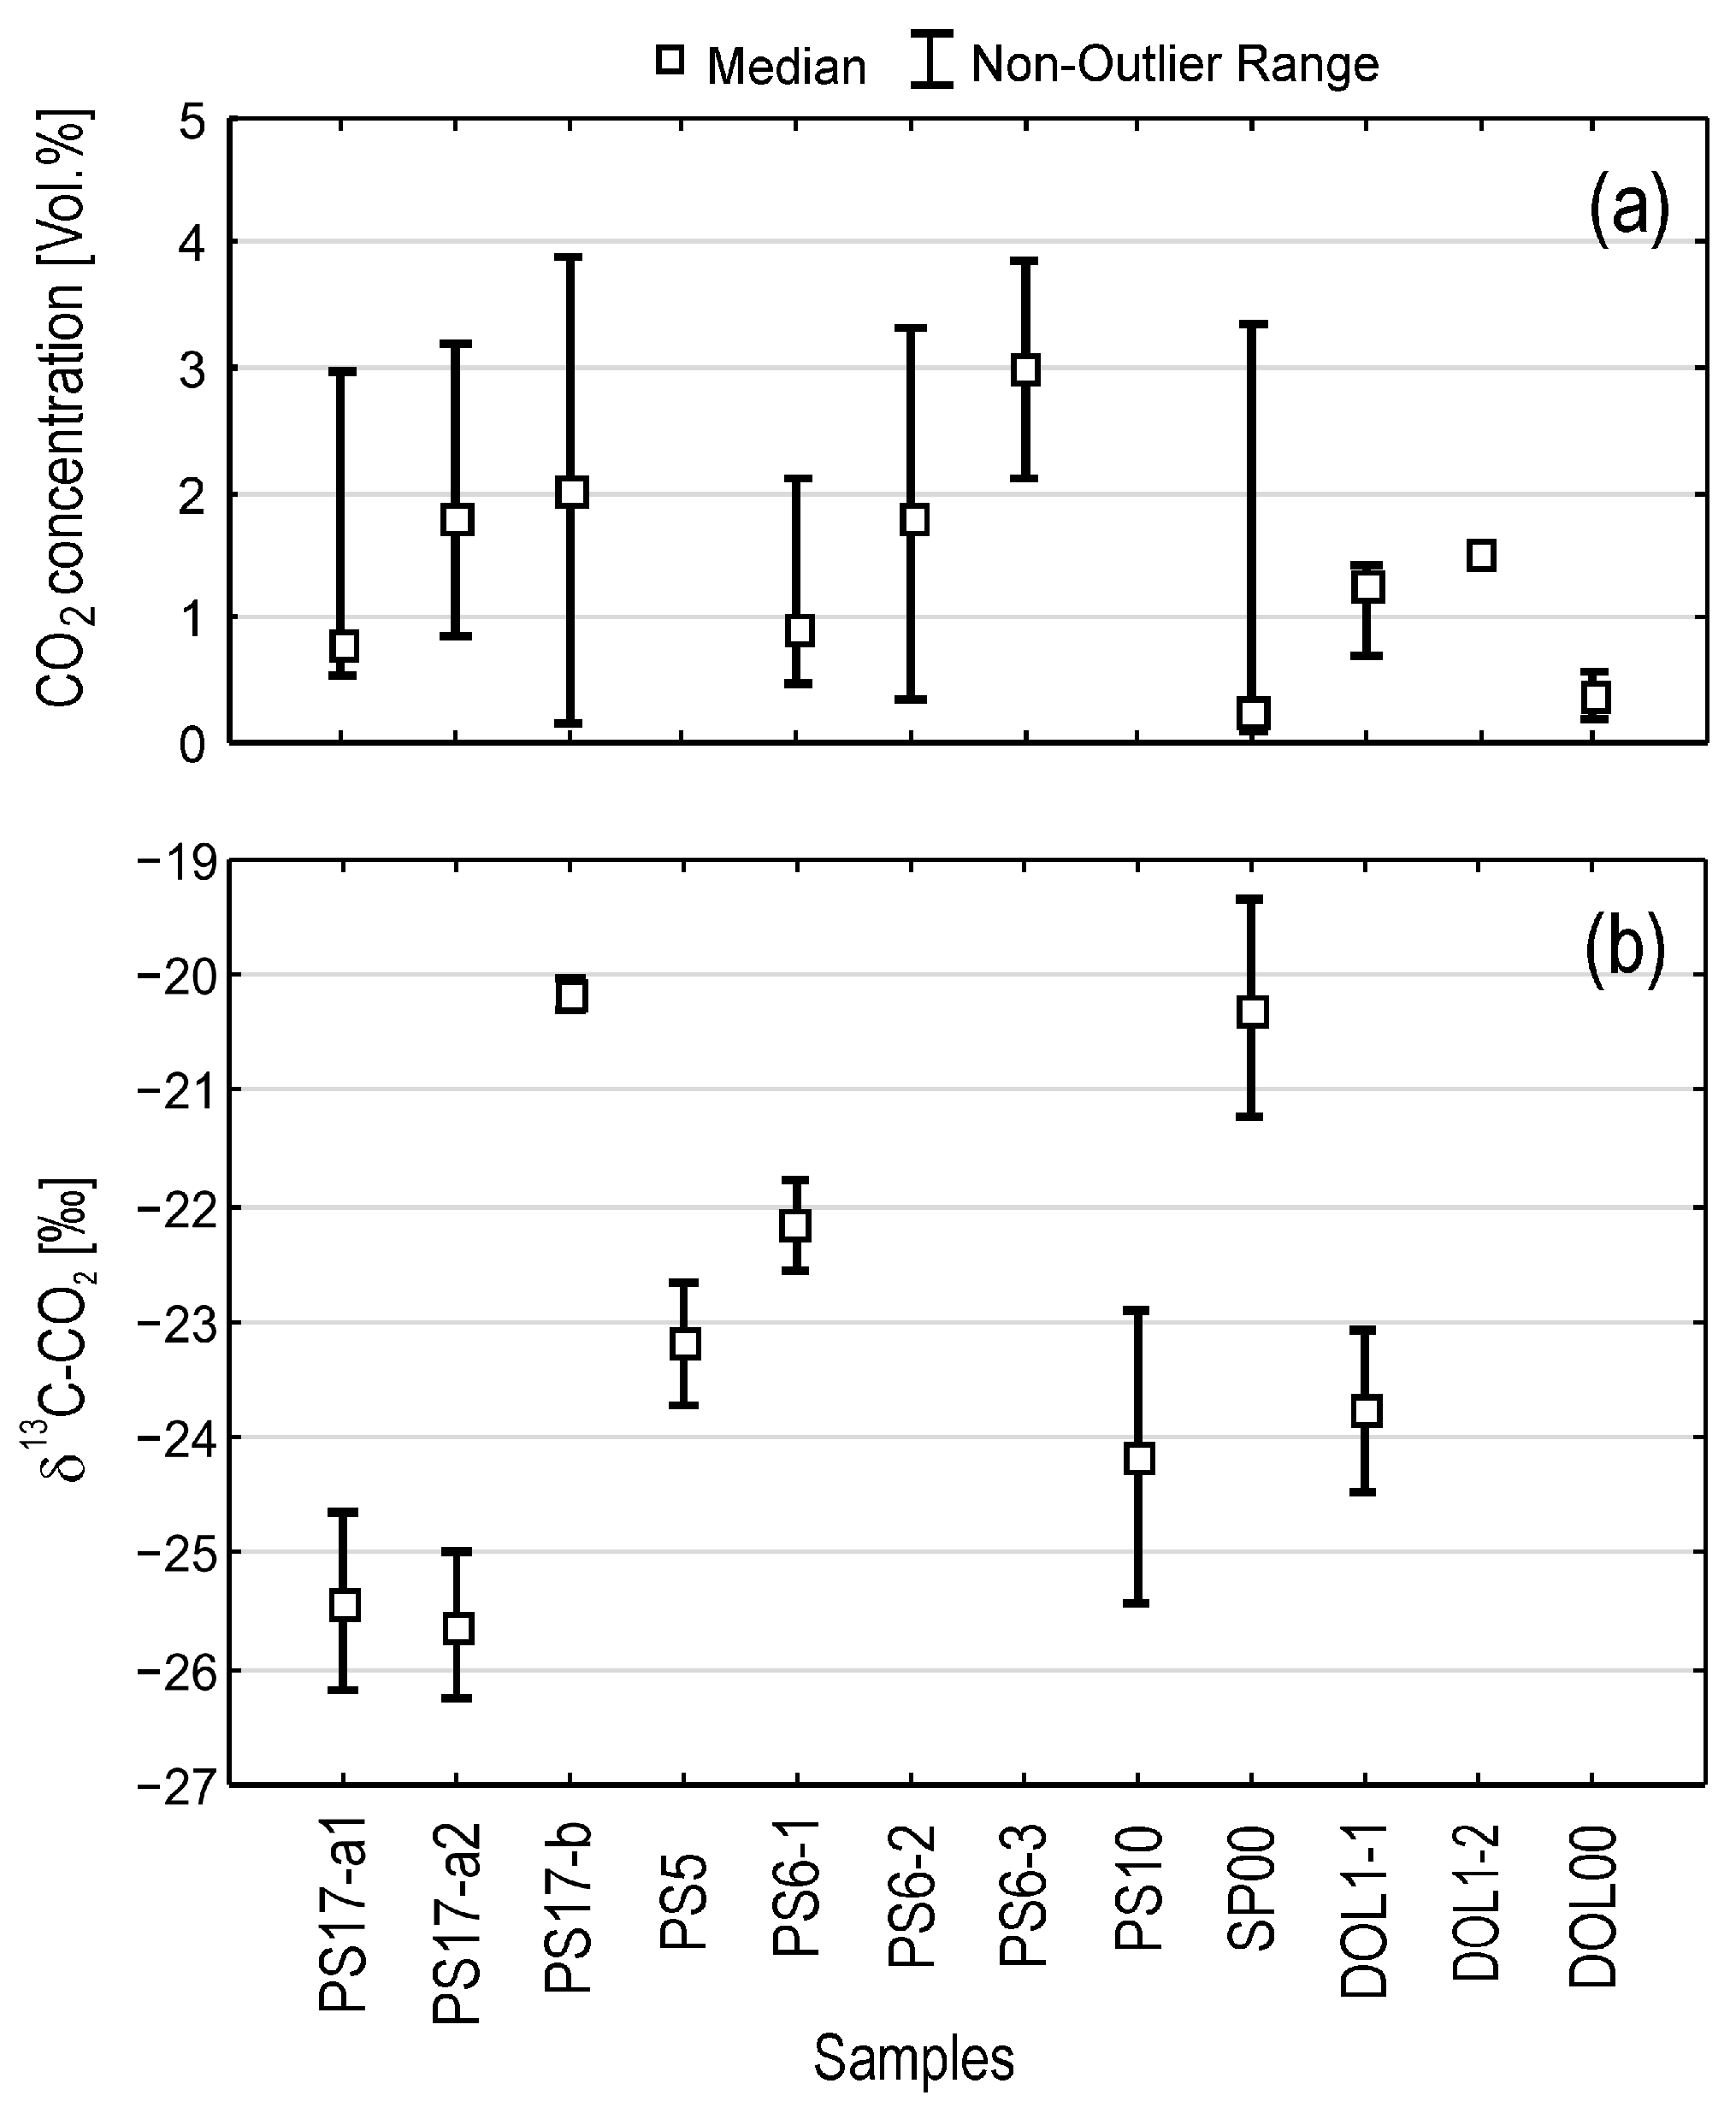
The results of comparative measurements with gas chromatography are presented in Figure 7a. Some medians of CO2 concentrations are less than 1 vol. %, the remaining values range from 1 to 2 vol. %. In the case of the PS6-3 well, the median is 3 vol. %. Carbon isotopes were determined in the same air samples (Figure 7b). δ13C-CO2 values are between −20 and −26‰.
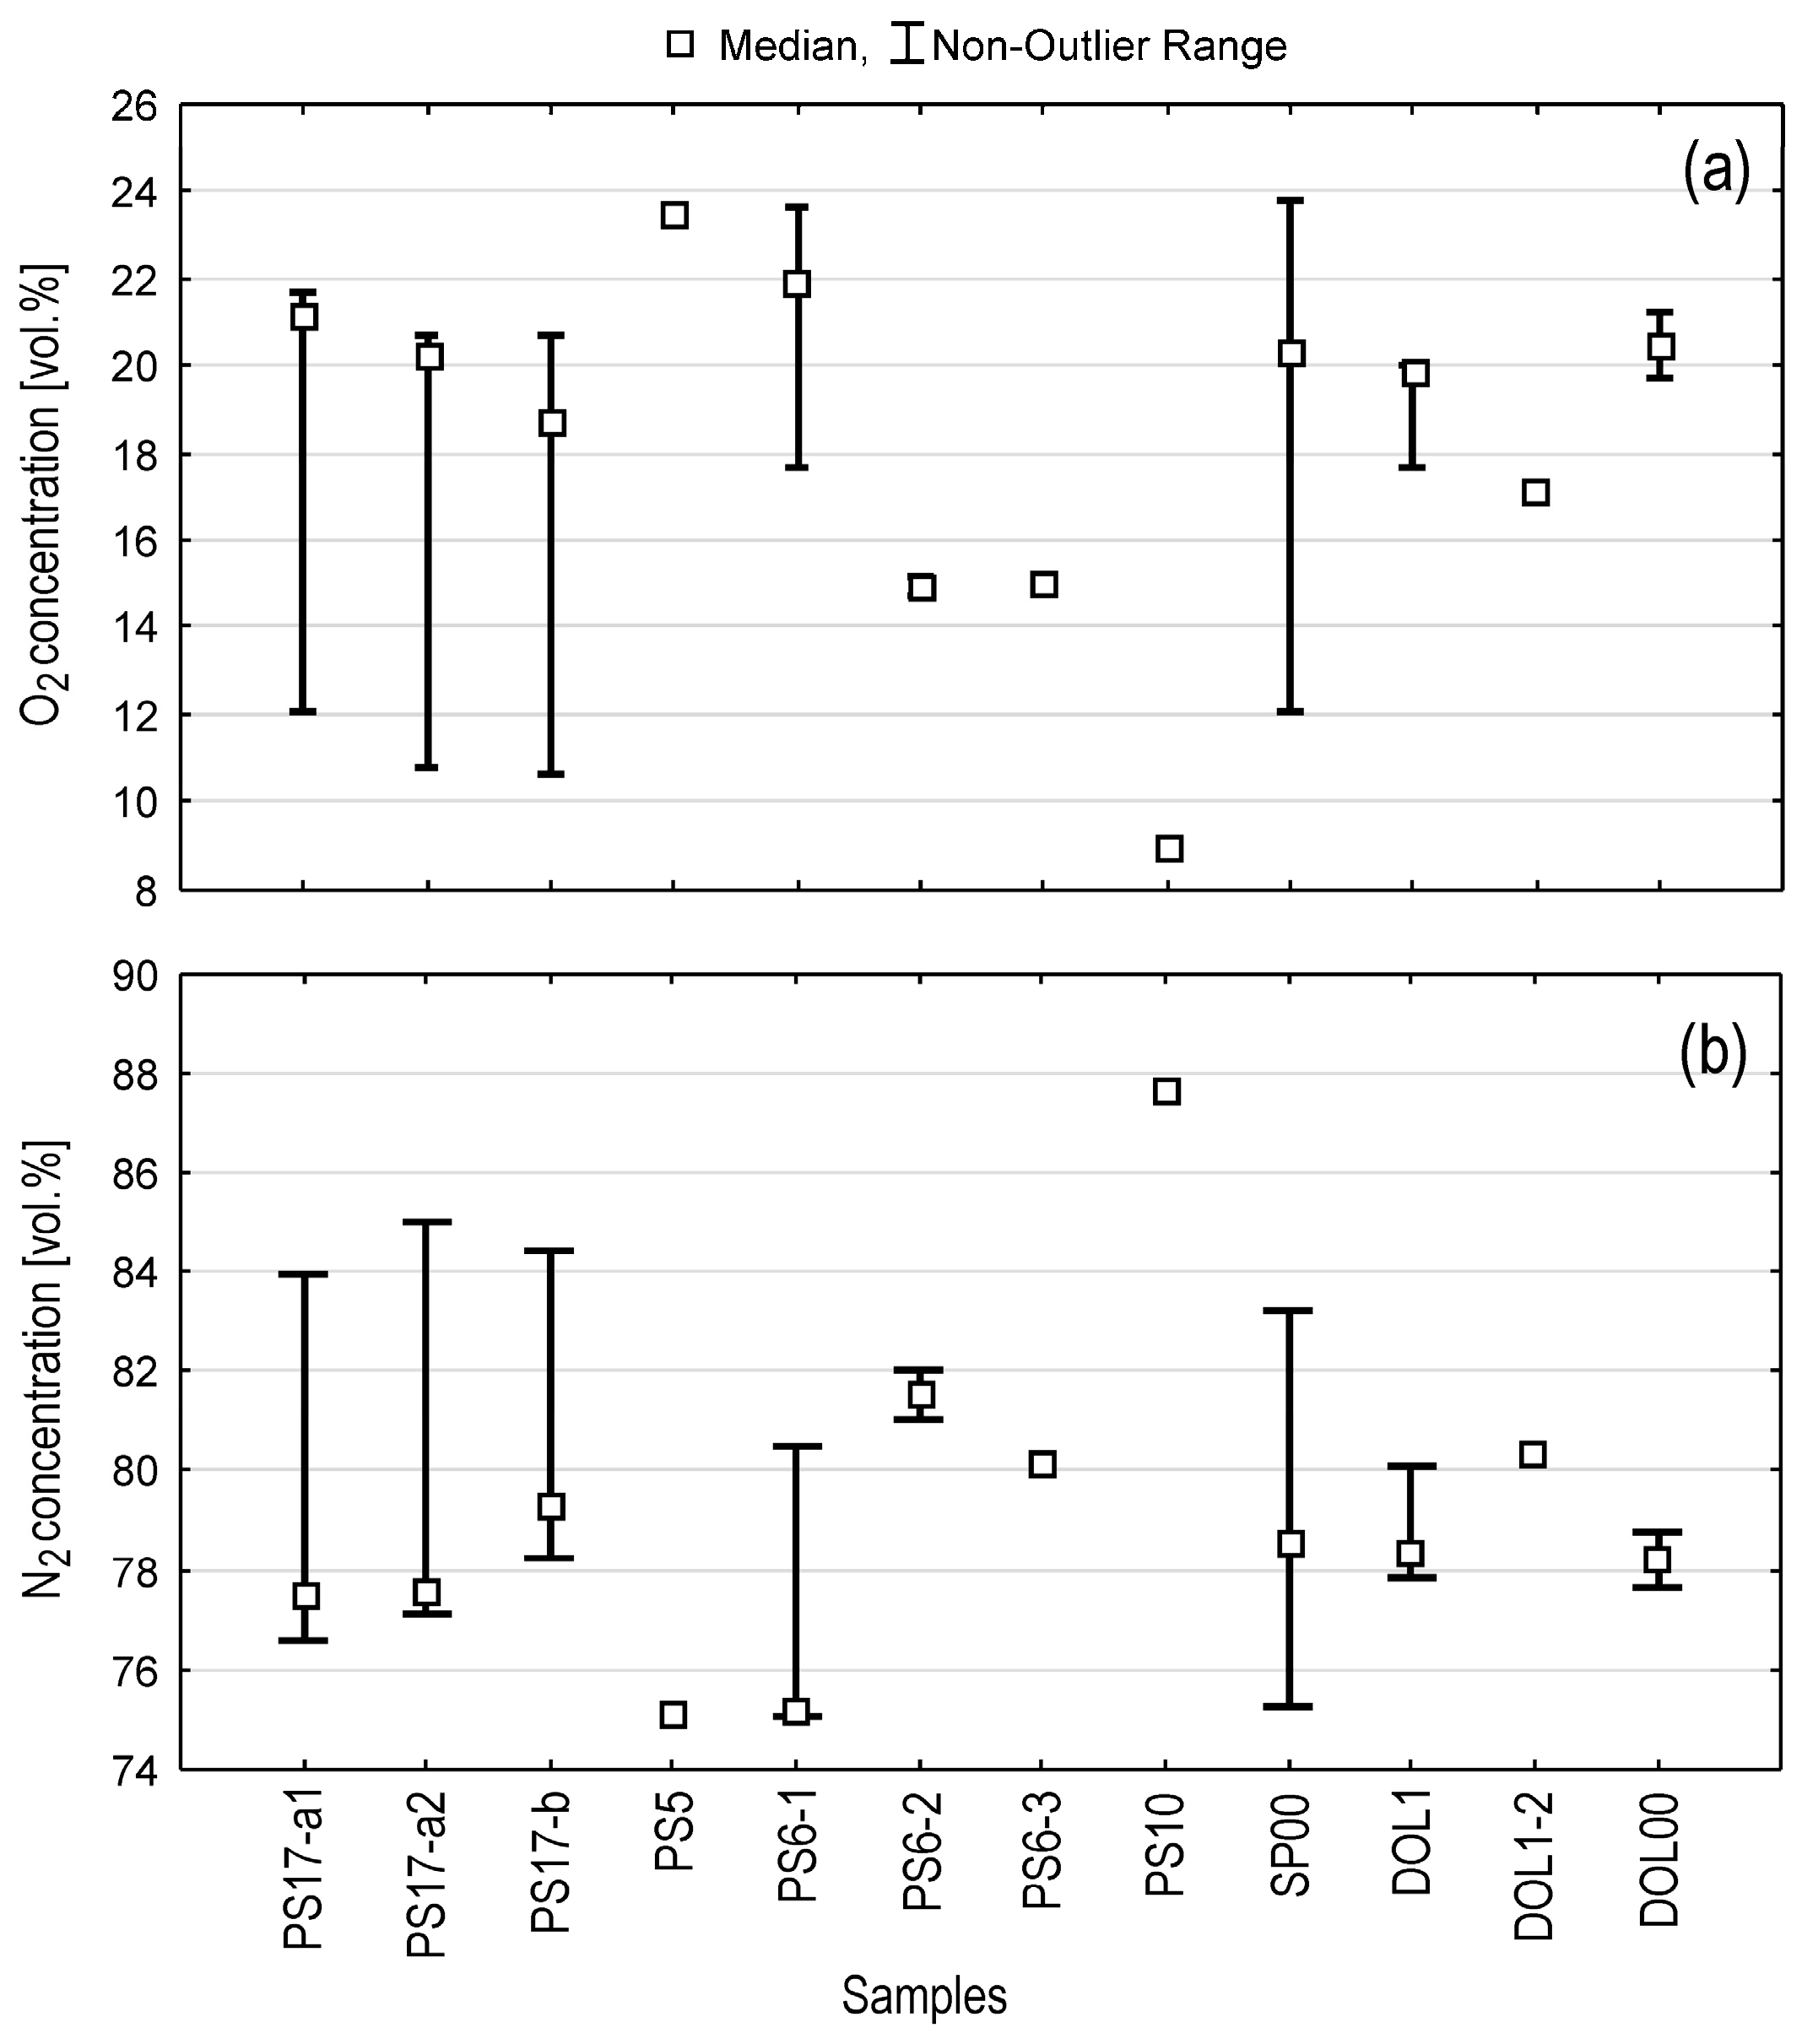
The oxygen and nitrogen concentrations in the borehole air determined with chromatography are presented in Figure 8. O2 concentrations are 9–24 vol. %, while N2 concentrations 75–88 vol. %. The gases are negatively correlated.

5. Discussion

5.1. Geophysical and Soil Characterization

The ERT profiles (Figure 2) reveal a complex paleotopography beneath the Harbechy Plateau, with sediment-filled depressions (deepest: ~5 m near sinkhole SH5) and variable limestone bedrock morphology. High-resistivity zones indicate compact limestone, while low-resistivity areas confirm 4 m-thick sedimentary cover (loess-dominated). Historical resistivity profiling by Hašek (in Přibyl [15]) mapped a 50 m-deep paleo-relief, consistent with dye-tested drainage into Suchý/Pustý žleb. Our findings align with this author but reveal finer-scale paleotopography due to higher-resolution methods.
The soil is classified as haplic anthrosol (loamic, protocalcaric) [28] reflecting:
(1)
Long-term agricultural use (potentially since the Neolithic);
(2)
A 0.4 m-thick dark Ap soil horizon formed by tillage and fertilization;
(3)
Loess substrate (2–4 m thick; 0.1–0.4 wt. % of calcite; smectite/kaolinite-dominated, Table 4). Subrounded loess particles (Figure 3) suggest short transport, while low SOM implies localized CO2 sources feeding the GRSL.

5.2. Water Chemistry

The modeling of water indicates it is almost in equilibrium with calcite (saturation index of calcite SIcalcite = −0.04) (Table 5). The partial pressure of CO2 in water (which represents the virtual partial pressure of CO2 in cave air, at which water would be in equilibrium), PCO2(w) = 10−1.38, exceeds cave air PCO2(cave) = 10−1.42 (Table 6), suggesting slight degassing [12].
The geochemical modeling found the partial pressure, PCO2(form) = 10−1.42, at which the composition of infiltrated water was formed (Table 6). Under normal conditions, this pressure corresponds to a concentration of 3.8 vol. %. This concentration matches the measurements in the well. The principle of the modeling is based on virtually adding/subtracting CO2 into/out the water/solution until equilibrium is reached.

5.3. CO2 Dynamics

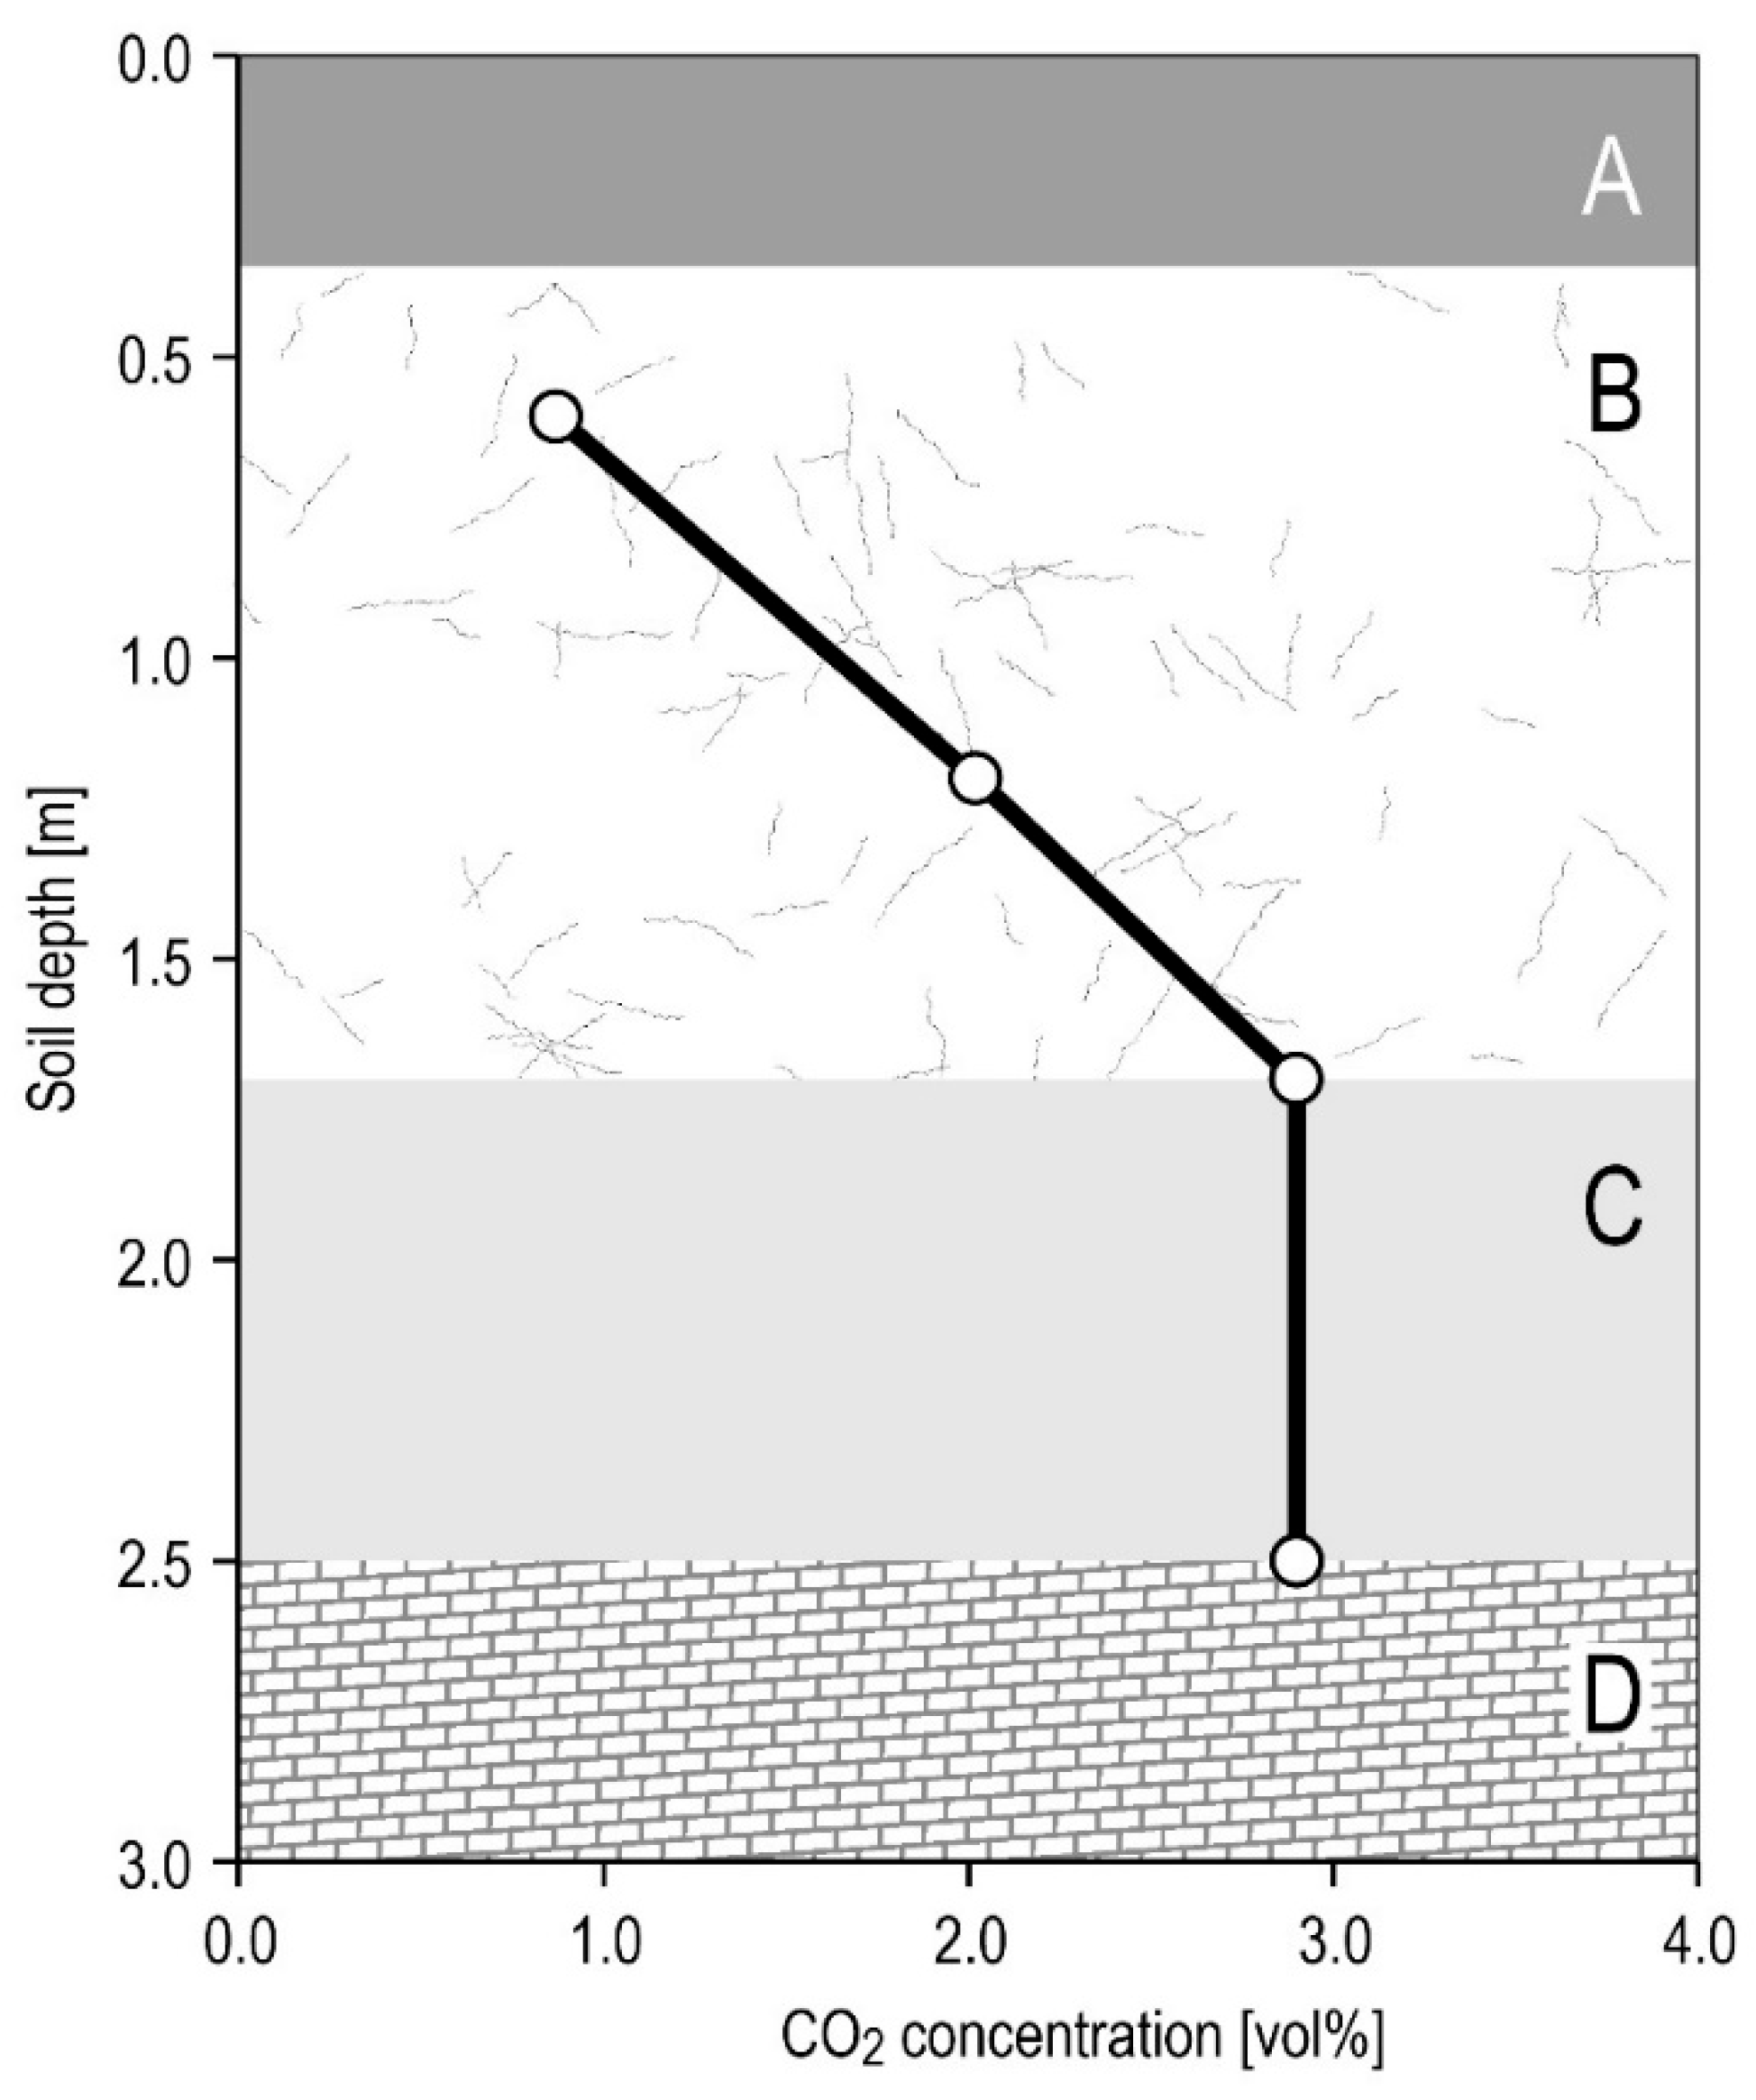
The hydrogeochemical modeling of drip water reveals the near-equilibrium with calcite (SIcalcite = −0.04) and elevated CO2 partial pressure (PCO2(form) = 10−1.42, equivalent to 3.8 vol. %), consistent with borehole measurements (1.5–6 vol. %). The CO2 gradient (Figure 9) reveals two features: (1) a sharp discontinuity at a depth of 1.7 m marking the GRSL boundary, and (2) a 0.8 m-thick layer with a baseline of 3 vol. % CO2, defining the GRSL itself.
The isotopic signatures (δ13C = −25‰ to −8‰) reflect C3 plant respiration, with minor geogenic input (likely carbonate dissolution). Low O2/CO2 ratios (11–24 vol. %) suggest incomplete oxidation of SOM.

5.4. Isotopic Signatures

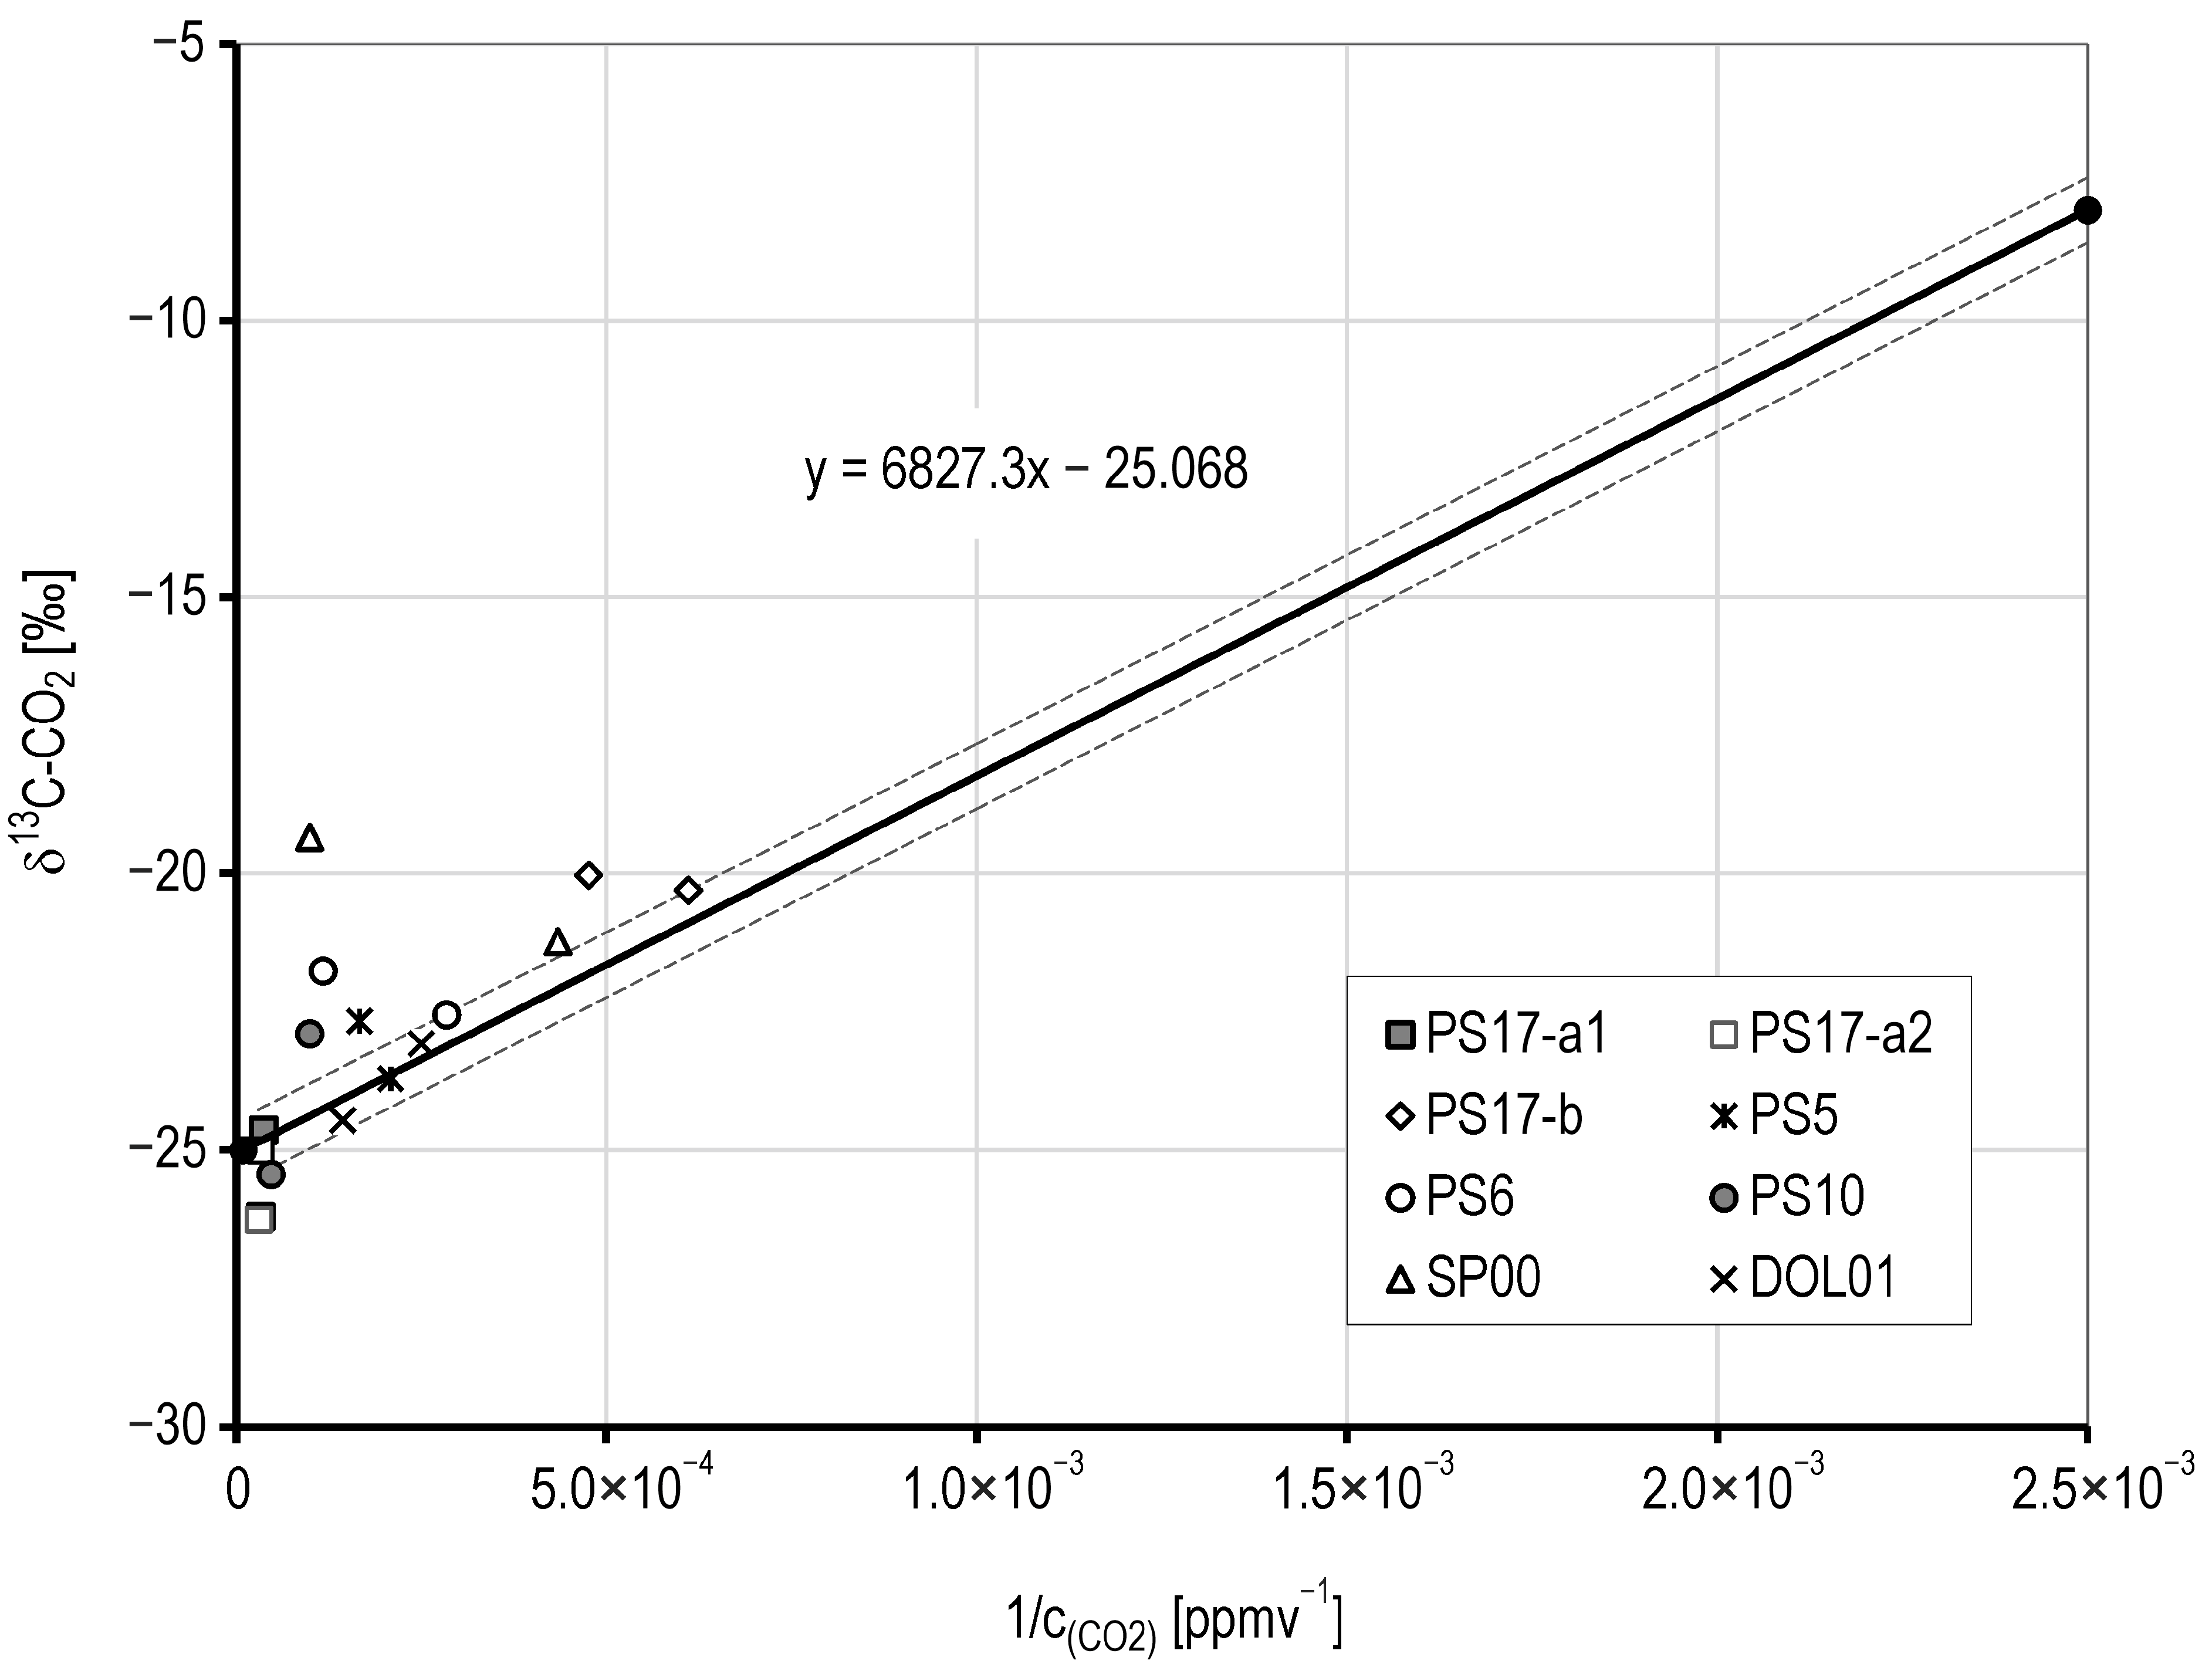
The isotopic composition of CO2 is shown in the Keeling plot, where δ13C-CO2 is plotted against the reciprocal CO2 concentration (Figure 10). This relationship, derived from the law of mass conservation [30], represents the mixing line of the two end members: atmospheric CO213C = −8.0 ± 0.1‰, [CO2] = 420 ppm; [31,32]) and the local biogenic source (δ13C = −25.0 ± 0.5‰, [CO2] = 35,000 ppm; [33,34]).
The points on the line indicate that the soil air is a mixture of the end points. The points above the line (PS6, PS10, PS5, SP00, and PS17-b) indicate a small fraction of abiogenic CO2 probably coming from acidic dissolution of carbonates [6]. Acidity could come from nitrification [35]. Points below the mixing line (PS17-a1, PS17-a2) suggest the presence of another source, e.g., carbon from methanogenesis (δ13C = −55 to −90‰, [36]) or CO2 from cellulose decomposition (δ13C = −27 to −32‰, [37]).
The N2 and O2 concentrations complement each other (Figure 8). However, O2 concentrations show significant deviations from the standard value of about 21 vol. %. Generally, 1 mol of O2 is consumed at the formation of 1 mol of CO2, see Equation (1). Therefore, under ideal conditions (oxidation led to complete CO2 formation), the sum of O2 and CO2 concentrations is 21 vol. %. However, in this study, this sum moves between 11.12 and 24.02 vol. % with a mean value of 19.82 ± 3.01 (SD). The low sum of CO2 and O2 indicates that not all oxygen was consumed for CO2 production. Some oxygen probably binds to oxidized organic molecules during SOM degradation (see the pathways of oxidation of cellulose and lignin in the Section 1).

5.5. Climatic Influences

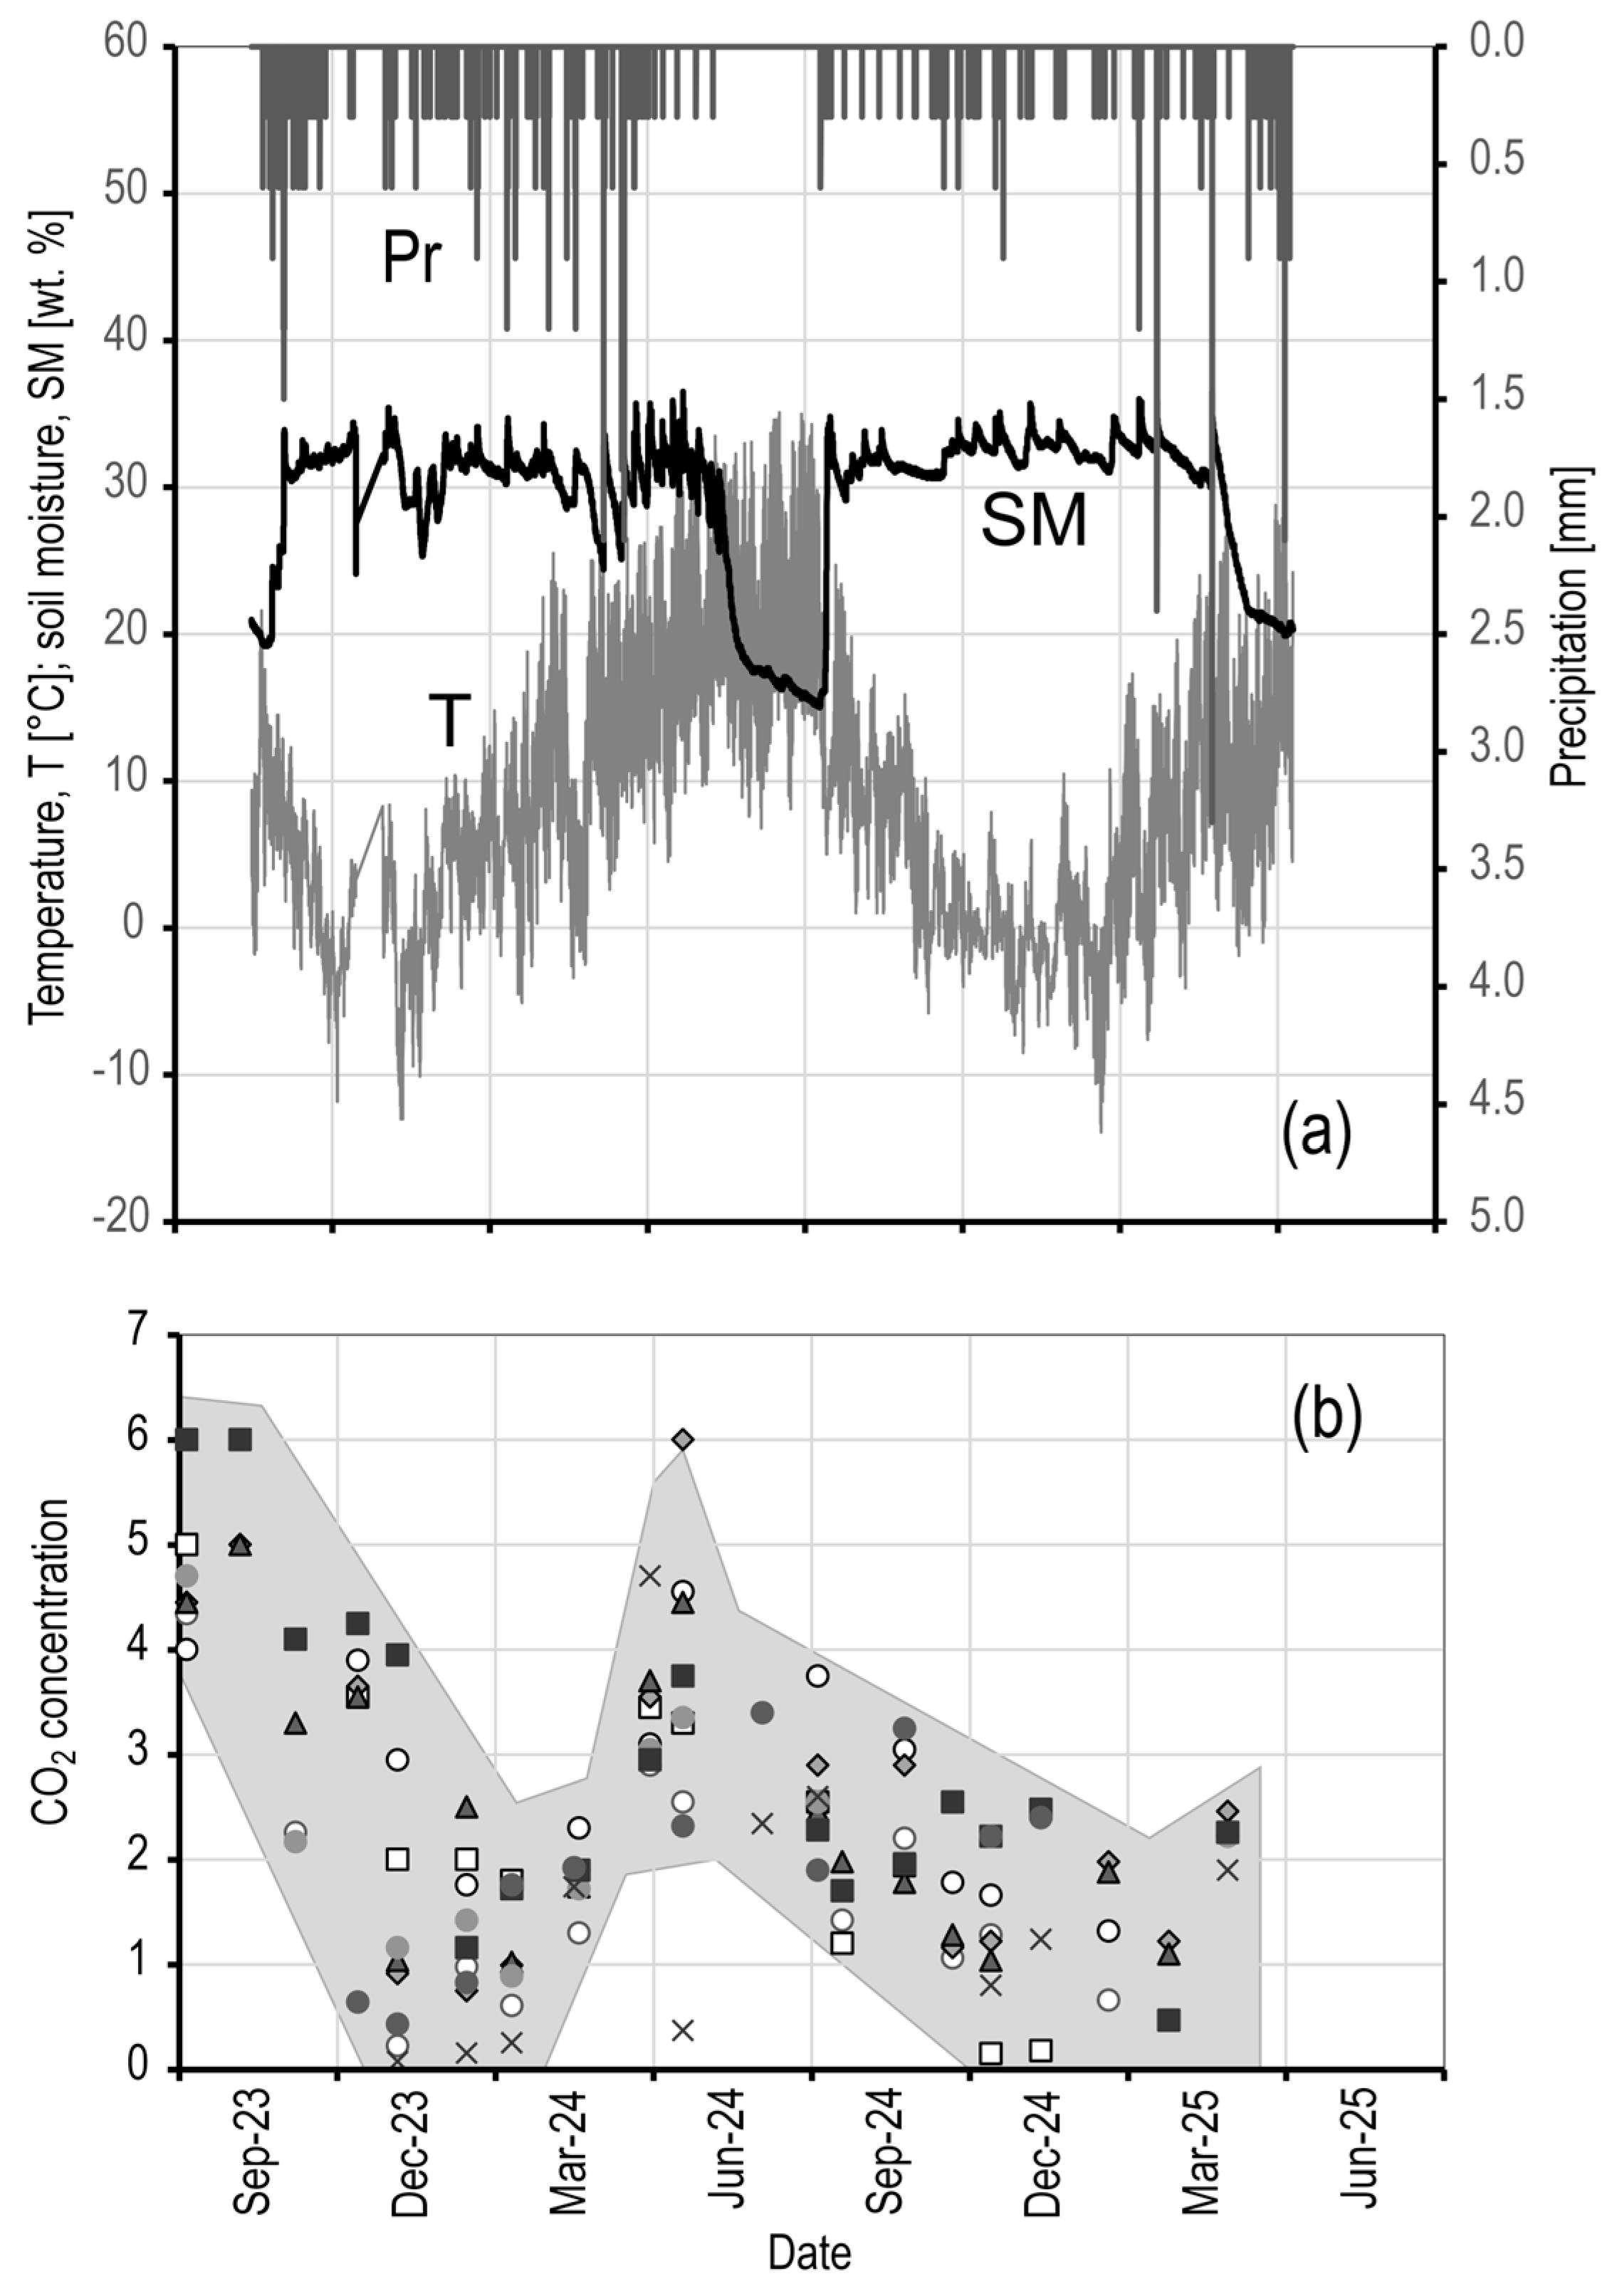
CO2 concentrations within the borehole air exhibit considerable instability, as evidenced by the dispersion of data in Figure 5 and Figure 6. As the conditions in the deeper soil strata, especially temperature, remain relatively stable, consideration of external influences appeared necessary. The temporal evolution of CO2 concentrations was systematically analyzed in correlation with the progression of the climatic variables coming from the Macocha Weather Station (Figure 11a).
The trends in CO2 concentrations weakly correlate with trends in external temperature (positively) and soil moisture (negatively) (Figure 11), see the peaks (Mar–Jun) in temperature (T), soil moisture (SM) (Figure 11a), and CO2 concentrations (Figure 11b). Agricultural remediation (reduced tillage/grass planting [38]) can exacerbate CO2 accumulation by limiting soil ventilation.
Despite the significant variability in the CO2 data (Figure 11b), certain indications of influence are apparent. Peak CO2 concentrations are observed between mid-March and June, roughly aligning with periods of minimal precipitation, reduced soil moisture, and elevated temperatures. On closer analysis, it is observed that the highest temperatures shift to early September, a trend like that observed in the minimum soil moisture levels. From a causal perspective, this shift is unlikely to reflect a strong relationship. The impact of precipitation on 5 June 2024 and 17 May 2024 appears more plausible. However, the expected similar impact on 3 March 2025, 4 April 2025, and 6 May 2025 is minimal, if present at all.

5.6. Conceptual Model

The conceptual model of GRSL formation is in Figure 12. GRSL formation is driven by SOM accumulation at the soil–bedrock interface, with CO2 fluxes (production jₚ, efflux jef, diffusion jd, and water transport jᵥ) governing concentration dynamics. The relatively low concentration of SOM found in the drill cores indicates that the main source of SOM and CO2 could be localized in a lesser area, e.g., in a single depression. From there, CO2 likely spreads to the wider environment.
Generally, the concentration of CO2 in the GRSL, cCO2, is proportional to the sum of all mass fluxes.
c C O 2 k   ( j p j e f j d j w )
where jp, jef, jd,, and jw are fluxes associated with CO2 production, efflux, diffusion through the bedrock, and transport of dissolved CO2, respectively. k is a proportionality coefficient. Note that the fluxes out of the soil have negative signs. It should be emphasized that any change in one of the fluxes will lead to a change in CO2 concentration. Therefore, all factors driving the single CO2 fluxes also influence the soil concentrations.

5.7. Implications

To our knowledge, this is the first report about CO2-rich layers in soil. That is why the direct comparison with similar works is limited. So, we contextualize our findings within adjacent research areas. We can compare our results primarily with the work of Benavente et al. [39] and Vadillo et al. [40], who dealt with CO2 measurements in the karst zone near Nerja Cave (Malaga, southern Spain, <1 km from the Mediterranean shore). The authors report for shallow soils CO2 concentrations in the range of 710 to 6900 ppmv (alternatively 340 to 3200 ppmv). These values are in the range that was also measured in Moravian Karst soils [19]. In deeper wells, Benavente et al. [39] measured CO2 concentrations in the range of 2.5 to 5.5 vol. %, which roughly agree with results our study. However, compared to our study, the values were measured in a much deeper vadose zone (14 to 22 m). The isotopic composition of δ13C-CO2 determined by Benavente et al. [39] ranged from 10.5‰ (atmosphere) to 21.5‰ (soil) or 22.0‰ (boreholes). Some of our samples (PS17-a1, PS17-a2) showed somewhat isotopically lighter CO2, δ13C-CO2 up to −26.3‰ and approaching the value of −27.7‰ reported by Cerling [34] for soil-respired CO2 based on the C3 photosynthetic pathway. However, the average of our values, δ13C-CO2 = −23.1 ± 2.17 (SMODCH) ‰, approaches the value of −23.3‰ resulting from Cerling’s diffusion model [34].
The method of soil/epikarstic CO2 calculation from seepage water hydrogeochemistry was verified due to agreement of calculated concentrations with those measured in the GRSL. The method was generally designed because of the discrepancy between water composition and commonly measured soil CO2 concentrations ([16,17,26]). Atkinson [41] did pioneer work when he was one of the first to point out the discrepancy between the hydrochemistry of karst springs and CO2 concentrations in soils. He called the CO2 calculated from the hydrogeochemistry of the water “subsurface CO2”.

5.8. Environmental Notes

Elevated carbon dioxide concentrations on the Harbechy Plateau are consistent with an agricultural land reclamation that involved the cessation of tillage and the planting of selected grasses [38]. However, this study shows that the remediation method mentioned above appears problematic. Cessation of tillage reduces soil ventilation, potentially exacerbating CO2 accumulation despite decreased SOM input. Given the extensive history of land cultivation, including tillage and fertilization over several centuries, it is reasonable to assume that organic matter was leaching from the topsoil by rainfall and subsequently accumulated at the soil–bedrock interface with reduced permeability. Although carbon dioxide production occurs similarly to before remediation, the cessation of tillage likely led to a reduction in typical soil ventilation during the winter months. Furthermore, the formation of continuous grasslands may hinder the diffusion of carbon dioxide into the atmosphere, thereby reducing the efflux of CO2. The altered ratio of CO2 production/efflux would lead to elevated CO2 concentrations. We plan to conduct an in-depth study of the problems in the future.

6. Conclusions

  • Validation of the GRSL Hypothesis
    • Over the past five decades, the hypothesis of a gas-rich soil layer (GRSL) that controls the composition of percolating water in the karst system has been developed. This study bridges the gap between drip-water-derived CO2 (PCO2(form) = 10–1.48, i.e., 3.8 vol. %) and topsoil measurements.
  • Field Evidence from Harbechy Plateau
    • The haplic anthrosol (loamic, protocalcaric) overlying Harbechy Cave. The GRSL was identified via: (a) drilling (direct detection at the soil–bedrock interface, 2–4 m depth), (b) ERT (confirmed undulating limestone bedrock topography), (c) CO2 gradients (average concentrations of 1.5–3 vol. %, peaking at 4–6 vol. % in a layer 0.8 m thick), and (d) leaking water composition.
  • Isotopic Insights
    • δ13C signatures reveal that GRSL CO2 is a mixture of (a) biogenic (δ13C = −25‰), (b) atmospheric (δ13C = −8‰), and (c) minor abiogenic sources (likely geogenic).
  • Climate Decoupling
    • No significant correlation was found between the GRSL CO2 fluctuations and the weather station data, suggesting that carbon dioxide dynamics are buffered by soil processes.
  • Broader Implications
    • The GRSL represents a previously overlooked carbon pool in karst agroecosystems, with potential impacts on (a) better understanding of karst hydrogeochemistry and karst process, (b) carbon cycling models (especially under land use change), and (c) speleothem formation (through altered seepage water chemistry).
    • This study sheds light on the origin of high CO2 concentrations involved in calcite–CO2−water interactions. However, many questions still await clarification. We need to examine in detail other influences: climatic, local (nature of the soil, agricultural use), and others. It is necessary to examine in detail the influence of fertilization in relation to isotopic composition and concentration, including the establishment of limits.
    • We believe that this work establishes a baseline for future detailed studies.

Author Contributions

Conceptualization, J.F. and V.B.; methodology J.F., V.B., D.O., D.V., R.N., F.K., J.Š. and R.H.; validation, J.F. and J.R.; formal analysis, J.F.; investigation V.B., R.H., J.R., R.N., D.O., M.D., D.V., J.F., J.N., J.Š., F.K., I.K. and F.C.; resources, J.F., R.H., R.N., M.D. and V.B.; data curation, R.H., V.B. and J.F.; writing—original draft preparation, J.F. and J.R.; writing—review and editing, J.F.; visualization, J.F., V.B., R.H., I.K., M.D., D.V., J.Š. and J.R.; supervision, J.F.; project administration, R.N.; funding acquisition, R.N., V.B. and J.F. All authors have read and agreed to the published version of the manuscript.

Funding

This work was supported by: The Technology Agency of the Czech Republic (Project “Rock Environment and Natural Resources” (RENS, No. SS02030023). Institutional funding from: not applicableCzech Geological Survey; Masaryk University; Institute of Geonics.

Institutional Review Board Statement

Not applicable.

Informed Consent Statement

Not applicable.

Data Availability Statement

Data are available upon request from the corresponding author.

Acknowledgments

We sincerely thank: the Nature Conservation Agency of the Czech Republic and Cave Administration of the Czech Republic and ZO ČSS Suchý žleb 6-14 for their extensive logistical support; colleagues from the Czech Geological Survey, Institute of Geonics, and Masaryk University for their invaluable contributions to this project; DeepSeek Chat for editorial support in reference standardization, following COPE guidelines on AI-assisted manuscript preparation; three anonymous reviewers whose constructive feedback significantly improved the manuscript.

Conflicts of Interest

The authors declare no conflict of interest.

Appendix A

Appendix A.1

Figure A1. Diffractograms of randomly oriented representative parts of the analyzed samples with the graphical result of the Rietveld refinement. Black curve = experimental diffractogram, red curve = theoretical diffractogram, gray curve = residue (experimental minus theoretical diffractogram).
Applsci 15 08907 g0a1

Appendix A.2

Figure A2. Diffractograms of oriented mounts with indication diffraction lines marked in Å, angular range 3.7–35.0°2θ.
Applsci 15 08907 g0a2

Appendix A.3

Figure A3. Pedological description of drill cores (Harbechy, Moravian Karst). The names of the cores correspond to the names of the samples.
Applsci 15 08907 g0a3
Legend: Soil type: HNag‘—brown soil, anthropic, slightly gleyic; HNmg‘—brown soil, slightly modal. Soil profile: Ap: sandy loam, lumpy, moist, roots Bt: sandy loam; Ap/Bt: transitional layer with notable gradation; Btg: loam, blocky, limestone grains, moist, slightly gleyic; Btg/C: transitional layer; saclSi: sandy loess loam; AsaclSi: loess loam with anthropogenic influence; grsicl: pelitic loess loam with small limestone fragments (up to 20 mm); sigrCo: loess loam, ochre brown with subangular limestone fragments, at the base transition into limestone eluvium; saSi: sandy loess loam, light brown with roots; Sasi: sandy loess loam, grayish brown; AgrsaSi: sandy loess loam, grayish brown with anthropogenic influence (fragments of bricks and other construction materials); Grsicl: loess loam, slightly sandy in places, ochre brown, clay smudges, subangular fragments of limestone; AsiCl: dark gray loess loam with anthropogenic influence; siclgrBo: loess loam, ochre brown, clay smudges, subangular fragments of limestone; siclGr: loess loam, ochre brown, clay smudges, angular fragments of limestone, at the base transition into limestone eluvium.

References

  1. Xu, M.; Shang, H. Contribution of soil respiration to the global carbon equation. J. Plant Physiol. 2016, 203, 16–28. [Google Scholar] [CrossRef] [PubMed]
  2. Zhang, S.; Bai, X.; Zhao, C.; Tan, Q.; Luo, G.; Wang, J.; Li, Q.; Wu, L.; Chen, F.; Li, C.; et al. Global CO2 consumption by silicate rock chemical weathering: Its past and future. Earths Future 2021, 9, e2020EF001938. [Google Scholar] [CrossRef]
  3. Bertagni, M.B.; Porporato, A. The carbon-capture efficiency of natural water alkalinization: Implications for enhanced weathering. Sci. Total Environ. 2022, 838, 156524. [Google Scholar] [CrossRef] [PubMed]
  4. Kuzyakov, Y.V.; Larionova, A.A. Contribution of rhizomicrobial and root respiration to the CO2 emission from soil (a review). Eurasian Soil Sci. 2006, 39, 753–764. [Google Scholar] [CrossRef]
  5. Holden, S.R.; Berhe, A.A.; Treseder, K.K. Decreases in soil moisture and organic matter quality suppress microbial decomposition following a boreal forest fire. Soil Biol. Biochem. 2015, 87, 1–9. [Google Scholar] [CrossRef]
  6. Fang, C.; Smith, P.; Smith, J.U.; Moncrieff, J.B. Incorporating microorganisms as decomposers into models to simulate soil organic matter decomposition. Geoderma 2025, 129, 139–146. [Google Scholar] [CrossRef]
  7. Tipping, E.; Cayman, C.J.; Luster, J. The C:N:P:S stoichiometry of soil organic matter. Biogeochemistry 2016, 130, 117–131. [Google Scholar] [CrossRef]
  8. Dehghani, F.; Reitz, T.; Schlüter, S.; Kastner, M.; Blagodatskaya, E. Decoupling of heat and CO2 release during decomposition of cellulose and its building blocks in soil. Soil Biol. Biochem. 2025, 206, 109801. [Google Scholar] [CrossRef]
  9. Yuan, X.; Cai, W.; Liang, X.-F.; Su, H.; Yuan, Y.; Li, A.; Tao, Y.-X. Lignocellulose degradation mechanisms across the Tree of Life. Curr. Opin. Chem. Biol. 2015, 29, 108–119. [Google Scholar] [CrossRef]
  10. Hall, S.J.; Huang, W.; Hammel, K.E. Lignin lags, leads, or limits the decomposition of litter and soil organic carbon. Ecology 2020, 101, e03113. [Google Scholar] [CrossRef]
  11. Faimon, J.; Lang, M. What actually controls the minute to hour changes in soil carbon dioxide concentrations? Geoderma 2018, 323, 52–64. [Google Scholar] [CrossRef]
  12. Lang, M.; Faimon, J. Effect of water excess on soil carbon dioxide, seepage water chemistry, and calcite speleothem growth: An experimental and modelling approach. Hydrol. Processes 2020, 34, 4334–4349. [Google Scholar] [CrossRef]
  13. Faimon, J.; Baldík, V.; Štelcl, J.; Všianský, D.; Rez, J.; Pracný, P.; Novotný, R.; Lang, M.; Roubal, Z.; Szabó, Z.; et al. Corrosion of calcite speleothems in epigenic caves of Moravian Karst (Czech Republic). Environ. Earth Sci. 2024, 83, 184. [Google Scholar] [CrossRef]
  14. Woessner, W.W.; Poeter, E.P. Hydrogeologic Properties of Earth Materials and Principles of Groundwater Flow; The Groundwater Project: Guelph, ON, Canada, 2020. [Google Scholar] [CrossRef]
  15. Přibyl, J. Harbešská jeskyně v Moravském krasu [Harbešská Cave in the Moravian Karst]. Čs. Kras 1972, 23, 55–67. (In Czech) [Google Scholar]
  16. Faimon, J.; Ličbinská, M.; Zajíček, P.; Sracek, O. Partial pressures of CO2 in epikarstic zone deduced from hydrogeochemistry of permanent drips, the Moravian Karst, Czech Republic. Acta Carsol. 2012, 41, 47–57. [Google Scholar] [CrossRef]
  17. Peyraube, N.; Lastennet, R.; Denis, A. Geochemical evolution of groundwater in the unsaturated zone of a karstic massif, using the PCO2-SIc relationship. J. Hydrol. 2012, 430–431, 13–24. [Google Scholar] [CrossRef]
  18. Peyraube, N.; Lastennet, R.; Denis, A.; Malaurent, P. Estimation of epikarst air PCO2 using measurements of water δ13CTDIC, cave air PCO2 and δ13CCO2. Geochim. Cosmochim. Acta 2013, 118, 1–17. [Google Scholar] [CrossRef]
  19. Blecha, M.; Faimon, J. Spatial and temporal variations in carbon dioxide (CO2) concentrations in selected soils of the Moravian Karst (Czech Republic). Carbonates Evaporites 2014, 29, 395–408. [Google Scholar] [CrossRef]
  20. Absolon, K. Moravský Kras [Moravian Karst]; Academia: Praha, Czech Republic, 1970. (In Czech) [Google Scholar]
  21. Köppen, W. Das geographische System der Klimate. In Handbuch der Klimatologie; Köppen, W., Geiger, R., Eds.; Gebrüder Borntraeger: Berlin, Germany, 1936; Volume 1, Part C. [Google Scholar]
  22. Quitt, E. Klimatické Oblasti Československa; Geografický ústav ČSAV: Brno, Czech Republic, 1971. (In Czech) [Google Scholar]
  23. Agentura Ochrany Přírody a Krajiny ČR. Podnebí, Charakteristika Oblasti [Climate, Area Characteristics]. 2025. Available online: https://moravskykras.aopk.gov.cz/podnebi (accessed on 10 June 2025). (In Czech)
  24. Redhaounia, B.; Ilondo, B.O.; Gabtni, H.; Sami, K.; Bédir, M. Electrical Resistivity Tomography (ERT) applied to karst carbonate aquifers: Case study from Amdoun, Northwestern Tunisia. Pure Appl. Geophys. 2016, 173, 1289–1303. [Google Scholar] [CrossRef]
  25. Moore, D.M.; Reynolds, R.C., Jr. X-Ray Diffraction and the Identification and Analysis of Clay Minerals, 2nd ed.; Oxford University Press: Oxford, UK, 1997. [Google Scholar]
  26. Milanolo, S.; Gabrovšek, F. Estimation of carbon dioxide flux degassing from percolating waters in a karst cave: Case study from Bijambare cave, Bosnia and Herzegovina. Geochemistry 2015, 75, 465–474. [Google Scholar] [CrossRef]
  27. Pracný, P.; Faimon, J.; Kabelka, L.; Hebelka, J. Variations of carbon dioxide in the air and droplets of Punkva Caves (Moravian Karst, Czech Republic). Carbonates Evaporites 2016, 31, 375–386. [Google Scholar] [CrossRef]
  28. IUSS Working Group WRB. World Reference Base for Soil Resources, 4th ed.; International Union of Soil Sciences: Vienna, Austria, 2022. [Google Scholar]
  29. Parkhurst, D.L.; Appelo, C.A.J. Description of Input and Examples for PHREEQC Version 3-A Computer Program for Speciation, Batch-Reaction, One-Dimensional Transport, and Inverse Geochemical Calculations; U.S. Geological Survey Techniques and Methods: Reston, VA, USA, 2013; Book 6, Chapter A43. [Google Scholar]
  30. Pataki, D.E.; Ehleringer, J.R.; Flanagan, L.B.; Yakir, D.; Bowling, D.R.; Still, C.J.; Buchmann, N.; Kaplan, J.O.; Berry, J.A. The application and interpretation of Keeling plots in terrestrial carbon cycle research. Global Biogeochem. Cycles 2003, 17, 1022. [Google Scholar] [CrossRef]
  31. Bowling, D.R.; Pataki, D.E.; Randerson, J.T. Carbon isotopes in terrestrial ecosystem pools and CO2 fluxes. New Phytol. 2007, 174, 24–40. [Google Scholar] [CrossRef] [PubMed]
  32. Keeling, C.D. The concentration and isotopic abundance of atmospheric carbon dioxide in rural areas. Geochim. Cosmochim. Acta 1958, 13, 322–334. [Google Scholar] [CrossRef]
  33. Gillon, M.; Barbecot, F.; Gibert, E.; Plain, C.; Corcho-Alvarado, J.-A.; Massault, M. Controls on 13C and 14C variability in soil CO2. Geoderma 2012, 189–190, 431–441. [Google Scholar] [CrossRef]
  34. Cerling, T.E.; Solomon, D.K.; Quade, J.; Bowman, J.R. On the isotopic composition of carbon in soil carbon dioxide. Geochim. Cosmochim. Acta 1991, 55, 3403–3405. [Google Scholar] [CrossRef]
  35. Gao, W.; Chen, M.; Xu, X. Tracing controls of autotrophic and heterotrophic nitrification in terrestrial soils. Eur. J. Soil Biol. 2022, 110, 103409. [Google Scholar] [CrossRef]
  36. Whiticar, M.J. Carbon and hydrogen isotope systematics of bacterial formation and oxidation of methane. Chem. Geol. 1999, 161, 291–314. [Google Scholar] [CrossRef]
  37. Hatté, C.; Balesdent, J.; Pizol, L. δ13C of CO2 from cellulose decomposition in soils ranges from −27‰ to −32‰. Soil Biol. Biochem. 2008, 40, 409–412. [Google Scholar] [CrossRef]
  38. Halešová, T.; Kotyzová, M. Zatravnění I. zóny CHKO Moravský kras [Grassland restoration in Zone I of the CHKO Moravian Karst. Ochrana Přírody 2021, 76, 15–18. (In Czech) [Google Scholar]
  39. Benavente, J.; Vadillo, I.; Carrasco, F.; Soler, A.; Liñán, C.; Moral, F. Air Carbon Dioxide Contents in the Vadose Zone of a Mediterranean Karst. Vadose Zone J. 2010, 9, 126–136. [Google Scholar] [CrossRef]
  40. Vadillo, I.; Benavente, J.; Carrasco, F.; Soler, A.; Liñán, C. Isotopic (13C) Signature of CO2 Sources in the Vadose Zone of a Mediterranean Karst (Nerja Cave Site, Southern Spain). In Advances in Research in Karst Media; Andreo, B., Carrasco, F., Durán, J., LaMoreaux, J., Eds.; Springer: Berlin/Heidelberg, Germany, 2010; pp. 71–76. [Google Scholar] [CrossRef]
  41. Atkinson, T.C. Carbon dioxide in the atmosphere of the unsaturated zone: An important control of groundwater hardness in limestones. J. Hydrol. 1977, 35, 111–123. [Google Scholar] [CrossRef]
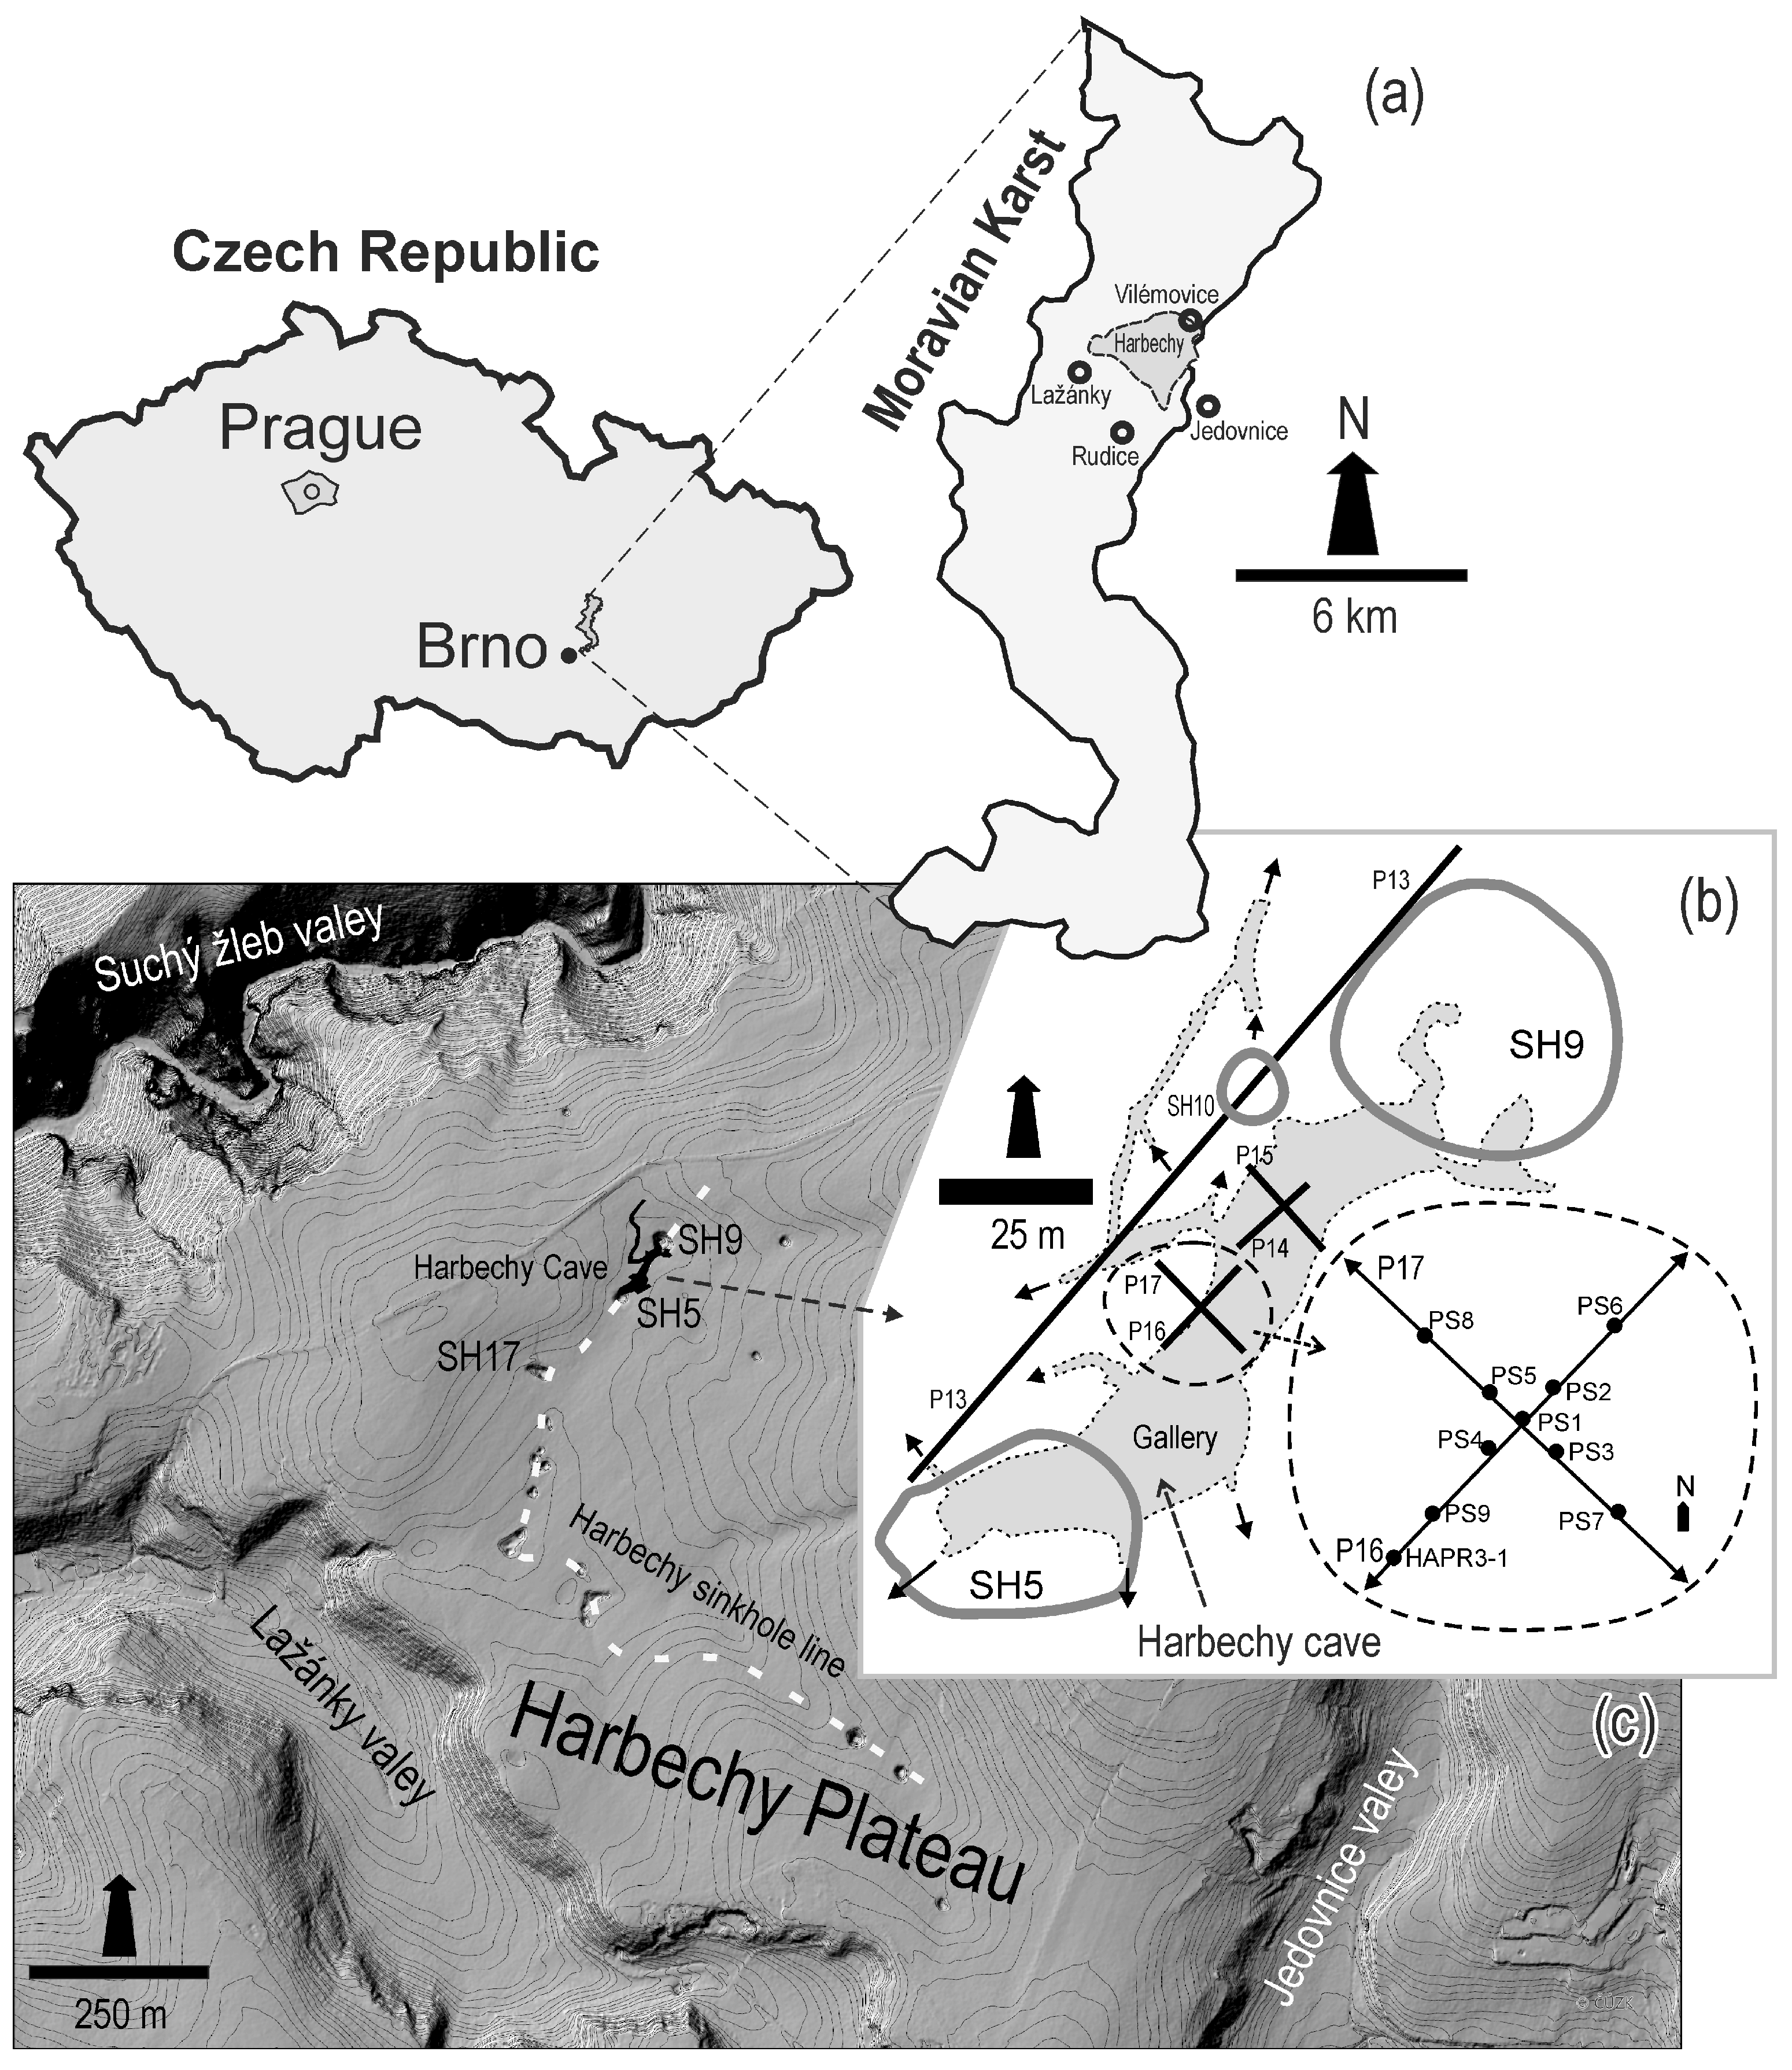
Figure 1. Study site: Moravian Karst overview (a); ERT profiles and boreholes (b); Harbechy Plateau (c). Short arrows in the sketch map (b) indicate probable ways of the air exchange in cave.
Applsci 15 08907 g001
Figure 2. Schematic diagram of the used method hierarchy. SEM/EDXA, XRD analysis, ERT, and IR spectrometry are Scanning Electron Microscopy/Energy Dispersive X-ray Analysis, X-ray Diffraction Analysis, InfraRed spectrometry, respectively.
Applsci 15 08907 g002
Figure 3. ERT profiles (P13–P17) showing resistivity contrasts: dark = wet sediments; light = limestone bedrock. The profile numbers are consistent with those shown in Figure 1. The labels above the profiles indicate the positions of the sinkholes, intersecting profiles, and the wells.
Applsci 15 08907 g003
Figure 4. Loess from Harbechy soils (Moravian Karst). SEM image.
Applsci 15 08907 g004
Figure 5. Distribution of principal constituents in soil air (Harbechy, Moravian Karst). Determined by gas chromatography. The y-axis is on a logarithmic scale. The samples DOL01 and SP00 are comparative samples from the Ostrov Plateau (Moravian Karst) and from the upper entrance of the Harbechy Cave (from 3-m depth), respectively.
Applsci 15 08907 g005
Figure 6. The concentrations of carbon dioxide (CO2), determined directly in the air of the well using a handheld IR spectrometer (Harbechy, Moravian Karst). Each concentration comprises 14 to 30 measurements.
Applsci 15 08907 g006
Figure 7. Carbon dioxide in soil air (Harbechy Plateau, Moravian Karst). Gaseous CO2 concentrations determined with gas chromatography (a); CO2 isotopic composition determined with mass spectrography (b). Each data point is composed of three measurements during different seasons in the period 2024–2025. The point without whiskers corresponds to one measurement. The samples DOL01 and SP00 are comparative samples from the Ostrov Plateau (Moravian Karst) and from the upper entrance of the Harbechy Cave (from 3-m depth), respectively.
Applsci 15 08907 g007
Figure 8. The oxygen (a) and nitrogen (b) concentrations in the soil air at Harbechy (Moravian Karst). Determined by gas chromatography. The samples DOL01 and SP00 are comparative samples from the Ostrov Plateau (Moravian Karst) and from the upper entrance of the Harbechy Cave (from 3-m depth), respectively.
Applsci 15 08907 g008
Figure 9. The gradient of CO2 concentrations measured within the single soil profile, the PS17-01 well. The stratification depicted in the image includes the plowed soil layer (A), the loess layer (B), the gas-rich soil layer (GRSL) (C), and the limestone bedrock (D).
Applsci 15 08907 g009
Figure 10. Keeling plot of borehole air samples with mixing line (bold line) between two endpoints: atmosphere and biogenic CO2. Dashed lines represent the confidence interval (95%) derived from the combined uncertainty of the δ13C measurement (±0.3‰) and the CO2 concentration (±10%). The samples DOL01 and SP00 are comparative samples from the Ostrov Plateau (Moravian Karst) and from the upper entrance of the Harbechy Cave (from 3-m depth), respectively.
Applsci 15 08907 g010
Figure 11. Relation between climatic variables, temperature (T), precipitation (Pr), soil moisture (SM) (all from the Macocha Weather Station) (a), and CO2 concentrations in the soil borehole air (measured by a handheld IR spectrometer) (b).
Applsci 15 08907 g011
Figure 12. A conceptual model depicting the formation of a gas-rich soil layer (GRSL). SOM denotes organic matter; the CO2 fluxes jp, jef, jw, and jd represent production, efflux to atmosphere, migration of dissolved CO2 with water, and direct diffusive/advective flux, respectively. The black area represents loess with an increased concentration of SOM.
Applsci 15 08907 g012
Table 1. Coordinates of the ERT profiles and boreholes in Figure 1.
XYZWGS
P14−587,451.50−1,143,616.89485.0849.3586011116.72924
P14−587,455.96−1,143,620.85485.2349.3585614616.72918
P15−587,463.04−1,143,613.18485.1749.358623316.72907
P15−587,455.96−1,143,620.85485.2349.3585614616.72918
P15−587,448.61−1,143,628.76485.3849.3584977316.72929
P16−587,464.15−1,143,632.08485.5949.3584532416.72909
P16−587,478.85−1,143,647.42485.5049.3583020816.72891
P17−587,479.08−1,143,632.27485.5149.3584373216.72888
P17−587,463.58−1,143,646.88485.8049.3583214516.72912
PS1−587,471.31−1,143,639.42485.6149.3583807916.72900
PS2−587,470.62−1,143,638.71485.5949.583878016.72901
PS3−587,470.55−1,143,640.16485.6249.358374916.72901
PS4−587,472.08−1,143,640.08485.6049.583741616.72899
PS5−587,472.05−1,143,638.82485.6049.3583854516.72899
PS6−587,469.23−1,143,637.31485.6349.3584016416.72902
PS7−587,469.15−1,143,641.52485.6849.3583640716.72903
PS8−587,473.52−1,143,637.53485.5349.3583955916.72897
PS9−587,473.34−1,143,641.56485.6149.3583597216.72897
PS10−587,455.97−1,143,620.86485.2649.3585613616.72918
PS11−587,457.36−1,143,619.42485.2449.3585729116.72916
PS12−587,457.39−1,143,622.22485.3649.3585478416.72916
PS17−587,655.67−1,143,761.03486.1249.3571177916.72665
PS18−586,072.57−1,139,866.72504.4249.3934470016.74265
PS25−586,349.49−1,140,723.66484.6249.3855210016.74010
HAPR3-1−587,477.42−1,143,645.52485.4549.3583210016.72892
P14 to P17 are ERT profiles (Figure 1). PS1 to PS25 are wells (boreholes) (Figure 1). PS17-1 (not shown in Figure 1) is the well near sinkhole 17 (SH17).
Table 2. EDX analysis of loess: spot analysis of individual particles and mean composition from sample area (wt. %).
NaMgAlSiKCaTiMnFeO
Spot Analysisn0.896.5632.490.790.490.26n11.3247.21
0.292.7838.370.310.23n nn8.9249.1
0.250.647.1334.460.920.64n0.726.5848.65
2.50.8211.6328.932.440.7nn5.8347.16
n1.0513.8824.915.10.910.46n8.2145.48
n0.557.6735.671.080.56nn4.8249.65
n1.2214.9725.124.940.550.35n6.7346.12
Area 50 × 50 µmn1.0610.7428.392.070.640.53n10.0546.51
n—below detection limit.
Table 3. Quantitative XRD phase analyses of loesses (drill cores, Harbechy Plateau, MK).
Minerals/SamplesHarbechy Loesses—DarkHarbechy Loesses—Light
Clay mineralsSmectite38.913.5
IIllite and mica structures 18.611.2
Kaolinite10.42.7
Chlorite0.42.1
OxidesAnatase1.10.3
Goethite13.97.9
Hematite0.30.1
Quartz12.245.8
CarbonatesCalcite0.60.1
SilicatesK-feldspar3.16.9
Plagioclase0.89.5
Sum100.3100.1
The mineral content is given as weight percentages.
Table 4. Composition of leaking/dripping water in Harbechy Cave. Gallery.
ConcentrationsMethod
pH 6.8Potentiometry
SodiumNa3.97 × 10−4ICP-OES
PotassiumK<1 × 10⁻⁵ICP-OES
Ammonium ionsNH4+7.22 × 10⁻⁶Spectrophotometry
CalciumCa6.74 × 10−3ICP-OES
MagnesiumMg1.65 × 10−4ICP-OES
SulfatesS4.69 × 10−4ICP-OES
ChloridesCl8.47 × 10−5Spectrophotometry
NitritesNO27.15 × 10−7Spectrophotometry
NitratesNO38.57 × 10−3Spectrophotometry
PhosphatesP3.23 × 10−6Spectrophotometry
Alkalinity 5.88 × 10⁻³Volumetric
All concentrations are expressed as mol/L units.
Table 5. Saturation indices (SI) and ion activity products (IAP) for infiltrated water (Harbechy Cave), calculated using the PHREEQC code [29].
Mineral PhaseSIlog IAPlog KT
AnhydriteCaSO4−1.79−6.13−4.34
AragoniteCaCO3−0.19−8.44−8.25
CalciteCaCO3−0.04−8.44−8.4
CO2(g)CO2−1.38−2.62−1.24
DolomiteCaMg(CO3)2−1.82−18.49−16.67
GypsumCaSO4.2H2O−1.53−6.13−4.6
HaliteNaCl−9.14−7.61.54
HydroxyapatiteCa5(PO4)3OH−2.06−3.87−1.82
CO2(g) means PCO2(w) = 10−1.38, where PCO2(w) is the partial pressure of CO2 in water [26,27]. IAP—ion activity product; KT—temperature-dependent equilibrium constant.
Table 6. Results of modeling of water composition in PHREEQC [29]. The CO2(g)form is the logarithm of the partial pressure of CO2 at which the composition of the leaking water was formed.
Mineral Phase SIlog IAPlog KT
AnhydriteCaSO4−1.79−6.13−4.34
AragoniteCaCO3−0.16−8.4−8.25
CalciteCaCO30−8.4−8.4
CO2(g)formCO2−1.42−2.66−1.24
DolomiteCaMg(CO3)2−1.74−18.42−16.67
GypsumCaSO4:2H2O−1.53−6.13−4.6
HaliteNaCl−9.14−7.61.54
HydroxyapatiteCa5(PO4)3OH−1.85−3.67−1.82
The CO2(g)form in this case is PCO2(form) = 10−1.42.
Disclaimer/Publisher’s Note: The statements, opinions and data contained in all publications are solely those of the individual author(s) and contributor(s) and not of MDPI and/or the editor(s). MDPI and/or the editor(s) disclaim responsibility for any injury to people or property resulting from any ideas, methods, instructions or products referred to in the content.