Article

The Influence Mechanism and Identification Method of the First Four Harmonics of the Mass Defect of Hemispherical Resonators

1
College of Intelligence Science and Technology, National University of Defense Technology, Changsha 410073, China
2
National Key Laboratory of Equipment State Sensing and Smart Support, National University of Defense Technology, Changsha 410073, China
*
Author to whom correspondence should be addressed.
Appl. Sci. 2025, 15(16), 8851; https://doi.org/10.3390/app15168851
Submission received: 17 July 2025 / Revised: 1 August 2025 / Accepted: 8 August 2025 / Published: 11 August 2025

Abstract

The influence mechanism and identification of mass defects in hemispherical resonators are currently highly challenging and significant research directions. This paper first establishes a shell–rod coupling vibration model under the influence of mass error, and, based on this model, constructs a characterization system for the vibration characteristics (quality factor and frequency split) of the resonator. The influence of the first four harmonic components of the mass defect on the quality factor and frequency split of the resonator was systematically studied, and the analytical expression of its quantitative representation was derived, which reveals the internal physical relationship between the mass defect and the vibration characteristics. Subsequently, the theoretical model was verified by using finite element simulation. Finally, an efficient and high-precision method for identifying the first four harmonics of hemispherical resonator mass defects was proposed, and an experimental device was set up to successfully achieve the synchronous identification of the first four harmonic components. An innovative beam-split optical system that streamlines displacement metrology reduced test complexity by >60%.

1. Introduction

Gyroscopes and accelerometers are the core of inertial navigation systems, among which gyroscopes are used to establish the mathematical connection between the navigation coordinate system and the inertial coordinate system [1]. The hemispherical resonator gyroscope (HRG) is currently the most promising solid-state wave gyroscope, featuring long service life, high reliability, low power consumption, and radiation resistance. It can handle inertial navigation tasks in various fields, such as aerospace and navigation [2,3]. The core component, the hemispherical resonator, is a sensitive element with high brittleness and symmetry, which is extremely difficult to manufacture. Therefore, its manufacturing accuracy directly determines the working performance of HRG [4,5].
The mass of the ideal resonator shell is uniformly distributed. However, various processing errors inevitably occur during the manufacturing process, leading to mass defects in the resonator [6,7]. These defects are usually described in the form of Fourier series expansion. Among them, the first four harmonic components of the mass defects have a dominant influence on the resonator. The fourth harmonic component has received extensive research focus due to its significant magnitude and relative ease of identification and elimination, yielding substantial progress [8,9,10,11], while there are relatively few studies on the errors of the first three harmonics. It is now found that the first three harmonic components also have a significant impact on the performance of the resonator, and their identification and elimination are relatively difficult. Therefore, research in this field is necessary and crucial [12,13]. Sagem established a theoretical model of the impact of mass defects on the quality factor, indicating that even a very small amount of quality defects can cause a sharp decline in the quality factor [14]. Shi et al. found that the first harmonic of the mass defect caused by laser processing deviation has a significant impact on the quality factor [15]. Lu et al. found through asymmetric trimming of the resonator that the mass defects of the first and second harmonics would lead to a significant reduction in the quality factor [16]. These studies collectively confirm the necessity of analyzing and eliminating the first three harmonic errors. Luo et al. analyzed anchor loss caused by imperfect mass distribution in cylindrical resonators [17]. Fan et al. derived the approximate analytical equation of the resonator coupled vibration by utilizing the energy changes during the spherical shell vibration process [18]. Finite element simulations in [19,20] detailed anchor loss mechanisms, quantifying impacts from geometric parameters, manufacturing tolerances, and external disturbances. Yao et al. established a parametric model of the resonator through finite element analysis, simulating the influence of spherical shell mass defects on frequency splitting across multiple harmonics [21]. Yuan et al. developed a quantitative relationship model between the first three harmonic-order mass defects and the support rod’s forced vibrations, analyzing the energy transfer path and dissipation mechanism from the spherical shell to the resonator’s support structure [22].
Accurate identification of mass defects is a prerequisite for their elimination. Basarab et al. studied the uneven thickness of resonators [23] and designed a magnetic sensor to identify the mass defects of cylindrical metal resonators [24]. Tao et al. identified the second harmonic components by using first-order frequency split [25]. Cheng et al. identified the first and third harmonics in hemispherical resonators by measuring the steady-state velocity response of a support rod using laser vibrometry [26]. Ning et al. achieved error identification for the first three harmonics through characterization of standing wave precession evolution [27]. Based on the mass ring model, Chen et al. derived the influence laws of the first three harmonics on the resonator’s dynamic characteristics, enabling the identification of both first- and third-order harmonic errors [28]. Although both methods [26,27,28] demonstrate high accuracy, their implementation involves complex procedures with significant operational intricacy.
The above-mentioned work has studied the influence mechanism and identification methods of the first three harmonic components of the mass defect on the vibration characteristics of the hemispherical resonator. However, it fails to clearly describe the intrinsic connection between the mass defect and the support loss, it lacks a complete system that simultaneously considers the influence of the first four harmonic errors on the vibration characteristics of the resonator, and the relevant identification methods are cumbersome and inefficient. And, it fails to simultaneously identify the errors of the first four harmonics. Therefore, this paper establishes a shell–rod coupling vibration model under the influence of the mass error of the hemispherical resonator. Based on the model, a resonator vibration characteristic characterization system was established. The influence of the first four harmonics of the mass defect on the quality factor and frequency split was systematically analyzed, and the analytical expression was derived, revealing the intrinsic connection between the mass defect and the vibration characteristics. Finally, an efficient and high-precision method for identifying the first four harmonics of resonator mass defects was proposed, and an experimental device was set up for identification experiments.

2. Hemispherical Resonator Mass Defects Characterization System

2.1. Hemispherical Resonator Shell–Rod Coupling Vibration Model

To establish a mass defects characterization system for a hemispherical resonator, the shell–rod coupling vibration equation of the resonator is first derived. The shell–rod coupling vibration of the resonator is shown in Figure 1, where R is the surface radius of the spherical shell. θ and φ are, respectively, the direction angles of the longitude and latitude lines. un, vn, and wn are, respectively, the displacements of points on the shell along the longitude, latitude, and normal directions under the n-th mode shape, with n = 1,2; x2 and y2, respectively, represent the displacements of the shell in the x and y directions; and x1, y1, and z1, respectively, represent the displacements of the support rod in the x, y, and z directions.
The force acting on the micro-elements on the spherical shell surface is shown in Figure 1. According to the elastic thin shell theory, the deformation geometric equation of the resonator indicates the relationship between the change of the middle surface and the displacement of the middle surface [29]:
ε 1 = 1 R u θ + w R ε 2 = 1 R sin θ v φ + u R cot θ + w R ε 12 = 1 R sin θ u φ + 1 R v θ v cot θ χ 1 = 1 R 2 2 w θ 2 w R 2 χ 2 = 1 R 2 sin 2 θ 2 w φ 2 1 R 2 cot θ w θ w R 2 χ 12 = 1 R 2 sin θ 2 w θ φ cot θ w φ
where R is the radius of the medium surface and ε1 and ε2 are the positive strains of each point on the medium surface along the directions of θ and φ, respectively. ε12 is the shear strain along the θ and φ directions on the medium surface. χ1 and χ2 represent the changes in the principal curvatures of each point on the middle surface. χ12 represents the change in torque along the θ and φ directions on the medium surface.
Furthermore, by using Hooke’s law to establish the relationship between stress and geometric quantities, the simplified form of Hooke’s law in the thin-shell case is obtained through the Kirchhoff–Love hypothesis (the physical equation of the resonator describes the relationship between the internal force of the middle surface and the deformation of the middle surface) [29]:
σ 1 = E 1 μ 2 ( ε 1 + μ ε 2 ) + ( χ 1 + μ χ 2 ) z σ 2 = E 1 μ 2 ( ε 2 + μ ε 1 ) + ( χ 2 + μ χ 1 ) z τ 12 = E 2 ( 1 + μ ) ε 12 + 2 χ 12 z
where E is the elastic modulus of the hemispherical shell; μ is the Poisson’s ratio; and σ1 and σ2 are normal stresses in the θ and φ directions, respectively. τ12 is the corresponding shear stress.
Based on the Kirchhoff–Love hypothesis of inextensibility of the middle surface, Lord Rayleigh’s inextensional theory applies to the flexural vibration of top-free shells when deformation is small and mid-surface strains vanish:
ε 1 = ε 2 = ε 12 = 0
According to Equations (1)–(3), the Rayleigh function corresponding to the n-th order mode shape can be solved:
U n ( θ ) = V n ( θ ) = sin θ   tan n θ 2 W n ( θ ) = ( n + cos θ ) tan n θ 2
Then, let the displacements at each point under the n-th mode of the resonator be expressed as
u n = sin θ   tan n θ 2 x n cos n φ + y n sin n φ v n = sin θ   tan n θ 2 x n sin n φ y n cos n φ w n = ( n + cos θ ) tan n θ 2 x n cos n φ + y n sin n φ
Then, the combined displacement equation for the shell and rod is given by
u = u 1 + u 2 v = v 1 + v 2 w = w 1 + w 2
The kinetic energy of the resonator can be expressed as
E k = ρ R 2 2 0 π / 2 0 2 π h sin θ ( u ˙ 2 + v ˙ 2 + w ˙ 2 ) d φ d θ
where h represents the thickness of the resonator spherical shell and ρ represents the density of the resonator. Because the resonator material adopts high-precision fused quartz, its density can be regarded as a constant value.
For a resonator with mass defects, it is assumed that the thickness distribution along the edge of the resonator’s spherical shell is uneven. The thickness can be expanded according to the Fourier series, the first four harmonic forms of mass defects is shown in Figure 2. Because the first four harmonic errors are the dominant factor and the harmonic errors above the fourth are ignored, the thickness expansion can be expressed as
h = i = 1 4 h i 1 + cos i ( φ φ i )
Imbalance mass distribution can be expressed as
M = i = 1 4 M i 1 + cos i ( φ φ i )
where Mi represents the relative amplitude of each harmonic error and φi represents the azimuth of each harmonic error. The transformation relationship between thickness imbalance and mass imbalance is shown in Equations (10) and (11).
M i = M i a 2 + M i b 2
M i a = R 2 ρ 0 π / 2 0 2 π h   tan 2 θ 2 sin 2 θ cos i φ d φ d θ M i b = R 2 ρ 0 π / 2 0 2 π h   tan 2 θ 2 sin 2 θ sin i φ d φ d θ
Then, the kinetic energy of the resonator with mass defects is
E k = 1 2 [ m 1 ( x ˙ 1 2 + y ˙ 1 2 + z ˙ 1 2 ) + m 2 ( x ˙ 2 2 + y ˙ 2 2 ) ] 1 4 [ ( 3 M 1 + M 3 ) x ˙ 1 x ˙ 2 + ( 3 M 1 M 3 ) y ˙ 1 y ˙ 2 + M 2 x ˙ 1 z ˙ 2 + M 2 y ˙ 1 z ˙ 2 ]
where m1 and m2 are the equivalent masses of the first- and second-order vibrations of the resonator, respectively.
According to the relationship between point stress and strain on the resonator, the elastic potential energy of the resonator can be obtained as
E p = 1 2 [ k 1 ( x ˙ 1 2 + y ˙ 1 2 + z ˙ 1 2 ) + k 2 ( x ˙ 2 2 + y ˙ 2 2 ) ]
where k1 and k2 represent the stiffness of the support rod and the spherical shell, respectively.
The Rayleigh dissipation function of the resonator is
E r = 1 2 [ ξ 1 ( x ˙ 1 2 + y ˙ 1 2 + z ˙ 1 2 ) + ξ 2 ( x ˙ 2 2 + y ˙ 2 2 ) ]
where ξ1 and ξ2 are the damping dissipation coefficients of the support rod and the spherical shell, respectively.
Substitute the vibrational energy expression of the resonator into the Lagrange equation:
L = d d t E k q ˙ E k q + E p q + E r q ˙
where q represents any of the independent variables x1, y1, z1, x2, and y2. L is the generalized force exerted externally on the resonator. When studying the free vibration of the resonator, it can be assumed to be zero.
The multi-order coupling vibration equation of the resonator under working conditions is obtained as
m 1 x ¨ 1 + ξ 1 x ˙ 1 + k 1 x 1 f 1 x ¨ 2 = 0 m 1 y ¨ 1 + ξ 1 y ˙ 1 + k 1 y 1 f 2 y ¨ 2 = 0 m 1 z ¨ 1 + ξ 1 z ˙ 1 + k 1 z 1 f 3 x ¨ 2 = 0 m 1 z ¨ 1 + ξ 1 z ˙ 1 + k 1 z 1 f 3 y ¨ 2 = 0 m 2 x ¨ 2 + ξ 2 x ˙ 2 + k 2 x 2 f 1 x ¨ 1 = 0 m 2 y ¨ 2 + ξ 2 y ˙ 2 + k 2 y 2 f 2 y ¨ 1 = 0 m 2 x ¨ 2 + ξ 2 x ˙ 2 + k 2 x 2 f 3 z ¨ 1 = 0 m 2 y ¨ 2 + ξ 2 y ˙ 2 + k 2 y 2 f 3 z ¨ 1 = 0
the coefficients of each term in the formula are shown in Appendix A. f1, f2, and f3 are the coupling term coefficients, representing the coupling of the vibration in each direction between the support rod and the spherical shell, respectively:
f 1 = 1 4 [ 3 M 1 cos ( 2 φ φ 1 ) + M 3 cos ( 2 φ 3 φ 3 ) ] f 2 = 1 4 [ 3 M 1 sin ( 2 φ φ 1 ) M 3 sin ( 2 φ 3 φ 3 ) ] f 3 = 1 2 M 2 cos ( 2 φ 2 φ 2 )

2.2. Characterization of the Influence of Mass Defects on Quality Factors

The vibration equations of the resonator are pairwise coupled, and the characteristic determinants of each pair of coupled equations have the following relationship:
Δ = det m 0 λ 2 + ξ 0 λ + k 0 f i λ 2 f i λ 2 m λ 2 + ξ λ + k
where i = 1, 2, and 3 represent the corresponding coupling term coefficients. The characteristic polynomial is
( m 2 λ 2 + ξ 2 λ + k 2 ) ( m 1 λ 2 + ξ 1 λ + k 1 ) f i 2 λ 4 = 0
The characteristic root real part is
Re Δ λ 0 1 4 f i 2 m 2 ξ 2 m 1 2 1 ω 1 2 ω 2 2 2
where ω1 and ω2 are the natural frequencies of the first- and second-order vibration modes, respectively.
Then, the quality factor is
Q = ω 2 Re Δ λ 0
From this, the support loss in each direction caused by the coupling vibration of the support rod and the spherical shell can be obtained. Then, the total support loss caused by the coupling of the shell–rod is
Q s = 1 1 Q x + 1 Q y + 1 Q z = 32 m 2 m 1 2 ω 2 3 ξ 1 ω 1 2 ω 2 2 2 9 M 1 2 + M 3 2 + 2 M 2 2 + 6 M 1 M 3 cos 4 φ φ 1 3 φ 3 2 M 2 2 cos 4 φ 4 φ 2
From Equation (22), it can be seen that the first three harmonics of mass defects will cause support loss, reduce the quality factor of the resonator, and lead to an uneven quality factor.
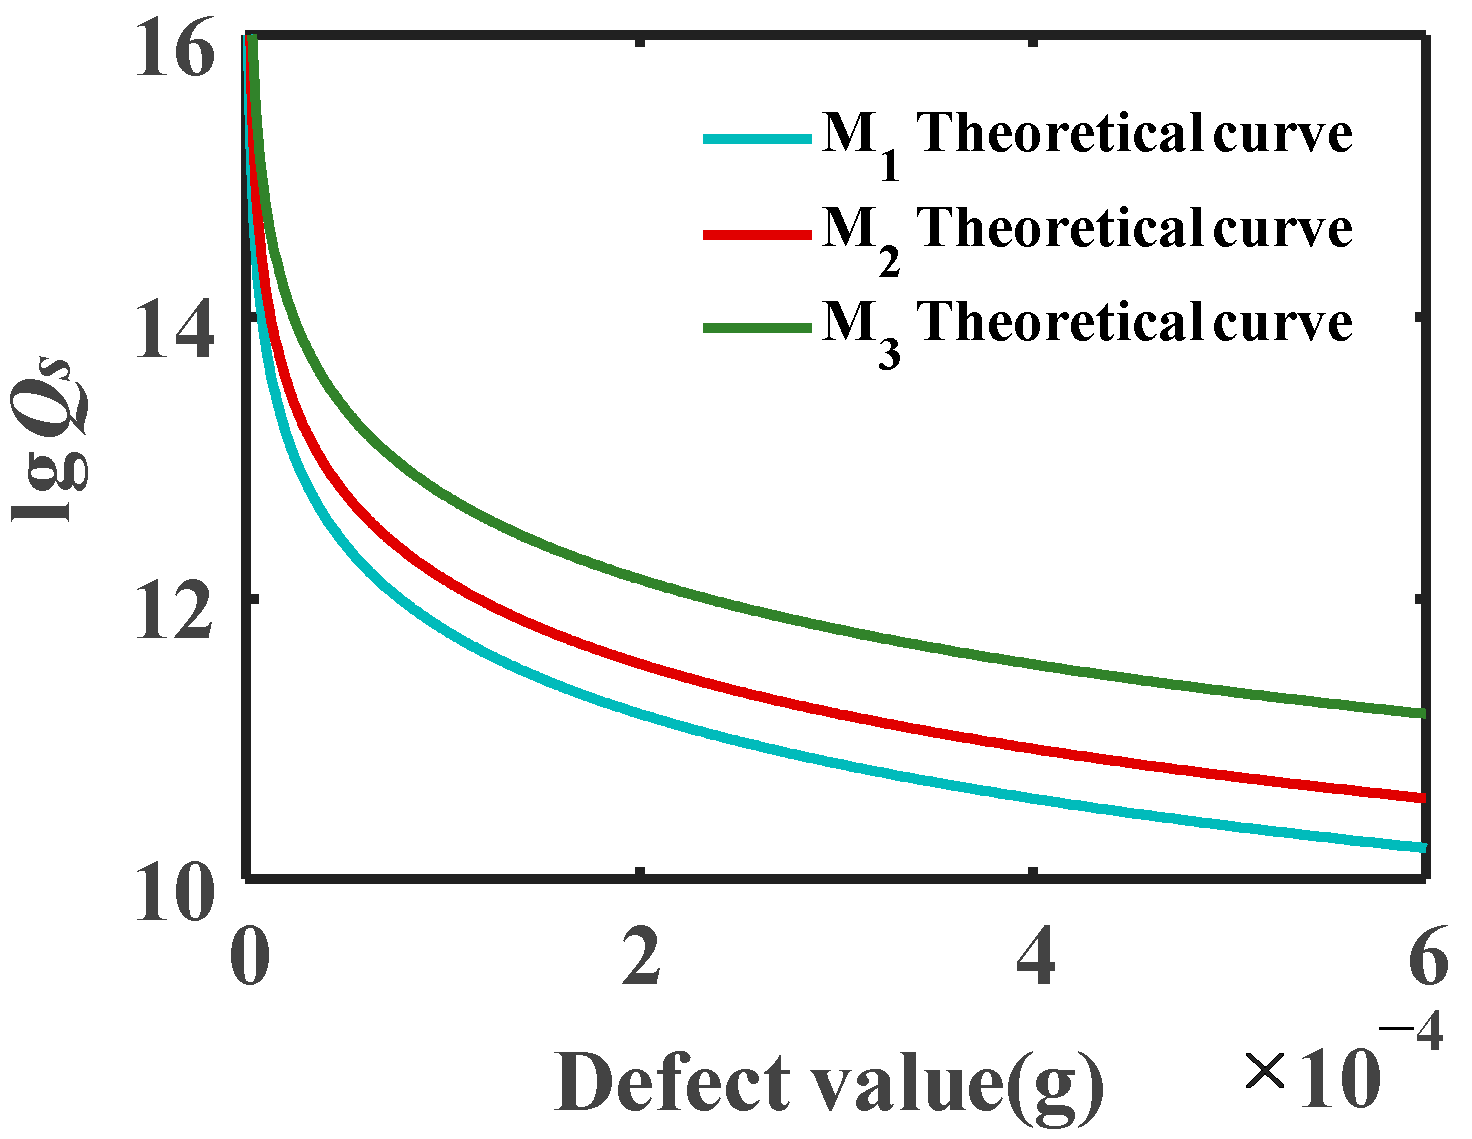
The influence curve of the first three harmonics on the support loss is shown in Figure 3. For ease of comparison, the vertical coordinate is taken in the form of the logarithm of the quality factor. It can be seen that the influence of the first harmonic is greater than that of the second harmonic and greater than that of the third harmonic.

2.3. Characterization of the Influence of Mass Defects on Frequency Split

In the second-order free vibration state of the hemispherical resonator, the kinetic energy, potential energy, and Rayleigh dissipation functions are obtained from the second-order vibration displacement u2, v2, and w2 in Equations (8)–(11). According to the Lagrange Equation (15), the second-order free vibration equation of the hemispherical resonator with mass imbalance is obtained:
m 2 + a 4 M 4 cos 4 ( φ φ 4 ) + a 2 M 2 cos 2 ( φ φ 2 ) x ¨ 2 + a 2 M 2 cos 2 ( φ φ 2 ) + a 2 M 2 sin 2 ( φ φ 2 ) x ˙ 2 + k 2 b + c 1 + 3 b a 4 M 4 cos 4 ( φ φ 4 ) x 2 + a 4 M 4 sin 4 ( φ φ 4 ) + a 2 M 2 cos 2 ( φ φ 2 ) y ¨ 2 + ξ 2 + a 2 M 2 cos 2 ( φ φ 2 ) + a 2 M 2 sin 2 ( φ φ 2 ) y ˙ 2 + k 2 c 2 + 3 b a 4 M 4 sin 4 ( φ φ 4 ) y 2 = 0 m 2 a 4 M 4 cos 4 ( φ φ 4 ) + a 2 M 2 sin 2 ( φ φ 2 ) y ¨ 2 + a 2 M 2 sin 2 ( φ φ 2 ) a 2 M 2 cos 2 ( φ φ 2 ) y ˙ 2 + k 2 b + c 1 3 b a 4 M 4 cos 4 ( φ φ 4 ) y 2 + a 4 M 4 sin 4 ( φ φ 4 ) + a 2 M 2 cos 2 ( φ φ 2 ) x ¨ 2 + ξ 2 + a 2 M 2 sin 2 ( φ φ 2 ) + a 2 M 2 cos 2 ( φ φ 2 ) x ˙ 2 + k 2 c 2 + 3 b a 4 M 4 sin 4 ( φ φ 4 ) x 2 = 0
The coefficients of each term in the formula are shown in Appendix A. In c1 and c2, o(Mi) represents a higher-order infinitesimal of Mi and can be generally ignored. Therefore, c1 and c2 can be disregarded.
From Equation (23), the expression of the second-order natural frequency of the hemispherical resonator can be obtained:
ω 21 = k 2 b 1 + 3 a 4 M 4 m 2 + a 4 M 4 + a 2 M 2 ω 22 = k 2 b 1 3 a 4 M 4 m 2 a 4 M 4 + a 2 M 2
Then, the frequency split of the second-order mode of the resonator is as follows:
Δ f = 1 2 π k 2 b 1 + 3 a 4 M 4 m 2 + a 4 M 4 + a 2 M 2 k 2 b 1 3 a 4 M 4 m 2 a 4 M 4 + a 2 M 2
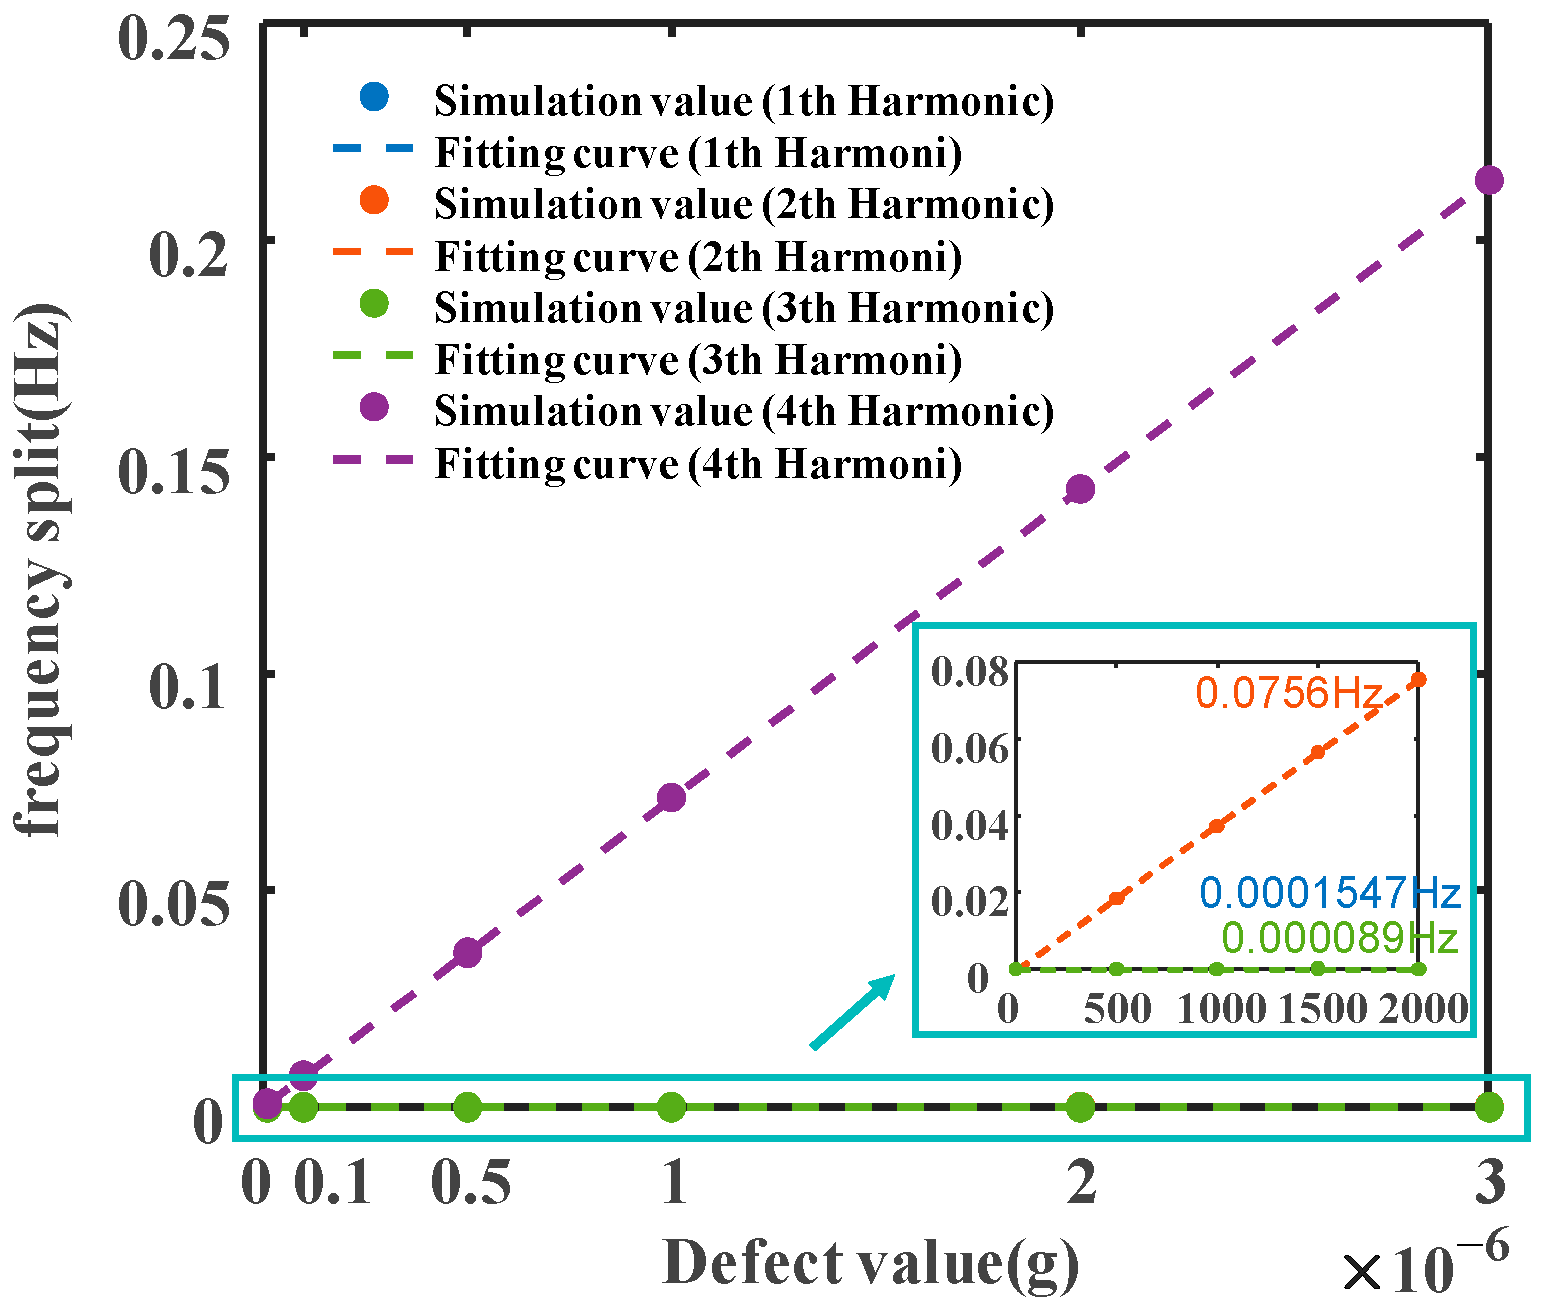
The influence of the second and fourth harmonics on frequency split is shown in Figure 4. It can be seen that the influence of the fourth harmonic on frequency split is much greater than that of the second harmonic, and the influence of the second harmonic can be ignored. The influence of both on frequency split is directly proportional.
If the influence of the second harmonic error on frequency split is ignored and only the fourth harmonic error is considered, the frequency split expression is
Δ f = 1 2 π k 2 b 1 + 3 a 4 M 4 m 2 + a 4 M 4 k 2 b 1 3 a 4 M 4 m 2 a 4 M 4
When a 1 M 4 m 2 , the denominator can be approximated as m 2 ± a 4 M 4 m 2 . The terms in a molecule can be approximated by first-order expansion as
k 2 b m 2 1 ± 3 a 4 M 4 k 2 b m 2 1 ± 3 a 4 M 4 2
Then, the frequency split expression can be simplified as
Δ f 3 a 4 2 π k 2 b m 2 M 4

3. Simulation Analysis

To verify the correctness of the theoretical formula, finite element simulations were conducted on the support loss and frequency split of the resonator using COMSOL (6.0) and Ansys (R18.0) simulation software, respectively. The established models and related parameters are shown in Figure 5. The material was set as fused silica, and the relevant physical parameters are presented in Table 1.

3.1. Support Loss Simulation

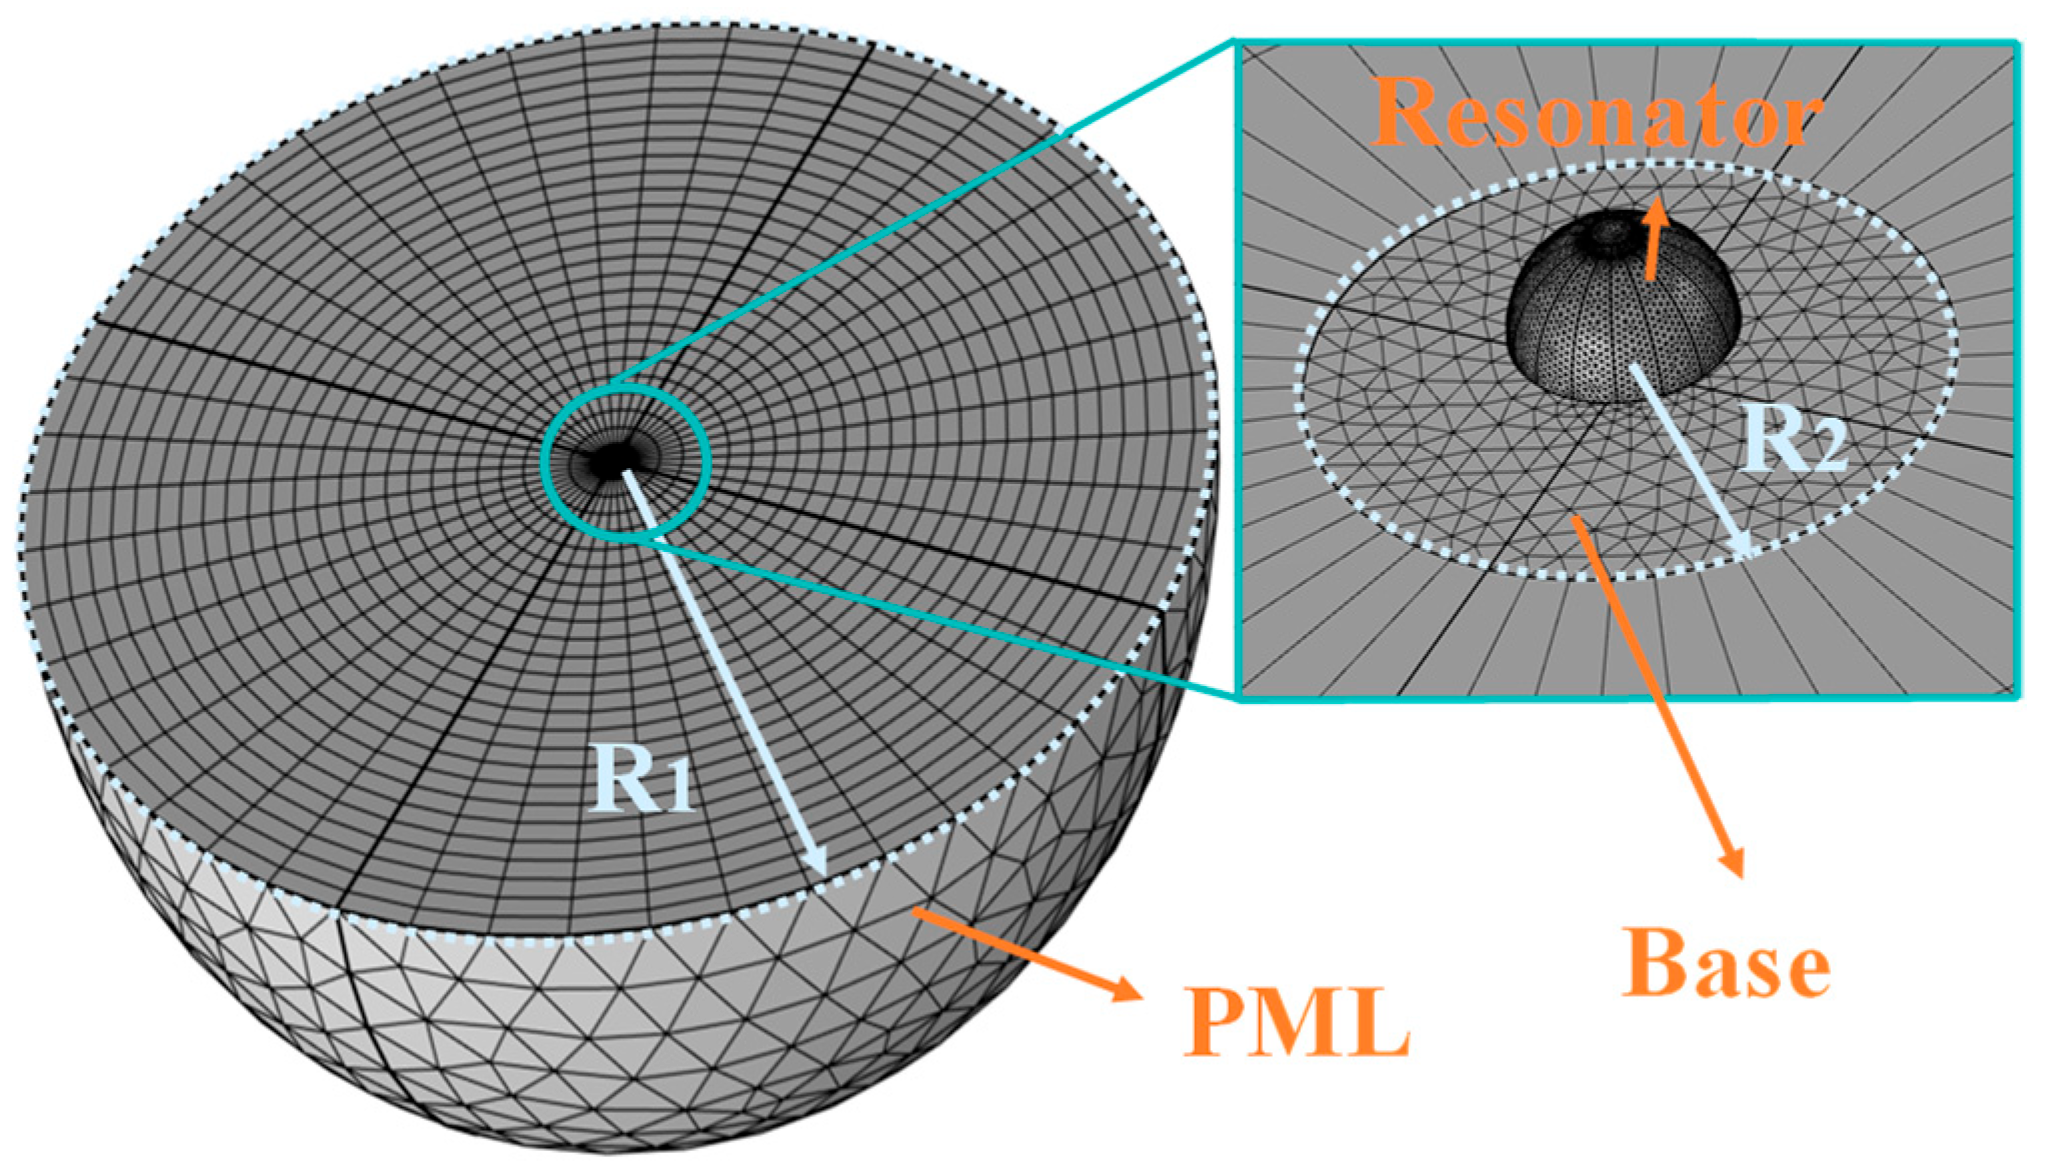
The support loss in the resonator originates from energy dissipation through the support rods, where partial wave energy of elastic waves (generated by standing wave vibrations) transmits to the base. To simulate this phenomenon, we employ a perfectly matched Layer (PML) in COMSOL Multiphysics that absorbs elastic wave energy propagating from the support rods to the base. For effective wave absorption, the PML radius must exceed the elastic wavelength.
The calculation formula for the elastic wave length is
λ = 2 π c ω
where c represents the propagation speed of the elastic wave:
c = E ( 1 μ ) ρ ( 1 + μ ) ( 1 2 μ )
Set the radius of the base as
R 2 = 20 d
where d is the radius of the bottom of the support rod, and then the radius of the perfectly matched layer should be
R 1 = λ + R 2
The values of the relevant parameters are shown in Table 2, and the PML and meshing model are shown in Figure 6.
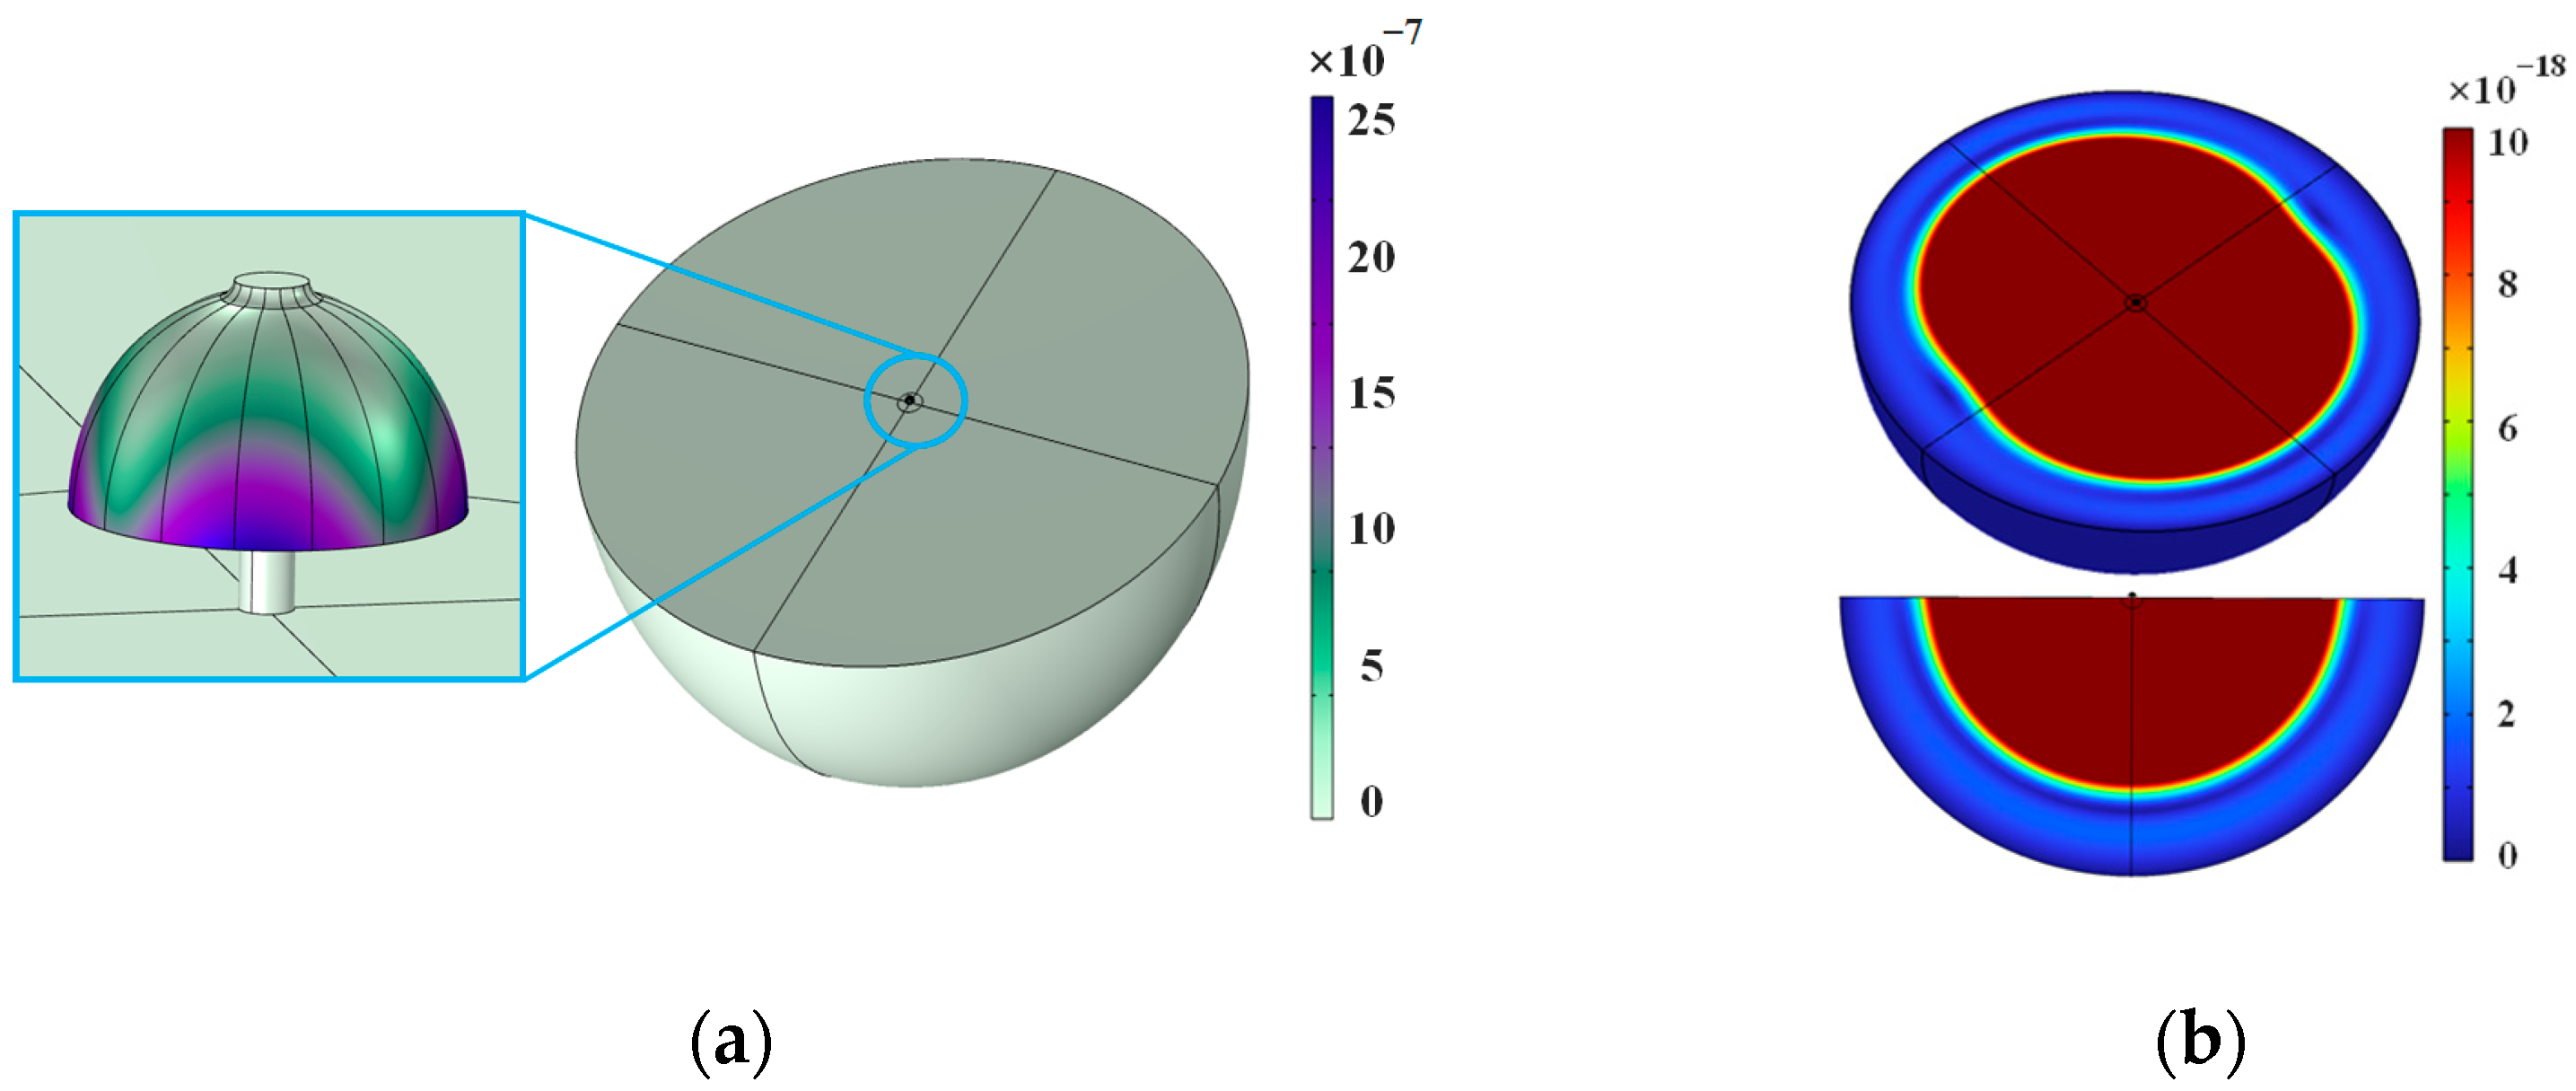
According to the distribution law of the first four harmonics at different azimuth angles of the resonator, the non-uniform mass with circumferential distribution was added to the spherical shell of the resonator to simulate the mass defect error of the first four harmonics. The displacement cloud diagram of the simulation results is shown in Figure 7.
The displacement of the elastic wave’s propagation attenuation in the PML is shown in Figure 7b. It can be seen that when the elastic wave propagates close to the edge of the PML, the displacement is already close to 0(10−19 m), indicating that the PML has absorbed the energy dissipation generated during the transmission of the elastic wave relatively completely, and the simulation results are reliable.
The influence of the first four harmonics on the quality factor is shown in Figure 8. For ease of comparison, the vertical coordinate is taken in the form of the logarithm of the quality factor. It can be seen that the fourth harmonic has no effect on the quality factor, while the first three harmonics all cause a decrease in the quality factor. Among them, the influence of the first harmonic is greater than that of the second harmonic and greater than that of the third harmonic, which is consistent with the theoretical analysis.

3.2. Frequency Split Simulation

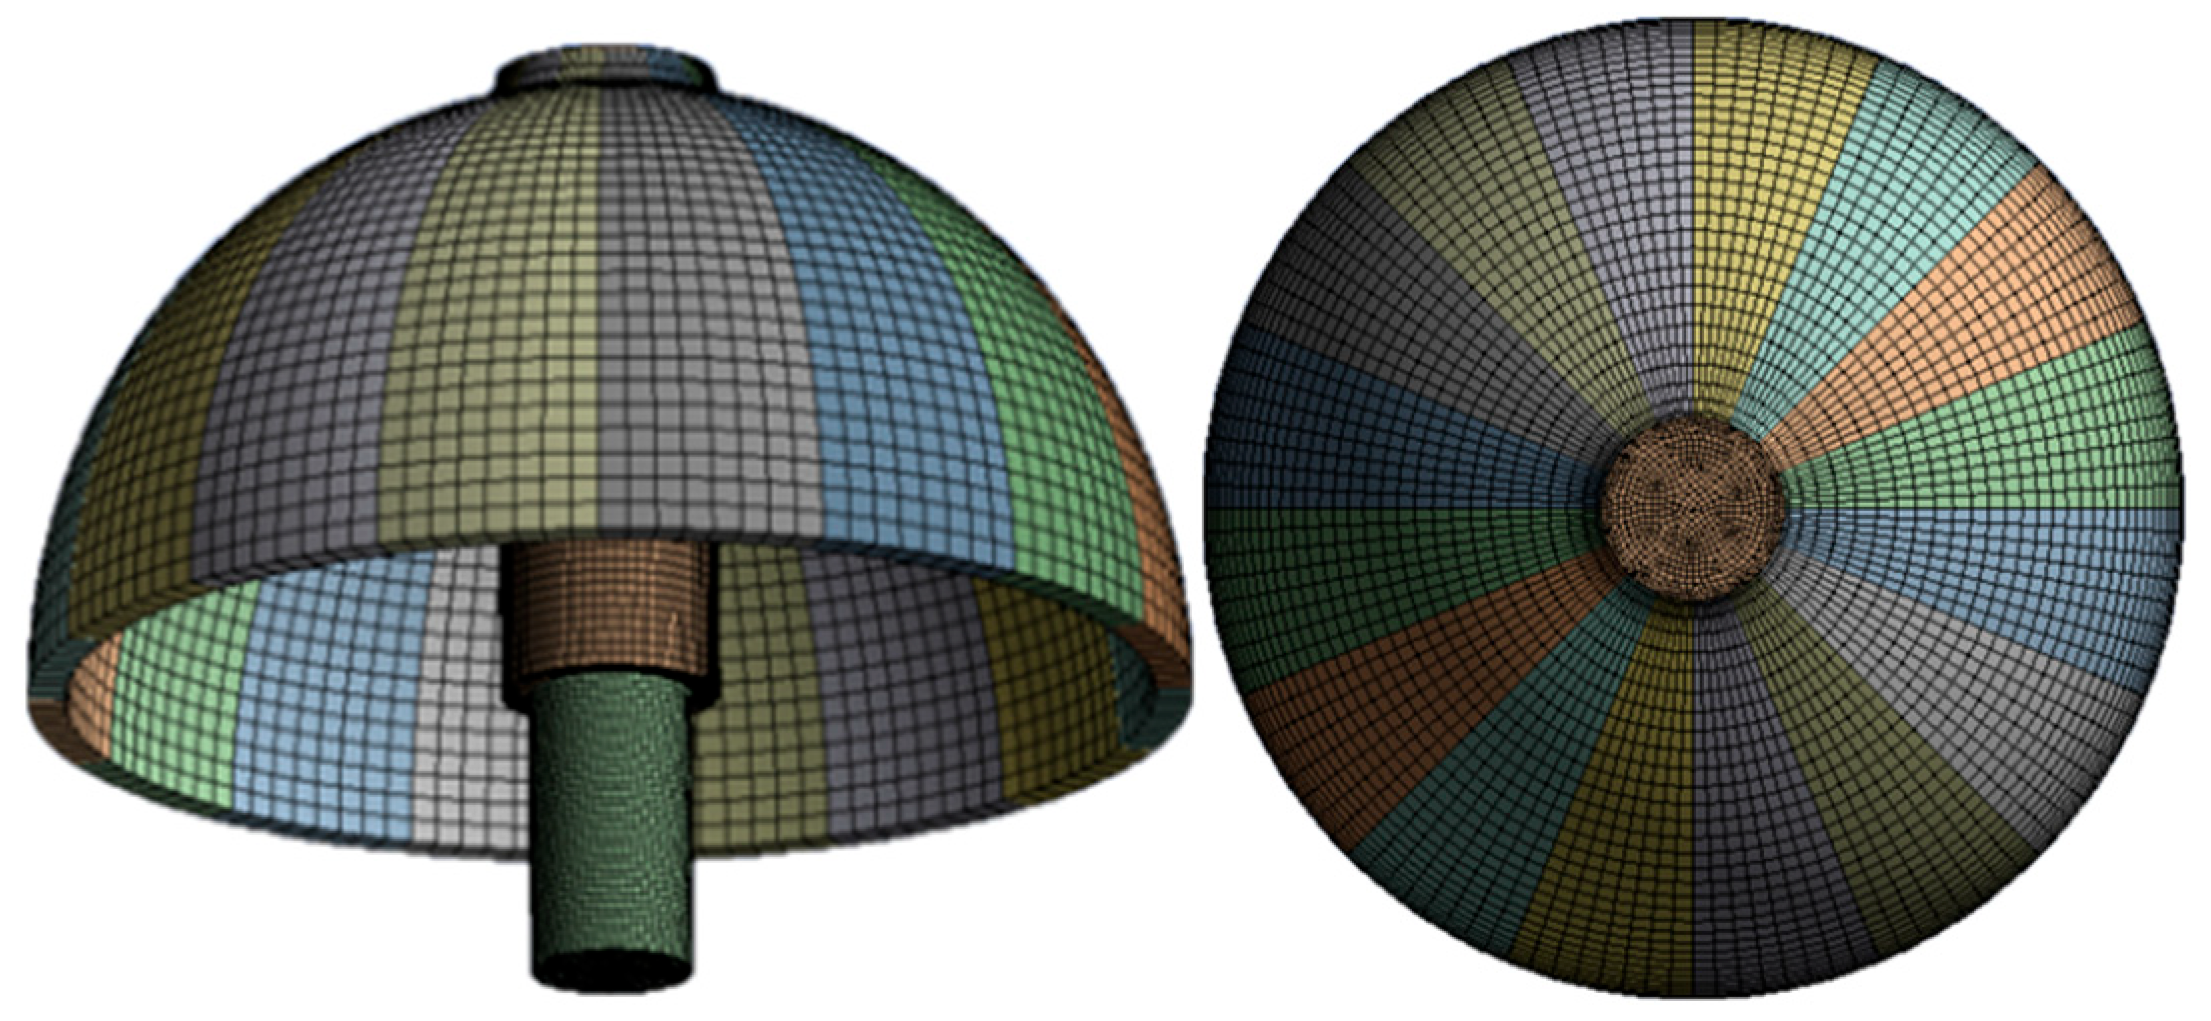
The support loss of the resonator was simulated in Ansys. Because the accuracy of mesh division greatly affects the finite element simulation accuracy of the frequency split, the spherical shell of the resonator was equally divided into 16 parts, and the support rod was precisely divided into 2 parts at the top and bottom to divide the mesh of the resonator, as shown in Figure 9. Finally, the accuracy of the model is such that the frequency split is 0.00003 HZ without defects.
The first four harmonic errors were simulated by attaching distributed masses to the edge of the resonator’s spherical shell, as illustrated in Figure 10. The frequency split of the resonator was then simulated, revealing the influence of these harmonic errors on the frequency split (Figure 11). The results demonstrate that the frequency split is predominantly caused by the fourth harmonic error, with the influence of the first three harmonics being negligible in comparison. Furthermore, the first four harmonics exhibit a direct proportional relationship with the frequency split, which aligns with the theoretical analysis.

4. Identification of Mass Defects

The simulation analysis results show that the first three harmonic errors cause the coupling vibration of the spherical shell and the support rod, resulting in support loss. The fourth harmonic error causes frequency split, and the influence increases with the increase of the harmonic error value. Therefore, the first three harmonics can be identified by measuring the vibration displacement of the support rod, and the fourth harmonic can be identified by measuring the frequency split, thereby quantifying the mass defects of the resonator.

4.1. Identification Methods and Devices

The vibration displacement at the point on the spherical shell of the resonator is
r 2 = A cos ω t
where A is the amplitude of the four-wave belly vibration of the spherical shell, which is substituted into the multi-order coupling vibration equation of the resonator. The rod vibration, Equation (16), can be obtained as follows:
m 1 x ¨ 1 + ξ 1 x ˙ 1 + k 1 x 1 = 1 4 A ω 2 2 [ 3 M 1 cos ( 2 φ φ 1 ) + M 3 cos ( 2 φ 3 φ 3 ) ] cos ω 2 t m 1 y ¨ 1 + ξ 1 y ˙ 1 + k 1 y 1 = 1 4 A ω 2 2 [ 3 M 1 sin ( 2 φ φ 1 ) M 3 sin ( 2 φ 3 φ 3 ) ] cos ω 2 t m 1 z ¨ 1 + ξ 1 z ˙ 1 + k 1 z 1 = 1 2 A ω 2 2 M 2 cos ( 2 φ 2 φ 2 ) cos ω 2 t
From Equation (34), the displacements of the support rod in three directions can be obtained as
x 1 = K A 2 3 M 1 cos 2 φ 0 φ 1 + M 3 cos 2 φ 0 3 φ 3 y 1 = K A 2 3 M 1 sin 2 φ 0 φ 1 M 3 sin 2 φ 0 3 φ 3 z 1 = K A M 2 cos ( 2 φ 0 2 φ 2 )
where K = ω 2 2 ω 1 2 2 + ξ 1 ω 2 / m 1 2 , and factors related to the material and structure of the resonator itself can be regarded as constants; φ 0 is the standing wave azimuth, that is, the initial excitation azimuth.
The resonator is excited, and the maximum radial vibration displacement r 1 of the support rod and its angle β with the x-axis are measured. These are decomposed into x 1 and y 1 and then M 1 , φ 1 , M 3 , and φ 3 can be calculated. The axial vibration displacement z 1 of the support rod can also be calculated as M 2 , φ 2 . There are six unknowns in the equation. Two different directions are excited. By constructing six equations, the first three harmonic errors can be solved. The relationship among the parameters is shown in Figure 12.
r 1 cos β = K A 2 3 M 1 cos 2 φ 0 φ 1 + M 3 cos 2 φ 0 3 φ 3 r 1 sin β = K A 2 3 M 1 sin 2 φ 0 φ 1 M 3 sin 2 φ 0 3 φ 3 z 1 = K A M 2 cos ( 2 φ 0 2 φ 2 )
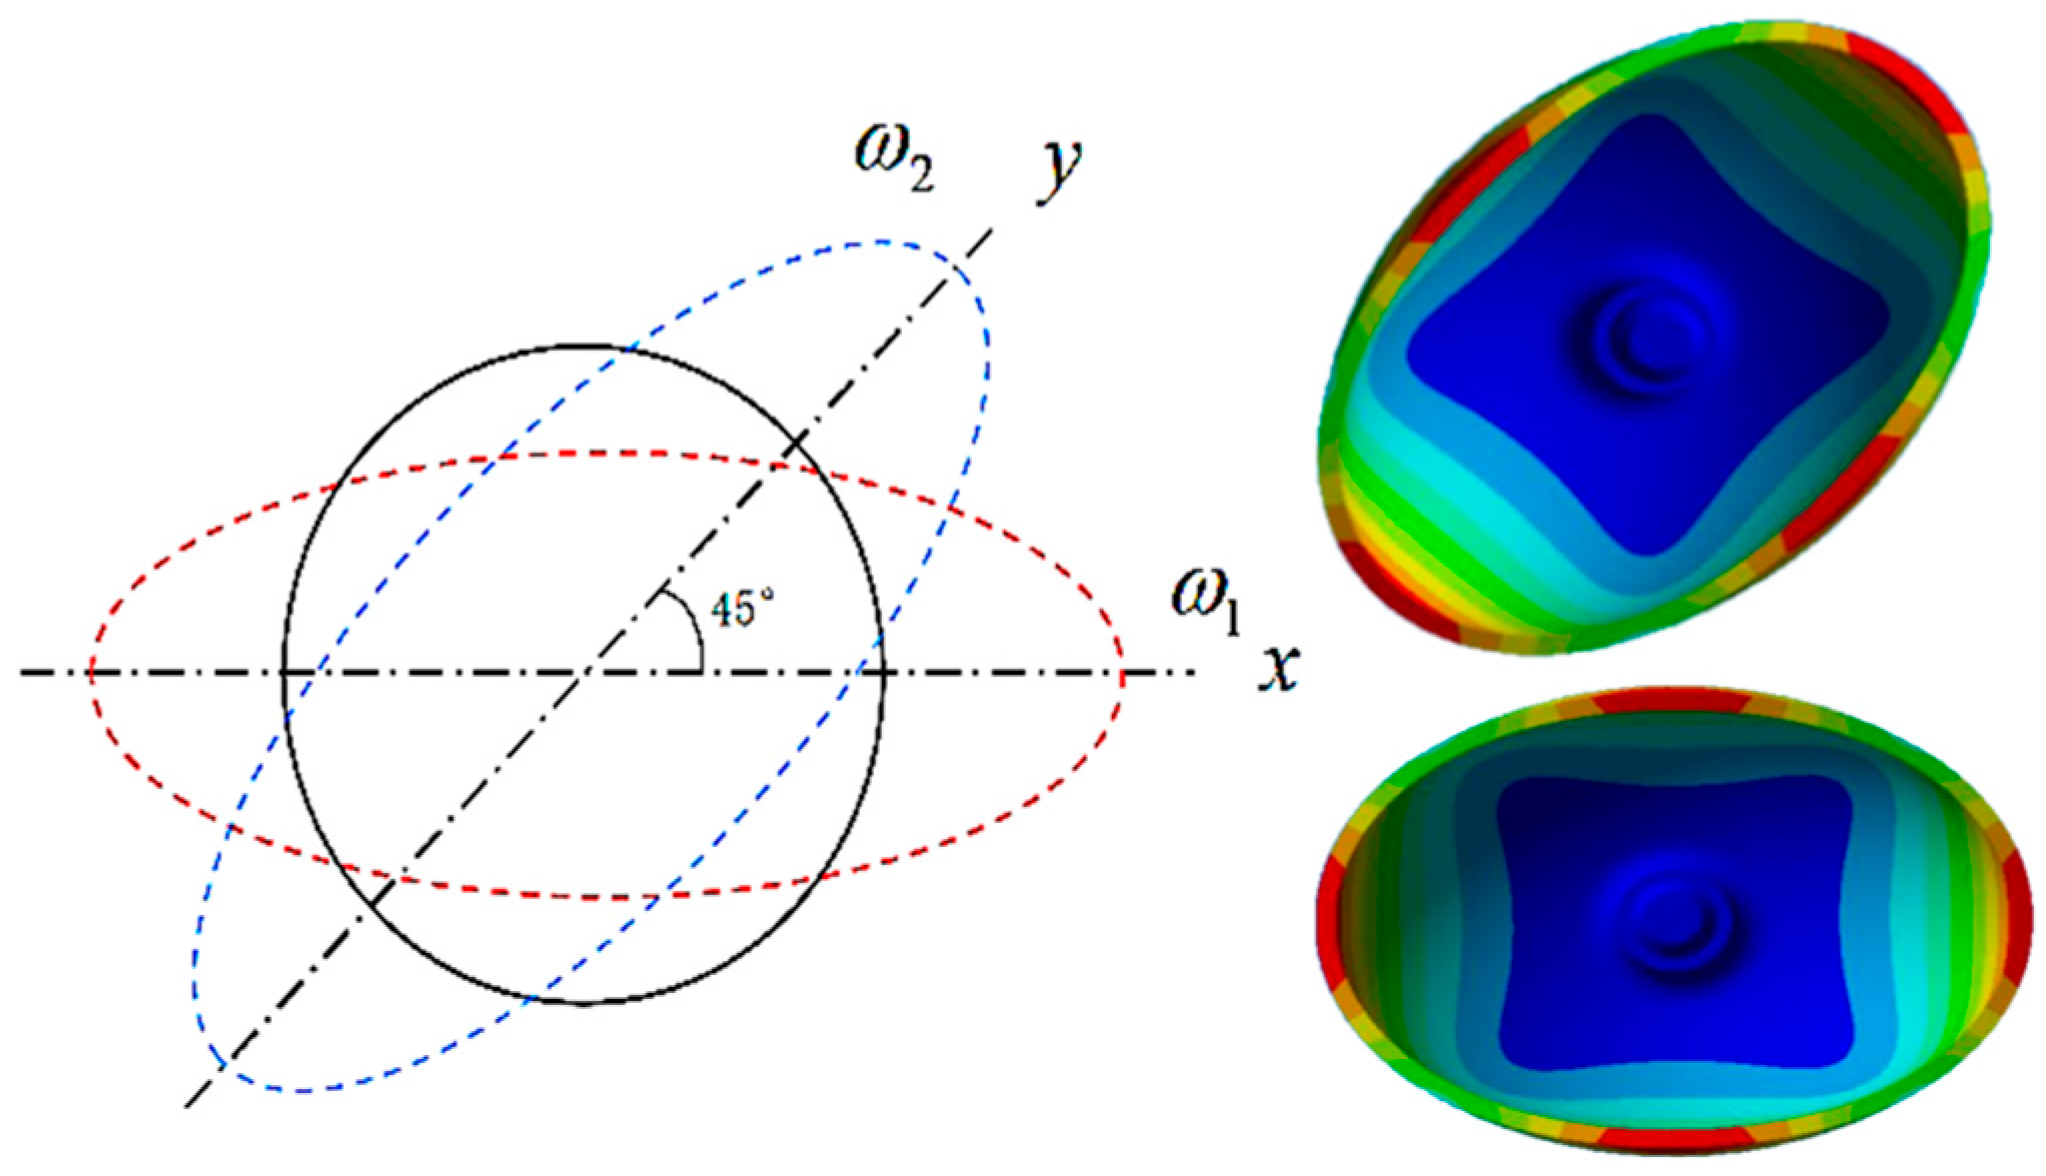
Frequency split refers to a phenomenon in hemispherical resonator operation where two inherent rigid axes, oriented at a 45° angle to each other, appear in the working mode. The natural frequencies along these two axes reach their maximum and minimum values, respectively, with the difference between these extreme values defining the frequency split magnitude (Figure 13).
The resonator’s fourth harmonic error is directly proportional to the frequency split. The azimuth position of this fourth harmonic error corresponds to the position of the resonator’s second-order vibration rigid axis. Consequently, the frequency split serves as the evaluation metric for fourth harmonic errors in quality defects.
The fourth harmonic error can be determined through frequency split measurements, with their quantitative relationship expressed as follows:
M 4 = K 0 Δ f
where K 0 is a constant and Δ f represents frequency split.
The beat frequency method was used to test the frequency split of the resonator and the position of the rigid shaft. When the resonator is excited and freely decays its vibration, there is frequency split. The vibration displacements of the spherical shells at the two rigid shaft positions are, respectively,
r 21 = A 1 e t τ cos ω 21 t r 22 = A 2 e t τ cos ω 22 t
The combined displacement of the vibrations of two rigid shafts is
r 2 = A 0 e t τ cos ω 21 t cos 2 φ + cos ω 22 t sin 2 φ
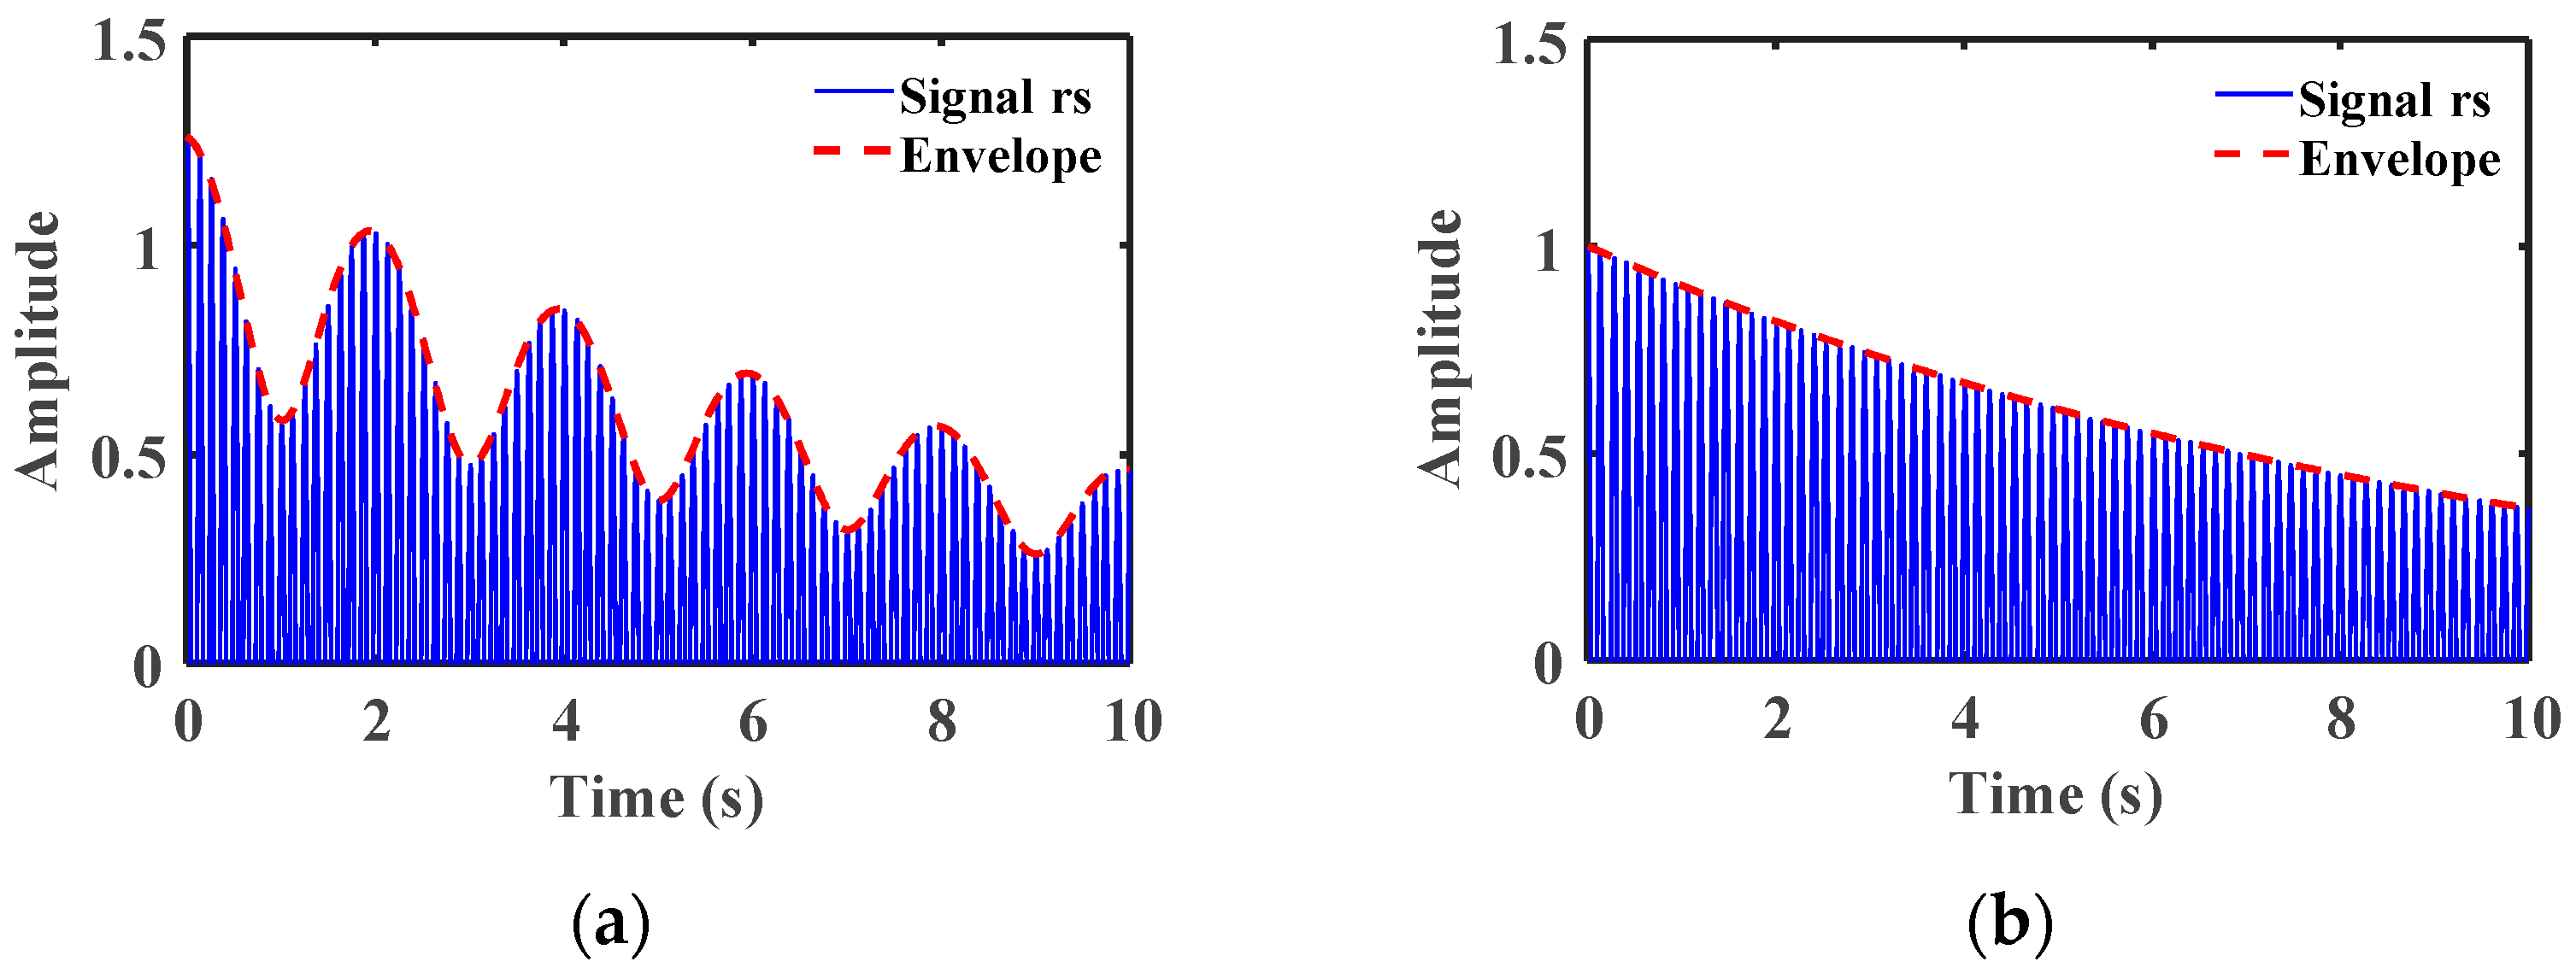
where φ represents the azimuth angle. It can be seen that the combined vibration displacement varies with the period T. This phenomenon is called the beat frequency, as shown in Figure 14a. The time of one beat frequency period is
T = 2 π ω 21 ω 22 = 1 Δ f
Therefore, frequency splitting can be obtained by reading the beat frequency period. When the azimuth angle φ is π i / 4 (where i is an integer), the vibration displacement term of a certain rigid shaft is 0. At this point, the beat frequency disappears, and this position is the position of the rigid shaft, as shown in Figure 14b. Therefore, this method can be used to find the orientation of the rigid shaft.
The identification system comprises a vibration measurement device, an excitation device, a vacuum chamber, a signal acquisition device, and a computer terminal. A Doppler laser vibrometer (Polytec Vibroflex, Waldbronn, Germany) serves as the vibration measurement device, offering sub-nanometer-level measurement accuracy. The excitation device employs a custom-made excitation hammer that enables non-destructive resonator excitation while achieving greater amplitude than conventional piezoelectric ceramics or interdigital electrodes.
A lock-in amplifier (Zurich Instruments, Zürich, Switzerland) functions as the signal acquisition device. The vacuum chamber maintains a high-vacuum environment for the resonator. The hemispherical resonator sample is mounted on a custom fixture, with its rotation controlled by a high-precision turntable (FICK FMSR100V, China) to facilitate circumferential vibration signal testing at various positions.
Additionally, a beam-splitting optical path using mirrors was designed for the diffusion sensor, enabling synchronous displacement measurements at multiple shell and rod positions in different directions. This configuration significantly improves vibration measurement efficiency by completing signal testing in a single excitation while eliminating disturbances caused by vibrometer relocation. The entire experimental setup is installed on an electronic active vibration isolation platform (WAVE Duo100, US) to ensure optimal testing conditions. Figure 15a presents the system schematic diagram, while Figure 15b shows the physical setup.
The identification process is shown in Figure 16. Firstly, Δ f is measured using the beat frequency method, and the position of the rigid shaft is found. Then, this position is set to the 0° position. At this position, the resonator is excited, and the axial and radial signals of the spherical shell and the support rod are measured to identify the parameters A , r 1 , β , and z 1 . Then, the excitation is carried out at the 45° position to identify the parameters A , r 1 , β , and z 1 . Substituting the identified parameters into Equation (36), the error of the first four harmonics can be obtained.
Table 3 presents a comparative analysis highlighting the superior performance of the proposed methodology over conventional approaches.

4.2. Identification Experiment

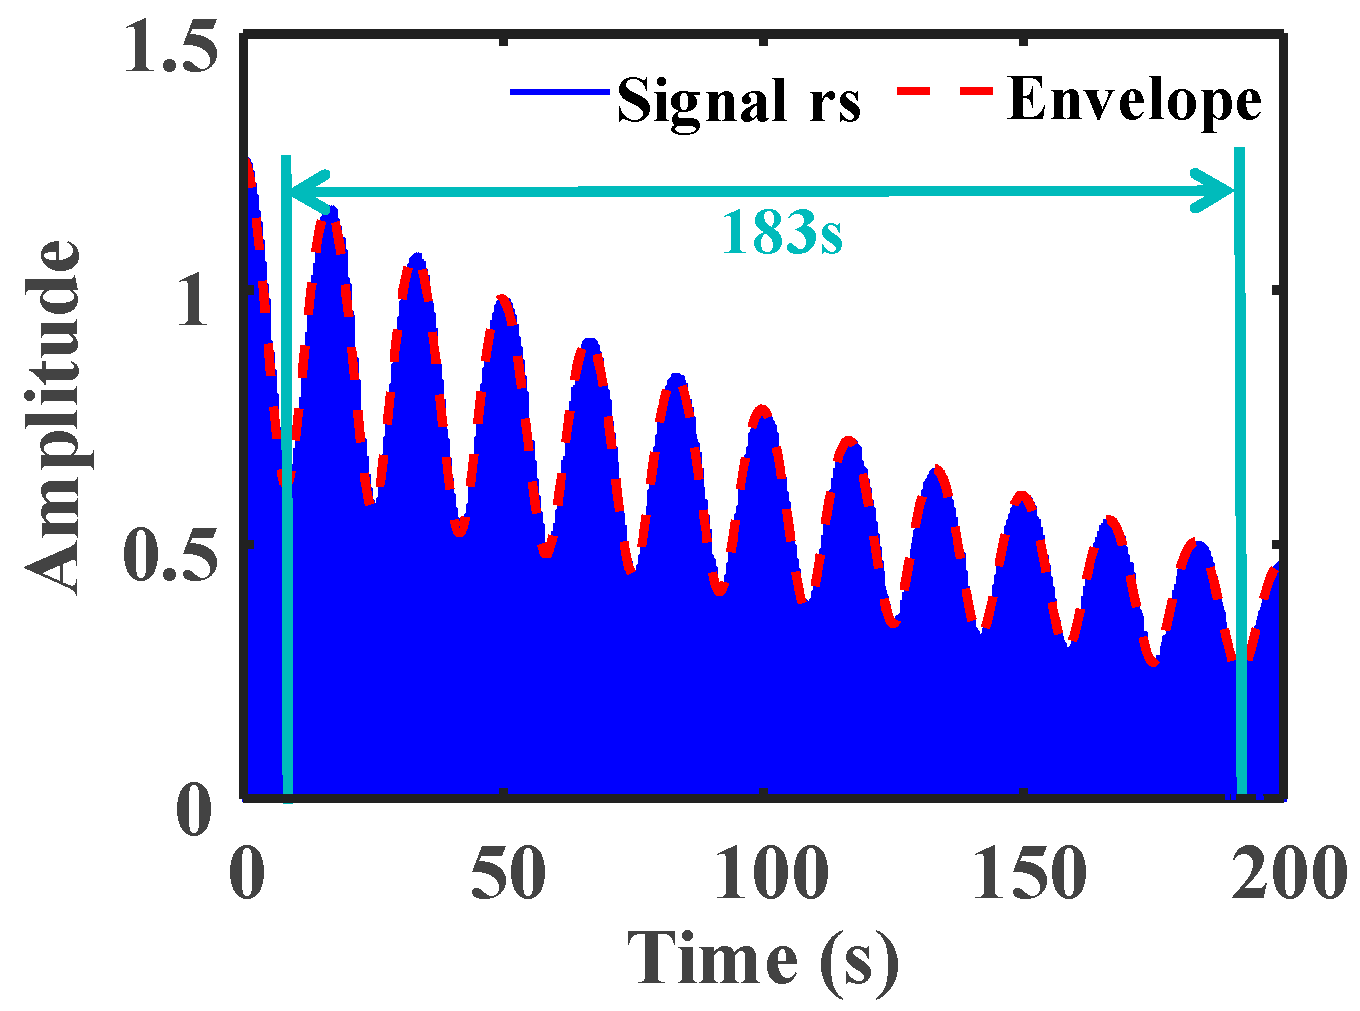
The mass defect identification of the hemispherical resonator samples was carried out, and the vacuum degree of the test environment was 1 × 10⁻⁴ Pa. First, the frequency split was measured using the beat frequency method. The beat frequency curve of the resonator sample is shown in Figure 17. The time of the 11 beat frequencies in the figure was read, and the reading error was evenly distributed among the 11 beat frequencies. The reading accuracy was relatively high. The time of the 11 beat frequencies in the figure was 183 s, so the beat frequency period was 16.63 s, and the frequency split was 0.06 HZ.
After determining the position of the rigid shaft using the beat frequency method and setting it to the 0° position, the 0° and 45° rigid shaft positions were excited, and the amplitudes of the spherical shell and the support rod in all directions were measured. The amplitude diagrams of the support rod in all directions are shown in Figure 18, and the identified parameters are presented in Table 4. Substituting the data in the table into the identification model for calculation, the relative amplitudes of the first three harmonic components of the resonator sample mass defect were obtained as 0.00023, 0.00021, and 0.00031, respectively, and the corresponding azimuth angles were 25.7°, 21.7°, and 51.6°, respectively.

5. Conclusions

This paper systematically investigates the influence mechanisms and identification methods of the first four harmonic components on the vibration characteristics of hemispherical resonators with mass defects. A shell–rod coupled vibration model under mass error excitation was established, and, for the first time, a comprehensive mass defect-vibration characteristic mapping system encompassing the first four harmonics was developed.
Through derivation of analytical expressions for both quality factor and frequency split induced by mass defects, the study quantitatively reveals the influence patterns of the first four harmonic components on the resonator’s dynamic characteristics. The proposed identification method enables synchronous displacement measurements in multiple directions at various shell–rod positions. This approach significantly improves testing efficiency while eliminating environmental disturbance errors inherent in asynchronous measurement methods, thereby enhancing identification accuracy. Notably, the method can simultaneously identify all four harmonic errors.
Future work will obtain the distribution cloud map of the tuned mass of the hemispherical resonator based on the identification results, focus on the high-resolution controllable continuous removal method of mass on high–steep surfaces, and achieve the joint tuning of the first four harmonic components of the mass defect of the hemispherical resonator. Based on the identified first four harmonic errors of the resonator’s mass imbalance, a non-uniform mass distribution contour map is generated for the spherical shell. Ion beam milling is then employed for continuous mass removal, enabling simultaneous correction of all four harmonic errors, laying the foundation for the development of high-performance HRG.

Author Contributions

Conceptualization, Q.L., W.C., and Y.L.; methodology, Q.L.; software, Q.L.; validation, Q.L., Y.L., and W.C.; formal analysis, J.L., Q.L., W.C., Y.Z., and Y.L.; investigation, Q.L., Y.Z., W.C., and Y.L.; resources, J.L.; data curation, Q.L.; writing—original draft preparation, Q.L.; writing—review and editing, J.L.; visualization, Q.L.; supervision, J.L.; project administration, J.L.; funding acquisition, J.L. All authors have read and agreed to the published version of the manuscript.

Funding

The authors acknowledge the National Natural Science Foundation of China (Grant No. 52375473).

Data Availability Statement

The datasets generated and analyzed during this study are included in this published article. Additional data supporting the findings are available from the corresponding author upon reasonable request.

Conflicts of Interest

The authors declare that they have no known competing financial interests or personal relationships that could have appeared to influence the work reported in this paper.

Appendix A

The coefficients of the multi-order coupled vibration equation of the resonator:
m 1 = 2 π R 2 ρ h
m 2 = R 2 ρ 0 π / 2 0 2 π h ( U 2 ( θ ) 2 + V 2 ( θ ) 2 + W 2 ( θ ) 2 ) sin θ d φ d θ
k 1 = E 12 R 2 ( 1 μ 2 ) 0 π / 2 0 2 π h 3 U 1 sin θ + 2 W 1 cos θ W ¨ 1 + 2 V 1 1 + cot θ + W 1 9 sin 2 θ 9 cos θ 2 cos θ sin 2 θ sin θ W ˙ 1 + 3 + 2 cos 2 θ cos θ sin θ sin θ U 1 8 cot θ U 1 4 V 1 1 + cos 2 θ sin θ W 1 sin θ W 1 d φ d θ ,
k 2 = E 12 R 2 ( 1 μ 2 ) 0 π / 2 0 2 π h 3 U 2 sin θ + 2 W 2 cos θ W ¨ 2 + 2 V 2 1 + cot θ + W 2 9 sin 2 θ 9 cos θ 2 cos θ sin 2 θ sin θ W ˙ 2 + 3 + 2 cos 2 θ cos θ sin θ sin θ U 2 8 cot θ U 2 4 V 2 1 + cos 2 θ sin θ W 2 sin θ W 2 d φ d θ ,
ξ 1 = 4 R 2 ρ 0 π / 2 0 2 π h U 1 ( θ ) cos θ + W 1 ( θ ) sin θ V 1 ( θ ) sin θ d φ d θ
ξ 2 = 4 R 2 ρ 0 π / 2 0 2 π h U 2 ( θ ) cos θ + W 2 ( θ ) sin θ V 2 ( θ ) sin θ d φ d θ
The coefficients of the second-order free vibration equation of the hemispherical resonator with mass imbalance:
a 2 = 0 π / 2 U 2 ( θ ) cos θ + W 2 ( θ ) sin θ sin 2 θ d θ 0 π / 2 0 2 π tan 2 θ 2 sin 2 θ cos 2 φ d φ d θ
a 4 = 0 π / 2 U 2 ( θ ) 2 V 2 ( θ ) 2 + W 2 ( θ ) 2 sin θ d θ 0 π / 2 0 2 π tan 2 θ 2 sin 2 θ cos 4 φ d φ d θ
a 2 = 0 π / 2 V 2 ( θ ) sin 2 θ d θ 0 π / 2 0 2 π tan 2 θ 2 sin 2 θ sin 2 φ d φ d θ
b = 0 π / 2 ( U 2 ( θ ) 2 + V 2 ( θ ) 2 + W 2 ( θ ) 2 ) sin θ d θ
c 1 = o ( M 4 2 ) + o ( M 4 2 ) + o ( M 1 M 3 ) + o ( M 1 M 4 ) + o ( M 2 M 3 ) + o ( M 2 M 4 ) + o ( M 3 M 4 ) + o ( M 1 2 M 2 )       + o ( M 1 2 M 4 ) + o ( M 1 M 2 M 3 ) + o ( M 1 M 3 M 4 ) + o ( M 2 2 M 4 ) + o ( M 3 2 M 2 ) + o ( M 3 2 M 4 ) + o ( M 4 3 )
c 2 = o ( M 2 2 ) + o ( M 1 M 3 ) + o ( M 1 2 M 2 ) + o ( M 1 2 M 4 ) + o ( M 1 M 2 M 3 ) + o ( M 1 M 3 M 4 )         + o ( M 2 2 M 4 ) + o ( M 3 2 M 2 ) + o ( M 3 2 M 4 ) + o ( M 4 3 )

References

  1. Delhaye, F. HRG by Safran: The Game-Changing Technology. In Proceedings of the IEEE International Symposium on Inertial Sensors and Systems, Moltrasio, Italy, 26–29 March 2018. [Google Scholar]
  2. Jeanroy, A.; Grosset, G.; Goudon, J.C.; Delhaye, F. HRG by Sagem from Laboratory to Mass Production. In Proceedings of the 2016 IEEE International Symposium on Inertial Sensors and Systems, Hawaii, HI, USA, 22–25 February 2016; pp. 1–4. [Google Scholar]
  3. Xia, D.; Yu, C.; Kong, L. The Development of Micromachined Gyroscope Structure and Circuitry Technology. Sensors 2014, 14, 1394–1473. [Google Scholar] [CrossRef]
  4. Deng, K.; Pan, Y.; Jia, Y.; Li, J.; Tang, X.; Wu, W.; Yuan, J. Separation of mass and gap errors of hemispherical resonator gyroscopes by varying bias voltage. Meas. J. Int. Meas. Confed. 2024, 228, 114308. [Google Scholar] [CrossRef]
  5. Xu, Z.; Yi, G.; Zhu, W. An accurate thermoelastic model and thermal output error analysis of a hemispherical resonator gyroscope under varying temperatures. Mech. Syst. Signal Process. 2022, 170, 108760. [Google Scholar] [CrossRef]
  6. Wang, C.; Ning, Y.; Zhao, W.; Yi, G.; Huo, Y. Surface Evolution of Fused Silica Hemispherical Resonators and Its Influence on the Quality Factor. Sens. Actuators A Phys. 2023, 359, 114456. [Google Scholar] [CrossRef]
  7. Xu, Z.; Li, J.; Wang, Z.; Chen, X.L.; Chen, X.Z. Discussion on Precision Machining Technology of Quartz Hemispherical Harmonic Oscillator. Navig. Control 2019, 18, 69–76. [Google Scholar]
  8. Ma, Z.K.; Zhao, H.B.; Zhao, W.; Song, X.; Chen, X. Precision Forming Technology of Quartz Hemispherical Harmonic Oscillator. Navig. Control 2019, 18, 77–83. [Google Scholar]
  9. Liu, J.; Xiong, C.; Qu, T.; Che, C. External Sphere Grinding Principle Error Analysis and Experimental Study of Hemispherical Resonator. Opt. Tech. 2022, 48, 295–300. [Google Scholar]
  10. Zha, X.; Jiang, F.; Xu, X. Investigation of Modelling and Stress Distribution of a Coating/Substrate System after an Indentation Test. Int. J. Mech. Sci. 2017, 134, 1–14. [Google Scholar] [CrossRef]
  11. Liu, H.; Chen, M.; Yu, B.; Fang, Z. Configuration Design and Accuracy Analysis of a Novel Magnetorheological Finishing Machine Tool for Concave Surfaces with Small Radius of Curvature. J. Mech. Sci. Technol. 2016, 30, 3301–3311. [Google Scholar] [CrossRef]
  12. Ma, C.; Liu, H.; Chen, M.; Cheng, J.; Tian, J.; Zhou, Z. Research on the Effect of Geometric Parameters of Hemispherical Resonator on Thermoelastic Dissipation. J. Mech. Eng. 2024, 60, 75–84. [Google Scholar]
  13. Khooshehmehri, A.; Eslami Majd, A.; Arabsheybani, E. Thermo-Elastic Damping and Anchor Loss in the Operational Modes of a Hemispherical Shell Resonator. J. Comput. Appl. Res. Mech. Eng. 2023, 12, 211–224. [Google Scholar]
  14. Remillieux, G.; Delhaye, F. Sagem Coriolis vibrating gyros: A vision realized. In Proceedings of the 2014 DGON Inertial Sensors and Systems (ISS), Karlsruhe, Germany, 16–17 September 2014. [Google Scholar]
  15. Shi, Y.; Xi, X.; Li, B.; Chen, Y.; Wu, Y.; Xiao, D.; Wu, X.; Lu, K. Micro Hemispherical Resonator Gyroscope With Teeth-Like Tines. IEEE Sens. J. 2021, 21, 13098–13106. [Google Scholar] [CrossRef]
  16. Lu, K.; Xi, X.; Xiao, D.; Shi, Y.; Zhuo, M.; Wu, X.; Wu, Y. A Study on the Trimming Effects on the Quality Factor of Micro-Shell Resonators Vibrating in Wineglass Modes. Micromachines 2019, 10, 695. [Google Scholar] [CrossRef]
  17. Luo, H.; Tao, Y.; Zeng, L.; Tang, X.; Yang, K.; Luo, H. Investigation on the optimal fixation condition of cylindrical resonators. In Proceedings of the 28th Saint Petersburg International Conference on Integrated Navigation Systems, Saint Petersburg, Russia, 31 May–2 June 2021. [Google Scholar]
  18. Fan, S.; Liu, G. Analysis of Bending Vibration of Hemispherical Shells. Appl. Math. Mech. 1991, 12, 957–964. [Google Scholar]
  19. Sharma, G.N.; Sundararajan, T.; Gautam, S.S. Effect of Geometric Imperfections on Anchor Loss and Characterisation of a Gyroscope Resonator with High Quality Factor. Gyroscopy Navig. 2020, 11, 206–213. [Google Scholar] [CrossRef]
  20. Darvishian, A.; Nagourney, T.; Cho, J.Y.; Shiari, B.; Najafi, K. Thermoelastic Dissipation in Micromachined Birdbath Shell Resonators. J. Microelectromech. Syst. 2017, 26, 758–772. [Google Scholar] [CrossRef]
  21. Yao, Y.; Yang, G.; Cheng, R. Mechanism of Frequency Splitting in Micro Hemispherical Resonator with T-Shape Masses: Study on the Harmonic Error Order Characteristics. Meas. Sci. Technol. 2025, 36, 085105. [Google Scholar] [CrossRef]
  22. Yuan, L.; Wang, N.; Xie, R.; Wei, Z.; Zeng, Q.; Wang, C. Study on the Mechanism of Energy Dissipation in Hemispherical Resonator Gyroscope. Sensors 2025, 25, 74. [Google Scholar] [CrossRef]
  23. Basarab, M.A.; Matveev, V.A.; Lunin, B.S.; Fetisov, S.V. Influence of nonuniform thickness of hemispherical resonator gyro shell on its unbalance parameters. Gyroscopy Navig. 2017, 8, 97–103. [Google Scholar] [CrossRef]
  24. Basarab, M.A.; Chumankin, E.A.; Lunin, B.S. Application of a magnetic sensor for determining the mass imbalance of the Coriolis vibratory gyroscope with cylindrical metallic resonator. In Proceedings of the 2017 Progress in Electromagnetics Research Symposium—SPRING (PIERS), St. Petersburg, Russia, 22–25 May 2017; pp. 2975–2979. [Google Scholar]
  25. Tao, Y.; Pan, Y.; Liu, J.; Jia, Y.; Yang, K.; Luo, H. A novel method for estimating and balancing the second harmonic error of cylindrical fused silica resonators. Micromachines 2021, 12, 380. [Google Scholar] [CrossRef] [PubMed]
  26. Cheng, W.; Xi, B.; Ren, S.; Ning, Y.; Tian, Z. Defects Identification and Mass Trimming in Hemispherical Resonators. Int. J. Mech. Sci. 2025, 294, 110242. [Google Scholar] [CrossRef]
  27. Ning, Y.; Wang, C.; Cheng, W.; Tian, Z. Anchor Loss Improvement in Hemispherical Resonators with Ion Beams. Int. J. Mech. Sci. 2024, 277, 109413. [Google Scholar] [CrossRef]
  28. Chen, Y.; Kong, F.; Zeng, K.; Xi, X.; Shi, Y.; Xiao, D.; Wu, X. A Trimming Strategy for Mass Defects in Hemispherical Resonators Based on Multi-Harmonic Analysis. Micromachines 2025, 16, 480. [Google Scholar] [CrossRef] [PubMed]
  29. Fan, S.; Liu, G.; Wang, Z. On flexural vibration of hemispherical shell. Appl. Math. Mech. 1991, 12, 1023–1030. [Google Scholar] [CrossRef]
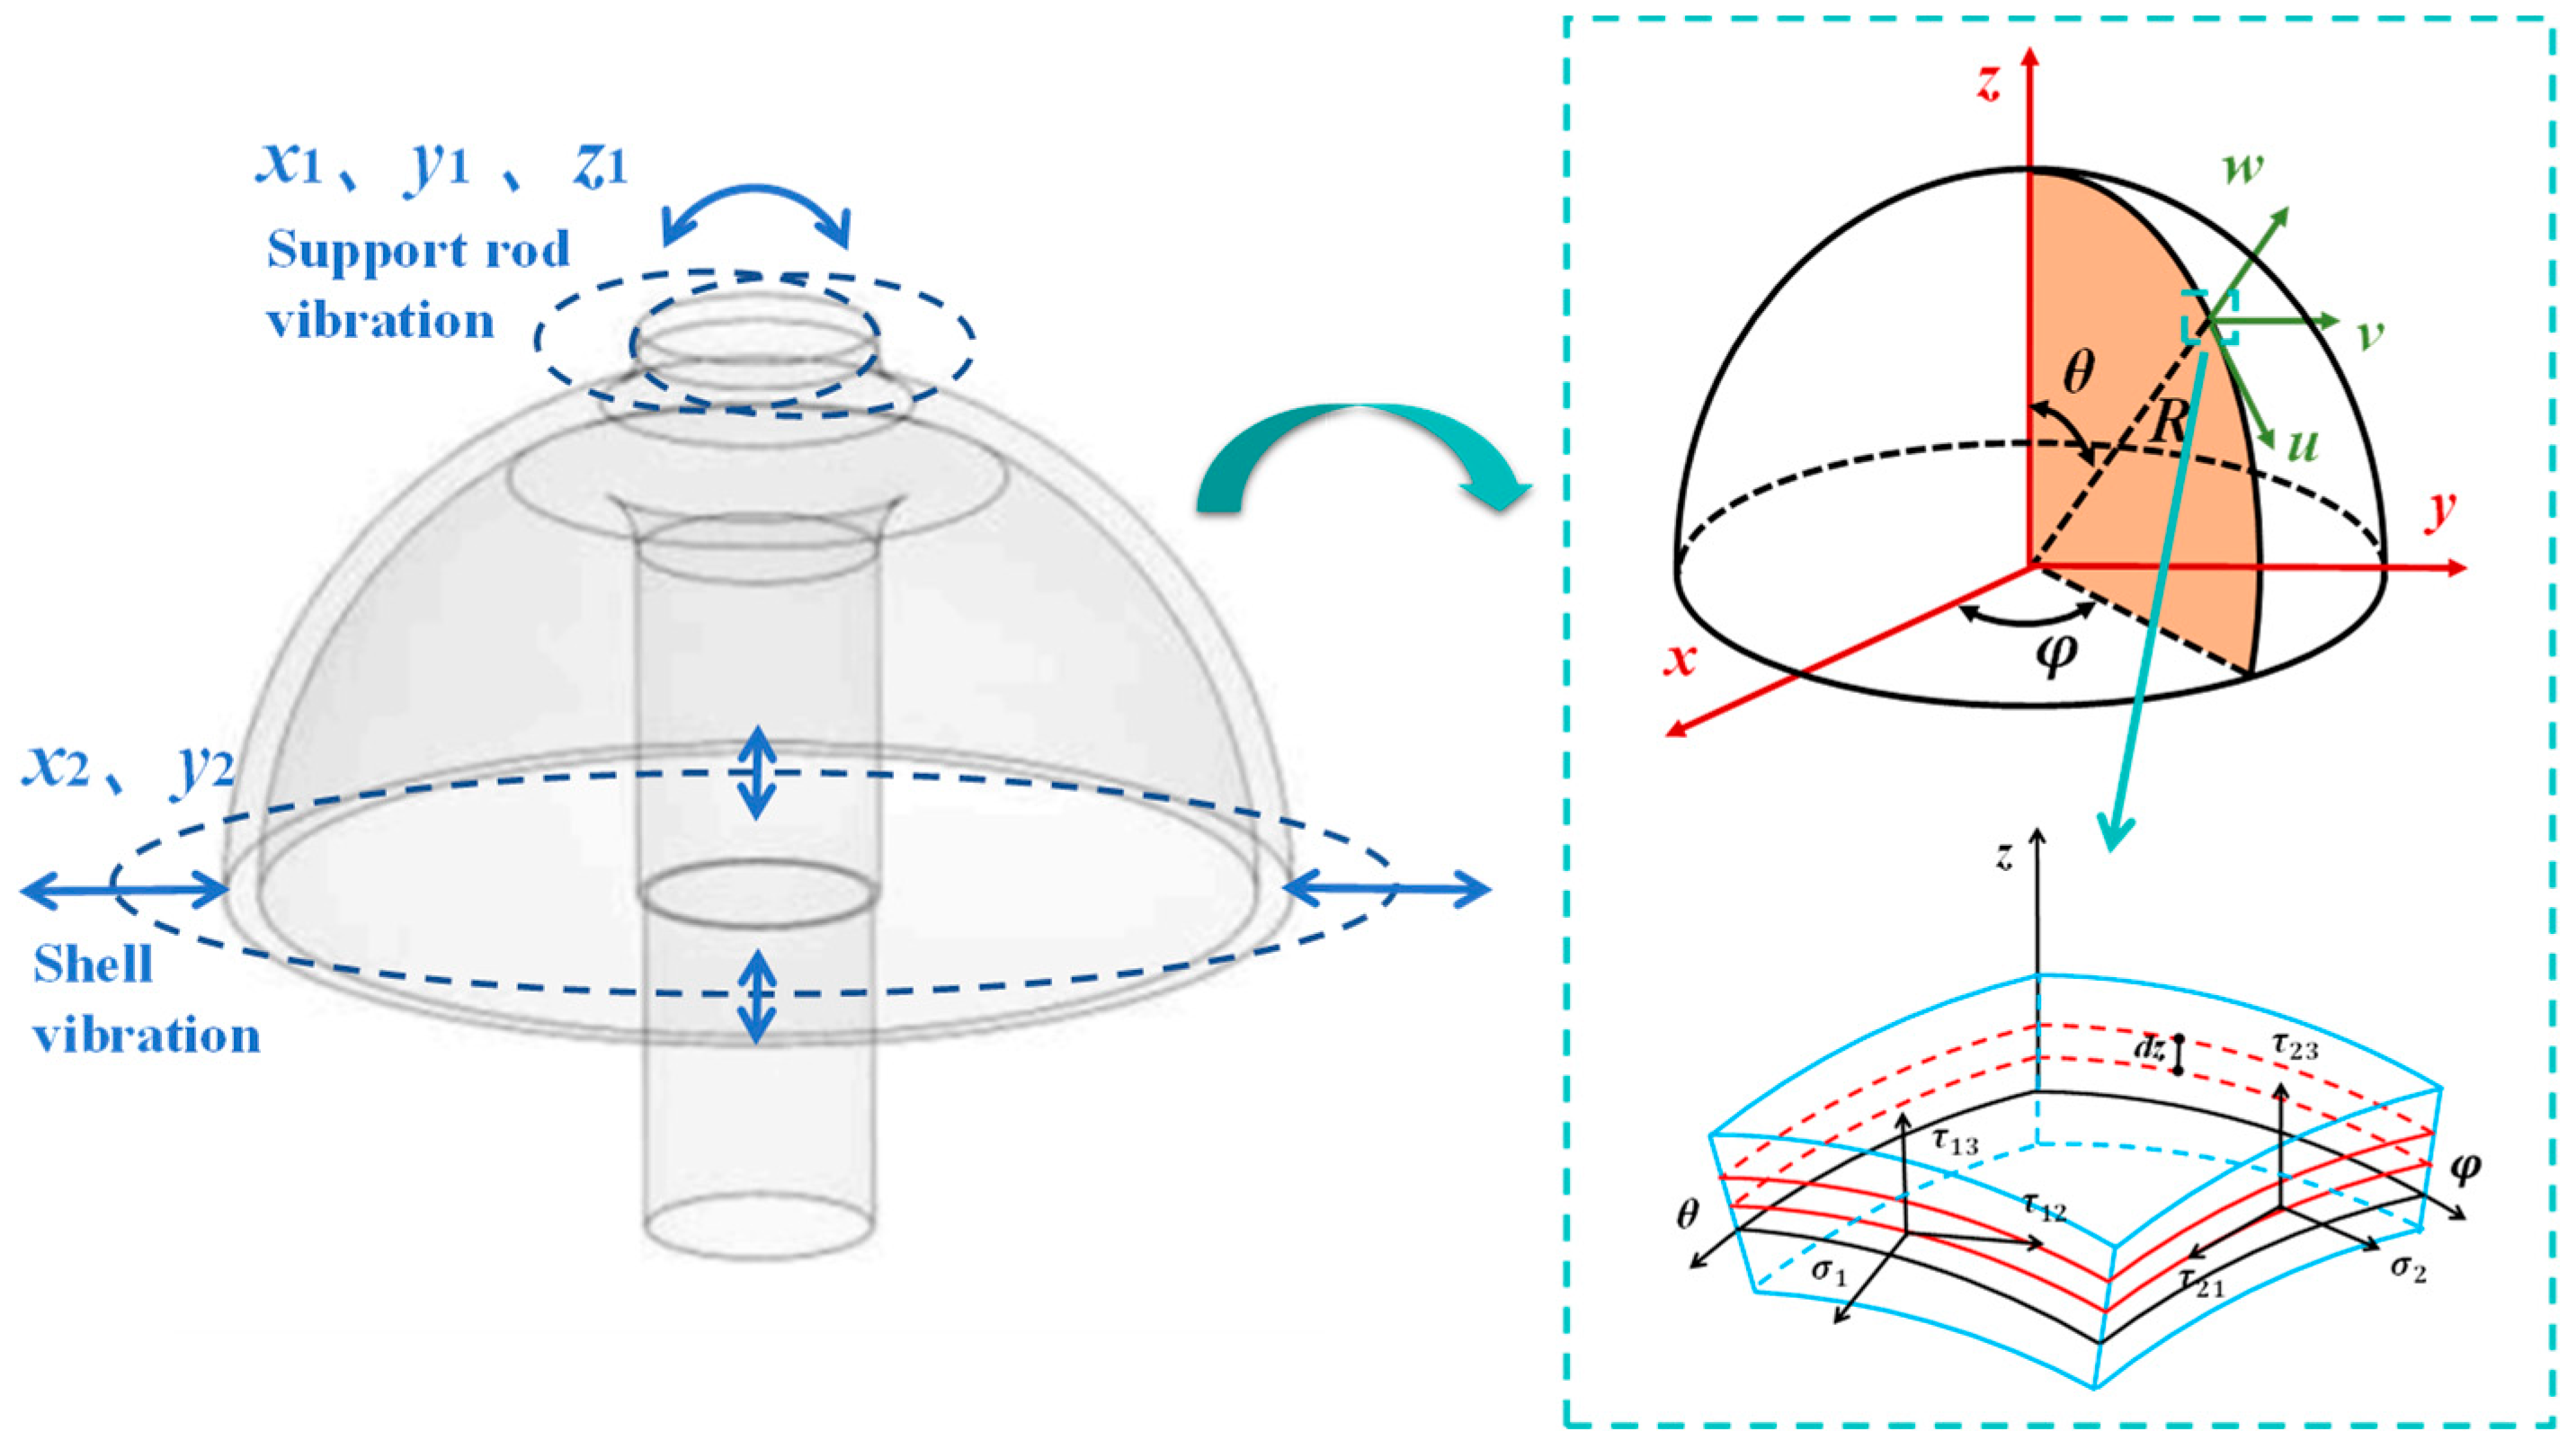
Figure 1. Hemispherical resonator shell–rod coupling vibration model.
Applsci 15 08851 g001
Figure 2. The first four harmonic forms of mass defects.
Applsci 15 08851 g002
Figure 3. The influence curve of the first three harmonics on support loss.
Applsci 15 08851 g003
Figure 4. The influence of the second and fourth harmonics on frequency split: (a) surface diagram of the influence of the second and fourth harmonics on frequency split; (b) curve graph of the influence of the second and fourth harmonics on frequency split.
Applsci 15 08851 g004
Figure 5. Finite element simulation model of hemispherical resonator: (a) geometric model of hemispherical resonator; (b) model geometric parameters.
Applsci 15 08851 g005
Figure 6. COMSOL finite element simulation model.
Applsci 15 08851 g006
Figure 7. COMSOL simulation result displacement cloud map: (a) overall displacement cloud map of the model; (b) the displacement of the elastic wave’s propagation attenuation in the PML.
Applsci 15 08851 g007
Figure 8. The influence of the first four harmonics on the quality factor.
Applsci 15 08851 g008
Figure 9. The meshing results of the Ansys model.
Applsci 15 08851 g009
Figure 10. Distribution mass is added to the edge of the spherical shell of the hemispherical resonator.
Applsci 15 08851 g010
Figure 11. The influence of the first four harmonic errors on frequency split.
Applsci 15 08851 g011
Figure 12. The relationship among the displacement parameters of the vibration signal of the support rod.
Applsci 15 08851 g012
Figure 13. Schematic diagram of frequency split.
Applsci 15 08851 g013
Figure 14. The beat frequency method for locating rigid shafts and reading frequency split: (a) vibration signals when there is a beat frequency; (b) vibration signal without beat frequency.
Applsci 15 08851 g014
Figure 15. Hemispherical resonator first harmonic error identification system: (a) schematic diagram of the identification system; (b) physical picture of the identification device.
Applsci 15 08851 g015
Figure 16. Identification process flowchart.
Applsci 15 08851 g016
Figure 17. Beat frequency curve of the resonator sample.
Applsci 15 08851 g017
Figure 18. Amplitude in all directions of the resonator support rod: (a) amplitude in all directions in the radial direction of the support rod; (b) axial amplitude of the support rod in all directions.
Applsci 15 08851 g018
Table 1. Physical parameters of the simulation model.
SymbolParametersValue
EYoung’s modulus76.7 GPa
ρAverage density2200 kg/m3
μPoisson’s ratio0.17
ω1Frequency of first-order modes5528 × 2pi rad/s
ω2Frequency of second-order modes7919 × 2pi rad/s
Table 2. PML-related parameters.
SymbolParametersValue
cElastic wave propagation speed6.12 km/s
λElastic wave length0.773 m
dThe radius of the bottom of the support beam1.5 mm
R1PML radius803 mm
R2Base radius30 mm
Table 3. Comparison of existing methods and the proposed method.
ItemExisting MethodsProposed Method
System complexityRequire multiple laser vibrometers, resulting in complex setupsA mirror-based beam-splitting optical configuration enables a single sensor to measure multiple shell–rod positions simultaneously, significantly simplifying the system
Error controlSensor repositioning introduces alignment errors and environmental interferenceSynchronous measurement eliminates these errors entirely
EfficiencySequential identification required for each harmonic orderSimultaneously identifies the first four harmonic errors in a single excitation cycle, improving efficiency
Table 4. The parameters obtained in the identification experiment.
SymbolParametersValue
raMaximum amplitude in xy-plane under 0° excitation320 pm
βIncluded angle of maximum amplitude in xy-plane under 0° excitation3
rzMaximum amplitude in z-direction under 0° excitation148 pm
AFour-node antinode amplitude under 0° excitation990 nm
raMaximum amplitude in xy-plane under 45° excitation420 pm
βIncluded angle of maximum amplitude in xy-plane under 45° excitation45°
rzMaximum amplitude in z-direction under 45° excitation140 pm
AFour-node antinode amplitude under 45° excitation990 nm
Disclaimer/Publisher’s Note: The statements, opinions and data contained in all publications are solely those of the individual author(s) and contributor(s) and not of MDPI and/or the editor(s). MDPI and/or the editor(s) disclaim responsibility for any injury to people or property resulting from any ideas, methods, instructions or products referred to in the content.