Article

Provenance Graph-Based Deep Learning Framework for APT Detection in Edge Computing

School of Cyberspace Security, Xi’an Jiaotong University, Xi’an 710049, China
*
Author to whom correspondence should be addressed.
Appl. Sci. 2025, 15(16), 8833; https://doi.org/10.3390/app15168833
Submission received: 16 April 2025 / Revised: 9 June 2025 / Accepted: 10 June 2025 / Published: 11 August 2025

Abstract

Edge computing builds relevant services and applications on the edge server near the user side, which enables a faster service response. However, the lack of large-scale hardware resources leads to weak defense for edge devices. Therefore, proactive defense security mechanisms, such as Intrusion Detection Systems (IDSs), are widely deployed in edge computing. Unfortunately, most of those IDSs lack causal analysis capabilities and still suffer the threats from Advanced Persistent Threat (APT) attacks. To effectively detect APT attacks, we propose a heterogeneous graph neural networks threat detection model based on the provenance graph. Specifically, we leverage the powerful analysis and tracking capabilities of the provenance graph to model the long-term behavior of the adversary. Moreover, we leverage the predictive power of heterogeneous graph neural networks to embed the provenance graph by a node-level and semantic-level heterogeneous mutual attention mechanism. In addition, we also propose a provenance graph reduction algorithm based on the semantic similarity of graph substructures to improve the detection efficiency and accuracy of the model, which reduces and integrates redundant information by calculating the semantic similarity between substructures. The experimental results demonstrate that the prediction accuracy of our method reaches 99.8% on the StreamSpot dataset and achieves 98.13% accuracy on the NSL-KDD dataset.

1. Introduction

Edge computing is an advanced distributed computing architecture that enhances the rapid, real-time computation and data analysis in the Internet of Things (IoT) [1]. However, the centralized data storage and management paradigm brings high-security risks, including vulnerability to cyberattacks and unauthorized tampering. In recent years, many researchers have integrated various security technologies into the edge computing IoT for data privacy, such as integrating blockchain technology into edge computing [2,3,4,5,6]. Specifically, edge nodes collect data and upload it to the blockchain and then use the blockchain for secure data exchange and verification so that various devices can share and exchange data without fear of tampering or loss. Unfortunately, if the data is tampered before data uploading to the blockchain, the application of blockchain technology will be rendered meaningless. To ensure data privacy, recent researchers have adopted Intrusion Detection Systemss (IDS) and rule-based methods to ensure the security of edge computing devices so as to ensure the security of data [2,5]. However, edge nodes are still subject to advanced threats to system security from external networks, especially Advanced Persistent Threats (APTs), which are a covert, complex, and persistent form of network attack. They are often initiated by attack organizations with powerful technology and resources and penetrate high-value targets such as government agencies and multinational corporations for a long time. Typical APT attacks often include multi-stage attack chains [7]: attackers use phishing websites, botnets, and other means to attack the edge hosts of the target system to obtain initial access to the system, then move horizontally in the target’s internal network to enhance access and penetrate the network, and implant backdoors in key network nodes to ultimately achieve data theft and control of the system.
In fact, even the edge devices from government departments and multinational corporations, such as NASA [8] and Amazon [9], have fallen victim to various attacks. According to the 360 Security statistics [10], APT attacks constitute approximately 60% of successful incursions against government departments and multinational corporations, which have inflicted colossal economic losses. Due to its concealment, complexity, and multi-target, APT poses significant challenges for detection. Existing attack detection systems deployed on edge devices, such as IDSs, primarily rely on rule engines [11] and virus attack libraries [12]. However, most of those detection systems overly rely on known attack characteristics and expert experience, which leads to the inadequate detection of unknown attacks. Additionally, these methods consume substantial system resources, hindering the timely and effective issuance of warnings for APT attacks. Furthermore, these detection methods neglect the relevance of the threat intelligence context, which is highly susceptible to APT attacks [13]. This oversight affects the timeliness and effectiveness of detection strategies, making it difficult to ensure the expected benefits of these strategies.
Detection based on provenance graphs has emerged as a highly effective countermeasure against APT attacks, attributed to its optimized resource utilization and enhanced efficiency [14,15]. This methodology entails the implementation of system monitoring to collate audit logs of system calls. Thereafter, the system’s execution is modeled as a Directed Acyclic Graph (DAG), with nodes representing system entities, including processes, files, and network connections, and edges denoting system events, such as file creation by processes. Utilizing the provenance graph, the detection tool is capable of constructing a penetration chain from alarm events flagged by the anomaly detection tool, thereby acquiring contextual information regarding the APT attacks. This contextual information is instrumental in elucidating sophisticated attack strategies, such as differentiating between benign and malicious compression behaviors [16].
Moreover, APT attack paths often include redundant or deceptive information that obscures the true trajectory of the attack, making it challenging to formulate an effective response strategy. In particular, the more redundant the data uploaded by edge nodes, the more it degrades the efficiency and accuracy of the resulting defense decisions. So despite the outstanding results of early experiments, provenance graphs still face two fundamental challenges for real-time threat detection in edge computing: unacceptable computational overhead and a poor balance between detection precision and recall.
To prevent edge nodes from APT attacks, we propose a provenance graph-based deep learning framework. Specifically, we combine the provenance graph and spatiotemporal information to facilitate the detection of concealed APTs. To enhance the efficiency of threat detection, we introduce a graph substructure similarity-based data reduction algorithm that leverages K-means clustering to eliminate redundant information in the provenance graph. Finally, we incorporate heterogeneous graph neural networks (HGNNs) to propose a detection model for network intrusion detection of devices in edge computing. The main contributions are as follows:
(1)
We construct a provenance graph of the system’s behavior over a period of time and designed a heterogeneous graph neural network threat detection model that takes the provenance graph as the input. This model utilizes the provenance graph to model the complex and dynamic activities of hosts. It embeds the provenance graph via node-level heterogeneous inter-attention and semantic-level heterogeneous inter-attention mechanisms. Subsequently, the extracted features are compressed and downgraded through a heterogeneous graph pooling layer. Finally, the prediction is accomplished using the graph representation layer. This model can effectively identify APT attack behaviors present in edge device systems.
(2)
We employ heterogeneous graph neural networks for intrusion detection on provenance graphs, leveraging HGNNs to enhance the accuracy and efficiency of threat detection. The provenance graph is processed as the input to the HGNN through graph embedding techniques. Leveraging the advanced pattern recognition and prediction capabilities of the HGNN, there is a significant enhancement in the accuracy of detecting sophisticated threats. Furthermore, as an inductive learning model, the HGNN diminishes the reliance on a priori knowledge during the detection process. This improves the applicability and detection efficiency of the model. On the StreamSpot dataset commonly used for network anomaly detection in edge streams, our detection accuracy exceeds 99%. On the NSL-KDD dataset, a large dataset containing various types of attacks, we still have a detection accuracy of 98.13%.
(3)
We propose a novel data reduction algorithm for provenance graphs that is grounded in the semantic similarity of graph substructures and aims to improve the detection efficiency and accuracy of the model. This algorithm pinpoints and trims redundant substructures by first delineating the pivotal attributes of nodes and edges within the provenance graph. It then employs the K-means clustering algorithm to group nodes, subsequently identifying and condensing superfluous substructures based on the similarity among these clustered formations. This method reduces the storage space of the graph while maintaining causal relationships, improving the detection efficiency of the model.

2. Related Works

Using new security technology to ensure the security of edge computing is one of today’s research hotspots, such as using blockchain technology to ensure the security of edge computing. Xu et al. [4] proposed a blockchain network architecture that utilizes edge computing to enhance the consensus mechanism and data storage capabilities of IoT devices. By combining edge servers, the proposed system achieves high throughput and high efficiency. Okegbile et al. [3] proposed a collaborative data-sharing scheme that utilizes the blockchain and cloud edge computing to enable data providers and users to work together to accomplish data-sharing tasks. Xu et al. [5] proposed a computational offloading method that utilizes the blockchain to ensure data integrity in edge computing to reduce task offloading time and energy consumption while maintaining load balancing and data integrity in the IoT. Vinay et al. [2] investigated the issue of security threats in the IoT and comprehensively analyzed the application of blockchain in IoT systems based on blockchain solutions, as well as the security faced in the process of integrating the blockchain with IoT challenges.
The current state of research on security policies in edge computing environments shows that edge network nodes are vulnerable to network intrusion threats [2]. The intrusion detection system, as an active defense security mechanism, is mainly used to detect intrusion threats in contemporary edge networks [13]. By processing and evaluating relevant information collected from the network, it is able to provide timely feedback and responses to any anomalous behavior detected [17]. However, APT attacks usually integrate various sophisticated attack techniques at different stages of the attack process [18,19], thus making the whole attack more stealthy. Traditional IDSs can only detect a few known vulnerabilities and cannot capture the whole process of APT attacks due to their insufficient causal analysis capability [20].
Detection based on provenance graphs has emerged as a highly effective countermeasure against APT attacks, attributed to its optimized resource utilization and enhanced efficiency [14,15]. This methodology entails the implementation of system monitoring to collate audit logs of system calls. Thereafter, the system’s execution is modeled as a Directed Acyclic Graph (DAG), with nodes representing system entities, including processes, files, and network connections, and edges denoting system events, such as file creation by processes. Utilizing the provenance graph, the detection tool is capable of constructing a penetration chain from alarm events flagged by the anomaly detection tool, thereby acquiring contextual information regarding the APT attacks. This contextual information is instrumental in elucidating sophisticated attack strategies, such as differentiating between benign and malicious compression behaviors [16].
Building on this foundation, Alsaheel et al. [21] proposed a technique that automatically reconstructs a series of events by relying on user-specified points of interest through causal analysis to accurately identify attack entry points. However, most of the existing research focuses on solving the problem of too many dependencies by performing fine-grained forensic analysis, such as prioritizing dependencies, customizing kernels, and optimizing storage. Although effective, these methods are difficult to popularize due to their reliance on techniques such as heuristic rules, binary staking, and kernel customization, resulting in high application costs. In order to reduce the application cost, Feng et al. [18] proposed a new approach that calculates the dependency impact by computing the discriminative dependency weights of multiple features and back-propagating from point-of-interest events to identify attack entry points. Gao et al. [22], on the other hand, proposed a specific query rule that enables effective attack investigation and detection by querying the stream of historical and real-time system call events. However, a major limitation of this approach is that it requires the manual construction of query statements, which is not only error-prone but also leads to volatile detection results. To overcome this limitation, Gao et al. [22] further proposed an automated attack detection method. The method utilizes natural language processing techniques to extract knowledge from cyber threat intelligence reports and analyze the threat details. Milajerdi et al. [15] proposed to rely on the correlation of suspicious event streams to detect ongoing attacks and use the knowledge from the cyber threat intelligence reports to align the attacks recorded in the system audit data through graph pattern matching. Pasquier et al. [14], on the other hand, proposed an approach that combines a runtime kernel layer monitor and a query module to enable real-time attack analysis.
Despite the outstanding results of early experiments, provenance graphs still face two fundamental challenges for real-time threat detection in edge computing: unacceptable computational overhead and a poor balance between detection precision and recall [16]. Since constructing provenance graphs requires a large amount of computational resources and since edge network nodes have relatively limited computational and storage resources, for example, according to an analysis of the dataset from DARPA Engagement 3 [23], a client generates an average of 3.7 GB of log data per day. If the state-of-the-art method Unicorn [14] is used for APT detection, it requires 687 MB of memory, so there is a need to investigate lightweight intrusion detection models and apply them to edge network nodes for intrusion detection. On the other hand, it is difficult to achieve a balance between precision and recall in detection. Rule-based approaches usually rely on generalized patterns to improve the recall rate, but these methods cannot detect APT with long latency periods and camouflage. In addition, rule-based methods are severely limited by expert knowledge and cannot detect unknown threats.

3. Materials and Methods

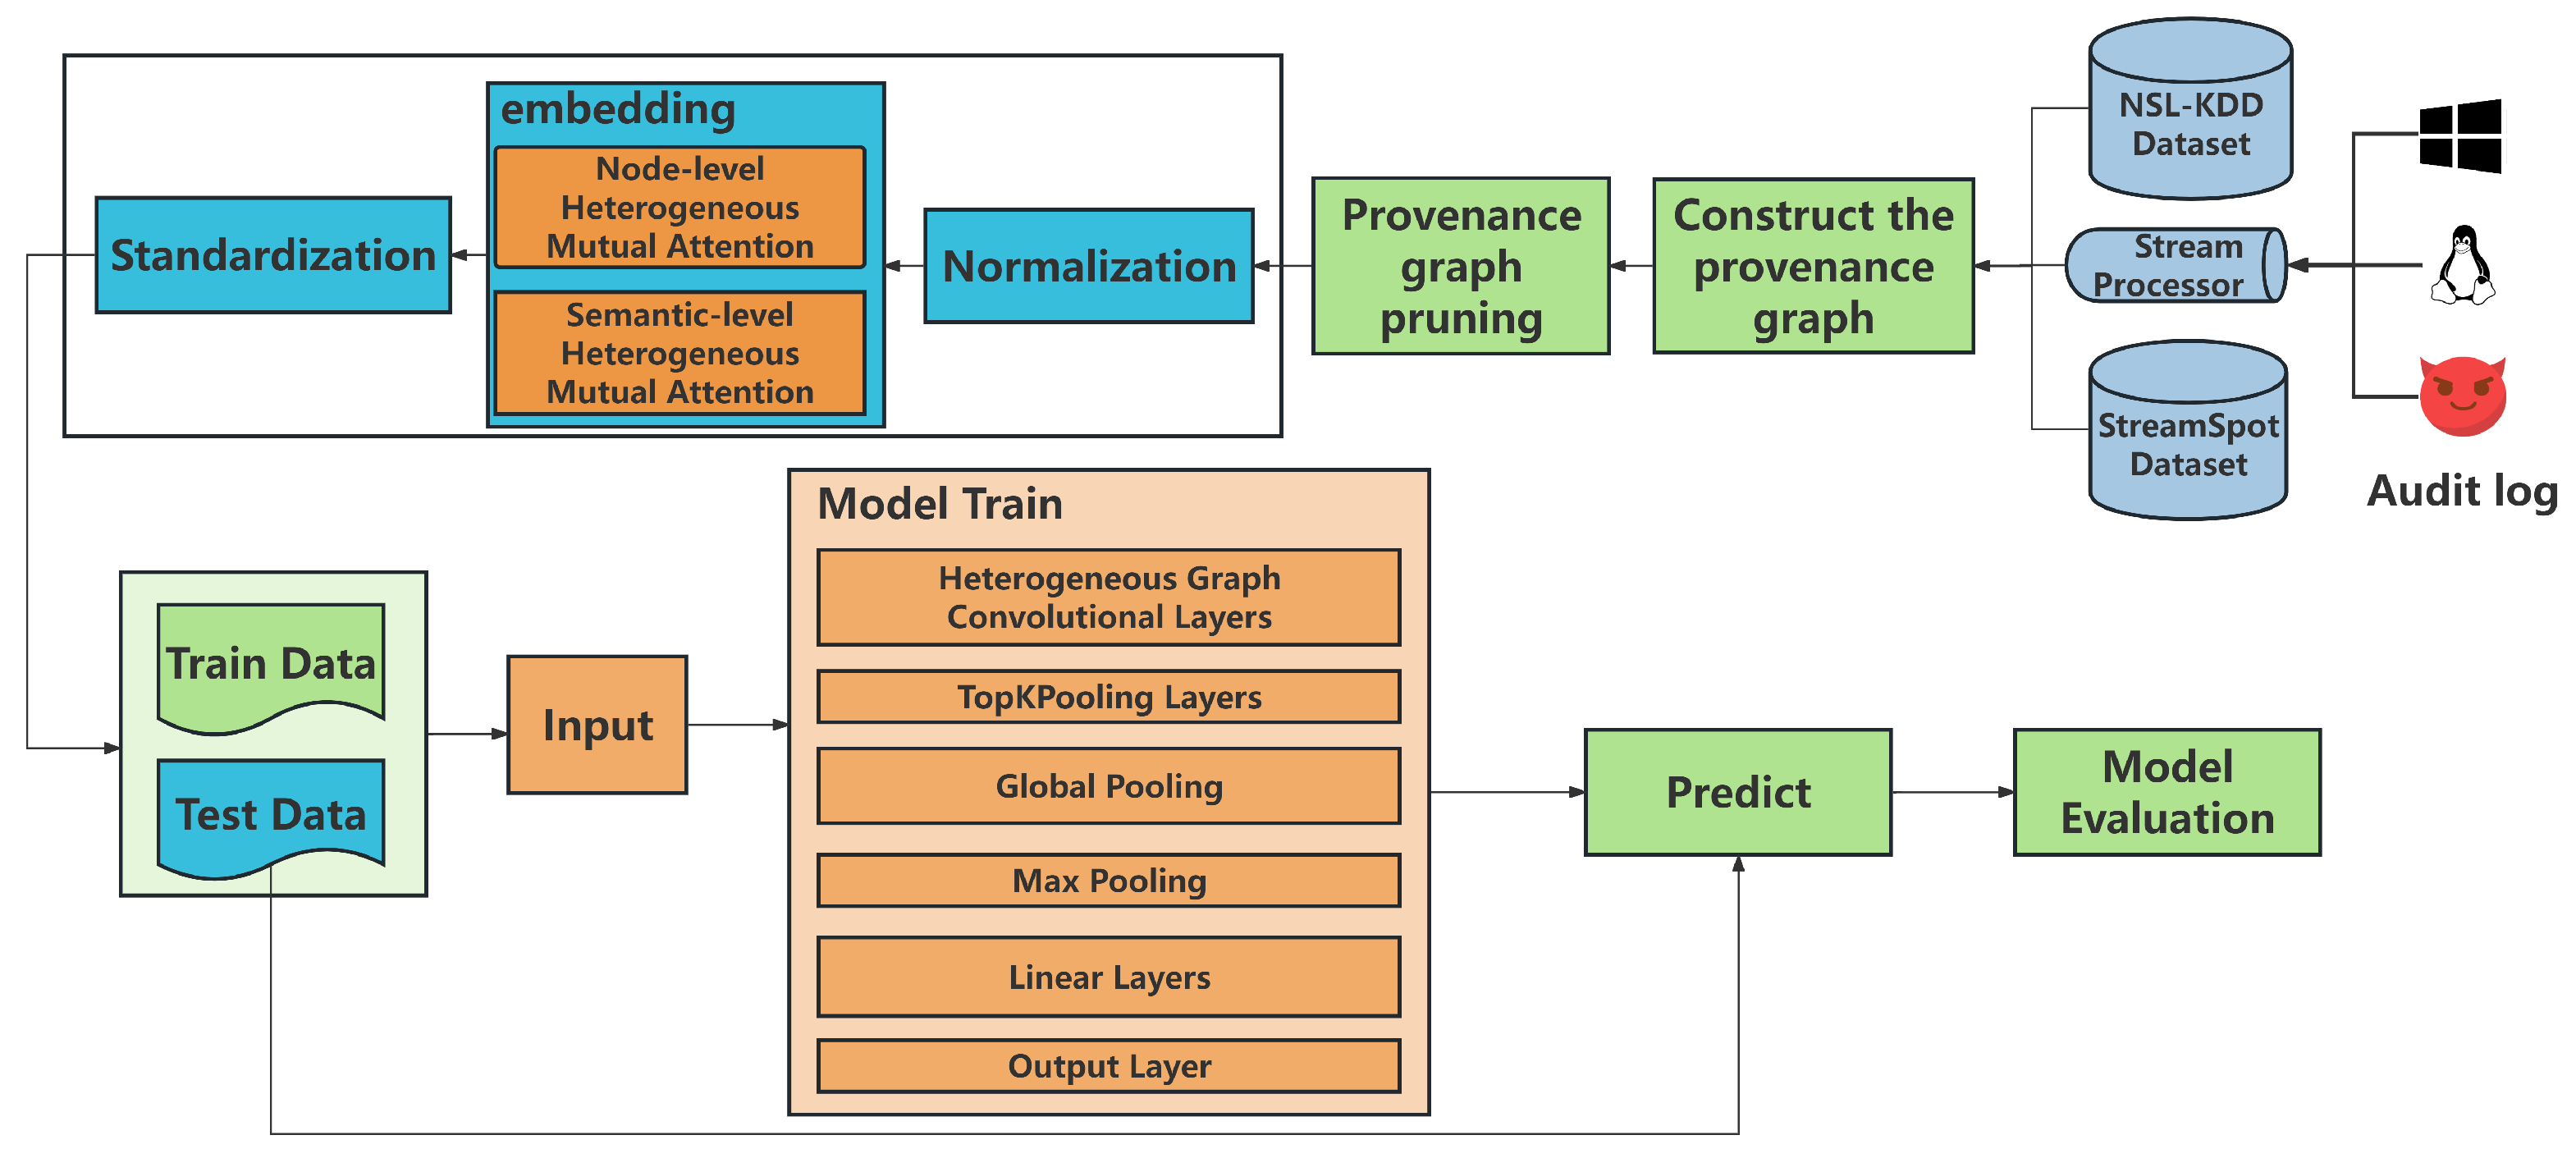
The intrusion detection method for edge computing devices relies on a threat detection model based on a provenance graph and heterogeneous graph neural networks to conduct intrusion detection. The model takes system audit logs and datasets as inputs to construct a provenance graph, uses a provenance graph data reduction algorithm based on the semantic similarity of graph substructures to reduce the provenance graph, then transforms the provenance graph into a form acceptable to the neural network through the process of attribute vectorization, and finally utilizes the heterogeneous graph neural networks to carry out the learning of the relevant features of the attack behaviors, and it constructs a suitable detection model that detects the presence of attacks, especially APT attacks, in log files. The framework of the model is shown in Figure 1.

3.1. Provenance Graph Construction

The provenance graph describes the flow of information between subjects and objects, and it reveals the behavioral patterns of the entire system by detailing the mutual exchanges and dependencies between components in the network system. The detailed veins of these exchanges and dependencies provide us with a picture of the dynamic operational processes of the host. It is worth noting that almost all critical nodes in threat activities, even APT, leave traces in these graphs.
In order to construct a suitable provenance graph, the logs contain three main categories: firstly, the subject logs of active behaviors, such as processes, etc.; secondly, the object logs of receptive behaviors, such as files, network data streams, etc.; and lastly, the event logs connecting the subject and the object. These log data are transformed into nodes and edges in the provenance graph, which makes the complex interactions within the system clear at a glance and facilitates us to detect and identify attacks.
The provenance graph constructed in the detection model is actually a graph with directional and heterogeneous properties. The provenance graph represents the subject, the object, and the information flow between them. In the provenance graph, the subject and the object represent the initiator of the system activity and are accompanied by rich information, such as the creation time, the command line parameter, etc. The edges of the provenance graph represent the system activity, and the flow of information between subjects and objects (such as process A opens file B, then opens C) is the edge between two nodes A and B. Also, we have considered a variety of elements, such as file objects, network flow objects, memory objects, etc., and recorded their properties and behaviors in detail. The categories of subjects and objects are divided, as shown in Table 1. However, in practice, APT attacks typically infiltrate systems via complex, multi-stage methods. The attack paths often contain a large volume of redundant information and similar substructures. Consequently, the provenance graph also incorporates a significant amount of redundant data. Only a small fraction of this redundant information provides security analysts with key insights for forensic analysis. The information similar to this portion not only occupies storage space but may also impede the analysts’ investigative progress and increase their workload. Based on this, the redundant information in the provenance graph can be reduced.
The core goal of data reduction in provenance graphs is to remove as many redundant, useless nodes and edges from the graph as possible while ensuring that the results of the forensic analysis are not affected.
Thus, first of all, we need to define the information that needs to be retained in the provenance graph and give a definition of the key attributes of each type of node and edge in the provenance graph.
For the set of attributes of node v = { v 1 , v 2 , , v n } , its key attributes are a subset of the set of attributes required in the provenance process { v 1 , v 2 , , v m } , where mn. When a suspicious file or process is detected, most provenance algorithms generally analyze all nodes associated with the detection point. The analysis mainly focuses on those attributes that reveal causal relationships rather than all the attributes of that node, and the attributes of the edges follow a similar logic; i.e., the analyst focuses on whether there is an operation between nodes that has a causal relationship without caring about the specific impact caused by that operation. Therefore, the reduction in the provenance graph based on key attributes usually does not affect the accuracy of the subsequent forensic analysis.
Next, we need to determine whether the nodes or edges have similar semantic contents, and the key attributes of the nodes and edges can be used to subsequently calculate the similarity of the substructures in the graph that have the same antecedent node, and then determine whether the nodes or edges have similar semantic contents.
For the set of successor nodes of a given node { t 1 , t 2 , t m } , if the key attributes of the first successor node t 1 and the last successor node t m are the same and the edge attributes from node s to the successor node t 1 as well as from s to t m are consistent with each other, then it can be assumed that the subgraphs from s to t 1 and from s to t m convey equivalent semantic information.
Since the system usually has a large number of repetitive operations, subgraphs with the same semantic information usually indicate that the system has executed the same or similar operations at that time. Deleting these redundant substructures but retaining the timestamps of the edges in the provenance graphs and the related statistical information will effectively reduce the redundant data without affecting the subsequent analysis of the attacks. Meanwhile, the retention of causal dependencies in the provenance graph during the above reduction process ensures the consistency of the event source node, target node, and occurrence time.
Finally, we need to design effective data reduction algorithms, and for this purpose the pseudo-code of a reduction algorithm based on the semantic similarity of graph substructures is designed, as shown in Algorithm 1. The algorithm uses a K-means clustering algorithm to cluster the nodes of the graph and reduces the redundant substructures of the graph by the similarity of the clusters.
Algorithm 1 Provenance graph reduction based on the semantic similarity of graph substructures
  1:
Input: Provenance graph G
  2:
Output: Reduced provenance graph G’
  3:
Build hierarchy H of G and extract semantic features F
  4:
for each node s G do
  5:
     H s Level of node s
  6:
     F s { Degree ( s ) , Centrality ( s ) , }
  7:
    for each neighbor t N ( s ) do
  8:
         H s H t if dependency exists
  9:
    end for
10:
end for
11:
Determine number of clusters k using K-means clustering
12:
for m = 1 , , M  do
13:
    for each cluster C i clusters do
14:
        for each node s C i do
15:
           Compute key attributes k s t of the substructure formed by node s and its successor node t
16:
           Calculate D ( s , t ) using the Jaccard index
17:
            D ( s , t ) = 1 | N ( s ) N ( t ) | | N ( s ) N ( t ) |
18:
           if  D ( s , t ) > α then
19:
               Merge nodes s and t within cluster C i
20:
           end if
21:
           Record semantic information k s t
22:
        end for
23:
    end for
24:
end for
25:
return reduced provenance graph G’
This algorithm performs provenance graph reduction based on the semantic similarity of graph substructures. The algorithm begins by taking the provenance graph G as input and aims to produce a reduced provenance graph G . First, it constructs a hierarchical structure H of G based on the dependencies among the nodes. For each node s, semantic features F s are extracted, which may include attributes like degree and centrality. These feature vectors are used to represent the characteristics of the nodes in the graph. The algorithm then proceeds to determine the number of clusters k using K-means clustering. For M iterations, it processes each cluster C i , where for every node s within the cluster, it computes the key attributes of the substructure formed by s and its successor node t. The similarity between these nodes is calculated using the Jaccard index. If the similarity D ( s , t ) exceeds a threshold α , the nodes s and t are merged within the same cluster C i . After merging, the semantic information of the merged nodes is recorded. Finally, the reduced graph G is returned.
The algorithm reduces the redundant subgraphs in the graph by analyzing the semantic similarity between the substructures in the graph, which accelerates the detection process and reduces the computational burden on analysts. Meanwhile, through K-means clustering calculation, the algorithm is able to identify the correlation between different attack phases, helping the detection system find potential APT attacks, which often utilize similar techniques and tactics to unfold in multiple phases, and the algorithm is able to effectively differentiate between normal activities and attack behaviors, reducing the rate of false alarms. In addition, the algorithm is able to cope with the continuous evolution of APT attack techniques, and when attackers try to use new techniques to bypass traditional detection, the algorithm is able to recognize the attack pattern based on the semantic features of the substructures and respond in time.
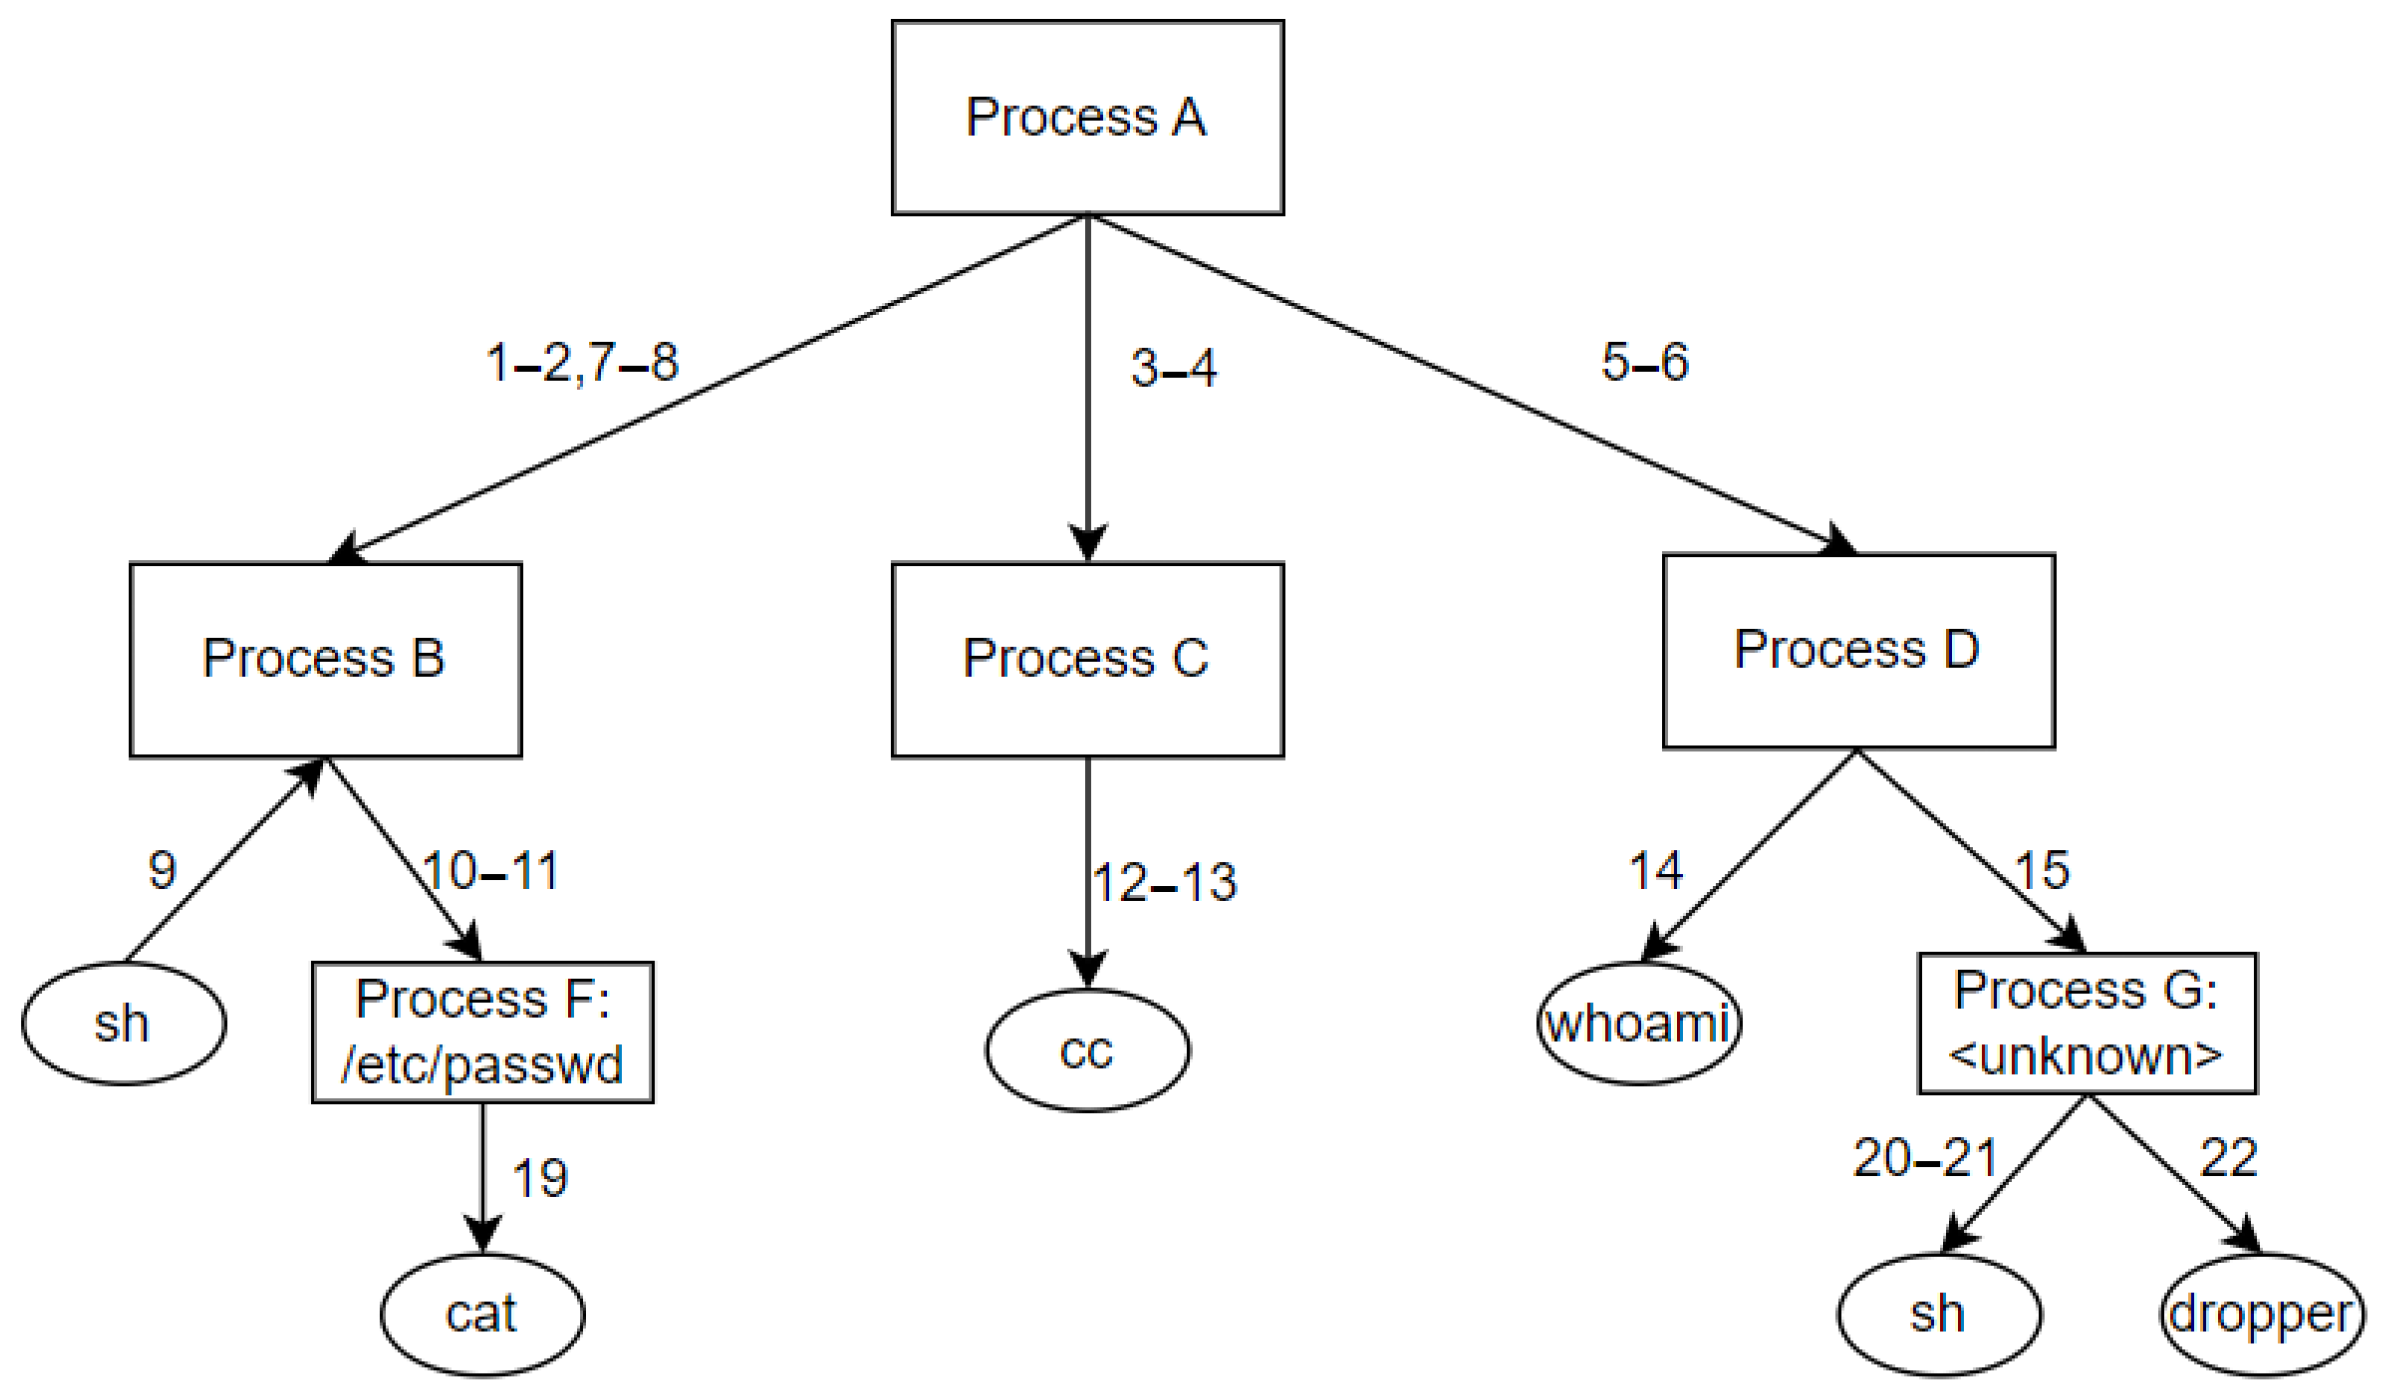
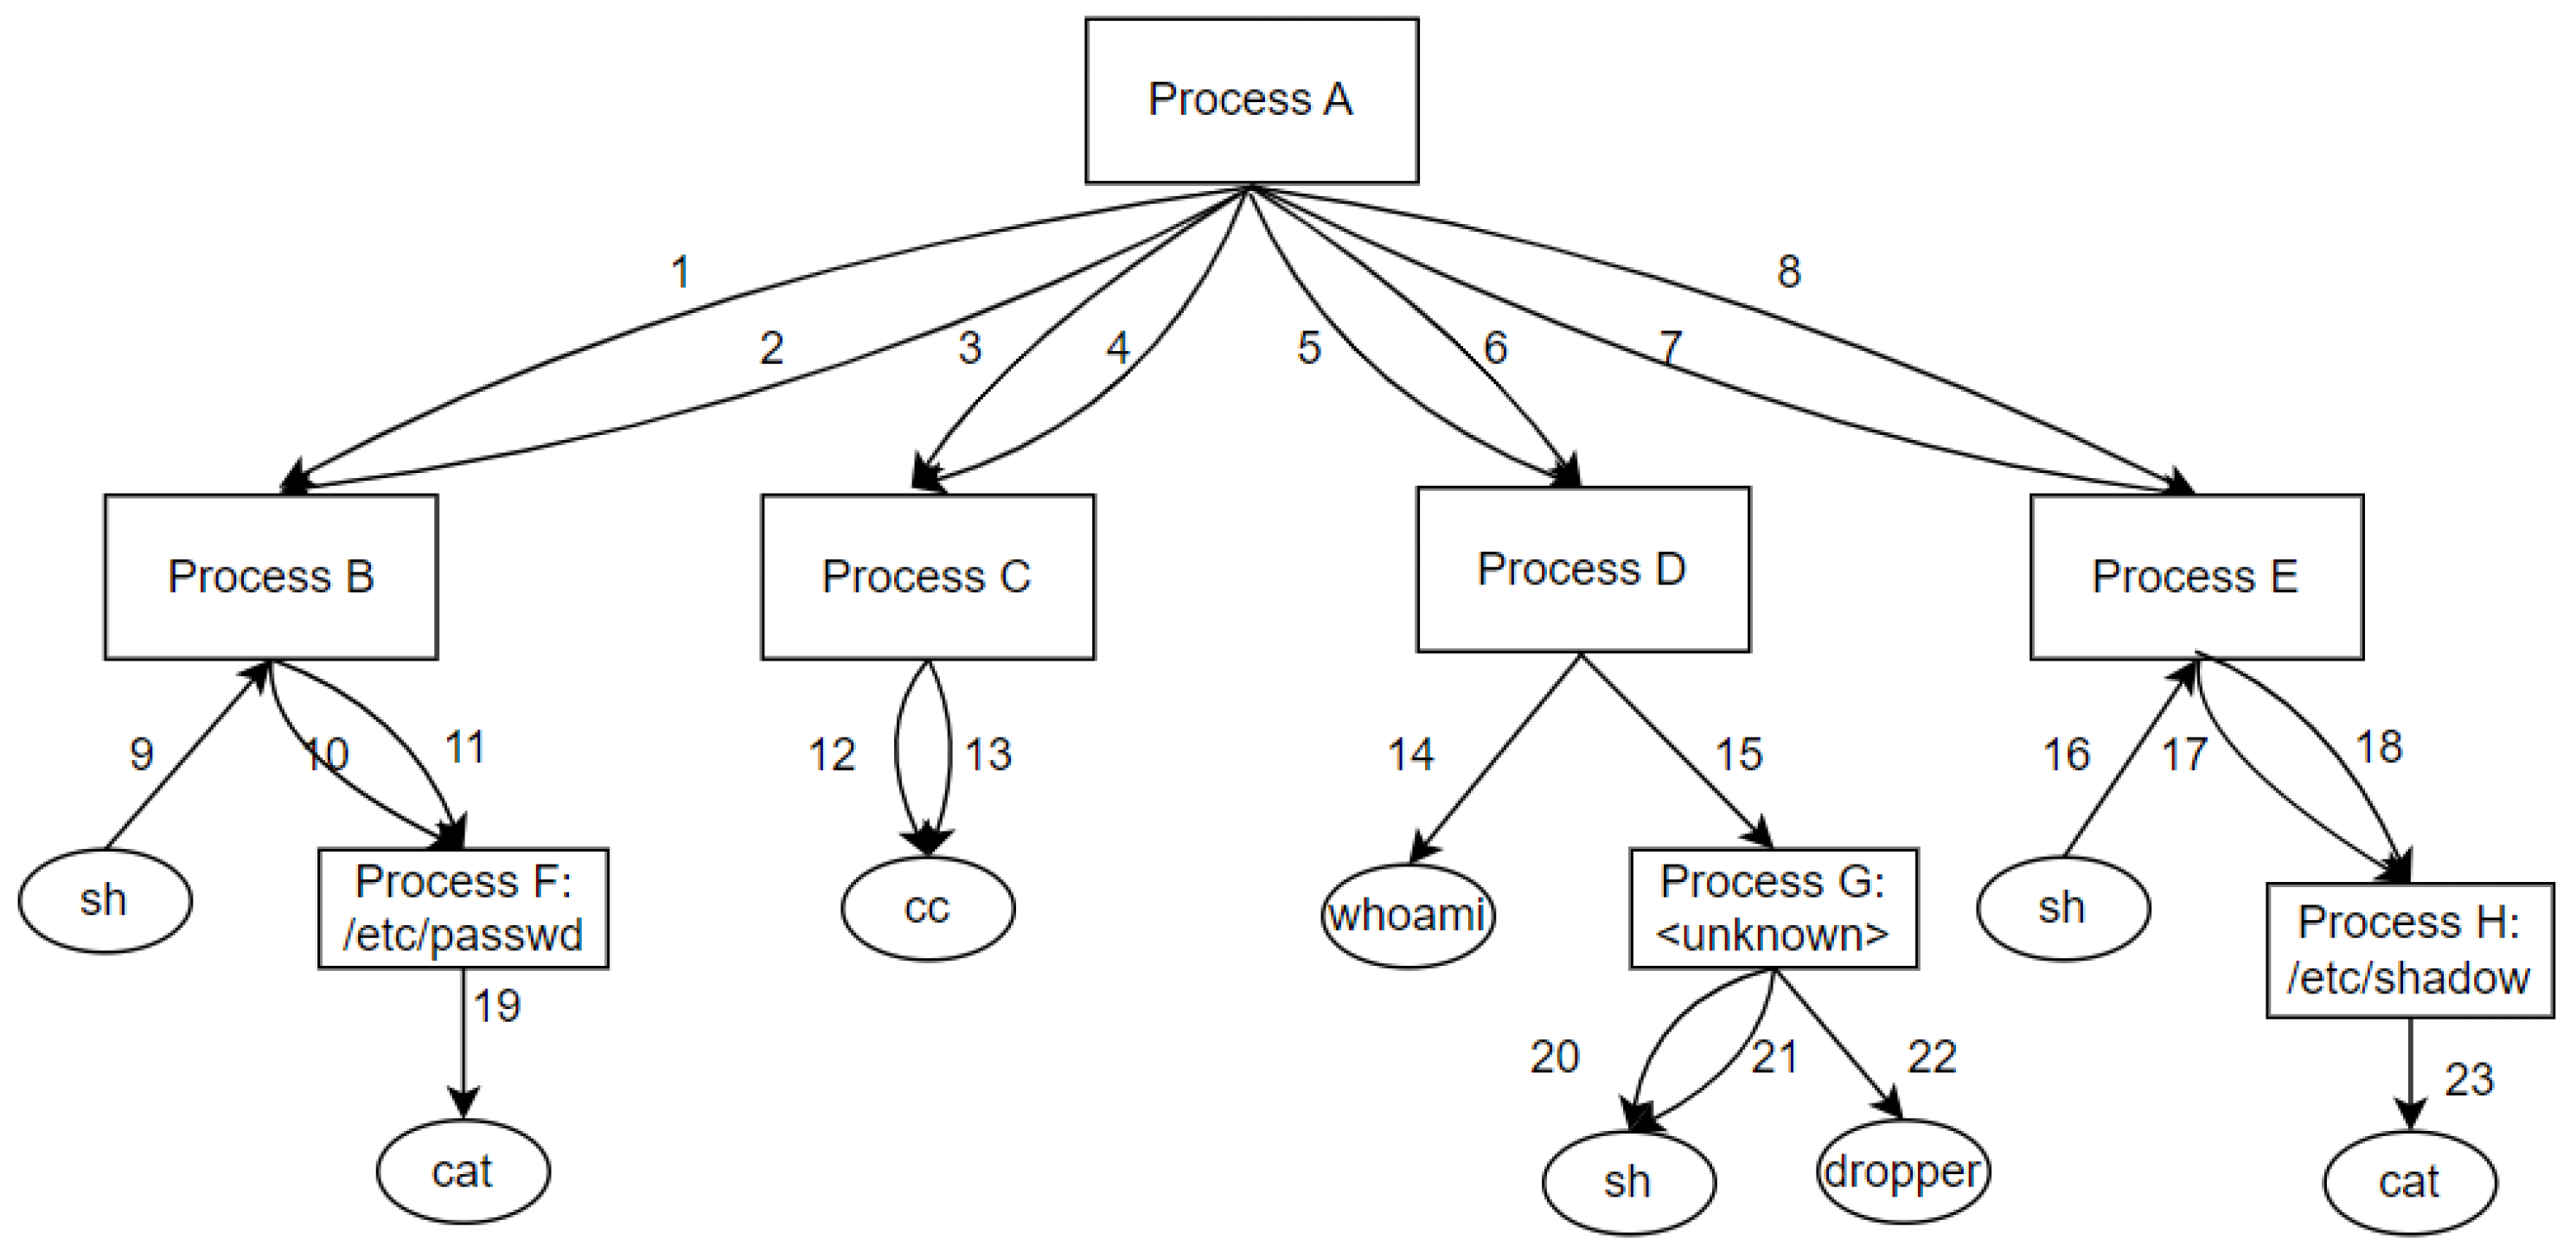
Figure 2 shows an example of a provenance graph of a host’s activity, where processes and files are represented by rectangles and ovals, respectively. In Figure 2, process A creates processes B, C, D, and E. Process B creates process F, while process D creates process G, and process E creates process H. Files sh and cat, which are directly or indirectly operated on by processes B and E, have the same file descriptors and are therefore the same file. At some point, process A creates the child process B. Process B operates on the file sh and creates process F, which then operates on the file cat, and process A behaves in a similar way with process E as it does with process B.
In practical applications, the algorithm based on the semantic similarity of substructures can effectively reduce the storage space of redundant data. Compared with Figure 2, Figure 3 is able to remove duplicate subgraph structures and retain important attack path information and its temporal attributes. Meanwhile, the algorithm is particularly effective for provenance graphs with more redundant information.

3.2. Attribute Vectorization

Since the heterogeneous graph neural network model cannot directly utilize the deep semantic information embedded in the provenance graph, we must first meticulously disassemble the provenance graph in order to separate its structured and unstructured information content. The core of this process is to simplify the cumbersome construction of the provenance graph into more manageable components of the model, and these simplified elements are mainly concretely presented through the feature vectors of edges and nodes.
In a provenance graph, node attributes vary depending on their type, which adds to the complexity of data processing. In order to effectively deal with this diversity, we mainly categorize node attributes into two types, namely text and numeric, and adopt different processing strategies, respectively.
For node attributes of the text type, special attention is paid to those attributes with clear categorization. In order to transform this category information into a numerical form that can be utilized by the model, its processing is carried out through one-hot coding, which converts each category into a unique binary vector. However, when confronted with attributes with a large number of categories, simple one-hot coding may result in a matrix that is too sparse for model learning. Therefore, in this case, the choice was made to use a target coding approach that maps each category to a more compact value space.
Among these text attributes, there are some strings containing system management commands, such as the cmdline attribute. This type of text is more difficult to process because system management commands are usually of high complexity and diversity. In addition, there is a lack of appropriate natural language processing (NLP) tools to effectively extract the features of such texts. Therefore, after considering the processing effect and model performance, we choose to discard this part of the text attributes that are difficult to process.
When processing the attributes of numeric types, targeted preprocessing is carried out according to the different ranges of their values. For most of the numeric types, one-hot coding is still used to retain their original category information. However, for those attributes with large value ranges, such as memory addresses, IP protocol attributes, etc., we adopt a different strategy. Due to the large and wide range of values of these attributes, if these attributes are directly input into the model, it may cause the model to ignore other relatively small features. Therefore, to avoid this, we first standardize and normalize these attributes to limit them to a reasonable range of values.
In addition, the temporal attributes and timestamps in the provenance graph are carefully handled in order to preserve information about the execution sequence of the system’s activities. This temporal information is crucial for understanding the system’s behavior. However, the raw timestamps are accurate to the nanosecond level, which is too fine for subsequent data processing. To facilitate subsequent data processing and reduce the computational burden, we reduce the precision of the timestamps from nanoseconds to seconds. Such processing retains the elements of time information and simplifies the complexity of data processing.

3.3. Heterogeneous Graph Neural Network Model Training

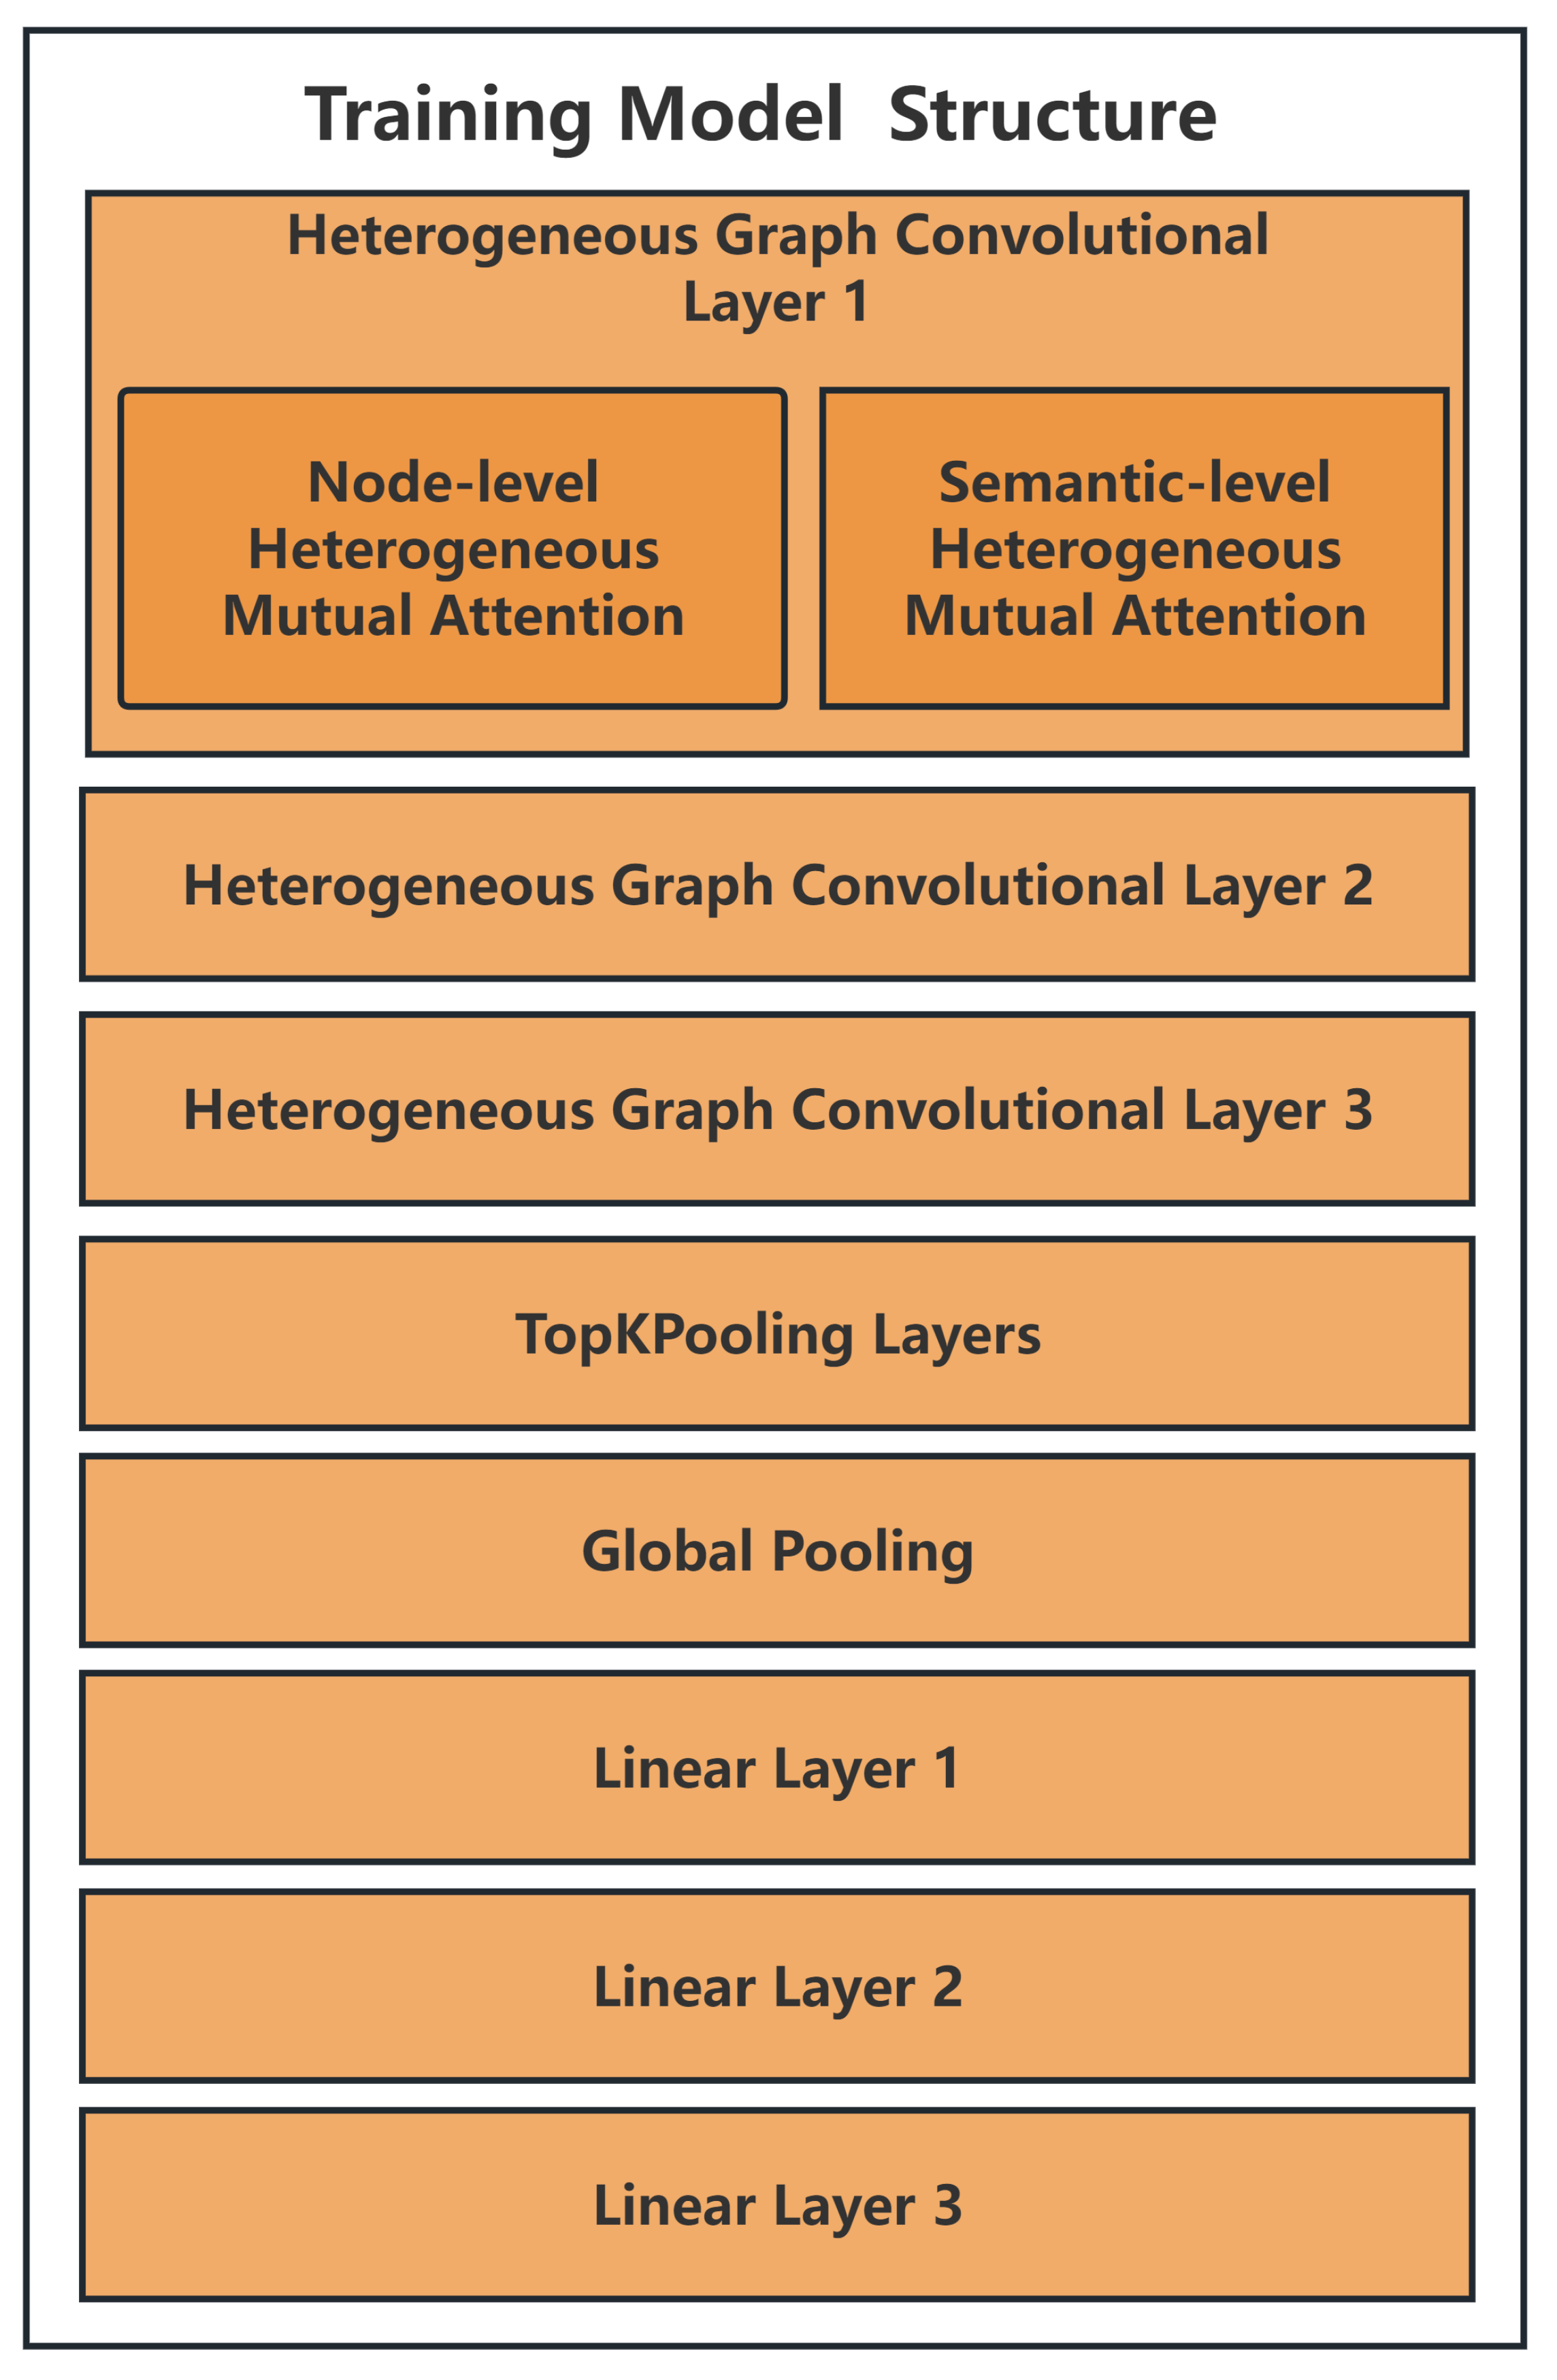
The heterogeneous graph neural network model consists of a heterogeneous graph convolutional layer, a heterogeneous graph pooling layer, and a graph readout layer. In the heterogeneous graph convolutional layer, through specific convolutional operations, the model is able to efficiently aggregate the neighborhood information of the nodes as a way to update the representation of each node and deeply capture various complex association patterns in the graph. Subsequently, the heterogeneous graph pooling layer comes into play, which performs fine-grained filtering and dimensionality reduction on the features extracted from the convolutional layer, aiming to reduce the number of variables in the feature graph while ensuring that key feature information is retained. This step is crucial to reduce the computational burden and enhance the broad applicability of the model. Ultimately, the graph readout layer acts as a global pooling function that regularizes the varying amount of node information to a uniform dimensionality criterion and completes the final classification prediction.
The architecture of the heterogeneous graph neural network model is shown in Figure 4 below:

3.3.1. Heterogeneous Graph Convolutional Layer

For the APT detection model based on provenance graphs and heterogeneous graph neural networks, the inputs are node feature vectors, edge feature vectors, and the adjacency matrix of the graph. The first thing that needs to be performed is the embedding of nodes, and the embedding of edges is accomplished by introducing the heterogeneous mutual attention mechanism.
Suppose a provenance graph consists of N nodes. The F-dimensional feature set of these nodes can be represented as h = { h 1 , h 2 , , h N } , where h i R F . R F represents an F-dimensional real vector space. The objective of the heterogeneous graph convolutional layer is to generate a new set of node features, denoted as h = { h 1 , h 2 , , h N } , with h i R F . During this process, the dimensionality of the feature vectors may change from F to F . To maintain sufficient expressive power for transforming the input features into higher-order features, at least one learnable linear transformation is necessary. For example, given two nodes i and j with their respective features h i and h j , we apply a linear transformation e i j = a ( W h i , W h j ) in the F-dimensional space. This transformation maps the original F-dimensional features to new F -dimensional features h i and h j .
The above formulation first maps the input features to a higher-order feature space through a linear transformation. Subsequently, it assigns the corresponding attention to each node using the self-attention mechanism. There is a generalized attention computation module for this process. This module calculates each node’s attention to other nodes by performing a mapping from R F × R F to R , thereby computing the influence coefficient of each node on other nodes, i.e., the attention coefficient e i j . When calculating the attention, the method comprehensively considers each pair of nodes in the graph. This means that the influence of each node in the graph on the target node is taken into account. However, this approach may ignore the overall structural information of the graph. To more accurately assess the relationship between the target node and its neighboring nodes, we only focus on the nodes within the neighborhood N of the target node j and calculate their correlation with the target node, denoted as e i j . N i represents the set of neighboring nodes of the target node i. To ensure a reasonable distribution of weights among different nodes, we need to perform a unified normalization procedure on the correlation degree between the target node and all its neighboring nodes. Here, we choose to use the softmax function to achieve this normalization process:
α i j = softmax j ( e i j ) = exp ( e i j ) k N i exp ( e i k ) .
Regarding the choice of the calculation of the correlation, two approaches can be used. The first one is to utilize the inner product of vectors to perform a kind of concise parameter-free correlation calculation. This method directly calculates the inner product of vectors W h i , W h j to derive the similarity between two vectors as their correlation. Another approach is to design a parameterized neural network layer to compute the correlation. This neural network layer can be flexibly adapted to specific tasks and data characteristics, but its core requirement is that it must output a scalar value that satisfies R d ( l + 1 ) × R d ( l + 1 ) R , which is used to quantitatively represent the degree of correlation between two inputs.
In the research experiments, to more precisely capture and model the complex relationships in the data, we choose a single-layer feedforward neural network with a relatively simple structure to calculate the correlation degree.
Notably, we adopt LeakyReLU as the nonlinear activation function in this neural network and set its slope in the negative half-axis to 0.2. This design not only enhances the network’s expressive power but also enables the network to maintain a certain level of activity when handling negative inputs. As a result, the network can more efficiently learn and adapt to the nonlinear relationships in the data. The nonlinear activation function is as follows:
e i j = LeakyReLU ( a T [ W h i W h j ] ) ,
where ⨁ denotes the splicing operation. a is a learnable vector parameter in the neural network for measuring the correlation between node features. The complete weight coefficients are computed as
α i j = exp LeakyReLU ( a T [ W h i W h j ] ) k N i exp LeakyReLU ( a T [ W h i W h k ] ) .
After obtaining the normalized attention coefficients, the linear combination of their corresponding features is computed, and after passing the nonlinear activation function, the final output feature vector for each node is
h i = σ j N i α i j W h j ,
where σ represents the activation function.
In addition, we employ the multi-head attention mechanism to stabilize the learning process of self-attention. Specifically, the above equation is applied to a set of K mutually independent attention mechanisms; then the outputs are stitched together:
h i = k = 1 K σ j N i α i j k W k h j ,
where α i j k represents the k-th weight coefficients computed by the group attention mechanism, W k is the corresponding input linear transformation matrix, and the final output node feature vector h i contains K F features. To reduce the dimensionality of the output feature vector, the splicing operation can be replaced with an averaging operation:
h i = σ 1 K k = 1 K j N i α i j k W k h j .
Each neighbor undergoes three attention computations. Each attention computation is a standard self-attention mechanism, outputting a vector h i . Finally, the three different vectors h i are either concatenated or averaged to obtain the final vector h i .
Through these operations, we complete the embedding of nodes. However, the provenance graph is a heterogeneous graph, which also requires the consideration of the information from incoming edges, and the node types are not the same. To capture the rich features of nodes more comprehensively, we need to synthesize multiple different semantic information. These diverse semantic information can be effectively revealed with the help of meta-paths. When dealing with heterogeneous graphs, choosing appropriate meta-paths and effectively fusing this different semantic information is a challenging task. To address this challenge, we adopt the semantic-level attention mechanism for heterogeneous graphs proposed by the heterogeneous graph neural network model. This mechanism can intelligently recognize the importance of different meta-paths and skillfully fuse the information of these meta-paths according to the needs of a specific task.
In implementing this method, we use node embeddings with specific semantics obtained from the node-level attention mechanism as the input data. Specifically, P sets of node embeddings with specific semantics learned from node-level attention are used as the inputs for the mechanism. For each meta-path β Φ 0 , β Φ 1 , , β Φ p , its learning weight can be expressed by a deep neural network responsible for performing the computation of semantic-level attention. This mechanism demonstrates the power of semantic-level attention in capturing the complex and varied semantic information behind heterogeneous graphs, providing a powerful tool when dealing with complex networks. The learning weights can be expressed as
β Φ 0 , β Φ 1 , , β Φ p = att sem Z Φ 0 , Z Φ 1 , , Z Φ p ,
where att sem denotes the deep neural network that performs semantic-level attention. It shows that semantic-level attention can capture all kinds of semantic information behind heterogeneous graphs.
In order to deeply explore and learn the importance of individual meta-paths, we will first perform a nonlinear transformation process on embeddings with specific semantics. This process can be realized by a neural network structure such as a multilayer perceptron (MLP), which can efficiently map the original embeddings to a new feature space. Immediately afterward, we will compute the similarity between these transformed embeddings and the predefined semantic-level attention vector similarity between these transformed embeddings and the predefined semantic-level attention vectors. These similarities essentially reflect the importance of each particular semantic embedding.
In addition, in order to obtain a global perspective, we will further average the importance of all specific semantic node embeddings. This averaging not only provides a concise metric but also helps us visualize the importance of each meta-path in the whole network. In this way, we can more precisely quantify and compare the contribution of different meta-paths to the final task performance.
The importance of each meta-path Φ i can be represented by the average importance calculated as follows:
w Φ i = 1 | V | i V q T · tanh ( W · z i Φ + b ) ,
where W is the weight matrix, b is the bias vector, and q is the semantic-level attention vector.
After obtaining the importance of each meta-path, we normalize them using the softmax function. The weights β Φ i of the meta-path Φ i can be obtained by applying the softmax function to normalize the importance values of all meta-paths:
β Φ i = exp ( w Φ i ) i = 1 K exp ( w Φ i ) .
where w Φ i represents the importance score of the meta-path Φ i . The above equation represents the contribution of the meta-path Φ i to a particular task. K represents the number of attention heads. Evidently, the higher the value of β Φ i , the more significant the meta-path Φ i is. It should be noted that for different tasks, the meta-path Φ i may have different weights. By using the learned weights as coefficients, we can fuse these semantics-specific embeddings to obtain the final embedding Z as follows:
Z = i = 1 P β Φ i · Z Φ i ,
where Z Φ i represents the semantic embedding vector of meta-path Φ i .

3.3.2. Heterogeneous Graph Pooling Layer

The main role of the heterogeneous graph pooling layer is to downsample the output of the convolutional layer, thereby reducing the size of the data and the number of parameters, which in turn reduces the computational load. The heterogeneous graph pooling layer employs average pooling. The pooling layer progressively reduces the number of nodes in the subsequent layer by setting a pooling rate of k ( 0 , 1 ) for each layer. Specifically, the number of nodes in a graph containing N nodes will be reduced to k 1 × N , k 2 × N , …, k m × N after m layers of pooling. Subsequently, these remaining node features and adjacency matrices are used to characterize the graph.
However, in the face of graphs with variable sizes and an unstable number of nodes, such as provenance graphs, a single hierarchical pooling operation may not be able to fully capture all the information of the graph. To solve this problem, on the basis of hierarchical pooling, all the remaining nodes are average pooled. Thus, a feature vector that can fully reflect the information of the whole graph is obtained.
In the pooling process, the nodes in each layer are not simply reduced but selected and optimized based on the clustering results of the nodes in the previous layer. This clustering method not only considers the feature information of the nodes but also fully integrates the topology of the graph, thus ensuring that the pooled nodes are more representative. After obtaining the feature matrix X of the nodes, we further combine the adjacency matrix A to carry out a refined pooling operation. This step not only takes into account the characteristics of the nodes themselves but also makes full use of the relationship information between the nodes, which makes the pooling results more accurate and comprehensive.
Ultimately, the forward propagation process of the heterogeneous graph pooling layer achieves the conversion from the provenance graph input to the highly refined feature output. The forward propagation process of the heterogeneous graph pooling layer can be simply described as the conversion from the input ( X , A ) to the output ( X , A ) , where X is the node feature matrix, A is the adjacency matrix, and X is the pooled node feature matrix. The dimensions of X are jointly determined by the number of original nodes n, the feature dimensions d, and the pooling rate k.
In this way, the pooling layer is able to simplify the graph structure while retaining the key feature information of the graph, providing strong support for subsequent graph classification tasks.

3.3.3. Heterogeneous Graph Readout Layer

Provenance graph classification prediction is achieved through the graph readout layer, which utilizes feature vectors representing the entire graph to accomplish this task. The core of the graph readout layer is the multilayer perceptron (MLP). When the output data from the heterogeneous graph hierarchical pooling layer is passed to the graph readout layer, the multilayer perceptron processes this data and thus performs the prediction of the graph type. Within the multilayer perceptron, we employ specific parameters, namely the weight matrix ω i and the bias vector b i , to process the data from the hidden layer. The graph feature vector g ˜ is converted into a new vector representation h ˜ after processing in the hidden layer, and this process is realized by the following equation:
h ˜ = ReLU ( ( ω i · g ˜ + b i ) .
After obtaining the vector h ˜ , we further use the softmax function, which is a normalized exponential function, to compute the probability distribution of the graph belonging to each category. In this process, x represents the graph feature vector, and C represents the number of all possible graph types. Ultimately, the probability distribution of the classification of the graph can be obtained by the following equation:
p ( y x ) = exp ( ( ω y x ) c = 1 C exp ( ( ω c x ) .
In this way, the graph readout layer is able to efficiently utilize the multilayer perceptron and softmax function to accurately predict the type of graph.

4. Experiments

In this section, we evaluate the performance of the model through some datasets that fit the real scenarios of edge devices. Firstly, the test is conducted on the StreamSpot dataset [24]. In order to further test the detection ability of the model, the model is tested on the NSL-KDD dataset [25] at the same time. The experiments are conducted on a computer equipped with an Intel i7-10700 CPU. In evaluating the performance of the model, we employ a variety of widely used deep learning evaluation criteria for evaluating the performance of the model, such as AUCs, the False Positive Rate (FPR), the Average Precision Rate (AP), ROC curves, recall, and F1-score.

4.1. Introduction to the Dataset

The first dataset is the StreamSpot dataset. The StreamSpot dataset is a dataset designed for system behavioral analysis and anomaly detection; it covers a number of different scenarios and provides researchers with a platform to test and validate their security detection methods. This dataset consists of six scenarios, five of which reflect normal user behavior, while the other scenario simulates an attack, specifically showing a process of downloading a program from a malicious URL and exploiting a flash memory vulnerability to gain system administrator privileges. To ensure the diversity and reliability of the data, each scenario was run 100 times during the data collection phase, while the SystemTap tool was used to record in detail various information about the system at runtime, which is crucial for subsequent system behavior analysis and model construction. In addition, the StreamSpot dataset performs well for developing and testing anomaly detection algorithms and is particularly suitable for those based on graphical analytics, machine learning, and streaming data processing approaches. The detailed information on the StreamSpot dataset is shown in Table 2:
The second dataset is the NSL-KDD dataset. It is a commonly used test dataset in network IDSs and an improved version of the KDD 99 dataset used in the KDD Cup 1999 competition. The dataset contains a large number of network connection records. Each record is labeled to indicate whether the connection represents normal network activity or a specific type of attack. The NSL-KDD dataset consists of four sub-datasets: KDDTest+ (the complete test set), KDDTest-21 (a subset of KDDTest+ that excludes the records with difficulty level 21), KDDTrain+ (the complete training set), and KDDTrain+20Percent (a 20% subset of KDDTrain+). Each record contains 43 features, which can be categorized as follows:
Basic features: They are extracted from TCP/IP connections, such as the duration, protocol type, and service type.
Traffic features: They are related to the same host or service, such as the number of connections, the error rate, etc.
Content characteristics: They reflect the content in the packet, such as the number of login attempts and the number of file creations.
The breakdown of the different sub-categories of each attack is given in the following table (Table 3):

4.2. Experimental Results on the StreamSpot Dataset

Compared to the NSL-KDD dataset, the StreamSpot dataset is a collection of experimental data specifically designed for network anomaly detection in edge streams, which means that it fully takes into account the characteristics of edge devices and the types of attacks the devices may suffer from during the data collection, annotation, and preprocessing phases, and the use of the StreamSpot dataset to test the IDS can more accurately reflect the system’s performance in the edge device environment. Moreover, the attack scenario in the StreamSpot dataset is to download a program from a malicious URL and use a flash memory vulnerability to obtain system administrator privileges. This scenario is designed to be closer to the types of attacks that may be suffered by the actual edge devices, which helps to more realistically evaluate the detection capability and adaptability of the IDS.
In the experimental setup, 400 of the 500 samples from the normal dataset were used for training and 100 for testing, while all 100 malicious samples were exclusively allocated to testing, and additionally 1000 generated samples were included in the training dataset to enhance model generalization, with the training configuration comprising 10 epochs, a learning rate of 0.0001, and a dropout rate of 0.4 to prevent overfitting. To determine the optimal number of training epochs, we designed an experiment where the epoch count served as the independent variable, while three key metrics—AUC (area under the receiver operating characteristic curve) for class discrimination, AP (Average Precision) for multi-class precision-recall balance, and FPR (False Positive Rate) for specificity quantification—were employed as dependent variables. By systematically varying epochs from 1 to 10 and analyzing the corresponding changes in these metrics, we identified the inflection point at epoch 10 where the model achieved a Pareto-optimal trade-off among detection accuracy, reliability, and the false alarm rate, providing empirical justification for the optimal training duration.These metrics offer a comprehensive model assessment, while the model was also evaluated using four other metrics—accuracy, precision, recall, and the F1-score—and compared with other mainstream models.
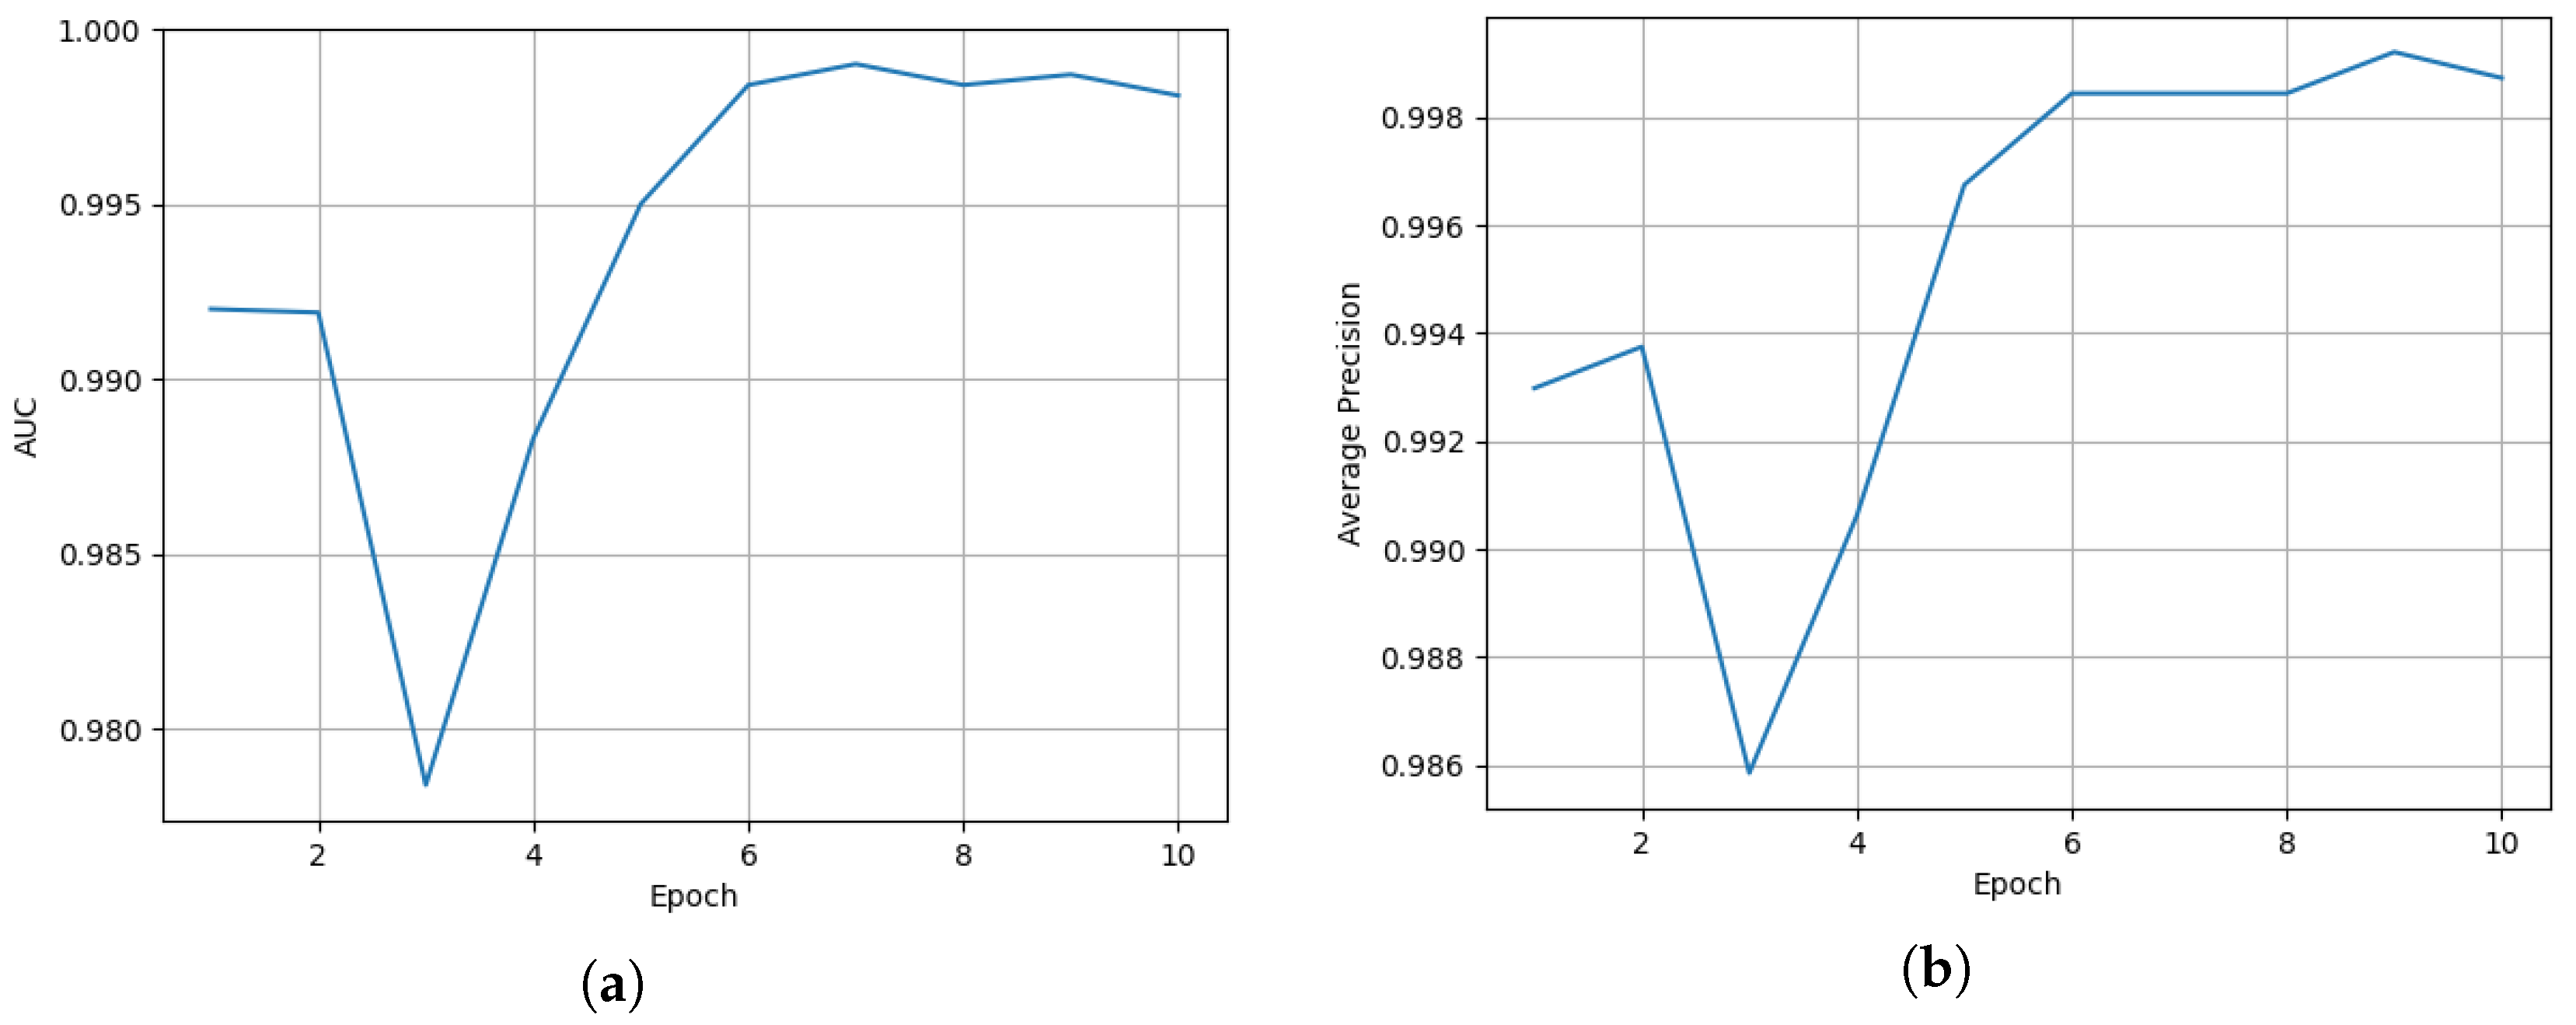
The AUC and AP curve are shown in Figure 5. Both the AUC and AP are important metrics used to evaluate the performance of models for binary classification problems, especially when dealing with unbalanced datasets; the AUC value gives a comprehensive view of the model’s performance under different thresholds. The closer the AUC and AP values are to one, the better the model is usually considered to perform. As can be seen in Figure 5, the AUC value starts at 1.0000 at Epoch 1, undergoes a series of slight decreases, and finally stabilizes at 0.9986 at Epoch 10. This trend suggests that
At the beginning of the model’s training (Epoch 1), the average accuracy of the model is around 0.99. This indicates that the model already has some classification ability at the beginning, but there is still room for improvement. As training continues, the AUC value gradually decreases, which may indicate that the model is gradually generalizing to the test set. The model gradually learns a wider range of features during training that may not be fully applicable to the training set. This is a good sign because it indicates that the model is starting to have better generalization capabilities. As training continues (Epoch increases), the average accuracy of the model begins to gradually improve, reaching a maximum of 0.998. This indicates that the model is gradually learning more effective features and is better able to adapt to the training data. However, when the training reaches a certain stage, the average accuracy of the model starts to decrease and eventually goes back to around 0.986. This is due to the occurrence of overfitting, where the model’s performance is over-optimized on the training set, while its performance decreases on unseen data. So we set the epoch to 10.
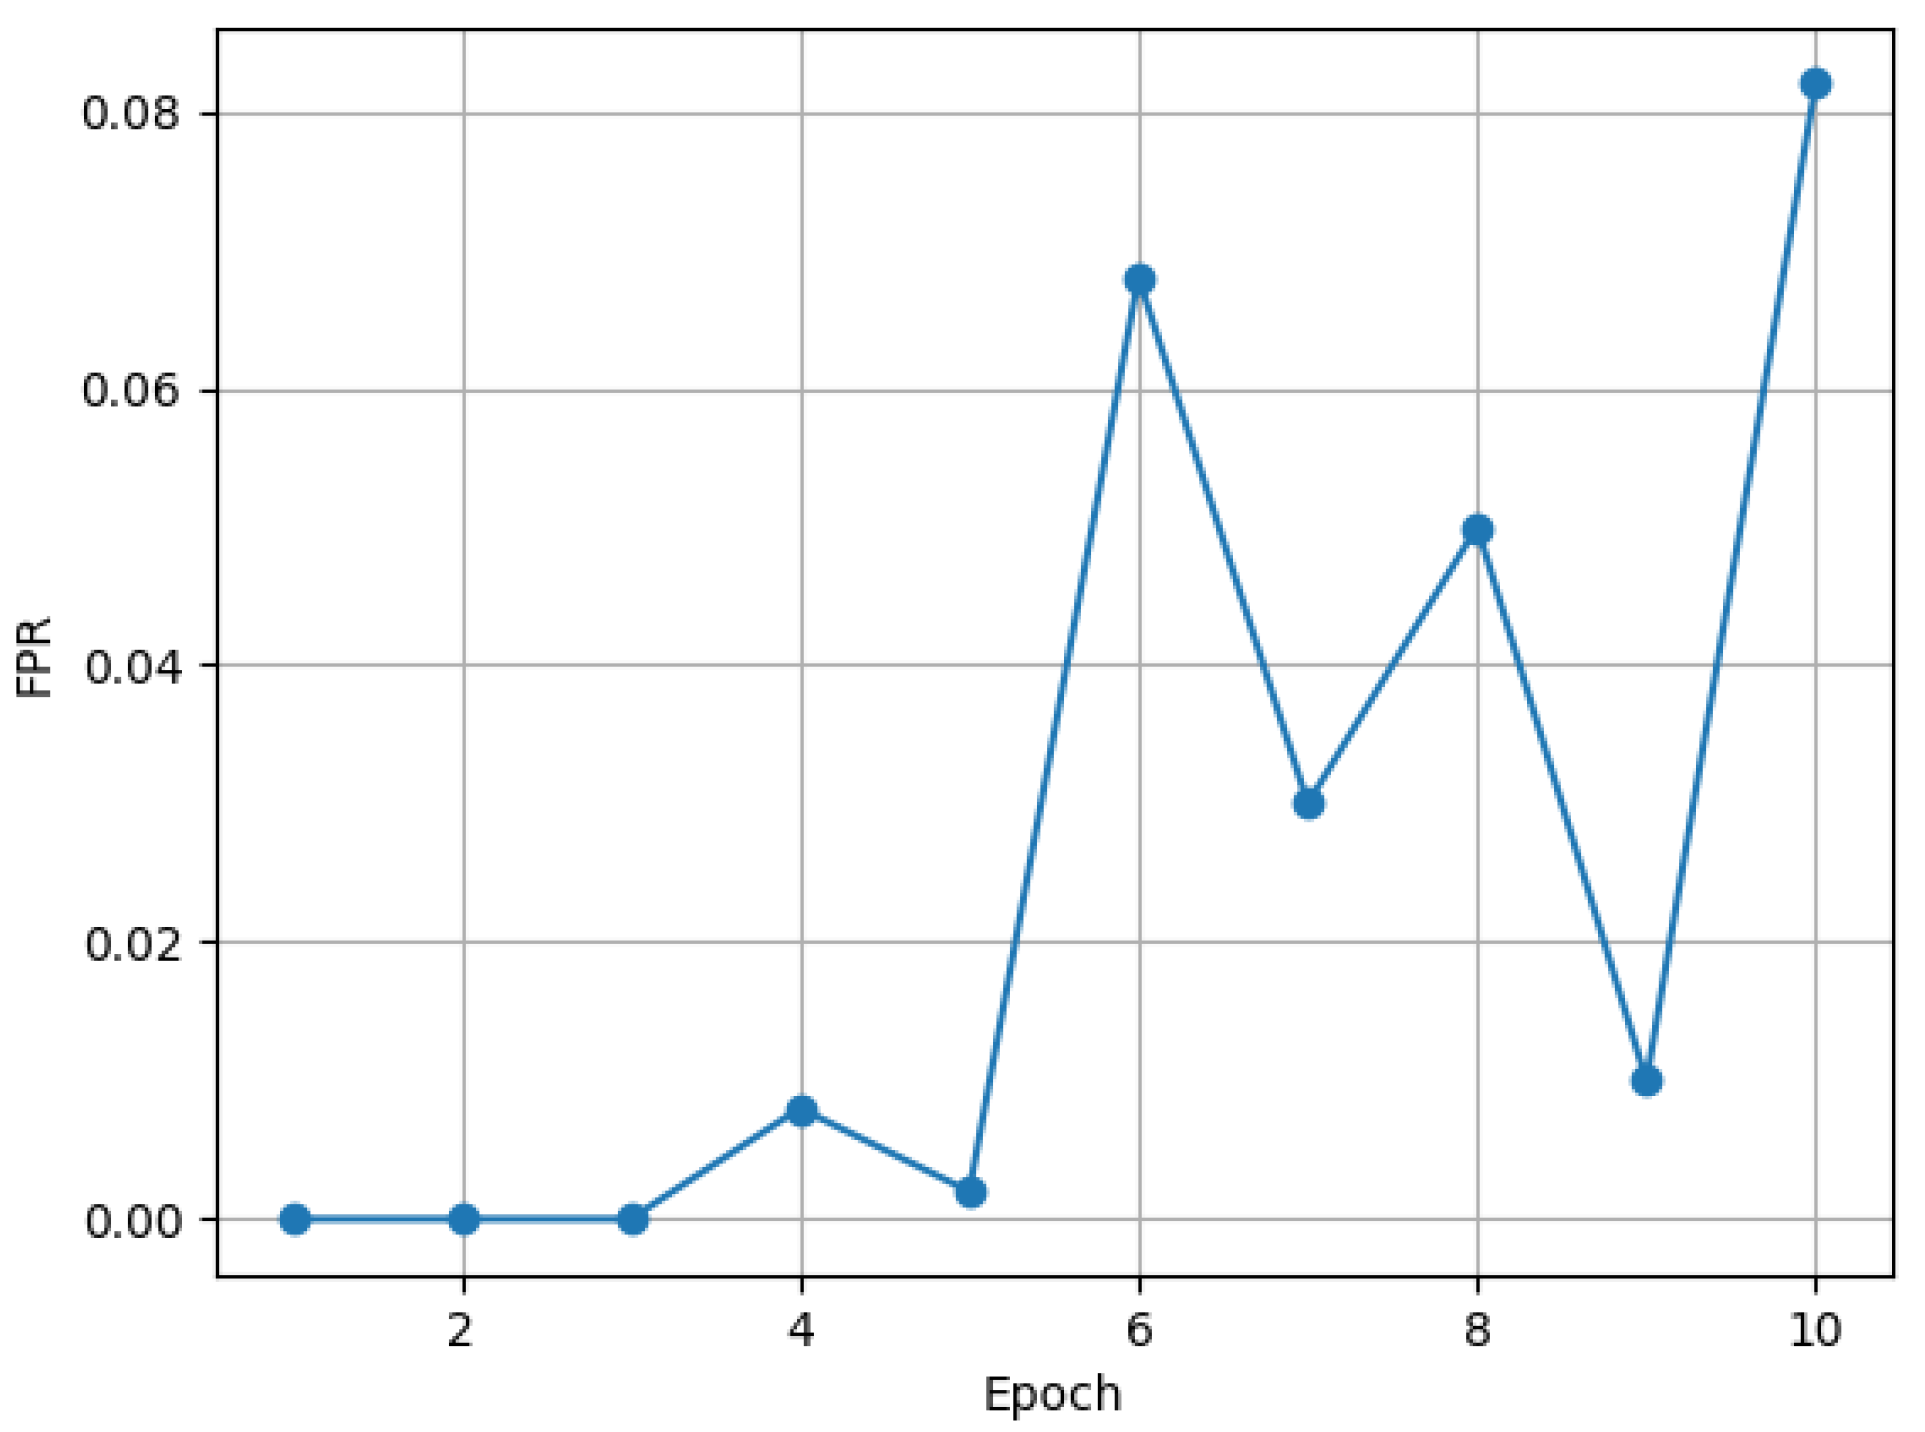
The False Positive Rate of our intrusion detection model within 10 epochs is shown in Figure 6. At Epochs 1 to 3, the FPR is zero, which means that the model is very cautious in classifying benign provenance graphs in the early stages of training and produces almost no false positives. This is because the model has not fully learned the characteristics of APT attack activities at this stage and thus prefers to determine uncertain provenance graphs as benign. During Epochs 4 to 6, the FPR fluctuates, rising then falling then rising again. The model starts to gradually learn the characteristics of APT attacks at this stage, but at the same time, it is also trying to distinguish between benign and malicious provenance graphs, resulting in fluctuations in the FPR. The fluctuation arises because the model is trying to find the best classification boundary. Starting from Epoch 6, the FPR gradually stabilizes, and although there are still some fluctuations, the overall trend is decreasing. This indicates that the model gradually optimizes its classification performance and reduces false positives during continuous training. At Epoch 10, the FPR is 0.0820. This value is still at a relatively low level, although it has increased from the previous one. Considering that the classification of provenance graphs is itself a complex binary classification problem and the detection of APT attack activities is a challenge in itself, this FPR value is acceptable. As the number of epochs increases, the False Positive Rate of the model continues to rise. Therefore, from the perspective of the False Positive Rate, it is reasonable to set the epoch to 10.
Moreover, we also use four metrics to comprehensively evaluate the intrusion detection model. The four metrics used to evaluate the model’s performance on each sub-dataset are accuracy, precision, recall, and the F1-score. It is known that TP denotes the number of samples in which the model correctly predicts a positive category; FP denotes the number of samples in which the model incorrectly predicts a positive category; TN denotes the number of samples in which the model correctly predicts a negative category; and FN denotes the number of samples in which the model incorrectly predicts a negative category. The formulas are as follows:
A c c u r a c y = T P + T N T P + T N + F P + F N ,
P r e c i s i o n = TP T P + F P ,
R e c a l l = TP T P + F N ,
F 1 - S c o r e = 2 × Precision × Recall Precision + Recall .
The results predicted by the intrusion detection model are shown in the following table (Table 4):
Next, in the StreamSpot dataset, our proposed detection model is compared with the following three mainstream APT attack detection methods:
StreamSpot: This model mainly realizes anomaly detection and attack identification through three steps. First, randomly sample the neighbors of the nodes, and use the network embedding method to embed the nodes into a low-dimensional space to obtain feature vectors. Then, calculate the similarity score between the feature vectors of the sampled neighbor sub-graphs and the normal nodes, and use this as the anomaly score of the nodes. Finally, accurately identify the attack behavior by calculating the density around each data point in the dataset.
UNICORN: The UNICORN model has a unique way of processing the provenance graph. It maps each node in the provenance graph to a label sequence of first-order, second-order, and third-order adjacent nodes centered on that node and constructs a histogram. Subsequently, using the Histosketch algorithm and the WL sub-graph kernel function 25, calculate the similarity between each pair of sub-graphs, and then obtain the feature representation vector of the provenance graph. Finally, with the help of the clustering algorithm, identify the system behavior.
SeqNet: When processing the provenance graph, the SeqNet model adopts the same provenance graph embedding algorithm as UNICORN to convert the provenance graph sequence into a feature vector. After that, the GRU deep-learning model extracts the long-term features of the provenance graph to mine the deep-level information in the data. Finally, complete the attack detection task through the clustering algorithm to effectively identify abnormal behaviors.
The results of the comparison of the different models on the StreamSpot dataset are shown in the following table (Table 5):
By observing the data in the table, it can be seen that on the StreamSpot dataset, the Average Precision of different models varies significantly. The StreamSpot model has a precision of 0.786 and has certain detection capabilities, but there are still misjudgments and missed detections. The precision of the UNICORN model is only 0.679. It may be that due to its unique processing method, it fails to fully extract data features, resulting in insufficient identification capabilities. The SeqNet model performs outstandingly, with its precision score reaching 0.968; it benefits from the effective extraction of deep-level information in the data by the GRU model. However, the model proposed in this paper performs the best, with a precision as high as 0.995. Compared with the other three mainstream methods, it has higher accuracy and reliability in detecting APT attacks, which fully demonstrates its effectiveness and superiority in this task and enables more accurate identification of attack behaviors.
On the StreamSpot dataset, the HGNN model took 1617.28 s to complete 10 epochs of training, while the average detection time per epoch was 273 s. Although the HGNN requires relatively longer training time compared to traditional machine learning methods such as Gaussian-based Naive Bayes, decision trees, and the support vector machine (SVM), defenders prioritize detection speed and accuracy in practical intrusion detection scenarios. By leveraging provenance graph structures to model complex causal relationships, the HGNN can more effectively identify APT attacks, achieving a detection accuracy 21.3–34.7% higher than baseline methods. Meanwhile, it only takes an average of 23 s to detect the test set of the StreamSpot dataset.

4.3. Experimental Results on the NSL-KDD Dataset

Compared to the StreamSpot dataset, the NSL-KDD dataset covers a wide range of types of network attacks, such as DoS (denial-of-service) attacks, R2L (remote-to-local) attacks, U2R (user-to-root) attacks, and Probe (probing) attacks. This diversity of attack types enables the dataset to comprehensively model the various security threats that edge devices may encounter, thus more accurately evaluating the detection capability and generalization performance of the IDS. Due to the large amount of data and the variety of attack types in the NSL-KDD dataset, it is an ideal platform for testing the extreme performance of the IDS for edge devices. By testing on this dataset, we can test the system’s capability and limitations in processing large-scale data and recognizing complex attack patterns, which is important for ensuring the data security of edge devices.
In order to test the extreme performance of the IDS for edge devices, we choose KDDTest+ and KDDTrain+ as the test set and training set, respectively, whose details are shown in Table 6 and Table 7:
The meanings of each attack are as follows: Denial of Service (DoS): The normal user is prevented from obtaining service by a large number of legitimate requests that take up resources.
Probe (Probe): The attacker scans the network to obtain system information and look for vulnerabilities.
User to Root (U2R): Local users elevate their privileges to the root user through a system vulnerability.
Remote to Local (R2L): The attacker sends packets remotely to gain access to the local system.
In the experimental setup, 125,973 samples from KDDTrain+ are used for training, and 22,544 samples from KDDTest+ are used for testing. The number of training rounds of the data is set to 20; the learning rate is set to 0.01, and the momentum is set to 0.9. Every 10 epochs, the learning rate is multiplied by 0.5, and the dropout is set to 0.4. We use accuracy, precision, recall, and the F1-score to evaluate the model’s performance on each sub-dataset. The results predicted by the intrusion detection model are shown in the following table (Table 8):
The experimental results show that the overall accuracy of the system is 98.13%, indicating that the system is able to efficiently distinguish normal traffic from abnormal attack traffic. Specifically, for DoS attacks, the system exhibits extremely high precision (99.18%) and high recall (87.06%) with an F1-score of 92.72%, showing the system’s excellent performance in Dos attack detection. For normal traffic identification, the system also performs well, with a precision and recall of 98.10% and 99.98%, respectively, and an F1-score of 99.03%, realizing almost no false positives or misses. For Probe attacks, the system also maintains high precision (99.05%) and reasonable recall (86.82%), with an F1-score of 92.53%. For the detection of R2L and U2R attacks, despite the high recall (97.85% and 78.50%, respectively), the precision is relatively low (76.91% and 85.79%), resulting in F1-score of 86.13% and 81.98%, respectively. This indicates that the IDS performs well in the detection of multiple attack types, but there is still room for improvement in specific types of attacks (R2L and U2R).
However, as indicated by the statistical Table 6 and Table 7 of the KDDTrain+ and KDDTest+ datasets, the U2R attack has merely 52 records in the KDDTrain+ dataset and 200 records in the KDDTest+ dataset. The R2L attack has 995 records in the KDDTrain+ dataset and 2654 records in the KDDTest+ dataset. Due to the small sample sizes of these two attack types, the model might not be capable of fully learning their feature patterns. When presented with new U2R and R2L attack samples, the model, lacking sufficient learning from a large volume of samples, finds it challenging to accurately identify them, thereby leading to lower detection accuracy.
To validate the results, we compare our models with other ML-based and DL-based attack detection methods. Table 9 summarizes various ML and DL approaches for the IDS using NSL-KDD datasets.
The comprehensive analysis of the metrics presented in the table offers compelling evidence that our heterogeneous graph neural network (HGNN) model, showcased in the “Our model” row, demonstrates remarkable performance enhancements throughout the training phase. Specifically, the accuracy rate of 98.1% outperforms most of the other referenced models in the table, such as the ensemble learning models from 2019 and 2024, as well as the DNN in 2018 and the CNN-LSTM in 2022. This high-precision number not only emphasizes the effectiveness of the model but also highlights its potential in network anomaly detection scenarios in edge devices.
5. Discussion

To address the challenge of edge devices detecting Advanced Persistent Threats, we designed a novel threat detection model. This model employs provenance graphs to capture complex host activities. It processes these graphs using heterogeneous graph neural network techniques. Specifically, it deeply embeds the provenance graph via a node-level and semantic-level heterogeneous inter-attention mechanism. Then, it compresses and reduces the feature dimensions with a heterogeneous graph pooling layer. Finally, it makes threat predictions through a graph readout layer.
We introduced deep learning heterogeneous graph neural networks to provenance graph detection. Compared with most existing methods, this approach has two significant advantages. Firstly, leveraging the neural network’s strong pattern recognition and prediction capabilities, it significantly enhances the accuracy and efficiency of advanced threat detection. Secondly, as an inductive model, it does not rely heavily on a priori knowledge such as labels or policy frameworks. This makes it more adaptable and practical in complex, dynamic, and unreliable environments.
To enhance the intrusion detection performance of edge devices, we proposed a data reduction algorithm for provenance graphs based on the semantic similarity of graph substructures. The algorithm defines key attributes of nodes and edges in the provenance graph, clusters nodes using the K-means clustering algorithm, and identifies and reduces redundant substructures. This method retains causal dependencies while reducing the graph storage space and improving edge device processing efficiency. Consequently, it effectively boosts the detection efficiency and accuracy of the model, making APT detection more feasible in edge device environments.
We tested the model’s intrusion detection ability on two datasets. On the StreamSpot dataset, the attack scenario involves downloading a program from a malicious URL and exploiting a flash memory vulnerability to gain system administrator privileges, which closely mimics real-world attacks on edge devices. The results show an average detection accuracy of 0.99 and a false alarm rate of 0.082, indicating good performance.
On the NSL-KDD dataset, which has a large volume of data and diverse attack types, the model achieved a total accuracy of 0.9813. It maintained high accuracy for DOS and Probe attacks (99.18% and 99.05%, respectively) and reasonable recall (87.06% and 86.82%, respectively). For R2L attacks, it had a high recall rate (98.13%) despite a relatively low precision score (76.91%).
To further ensure the feasibility of deploying this model in various edge computing environments, we evaluate model complexity using two key metrics: parameter count and floating-point operations (FLOPs). Parameter count denotes the total number of learnable weights and biases within the model, which directly determines its representational capacity and structural complexity. FLOPs quantify the total number of arithmetic operations executed by the model during inference or training, serving as a proxy for its computational workload. Detailed parameter specifications of the model are presented in Table 10.
The memory and computing requirements of the model are presented in Table 11.
In the edge computing system, the gateway device is the core hub connecting the terminal and the cloud, the main target of various advanced attacks, and one of the main application scenarios of the IDS. Intelligent gateways based on the ARM Cortex-M/R architecture, such as Aqara Hub, typically have memory capacities ranging from 128 MB to 512 MB. Network routing devices using the ARM Cortex-A7/A9 architecture have memory ranging from 64 MB to 256 MB. The commonly used open-source lightweight IDS Snort [30] consumes about 60 MB of memory without integrating special modules and 5.5 MB of memory after integrating Hyperscan. After deploying our trained model, the resource consumed during detection is only 502.3 KB, which can be applied to the vast majority of edge gateway devices.
However, there is still significant room for improvement in the intrusion detection of R2L and U2R attacks. The primary reason for the lower detection accuracy of R2L and U2R attacks lies in the significantly smaller sample sizes of these two attack types compared to others. According to the statistics in Table 6 and Table 7, U2R attacks have only 52 and 200 records in the training and test sets, respectively, while R2L attacks have 995 and 2654 samples in the training and test sets—far fewer than DoS (45,927 training samples) and Probe (11,656 training samples) attacks. In small-sample scenarios, the model struggles to fully learn the detailed features of attack patterns, leading to reduced generalization ability. Additionally, R2L and U2R attacks typically involve multi-stage covert operations that rely on long-term behavioral correlations, and most existing models [26,27,28] have limitations in capturing cross-stage dependency relationships, resulting in poor detection performance for R2L and U2R. In the future, further optimization can be achieved through data augmentation (such as generating adversarial network synthetic samples) or transfer learning (pretraining with large-scale homologous data).

6. Conclusions

In conclusion, the integration of edge computing has brought about remarkable advancements in data security and processing efficiency, yet edge network devices remain vulnerable to cyber threats, particularly APTs. To address this pressing issue, we detail an intrusion detection method for edge computing devices, which is based on provenance graphs and heterogeneous graph neural network techniques. Firstly, the method of provenance graph construction is introduced, which represents the complex and dynamic system behavior with the graph structure; then the edges and nodes of the provenance graph are vectorized and processed into the form acceptable to a neural network, and finally, the process of neural network model training is introduced, which consists of three main parts, namely a heterogeneous graph convolutional layer, a heterogeneous graph pooling layer, and a graph readout layer, which are aimed at realizing the whole provenance graph’s overall categorization, distinguishing between provenance graphs that contain attack activities and benign provenance graphs. Finally, the StreamSpot dataset and the NSL-KDD dataset are used to train and test the model, and the performance of the model is evaluated by multiple metrics, such as AUC, AP, recall, F1-score, FPR, etc. The experimental results show that the prediction accuracy of our method reaches more than 99% on the StreamSpot dataset, and the prediction accuracy of our method on the NSL-KDD dataset reaches 98.13%.
Overall, our research provides a promising solution for enhancing the security of edge computing devices. Future work could focus on further optimizing the model to improve its performance in detecting complex attack types such as R2L and U2R attacks and exploring its application in more diverse real-world scenarios.

Author Contributions

Conceptualization, T.W. and W.T.; methodology, T.W. and software, T.W. and Y.S.; validation, T.W. and Y.S.; formal analysis, and J.L.; writing—original draft preparation, review, and editing, T.W., W.T. and J.L. All authors have read and agreed to the published version of the manuscript.

Funding

This work was supported in part by the National Key Research and Development Program of China under Grant 2022YFB2702800 and in part by the NSFC under Grant 62472347 and Grant 62102305.

Data Availability Statement

The StreamSpot dataset is available in the mentioned references. The official website link of the NSL-KDD dataset is invalid. You can download it from the following website: https://github.com/Jehuty4949/NSL_KDD (accessed on 4 July 2025 ).

Conflicts of Interest

The authors declare no conflicts of interest.

References

  1. An, X.; Cao, G.; Miao, L.; Ren, S.; Lin, F. A Survey on Security of Intelligent Edge Computing. Telecommun. Sci. 2018, 34, 13. [Google Scholar]
  2. Gugueoth, V.; Safavat, S.; Shetty, S.; Rawat, D. A review of IoT security and privacy using decentralized blockchain techniques. Comput. Sci. Rev. 2023, 50, 100585. [Google Scholar] [CrossRef]
  3. Okegbile, S.D.; Cai, J.; Alfa, A.S. Performance analysis of blockchain-enabled data-sharing scheme in cloud-edge computing-based IoT networks. IEEE Internet Things J. 2022, 9, 21520–21536. [Google Scholar] [CrossRef]
  4. Xu, F.; Yang, F.; Zhao, C.; Fang, C. Edge computing and caching based blockchain IoT network. In Proceedings of the 2018 1st IEEE International Conference on Hot Information-Centric Networking (HotICN), Shenzhen, China, 15–17 August 2018; pp. 238–239. [Google Scholar]
  5. Xu, X.; Zhang, X.; Gao, H.; Xue, Y.; Qi, L.; Dou, W. BeCome: Blockchain-enabled computation offloading for IoT in mobile edge computing. IEEE Trans. Ind. Inform. 2019, 16, 4187–4195. [Google Scholar] [CrossRef]
  6. Tang, W.; Li, J.; Dong, C.; Miao, Y.; Li, Q.; Li, N.; Deng, S.; Ji, S. Robust and Secure Aggregation Scheme for Federated Learning. IEEE Internet Things J. 2024, 11, 12345–12360. [Google Scholar] [CrossRef]
  7. Zhong, M.; Lin, M.; Zhang, C.; Xu, Z. A survey on graph neural networks for intrusion detection systems: Methods, trends and challenges. Comput. Secur. 2024, 141, 103821. [Google Scholar] [CrossRef]
  8. Humphries, M. NASA Has Been Hacked Thanks to a Raspberry Device. Available online: https://www.pcmag.com/news/nasa-hack-used-a-raspberry-pi (accessed on 4 July 2025).
  9. CISOMAG. Amazon Suffers Fraud Attack from Cybercriminals. Available online: https://cisomag.com/amazon-suffers-fraud-attack-from-cybercriminals/ (accessed on 4 July 2025).
  10. 360. 360’s Attack Cases Database. Available online: https://sc.360.net/ (accessed on 4 July 2025).
  11. Shu, X.; Yao, D.; Ramakrishnan, N.; Jaeger, T. Long-span program behavior modeling and attack detection. ACM Trans. Priv. Secur. (TOPS) 2017, 20, 1–28. [Google Scholar] [CrossRef]
  12. Hossain, M.N.; Milajerdi, S.M.; Wang, J.; Eshete, B.; Gjomemo, R.; Sekar, R.; Stoller, S.; Venkatakrishnan, V. SLEUTH: Real-time attack scenario reconstruction from COTS audit data. In Proceedings of the 26th USENIX Security Symposium (USENIX Security 17), Vancouver, BC, Canada, 16–18 August 2017; pp. 487–504. [Google Scholar]
  13. Anderson, J. Computer Security Threat Monitoring and Surveillance; James P. Anderson Company: Fort Washington, MA, USA, 1980. [Google Scholar]
  14. Han, X.; Pasquier, T.; Bates, A.; Mickens, J.; Seltzer, M. Unicorn: Runtime provenance-based detector for advanced persistent threats. arXiv 2020, arXiv:2001.01525. [Google Scholar]
  15. Milajerdi, S.M.; Gjomemo, R.; Eshete, B.; Sekar, R.; Venkatakrishnan, V. Holmes: Real-time apt detection through correlation of suspicious information flows. In Proceedings of the 2019 IEEE Symposium on Security and Privacy (SP), San Francisco, CA, USA, 19–23 May 2019; pp. 1137–1152. [Google Scholar]
  16. Hassan, W.U.; Guo, S.; Li, D.; Chen, Z.; Jee, K.; Li, Z.; Bates, A. Nodoze: Combatting threat alert fatigue with automated provenance triage. In Proceedings of the Network and Distributed Systems Security Symposium, San Diego, CA, USA, 24–27 February 2019. [Google Scholar]
  17. Bashir, U.; Chachoo, M. Intrusion detection and prevention system: Challenges & opportunities. In Proceedings of the 2014 International Conference on Computing for Sustainable Global Development (INDIACom), New Delhi, India, 5–7 March 2014; pp. 806–809. [Google Scholar]
  18. Dong, F.; Wang, L.; Nie, X.; Shao, F.; Wang, H.; Li, D.; Luo, X.; Xiao, X. DISTDET: A Cost-Effective Distributed Cyber Threat Detection System. In Proceedings of the 32nd USENIX Security Symposium (USENIX Security 23), Anaheim, CA, USA, 9–11 August 2023; pp. 6575–6592. [Google Scholar]
  19. Living Off The Land Binaries and Scripts (and now also Libraries). Project/LOLBAS. Available online: https://github.com/LOLBAS (accessed on 4 July 2025).
  20. Bilge, L.; Dumitraş, T. Before we knew it: An empirical study of zero-day attacks in the real world. In Proceedings of the 2012 ACM Conference on Computer and Communications Security, Raleigh, NC, USA, 16–18 October 2012; pp. 833–844. [Google Scholar]
  21. Alsaheel, A.; Nan, Y.; Ma, S.; Yu, L.; Walkup, G.; Celik, Z.B.; Zhang, X.; Xu, D. ATLAS: A sequence-based learning approach for attack investigation. In Proceedings of the 30th USENIX Security Symposium (USENIX Security 21), Vancouver, BC, Canada, 11–13 August 2021; pp. 3005–3022. [Google Scholar]
  22. Gao, P.; Shao, F.; Liu, X.; Xiao, X.; Qin, Z.; Xu, F.; Mittal, P.; Kulkarni, S.R.; Song, D. Enabling efficient cyber threat hunting with cyber threat intelligence. In Proceedings of the 2021 IEEE 37th International Conference on Data Engineering (ICDE), Chania, Greece, 19–22 April 2021; pp. 193–204. [Google Scholar]
  23. The DARPA Transparent Computing (TC) Program Data Release. Available online: https://github.com/darpai2o/TransparentComputing (accessed on 4 July 2025).
  24. Streamspot Datasets. 2016. Available online: https://github.com/sbustreamspot/ (accessed on 4 July 2025).
  25. NSL-KDD Datasets. Available online: https://www.unb.ca/cic/datasets/nsl.html (accessed on 4 July 2025).
  26. Gao, X.; Shan, C.; Hu, C.; Niu, Z.; Liu, Z. An adaptive ensemble machine learning model for intrusion detection. IEEE Access 2019, 7, 82512–82521. [Google Scholar] [CrossRef]
  27. Naseer, S.; Saleem, Y.; Khalid, S.; Bashir, M.K.; Han, J.; Iqbal, M.M.; Han, K. Enhanced network anomaly detection based on deep neural networks. IEEE Access 2018, 6, 48231–48246. [Google Scholar] [CrossRef]
  28. Suganthi, J.; Nagarajan, B.; Muhtumari, S. Network anomaly detection using hybrid deep learning technique. In Advances in Parallel Computing Algorithms, Tools and Paradigms; IOS Press: Amsterdam, The Netherlands, 2022; pp. 103–109. [Google Scholar]
  29. Elsayed, S.; Mohamed, K.; Madkour, M.A. A comparative study of using deep learning algorithms in network intrusion detection. IEEE Access 2024, 12, 58851–58870. [Google Scholar] [CrossRef]
  30. Snort. Available online: https://www.snort.org/ (accessed on 4 July 2025).
Figure 1. Heterogeneous graph neural network threat detection model based on provenance graphs.
Applsci 15 08833 g001
Figure 2. Example of a provenance graph for a host activity.
Applsci 15 08833 g002
Figure 3. Provenance graph after using the data reduction algorithm based on the semantic similarity of graph substructures.
Applsci 15 08833 g003
Figure 4. Architecture of the heterogeneous graph neural network model.
Applsci 15 08833 g004
Figure 5. Intrusion detection model results on the StreamSpot dataset: (a) area under the receiver operating characteristic curve; (b) Average Precision.
Applsci 15 08833 g005
Figure 6. The False Positive Rate of the intrusion detection model within 10 epochs.
Applsci 15 08833 g006
Table 1. Classification of subject and object categories.
SubjectSubject Objects (Processes and Threads)
File objects
Memory objects
ObjectsNetwork stream objects
Inter-process communication objects
Executing user objects
Source objects
Table 2. Characteristics of the StreamSpot dataset.
LabelNumber of ImagesAverage Number of EdgesAverage Number of NodesData Size (GIB)
YouTube100113,22982920.3
VGame100112,95886370.4
Download100320,81488311
Gmail10037,38268270.1
CNN100294,90389900.9
Attack10028,41288910.1
Table 3. Attack types and Sub-types.
TypeDoS (11)Probe (6)U2R (7)R2L (15)
    xsnoop
    warezclient
 udpstorm  warezmaster
 worm  xlock
 apache2ipsweepBuffer_ overflowftp write
 backmscanloadmoduleguess_ passwd
Sub-typelandnmapperlhttptunnel
 neptunemailbombportsweepsaintpsimap
 podsatanrootkitmultihop
 processtableaintsqlattacknamed
 smurf xtermPhf
 teardrop  Sendmail
    Snmpgetattack
    spy
    snmpguess
Table 4. Metrics and results on the SreamSpot Dataset.
MetricsPrecisionAccuracyRecallF1-Score
Results0.99860.99900.99720.9980
Table 5. Average Precision of different modules.
ModuleStreamSpotUNICORNSeqNetOur Model
Average Precision0.7860.6790.9680.995
Table 6. KDDTrain+ dataset statistics.
CategoryNormalDoSProbeU2RR2LTotal
Number of Records67,34345,92711,65652995125,973
Table 7. KDDTest+ dataset statistics.
CategoryNormalDoSProbeU2RR2LTotal
Number of Records971174582421200265422,544
Table 8. Performance metrics for different attack types.
TypePrecision (%)Recall (%)F1-Score (%)
DoS99.1887.0692.72
Normal98.1099.9899.03
Probe99.0586.8292.53
R2L76.9197.8586.13
U2R85.7978.5081.98
Table 9. Comparison of the research on ML-based on the NSL-KDD dataset.
ReferenceLearning AlgorithmAccuracy (%)
[26]Ensemble learning model with various ML algorithms85.2
[27]DNN89.0
[28]CNN-LSTM91.0
[29]Ensemble learning model with various ML algorithms97.9
Our modelHeterogeneous graph neural network (HGNN)98.1
Table 10. Model architecture parameters.
LayerOutput ShapeParameters
Node Embedding [ N , 16 ] 80
Edge Type Embedding [ E , 16 ] 464
RGATConv Layer 1 [ N , 16 ] 7680
RGATConv Layer 2 [ N , 16 ] 7680
RGATConv Layer 3 [ N , 16 ] 7680
TopKPooling Layers N = N × 0.8 0
Linear Layer 1 [ 1 , 16 ] 1552
Linear Layer 1 [ 1 , 4 ] 68
Linear Layer 3 [ 1 , 1 ] 5
Total 25,201
Table 11. Key overhead metrics for the heterogeneous graph neural network.
MetricValue
Total Parameters25,201
Total Memory Usage502.3 KB
Total FLOPs820,000
Disclaimer/Publisher’s Note: The statements, opinions and data contained in all publications are solely those of the individual author(s) and contributor(s) and not of MDPI and/or the editor(s). MDPI and/or the editor(s) disclaim responsibility for any injury to people or property resulting from any ideas, methods, instructions or products referred to in the content.