Article

Effects of Perforation Location in Gas Diffusion Layers on Electrochemical Characteristics of Proton Exchange Membrane Fuel Cells

1
Department of Mechanical Engineering, Dankook University, 152 Jukjeon-ro, Suji-gu, Yongin-si 16890, Gyeonggi-do, Republic of Korea
2
Department of Mechanical Engineering, Stanford University, 440 Escondido Mall, Stanford, CA 94305, USA
*
Authors to whom correspondence should be addressed.
Appl. Sci. 2025, 15(16), 8804; https://doi.org/10.3390/app15168804
Submission received: 4 July 2025 / Revised: 6 August 2025 / Accepted: 6 August 2025 / Published: 9 August 2025
(This article belongs to the Special Issue Advances in New Sources of Energy and Fuels)

Abstract

Water management is a critical issue for improving both the performance and durability of proton exchange membrane fuel cells (PEMFCs). A gas diffusion layer (GDL), as a porous medium, plays a key role in liquid water removal, reactant supply, and ensuring uniform distribution within the cell. Local perforations in the GDL are known to enhance water management capability. To further improve mass transfer, the effects of the perforation location in the GDL on PEMFC performance were investigated under different flow rates. The performance was compared and analyzed for three cases with GDL on the cathode side: a conventional GDL, a GDL perforated only under the channel, and a GDL with the perforations offset toward the rib by half the channel width. As a result, the offset of the perforations led to improved performance and enhanced uniformity, and the effect of the offset became more significant at higher flow rates. The under-channel and offset cases showed slight performance increases of 3.02% and 3.11% under the cathode stoichiometric ratio (SRc) of 1.2, but more significant improvements of 4.72% and 5.29% were observed under the SRc of 3.0. These results suggest the necessity of considering the flow field when designing a perforated GDL.

1. Introduction

As carbon emission regulations continue to tighten worldwide, interest in renewable energy technologies has grown significantly. Among them, fuel cells generate electricity by electrochemical half-reactions of hydrogen and oxygen, with zero emissions. Fuel cells are categorized based on the type of electrolyte, with typical examples including proton exchange membrane fuel cells (PEMFCs) and solid oxide fuel cells (SOFCs). In particular, PEMFCs offer distinct advantages over other fuel cell types, such as low operating temperature below 100 °C and excellent scalability. These benefits make PEMFCs especially well suited for use in transportation sectors [1,2,3,4,5,6].
A gas diffusion layer (GDL) is a porous medium located between the catalyst layer (CL) and the flow channel. The GDL provides a pathway of heat and electrons, which are produced by electrochemical reactions. The GDL is typically fabricated from carbon paper or carbon cloth to ensure high electrical and thermal conductivity. In addition, reactant gases travel from the flow channels to the catalyst layer via the GDL. To achieve high performance and durability in PEMFCs, the reactants need to be evenly distributed across the GDL, including the area under the ribs. For this purpose, the GDL must exhibit sufficient porosity and high permeability.
The GDL also plays a critical role in water management within PEMFCs. Sufficient membrane hydration is required to ensure high proton conductivity. Therefore, reactant gases are generally humidified before being supplied to the cell. However, condensation occurs within the porous layer when water vapor accumulates and the partial pressure of water vapor exceeds the saturation pressure. Such condensation blocks the porous network, severely impeding fuel transport to the catalyst layer. Efficient water removal is particularly important on the cathode side, where water is generated as a byproduct of oxygen reduction reaction. Insufficient removal of liquid water restricts oxygen transport, thereby degrading performance and accelerating cell aging. These water management issues present a major challenge for the commercialization of PEMFCs. Therefore, improving the structural design of the GDL is essential to enhance reactant transport and facilitate water removal, ultimately improving the performance and durability of PEMFCs.
Many researchers have investigated optimizing GDL porosity to improve reactant distribution in PEMFCs. Jing et al. [7] demonstrated that the GDL with a linearly increasing pore distribution (positive gradient) can significantly enhance oxygen transport. This leads to a more uniform current density distribution and a 9.4% increase in peak power output. Kahveci et al. [8] analyzed the impact of GDL porosity (ranging from 0.3 to 0.6) on PEMFC performance using the three-dimensional isothermal model. They found that higher porosity improved diffusion characteristics and increased current density. Conversely, reducing porosity from 0.6 to 0.3 decreased current density by 4.01% at 0.4 V, thereby degrading cell performance.
Several studies have been conducted in which the permeability of the GDL was varied, as this is a key indicator of how easily materials such as gases and liquids can pass through it. For example, Feser et al. [9] measured the in-plane permeability of the different GDL materials under radial flow conditions. They found that woven GDLs exhibited up to three times higher permeability than conventional carbon paper. This significantly improves the transport of reactant gases. Zhang et al. [10] optimized the pore distribution of the GDL in a parabolic manner, resulting in a more uniform current density distribution and improving cell performance by up to 6.9%. Son et al. [11] investigated the effect of anisotropic permeability on PEMFC performance using computational fluid dynamics (CFD) and found that enhancing x-direction permeability in serpentine flow fields led to a 5.3% increase in power output.
Nevertheless, water flooding continues to be a persistent and unpredictable challenge in GDL design, primarily caused by inefficient water removal. Various strategies have been proposed to enhance liquid water transport within the GDL to address this issue. Kakaee et al. [12] used the lattice Boltzmann method (LBM) to analyze the effect of PTFE distribution and binder content on droplet removal. They found that non-uniform PTFE and high binder content hinder water removal and reduce performance. Calili-Cankir et al. [13] fabricated a patterned hydrophobic GDL and reported that a triangular pattern improved water management and increased peak power density by over 10%. Sim et al. [14] demonstrated that controlling the in-plane pore gradient and perforation distribution of the GDL achieved more than a 12% improvement in performance through increased outlet-side porosity and front-side perforations.
In addition to hydrophobic treatment, several studies have explored modifying water transport behavior using perforated GDLs. Lin et al. [15] fabricated a quadrilateral patterned perforated GDL using laser drilling and arranged it perpendicular to the gas flow channels. This configuration significantly enhanced both oxygen diffusion and water removal, achieving a peak power density of 1.43 W/cm2 and a maximum current density of 5400 mA/cm2. This corresponds to a performance improvement of 28.6–58.8% compared to conventional commercial GDLs. Zhang et al. [16] conducted numerical simulations using the GDL with circular grooves and found that an exponential design of groove spacing and depth improved oxygen concentration uniformity and water drainage capability. The study also found that a groove spacing of 2 mm provided the highest current density and the most stable output performance.
Among the various techniques, perforation has emerged as one of the most practical and effective methods of actively controlling mass transport phenomena, as it enables direct drainage pathways to be formed within the GDL. A summary of prior numerical studies on perforated GDLs is presented in Table 1. However, based on our review, comparative studies evaluating the effect of perforation location on cell performance remain scarce. Therefore, we investigated how the location of perforations affects PEMFC performance in this study. The performance of the cases with perforations located directly under the channel and with perforations laterally offset by a certain distance was compared to that of the conventional case. Furthermore, the effect of flow rate on the PEMFC performance with a perforated GDL was evaluated.

2. Numerical Process

2.1. Analysis Model

The PEMFC unit cell used in this study consists of bipolar plates, GDLs, MPLs, CLs, and a membrane with a reaction area of 1 cm2. The structural variations of the cathode for each case are depicted in Figure 1. In the conventional GDL case, the bipolar plate is entirely covered by the GDL. The perforated GDL contains perforations of uniform size and rectangular shape, evenly spaced and matched to the width of the flow channel. Depending on the perforation location, two configurations are considered: one with perforations located under the channel, and the other with perforations offset by 0.4 mm. Given that both the channel and rib widths are 0.8 mm in this model, 0.4 mm represents half their width. Serpentine flow channels are applied to both the anode and the cathode, and the anode structure is kept constant in all cases. Additional geometric details are summarized in Table 2. Furthermore, the following assumptions were considered in numerical calculations.
  • The flow is regarded as incompressible and laminar.
  • All gas species are treated as ideal gases.
  • As the membrane is impermeable, crossover does not occur.
  • Effects of thermal and electrical contact resistance are neglected.

2.2. Governing Equations

The numerical calculation was performed by solving eight governing equations for the conservation of mass, momentum, species, energy, electron, proton, liquid, and dissolved water. These equations and corresponding details are described below.
Mass conservation equation [22]:
· ρ u = S m a s s
Momentum conservation equation [22]:
· ρ u u = · μ u P + S m o m
ρ , u , μ , and P are the gas density (kg m−3), the velocity (m s−1), the dynamic viscosity (Pa s), and the pressure (Pa), respectively. S m a s s is the mass source, and S m o m is the momentum source.
Species conservation equation [22]:
· ρ Y i u = · ρ D e f f , i Y i + S i
Y i is the mass fraction of species and D e f f , i is the effective gas diffusivity (m2 s−1). S i is the species source term, which includes generation or consumption and phase change of species.
Energy conservation equation [22]:
· ρ c p T u = · k e f f T + S T
c p , k e f f , and T are the specific heat (J kg−1 K−1), the effective thermal conductivity (W m−1 K−1), and the temperature (K), respectively. S T is the thermal energy source which is generated by electrochemical reactions, joule heating, and latent heat.
Charge conservation equations [11]:
· σ e f f , e ϕ e + S e = 0
· σ e f f , p ϕ p + S p = 0
σ e f f , e , σ e f f , p , ϕ e , and ϕ p are the effective electrical conductivity (S m−1), the effective proton conductivity (S m−1), the electric potential (V), and the ionic potential (V), respectively. The source terms S e and S p indicate the volumetric current generated by the reactions.
Liquid water transport equation [11]:
· ρ l u l = · ρ l D l s + S l
ρ l , D l , s , and u l are the liquid density (kg m−3), the liquid diffusivity (m2 s−1), the liquid saturation, and the liquid velocity (m s−1), respectively. The liquid source term S l means the evaporation and condensation of water.
Dissolved water transport equation [11]:
· n d F σ e f f , p ϕ p = · ρ m E W D d w λ + S d w
n d , F , ρ m , E W , λ , and D d w are the electro-osmotic drag coefficient, the Faraday constant (J mol−1 K−1), the density of dry membrane (kg m−3), the equivalent weight of the polymer membrane (kg mol−1), the water content, and the diffusivity of dissolved water (m2 s−1), respectively. S d w is the source term meaning adsorption or desorption of water.
Table 3 presents the source terms in the governing equations, and the parameters and the equations used in the model are summarized in Table 4, Table 5 and Table 6.

2.3. Analysis Conditions

The simulations of the 3D PEMFC model were executed using ANSYS Fluent 2023 R2. A steady state approach was employed in the simulations to analyze transport behavior under stable operating conditions. To analyze the characteristics of the PEMFC, governing equations for electric potential, protonic potential, dissolved water, and liquid water were adopted as user-defined scalars (UDSs). For effective calculation, the semi-implicit method for pressure-linked equations (SIMPLE) algorithm was used for effective calculation. The F-cycle multigrid method was employed for the solution of all variables. To enhance numerical stability, the bi-conjugate gradient stabilized method (BCGSTAB) solver was applied to the species transport and the two potential conservation equations. The convergence judgement was executed as the residuals for all variables were less than 1 × 10⁻⁶.
The boundary conditions were applied to closely match the experimental conditions in our laboratory to validate the model. Temperature were set to 353 K at both ends of the bipolar plates on the anode and cathode side, corresponding to the locations of the cartridge heaters used in the experiment. Reactants were supplied at the relative humidity of 100%, and the operating pressure of 1 atm was set to outlets of the flow channels. The stoichiometric ratios of both inlets were set to 2 with a reference current density of 1 A/cm2. Additionally, the stoichiometric ratio at the cathode (SRc) was varied to 1.2 and 3.0 to elucidate the influences of mass flow rate.

3. Results and Discussion

3.1. Model Validation

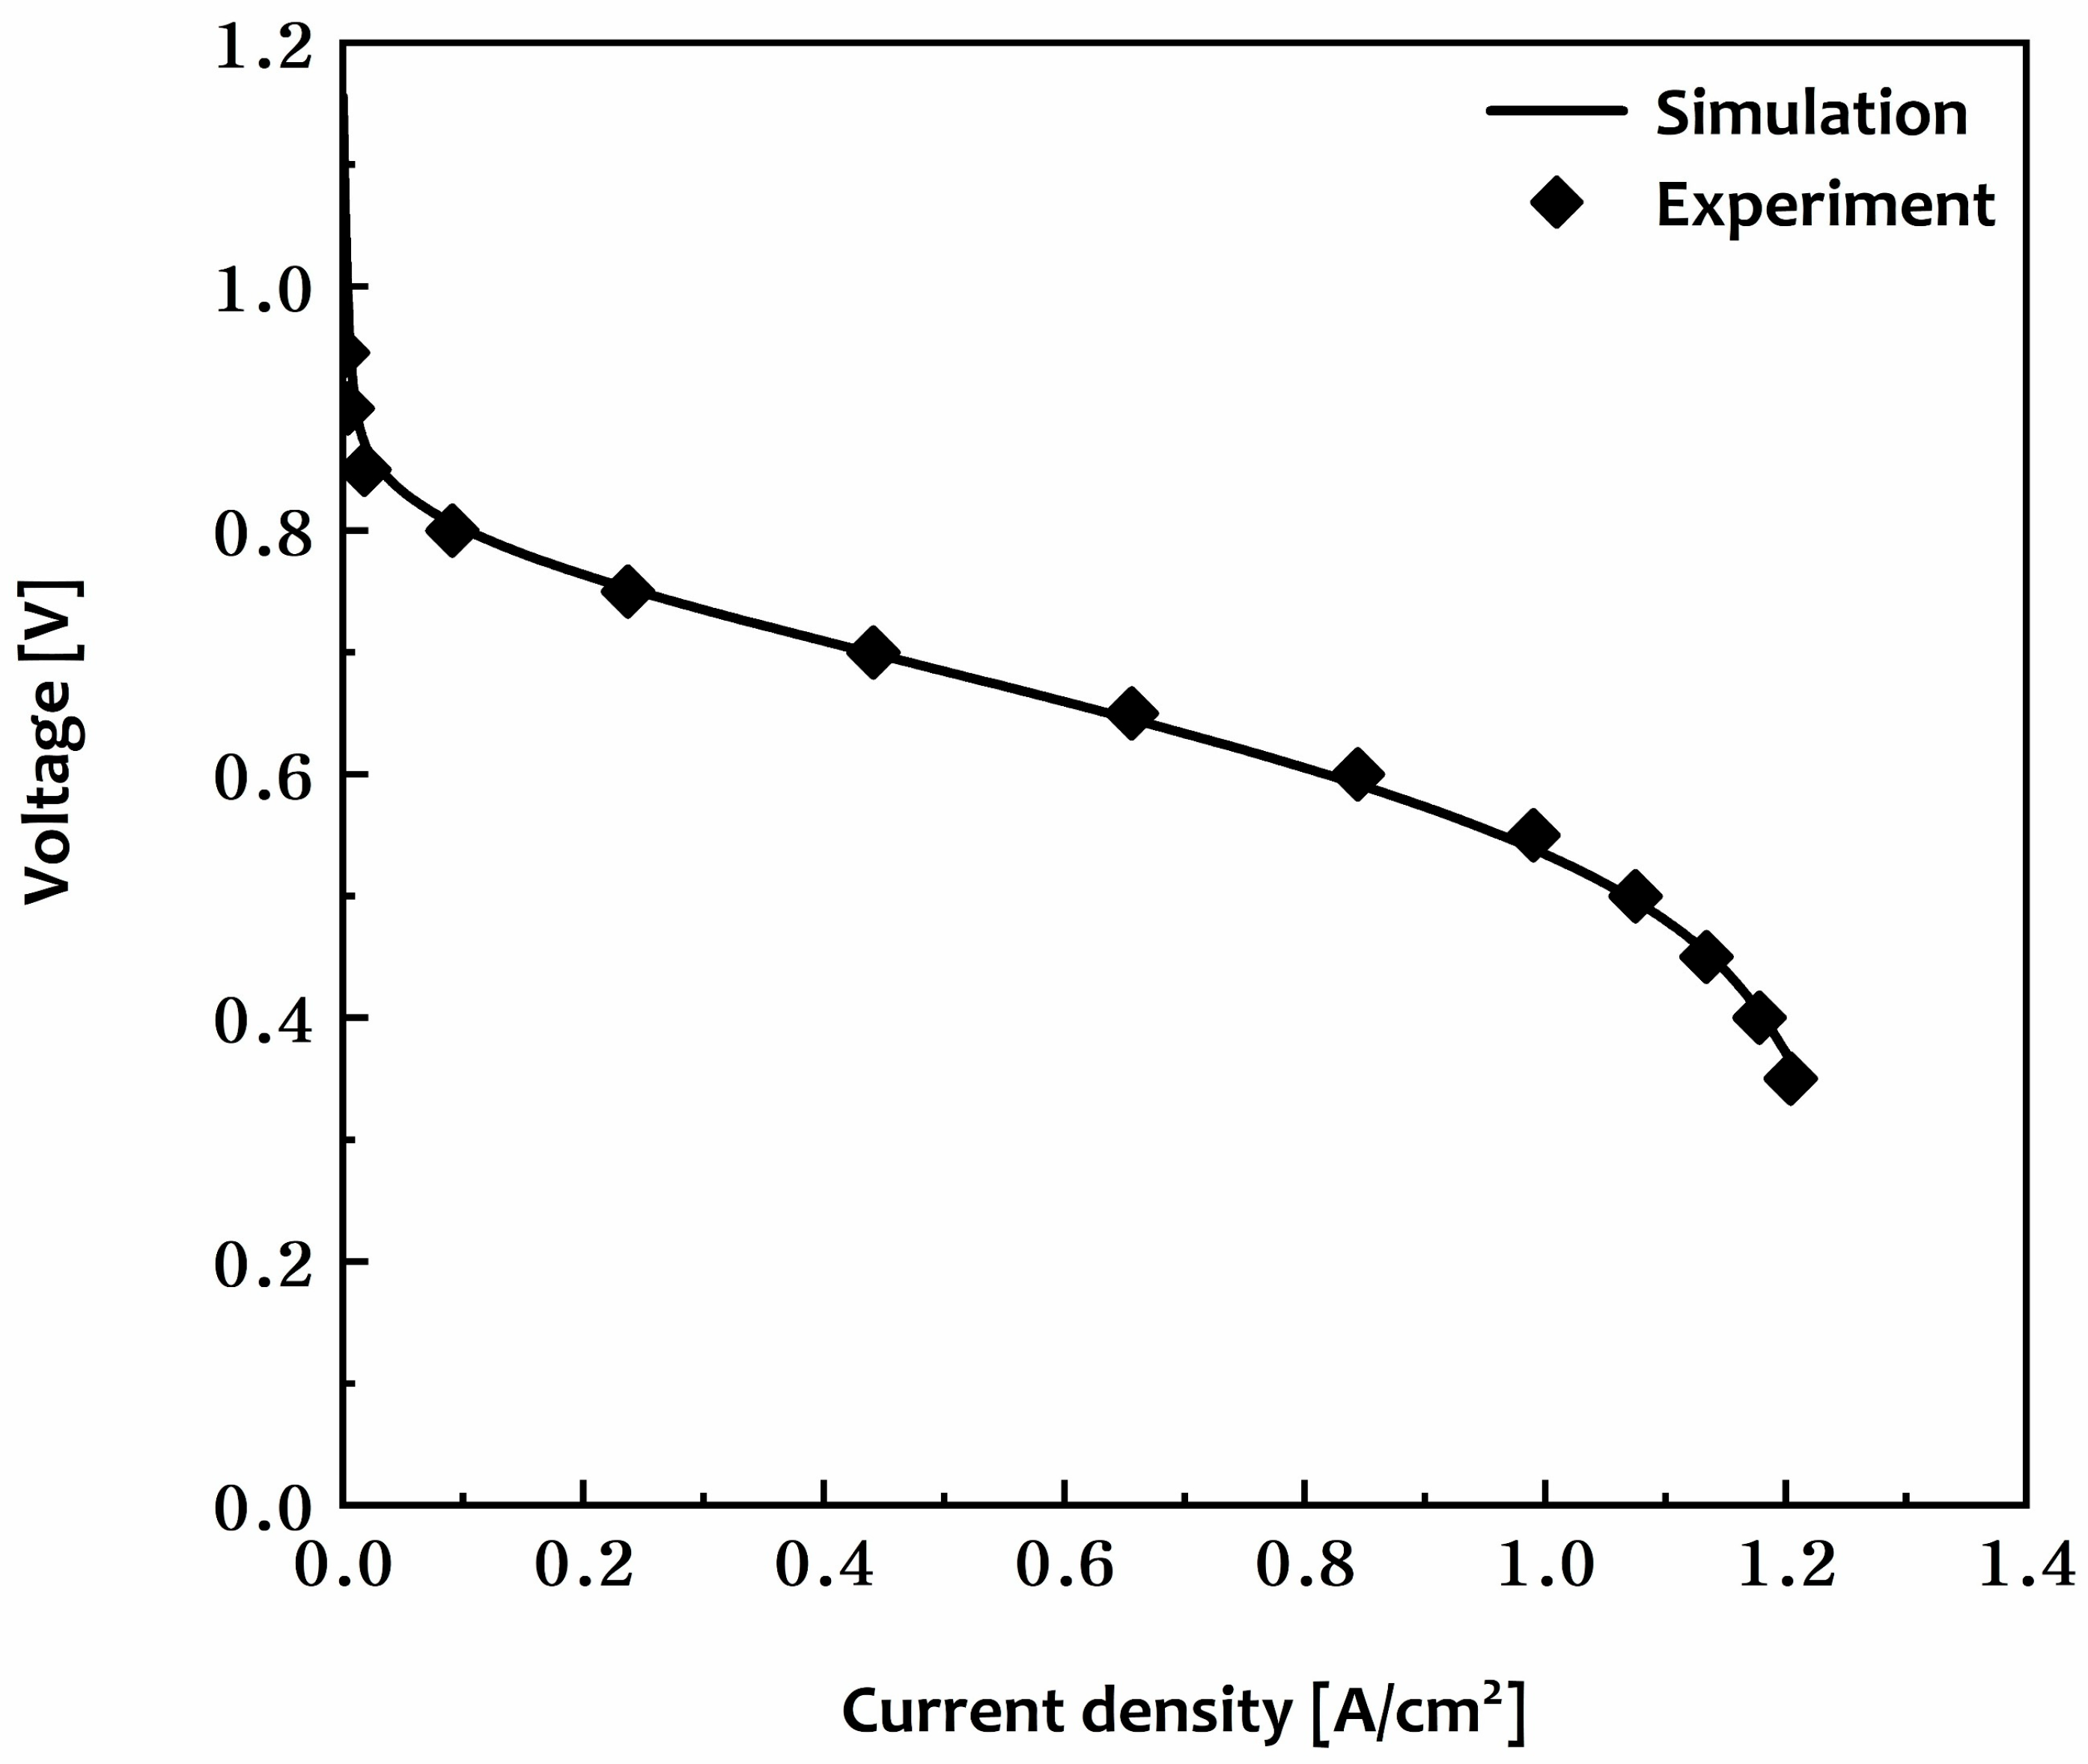
To ensure the reliability of the simulation results, the numerical model was validated. Figure 2 shows polarization curves of the PEMFC unit cell obtained from both simulation and experiment. The experimental data were acquired in our laboratory, and the experiment was conducted using identical geometry and material properties to those of the unit cell in simulation. Furthermore, operating conditions—including flow rate (SRc = 2.0), pressure, relative humidity, and temperature—were matched to those used in simulation. In the experiment, the temperatures of the bubbler, the gas line connecting the bubbler to the unit cell, and the unit cell were all maintained at 80 °C on both the anode and cathode sides to ensure relative humidity of 100%. As a result, a good match between simulation and experimental data indicates that the model is reliable.

3.2. Effects of Perforation Locations

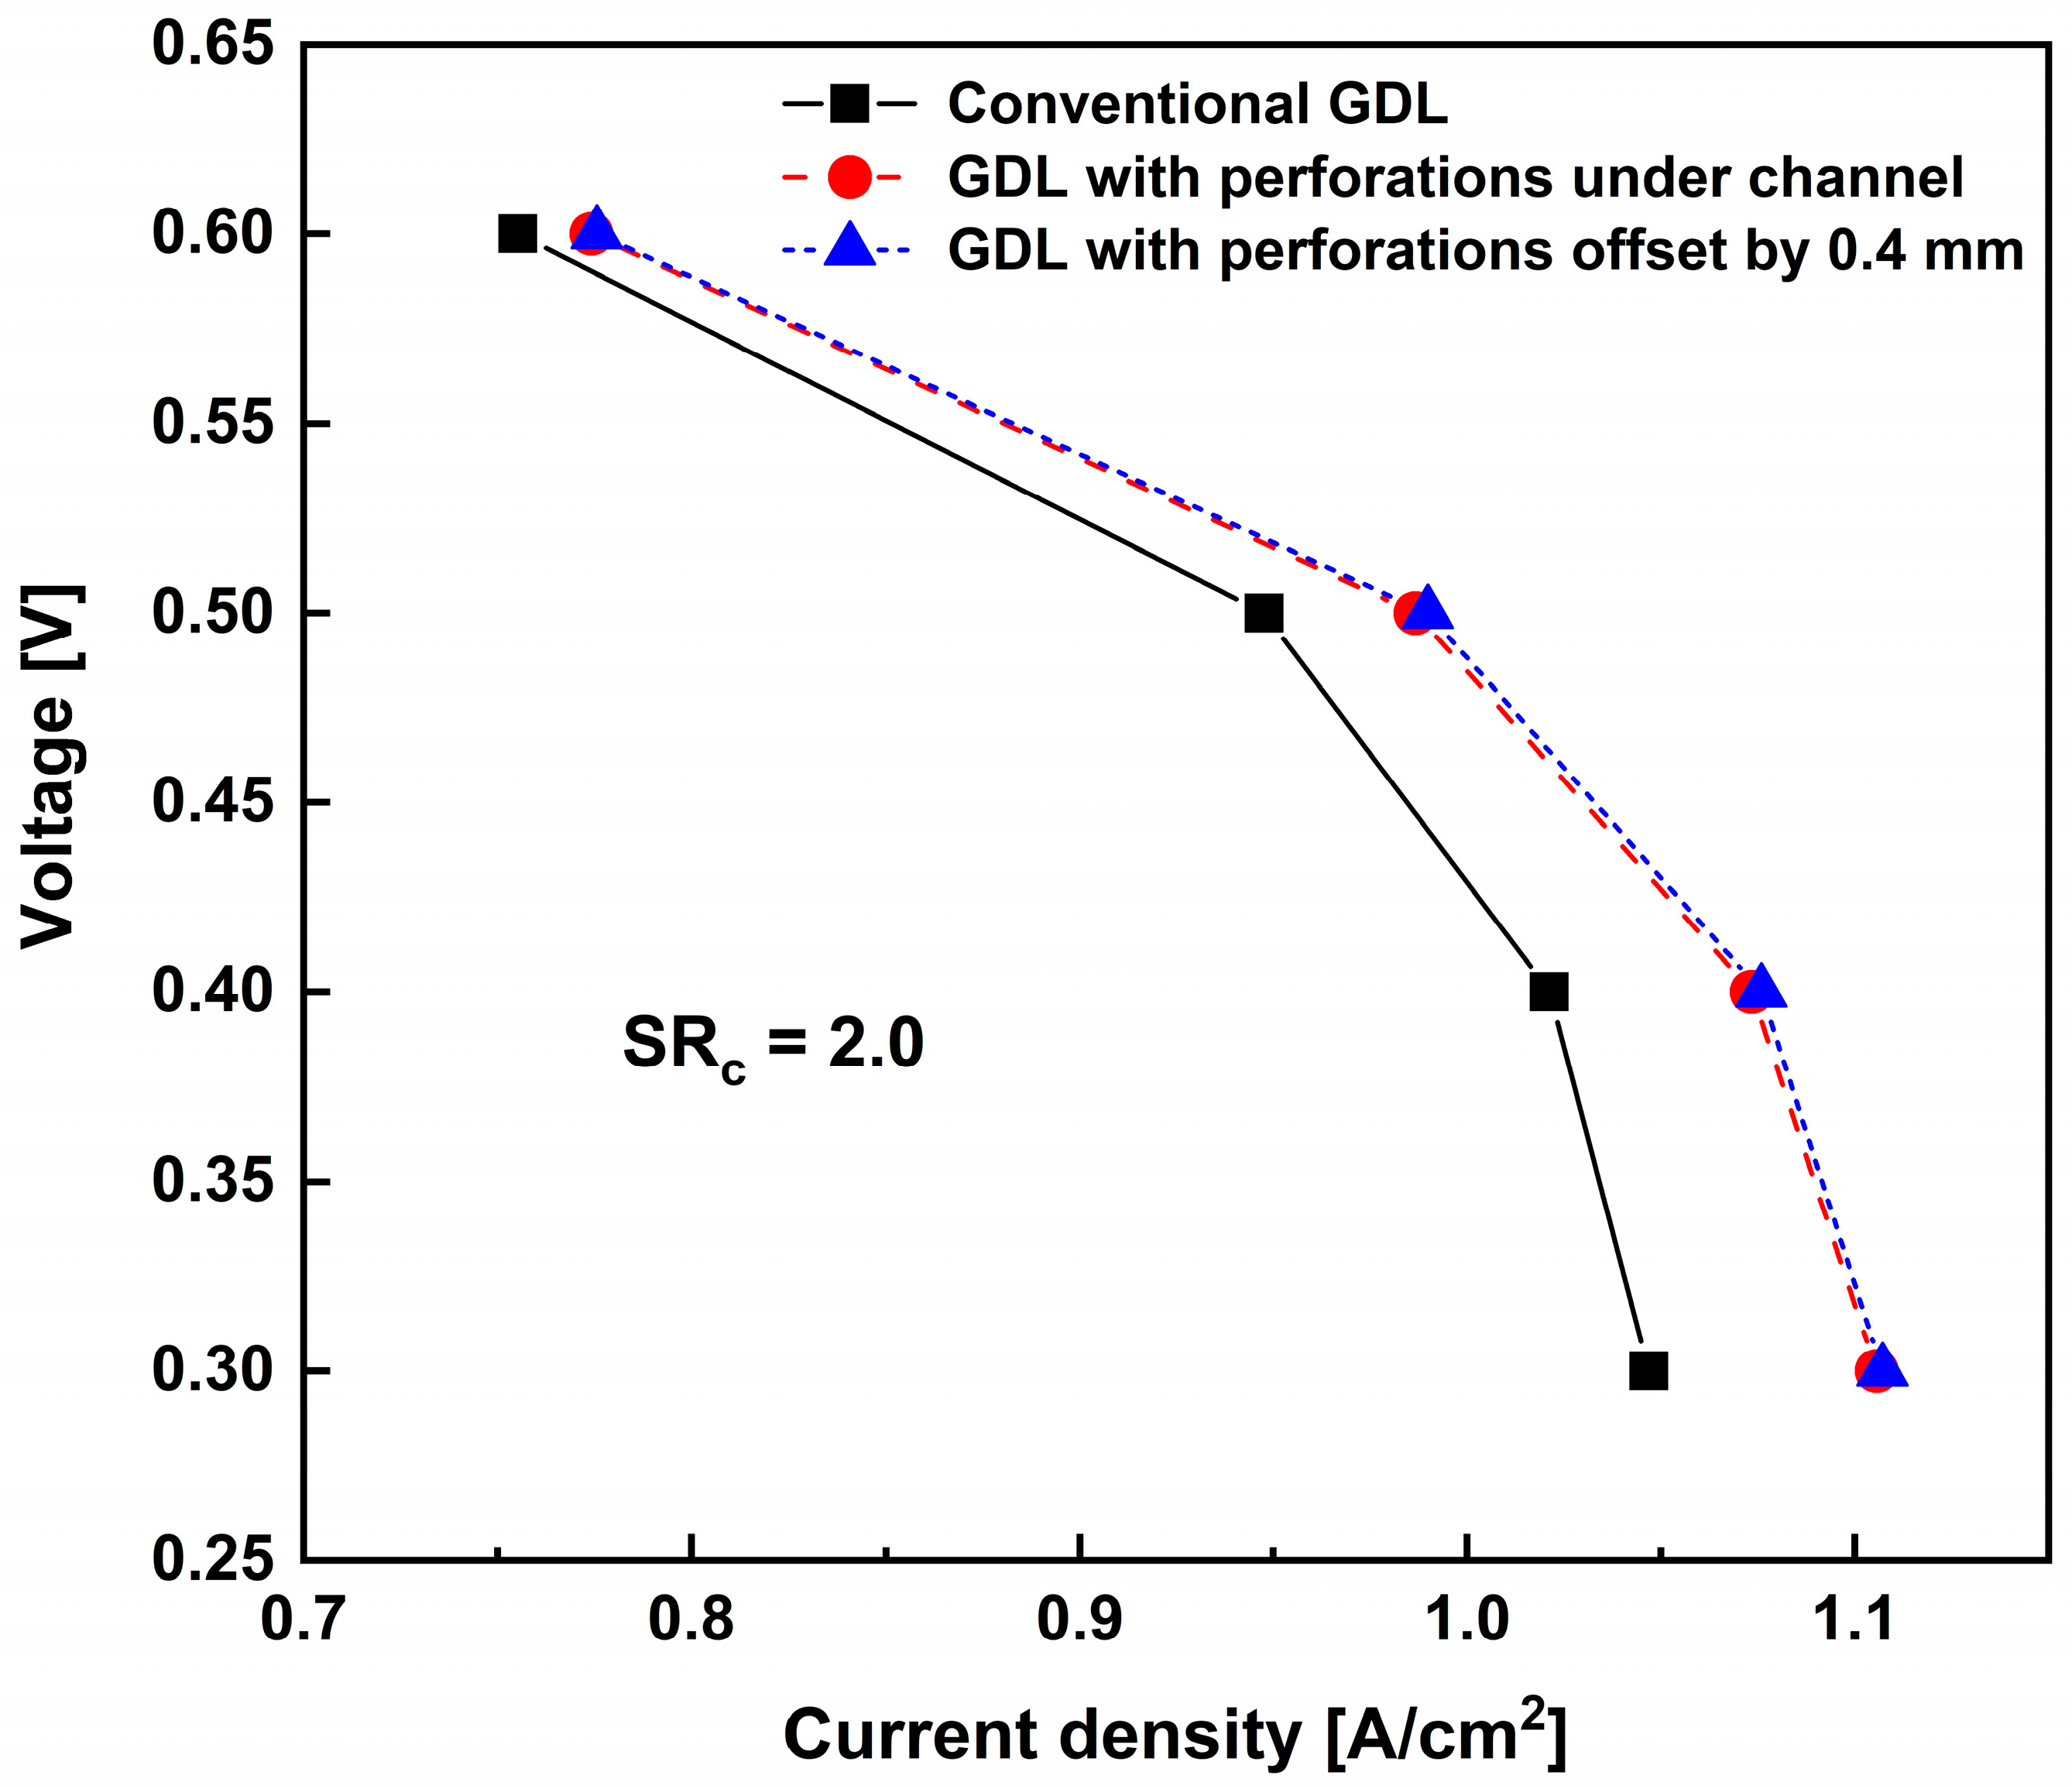
Figure 3 illustrates the polarization curves for different GDL perforations configurations, obtained under SRc of 2.0. Polarization curves were constructed with numerical results of 0.6, 0.5, 0.4, and 0.3 V to examine the impact of perforations on mass transfer in the PEMFC, as mass transfer losses are negligible at high cell voltages. Both perforated GDL cases showed better performance than the conventional GDL case. Also, the offset case showed slightly higher performance than the under-channel perforated case, especially for lower operating voltage. This tendency implied that the perforations and their locations influenced the mass transport loss of the PEMFC.
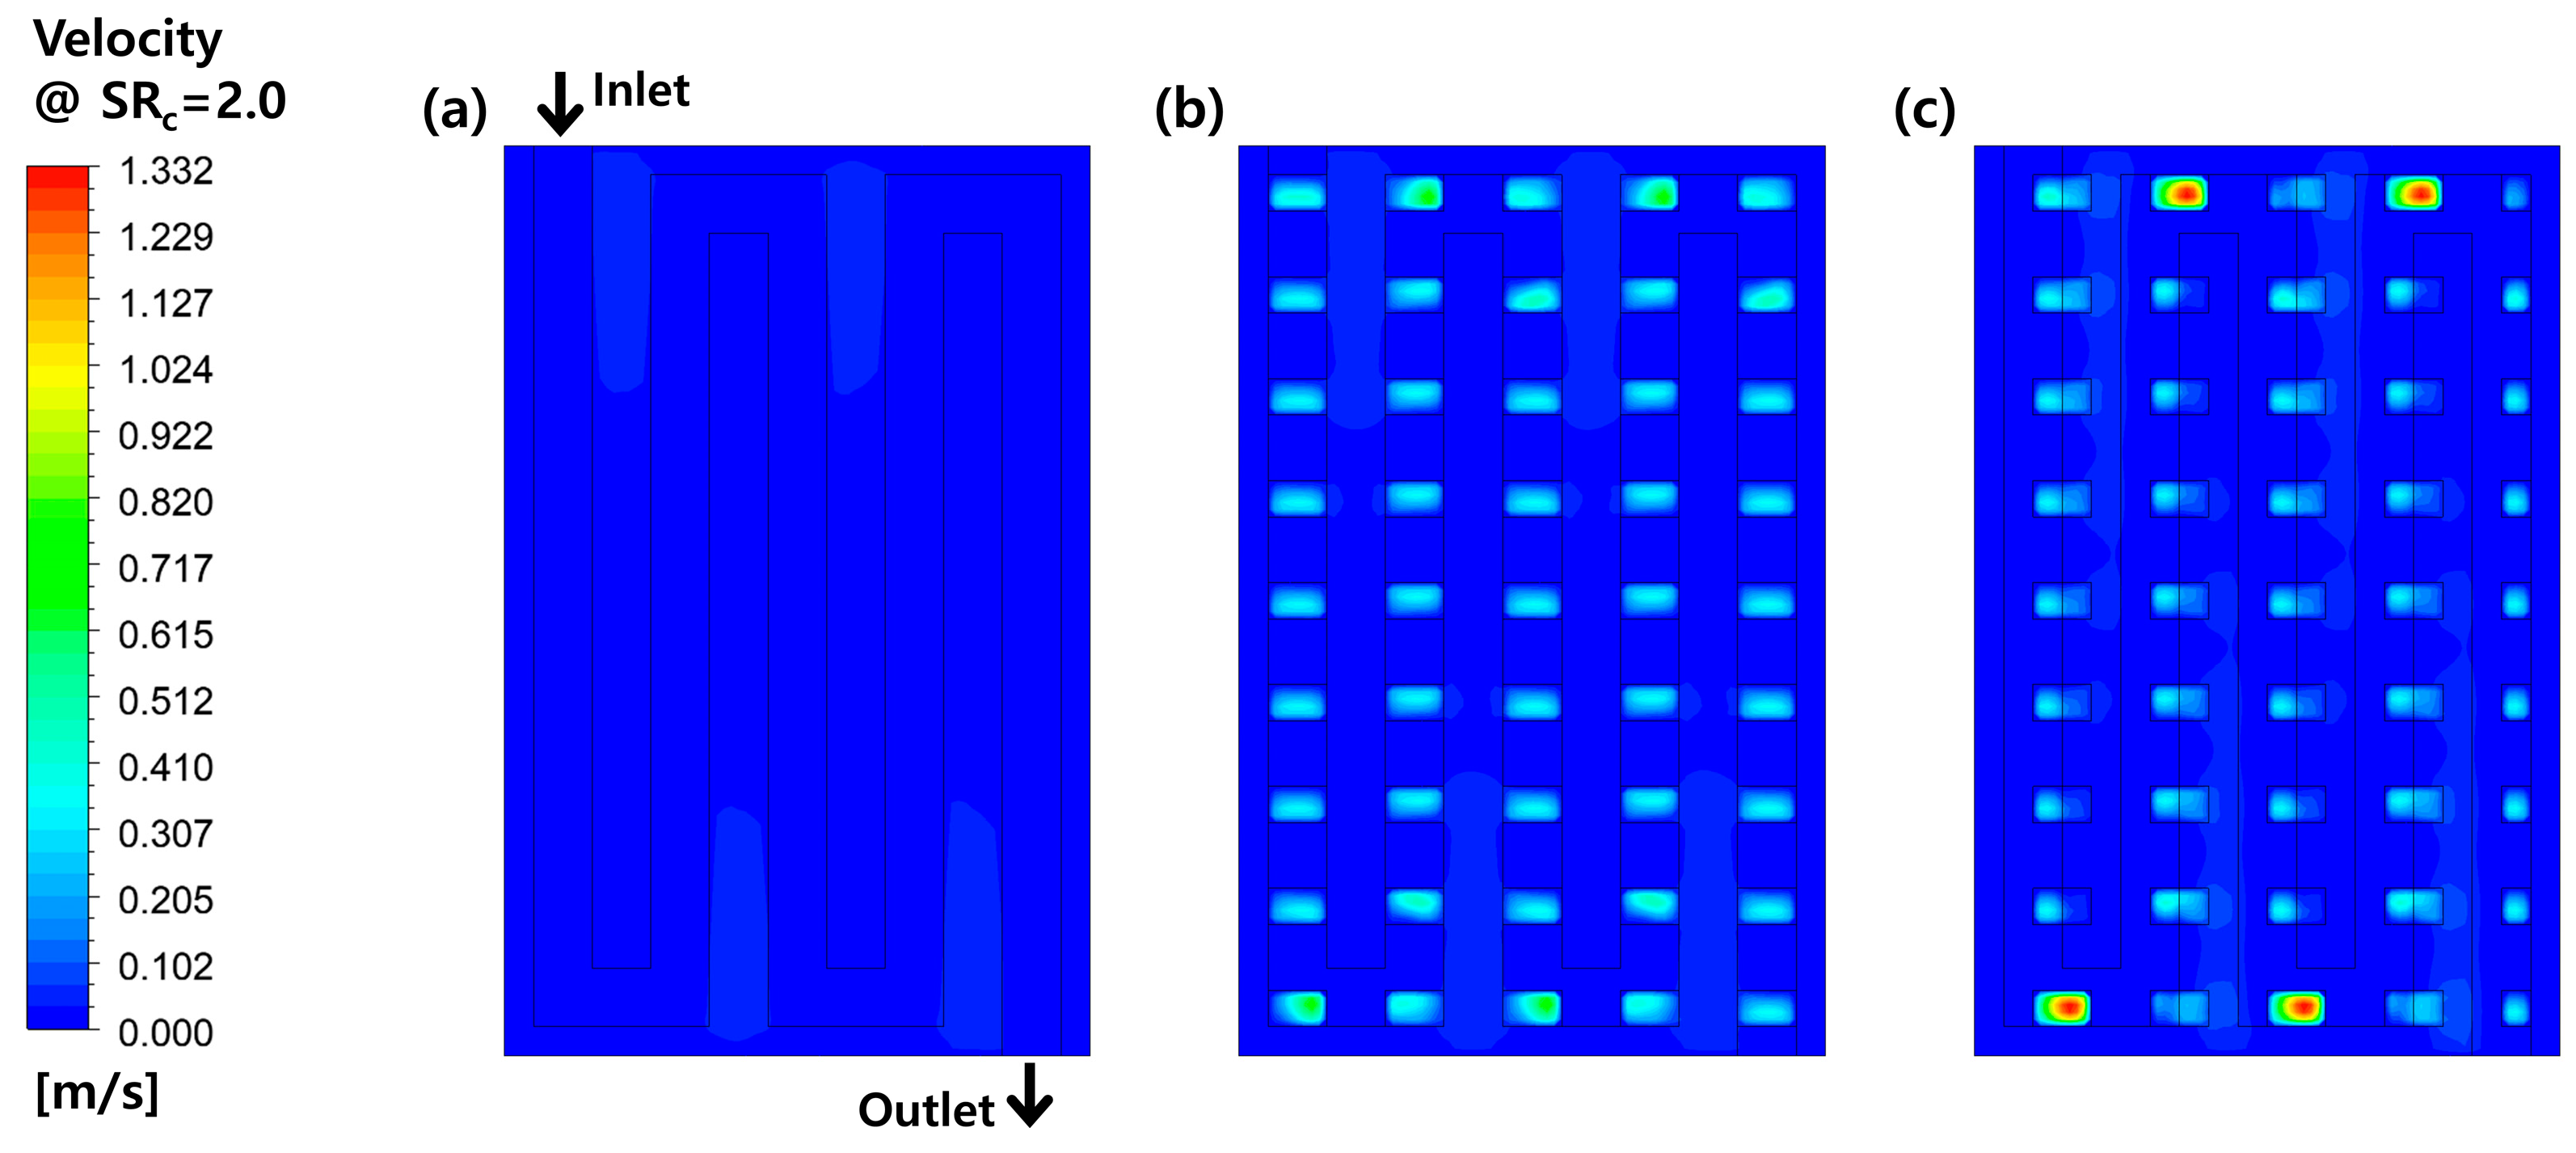
Figure 4 depicts velocity contours on the midplane of the cathode GDL under 0.5 V. The flow velocity within the conventional GDL was entirely blue, suggesting a significantly low velocity. Nevertheless, the velocity was substantially enhanced within the perforations on the GDL in the other cases. Especially for the GDL offset case, the velocity was slightly increased under the rib, even in the area covered by GDL. The region under the rib is vulnerable to oxygen depletion and water accumulation due to limited mass transport pathways. The velocity contours with the GDL explain the extent of convection induced by the pressure drop between adjacent channels. A higher velocity indicates a more active gas supply within the porous layers, enabling more effective oxygen supply and water removal in that area. Additionally, the highest velocity was shown on the perforations under the turn of the serpentine structure in the offset case. This behavior seemed to occur as the flow reoriented after hitting the wall at the turns.
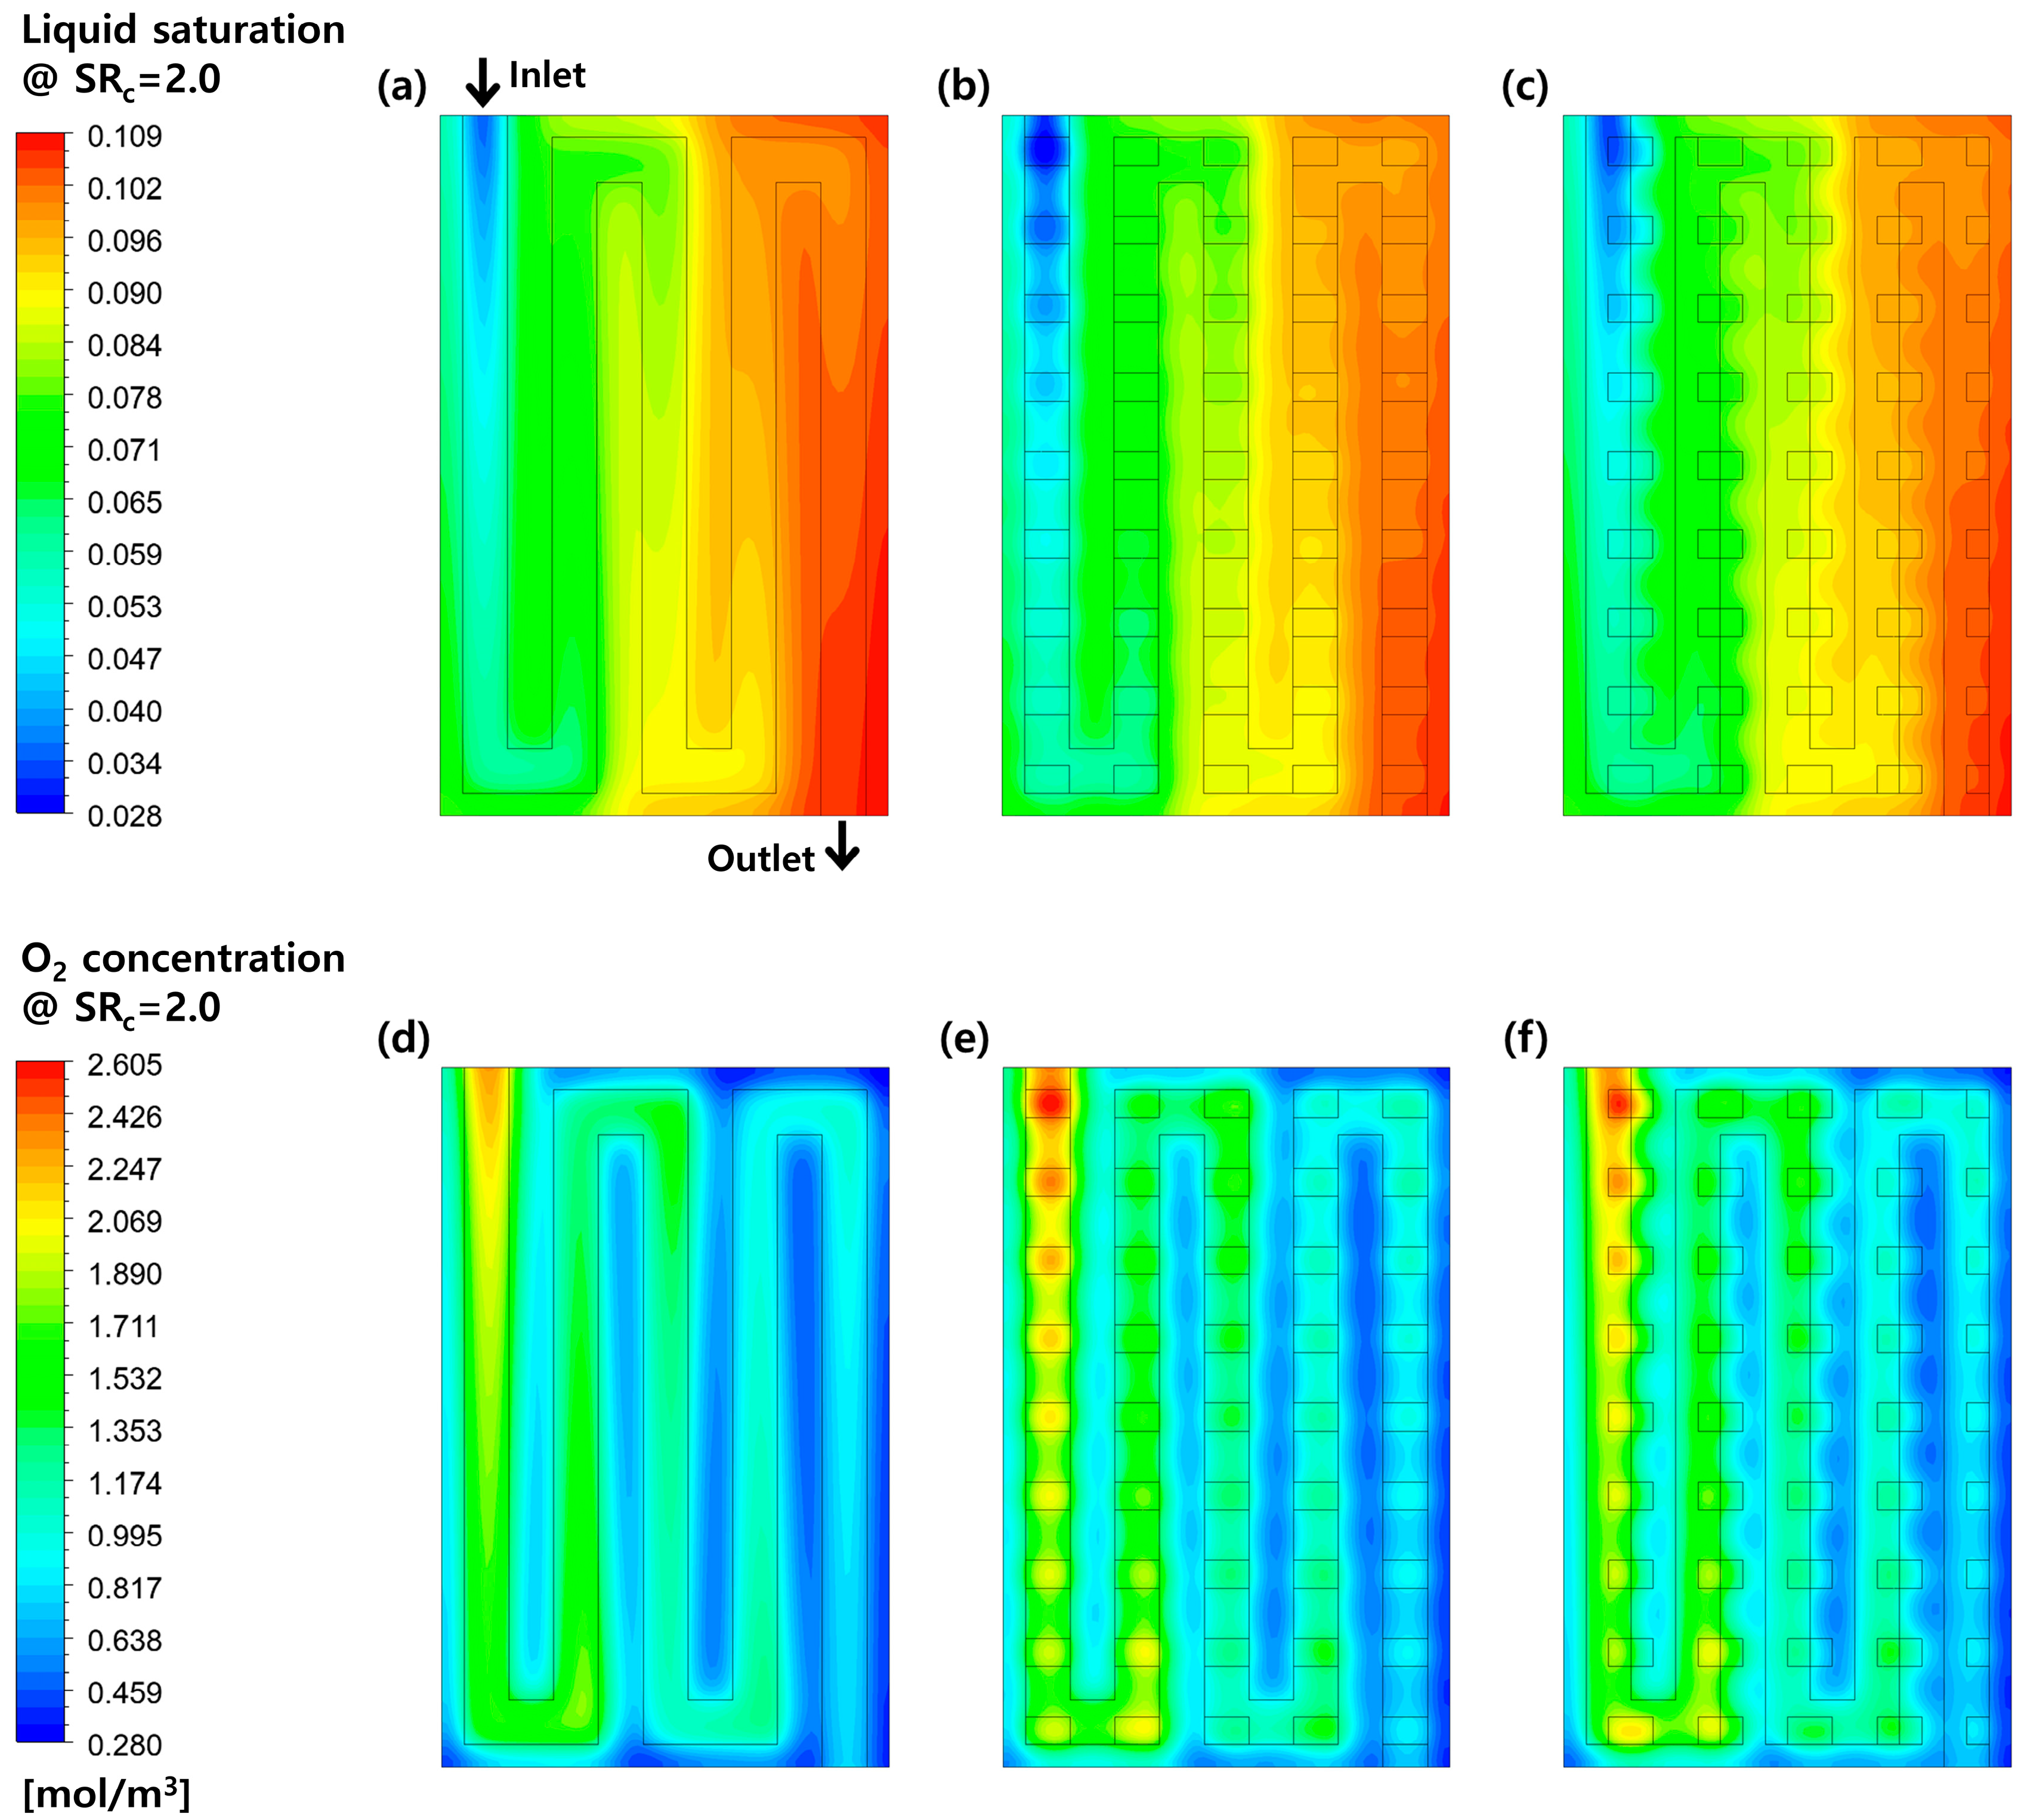
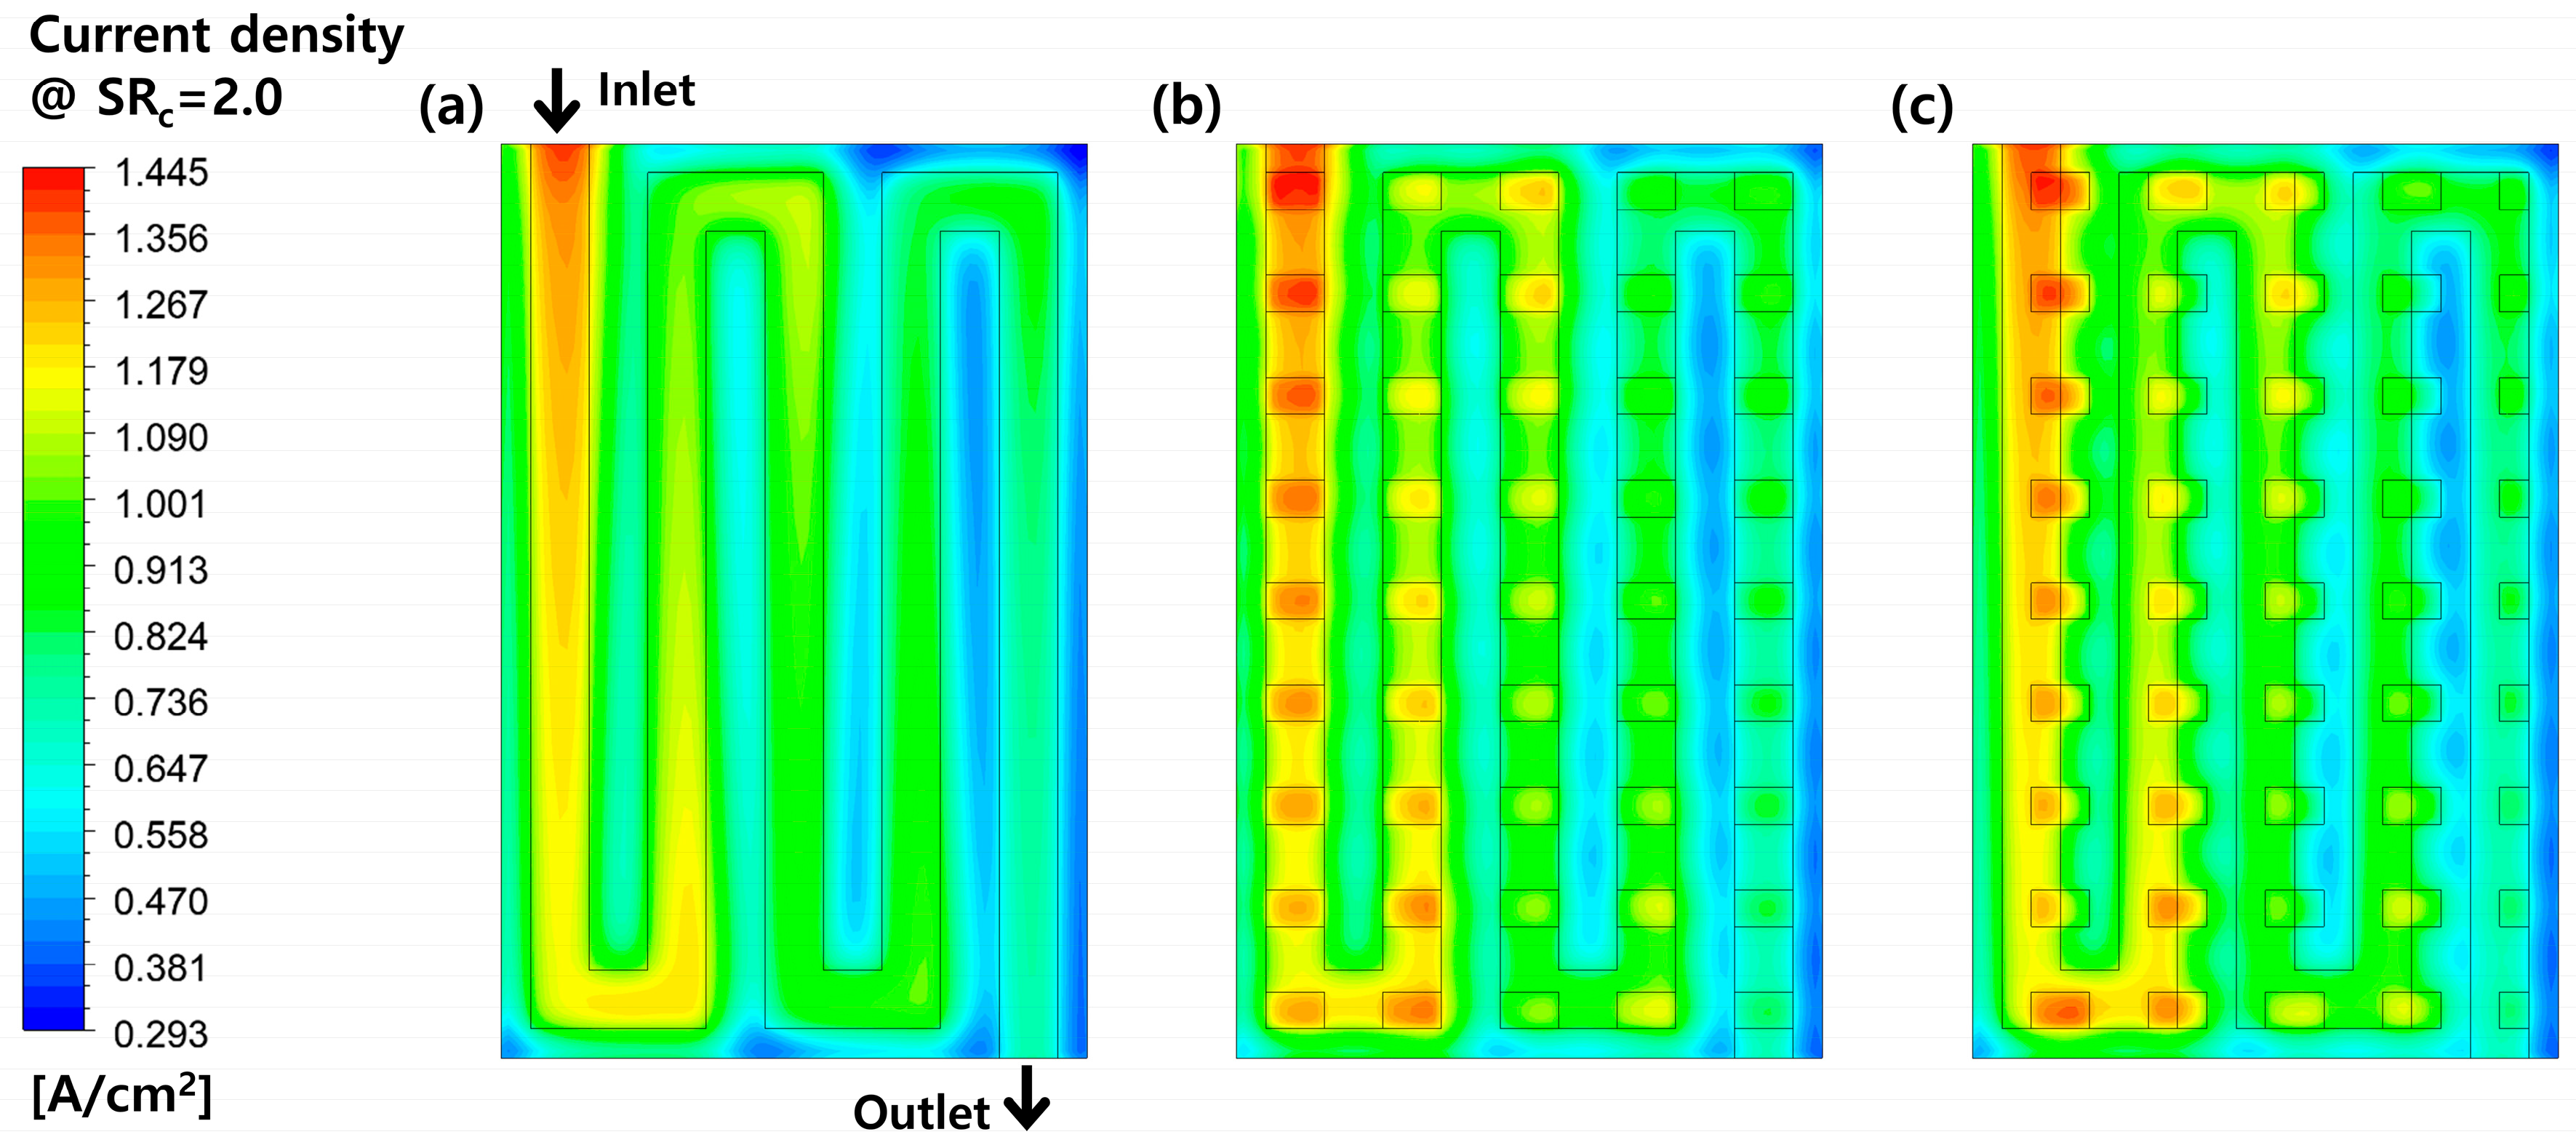
The contours of liquid saturation and oxygen concentration at the CL–MPL interface under 0.5 V is shown in Figure 5. In Figure 5a–c, as the velocity increased through the perforations on the GDL, the blue region became larger, which means that the liquid was easily removed under the perforations. This indicates that the gas diffusivity became higher under the perforations. In the results, oxygen supply was facilitated under the perforations on the GDL, as shown in Figure 5d–f. A slightly higher oxygen concentration was observed in the under-rib area covered by the GDL for the offset case compared to the under-channel perforated case, which was attributed to the increased local velocity. Figure 6 shows the current density contours at the CL–MPL interface on the cathode side under 0.5 V. The perforated GDL cases exhibited higher current density than the conventional GDL case. Furthermore, the offset case showed a higher current density in the under-rib region covered by the GDL, compared to the under-channel perforated case. The current density distributions were almost consistent with the oxygen concentration distributions. This consistency indicates that enhanced mass transfer led to an improvement in the electrochemical performance of the PEMFC.
The detailed computational data are summarized in Table 7. The oxygen concentration in the cathode CL increased from 0.9559 mol/m3 in the conventional GDL case to 1.027 mol/m3 in the case with the GDL perforated under the channel due to the presence of perforations. Also, a slightly higher concentration of 1.032 mol/m3 was observed in the offset case. This trend implies that both the presence and the location of the perforations affect mass transfer in the PEMFC. Furthermore, depending on the oxygen concentration, the current density increased from 0.9477 A/cm2 in the conventional GDL case to 0.9867 A/cm2 in the case with the GDL perforated under the channel, and further to 0.9898 A/cm2 in the offset case.

3.3. Effects of Stoichiometric Ratio

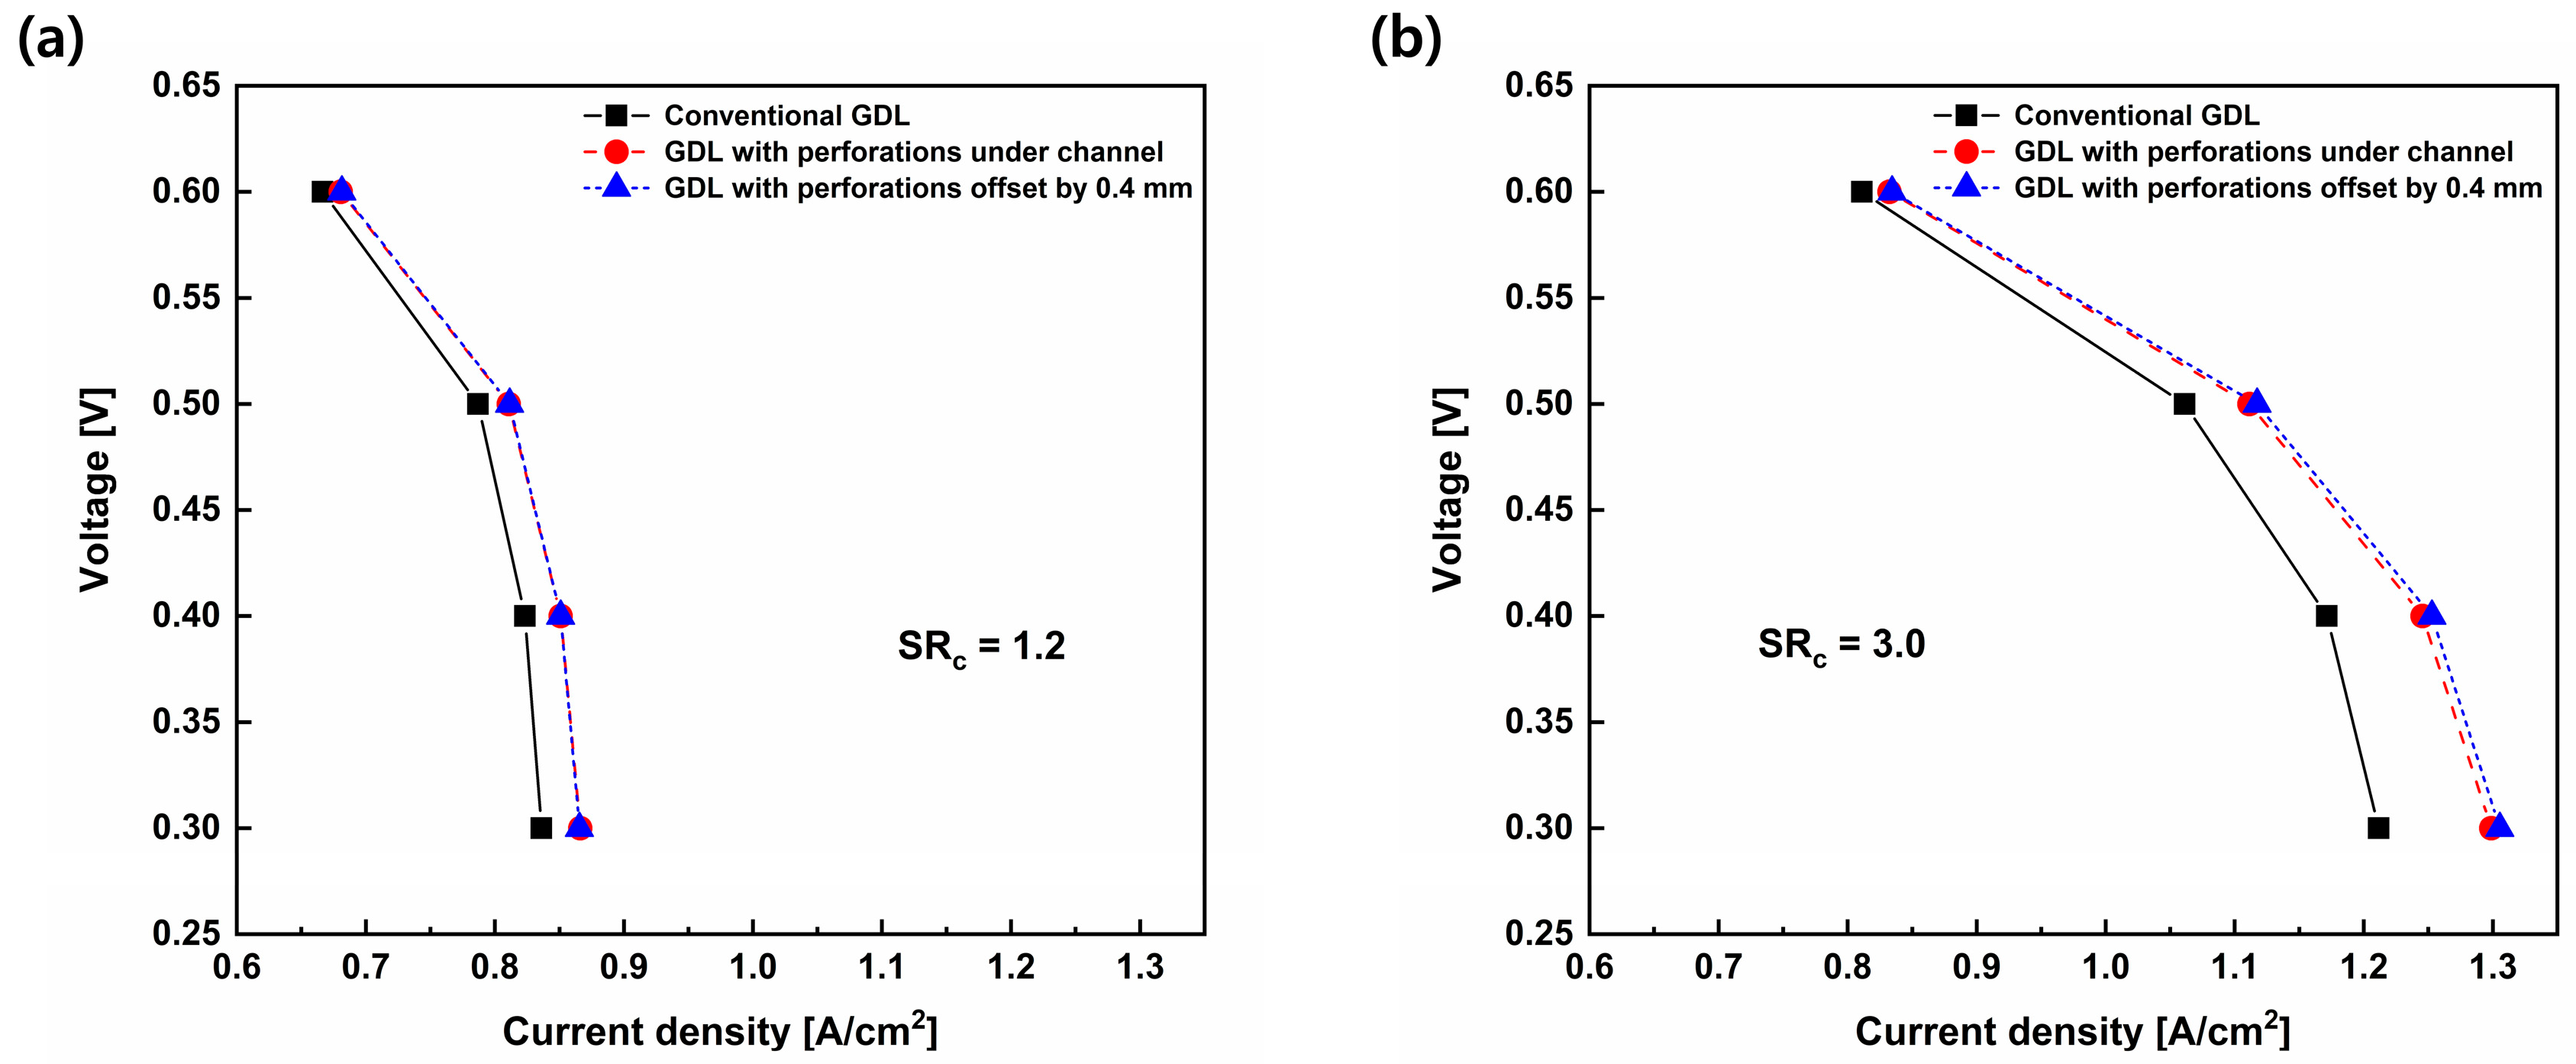
As the perforations in the GDL positively affect mass transfer in the PEMFC, the influence of mass flow rate was further elucidated. As previously mentioned, simulations were conducted by varying SRc of oxygen from 2.0 to 1.2 and 3.0 for 1 A/cm2, which indicates that the mass flow rate was adjusted. On the cathode side of PEMFCs, water tends to accumulate, which hinders oxygen supply. Therefore, the selection of an appropriate SRc is necessary. A higher SRc enhances oxygen transport and improves cell performance, but an excessively high SRc reduces the net power output of the system. Polarization curves for each SRc are shown in Figure 7. The SRc of 3.0 cases showed consistently better performance than the SR 1.2 cases, due to the increased oxygen supply. For both SRc of 1.2 and SRc of 3.0 cases, the presence of perforations led to performance improvement. In the SRc of 3.0 cases, the offset case showed higher performance than the under-channel perforated case, whereas in the SRc of 1.2 cases, the performance improvement due to the offset was negligible.
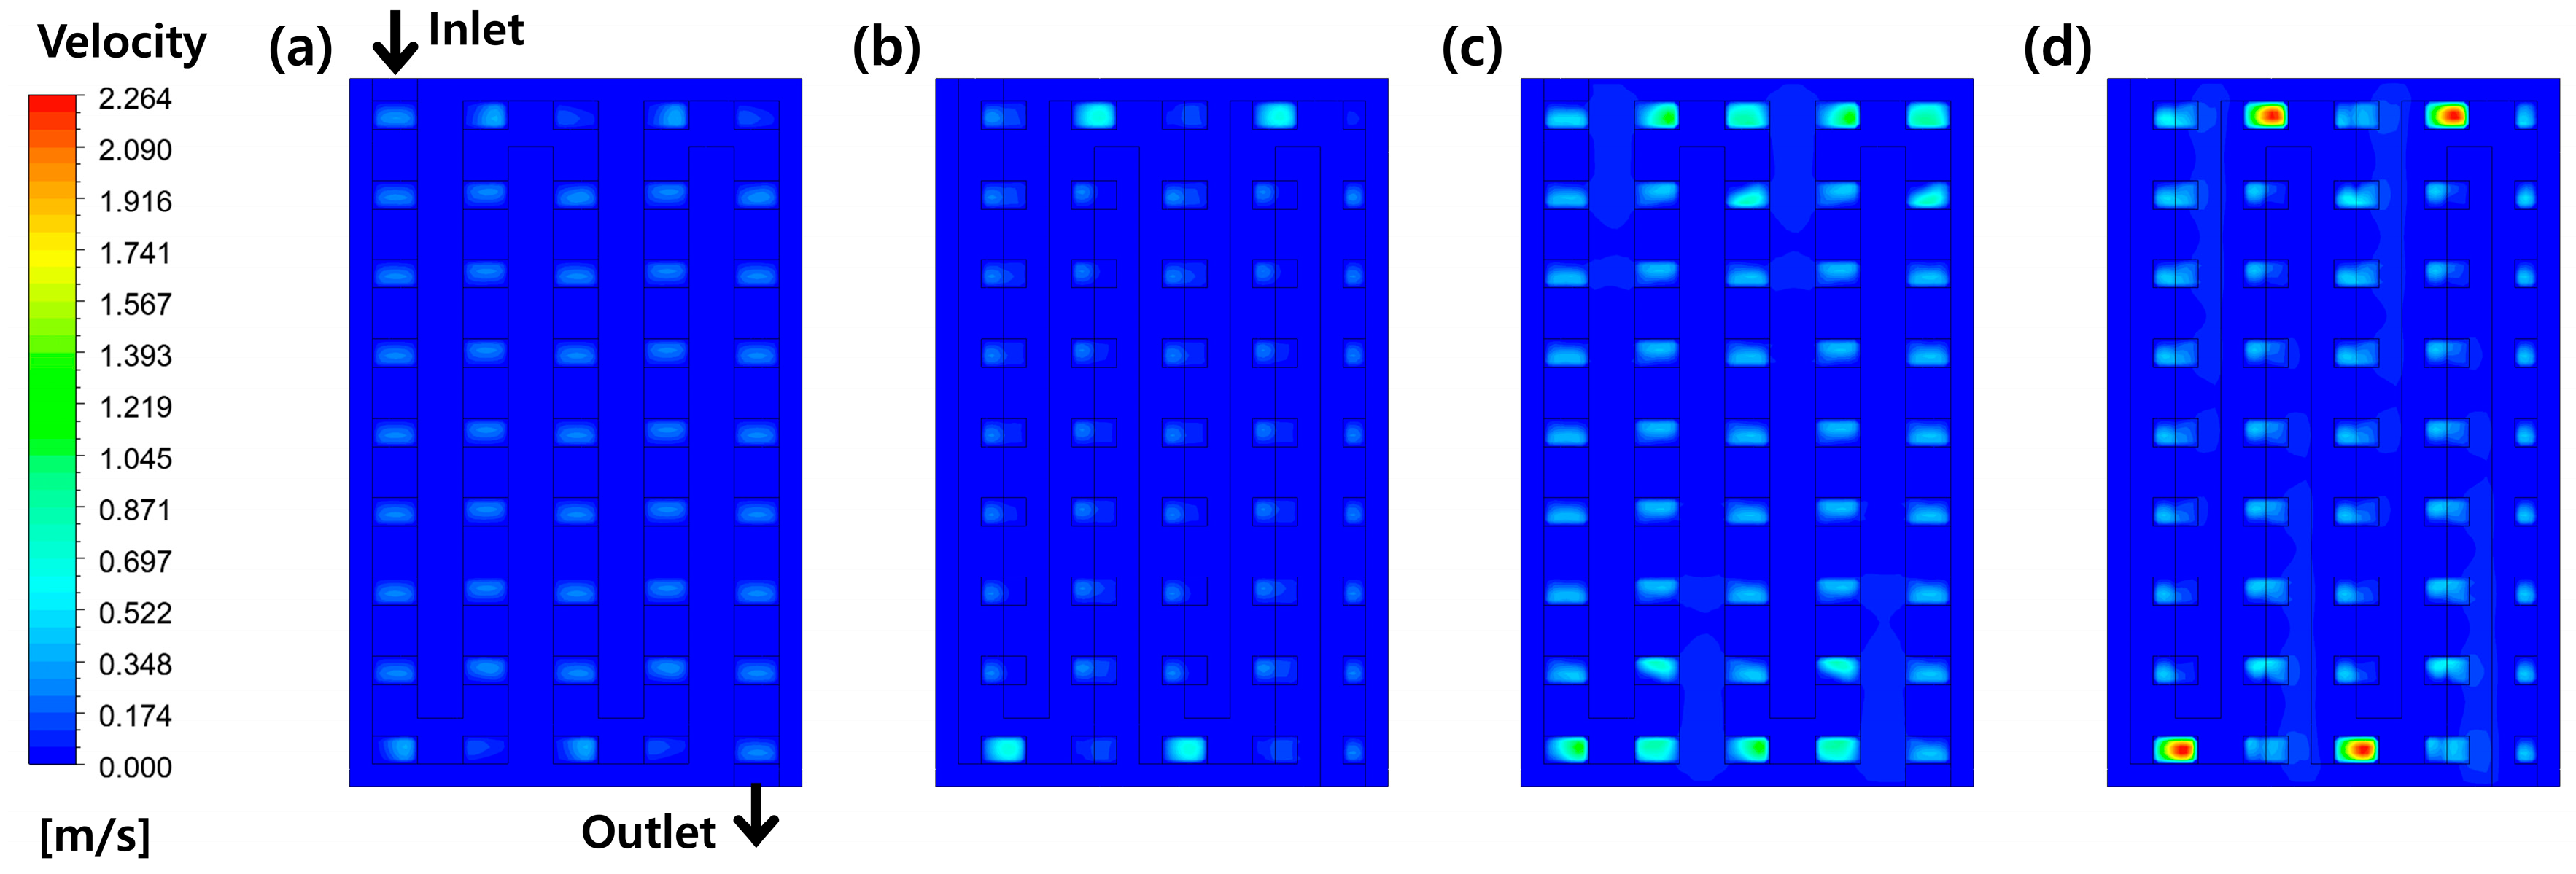
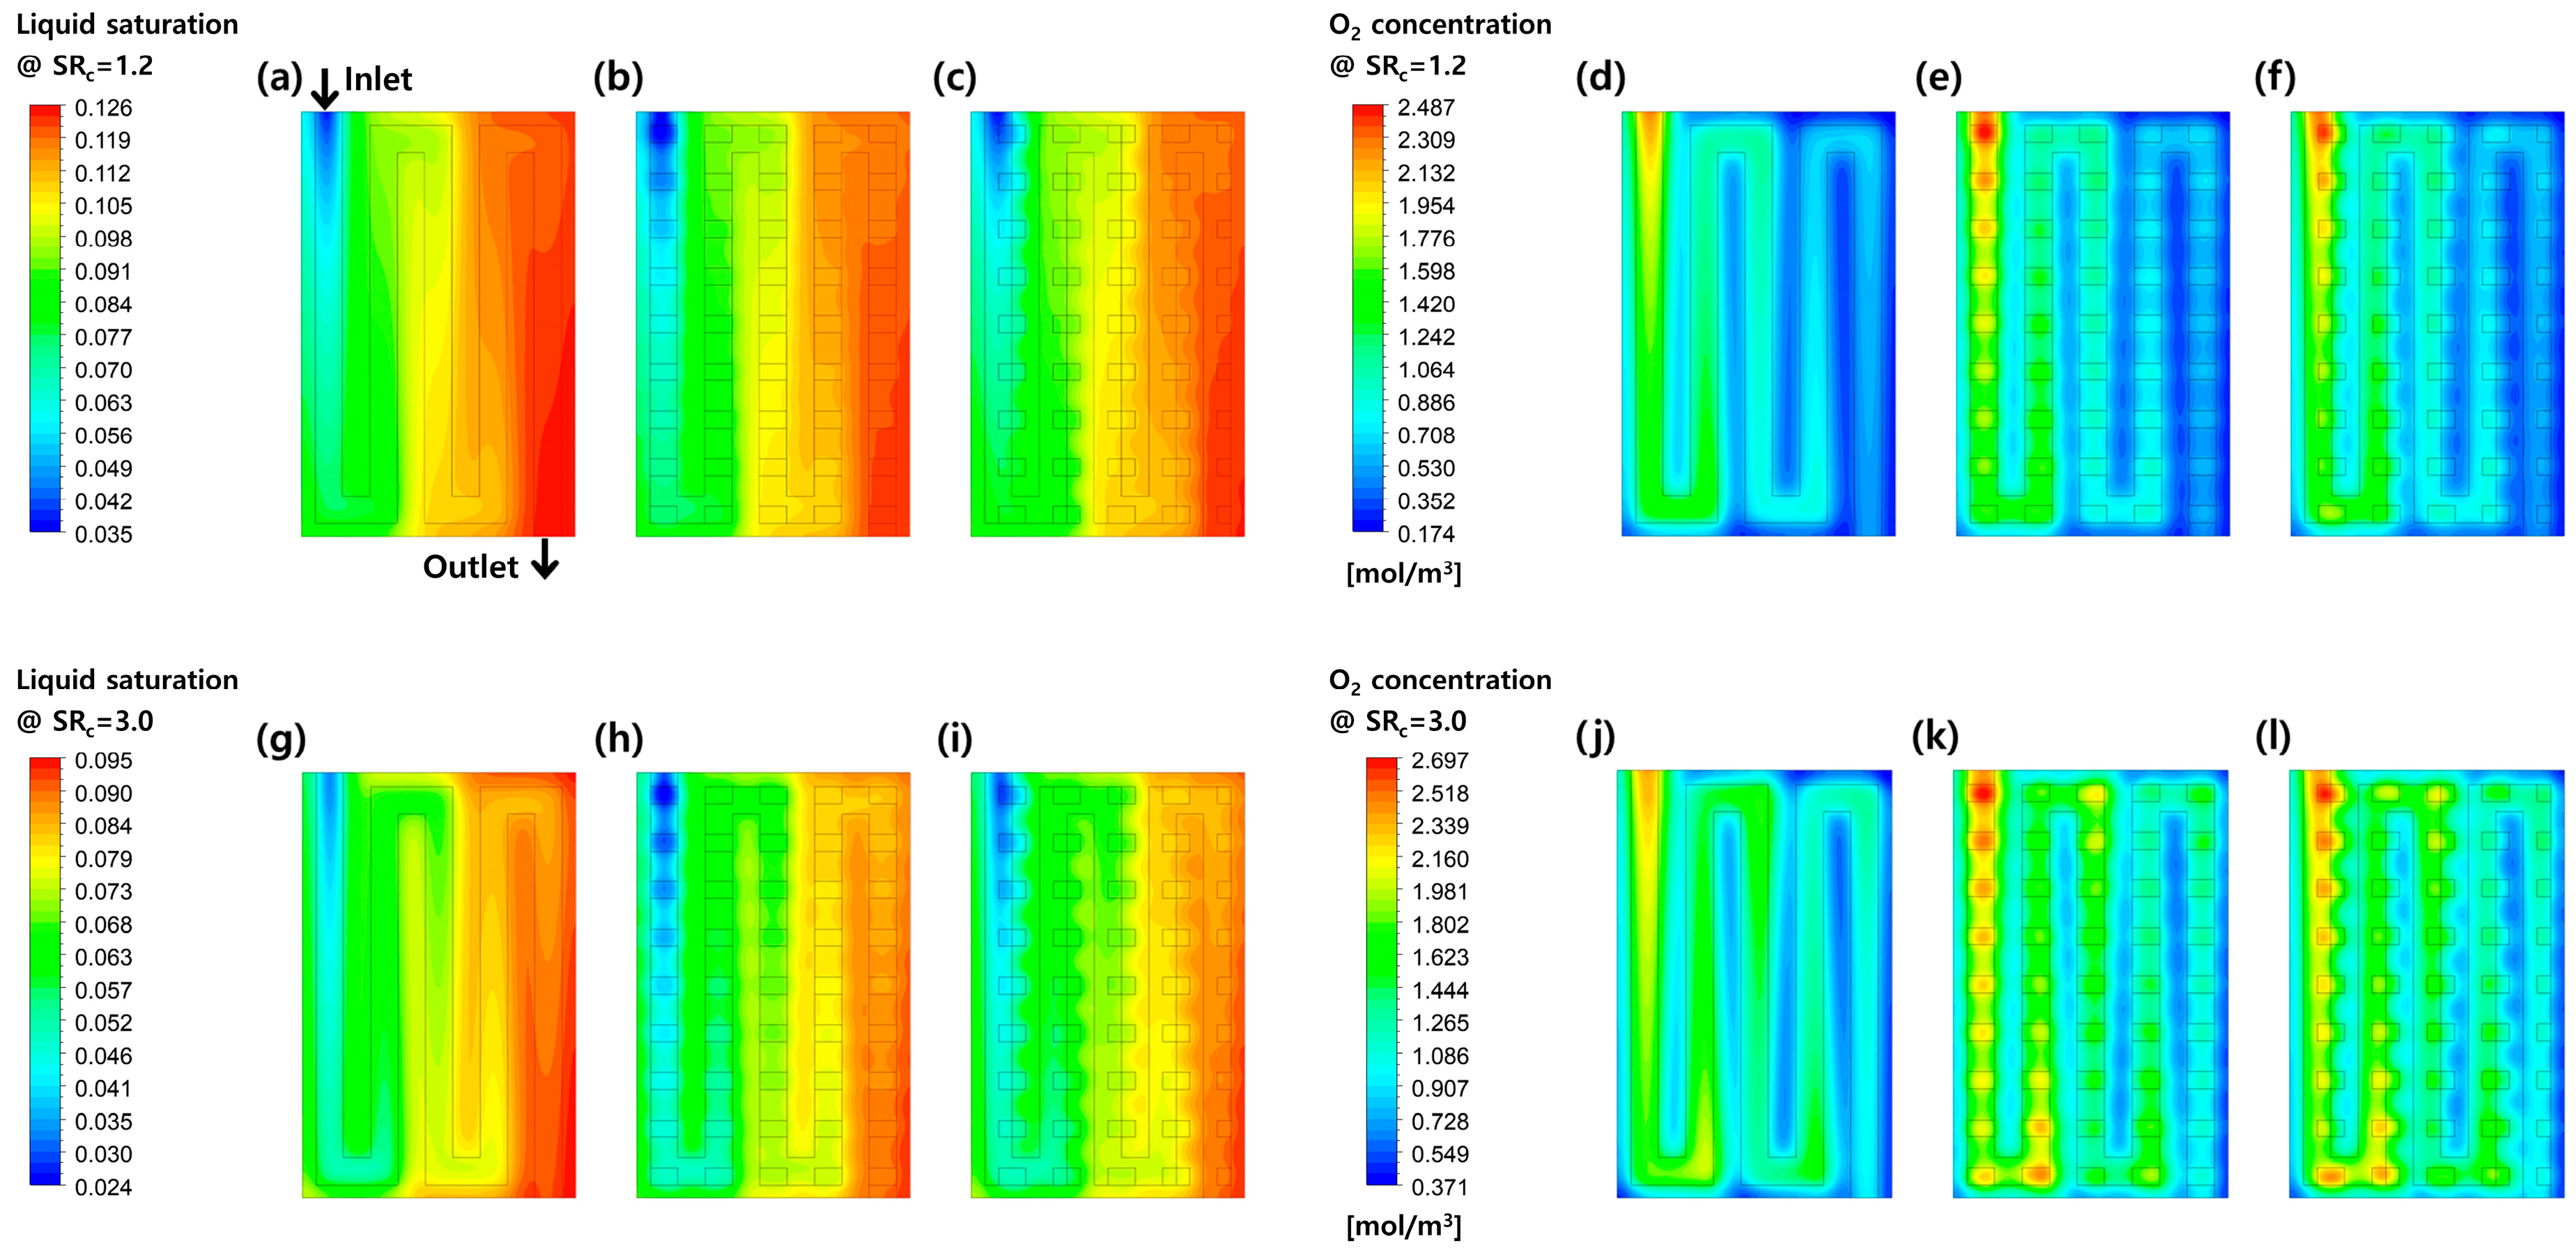
Figure 8 depicts velocity contours at the midplane of the cathode GDL for each perforated case. With increasing SRc, the velocity increase in the perforations became more evident. This is because a higher mass flow rate caused a greater pressure difference between adjacent channels across the ribs, promoting stronger convective transport. The change in velocity affected the distributions of oxygen concentration and liquid saturation at the cathode CL–MPL interface, as shown in Figure 9. A comparison between Figure 9a–c and Figure 9g–i shows that the increase in the blue region due to perforations was more pronounced in the SRc of 3.0 cases than in the SR 1.2 cases. This indicates that the presence of perforations has a greater impact on liquid removal when the mass flow rate is higher due to a higher velocity in the perforations. Furthermore, comparison of Figure 9d–f with Figure 9j–l reveals that the expansion of the red region became more significant at higher SR, implying that oxygen supply was more active under such regions.
The specific computational data are shown in Table 8. For the SRc of 1.2 cases, the oxygen concentration in the cathode CL increased from 0.7460 mol/m3 in the conventional case to 0.7857 mol/m3 in the case with the GDL perforated under the channel. However, in contrast to the SR 2.0 case, the oxygen concentration slightly decreased to 0.7852 mol/m3 in the offset case. The current density increased a little compared to the conventional case, with an increase of 3.02% in the under-channel perforated case and 3.11% in the offset case. For the SR 3.0 cases, the oxygen concentration in the cathode CL gradually increased from 1.1299 mol/m3 in the conventional case to 1.2331 mol/m3 in the under-channel perforated case, and further to 1.2441 mol/m3 in the offset case. The improvement in current density relative to the conventional case was 4.72% for the under-channel perforated case and a higher 5.29% for the offset case.
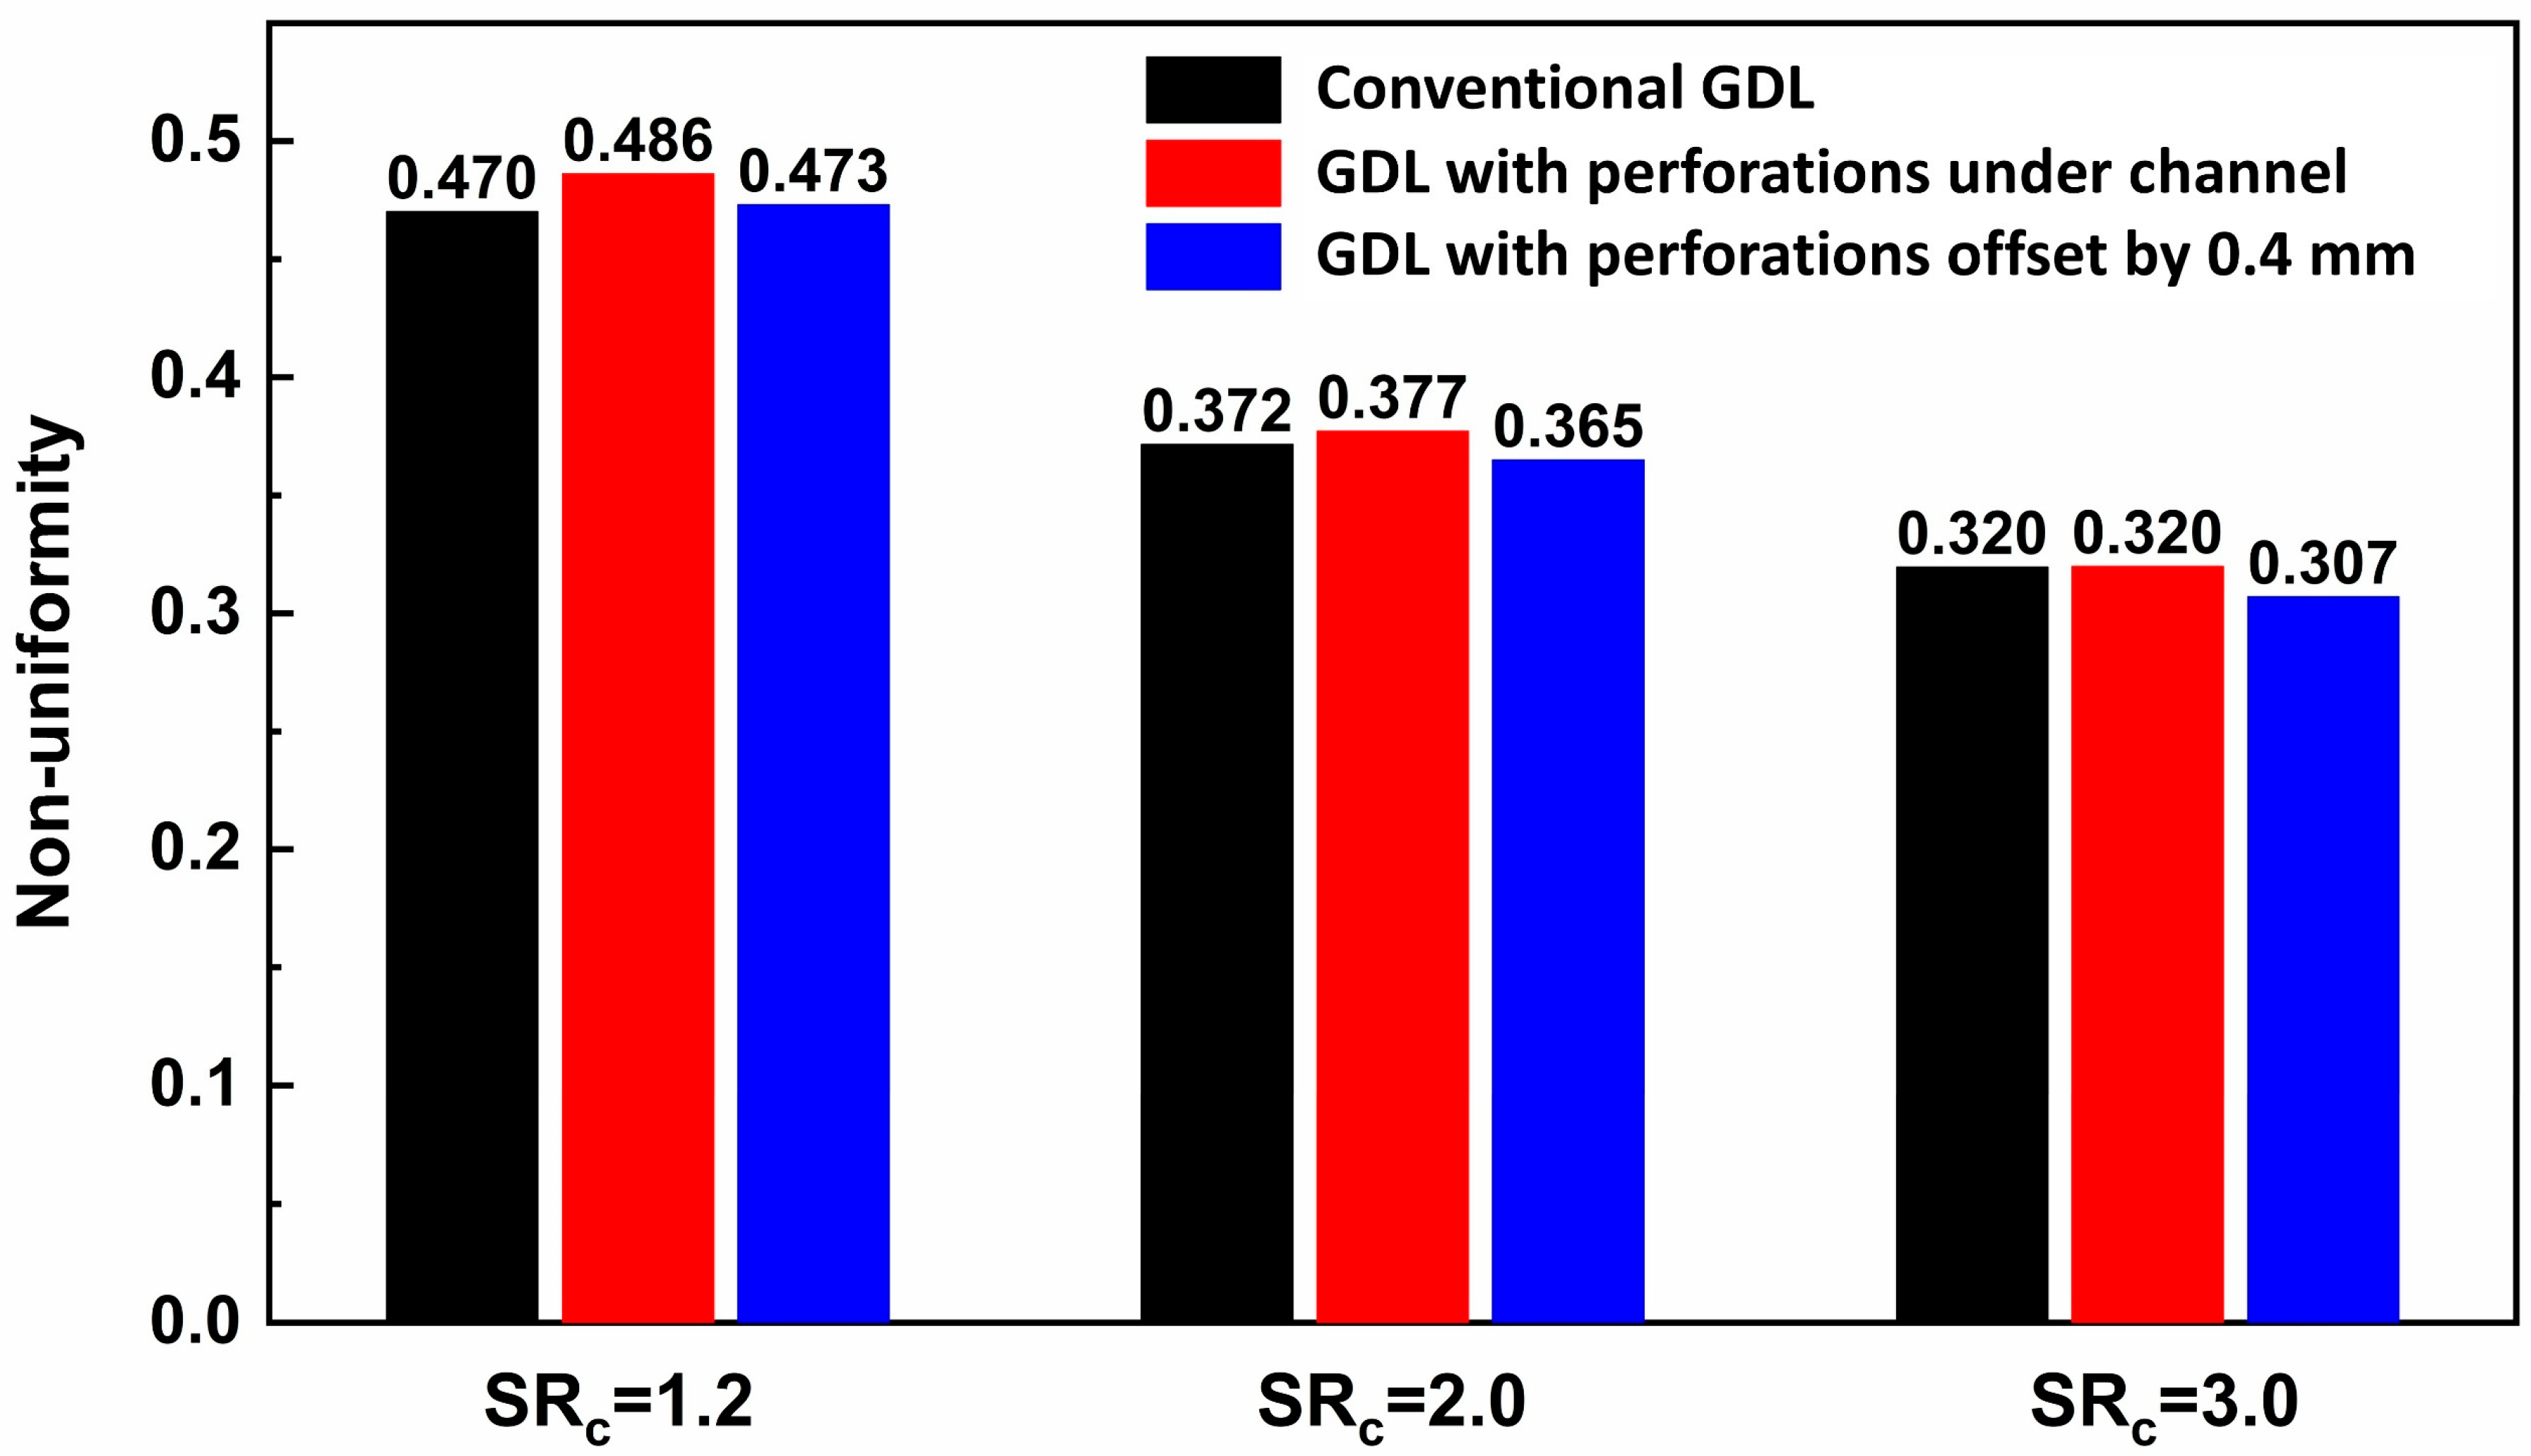
The non-uniformities of oxygen concentration at the cathode CL–MPL interface for all cases are also compared in Figure 10, as calculated in the following equation [41].
E = C O 2 C O 2 ¯ 2 d S C O 2 ¯ 2 d S
As shown in Figure 10, the overall non-uniformity decreased as the SRc increased. This was attributed to the enhanced mass transfer, especially for convection, caused by the higher flow rate. In the SRc of 1.2 cases, the non-uniformities of the perforated cases were even higher than that of the conventional case. This is because the perforations lead to higher oxygen concentration only in the local region. Moreover, convective transfer is insufficient due to the low pressure difference between adjacent channels. Consequently, this contributes to improved performance but causes a more uneven distribution. However, as SRc increased, the non-uniformity in the perforated cases decreased more significantly than in the conventional case. This is due to the enhanced convective transfer through the perforations, resulting from the increased pressure difference between adjacent channels. Furthermore, the offset case consistently exhibited lower non-uniformity compared to the under-channel perforated case. In the offset case, the flow velocity also increased in the under-rib region covered by the GDL, which facilitated more effective oxygen transport to this region. As a result, the offset case presented a more uniform distribution of the oxygen concentration overall, which became slightly more even with increasing SRc.

4. Conclusions

In this study, the effects of the presence and location of perforations in the cathode GDL on the electrochemical performance of the PEMFC were investigated under varying stoichiometric ratios. The presence of perforations facilitated local liquid removal and oxygen supply, leading to improved performance compared to the conventional GDL. However, it also caused an uneven oxygen distribution. As the perforations were offset toward the rib, the velocity in the under-rib region covered by the GDL slightly increased. This resulted in a more uniform oxygen distribution and enhanced PEMFC performance. Furthermore, the influence of the perforation became more pronounced at higher flow rates. At an SRc of 1.2, the performance increased by only 3.02% in the under-channel perforated case and 3.11% in the offset case, compared to the conventional case. In contrast, at an SRc of 3.0, the performance improvements were 4.72% and 5.29% for the under-channel and offset cases, respectively.
This study suggests that the perforation location can affect both PEMFC performance and the uniformity of internal oxygen distribution. Future work will explore the effects of more diverse perforation placements.

Author Contributions

Conceptualization, D.K.S., J.S., S.J.B. and G.Y.C.; methodology, D.K.S., J.S. and S.J.B.; software, D.K.S., G.H.K. and J.S.; validation, D.K.S.; formal analysis, D.K.S., G.H.K. and J.S.; investigation, G.H.K.; resources, G.Y.C.; data curation, D.K.S. and G.H.K.; writing—original draft preparation, D.K.S. and G.H.K.; writing—review and editing, G.Y.C.; visualization, D.K.S. and J.S.; supervision, S.J.B. and G.Y.C.; project administration, G.Y.C.; funding acquisition, S.J.B. and G.Y.C. All authors have read and agreed to the published version of the manuscript.

Funding

This work was supported by the National Research Foundation of Korea (NRF) grant funded by the Korea government (MSIT) (no. RS-2023-00213741). This research was supported by the Korean Institute for Advancement of Technology (KIAT) grant funded by the Korea Government (MOTIE) (RS-2024-00435841, Human Resource Development Program for Industrial Innovation (Global)). This paper was supported by the Korea Institute for Advancement of Technology (KIAT) grant funded by the Korea Government (MOTIE) (P0017120, The Competency Development Program for Industry Specialist). This research was supported by a grant (H2409002) from the Gyeonggi Technology Development Program funded by Gyeonggi Province. This research was supported by the Industrial Technology Innovation Program (RS-2024-00442824), funded by the Ministry of Trade, Industry and Energy (MOTIE) and the Korea Institute for Advancement of Technology (KIAT).

Data Availability Statement

The data presented in this study are available on request from the corresponding author. The data are not publicly available due to privacy.

Conflicts of Interest

The authors declare no conflict of interest.

Abbreviations

CLCatalyst layer
GDLGas diffusion layer
MPLMicroporous layer
PEMFCProton exchange membrane fuel cell
SRcStoichiometric ratio on the cathode side

References

  1. O’Hayre, R.; Cha, S.-W.; Colella, W.; Prinz, F.B. Fuel Cell Fundamentals; John Wiley & Sons: Hoboken, NJ, USA, 2016. [Google Scholar]
  2. Jang, G.-E.; Cho, G.-Y. Effects of Ag Current Collecting Layer Fabricated by Sputter for 3D-Printed Polymer Bipolar Plate of Ultra-Light Polymer Electrolyte Membrane Fuel Cells. Sustainability 2022, 14, 2997. [Google Scholar] [CrossRef]
  3. Yoo, H.J.; Cho, G.Y. Influences of Flow Channel on Electrochemical Characteristics of Polymer Electrolyte Fuel Cells Humidified with NaCl Contained H2O. Sustainability 2023, 15, 2415. [Google Scholar] [CrossRef]
  4. Hong, K.W.; Kwon, Y.R.; Song, D.K.; Jung, D.Y.; Kang, B.K.; Kwon, S.K.; Ryu, S.; Cho, G.Y. Fabrication and Characterization of Pt-Pr6O11 Nano Cathode Electrode for Polymer Electrolyte Membrane Fuel Cells via Co-Sputtering Method. Sustainability 2024, 17, 198. [Google Scholar] [CrossRef]
  5. Jung, D.Y.; Song, D.K.; Kim, J.S.; Lee, S.H.; Min, G.W.; Son, J.H.; Cho, G.Y. Numerical Investigation of Effects of Obstacles in Flow Channels and Depth of Flow Channels for PEMFCs. Sustainability 2024, 16, 10144. [Google Scholar] [CrossRef]
  6. Kang, B.G.; Kwon, Y.R.; Hong, K.W.; Kwon, S.K.; Lee, H.M.; Song, D.K.; Jeon, J.W.; Jung, D.Y.; Go, D.; Cho, G.Y. Performance Improvement of Proton Exchange Membrane Fuel Cells with a TiO2 Sputtered Gas Diffusion Layer Under Low-Humidity Conditions. Energies 2025, 18, 1525. [Google Scholar] [CrossRef]
  7. Jing, S.-Y.; Sun, Z.Y.; Yang, L.; Wang, Y. Effects of porosity and porosity distribution in gas diffusion layer on the performances of proton exchange membrane fuel cell. J. Power Sources 2024, 613, 234957. [Google Scholar] [CrossRef]
  8. Kahveci, E.E.; Taymaz, I. An Investigation of GDL Porosity on PEM Fuel Cell Performance. Chem. Eng. Trans. 2014, 42, 37–42. [Google Scholar] [CrossRef]
  9. Feser, J.P.; Prasad, A.K.; Advani, S.G. Experimental characterization of in-plane permeability of gas diffusion layers. J. Power Sources 2006, 162, 1226–1231. [Google Scholar] [CrossRef]
  10. Zhang, J.; Xuan, D.; Liu, S.; Chen, C. Influence and Optimization of Gas Diffusion Layer Porosity Distribution along the Flow Direction on the Performance of Proton Exchange Membrane Fuel Cells. ACS Omega 2024, 9, 239–251. [Google Scholar] [CrossRef]
  11. Son, J.; Um, S.; Kim, Y.-B. Numerical analysis of the effect of anisotropic gas diffusion layer permeability on polymer electrolyte membrane fuel cell performance with various channel types. Fuel 2021, 289, 119888. [Google Scholar] [CrossRef]
  12. Kakaee, A.H.; Molaeimanesh, G.R.; Garmaroudi, M.H.E. Impact of PTFE distribution across the GDL on the water droplet removal from a PEM fuel cell electrode containing binder. Int. J. Hydrogen Energy 2018, 43, 15481–15491. [Google Scholar] [CrossRef]
  13. Calili-Cankir, F.; Can, E.M.; Ingham, D.B.; Hughes, K.J.; Ma, L.; Pourkashanian, M.; Lyth, S.M.; Ismail, M.S. Patterned hydrophobic gas diffusion layers for enhanced water management in polymer electrolyte fuel cells. Chem. Eng. J. 2024, 484, 149711. [Google Scholar] [CrossRef]
  14. Sim, J.; Kang, M.; Min, K. Effects of porosity gradient and average pore size in the in-plane direction and disposition of perforations in the gas diffusion layer on the performance of proton exchange membrane fuel cells. J. Power Sources 2022, 544, 231912. [Google Scholar] [CrossRef]
  15. Lin, P.; Sun, J.; He, C.; Wu, M.; Zhao, T. Quadrilateral-Patterned Perforated Gas Diffusion Layers Boost the Performance of Fuel Cells. ACS Energy Lett. 2024, 9, 1710–1716. [Google Scholar] [CrossRef]
  16. Zhang, H.; Zhang, L.; Zhang, Y.; Hou, Z.; Liu, J. Effect of Gas Diffusion Layer Notch Arrangement and Gradient Depth on the Performance of Proton Exchange Membrane Fuel Cells in the Serpentine Flow Field. ACS Omega 2023, 8, 10191–10201. [Google Scholar] [CrossRef] [PubMed]
  17. Wang, X.; Chen, S.; Fan, Z.; Li, W.; Wang, S.; Li, X.; Zhao, Y.; Zhu, T.; Xie, X. Laser-perforated gas diffusion layer for promoting liquid water transport in a proton exchange membrane fuel cell. Int. J. Hydrogen Energy 2017, 42, 29995–30003. [Google Scholar] [CrossRef]
  18. Fang, W.-Z.; Tang, Y.-Q.; Chen, L.; Kang, Q.-J.; Tao, W.-Q. Influences of the perforation on effective transport properties of gas diffusion layers. Int. J. Heat Mass Transf. 2018, 126, 243–255. [Google Scholar] [CrossRef]
  19. Yin, B.; Xu, S.; Yang, S.; Dong, F. Influence of Microelliptical Groove Gas Diffusion Layer (GDL) on Transport Behavior of Proton Exchange Membrane Fuel Cell (PEMFC). Int. J. Heat Mass Transf. 2021, 180, 121793. [Google Scholar] [CrossRef]
  20. Wang, Y.; Zhang, P.; Gao, Y.; He, W.; Zhao, Y.; Wang, X. Optimal design of cathode gas diffusion layer with arrayed grooves for performance enhancement of a PEM fuel cell. Renew. Energy 2022, 199, 697–709. [Google Scholar] [CrossRef]
  21. Sun, S.-F.; Sun, Z.Y. Water distribution and transmission within perforated gas diffusion layer and layered gas diffusion layer of a proton exchange membrane fuel cell. J. Power Sources 2025, 643, 237024. [Google Scholar] [CrossRef]
  22. Fluent, A. Ansys Fluent Theory Guide; Ansys Inc.: Canonsburg, PA, USA, 2011; Volume 15317. [Google Scholar]
  23. Jiao, K.; Li, X. Water transport in polymer electrolyte membrane fuel cells. Prog. Energy Combust. Sci. 2011, 37, 221–291. [Google Scholar] [CrossRef]
  24. Son, J.; Um, S.; Kim, Y.-B. Relationship between number of turns of serpentine structure with metal foam flow field and polymer electrolyte membrane fuel cell performance. Renew. Energy 2022, 188, 372–383. [Google Scholar] [CrossRef]
  25. Xing, L.; Mamlouk, M.; Kumar, R.; Scott, K. Numerical investigation of the optimal Nafion® ionomer content in cathode catalyst layer: An agglomerate two-phase flow modelling. Int. J. Hydrogen Energy 2014, 39, 9087–9104. [Google Scholar] [CrossRef]
  26. Li, S.; Yuan, J.; Xie, G.; Sundén, B. Effects of agglomerate model parameters on transport characterization and performance of PEM fuel cells. Int. J. Hydrogen Energy 2018, 43, 8451–8463. [Google Scholar] [CrossRef]
  27. Wang, B.; Xie, B.; Xuan, J.; Jiao, K. AI-based optimization of PEM fuel cell catalyst layers for maximum power density via data-driven surrogate modeling. Energy Convers. Manag. 2020, 205, 112460. [Google Scholar] [CrossRef]
  28. Yoo, B.; Lim, K.; Salihi, H.; Ju, H. A parametric study on the performance requirements of key fuel cell components for the realization of high-power automotive fuel cells. Int. J. Heat Mass Transf. 2022, 186, 122477. [Google Scholar] [CrossRef]
  29. Lampinen, M.J.; Fomino, M. Analysis of Free Energy and Entropy Changes for Half-Cell Reactions. J. Electrochem. Soc. 1993, 140, 3537–3546. [Google Scholar] [CrossRef]
  30. Zhang, G.; Jiao, K. Three-dimensional multi-phase simulation of PEMFC at high current density utilizing Eulerian-Eulerian model and two-fluid model. Energy Convers. Manag. 2018, 176, 409–421. [Google Scholar] [CrossRef]
  31. Kong, Y.; Liu, M.; Hu, H.; Hou, Y.; Vesztergom, S.; Gálvez-Vázquez, M.d.J.; Montiel, I.Z.; Kolivoška, V.; Broekmann, P. Cracks as Efficient Tools to Mitigate Flooding in Gas Diffusion Electrodes Used for the Electrochemical Reduction of Carbon Dioxide. Small Methods 2022, 6, 2200369. [Google Scholar] [CrossRef]
  32. Son, J.; Lee, D.; Um, S.; Kim, Y.-B. Effect of stacking pressure on the performance of polymer electrolyte membrane fuel cell with various channel types. Energy Convers. Manag. 2021, 232, 113803. [Google Scholar] [CrossRef]
  33. Chen, C.; Wang, C.; Zhang, Z. Numerical investigation of the water transport and performance of proton exchange membrane fuel cell with an imitating river flow field. Energy Convers. Manag. 2023, 276, 116532. [Google Scholar] [CrossRef]
  34. Peron, J.; Mani, A.; Zhao, X.; Edwards, D.; Adachi, M.; Soboleva, T.; Shi, Z.; Xie, Z.; Navessin, T.; Holdcroft, S. Properties of Nafion® NR-211 membranes for PEMFCs. J. Membr. Sci. 2010, 356, 44–51. [Google Scholar] [CrossRef]
  35. Gostick, J.T.; Fowler, M.W.; Pritzker, M.D.; Ioannidis, M.A.; Behra, L.M. In-plane and through-plane gas permeability of carbon fiber electrode backing layers. J. Power Sources 2006, 162, 228–238. [Google Scholar] [CrossRef]
  36. Xing, L.; Das, P.K.; Song, X.; Mamlouk, M.; Scott, K. Numerical analysis of the optimum membrane/ionomer water content of PEMFCs: The interaction of Nafion® ionomer content and cathode relative humidity. Appl. Energy 2015, 138, 242–257. [Google Scholar] [CrossRef]
  37. Springer, T.E.; Zawodzinski, T.A.; Gottesfeld, S. Polymer Electrolyte Fuel Cell Model. J. Electrochem. Soc. 1991, 138, 2334. [Google Scholar] [CrossRef]
  38. Ye, Q.; Nguyen, T.V. Three-Dimensional Simulation of Liquid Water Distribution in a PEMFC with Experimentally Measured Capillary Functions. J. Electrochem. Soc. 2007, 154, B1242. [Google Scholar] [CrossRef]
  39. Mann, R.F.; Amphlett, J.C.; Peppley, B.A.; Thurgood, C.P. Henry’s Law and the solubilities of reactant gases in the modelling of PEM fuel cells. J. Power Sources 2006, 161, 768–774. [Google Scholar] [CrossRef]
  40. Fan, L.; Zhang, G.; Jiao, K. Characteristics of PEMFC operating at high current density with low external humidification. Energy Convers. Manag. 2017, 150, 763–774. [Google Scholar] [CrossRef]
  41. Wang, Y.; Sun, Z.Y.; Yang, L. Enhancement effects of the obstacle arrangement and gradient height distribution in serpentine flow-field on the performances of a PEMFC. Energy Convers. Manag. 2022, 252, 115077. [Google Scholar] [CrossRef]
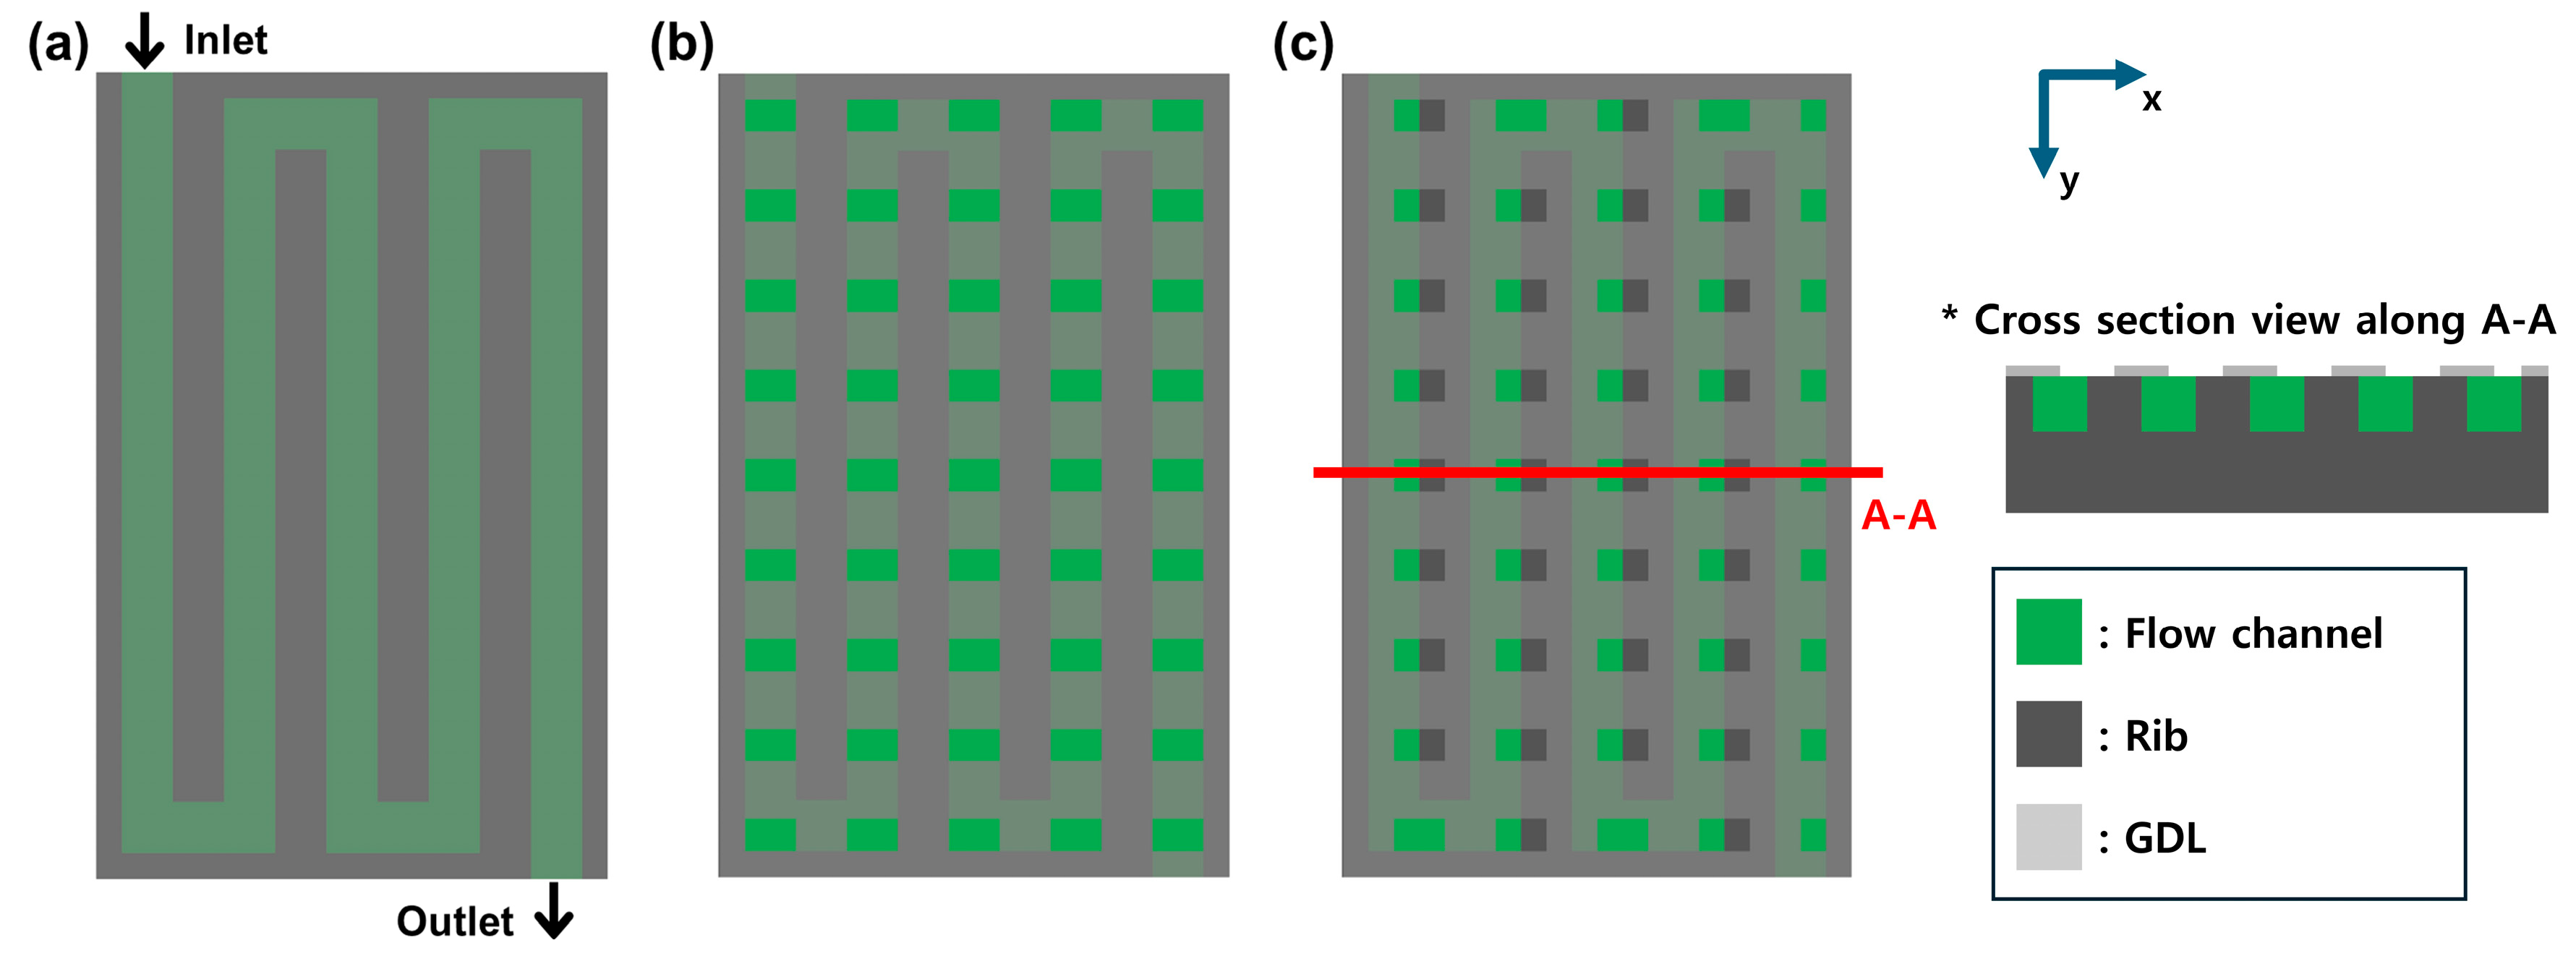
Figure 1. Bipolar plates on the cathode side with (a) conventional GDL, (b) GDL with perforations under channel, and (c) GDL with perforations offset by 0.4 mm, * including cross section view along A-A.
Applsci 15 08804 g001
Figure 2. Polarization curves based on simulation and experimental data.
Applsci 15 08804 g002
Figure 3. Polarization curves of GDLs with different perforation configurations under cathode stoichiometric ratio (SRc) of 2.0.
Applsci 15 08804 g003
Figure 4. Velocity contours at the midplane of the GDL on the cathode side under 0.5 V and cathode stoichiometric ratio (SRc) of 2.0 for (a) conventional GDL, (b) GDL with perforations under channel, and (c) GDL with perforations offset by 0.4 mm.
Applsci 15 08804 g004
Figure 5. Liquid saturation contours at the CL–MPL interface on the cathode side under 0.5 V and cathode stoichiometric ratio (SRc) of 2.0 for (a) conventional GDL case, (b) GDL with perforations under channel case, and (c) GDL with perforations offset by 0.4 mm case; oxygen concentration contours for (d) conventional GDL case, (e) GDL with perforations under channel case, and (f) GDL with perforations offset by 0.4 mm case.
Applsci 15 08804 g005
Figure 6. Current density contours at the CL–MPL interface on the cathode side under 0.5 V and cathode stoichiometric ratio (SRc) of 2.0 for (a) conventional GDL case, (b) GDL with perforations under channel case, and (c) GDL with perforations offset by 0.4 mm case.
Applsci 15 08804 g006
Figure 7. Polarization curves of different GDL perforation configurations for (a) the cathode stoichiometric ratio (SRc) of 1.2 cases and (b) the SRc of 3.0 cases.
Applsci 15 08804 g007
Figure 8. Velocity contours at the midplane of the GDL on the cathode side for (a,b) the cathode stoichiometric ratio (SRc) of 1.2 cases and (c,d) the SRc 3.0 cases on the cathode side under 0.5 V: (a,c) GDL with perforations under channel cases and (b,d) GDL with perforations offset by 0.4 mm cases.
Applsci 15 08804 g008
Figure 9. Liquid saturation contours at the cathode CL–MPL interface under 0.5 V for (ac) the cathode stoichiometric ratio (SRc) of 1.2 cases and (gi) the SRc 3.0 cases; oxygen concentration contours for (df) the SRc 1.2 cases and (jl) the SRc 3.0 cases: (a,d,g,j) conventional GDL cases, (b,e,h,k) GDL with perforations under channel cases, and (c,f,i,l) GDL with perforations offset by 0.4 mm cases.
Applsci 15 08804 g009
Figure 10. Non-uniformity of oxygen concentration at the cathode CL–MPL interface for different perforation configurations and different stoichiometric ratios under 0.5 V.
Applsci 15 08804 g010
Table 1. Previous studies that numerically analyzed the effects of perforated GDLs on mass transport characteristics in PEMFCs.
Main AuthorScopeMethodologyMain Findings
Wang (2017) [17] Enhancing liquid water transport with laser-perforated GDL designs.Experiment and 3D level set simulation.Optimal perforation size improves drainage and avoids flooding.
Fang (2018) [18] Transport properties evaluation of perforated GDL.Multiple-relaxation time lattice Boltzmann based on stochastic reconstructed microstructures. Perforations increase permeability and diffusivity but decrease thermal conductivity.
Yin (2021) [19] Transport properties improvement with microelliptical groove GDLs.3D numerical modeling with parametric variation. Elliptical grooves improve water removal and oxygen supply within the GDL.
Wang (2022) [20] Grooved GDL design optimization.3D multiphase CFD simulation with various parameters.Nonuniformly arrayed grooves facilitates drainage and uniform distribution.
Zhang (2023) [16] Influence of notch arrangement and gradient on water transport.3D simulations under steady and transient conditions.Optimal notch gradient and arrangement improve drainage and reduce local flooding.
Lin (2024) [15] Analysis of quadrilaterally patterned perforations on GDLs.Experiment and multiscale simulations.Vertically arranged perforations reduce liquid saturation and boost performance.
Sun (2025) [21] Investigation of water transport behavior within the GDLs.3D multiphase simulation validated with experiment.Smaller holes with proper pitch improve drainage under various conditions.
Table 2. Geometrical parameters of PEMFC model.
Geometrical DimensionsValueUnit
Reaction area1cm2
Sizes of perforations0.8 × 0.5mm2
Gaps between perforations0.9mm
Width of channel0.8mm
Width of rib0.8mm
Thickness of bipolar plate 2mm
Thickness of GDL160µm
Thickness of MPL90µm
Thickness of CL5µm
Thickness of membrane25.4µm
Table 3. Source terms in the model [23,24,25].
Source TermDescriptionUnit
Mass S m a s s = S H 2 S v l M H 2 O S v d S O 2 S v l M H 2 O S v d   S v l                                                                 A n o d e   C L                                 C a t h o d e   C L                             M P L ,   G D L ,   c h a n n e l kg m−3 s−1
Momentum S m o m = μ K u + β ρ ε 1.5 K u u    C L ,   M P L ,   G D L kg m−2 s−2
Hydrogen S H 2 = M H 2 j a 2 F    A n o d e   C L kg m−3 s−1
Oxygen S O 2 = M O 2 j c 4 F    C a t h o d e   C L kg m−3 s−1
Vapor S H 2 O = S v l M H 2 O S v d S v l                                                   C L                                                                 M P L ,   G D L ,   c h a n n e l kg m−3 s−1
Energy S T = i p σ e f f , p M e m b r a n e     η a T S a 2 F j a + i e 2 σ e f f , e + i p 2 σ e f f , p + h l g S v l       A n o d e   C L η c T S c 4 F j a + i e 2 σ e f f , e + i p 2 σ e f f , p + h l g S v l C a t h o d e   C L i e 2 σ e f f , e + h l g S v l M P L ,   G D L i e 2 σ e f f , e B i p o l a r   p l a t e W m−3
Electron S e = j a j c   A n o d e   C L         C a t h o d e   C L A m−3
Proton S p = j a j c   A n o d e   C L         C a t h o d e   C L A m−3
Liquid water S l = S v l    C L ,   M P L ,   G D L ,   c h a n n e l kg m−3 s−1
Dissolved water S d w = S v d                   S v d + j c 2 F         A n o d e   C L         C a t h o d e   C L mol m−3
Water condensation and evaporation S v l = γ c o n d ε 1 s M H 2 O P H 2 O P s a t / ( R T ) P H 2 O P s a t γ e v a p ε s M H 2 O   P H 2 O P s a t / ( R T )                         P H 2 O < P s a t kg m−3 s−1
Dissolved water adsorption and desorption S v d = γ a d s ρ m e m E W λ e q λ γ d e s ρ m e m E W λ e q λ   λ e q λ λ e q < λ mol m−3
Table 4. Parameters and properties of the model.
ParameterValueUnit
Anode transfer coefficient [26,27], α a 0.5-
Cathode transfer coefficient [26,27], α c 1.0-
Reference H2 concentration [26,27], C H 2 r e f 56.4mol m−3
Reference O2 concentration [26,27], C O 2 r e f 3.39mol m−3
Activation energy of hydrogen oxidation [28], E a a c t 10,000J mol−1
Activation energy of oxygen reduction [28], E c a c t 70,000J mol−1
Entropy change by hydrogen oxidation [29], S a 0.104J mol−1 K−1
Entropy change by oxygen reduction [29], S c −326.36J mol−1 K−1
Electrical conductivity of BPP, GDL, MPL, CL [30], σ B P P ,   σ G D L ,   σ M P L ,   σ C L   20,000, 8000, 5000, 5000S m−1
Thermal conductivity of BPP, MPL, CL, membrane [30], k B P P , k M P L , k C L , k m e m 120, 1, 1, 0.16W m−1 K−1
Through-plane thermal conductivity of GDL [30], k G D L   1.7W m−1 K−1
In-plane thermal conductivity of GDL [30], k G D L   21W m−1 K−1
Porosity of GDL, MPL [31,32], ε G D L ,   ε M P L 0.8, 0.7-
Permeability of GDL, MPL, CL [30], K G D L , K M P L ,   K C L 1   ×   10−11, 1   ×   10−12, 1   ×   10−13m2
Contact angle of GDL, MPL, CL [30], θ G D L ,   θ M P L ,   θ C L 110, 130, 95deg
Surface tension [33], σ   0.0625N m−1
Latent heat of water phase change [24], h l g   2.36   ×   106J kg−1
Dry membrane density [34], ρ m   1970kg m−3
Membrane equivalent weight [34], E W   1.050kg mol−1
Condensation rate [23], γ c o n d 100s−1
Evaporation rate [23], γ e v a p 100s−1
Inertial coefficient [35], β 2.88   ×   10−6m−1
Platinum loading [26], m p t 0.4mg cm−2
Platinum density [26], ρ p t 21,450kg m−3
Carbon loading, m C 0.27mg cm−2
Carbon density [26], ρ C 1800kg m−3
Agglomerate radius [26], r a g g 0.2µm
Ionomer volume fraction of catalyst layer [26], L i 0.4-
Ionomer volume fraction of agglomerate [26], L i , a g g 0.5-
Table 5. Additional equations used in the model.
DescriptionEquationUnit
Open circuit voltage [24] V o c = 1.229 0.0008456 T 298.15 + R T 2 F l n P H 2 P O 2 1 / 2 V
Overpotential [24] η a = ϕ s ϕ e ,       η c = ϕ s ϕ e V o c V
Anode volumetric current density [11,36] j a = 1 s a e f f i o , a P H 2 C H 2 r e f H H 2 0.5 exp α a F η a R T e x p α c F η a R T A m−3
Cathode reaction rate [11,36] k c = α e f f i 0 , c 4 F 1 ε C L C O 2 r e f exp α a F η c R T + e x p α c F η c R T A m−3
Anode exchange current density [11,28] i 0 , a = 100 exp E a a c t R 1 T 1 353 A m−2
Cathode exchange current density [11,28] i 0 , c = 5 × 10 4 exp E c a c t R 1 T 1 353 A m−2
Proton conductivity [37] σ p = 0.514 λ 0.326 exp 1268 1 303 1 T S m−1
Effective proton conductivity [26] σ e f f , p = σ p             L i 1.5 σ p     M e m b r a n e C L                                 S m−1
Effective electrical conductivity [26] σ e f f , e = 1 ε L i 1.5 σ e 1 ε 1.5 σ e                   σ e                                                         C L                                             M P L ,   G D L                 B i p o l a r   p l a t e S m−1
H2 and H2O diffusivity
in the anode side [38]
D H 2 , a = D H 2 O , a = 1.055 × 10 4 T 333 1.75 101,325 P m2 s−1
O2 diffusivity
in the cathode side [38]
D O 2 , c = 0.2652 × 10 4 T 333 1.75 101,325 P m2 s−1
H2O diffusivity
in the cathode side [38]
D H 2 O , c = 0.2982 × 10 4 T 333 1.75 101,325 P m2 s−1
Effective gas diffusivity [11] D e f f , i = ε 1.5 1 s 1.5 D i m2 s−1
Henry’s constant for H2 in ionomer [39] D O 2 , i = 3.1 × 10 7 exp 2768 T Pa m3 mol−1
Henry’s constant for O2 in ionomer [39] D O 2 ω = 1.98 × 10 9 μ l @ 293 K μ l T 293 Pa m3 mol−1
Saturation pressure [23] P s a t = 10 2.1794 + 0.02953 ( T 273.15 ) 9.1837 × 10 5 T 273.15 2 + 1.4454 × 10 7 T 273.15 3   Pa
water activity [23] a = P H 2 O P s a t + 2 s -
Liquid velocity [38] u l = K r l μ g K r g μ l u g m s−1
Relative permeability [38] K r l = s 3 ,       K r g = 1 s 3 m2
Capillary pressure [40] P c = σ cos θ ε K 0.5 ( 1.417 s 2.120 s 2 + 1.263 s 3 ) Pa
Liquid water diffusivity [38] D l = K K r l μ l d P c d s   m2 s−1
Equilibrium water content [23,37] λ e q = 0.043 + 17.81 a 39.85 a 2 + 36 a 3 14 + 1.4 a 1                                                                       16.8                                                                                                                     a 1                                             1 < a 3                             a > 3                                             -
Electro-osmotic drag coefficient [37] n d = 2.5 λ 22 -
Dissolved water diffusivity [23,37] D d w = 2.693 × 10 10 λ 2 D d w 0 0.87 3 λ + 2.95 λ 2 2 < λ 3 D d w 0 2.95 4 λ + 1.64 λ 3 3 < λ 4 D d w 0 2.563 0.33 λ + 0.0264 λ 2 0.000671 λ 3 λ > 4
w h e r e     D d w 0 = 10 10 exp 2416 1 303 1 T
m2 s−1
Adsorption rate [25] γ a d s = 1.14 × 10 5 t C L λ V ω V m + λ V ω exp 2416 1 303 1 T s−1
Desorption rate [25] γ d e s = 4.59 × 10 5 t C L λ V ω V m + λ V ω exp 2416 1 303 1 T s−1
Table 6. Cathode-side agglomerate model equations [26].
DescriptionEquationUnit
Cathode volumetric current density j c = 4 F P O 2 H O 2 1 ξ 1 ε C L k c + r a g g + δ i + δ ω r a g g δ i a a g g , i D O 2 , i + δ ω a a g g , ω D O 2 , ω 1     A m−3
Pt mass ratio of Pt/C particles M R P t = m P t m P t + m c -
Pt/C volume fraction of catalyst layer L p t / C = m P t t C L 1 ρ P t + 1 ρ C 1 M R P t M R P t -
Active surface area a e f f = 10 3 m P t t C L 222.79 M R P t 3 158.57 M R P t 2 201.53 M R P t + 159.5 m−1
CL porosity ε C L = 1 L P t / C L i -
Number of agglomerate particles per CL volume N a g g = 3 L P t / C 4 π r a g g 3 1 L i , a g g -
Ionomer film thickness δ i = r a g g L i 1 L i , a g g L P t / C L i , a g g + 1 3 1 m
Water film thickness δ ω = r a g g + δ i 3 + 3 s ε C L 4 π N a g g 3 r a g g + δ i m
Effective agglomerate surface area of ionomer film a a g g , i = 3 L P t / C   ε C L r a g g 3 1 L i , a g g r a g g + δ i 2 m−1
Effective agglomerate surface area of water film a a g g , ω = 3 L P t / C   ε C L r a g g 3 1 L i , a g g r a g g + δ i + δ ω 2 m−1
Dissolved O2 diffusivity
in ionomer film [39]
D O 2 , i = 3.1 × 10 7 exp 2768 T m2 s−1
Dissolved O2 diffusivity
in water film [39]
D O 2 ω = 1.98 × 10 9 μ l @ 293 K μ l T 293 m2 s−1
Thiele modulus Φ = r a g g 3 k c L i , a g g 1.5 D O 2 , i -
Effectiveness factor ξ = 1 Φ 1 tanh 3 Φ 1 3 Φ -
Table 7. Computational data for each GDL perforation configuration at 0.5 V.
Conventional GDLGDL with Perforations Under ChannelGDL with Perforations Offset by 0.4 mmUnit
Average oxygen concentration in the cathode CL0.95591.0271.032mol/m3
Current density0.94770.98670.9898A/cm2
Improvement-4.124.44%
Table 8. Computational data for each GDL perforation configuration under different stoichiometric ratios at 0.5 V.
Conventional GDLGDL with Perforations Under ChannelGDL with Perforations Offset by 0.4 mmUnit
Average oxygen concentration in the cathode CL at SRc = 1.20.74600.78570.7852mol/m3
Current density at SRc = 1.20.78690.81070.8114A/cm2
Improvement at SRc = 1.2-3.023.11%
Average oxygen concentration in the cathode CL at SRc = 3.01.12991.23311.2441mol/m3
Current density at SRc = 3.01.06121.11131.1173A/cm2
Improvement at SRc = 3.0-4.725.29%
Disclaimer/Publisher’s Note: The statements, opinions and data contained in all publications are solely those of the individual author(s) and contributor(s) and not of MDPI and/or the editor(s). MDPI and/or the editor(s) disclaim responsibility for any injury to people or property resulting from any ideas, methods, instructions or products referred to in the content.