Article

Presumptions for the Integration of Green Hydrogen and Biomethane Production in Wastewater Treatment Plants

by
Ralfas Lukoševičius
*,
Sigitas Rimkevičius
and
Raimondas Pabarčius
Lithuanian Energy Institute, Breslaujos St. 3, 44403 Kaunas, Lithuania
*
Author to whom correspondence should be addressed.
Appl. Sci. 2025, 15(13), 7417; https://doi.org/10.3390/app15137417
Submission received: 4 June 2025 / Revised: 22 June 2025 / Accepted: 27 June 2025 / Published: 2 July 2025
(This article belongs to the Special Issue Advances in New Sources of Energy and Fuels)

Abstract

Achieving climate neutrality goals is inseparable from the sustainable development of modern cities. Municipal wastewater treatment plants (WWTP) are among the starting points when moving cities to Net-zero Greenhouse Gas (GHG) emissions and climate neutrality. This study focuses on the analysis of the integration of green hydrogen (H2) and biomethane technologies in WWTPs, and on the impact of this integration on WWTPs’ energy neutrality. This study treats WWTP as an integrated energy system with certain inputs and outputs. Currently, such systems in most cases have a significantly negative energy balance, and, in addition, fossil fuel energy sources are used. Key findings highlight that the integration of green hydrogen production in WWTPs and the efficient utilization of electrolysis by-products can make such energy systems neutral or even positive. This study provides an analysis of the main technical presumptions for the successful integration of green hydrogen and biomethane production processes in WWTP. Furthermore, a case study of a real wastewater treatment plant is presented.

1. Introduction

Wastewater treatment is one of the biggest energy consumers in the public sector [1]. Municipal WWTPs consume 3% of the global electricity, indirectly contributing to CO2 emissions [2]. WWTPs are also the sources of direct carbon emissions (methane (CH4) and nitrous oxide (N2O)). The municipal wastewater sector accounts for up to 7% and 10% of anthropogenic CH4 and N2O emissions, respectively [3]. Municipal wastewater treatment plants are among the starting points when moving cities to Net-zero Greenhouse Gas emissions and climate neutrality.
Modern WWTPs should maintain a balance between three combined sustainability criteria, including wastewater quality, energy efficiency and GHG emissions [4].

1.1. EU Regulatory Environment

Directive (European Union (EU)) 2024/3019 of 27 November 2024 concerning urban wastewater treatment [5] sets the new binding objective for the energy neutrality of municipal WWTPs. Member States shall ensure that, at the national level, the total annual energy from renewable sources, as defined in Article 2(1) of Directive (EU) 2018/2001 [6] generated by urban WWTPs treating a load of 10,000 population equivalent (PE) and above, is equivalent to at least 70% of the total annual energy used by such plants by 31 December 2040, and 100% of the total annual energy used by such plants by 31 December 2045 [5].
The energy neutrality of WWTPs will also help to reduce the EU energy dependence, one of the objectives expressed in the European Commission (EC) “Repower EU” Plan [7]. It is also in line with Directive (EU) 2018/844 [8] and with Directive (EU) 2018/2001 [6], in which urban wastewater treatment sites are qualified as ‘go-to’ areas for renewables, which means a location that is recognized as particularly suitable for the installation of plants to produce energy from renewable sources [5].
Special attention must be paid to identify and utilize the potential for biogas production from sludge, the better use of the available surfaces in urban WWTPs for solar energy production, waste heat recovery and use in WWTPs or in district heating systems [5], and producing other renewable energy sources, especially focusing on green hydrogen.
The EC Delegated Regulation setting out detailed rules for the production of renewable liquid and gaseous transport fuels of non-biological origin [9] sets the rules for determining when electricity used for the production of green hydrogen can be considered fully renewable. Renewable hydrogen producers like municipal WWTPs are encouraged by this EU Regulation to produce the amount of renewable electricity required for the production of green hydrogen in renewable electricity generation facilities they own themselves [9].
The Hydrogen strategy for climate-neutral Europe, adopted in July 2020 by the EC [10], defines a strategic objective to install at least 40 GW of renewable hydrogen electrolyzers by 2030 and produce up to 10 million tons of renewable hydrogen in the EU.
The ‘Repower EU’ Plan [7] invites the immediate acceleration of clean energy transition and the diversification of the EU gas supply, and thus to minimize the impact of rising energy prices. Therefore, the European biogas and biomethane sectors are committed to delivering 35 billion m3 of sustainable biomethane by 2030, supporting the EU in achieving climate goals and energy security. The integration of biomethane and green hydrogen in Municipal wastewater treatment plants will contribute to achieving these ambitious EU goals.

1.2. Biomethane and Green Hydrogen in WWTPs: Situation Overview

The task of energy neutrality of a wastewater treatment plant is twofold: (1) increasing the energy efficiency of technological processes and reducing energy consumption; (2) increasing energy production in the WWTP itself and recovering energy from wastewater [5].
The specific electricity consumption depends on the size of WWTP, ranging from 37 to 96 kWhel/PE/a, with an average of 72 kWhel/PE/a [11]. The largest share of electricity consumed in WWTPs is for these processes—aeration (51%), centrifuges (10%), anaerobic digestion (AD) (9%), and pumping (8%) [12].
One of the most important tasks to increase energy production in the WWTP itself is to increase the production of biogas or biomethane. Biogas, which usually consists of 50–70% CH4 and 50–30% carbon dioxide (CO2) [13], can be used directly in the wastewater treatment plant for heat and electricity generation. In this case, biogenic CO2 formed during biogas production, and CO2 formed during biogas combustion in cogeneration or water heating boilers, are emitted into the atmosphere. Since biogenic CO2 constitutes about 30–50% [13] of the biogas volume, this means that large amounts of CO2 are emitted into the atmosphere unused.
A more efficient way to use biogas can be biogas upgrading, during which CO2 is separated from biogas and biomethane is produced. Biomethane can be used in the WWTP itself as a transport fuel or transferred to external users. This is most often done by injecting biomethane into the natural gas network. In this way, biomethane can be efficiently consumed in various processes—as a transport fuel, as a raw material for the chemical industry, or as an energy carrier for producing electricity, heat or cold. Also, the energy value of the biomethane produced in the WWTP and supplied to external customers can partially compensate, for example, the energy value of electricity purchased from the network, thus increasing the energy neutrality of the WWTP.
However, biogas upgrading does not solve the issue of biogenic CO2 utilization. Although biogenic CO2 separated in the biogas upgrading process can be used, for example, in liquefied form in the food or other industry, such a use is not widespread, at least at present due to the relatively high price of biogenic CO2. Another way of using CO2 in WWTPs is CO2 methanation, in order to increase the production of biomethane in the WWTP [13,14]. The methanation process requires green hydrogen, which can be produced in the WWTP.
Hydrogen production by electrolysis and CO2 methanation refer to the rapidly developing group of so-called Power-to-X technologies. Power-to-X processes can potentially transform hard-to-decarbonize sectors by converting renewable electricity into value-added products such as hydrogen, methane, ethylene, and others, and thereby substantially reduce carbon emissions [15]. Power-to-Gas processes, namely Power-to-Hydrogen and Power-to-Methane, represent some of the only options for seasonal electricity storage at the necessary capacities for a country that relies on renewable energy technologies [16]. CO2 methanation belongs to CO2-consuming technologies, taking into account the need for carbon capture and utilization in future GHG neutral energy systems and carbon neutrality [17], as well as the inevitable need to reduce emissions of the most important greenhouse gas, CO2, to achieve climate goals.
The next important task, closely related to the production of green hydrogen in WWTPs, is the increase in the production of green electricity in WWTPs. Most often, the literature examines the possibilities of solar [18,19] and wind [13,20] electricity production and their impact on energy and greenhouse gas balance. The area and location of the WWTP itself almost always limit this production [20,21,22]. Another method of green energy production found in the literature is hydropower from wastewater flow [23,24,25]. This is a more theoretical possibility in WWTPs, located in the lowlands, since the amount of electricity generated is small, and the capital investments are significant. The use of solar and wind electricity as variable energy sources necessitates the assessment and analysis of the use of electricity storage systems in WWTPs.
One of the most important challenges is the reduction of the cost of produced green hydrogen [26]. The development of green hydrogen in the EU is currently mainly based on political decisions. However, the EU operates in a global world market. Energy prices have a major impact on the competitiveness of the economy. As the EU competes with producers in the USA, Asia, especially China and India, South America, Russia, and other regions of the world and some of them have large fossil fuel resources or have not set ambitious climate change mitigation targets, it is important to ensure that green energy prices approach economically viable prices in the long term. Another way to protect the EU producers using sustainable energy is to apply regulatory measures, such as a border CO2 tax. However, the application of such measures is associated with certain problems, in particular the possibility of assessing the energy greenness of third-country producers fairly and independently.
In a WWTP, there is an opportunity to directly use the by-products of hydrogen production—oxygen (O2) and heat. The effective use of hydrogen production by-products in a WWTP can significantly contribute to reducing the cost of green hydrogen [13,27]. The most often found cases for integrating green hydrogen facilities in WWTPs include the use of these by-products or the methanation of biogas.
The literature most often analyzes the utilization cases of separate electrolysis products. The use of oxygen for aeration purposes is presented in articles [13,19]. The use of hydrogen for CO2 methanation is presented in articles [14,28]. The utilization of waste heat from electrolyzers is presented in articles [14,29]. However, there are not many articles that analyze the potential for the use of all three electrolysis products in WWTPs together.
In a series of articles [30,31,32,33], WWTP is analyzed as a technological system, the main input, output, and internal parameters of which are various quantitative and qualitative indicators of sewage, sludge and treated water—the amount of chemical substances, bacteriological contamination, fertilizer value, purification level, etc. The main goal of these models is to achieve the required quality of wastewater treatment.
In other works [13,34,35,36,37], the main goal of WWTP modeling is to reduce GHG emissions, including primarily carbon dioxide (CO2), methane (CH4), and nitrous oxide (N2O).
In most cases, the main amount of electricity is obtained from the grid, although efforts are made to ensure that the largest share is renewable electricity, obtained mainly from solar [18,19] and wind power [13,20] plants or combined solar-wind-hydro [21,38] sources.
The integration of green hydrogen and biomethane technologies in WWTP can provide synergy for the implementation of both above-mentioned goals, that is, increasing biomethane production in WWTP and reducing the cost of green hydrogen production. At the same time, this would also contribute to achieving the strategic goal of complete neutrality of WWTPs [5].

1.3. Aims and Objectives

Currently, there are not many articles that analyze urban WWTPs as an integrated energy system, aiming for complete energy neutrality of WWTPs. In this article, we fill this gap by presenting an analysis of a system that includes various possible renewable energy production methods in current and future WWTPs and presents a balance of energy production and consumption in the WWTP.
The innovativeness of this article is characterized by the fact that an analysis is presented in which the WWTP is viewed as an integrated energy system, which integrates the production of various types of energy and energy carriers, including electricity and thermal energy, biogas, biomethane and green hydrogen, hydropower, sludge gasification, wastewater heat recovery, and the use of by-products formed during green hydrogen production—oxygen and heat. An innovative approach for the selection of electrolyser power based on multiple technical criteria is also presented. The performed analysis of WWTP as an energy system will help to understand the requirements that must be met to achieve complete energy neutrality of WWTP.
The main questions raised and analyzed in this article are as follows:
  • What are the main presumptions for the successful integration of green hydrogen and biomethane technologies?
  • What is the relationship between the electrolyser capacity and the oxygen, hydrogen, and heat demand in a WWTP?
  • What is the relationship between the electrolyser capacity and the availability of green electricity?
  • What degree of energy neutrality can be achieved by integrating green hydrogen production into WWTP, and what other measures are needed to achieve complete energy neutrality of a WWTP?
  • In which external systems and in what way can the excess energy produced in WWTP be consumed?

2. Methodology

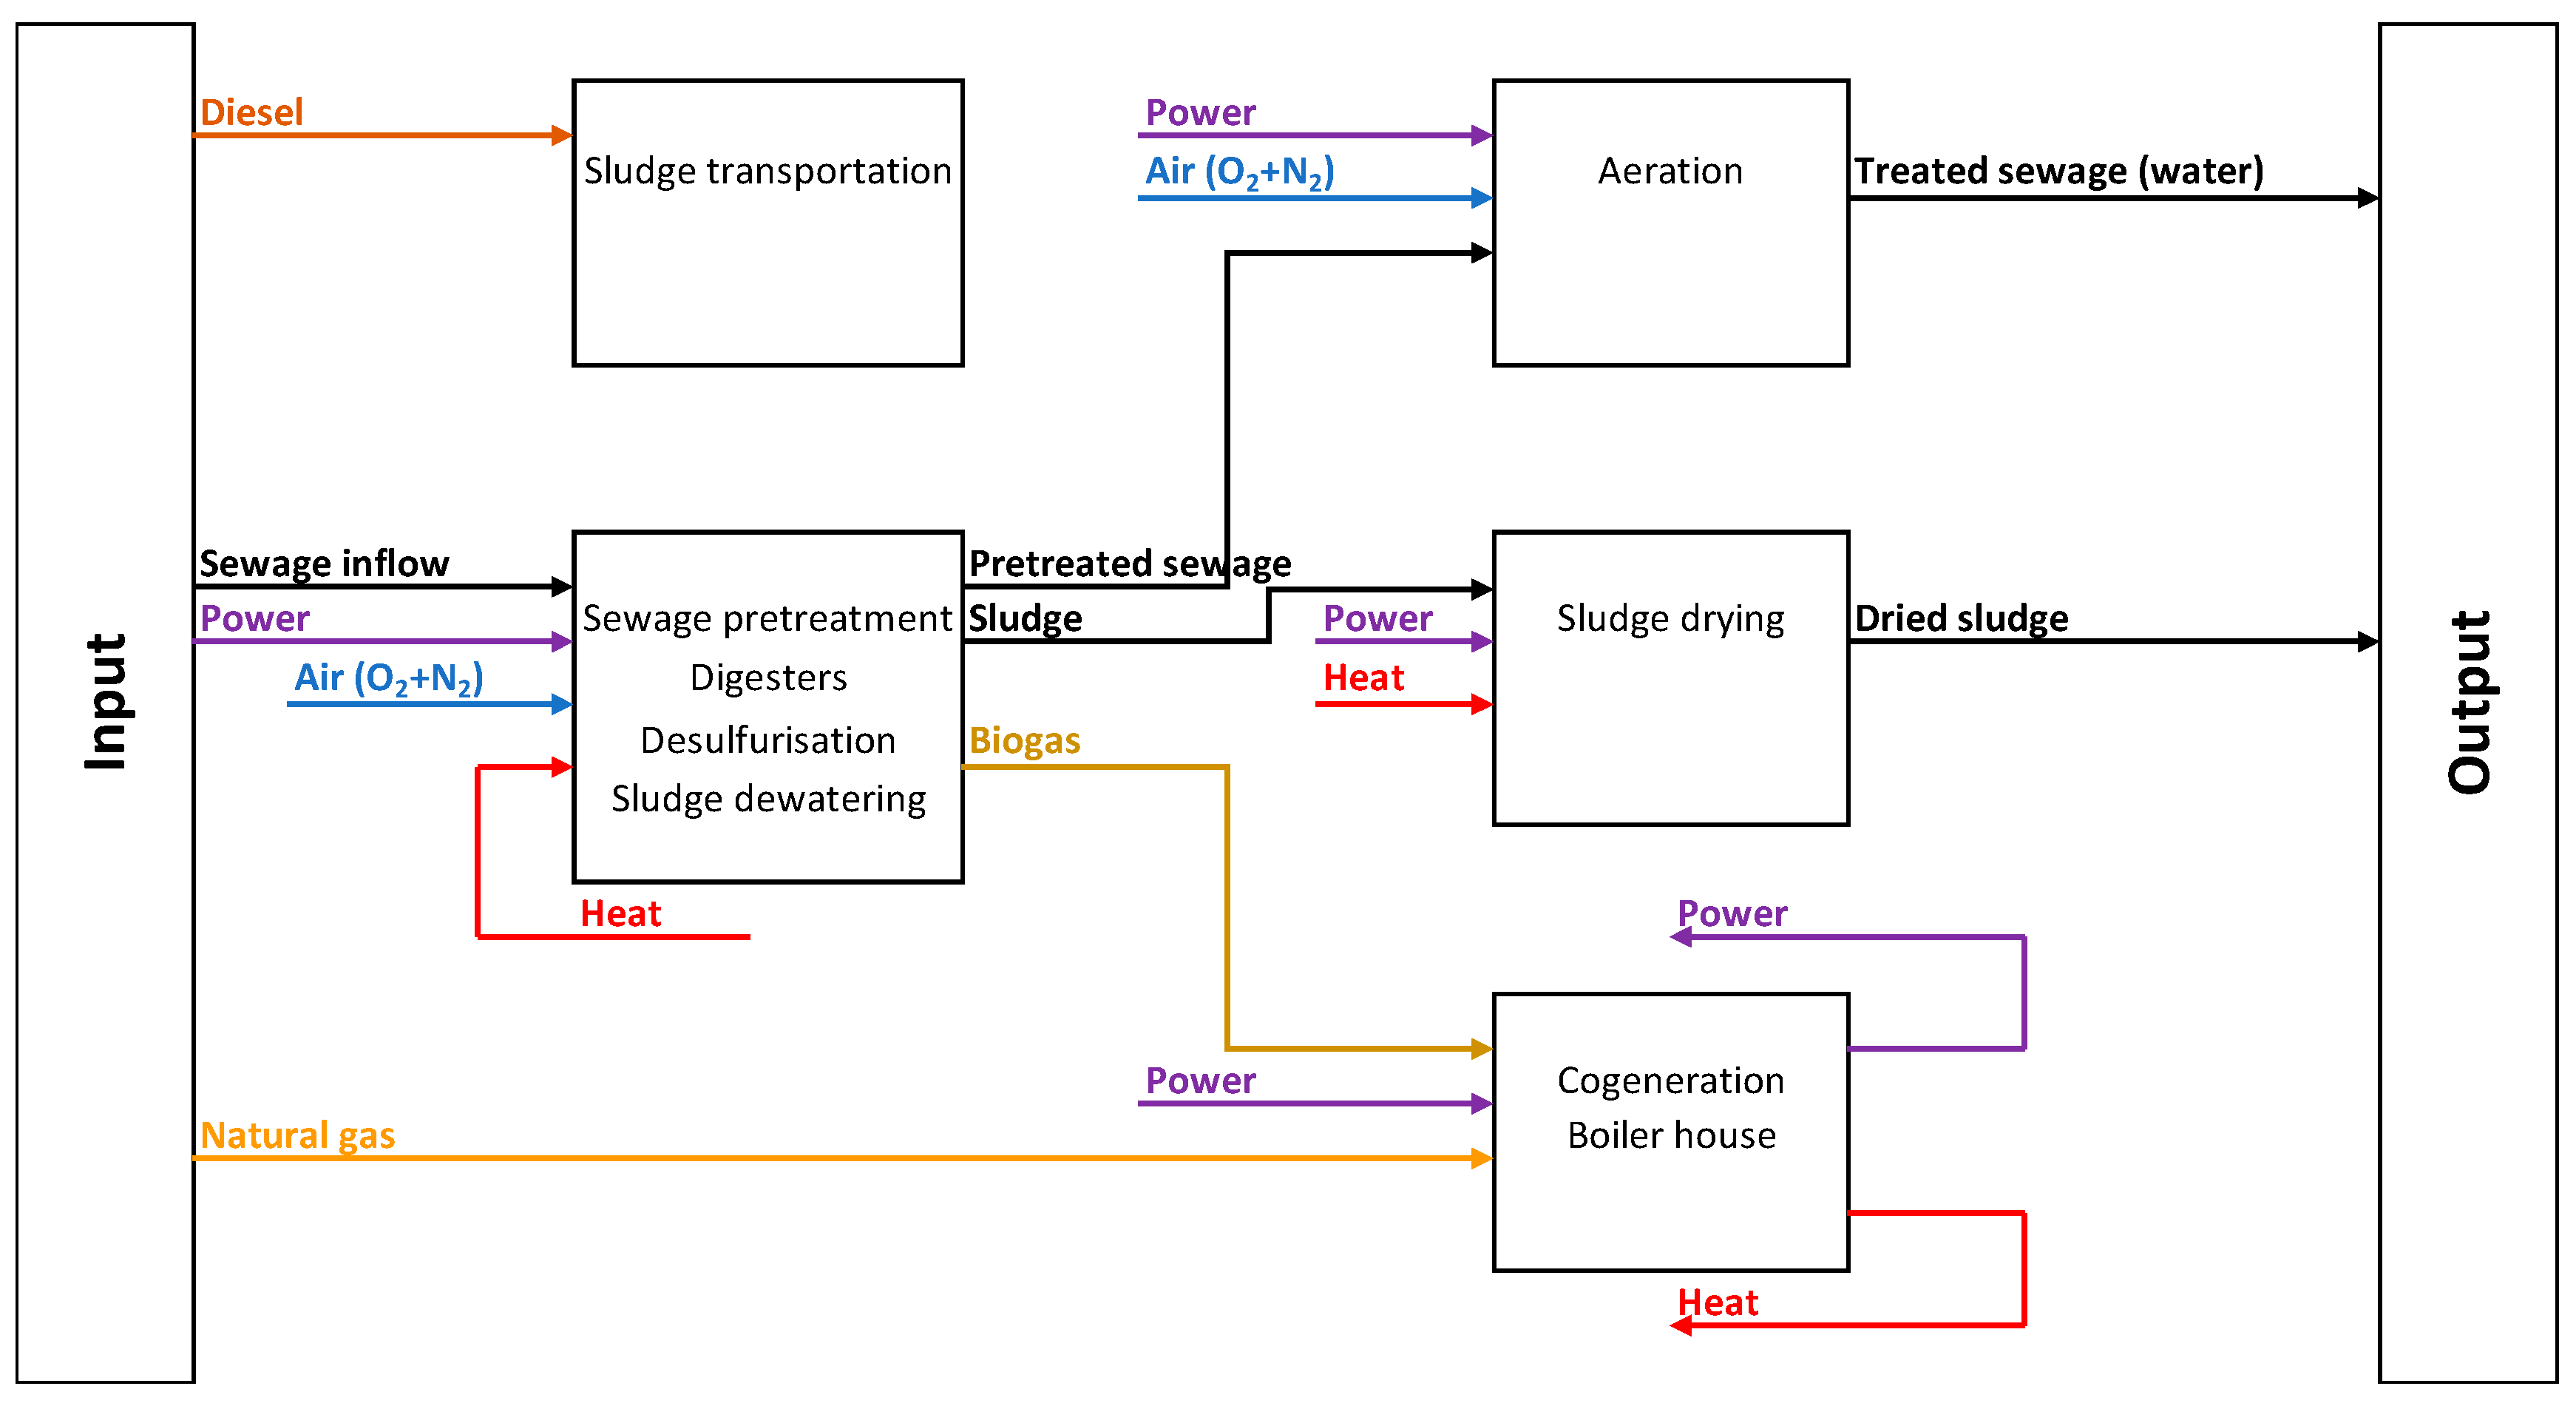
2.1. Wastewater Treatment Plant as an Integrated Energy System

For the representation of processes and configuration of a wastewater treatment plant, we chose Kaunas WWTP, operated by the Kaunas city water management company UAB “Kauno vandenys” (Lithuania). Figure 1 shows the technological diagram of the Kaunas wastewater treatment plant, the second largest city in Lithuania. Kaunas city wastewater treatment plant can be considered a typical wastewater treatment plant of a medium-sized European city. The main energy and mass flows, excluding chemicals, are incoming wastewater, treated water, sludge, electricity, heat, natural gas, diesel as a transport fuel, biogas, CO2, air, exhaust gases from the boiler plant and cogeneration units, and steam.
Directive (EU) 2024/3019 [5] indicates that WWTPs should achieve the goal of energy neutrality by 2045. To control the achievement of this goal, the WWTP should be considered as an energy system with certain input and output flows. In this way, the technological diagram can be transformed into another form. Figure 2 shows a diagram of the current state of the WWTP as an energy system.
As stated in [11], the specific electricity consumption in WWTPs of various sizes ranges from 37 to 96 kWhel/PE/a, with an average of 72 kWhel/PE/a. Other papers show that a typical WWTP consumes 0.35–0.8 kWh/m3 of incoming sewage, depending on the wastewater type, treatment system, plant capacity, and level of energy efficiency efforts [39,40] in on-site use (for aeration, pumping and heating) and off-site use (transportation and production of chemicals used in the treatment processes) [41].
Sewage energy content can be up to 9.7 kWh/m3 (greatest portion of thermal and chemical, and some amount of hydroenergy), while the current recovery in the form of biogas is only 2.7 kWh (for a chemical oxygen demand (COD) of 800–1000 g/m3) and even <1.8 kWh (for a COD of 430–500 g/m3) [39,40].
Like in many other cases [42,43], Kaunas WWTP now has a relatively high negative energy balance. The total energy consumption is slightly above 26 thousand MWh per year, and energy production in the WWTP itself is less than 18 thousand MWh per year. So, the energy deficit is more than 30%.
Assuming that the integration of green hydrogen production in WWTP will improve this situation, we can make a new extended energy diagram of WWTP as an energy system, which is shown in Figure 3. This diagram introduces additional energy and mass flows—renewable electricity (solar, wind and possibly hydro), biomethane, biogenic CO2, hydrogen, oxygen, waste heat from the electrolysis process, and recovered sewage heat.
The task of integration of green hydrogen and biomethane technologies while achieving energy neutrality of WWTP has several related dimensions—technical, technological, environmental, economic and legislative [5,44]. In this article, we will focus on the technical and technological issues that have the most significant impact on energy production and consumption in the wastewater treatment plant itself.

2.2. Principles of Electrolyzer Power Selection

To effectively integrate green hydrogen production facilities into a municipal WWTP, it is essential to select the electrolyzer power correctly. The selection of electrolyzer power found in the literature is usually based on the oxygen demand for aeration, considering that the hydrogen demand can also be assessed [13]. We propose to evaluate several main technological criteria for selecting the electrolyzer power: (1) possibilities of using the by-product of electrolysis—oxygen; (2) possibilities of using the main electrolysis product—hydrogen; (3) possibilities of using the by-product of electrolysis—heat; (4) availability of renewable electricity for green hydrogen production.
The maximum oxygen demand is determined by the demand in WWTP’s processes—aeration and sulphur removal from biogas. According to some authors, the excess oxygen content is of a relatively low value and should usually be released into the atmosphere, since the compression, storage and transport of oxygen to external users does not seem economically viable [13,45]. Other authors state that high-purity oxygen from the electrolyzers can have a relatively high market value due to its demand in the steel and chemical industries [14].
The minimum hydrogen demand is equal to the hydrogen consumption for methanation of CO2, contained in raw biogas, or biogenic CO2. The additional hydrogen could theoretically be used in WWTP cogenerators for electricity production. A certain amount of hydrogen can also be used as transport fuel in WWTP’s transport [13]. According to the EU hydrogen strategy [10], with the growing demand for green hydrogen in industry, energy and transport, the maximum hydrogen production volumes in the WWTP could be practically unlimited.
The base heat demand is determined, as in the case of oxygen, by the heat demand in WWTP’s processes—primarily for sludge drying and bioreactor heating. If WWTP has access to a city district heating (DH) network, then the volume of excess heat production in the electrolyzer can be determined by the needs and capabilities of the district heating system [29,46].
The availability of renewable electricity for green hydrogen production is one of the key factors limiting the maximum possible electrolyzer power [9].
Thus, the optimal power of the electrolyzer must be selected based on a complex analysis of these four criteria.
However, in individual cases, the selected power of the electrolyzer may be directly limited by any one of the criteria.

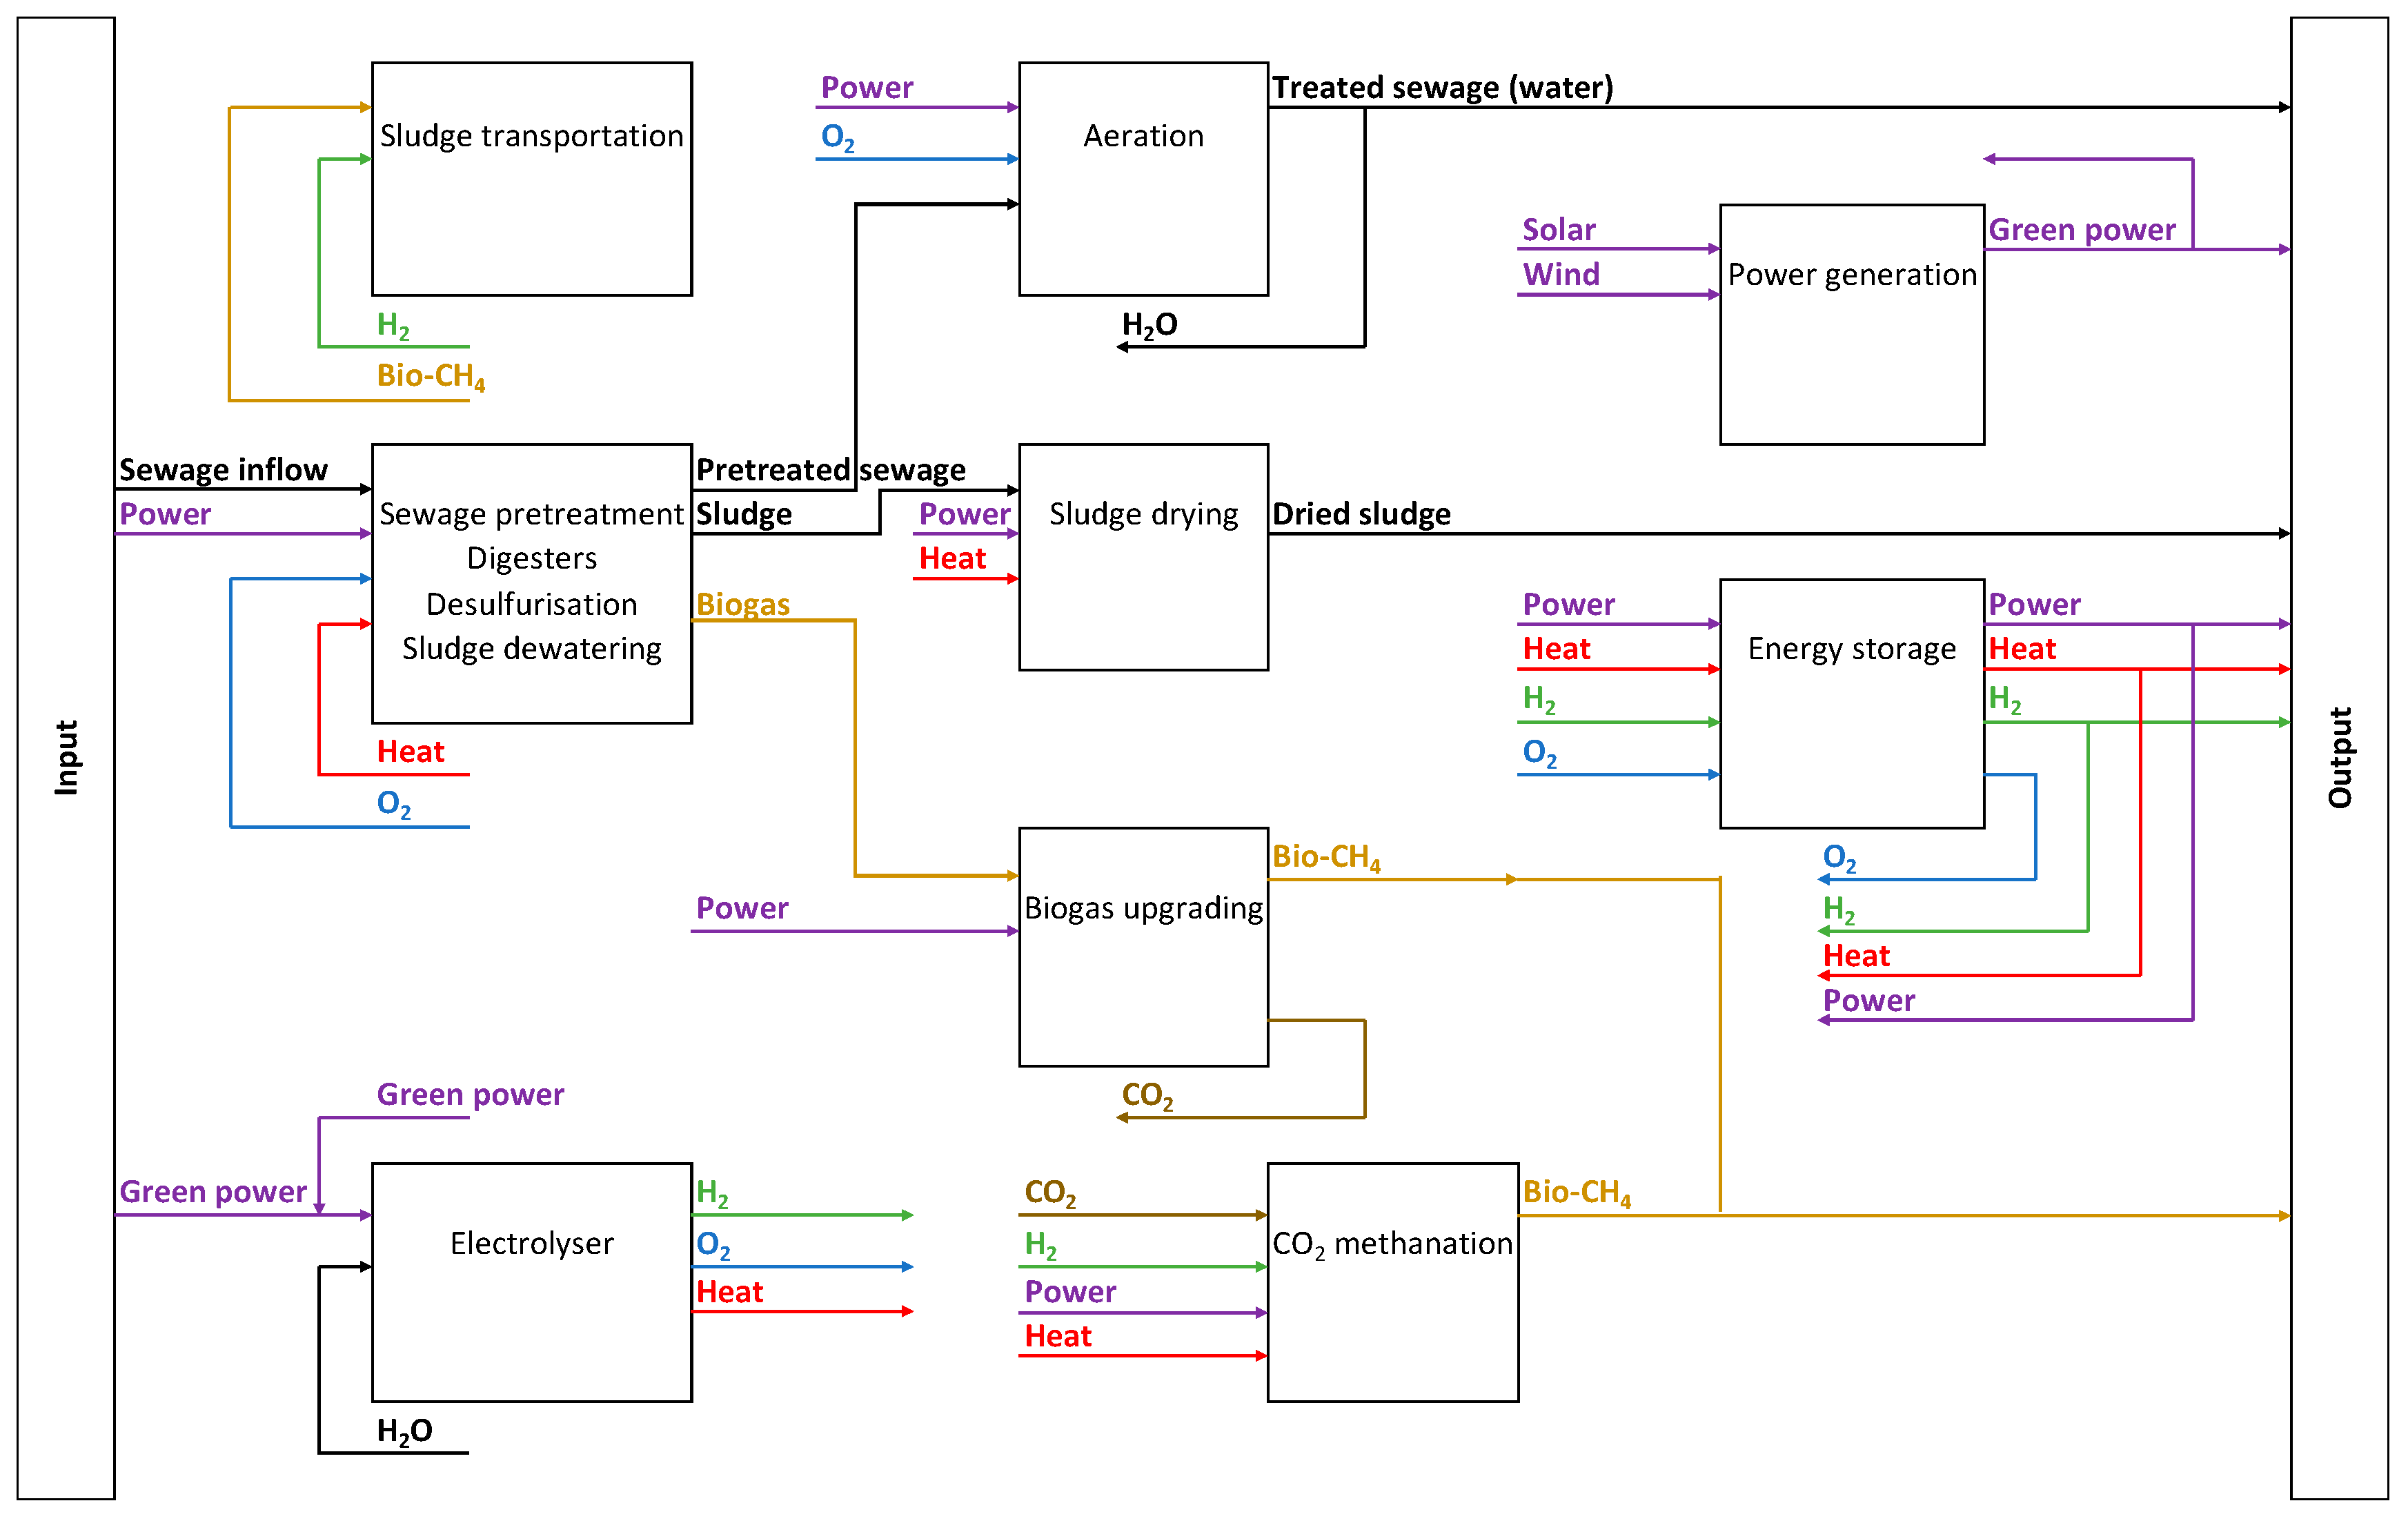
2.3. Presumptions for the Successful Integration of Green Hydrogen and Biomethane Production Processes

In this section, we will examine the main presumptions for the successful integration of green hydrogen and biomethane technologies in municipal WWTPs. We will review the general principles and provide specific data for a real municipal wastewater treatment plant.
The case study is based on data from the WWTP of Kaunas city (Lithuania). Kaunas had a population of 303,000 at the beginning of 2024. The amount of wastewater entering WWTP, including industrial users, is 392,000 population equivalent.
We have identified seven key presumptions for the successful integration of green hydrogen and biomethane production processes in municipal WWTP:
  • Utilization possibility of all products from electrolysis in WWTP;
  • Availability of green electricity for the production of green hydrogen in terms of quantity and time;
  • Availability of external infrastructure;
  • Energy and products storage requirements and possibilities of various types of energy;
  • Use of renewable energy carriers produced in WWTP for WWTP needs;
  • Sufficiency of incoming waste streams for the efficient functioning of WWTP as an energy system;
  • Technology readiness level of key processes.
Further, there is a concise description of each of them.

2.3.1. Utilization Possibility of All Products from Electrolysis in WWTP

The resources required for the production of green hydrogen are renewable electricity and water. According to the literature, the production of 1 kg of hydrogen by electrolysis, depending on the efficiency of the device, may require 50–66 kWh of electricity [13,47], or 1.27–1.67 kWh of electricity per kWh of hydrogen energy value. From an economic point of view, the cost of electricity constitutes the most significant portion of the operating costs of an electrolyzer. The average hydrogen production costs using grid electricity in Europe in 2023 for all countries were 7.94 EUR/kg [48]. Taking into account that, for example, the 2023 yearly aggregated electricity price in the NordPool Germany area was 95.18 Eur/MWh [49], the average cost of electricity in various electrolysis devices ranged from 5.0 Eur to 6.6 Eur per 1 kg of green hydrogen. The energy efficiency of modern electrolyzers reaches 60–79% [13,47].
The main by-products of hydrogen production are heat and oxygen, which are obtained by splitting water during electrolysis. Heat is itself a form of energy, and its direct use can reduce the need for other energy sources in WWTP. Oxygen itself does not replace other energy sources, but the direct use of oxygen, as we will see later, has a very significant impact on the electricity demand in WWTP, and thus on the energy balance of the WWTP.
Oxygen Demand at the Wastewater Treatment Plant
One of WWTP’s most important technological processes is activated sludge treatment by aeration. During this process, the decomposition of organic dissolved pollutants and the removal of nitrogen (nitrification and denitrification in parallel) occur.
The biological decomposition of organic compounds is one of the key processes in wastewater treatment. It is very important to properly aerate activated sludge, as microorganisms must be provided with the appropriate amount of oxygen [12].
The most often used aeration methods are diffused air aeration (coarse, medium, fine bubble) and surface aeration (especially in older WWTPs). Pure oxygen aeration in municipal WWTPs is still quite rarely used.
Aeration usually consumes the biggest portion of energy in current wastewater treatment technology (consuming 50–70% [12,50], or even up to 90% of electricity used by WWTP). At the same time, it constitutes one of the largest operating costs.
The air demand depends on the control of the aeration process.
The simplest control systems are only supplying a proper amount of air to the aeration tanks without using the feedback signals. More complex control systems include feedback from the oxygen level meters in nitrification zones. However, these management methods do not ensure optimal oxygen levels and electricity consumption.
The most advanced control systems include online feedback signals from the other important variables (ammonia nitrogen and total nitrogen) to adjust the optimal oxygen concentration level in aeration tanks. The best results are achieved when aeration process simulation systems are used to control air supply [12].
By optimizing aeration control in this way, the amount of air supplied, and thus the energy consumed by the blowers, can be reduced by 10–20% [12].
The aeration process requires precisely the oxygen present in the air. Nitrogen and other gases present in the air do not affect the aeration process and essentially act as unnecessary ballast.
When air is replaced with oxygen during the aeration process, there is a possibility of significantly reducing electricity consumption. Since the oxygen content in the air is slightly less than 21%, replacing the air with oxygen should reduce the amount of gas supplied and, at the same time, the efficiency of the blowers by almost 5 times. In addition, by reducing the flow of injected gas, oxygen uptake can be improved [12].
The typical electricity consumption for air aeration is 2.25 kg O2/kWh (1.58 m3 O2/kWh), for standard fine bubble diffusers. This means the supply of 7.54 m3 air/kWh to get the required O2 amount (with 20,95% volume O2 in the air) [13]. In the study [51], it was investigated the impact of using pure O2 instead of air, showing far higher (between 5 and 6 times) oxygen transfer rate. As noted in this study, the 5.5 times increase in O2 transfer rate was achieved due to complex effects when switching from air to pure O2 (higher O2 solubility, 20% increase in mass transfer coefficient for small bubbles, 5 times higher O2 driving force). Thus, oxygen supply efficiency of 12.5 kg O2/kWh can be achieved [13].
The total oxygen demand for aeration can be determined using Equation (1) [52]:
O D = 0.75 × Q × ( B O D i B O D e ) + 2 × V A × M L S S 1000 + 4.3 × Q × ( A m m i A m m e ) 2.83 × Q × [ ( A m m i A m m e ) N e ]
where OD is the oxygen demand for aeration, (g/h); Q is the wastewater inflow, (m3/h); VA is aeration tank volume, (m3); MLSS is the mixed liquor suspended solids in the aeration tank (g/L); BODi and BODe are the inflow and outflow concentrations of biological oxygen demand (BOD) (g/m3); Ammi and Amme are the inflow and outflow concentrations of ammoniacal nitrogen (g/m3), and Ne is the outflow of nitrate nitrogen (g/m3).
Authors of the article [13] present an evaluation of a 426,400 PE wastewater treatment plant stating that 27,344 kg O2 would be required per day, which equates to ca. 6,994,000 m3 O2/a generated by the electrolyzer. Using pure O2 aeration instead of air aeration may reduce aeration electricity demand by 82% (from 4440 MWh/a to 799 MWh/a). Considering that aeration is typically 49% of the power demand, the overall WWTP electricity demand may be reduced by 40% through O2 use.
Another option for using oxygen in a wastewater treatment plant is the removal of sulfur from biogas.
Sulphur compounds, including both hydrogen sulphide (H2S) and other sulphur-based compounds, are one of the most hazardous impurities found in raw biogas [53]. The concentration of H2S in municipal wastewater-derived biogas can reach 400–4000 ppm [53,54]. In other applications, H2S levels could be as high as 4500 ppm in dairy manure-derived biogas [55] and 12,000 ppm in distillery anaerobic digestion biogas of the ethanol industry [56]. H2S tolerance levels for the currently most often used conversion technologies for biogas [57] are: 50–200 ppm for internal combustion engines [55,58], 4 ppm for biomethane injection to natural gas grid [55], 16 ppm for biomethane as transportation fuel [55]. For innovative use in solid oxide fuel cells for electricity production, this level should be 1–4 ppm [53] or even <1 ppm [59,60].
Over the past decade, biogas biodesulfurization technologies have shown a growing interest in research and applications due to their environmental, economic and energy advantages [61,62,63].
When cleaning sulfur using biological methods, oxygen is required for the nutrition of H2S-decomposing bacteria. Until now, in most cases, air has been blown into the anaerobic digestion (AD) reactor under the dome or into the desulphurization unit due to its simplicity and cheapness. However, along with the air, nitrogen is mixed into the biogas in this way, which makes up about 70% of the air volume. If biogas is used for heat and electricity production and is burned in cogeneration plants or biogas boilers, the amount of nitrogen added does not affect it. However, if biogas is upgraded and biomethane is produced, the amount of nitrogen added can significantly impact the quality of biogas upgrading. Since the physical properties of nitrogen are closer to methane than to CO2, when using Pressure Swing Adsorption (PSA) technology, a separate line may be required for nitrogen removal, and in the case of membrane technology, additional purification stages may be required. In any case, the equipment becomes significantly more expensive, and electricity costs increase. The problem can be solved by using pure oxygen instead of air. However, compared to aeration, sulfur removal requires significantly less amount of oxygen.
Heat Demand at the Wastewater Treatment Plant
The total thermal energy demand in a WWTP can reach 2245–6033 MWh (without and with sludge drying) per year for 100,000 population equivalent. The primary heat consumers in WWTPs of moderate climate countries are the following processes: AD reactor heating (about 30% of the total heat demand) and sludge drying (about 45% of the total heat demand). For heat production, many WWTPs use biogas, which is burned in cogenerators or water heating boilers. If the energy of their own biogas is not enough, fossil fuels are used—natural gas or liquid fuel. If the WWTP is located near the city’s district heating network, it is possible to use heat from the district heating system to heat the reactors. This is especially advanced when renewable fuels are used in the district heating system (the case of Lithuania). Low-parameter heat (about 45 °C) is sufficient for heating the reactors. Sludge drying requires heat of much higher parameters (85–95 °C). Advanced urban district heating systems are switching to low-temperature networks, where heat of 45–65 °C is supplied to the network. It is impossible to use heat of such parameters for sludge drying directly. However, waste heat from hydrogen production in an electrolyzer is perfectly suitable for sludge drying, as its temperature for Proton Exchange Membrane (PEM) electrolyzers reaches up to 200 °C [64].
The heating demand for the AD reactors can be evaluated as 10% of the energy content of the biogas [65].
The study [14] presents a comprehensive techno-economic assessment of four power-to-gas systems based on ex situ biomethanation and gasification technologies in a real UK WWTP, treating 198,000 m3/a sewage sludge and 33,673 m3/a digestate after dewatering. In the simplest scenario, the heat demand is 0.65 MW only for the digesters. The heat generation is 1.61 MW in the electrolyzer and 1.21 MW in the biomethanation reactor. Heat generation exceeds heat demand by 4.3 times. The most sophisticated scenario involves a 7 MW PEM electrolyzer, a biomethanation reactor for the treatment of 9201 t/a of CO2 and a sludge gasification plant. The heat demand is 0.65 MW for digesters and 1.1 MW for digestate drying before gasification. The heat generation is 1.61 MW in the electrolyzer, 1.5 MW in the biomethanation reactor and 1.1 MW in the gasification. Heat generation exceeds heat demand by 2.4 times. If gasification was removed but sludge drying was left in, heat generation would exceed heat demand by 1.8 times.
Hydrogen Demand at the Wastewater Treatment Plant
There are not many practical examples of hydrogen use on an industrial scale in WWTPs. This is still the subject of more theoretical research, experimental or pilot tests.
The main possibility of using green hydrogen in WWTP is the use of hydrogen for the methanation of biogenic CO2 [13,14,66].
When biogas is purified using the most common methods in practice (membrane separation, PSA, water scrubber), gaseous CO2 is separated from methane [54]. This CO2 is not convenient without additional compression to transport and use for other purposes, e.g., in industry, and is usually released into the atmosphere. In the case of cryogenic biogas upgrading, liquefied biomethane and liquefied CO2 are obtained during the same process, but cryogenic purification is rarely used due to high capital and operating costs [54]. By using green hydrogen and methanation of CO2, separated from biogas, it is possible to produce an additional 50–70% biomethane in the WWTP [13,66].
The methanation of CO2 from anaerobic digestion within the power to gas concept has recently emerged as a promising technology to upgrade biogas, to decarbonize the domestic and industrial heat sector, provide long-term energy storage and deliver grid balancing services [14].
Two approaches exist to produce methane via the Sabatier reaction (Equation (2)), i.e., chemical (or catalytic) and biological methanation [54,67].
4H2 + CO2 → CH4 + 2H2O, ΔG0 = −165 kJ/mol
During the chemical methanation, various catalysts, such as nickel (Ni) or ruthenium (Ru), can be used under increased temperature (e.g., 300–600 °C) and pressure (e.g., 50–200 bars) [28,54,68]. Chemical methanation requires much smaller reactor sizes for the same feed gas flow as biological methanation. Use of chemical methanation also leads to higher efficiencies because no stirrer in the reactor is required, and the waste heat can easily be utilized [69]. High rates of CO2 conversion can be achieved with chemical methanation. The results of the study [28] showed that, while the cooled reactor with no previous CO2 separation from the biogas had a CO2 conversion of 91.8%, the adiabatic reactors showed an overall conversion of 93.0%. Another study [68] revealed that, through catalytic methanation, the outlet gas mixture (CH4 ≥ 95%, H2 ≤ 5% and CO2 ≤ 2.5%) fulfils the requirements for gas grid injection.
On the other hand, chemical methanation requires that input CO2 is free from impurities (such as siloxanes), however, biological methanation requires less stringent quality and may use the CO2 in raw biogas derived from anaerobic digestion to produce methane [67]. This means that the biological methanation process does not require biogas upgrading prior to CO2 methanation—this can save capital investment and operating costs, especially for electricity.
The most popular biotechnology strategies for increasing the methane content in the biogas include: (i) H2-assisted CO2 bioconversion, (ii) fermentative CO2 reduction, (iii) microbial electrochemical CO2 utilization, and (iv) CO2 capture by microalgae [54].
During the last decade, H2-assisted CO2 bioconversion, or biological hydrogen methanation (BHM), has been widely investigated and well-proven with sufficient experimental results as a means of upgrading biogas [54,66,70,71].
BHM is a promising technology for the conversion of green electricity to biomethane via electrolysis and an application of the Sabatier-reaction (Equation (2)). During the BHM process, catalyzed by specific Methanothermobacter microorganisms, it is possible to convert H2 and CO2 to CH4 with a small amount of water as a byproduct.
The BHM process can be applied both within an anaerobic digester system, known as in situ, or in a separate reactor known as ex situ [14,66,70,72]. In situ biomethanation takes place within the anaerobic digester. H2 gas is introduced typically through mixing or diffusion to maximize the contact area with hydrogenotrophic methanogenic archaea, which produce CH4 from CO2 and H2. Ex situ methanation takes place in a separate external reactor, typically tailored to suit the hydrogenotrophic methanogens. Gases (biogas, CO2, H2) and specific nutrient media are supplied to the ex situ reactor under controlled conditions [66]. Hybrid systems can also be used, in which in situ and ex situ biogas upgrading are taking place together, aiming to process optimization [54,73,74,75,76].
While some studies have attempted in situ upgrading, although at lower efficiencies, ex situ is more developed [66]. In situ systems can only reach a final CH4 concentration of up to 90% [77] while the ex situ systems can produce a high purity (~98%) CH4 stream [78], meeting the quality requirements of the natural gas grid. Furthermore, the ex situ technology is a system of a higher technology readiness level (TRL) with demo plants already in operation [79] while the in situ is only proven at lab scale [14]. It is reported that industry-ready Continuously Stirred Tank Reactors (CSTRs) can have Methane evolution rate (MER) up to 800 L CH4/Lvr/day at grid injection purity 99% CH4 [66].
The implementation of the BHM process can increase CH4 yields by 50–70%, depending on the injected biogas composition from the AD process [66]. The BHM process converts the injected H2 and CO2 gas at a theoretical molar ratio of 4:1 to grid-quality CH4. Yet it was noted [80] that a molar ratio for H2 to CO2 of 3.76:1 gave a higher quality gas in terms of methane content. In addition to the generation of green, renewable energy, carbon capture and reuse are other significant benefits of the technology.
As a model in article [13] showed, the power of a PEM electrolyzer based on oxygen demand for aeration of a 426,400 PE wastewater treatment plant is 10 MW. The hydrogen demand for CO2 methanation in BHM equates to 3.1 million m3 H2/a, or 22.2% of that produced from the 10 MW electrolyzer. An additional yield of 0.76 mln m3 CH4/a can be generated (with 98.8% conversion); this additional CH4 equates to a 54.3% increase in the CH4 yield, totalling 2.17 mln m3 CH4/a.
The study [14] presents a comprehensive techno-economic assessment of four power-to-gas systems based on ex situ biomethanation and gasification technologies in a real UK WWTP, treating 198,000 m3/a sewage sludge and 33,673 m3/a digestate after dewatering. In the simplest scenario, the whole amount of H2 is provided by the PEM electrolyzer. It does not consider digestate utilization, and the digestate is thereby recycled after dewatering into farmland. The biomethanation in this scenario leads to a 63% increase in biomethane production. In the most sophisticated scenario, the digestate is treated in a gasification reactor and a mixture of H2 and CO2 (ratio 4:1) is provided to the methanation reactor. In this case, an increase of biomethane up to 96% can be achieved.

2.3.2. Availability of Green Electricity for the Production of Green Hydrogen in Terms of Quantity and Time

As mentioned above, not all renewable electricity is suitable for green hydrogen production. According to EU requirements, renewable electricity generation facilities must be directly dedicated to the production of green hydrogen [9].
The first option to secure renewable electricity for green hydrogen production is to install and utilize renewable electricity generation capacities within the WWTP territory. The most important factors defining this option are the WWTP territory and the WWTP location [20]. It is estimated that the ground area required for a solar power plant is 8 m2/kW [20,21], or 0.8 ha/1 MW of solar PV. The roofs of WWTP buildings can be used to install a solar power plant, but this does not solve the problem if we are talking about producing green hydrogen of at least somewhat higher capacity.
According to the results of studies, examining land demand analysis for installation of wind and solar power generation systems in WWTPs, for a WWTP with a capacity of 120,000 m3/day, the available area for installation of flexible PV over treatment pools and roof PV on building roofs is about 50,000 m2 in total, and the available area for installation of wind turbines in free green areas is about 10,000 m2 in total [20,22].
This means that a 6.25 MW solar power plant could be installed, which would produce about 6413 MWh of electricity per year in Lithuanian climate conditions [81]. If electricity storage of suitable capacity were installed, a solar power plant of this size could supply electricity to an electrolyzer of about 0.92 MW, operating at 80% capacity [13].
The installation of wind turbines is primarily limited by the distance to the nearest buildings. According to the current Lithuanian standards, this distance must be at least 4 times greater than the height of the wind turbine mast [82]. Municipal WWTPs are usually installed in urban areas or near cities. The development of wind energy in such places is impossible due to protests from surrounding residents, even if the area available to WWTP was sufficient to build wind turbines.
It is estimated that the ground area required for a wind power plant is 3400 m2/MW [20]. Bearing in mind that in a wastewater treatment plant with a capacity of 120,000 m3/d, the free area for a wind power plant can be about 10,000 m2 [20], it would be possible to install an almost 3 MW wind power plant, which would produce about 4700 MWh of electricity per year in Lithuanian climate conditions [83]. If an electricity storage of suitable capacity were installed, a wind farm of this size could supply electricity to an electrolyzer of approximately 0.67 MW operating at 80% capacity [13].
Paper [20] analyzes the economic feasibility of acquiring additional land for solar and wind power plants to supply electricity for green hydrogen production, in order to address the land shortage within the WWTP area itself. However, other conditions, such as the availability of free land and the location of the WWTP, must be met in order to take advantage of this opportunity.
The literature describes cases where wastewater hydropower is used to produce green energy.
The main advantage of hydropower systems utilizing artificial water sources compared to natural water sources is their predictability. In WWTPs, usually, wastewater flow to the plant is constant, thus ensuring the stable hydro energy generation, in contrast to the hydropower plants using natural water flow in rivers, which is variable in time [25,84,85].
However, the potential for hydropower generation is limited by the amount of wastewater entering the WWTP and the height of the head.
In 2020, the amount of municipal wastewater produced in Europe was 55 km3 [86]. The potential for electricity production from sewage in this region, with some assumptions, is estimated to be equal to 664.24 TWh. However, this value is indicative only and would require separate scientific research [24].
Authors of the study [24] investigated the hydropower capacity of WWTPs by utilizing the kinetic and potential energy from treated wastewater to generate power. WWTP in Torun, Poland, was analyzed as a case study, treating wastewater 42,740 m3 daily. The installed capacity of the Francis turbine is 55 kW, with a head of 7.45 m. It utilizes the top water from the secondary sedimentation tanks, which is discharged into a system of top and bottom water basins. Research showed that the average and the highest turbine power reached 20.89 kW and 24.82 kW, respectively, resulting in a total production of 150.29 MWh/a.
At Al Samra WWTP, treating 364,000 m3 per day, or 70% of the wastewater in Jordan, electrical energy is generated through hydraulic turbines at the inlet and exit of the plant. Two Pelton turbines are installed at the inlet of the WWTP with a net head of 80 m, producing a net power output of 1.76 MW. At the exit of the plant, there are 3 Francis turbines that receive the exit flow from a head of 42.8 m, resulting in a net power generation output of 2.13 MW [38].
Article [23] presents a methodology, developed and applied to a case study, for evaluation of hydropower potential in a group of WWTPs at the regional or country level. This study analyzed a final group of 34 sites out of the 186 WWTPs in the Valencia Region in Spain. The sites were selected based on technical criteria—the power p > 100 W and the head H > 1 m. For this group, electricity generation was estimated at 340,472 kWh/year. Technical modifications of the plants can increase the potential generation by 37.5% (to 468,434 kWh/year). However, this generation still accounts for only a small part of WWTP’s electricity demand.
In lowland regions, the installation of hydro turbines in urban wastewater networks is much more complex compared to regions with steep terrain or surrounded by mountains. Ultralow head is defined for sites with a hydraulic head of less than 2–3 m [87,88]. Some studies even offered a feasibility threshold for such plants operating in urban areas—a minimum head of 4.5 m with a flow of 0.05 m3/s [89]. Paper [25] focuses on possible power generation by micro-hydro turbines integrated into lowland wastewater systems, which convert the potential energy of effluents in pipes into electric power. The case study was based on the Lithuanian WWTP system. Lithuania is a low-lying country; most WWTP sites have low or medium heads (up to 15 m). There are 58 WWTPs operating in the country. More than 20 potential sites for installing hydropower turbines were identified, with a preliminary power capacity estimated as less than 100 kW. However, only 7 of them have a potential power capacity of more than 20 kW but less than 70 kW.
Another source of renewable electricity in WWTPs is cogeneration plants, which burn biogas to produce heat and electricity. However, with the introduction of electrolyzers in WWTPs and the transition to the production of a more valuable product—biomethane—the combustion of biogas in cogeneration plants becomes impractical.
In the EU, the possibility of using electricity for the production of green hydrogen from the electricity grid coming to WWTP only exists if the average CO2 emissions from electricity production on the country or regional level do not exceed 18 g CO2eq/kWh [9]. In 2023, only in Sweden, the greenhouse gas emission intensity of electricity generation (8 g CO2eq/kWh) was below this level. Finland, France and Luxembourg had 40, 50 and 56 g CO2eq/kWh, respectively [90], while EU-27 average was 210 g CO2eq/kWh.

2.3.3. Availability of External Infrastructure

The next important factor for the successful integration of green hydrogen and biomethane technologies is the availability of various infrastructure. The most important thing is access to the following types of infrastructure: natural gas, district heating, power networks, as well as transport refueling infrastructure. In the future, access to the developing European hydrogen network will also need to be assessed [91]. Direct access to energy networks can reduce energy losses associated with the transportation of energy produced by WWTPs [47].
Natural Gas Network
The importance and consumption of natural gas in WWTPs should be continuously reduced, aiming for complete energy neutrality of WWTPs [5]. However, direct access to the natural gas network is relevant to ensure efficient sale, distribution and use of one of the main energy products produced by WWTPs—biomethane. By integrating green hydrogen production into WWTPs, biomethane production can increase by 50–70% (e.g., by implementing biogenic CO2 methanation) [13,66]. The value of biomethane consists of two components—the energy value, which is equal to the price of natural gas, and the additional green gas value, which is justified by the green gas guarantee of origin and the green certificate (Proof of Sustainability (PoS)). According to Lithuanian law, the guarantee of origin is granted only to biomethane injected into the natural gas network. Although at the end of 2023, the legal possibility of transporting produced biomethane from the production site to the injection point became available, direct injection of biomethane is the most efficient option from an economic and environmental point of view, as there is no need to use excess energy for compression or liquifaction of biomethane and to burn transport fuel for biomethane transportation by roads [47].
Another advantage of direct connection to the natural gas network is the ability to inject hydrogen produced by WWTP and transport it through the natural gas network. In order to transport hydrogen by road, hydrogen must be compressed to high pressure or liquefied. The low volumetric energy density of hydrogen requires energy-intensive methods for its storage and transportation. Compressing to 700 bars incurs energy losses of 10–15%, liquefaction at −253 °C expends up to 30% of its energy [47].
In countries like Germany, Italy, the UK or Lithuania, where natural gas infrastructure is well developed, biomethane and hydrogen can be supplied together with natural gas through the existing pipeline network, a concept known as the “green gas concept” [47]. Additionally, natural gas transmission lines operate at higher pressures of up to 80 bar, while local distribution networks operate at much lower pressures of 4–30 bar [92].
However, the injection of hydrogen into the natural gas network is limited by existing technical and regulatory conditions. The technical conditions include the 3.3 times lower volumetric energy density of hydrogen compared to methane, the associated need for additional transmission and storage capacities of the gas network, hydrogen embrittlement in natural gas pipelines, accuracy requirements for gas flow monitoring, metering and regulation stations, the sensitivity of end-user appliances to gas composition and others [93,94,95]. Therefore, depending on the age and technology of the natural gas system, various countries limit the hydrogen blending level in mixtures with natural gas. This blending level ranges from 0.1% (Sweden, UK, Ireland, Latvia) to 6% (France) or 10% (Germany, limited to 2% for “sensitive” consumers) [95]. In Lithuania, the permitted hydrogen blending level is 2% in pipelines with a pressure of p < 1.6 MPa and 0.1% in pipelines with a pressure of p ≥ 1.6 MPa (with a special permit, it can be increased to 2%) [96]. This means that the amount of hydrogen that can be injected into the natural gas network directly depends on the natural gas flow at the injection point. Research and pilot projects are underway in various countries to clarify the impact of hydrogen on the natural gas system (10% hydrogen in the blend in Germany, Italy and Australia, 20% in France, Spain and UK, 20–30% in the USA) [95,97]. In addition, the current natural gas regulatory system cannot be directly applied to hydrogen, so new standards need to be developed, taking into account various issues, including gas quality and safety [95]. Therefore, hydrogen blending in the natural gas network most probably will be a transitional measure to stimulate the emergence of a green hydrogen market and to develop the first pure hydrogen transportation capacities [10].
District Heating Network
Access to a district heating network is important from two perspectives. First, it is the efficient use of waste heat released during the production of green hydrogen by electrolysis or recovered from wastewater by heat pumps [11,29,46]. From 20% to 40% of the electricity consumed during the electrolysis process is converted into heat, which is often emitted into the atmosphere [29]. Some of this heat can be used in the WWTP itself. However, depending on the power of the electrolyzer, the amount of excess heat can be quite large, and its efficient utilization is relevant to ensure the energy neutrality of the WWTP. With the help of modern heat exchangers, 85% of the heat can be recovered from the electrolyzer stack and the outgoing gas (hydrogen and oxygen) flows [29]. Central heating systems in Europe are most developed in Denmark, Sweden, Estonia, Lithuania and some other countries [98]. For example, in Lithuania, 56% of households are connected to district heating networks [98]. And even in the UK, where only 2% of consumers are currently connected to the district heating network, plans are underway to increase this figure to 43% by 2050 [99]. Paper [29] provides data that an 11 MW electrolyzer operating only 5 h a day (when there is a surplus of solar and wind power) can provide heat for 190 households [29]. By fully utilizing the waste heat of the electrolyzer, the overall efficiency of the hydrogen and heat production system can reach 90.0–94.6% [29,100,101].
Also, after signing the relevant contracts with the district heating network operator, the district heating network could be used as a heat accumulator if the electrolyzer operates intermittently. The district heating network can also be used as a source of heat from renewable energy sources, thus increasing the GHG neutrality of the WWTP. If the heat in the district heating network is produced from renewable sources, WWTP can abandon the combustion of natural gas for heat production. Lithuania has a favorable situation in this regard. In the district heating system of Lithuania as a whole, 73% of heat was produced from RES in 2024, the target for 2030 is 90% of heat from RES [102].
Power Grid
The available power of the electricity grid at WWTP can be significant for the production of green hydrogen, but in the EU, this is possible only in regions with low CO2 emissions [9]. However, with the rapid expansion of the share of renewable electricity generation in the overall electricity balance, this opportunity will be available to more and more WWTPs in different countries. This can be indicated by the decreasing trend of EU power sector emissions, which in 2023 dropped by 46% below the peak in 2007 [103].
The available power of the electricity grid may also be important if the WWTP plans to supply balancing electricity to the grid (whether this is possible and logical), produced from biomethane or green hydrogen in cogeneration plants [104].
Transport Refuelling Infrastructure
As mentioned above, one of the results of integrating green hydrogen production into WWTPs could be a significant increase in biomethane production. Currently, Europe’s largest share of biomethane (23% in the year 2023) is used in transport [105]. Over the next ten years, as heavy transport decarbonizes, the demand for biomethane in transport is expected to increase fourfold. The development of hydrogen heavy transport is also predicted. Biomethane and hydrogen produced in WWTPs are already being used as transport fuels. For example, in 2021, the 13 hydrogen refuelling stations in the UK were equipped to deliver around 60 kg of hydrogen per day. 60 kg of hydrogen is enough to fill around 10 hydrogen fuel cell cars, and although there are only around 2500 registered in the UK, the government predicts that there could be over 1.5 million hydrogen-powered vehicles on the roads by 2030. Future filling stations are expected to deliver over 1200 kg of hydrogen per day to meet the increased demand for hydrogen for fuel [29]. This would provide enough hydrogen for over 15 fuel cell lorries or around 200 cars. Direct WWTP access to biomethane and hydrogen transport filling infrastructure could ensure lower energy consumption and, at the same time, lower GHG emissions.

2.3.4. Energy and Products Storage Requirements and Possibilities of Various Types of Energy

In WWTP, it is essential to coordinate the operation of energy-producing and energy-consuming processes and equipment in time. The important processes for our study can be divided into several groups. According to the temporal nature, processes can be divided into continuous, intermittent and volatile operations. According to the energetic nature, processes can be divided into energy-consuming and energy-generating. Energy-generating processes include processes that produce not only electricity and heat, but also energy carriers (biogas, biomethane, hydrogen) and oxygen used in wastewater treatment processes.
A list of the main processes in a WWTP according to their time characteristics and main type of energy is presented in Table 1.
The types of energy or energy carriers whose storage should be ensured to achieve energy neutrality of the wastewater treatment plant are electricity, heat, biogas, biomethane, hydrogen and oxygen.
The size of the electricity storage facility is determined by the following main parameters: (1) the demand of electrolysis products in WWTP; (2) the power and the operating mode of the electrolyzer; (3) the availability of green electricity in solar, wind, hydro power plants and biogas cogeneration plants in terms of quantity and time. For the main types of electrolyzers, the most optimal is the continuous operation mode. The cold start-up time of the electrolyzer varies from less than 5 min for PEM to more than 600 min for Solid Oxide Electrolyzer Cell (SOEC) electrolyzers, while the warm start-up time varies from less than 10 s for PEM to 10–15 min for SOEC electrolyzers [19,64]. However, solar and wind electricity generation is unstable. In order to ensure the optimal operating mode of the electrolyzer and the consumption of peak solar and wind electricity, it is necessary to install electricity storage facilities [18,20,22] in the WWTP. In some cases, the grid can act as a storage system, minimizing the high capital cost of batteries, especially if net metering regulations are applied [20,38].
A heat storage facility is required if the electrolyzer operates intermittently and produces more heat than is consumed by the main processes of the wastewater treatment plant, primarily sludge drying. If the wastewater treatment plant is connected to a district heating system and there are technical and legal possibilities for storing heat energy, then the district heating network could be used as a heat storage facility [106].
The size of the oxygen storage facility is determined by the following parameters: (1) the amount of oxygen consumed for aeration and sulfur removal and the temporal nature of consumption; (2) the amount of oxygen produced in the electrolyzer and the operating mode of the electrolyzer. The operating mode of the electrolyzer, in turn, depends on the availability of green electricity [19].
The size of the hydrogen storage facility is determined by the following parameters: (1) the amount of hydrogen consumed for CO2 methanation and the temporal nature of consumption; (2) the amount of hydrogen produced in the electrolyzer and the operating mode of the electrolyzer; (3) methods of supplying hydrogen to external consumers (injection into a natural gas/hydrogen network or transportation of compressed hydrogen by road transport [19,20]). The operating mode of the electrolyzer, in turn, depends on the availability of green electricity.
Biogas is produced continuously. If biogas is used for biomethane production with injection into the natural gas network, then biogas consumption is also continuous. In this case, a biogas storage facility is only required when biomethane production facilities are being repaired or scheduled maintenance work is being performed related to the shutdown of these facilities. In an extreme case, all excess biogas can be burned in a flare (typically 2% of biogas received is flared [107]). However, burning biogas in a flare is not acceptable from an economic and environmental point of view, since CO2 and heat are emitted into the atmosphere. Biogas can be used in cogeneration units primarily for electricity production during peak periods, when the cogeneration units are switched on when the electricity price in the electricity network is highest. In this case, the biogas storage facility’s size should be selected considering economic and technological factors.
Biomethane, like biogas, is produced continuously. If all produced biomethane is injected into the natural gas network, then a biomethane storage facility is only needed when troubleshooting biomethane compression and injection equipment or performing scheduled maintenance work. In an extreme case, all excess biomethane can be burned in a flare [107]. However, burning biomethane in a flare, like for biogas, is not acceptable. If biomethane is transported to consumers by road transport, then the size of the biomethane storage is determined by the frequency of biomethane transportation and economic criteria. The pressure of such storage facilities is usually 250–300 bars [67]. These can be stationary or mobile (gas cylinders mounted on a car trailer, ready for transportation). If the produced biomethane is used in the WWTP’s own transport, a storage of sufficient size must be provided for quick filling of the vehicles.

2.3.5. Use of Renewable Energy Carriers Produced in WWTP for WWTP Needs

Use of Biomethane and Hydrogen in Transport
For the successful development of the green course, it is important that the green energy producers themselves set an example first. In a wastewater treatment plant, the greatest need for heavy transport, and thus the consumption of transport fuel, is for transporting treated wet or dried sludge to places of use or storage. The need for heavy transport increases even more if untreated sludge is transported by road for treatment to the centralized wastewater treatment plant from surrounding municipalities. Biomethane can easily replace fossil fuels in transport, as there are already enough biomethane-powered heavy vehicles on the market, and biomethane production technologies have reached a high industrial level of development. In addition, using biomethane-powered vehicles from a Life Cycle Assessment (LCA) perspective, considering vehicle, fuel, service and operating costs and environmental taxes, is already economically superior to cars powered by fossil fuels. According to data presented by Scania Lithuania in March 2024, the average cost per km of a biomethane-powered truck was EUR 0.856, compared to EUR 0.863 for a diesel-powered truck. The cost of the truck itself, fuel costs, total operating costs and driver wages were assessed over a 7-year period of operation of the truck, covering 840,000 km [108]. Hydrogen is a beneficial substitute for fossil fuels due to its superior heating value (142 MJ/kg) and the absence of hazardous emissions during burning [109]. From an energy efficiency perspective, compressed hydrogen gas (CHG) heavy goods vehicles (HGV) have the lowest energy use of the three engine types (6.6 MJ/km), as compared to diesel (12.2 MJ/km) and compressed biomethane gas (CBG) (13.8 MJ/km) [13]. A particular challenge at present is the significantly higher cost of hydrogen vehicles, which can be up to three times greater than diesel heavy-duty vehicles [110].
There are a few articles that assess the fuel consumption of WWTPs in transport. Most often, the combined potential of transport fuels produced by WWTPs—biomethane and hydrogen—is assessed. Article [13] provides data that a 426,400 PE WWTP with integrated green hydrogen production could produce fuel that would replace 100,000 t of diesel and sufficient fuel would be generated annually for 94 compressed biomethane gas HGVs and 296 compressed hydrogen gas fuel cell HGVs at an annual milage of 60,000 km [13].
Use of Biomethane (Biogas) and Hydrogen for Electricity and Heat Production
In order to achieve complete energy neutrality of the WWTP, all energy consumed in the WWTP must be produced in the WWTP itself or externally, but in this case, it must be used exclusively for the needs of the WWTP and cannot be purchased [9]. When solar and wind power plants and electricity storage devices do not ensure a sufficient electricity supply, it may be appropriate to produce the missing electricity from biomethane or green hydrogen, which are produced in the WWTP. In many European countries, WWTPs have operating biogas cogeneration plants. Energy (electricity and heat) production based on biogas obtained in WWTPs, for example, in Germany, UK and Sweden was 3657, 1483 and 715 GWh/year, respectively [111].

2.3.6. Sufficiency of Incoming Waste Streams for the Efficient Functioning of WWTP as an Energy System

The total energy consumed in a wastewater treatment plant can be conditionally divided into two types: fixed, which does not depend on the amount of wastewater being treated, and variable, which directly depends on the amount of wastewater being treated. Fixed energy costs include, for example, heating of administrative, laboratory and auxiliary premises. Variable energy costs include, for example, biogas upgrading and sludge drying. Some costs, such as aeration, partially depend on the amount of wastewater being treated.
For this reason, as the volume of treated wastewater increases, the energy consumption required per cubic meter of wastewater treatment decreases relatively. The main energy source naturally produced in the WWTP is biomethane, which is obtained by biogas upgrading and CO2 methanation [14]. The green hydrogen required for methanation is, in turn, obtained in an electrolyzer integrated into WWTP, effectively utilizing the electrolysis by-products in other wastewater treatment processes [13].
However, biogas production in WWTPs is often limited [107]. For example, in Sweden, more than 1100 million m3 of wastewater are treated every year in 453 WWTPs across the country; of these, only 5% of the plants treat wastewater from >100,000 PE, while 60% of the WWTPs have a size of <10,000 PE [112]. Only 135 WWTPs in Sweden have a digester for biogas production from sludge, since many WWTPs are small and it is not profitable to build one [42].
As the incoming wastewater flow decreases, the demand for all electrolysis products—hydrogen, oxygen, and heat—decreases. Although technically possible, installing an electrolyzer in a WWTP may not make economic sense in the case of insufficient wastewater volumes.
At present, AD is mostly used in WWTPs with a capacity exceeding 20,000 m3/d. Integrating co-digestion into small WWTPs can be a solution for economically viable biogas production in these plants [113].
The main possibility for increasing biogas production in WWTPs is co-digestion of internal residue from wastewater treatment and external organic feedstock originated from sources close to WWTP [107]. The literature provides some examples of co-digestion, where the amount of biogas in WWTP is increased by supplying additional raw materials to the WWTP [107,114].
According to different authors, co-digestion has some benefits in improving the quantity and quality of biogas and bio-fertilizer [107] mainly due to (i) increasing C:N ratio, microbiological activity, buffering capacity, and nutrient recycling [115]; (ii) available readily biodegradable waste [116]; (iii) improving AD through direct interspecies electron transfer (DIET) process via conductive materials such as biochar [117]; (iv) enabling in situ biogas clean-up by physicochemical characteristics of biochar [117]; (v) diluting pollutants by addition of clean biowaste [118], (vi) adding feedstocks to AD tanks to compensate the reduction of organic load in the winter season [119].
Another solution for small WWTPs could be merging by transporting dewatered and thickened sludge from several surrounding WWTPs to the centralized location for digestion to improve the economical viability of biogas production and upgrading to biomethane [120].
Most often used externally derived organic wastes for co-digestion in WWTP are animal manure, agro-industrial residues, garden waste, sludge from fish farming (manure and excess feed), the organic fraction of municipal solid waste (OFMSW) or slaughterhouse waste [114]. Some important wastes derived internally and their utilization in AD, including screenings, grease trap sludge and fine sieved fractions (FSFs), are under investigation [107]. Biochar and algal biomass can be obtained from internal and external waste sources. However, co-digestion of these resources is mainly on laboratory or pilot scale [107].
One of the most important sources of additional raw materials for co-digestion can be sorted food waste (FW). According to the EU Waste Framework Directive [121], from 2024, in the EU member states, biological waste, including food and kitchen waste from households, offices, retail and wholesale trade, and catering establishments, must be collected separately or composted in households. As can be found in European household FW studies, the FW amounts vary from 43 kg/cap/a to 129 kg/cap/a, with the European average at 71 kg/cap/a [122,123,124,125]. For example, FW amount in Denmark is 48 kg/cap/a, Finland—56.4 kg/cap/a, Sweden—69 kg/cap/a, Norway—80.2 kg/cap/a, the Netherlands—61.8 kg/cap/a, Poland—61.7 kg/cap/a. Almost 55% of this amount is edible food waste (EFW), the remaining 45% is inedible food waste (IFW) [122]. The highest specific methane yield of FW varies from 557 mL/g volatile solids (VS) for the mesophilic AD system to 680 mL/g VS for thermophilic AD systems [126].
Results presented in [127] indicated that a conventional WWTP may treat a 10% addition of food waste (expressed as VS) without experiencing severe modifications in process parameters, thus obtaining 16% extra energy.

2.3.7. Technology Readiness Level of Key Processes

The energy neutrality of wastewater treatment plants will have to be gradually achieved by 2045 with interim evaluations in 2030, 2035 and 2040 [5]. This means that measures to achieve energy neutrality must be planned immediately and implemented in the near future. Therefore, the level of development of the technologies to be used is very important. The use of some promising technologies, currently only being tested at the laboratory level, may not be possible due to time constraints.
Mature, industrially tested technologies include biogas production by anaerobic digestion and biogas upgrading [54], electrolysis [64], chemical (or catalytic) methanation of CO2 separated from biogas [47]. Mature technologies include solar and wind power generation, electricity generation in cogeneration units, electricity, heat and gas storage solutions. Advanced technologies, but still little used in WWTPs, include biological ex situ CO2 methanation [14], the use of biomethane and hydrogen as transport fuels for WWTP needs, the use of heat pumps or hydroturbines [23].
Meanwhile, other technologies—biological in situ CO2 methanation [14], removal of H2S from anaerobic digestion with oxygen micro-aeration [128], biogas boiler house exhaust gas methanation, sludge gasification [129]—are still in the pilot or laboratory stage.
A list of the main WWTP processes according to the level of technological readiness is presented in Table 2.

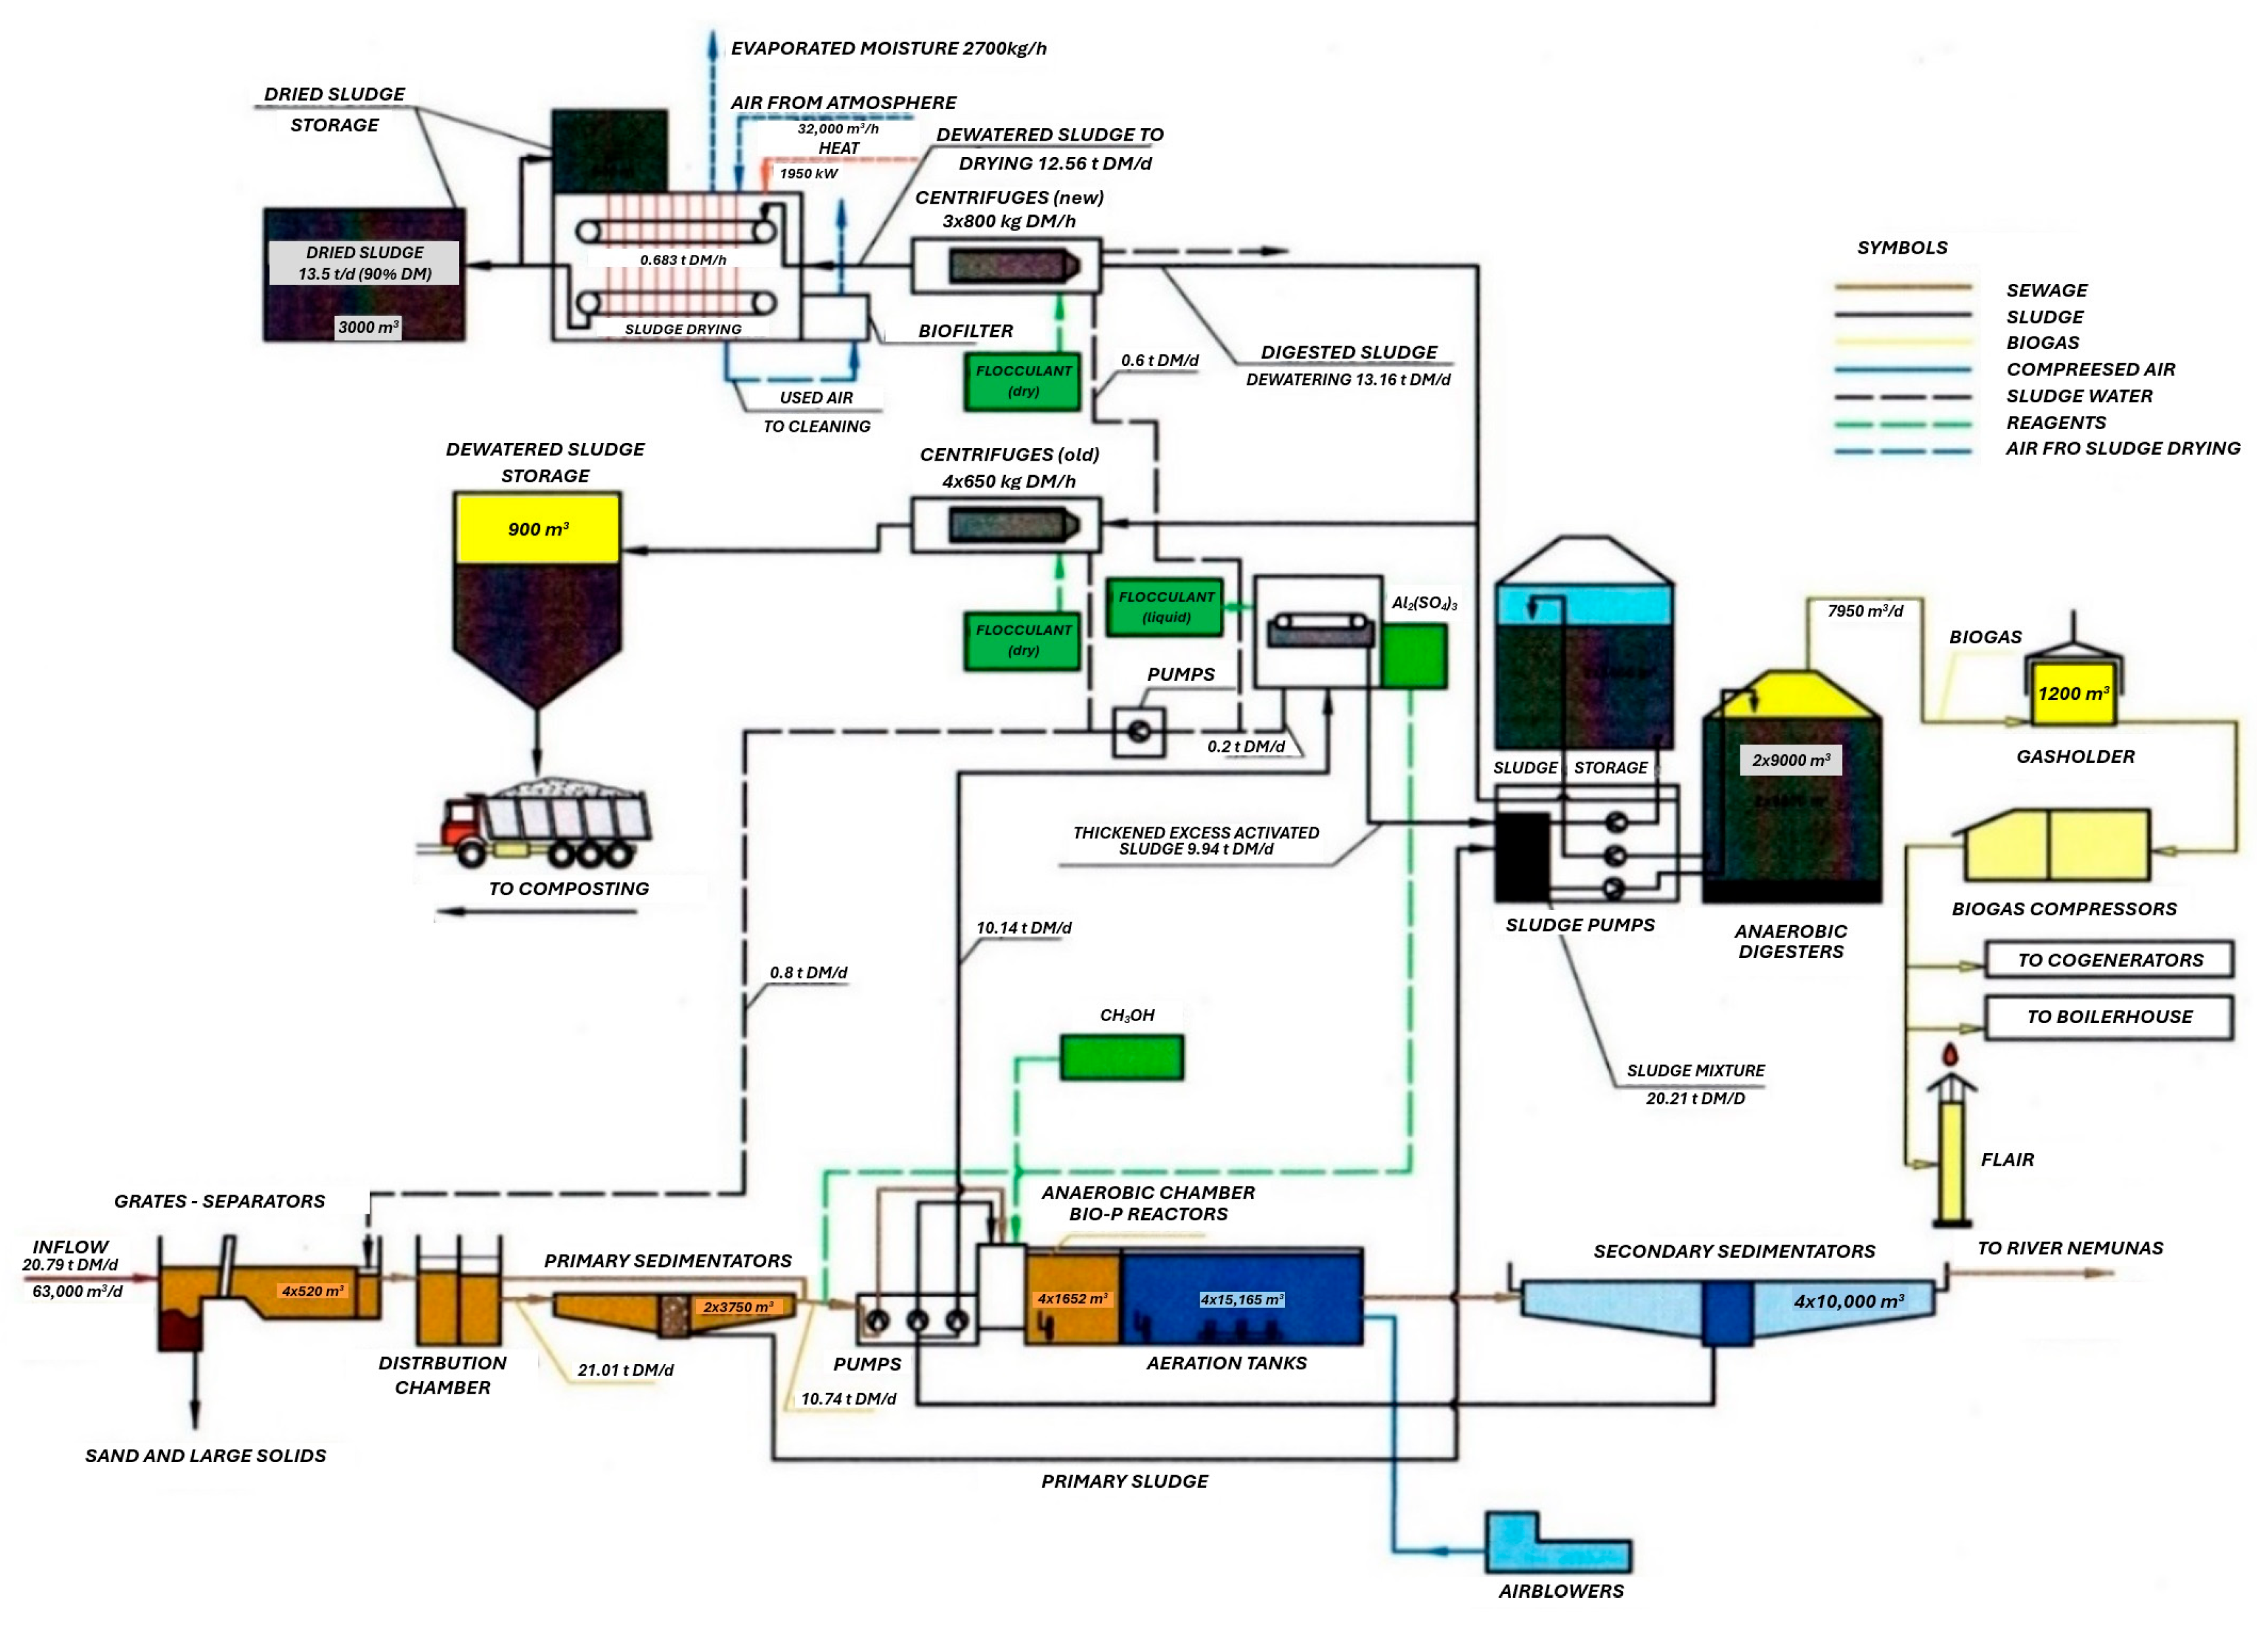
3. Analysis of Kaunas WWTP Case

This section applies the seven key presumptions for the successful integration of green hydrogen and biomethane production processes in the Kaunas City wastewater treatment plant, which was commissioned in 1999. The total amount of wastewater inflow is 25.5 million m3 per year, or 392,400 PE.
Description of Kaunas WWTP. The technological diagram of the Kaunas City WWTP is presented in Figure 1.
The wastewater from the city flows into the WWTP through three pipes with a diameter of 1.2 m. Large solids are retained in perforated grates with a hole diameter of 6 mm. About 532 tons of various floating waste are generated per year. The solids are drained from the grates by a press and used in the Kaunas city municipal waste incineration plant for energy production. Sand is settled in aerated grit chambers. About 250 tons of sand are generated per year. Sand is drained by a separator and taken to a landfill. Wastewater is mechanically treated in two primary settling tanks with a diameter of Ø 40 m, a depth of 3 m, and a total volume of 7500 m3. Biological treatment consists of 4 parallel technological lines, each with a 1674 m3 bio-P (biological phosphorus removal) reactor and a 15,165 m3 N/DN (simultaneous nitrification-denitrification) reactor. The total volume of aerotanks is 67,356 m3. The design concentration of activated sludge is 4.8 g/L (at a daily wastewater flow rate of 81,890 m3/d). In the N/DN reactors (aerotanks), organic dissolved pollutants are decomposed and nitrogen is removed (nitrification and denitrification in parallel). In order to ensure simultaneous conditions for nitrification and denitrification, it is necessary to maintain an optimal dissolved oxygen concentration of about 0.15–0.3 g/L. Each aeration tank section is equipped with ammonium nitrogen and nitrate concentration meters, which are used to control the operation of blowers and mixers using intelligent algorithms. In addition, in each N/DN reactor, the activated sludge concentration (at the end of the device), the oxygen concentration and wastewater temperature are measured at two points. The air required to ensure the biological treatment of wastewater is supplied by air blowers. Five air blowers are installed, with a total capacity of 55,800 m3 of air per hour, and a total electrical power of 1380 kW. Wastewater from the aerotanks is fed to secondary settling tanks. There are four secondary settling tanks; the volume of the settling zone of one settling tank is about 10,000 m3. During biological wastewater treatment, excess activated sludge is generated. Before it is fed to the digesters, the sludge is thickened, i.e., its concentration is increased, and its volume is reduced by about 4.5–6.0 times. For sludge digestion, two anaerobic digesters with a volume of 9000 m3 each and two sludge storage tanks with a capacity of 4500 m3 each are used. An anaerobic mesophilic digestion process takes place in these anaerobic digesters, maintaining a temperature of 34–35 °C. After digestion, the sludge is dewatered with centrifuges to 73–77% humidity. After dewatering, about 19–20 tons of sludge based on dry matter are obtained, or 79–83 tons of 76% humidity sludge mass per day. About 50% of the dewatered sludge is dried in belt dryers to 10% humidity. The dried sludge is used in the cement industry for heat production. Some of the dewatered sludge is used in agriculture for fertilization and composting, while the rest is used in the Kaunas municipal waste incineration plant for energy production.
The main data of Kaunas WWTP are presented in Table 3.
Oxygen demand. In Kaunas WWTP aeration consumes 4382 MWh of electricity per year, or 46.9% of the wastewater treatment plant’s total electricity demand.
At the beginning of 2023, a new biological treatment control system was installed. Ammonium nitrogen and nitrate concentration meters were installed in each aeration tank section, and the work of blowers and mixers was controlled using smart algorithms. This fundamentally changed the management of the biological treatment part of the plant. Since the construction of the biological treatment plant in 2008, aeration has been continuous—a larger or smaller amount of air was supplied according to the dissolved oxygen setpoints, i.e., the blowers and mixers in the aeration tanks worked continuously. After installing the new control system, aeration became periodic—air is supplied to each section separately according to demand. This ensures better efficiency of wastewater treatment in terms of nitrogen and saves electricity. After the modernization of the system, the amount of electricity consumed for biological aeration decreased by 11.4%, the amount of electricity consumed for mixing decreased by 42.1%, and the average total nitrogen concentration decreased by 7.1 mg/L.
Based on Equation (2) and data provided by Kaunas WWTP (Q of 2911 m3/h, BODi of 337 mg O2/L, BODe of 4.6 mg O2/L, VA of 60,660 m3, MLSS of 5.8 g/L, Ammi of 50 g/m3, Amme of 2.9 g/m3, Ne of 2.67 g/m3), the calculated total oxygen demand for aeration is 5,823,558 m3/a.
If oxygen generated during electrolysis was used for aeration, the efficiency of the aerators and the electricity consumed at the same time could be reduced by 81.2%, or 5.5 times [51].
Heat demand and production. The annual heat demand of Kaunas WWTP is 16,129 MWh. Of this, 28.7%, or 4633 MWh, is used for heating anaerobic digesters, and 45.4%, or 7320 MWh, for drying sludge. The remaining 25.9% of thermal energy is used for other technological processes and heating administrative premises. Approximately half of the total sludge is dried. If the entire sludge were dried, the heat demand would be significantly higher (almost one and a half times). A temperature of 85–92 °C is required for drying sludge. The temperature of the hot water supplied in the Kaunas city district heating system is 65 °C. Therefore, it is impossible to use heat from the district heating network to dry sludge without additional warming up. The installed power of the sludge dryer is 1.95 MW.
Currently, the greatest portion—98.1% of the thermal energy consumed by Kaunas WWTP—is produced from biogas in the boiler house (91.1%) and in cogeneration units (7.0%). The remaining small portion of 1.9% of thermal energy is produced in the boiler house from natural gas. By installing a 8.3 MW electrolyzer, based on oxygen demand, the amount of waste heat from the electrolyzer would fully cover the heat needs of the WWTP (see Table 4). Therefore, the entire amount of biogas could be used for biomethane production.
Hydrogen demand. The amount of biogas produced at the Kaunas WWTP is 3.815 million m3 per year. The average methane concentration in biogas is 62.8%. Thus, during the biogas production process, 1.420 million m3 of biogenic CO2 is generated per year. The methanation of this amount of CO2 would require 5.682 million m3 of green hydrogen per year and an additional 1.420 million m3 of biomethane could be produced, or 59.3% more. If sorted food waste from Kaunas city were used for biogas production, another 0.803 million m3 of biogas and 0.391 million m3 of biogenic CO2 would be produced per year. The methanation of this amount of CO2 would require another 1.564 million m3 of green hydrogen per year and an additional 0.391 million m3 of biomethane could be produced. The total demand for green hydrogen for CO2 methanation could be 7.246 million m3, and biomethane production could be increased by 2.223 million m3, or 92.8%.
Electricity demand, production and availability of green electricity. The annual electricity demand of Kaunas WWTP is 9350 MWh. Of this, 44.0%, or 4115 MWh, is used for sludge management, and 46.9%, or 4382 MWh, for biological wastewater treatment. The remaining 9.1% of electricity is used for other technological processes and administrative premises.
Currently, the greatest portion—80.6% of the electricity consumed by Kaunas WWTP—is obtained from the electricity grid. The remaining electricity is produced from biogas in cogeneration units (1627 MWh or 17.4%) and a solar power plant (190 MWh or 2.0%). Thus, 1817 MWh or 19.4% of the total electricity consumed by WWTP is produced in WWTP from renewable resources.
Kaunas WWTP has three cogeneration units with a total capacity of 900 kWel. The total operating time of all cogenerators in 2023 was 11,368 h, or 43.3% of the total possible operating time, and a significant amount of the time the cogenerators were operating at partial capacity. Installing an electrolyzer in the WWTP and utilizing the waste heat of the electrolyzer would make the use of biogas in cogenerators solely for electricity production economically inexpedient.
Kaunas WWTP currently has an installed 200-kW solar power plant, and a project has been prepared to expand the solar power plant by another 200 kW. Based on the estimates presented in articles [20,21,22], the total solar electricity potential of Kaunas WWTP could reach 3639 kW, and the wind electricity potential—1.7 MW. The limited free territory of WWTP (7.8 ha) and location (city area, vicinity of living areas) are strongly limiting factors for expanding green electricity production at WWTP, especially for wind electricity.
A common limiting feature of solar and wind power plants is the unstable electricity production during the day and year. In Lithuania, the intensity of sunlight depends significantly on the time of year. According to Kaunas WWTP data, the average monthly solar electricity generation during the light period (May–September) is on average 3.6 times higher than during the dark period of the year (October–April). If the electrolyzer operates in continuous mode, to ensure an uninterrupted supply of green electricity, it is necessary to build electricity storage facilities or ensure the supply of green electricity from other sources, such as a biogas cogenerators.
The second option to secure renewable electricity for the production of green hydrogen is to use electricity from solar and wind parks located outside the WWTP and connected to the WWTP by direct cable lines. This option is difficult in the case of Kaunas WWTP since the WWTP is located in an urbanized area.
The third option for supplying renewable electricity for green hydrogen production is to use renewable electricity from the grid, if the average CO2 emissions from electricity production in the country or region do not exceed 18 g CO2eq/kWh of electricity. At present, this option is not available to WWTPs in Lithuania, as the average CO2 emissions from electricity production in Lithuania in 2023 were 124 g CO2eq/kWh of electricity [90].
Kaunas WWTP has a small hydropower potential. According to the information provided in the study [25], the total hydropower potential, considering wastewater turbining before and after the treatment plant, is 654 MWh, which would be about 7% of the current electricity demand of the WWTP.
Natural gas network. Kaunas WWTP has direct access to the medium-pressure (3 bars) natural gas distribution network in its territory. The capacity of biomethane injection into the gas network exceeds 5 million m3/year, which fully satisfies the current and prospective biomethane production capabilities of Kaunas WWTP.
District heating network. The nearest Kaunas city district heating subnetwork is located 1000 m from the WWTP plant. Winter/summer heat demand in this subnetwork varies from 2.5 MW to 0.5 MW. Limiting factor—a new heating pipeline should be installed through the territory of the botanical reserve. Mitigating circumstance—biogas and natural gas pipelines are already laid through the botanical reserve. The heat supply route could be laid next to biogas and natural gas pipelines, using trenchless technologies.
The Kaunas city district heating system produces 90% of heat from renewable sources [130]. During the heating season, when the outdoor temperature is above 0 °C, and during the entire non-heating season, the temperature of the water supplied to the district heating system is 65 °C. Excess waste heat from the electrolyzer, which is not consumed by the wastewater treatment plant itself, could be supplied to the district heating network from the WWTP. When the electrolyzer is not operating, heat from the district heating network, after additional warming up to 85 °C in the WWTP boiler room, could be used for sludge drying, and without additional warming up—for all other processes.
Power network. Kaunas WWTP has its own 110/10 kV power network substation located near the WWTP territory. The available power input from this substation is 20 MW. This fully satisfies the power needs of the planned electrolyzer.
Transport fuel filling infrastructure. Kaunas WWTP is in a good location in this regard. The distance from Kaunas WWTP to the transport fuel station, located near the Via Baltica traffic corridor connecting Poland, Lithuania, Latvia, Estonia, and Finland, is only 300 m. This location guarantees constant transport flows, making it convenient for installing biomethane and hydrogen filling stations.
Energy storage possibilities. Kaunas WWTP currently has a 1200 m3 biogas storage capacity. 7.8 ha of free WWTP area can be used for all other types of energy storage.
Use of biomethane and hydrogen in transport. Kaunas WWTP generates 31,367 t of dewatered sludge per year, with a moisture content of 77%. Approximately half of the dewatered sludge (15,445 t) is dried. The dried sludge (3926 t) is used for energy production in the cement industry and is transported over a distance of more than 230 km. Part of the dewatered, non-dried sludge (14,244 t) is transported and used in agriculture—for fertilization and composting. The remaining portion of the dewatered, non-dried sludge (1678 t), together with waste from the grates (about 532 t), is transported to the Kaunas city municipal waste incineration plant for energy production. 355 MWh of diesel is consumed annually for sludge transportation, which could be replaced with biomethane or green hydrogen produced at the wastewater treatment plant. The transport fuel consumption for other WWTP needs amounts to 100 MWh per year.
Use of biomethane (biogas) and hydrogen for electricity and heat production. Kaunas WWTP has three cogenerators with a capacity of 300 kWel each, with a total electricity generation capacity of 900 kWel. After installing an electrolyzer at Kaunas WWTP, these generators could only be used for electricity production from biogas during peak electricity demand. As we noted earlier, the heat needs of the WWTP can be fully covered by the waste heat of the electrolyzer, therefore, in the absence of additional heat demand, the constant use of cogenerators is economically inexpedient.
Energy potential of dewatered sludge. In order to have a complete energy balance of the WWTP, the energy value of wastewater sludge should be assessed. Kaunas WWTP generates 7175 t of dewatered sludge by dry mass per year. Almost half of the generated dewatered sludge (3533 t by dry mass, or 49.2%) is dried and used for energy production in the cement industry. Some of the dewatered, non-dried sludge (1678 t by dry mass, or 23.4% of the total sludge) is also used for energy production in the Kaunas municipal waste incineration plant. The authors of article [129] studied the possibilities of using dried sludge from Kaunas WWTP for energy production by gasification. According to the data presented in this article, the total energy value of sludge generated in Kaunas WWTP is more than 38,315 MWh per year. However, there is currently no clear methodology that allows for the inclusion of sludge energy extracted in energy production facilities outside the WWTP into the energy balance of a WWTP.
Heat recovery from wastewater. Another potential energy source in WWTP is recoverable heat from wastewater by heat pump technology. Although this is a promising technology, theoretically studied in a number of articles [46,106,131,132], its practical application in WWTPs is not yet widespread. Based on methodology and assumptions presented in [131,132] (wastewater temperature reduction of 5 K, coefficient of performance (COP) of 4.0, actual Kaunas WWTP wastewater outflow of 809 L/s), the theoretical potential of wastewater heat recovery Qrec is 16.98 MW, or 148,760 MWh/a. Considering COP equal to 4.0, the capacity of the wastewater heat pump Qcap is 22.64 MW. This means that the theoretical heat amount supplied from the heat pump to the district heating network could reach 198,341 MWh/a while consuming 49,585 MWh/a of electricity. This amount of heat significantly exceeds the demand of the nearest Kaunas city district heating subnetwork. The main Kaunas city district heating network is located on the other side of the river Nemunas. Although in 2024 Kaunas city implemented a project to connect another DH subnetwork, also located on the other side of the river Nemunas, there are no plans to connect the Kaunas WWTP DH subnetwork in the coming years. For this reason, heat recovery potential from wastewater is not included in the present Kaunas WWTP energy neutrality estimations.
Increasing incoming waste streams. The annual wastewater volume of Kaunas WWTP is currently 25.5 million m3. The treatment of this wastewater produces 3.815 million m3 of biogas, or 27,161 MWh of energy value. Based on the results of the Alytus city (Lithuania) sorted food waste collection [133] and the data of the Vienna city (Austria) sorted food waste biogas power plant [134], the implementation of a sorted food waste collection system in Kaunas city would allow the collection of 11,772 t of food waste and the production of 4281 MWh of biogas per year. In this way, biogas production would increase by 15.8%. The use of additional agricultural residues in Kaunas WWTP is unlikely due to the resistance of the residents in the surrounding areas to the expansion of the WWTP. However, there are currently no agricultural biogas plants in the nearest places, so the use of agricultural waste may be technically and economically acceptable.

4. Results and Discussion

4.1. Energy Balance Before Integration of the Electrolyzer

Currently, the total energy consumption of Kaunas WWTP is 26,029 MWh. The electricity consumption is 9350 MWh (or 35.9% of the total energy), of which 80.6% was obtained from the electricity grid, 17.4% was produced in cogeneration from biogas, and 2.0%—in a solar power plant. The heat consumption is 16,129 MWh (or 62.0% of the total energy). Almost all the heat (98.1%) was produced from biogas in the boiler house and cogeneration. Only 395 MWh of natural gas was consumed for heat production (or 1.5% of the total energy). 455 MWh of diesel (or 1.7% of the total energy) was consumed in the WWTP’s own transport and for treated sludge transportation.
The energy production in Kaunas WWTP is 17,645 MWh. Of this, 15,829 MWh (or 89.7%) is heat production from biogas, 1627 MWh (or 9.2%) is electricity production from biogas, and 190 MWh (or 1.1%) is electricity production in a solar power plant. Although the energy value of the produced biogas is higher (27,161 MWh), a significant portion of the biogas energy is lost with exhaust gases when burning biogas in the boiler room and cogenerators.
Thus, the total energy balance (produced energy minus consumed energy) is negative and amounts to (−8383) MWh, or (−32.2%) of the amount of energy consumed.
The energy balance data are presented in Table 5.

4.2. Selecting the Power of the Electrolyzer

In Section 2.2. we suggested that when selecting the electrolyzer power, several main technological criteria should be assessed: (1) the possibility of using the by-product of electrolysis—oxygen; (2) the possibility of using the main product of electrolysis—hydrogen; (3) the possibility of using the by-product of electrolysis—heat and (4) the availability of renewable electricity for green hydrogen production.
Based on the data presented in Section 3, the need for pure oxygen in Kaunas WWTP for aeration is 5.824 million m3. If the primary use of hydrogen is biogas methanation, the need for hydrogen depends on the amount of biogenic CO2 generated. Currently, the need for hydrogen is 5.682 million m3, and considering sorted food waste as an additional source of raw materials—7.246 million m3. The total heat demand in Kaunas WWTP is 16,129 MWh.
Theoretically, the largest amount of renewable electricity could be produced at Kaunas WWTP if all biogas were used in cogeneration for electricity production. In the current situation, this would be 9991 MWh. After assessing the collection of sorted food waste, solar electricity and hydroelectric potential, renewable electricity production could reach 15,976 MWh.
When selecting the electrolyzer power, it is assumed that the electrolyzer will operate with electrolyzer capacity factor equal to 80% and with electrolyzer efficiency equal to 60% [13].
The options for selecting the electrolyzer power are presented in Table 4. The figures are given for two cases: V1—current situation (without additional waste, without solar power plant expansion and hydroelectricity); V2—after assessing the collection of sorted food waste, the potential of solar power and hydroelectricity.

4.3. Energy Balance After Integration of the Electrolyzer

Two system cases are compared. In the first case (V1), only the installation of an electrolyzer in WWTP was evaluated. In the second case (V2), the potential of additional raw materials (sorted food waste), solar electricity and hydroelectricity was assessed in addition to installing an electrolyzer.
In both cases, the power of the evaluated electrolyzer is selected based on oxygen demand and is 8.3 MW. It is assumed that only the waste heat of the electrolyzer will be used for the needs of the wastewater treatment plant. The excess waste heat of the electrolyzer will be supplied to the Kaunas city district heating network. The green hydrogen produced in the electrolyzer will be used for biogas methanation. The excess green hydrogen produced will be mixed into the natural gas network or used for transport. After biogas methanation, the biomethane produced will be injected into the natural gas network or used in the WWTP’s own transport and for treated sludge transportation. Biogas will not be used for heat or electricity production.
The total annual energy consumption of Kaunas WWTP is 97,697 MWh (case V1) or 102,389 MWh (case V2). In both cases, the greatest portion is electricity—64,067 MWh (65.6% and 62.6% of the total energy, respectively). Heat consumption is 16,129 MWh (16.52% and 15.87% of the total energy, respectively). Hydrogen consumption for methanation is 17,046 MWh and 21,738 MWh (17.4% and 21.2% of the total energy, respectively). Biomethane consumption in transport is 455 MWh, which in both scenarios is less than 0.5% of the total energy.
The total annual energy production in Kaunas WWTP is 94,628 MWh (case V1) or 106,898 MWh (case V2). The main types of energy produced are biomethane—39,674 MWh and 48,022 MWh (or 41.9% and 44.9%, respectively), hydrogen—34,941 MWh in both cases (36.9% and 32.7%, respectively) and heat production in the electrolyzer—25,226 MWh in both cases (23.0% and 20.8%, respectively). A small amount of electricity is also produced: in the first case 190 MWh of solar electricity (0.2% of the total amount of energy produced), in the second case 3458 MWh of solar electricity and 654 MW of hydroelectricity (3.8% of the total energy produced). In the first case, the total energy balance remains slightly negative (−3.1%) or (−3.069 MWh). In the second case, the energy balance is already somewhat positive (+4.4%) or 4508 MW.
Energy balance data are presented in Table 5.

5. Conclusions

  • The task of energy neutrality of the WWTP should be divided into two stages. In the first stage, it should be achieved that the energy balance of the WWTP becomes positive—that is, the amount of all types of useful energy produced in the WWTP exceeds the consumption of all kinds of energy in the WWTP. In the second stage, it should be sought that all renewable electricity used for green hydrogen production is generated at WWTP as is required by the EU Regulations [9].
  • The analyzed case of Kaunas WWPT showed that installing an electrolyzer in a WWTP can significantly improve the energy balance of the WWTP.
  • To effectively utilize all electrolysis products and achieve the highest energy efficiency of the WWTP, the electrolyzer selection should be conducted by assessing the possibilities of using oxygen, hydrogen, heat and the availability of green electricity. For this, detailed technical and economic modeling of the WWTP should be carried out. This is the goal of the following research by the authors of this article. In this article, the electrolyzer was selected for analysis based on the oxygen demand.
  • The main problem in ensuring that all hydrogen produced by WWTP is green usually is the unavailability of renewable electricity sources installed onsite of WWTP. The potential for solar and wind electricity production in the WWTP territory is often limited due to the size of the free WWTP territory and the immediate vicinity of the living areas. Therefore, in the case of Kaunas WWTP, the most realistic source of green electricity could be the construction of remote solar and wind parks, once the appropriate economic or political conditions are in place.
  • In the analyzed case of Kaunas WWTP, there is good access to all types of infrastructure—natural gas, electricity, heating networks, and transport refueling. In this way, the injection of the produced biomethane into the natural gas network, the mixing of hydrogen into biomethane, the use of waste electrolysis excess heat, the direct use of biomethane and hydrogen for filling transport fuel tanks and the supply of electricity to the electrolyzer can be ensured.
  • By completely replacing the air in the aeration with oxygen generated during electrolysis, the performance, and thus electricity consumption of blowers in Kaunas WWTP could be reduced by 5.5 times, from 4382 MWh to 797 MWh. The electricity consumption for wastewater treatment processes in the WWTP would be reduced by 38.3%.
  • An essential factor is the availability of electricity to the electrolyzer. Although replacing air with oxygen significantly reduces electricity demand for wastewater treatment processes in Kaunas WWTP, but due to the installation of an electrolyzer, the total electricity demand of the WWTP can increase by up to 7 times if the electrolyzer power is selected according to the oxygen demand.

Author Contributions

Conceptualization, R.L. and S.R.; methodology, R.L.; resources, R.L.; writing—original draft preparation, R.L.; writing—review and editing, S.R. and R.P.; visualization, R.L.; supervision, S.R. All authors have read and agreed to the published version of the manuscript.

Funding

This research received no external funding.

Institutional Review Board Statement

Not applicable.

Informed Consent Statement

Not applicable.

Data Availability Statement

Restrictions apply to the availability of these data. Data was obtained from the Kaunas city water management company UAB “Kauno vandenys” (Lithuania) and are available from the authors with the permission of UAB “Kauno vandenys”.

Acknowledgments

We would like to thank the Kaunas city water management company UAB “Kauno vandenys” (Lithuania) for providing data on technologies used in Kaunas WWTP and consultations.

Conflicts of Interest

The authors declare no conflicts of interest.

Abbreviations

The following abbreviations are used in this manuscript:
ADAnaerobic digestion
BHMBiological hydrogen methanation
Bio-PBiological phosphorus removal
BODBiological oxygen demand
CBGCompressed biomethane gas
CH4Methane
CHGCompressed hydrogen gas
CO2Carbon dioxide
CODChemical oxygen demand
COPCoefficient of performance
CSTRsContinuously Stirred Tank Reactors
DHDistrict heating
DIETDirect interspecies electron transfer
ECEuropean Commission
EFWEdible food waste
EUEuropean Union
FSFsFine sieved fractions
FWFood waste
GHGGreenhouse gas
H2Hydrogen
H2SHydrogen sulphide
HGVHeavy goods vehicle
IFWInedible food waste
LCALife cycle assessment
MERMethane evolution rate
N/DNNitrification-denitrification
N2ONitrous oxide
O2Oxygen
OFMSWOrganic fraction of municipal solid waste
PEPopulation equivalent
PEMProton exchange membrane
PoSProof of Sustainability
PSAPressure Swing Adsorption
QcapCapacity of wastewater heat pump
QrecTheorical potential of waste heat recovery
SOECSolid oxide olectrolyzer cell
TRLTechnology readiness level
VSVolatile solids
WWTPWastewater treatment plant

References

  1. European Commission. Questions and Answers on the New EU Rules on Treating Urban Wastewater. 2022. Available online: https://ec.europa.eu/commission/presscorner/detail/en/qanda_22_6281 (accessed on 8 May 2025).
  2. Lu, L.; Guest, J.S.; Peters, C.A.; Zhu, X.; Rau, G.H.; Ren, Z.J. Wastewater treatment for carbon capture and utilization. Nat. Sustain. 2018, 1, 750–758. [Google Scholar] [CrossRef]
  3. Maktabifard, M.; Al-Hazmi, H.E.; Szulc, P.; Mousavizadegan, M.; Xu, X.; Zaborowska, E.; Li, X.; Mąkinia, J. Net-zero carbon condition in wastewater treatment plants: A systematic review of mitigation strategies and challenges. Renew. Sustain. Energy Rev. 2023, 185, 113638. [Google Scholar] [CrossRef]
  4. Zaborowska, E.; Czerwionka, K.; Mąkinia, J. Integrated plant-wide modelling for evaluation of the energy balance and greenhouse gas footprint in large wastewater treatment plants. Appl. Energy 2021, 282 Pt A, 116126. [Google Scholar] [CrossRef]
  5. European Union. Directive (EU) 2024/3019 of the European Parliament and of the Council of 27 November 2024 Concerning Urban Wastewater Treatment (Recast). Available online: https://eur-lex.europa.eu/eli/dir/2024/3019/oj/eng (accessed on 8 May 2025).
  6. European Union. Directive (EU) 2018/2001 of the European Parliament and of the Council of 11 December 2018 on the Promotion of the Use of Energy from Renewable Sources (Recast). Consolidated Text: 2024-07-16. Available online: https://eur-lex.europa.eu/legal-content/EN/TXT/?uri=CELEX%3A02018L2001-20240716 (accessed on 8 May 2025).
  7. European Commission. Communication from the Commission to the European Parliament, the European Council, the Council, the European Economic and Social Committee and the Committee of the Regions: REPowerEU Plan (COM/2022/230 Final). Available online: https://eur-lex.europa.eu/legal-content/EN/TXT/?uri=celex:52022DC0230 (accessed on 8 May 2025).
  8. European Union. Directive (EU) 2018/844 of the European Parliament and of the Council of 30 May 2018 Amending Directive 2010/31/EU on the Energy Performance of Buildings and Directive 2012/27/EU on Energy Efficiency. Available online: https://eur-lex.europa.eu/eli/dir/2018/844/oj/eng (accessed on 8 May 2025).
  9. European Commission. Commission Delegated Regulation (EU)/… Supplementing Directive (EU) 2018/2001 of the European Parliament and of the Council by Establishing a Union Methodology Setting Out Detailed rules for the Production of Renewable Liquid and Gaseous Transport Fuels of Non-Biological Origin (C/2023/1087 Final). Available online: https://eur-lex.europa.eu/legal-content/EN/TXT/?uri=pi_com%3AC%282023%291087 (accessed on 8 May 2025).
  10. European Commission. Communication from the Commission to the European Parliament, the Council, the European Economic and Social Committee and the Committee of the Regions. A Hydrogen Strategy for a Climate-Neutral Europe (COM/2020/301 Final). Available online: https://eur-lex.europa.eu/legal-content/EN/TXT/?uri=CELEX%3A52020DC0301 (accessed on 8 May 2025).
  11. Gruber-Glatzl, W.; Brunner, C.; Meitz, S.; Schnitzer, H. From the Wastewater Treatment Plant to the Turnstiles of Urban Water and District Heating Networks. Front. Sustain. Cities 2020, 2, 523698. [Google Scholar] [CrossRef]
  12. Drewnowski, J.; Remiszewska-Skwarek, A.; Duda, S.; Łagód, G. Aeration Process in Bioreactors as the Main Energy Consumer in a Wastewater Treatment Plant. Review of Solutions and Methods of Process Optimization. Processes 2019, 7, 311. [Google Scholar] [CrossRef]
  13. Rusmanis, D.; Yang, Y.; Lin, R.; Wall, D.M.; Murphy, J.D. Operation of a circular economy, energy, environmental system at a wastewater treatment plant. Adv. Appl. Energy 2022, 8, 100109. [Google Scholar] [CrossRef]
  14. Michailos, S.; Walker, M.; Moody, A.; Poggio, D.; Pourkashanian, M. Biomethane production using an integrated anaerobic digestion, gasification and CO2 biomethanation process in a real waste water treatment plant: A techno-economic assessment. Energy Convers. Manag. 2020, 209, 112663. [Google Scholar] [CrossRef]
  15. Müller, G.; Kullmann, F.; Linssen, J.; Stolten, D. The costs of future energy technologies: A comprehensive review of power-to-X processes. J. CO2 Util. 2025, 92, 103019. [Google Scholar] [CrossRef]
  16. Sterner, M.; Specht, M. Power-to-Gas and Power-to-X—The History and Results of Developing a New Storage Concept. Energies 2021, 14, 6594. [Google Scholar] [CrossRef]
  17. Zhang, L.; Song, Y.; Shi, J.; Shen, Q.; Hu, D.; Gao, Q.; Chen, W.; Kow, K.-W.; Pang, C.; Sun, N.; et al. Frontiers of CO2 Capture and Utilization (CCU) towards Carbon Neutrality. Adv. Atmos. Sci. 2022, 39, 1252–1270. [Google Scholar] [CrossRef]
  18. Zhang, B.; Yan, K.; Lyu, Y.; Qian, Y.; Gao, H.; Tian, J.; Zheng, W.; Chen, L. A “water and carbon” near-zero emission WWTP system: Model development and techno-economic-environmental benefits assessment. Appl. Energy 2024, 371, 123727. [Google Scholar] [CrossRef]
  19. Donald, R.; Boulaire, F.; Love, J.G. Contribution to net zero emissions of integrating hydrogen production in wastewater treatment plants. J. Environ. Manag. 2023, 344, 118485. [Google Scholar] [CrossRef] [PubMed]
  20. Zhao, C.; Xu, J.; Skov, I.R.; Østergaard, P.A. Hydrogen production from treated wastewater powered by solar–wind energy: Feasibility analysis and optimal planning. Int. J. Hydrogen Energy 2024, 89, 293–309. [Google Scholar] [CrossRef]
  21. Zhao, C.; Wang, F.; Xu, J.; Tan, C.; Østergaard, P.A. Optimal planning and operation for a grid-connected solar–wind–hydro energy system in wastewater treatment plants. Renew. Energy 2024, 230, 120791. [Google Scholar] [CrossRef]
  22. Xu, J.; Zhao, C.; Wang, F.; Yang, G. Industrial decarbonisation oriented distributed renewable generation towards wastewater treatment sector: Case from the Yangtze River Delta region in China. Energy 2022, 256, 124562. [Google Scholar] [CrossRef]
  23. Llácer-Iglesias, R.M.; López-Jiménez, P.A.; Pérez-Sánchez, M. Exploring options for energy recovery from wastewater: Evaluation of hydropower potential in a sustainability framework. Sustain. Cities Soc. 2023, 95, 104576. [Google Scholar] [CrossRef]
  24. Tomczyk, P.; Mastalerek, K.; Wiatkowski, M.; Kuriqi, A.; Jurasz, J. Assessment of a Francis Micro Hydro Turbine Performance Installed in a Wastewater Treatment Plant. Energies 2023, 16, 7214. [Google Scholar] [CrossRef]
  25. Punys, P.; Jurevičius, L. Assessment of Hydropower Potential in Wastewater Systems and Application in a Lowland Country, Lithuania. Energies 2022, 15, 5173. [Google Scholar] [CrossRef]
  26. International Energy Agency (IEA). Global Hydrogen Review 2024. Available online: https://iea.blob.core.windows.net/assets/89c1e382-dc59-46ca-aa47-9f7d41531ab5/GlobalHydrogenReview2024.pdf (accessed on 8 May 2025).
  27. Jacobs, Yarra Valley Water. Towards a Zero Carbon Future. 2020. Available online: https://www.jacobs.com/sites/default/files/2022-03/jacobs-yarra-valley-water-towards-a-zero-carbon-future.pdf (accessed on 8 May 2025).
  28. Silva, J.; Gonçalves, J.C.; Rocha, C.; Vilaça, J.; Madeira, L.M. Biomethane production from biogas obtained in wastewater treatment plants: Process optimization and economic analysis. Renew. Energy 2024, 220, 119469. [Google Scholar] [CrossRef]
  29. Burrin, D.; Roy, S.; Roskilly, A.P.; Smallbone, A. A combined heat and green hydrogen (CHH) generator integrated with a heat network. Energy Convers. Manag. 2021, 246, 114686. [Google Scholar] [CrossRef]
  30. Pilz, F.; Svardal, K.; Kreuzinger, N.; Krampe, J. Model-based dynamic simulation study to boost the WWTP performance in winter tourism regions. J. Water Process Eng. 2024, 61, 105266. [Google Scholar] [CrossRef]
  31. Gabrielli, M.; Compagni, R.D.; Gusmaroli, L.; Malpei, F.; Polesel, F.; Buttiglieri, G.; Antonelli, M.; Turolla, A. Modelling and prediction of the effect of operational parameters on the fate of contaminants of emerging concern in WWTPs. Sci. Total Environ. 2023, 856, 159200. [Google Scholar] [CrossRef] [PubMed]
  32. Hallas, J.F.; Mackowiak, C.L.; Wilkie, A.C. Mitigating rural WWTP impacts: System dynamics modeling of downstream nutrient outputs. Sci. Total Environ. 2020, 744, 140809. [Google Scholar] [CrossRef]
  33. Struk-Sokołowska, J.; Miodoński, S.; Muszyński-Huhajło, M.; Janiak, K.; Ofman, P.; Mielcarek, A.; Rodziewicz, J. Impact of differences in speciation of organic compounds in wastewater from large WWTPs on technological parameters, economic efficiency and modelling of chemically assisted primary sedimentation process. J. Environ. Chem. Eng. 2020, 8, 104405. [Google Scholar] [CrossRef]
  34. Yu, W.; Liu, R.; Zhu, K.; Hao, X. Variable emission factors of CH4 and N2O from WWTPs: A model-based analysis on available data. Environ. Res. 2025, 264, 120380. [Google Scholar] [CrossRef]
  35. Shukuru, B.N.; Politaeva, N.A. Mitigating CH4 and N2O emissions from domestic and industrial wastewater. Renew. Sustain. Energy Rev. 2025, 210, 115203. [Google Scholar] [CrossRef]
  36. Zhang, Z.; Qi, F.; Liu, Y.; Asif, M.B.; Ikhlaq, A.; Wang, Z.; Chen, C.; Li, C.; Chang, J.; Li, Q.; et al. Comprehensive assessment, intelligent prediction, and precise mitigation strategies for greenhouse gas emissions in full-scale wastewater treatment plants. Environ. Res. 2025, 270, 121052. [Google Scholar] [CrossRef]
  37. Lancioni, N.; Szelag, B.; Sgroi, M.; Barbusiński, K.; Fatone, F.; Eusebi, A.L. Novel extended hybrid tool for real time control and practically support decisions to reduce GHG emissions in full scale wastewater treatment plants. J. Environ. Manag. 2024, 365, 121502. [Google Scholar] [CrossRef]
  38. Alrbai, M.; Al-Dahidi, S.; Al-Ghussain, L.; Alahmer, A.; Hayajneh, H. Minimizing grid energy consumption in wastewater treatment plants: Towards green energy solutions, water sustainability, and cleaner environment. Sci. Total Environ. 2024, 926, 172139. [Google Scholar] [CrossRef]
  39. Maktabifard, M.; Zaborowska, E.; Makinia, J. Achieving energy neutrality in wastewater treatment plants through energy savings and enhancing renewable energy production. Rev. Environ. Sci. Biotechnol. 2018, 17, 655–689. [Google Scholar] [CrossRef]
  40. Stazi, V.; Tomei, M.C. Dissolved methane in anaerobic effluents: A review on sustainable strategies for optimization of energy recovery or internal process reuse. J. Clean. Prod. 2021, 317, 128359. [Google Scholar] [CrossRef]
  41. Yao, Y.; Huang, G.; An, C.; Chen, X.; Zhang, P.; Xin, X.; Shen, J.; Agnew, J. Anaerobic digestion of livestock manure in cold regions: Technological advancements and global impacts. Renew. Sustain. Energy Rev. 2020, 119, 109494. [Google Scholar] [CrossRef]
  42. Swedish Environmental Protection Agency (SEPA). Biogas ur Gödsel, Avfall och Restprodukter—Goda Svenska Exempel; SEPA: Stockholm, Sweden, 2012; pp. 1–116. Available online: https://www.diva-portal.org/smash/get/diva2:1614170/FULLTEXT01.pdf (accessed on 8 May 2025).
  43. Xiong, Y.-T.; Zhang, J.; Chen, Y.-P.; Guo, J.-S.; Fang, F.; Yan, P. Geographic distribution of net-zero energy wastewater treatment in China. Renew. Sustain. Energy Rev. 2021, 150, 111462. [Google Scholar] [CrossRef]
  44. Renfrew, D.; Vasilaki, V.; Katsou, E. Indicator based multi-criteria decision support systems for wastewater treatment plants. Sci. Total Environ. 2024, 915, 169903. [Google Scholar] [CrossRef] [PubMed]
  45. Pascuzzi, S.; Anifantis, A.S.; Blanco, I.; Scarascia Mugnozza, G. Electrolyzer Performance Analysis of an Integrated Hydrogen Power System for Greenhouse Heating. A Case Study. Sustainability 2016, 8, 629. [Google Scholar] [CrossRef]
  46. Lagoeiro, H.; Maidment, G.; Ziemele, J. Potential of treated wastewater as an energy source for district heating: Incorporating social elements into a multi-factorial comparative assessment for cities. Energy 2024, 304, 132190. [Google Scholar] [CrossRef]
  47. Saravanakumar, A.; Sudha, M.R.; Chen, W.H.; Pradeshwaran, V. Hydrogen and biomethane pathways to achieve sustainable transportation in circular economic concept: A review. Int. J. Hydrogen Energy 2025, 143, 403–419. [Google Scholar] [CrossRef]
  48. European Hydrogen Observatory. Hydrogen Production. Available online: https://observatory.clean-hydrogen.europa.eu/hydrogen-landscape/production-trade-and-cost/hydrogen-production (accessed on 8 May 2025).
  49. Nord Pool. Prices. Available online: https://data.nordpoolgroup.com/auction/day-ahead/prices?deliveryDate=latest&currency=EUR&aggregation=YearlyAggregate&deliveryAreas=GER (accessed on 8 May 2025).
  50. Fan, Y.; Lei, Z.; Guo, Z.; Huang, W.; Wang, D.; Wang, X.; Zhang, Z.; Shimizu, K. Enhanced solubilization of solid organics and methane production by anaerobic digestion of swine manure under nano-bubble water addition. Bioresour. Technol. 2020, 299, 122512. [Google Scholar] [CrossRef] [PubMed]
  51. Mohammadpour, H.; Cord-Ruwisch, R.; Pivrikas, A.; Ho, G. Utilisation of oxygen from water electrolysis—Assessment for wastewater treatment and aquaculture. Chem. Eng. Sci. 2021, 246, 117008. [Google Scholar] [CrossRef]
  52. Environmental Protection Agency Ireland (EPA Ireland). Waste Water Treatment Manuals. Primary, Secondary and Tertiary Treatment. Available online: https://www.susana.org/_resources/documents/default/3-3017-7-1520420240.pdf (accessed on 8 May 2025).
  53. Pera, L.; Gandiglio, M.; Marocco, P.; Pumiglia, D.; Santarelli, M. Trace contaminants in biogas: Biomass sources, variability and implications for technology applications. J. Environ. Chem. Eng. 2024, 12, 114478. [Google Scholar] [CrossRef]
  54. Gkotsis, P.; Kougias, P.; Mitrakas, M.; Zouboulis, A. Biogas upgrading technologies—Recent advances in membrane-based processes. Int. J. Hydrogen Energy 2023, 48, 3965–3993. [Google Scholar] [CrossRef]
  55. Dada, O.I.; Yu, L.; Neibergs, S.; Chen, S. Biodesulfurization: Effective and sustainable technologies for biogas hydrogen sulfide removal. Renew. Sustain. Energy Rev. 2025, 209, 115144. [Google Scholar] [CrossRef]
  56. Haosagul, S.; Prommeenate, P.; Hobbs, G.; Pisutpaisal, N. Sulfur-oxidizing bacteria in full-scale biogas cleanup system of ethanol industry. Renew. Energy 2020, 150, 965–972. [Google Scholar] [CrossRef]
  57. European Biogas Association (EBA). Statistical Report 2022: Tracking Biogas and Biomethane Deployment Across Europe; EBA: Brussels, Belgium, 2022; pp. 1–162. Available online: https://www.europeanbiogas.eu/__trashed-3/ (accessed on 8 May 2025).
  58. Macor, A.; Benato, A. Regulated Emissions of Biogas Engines—On Site Experimental Measurements and Damage Assessment on Human Health. Energies 2020, 13, 1044. [Google Scholar] [CrossRef]
  59. Ghimire, A.; Gyawali, R.; Lens, P.N.L.; Lohani, S.P. Chapter 11—Technologies for removal of hydrogen sulfide (H2S) from biogas. In Emerging Technologies and Biological Systems for Biogas Upgrading; Aryal, N., Ottosen, L.D.M., Kofoed, M.V.W., Pant, D., Eds.; Academic Press: Cambridge, MA, USA, 2021; pp. 295–320. [Google Scholar] [CrossRef]
  60. Wasajja, H.; Lindeboom, R.E.F.; van Lier, J.B.; Aravind, P.V. Techno-economic review of biogas cleaning technologies for small scale off-grid solid oxide fuel cell applications. Fuel Process. Technol. 2020, 197, 106215. [Google Scholar] [CrossRef]
  61. Cano, P.I.; Colón, J.; Ramírez, M.; Lafuente, J.; Gabriel, D.; Cantero, D. Life cycle assessment of different physical-chemical and biological technologies for biogas desulfurization in sewage treatment plants. J. Clean. Prod. 2018, 181, 663–674. [Google Scholar] [CrossRef]
  62. Corey, K.; Zappa, L. Global Environmental Solutions, Inc. Odor Control “ABC’s”. How to Compare and Evaluate Odor Control Technologies. 2018. Available online: http://gesodorcontrol.com/abcs.pdf (accessed on 8 May 2025).
  63. Barbusiński, K.; Urbaniec, K.; Kasperczyk, D.; Thomas, M. Chapter 2—Biofilters versus bioscrubbers and biotrickling filters: State-of-the-art biological air treatment. In From Biofiltration to Promising Options in Gaseous Fluxes Biotreatment; Soreanu, G., Dumont, É., Eds.; Elsevier: Amsterdam, The Netherlands, 2020; pp. 29–51. [Google Scholar] [CrossRef]
  64. Wang, J.; Wen, J.; Wang, J.; Yang, B.; Jiang, L. Water electrolyzer operation scheduling for green hydrogen production: A review. Renew. Sustain. Energy Rev. 2024, 203, 114779. [Google Scholar] [CrossRef]
  65. Ravina, M.; Castellana, C.; Panepinto, D.; Zanetti, M.C. MCBioCH4: A computational model for biogas and biomethane evaluation. J. Clean. Prod. 2019, 227, 739–747. [Google Scholar] [CrossRef]
  66. Rusmanis, D.; O’Shea, R.; Wall, D.M.; Murphy, J.D. Biological hydrogen methanation systems—An overview of design and efficiency. Bioengineered 2019, 10, 604–634. [Google Scholar] [CrossRef]
  67. Vo, T.T.Q.; Xia, A.; Wall, D.M.; Murphy, J.D. Use of surplus wind electricity in Ireland to produce compressed renewable gaseous transport fuel through biological power to gas systems. Renew. Energy 2017, 105, 495–504. [Google Scholar] [CrossRef]
  68. Guilera, J.; Andreu, T.; Basset, N.; Boeltken, T.; Timm, F.; Mallol, I.; Morante, J.R. Synthetic natural gas production from biogas in a waste water treatment plant. Renew. Energy 2020, 146, 1301–1308. [Google Scholar] [CrossRef]
  69. Götz, M.; Lefebvre, J.; Mörs, F.; Koch, A.M.; Graf, F.; Bajohr, S.; Reimert, R.; Kolb, T. Renewable Power-to-Gas: A technological and economic review. Renew. Energy 2016, 85, 1371–1390. [Google Scholar] [CrossRef]
  70. Angelidaki, I.; Treu, L.; Tsapekos, P.; Luo, G.; Campanaro, S.; Wenzel, H.; Kougias, P.G. Biogas upgrading and utilization: Current status and perspectives. Biotechnol. Adv. 2018, 36, 452–466. [Google Scholar] [CrossRef] [PubMed]
  71. Voelklein, M.A.; Rusmanis, D.; Murphy, J.D. Biological methanation: Strategies for in-situ and ex-situ upgrading in anaerobic digestion. Appl. Energy 2019, 235, 1061–1071. [Google Scholar] [CrossRef]
  72. Lecker, B.; Illi, L.; Lemmer, A.; Oechsner, H. Biological hydrogen methanation—A review. Bioresour. Technol. 2017, 245 Pt A, 1220–1228. [Google Scholar] [CrossRef] [PubMed]
  73. Kapoor, R.; Ghosh, P.; Kumar, M.; Vijay, V.K. Evaluation of biogas upgrading technologies and future perspectives: A review. Environ. Sci. Pollut. Res. 2019, 26, 11631–11661. [Google Scholar] [CrossRef]
  74. Kougias, P.G.; Treu, L.; Benavente, D.P.; Boe, K.; Campanaro, S.; Angelidaki, I. Ex-situ biogas upgrading and enhancement in different reactor systems. Bioresour. Technol. 2017, 225, 429–437. [Google Scholar] [CrossRef]
  75. Kougias, P.G.; Tsapekos, P.; Treu, L.; Kostoula, M.; Campanaro, S.; Lyberatos, G.; Angelidaki, I. Biological CO2 fixation in up-flow reactors via exogenous H2 addition. J. Biotechnol. 2020, 319, 1–7. [Google Scholar] [CrossRef]
  76. Wu, L.; Wei, W.; Song, L.; Woźniak-Karczewska, M.; Chrzanowski, Ł.; Ni, B.-J. Upgrading biogas produced in anaerobic digestion: Biological removal and bioconversion of CO2 in biogas. Renew. Sustain. Energy Rev. 2021, 150, 111448. [Google Scholar] [CrossRef]
  77. Luo, G.; Angelidaki, I. Hollow fiber membrane based H2 diffusion for efficient in situ biogas upgrading in an anaerobic reactor. Appl. Microbiol. Biotechnol. 2013, 97, 3739–3744. [Google Scholar] [CrossRef]
  78. Vo, T.T.Q.; Wall, D.M.; Ring, D.; Rajendran, K.; Murphy, J.D. Techno-economic analysis of biogas upgrading via amine scrubber, carbon capture and ex-situ methanation. Appl. Energy 2018, 212, 1191–1202. [Google Scholar] [CrossRef]
  79. Ericsson, K. Biogenic Carbon Dioxide as Feedstock for Production of Chemicals and Fuels: A Technoeconomic Assessment with a European Perspective; Miljö- och Energisystem, LTH, Lunds Universitet: Lund, Sweden, 2017; pp. 1–48. Available online: https://lucris.lub.lu.se/ws/portalfiles/portal/31711760/Biogenic_carbon_dioxide_as_feedstock_for_production_of_chemicals_and_fuels_IMES_report_103.pdf (accessed on 8 May 2025).
  80. Burkhardt, M.; Koschack, T.; Busch, G. Biocatalytic methanation of hydrogen and carbon dioxide in an anaerobic three-phase system. Bioresour. Technol. 2015, 178, 330–333. [Google Scholar] [CrossRef]
  81. Ministry of Energy of the Republic of Lithuania. Frequently Asked Questions About Electricity Generating Consumers. Available online: https://enmin.lrv.lt/lt/veiklos-sritys-3/atsinaujinantys-energijos-istekliai/elektros-energija-gaminantys-vartotojai/dazniausiai-uzduodami-klausimai-apie-elektra-gaminancius-vartotojus/ (accessed on 8 May 2025).
  82. Seimas of the Republic of Lithuania. Law of the Republic of Lithuania on Renewable Energy Resources Nr. XI-1375. Consolidated Text: 2025-01-23. Available online: https://e-seimas.lrs.lt/portal/legalAct/lt/TAD/TAIS.398874/asr (accessed on 8 May 2025).
  83. Lithuanian Wind Power Association (LVEA). Wind Energy in Lithuania 2022. Available online: https://lvea.lt/en/lithuanian-statistics/ (accessed on 8 May 2025).
  84. Chae, K.-J.; Kim, I.-S.; Ren, X.; Cheon, K.-H. Reliable energy recovery in an existing municipal wastewater treatment plant with a flow-variable micro-hydropower system. Energy Convers. Manag. 2015, 101, 681–688. [Google Scholar] [CrossRef]
  85. Mérida García, A.; Rodríguez Díaz, J.A.; García Morillo, J.; McNabola, A. Energy Recovery Potential in Industrial and Municipal Wastewater Networks Using Micro-Hydropower in Spain. Water 2021, 13, 691. [Google Scholar] [CrossRef]
  86. Ehalt Macedo, H.; Lehner, B.; Nicell, J.; Grill, G.; Li, J.; Limtong, A.; Shakya, R. Distribution and characteristics of wastewater treatment plants within the global river network. Earth Syst. Sci. Data 2022, 14, 559–577. [Google Scholar] [CrossRef]
  87. European Small Hydropower Association (ESHA). Guide on How to Develop a Small Hydropower Plant, 2nd ed.; ESHA: Brussels, Belgium, 2004; pp. 1–296. Available online: https://energycommunityplatform.eu/wp-content/uploads/2022/06/Merged-Guide-Develop-a-Small-Hydropower-Plant.pdf (accessed on 8 May 2025).
  88. Zhou, D.; Deng, Z.D. Ultra-low-head hydroelectric technology: A review. Renew. Sustain. Energy Rev. 2017, 78, 23–30. [Google Scholar] [CrossRef]
  89. Munaaim, M.A.C.; Razali, N.; Ayob, A.; Hamidin, N.; Mydin, M.A.O. Potential of Micro Hydroelectric Generator Embedded at 30,000 PE Effluent Discharge of Sewerage Treatment Plant. E3S Web. Conf. 2018, 34, 2037. [Google Scholar] [CrossRef]
  90. European Environment Agency (EEA). Greenhouse Gas Emission Intensity of Electricity Generation, Country Level. Chart (Interactive), Published 25 October 2024, Modified 15 April 2025. Available online: https://www.eea.europa.eu/en/analysis/indicators/greenhouse-gas-emission-intensity-of-1/greenhouse-gas-emission-intensity-of-electricity-generation-country-level (accessed on 8 May 2025).
  91. European Hydrogen Backbone (EHB). European Hydrogen Infrastructure Map. Available online: https://ehb.eu/page/h2-infrastructure-map (accessed on 8 May 2025).
  92. International Energy Agency (IEA). IEA Bioenergy Task 37—Country Reports Summaries 2019. 2020. Available online: https://www.ieabioenergy.com/wp-content/uploads/2020/03/IEA-Task-37-Country-Report-Summaries-2019-1.pdf (accessed on 8 May 2025).
  93. Cristello, J.B.; Yang, J.M.; Hugo, R.; Lee, Y.; Park, S.S. Feasibility analysis of blending hydrogen into natural gas networks. Int. J. Hydrogen Energy 2023, 48, 17605–17629. [Google Scholar] [CrossRef]
  94. Wu, X.; Zhang, H.; Yang, M.; Jia, W.; Qiu, Y.; Lan, L. From the perspective of new technology of blending hydrogen into natural gas pipelines transmission: Mechanism, experimental study, and suggestions for further work of hydrogen embrittlement in high-strength pipeline steels. Int. J. Hydrogen Energy 2022, 47, 8071–8090. [Google Scholar] [CrossRef]
  95. Erdener, B.C.; Sergi, B.; Guerra, O.J.; Chueca, A.L.; Pambour, K.; Brancucci, C.; Hodge, B.-M. A review of technical and regulatory limits for hydrogen blending in natural gas pipelines. Int. J. Hydrogen Energy 2023, 48, 5595–5617. [Google Scholar] [CrossRef]
  96. Minister of Energy of the Republic of Lithuania. Order on Approval of Natural Gas Quality Requirements Nr. 1-194. Consolidated Text: 2024-12-10. Available online: https://e-seimas.lrs.lt/portal/legalAct/lt/TAD/TAIS.457419/asr (accessed on 8 May 2025).
  97. Mahajan, D.; Tan, K.; Venkatesh, T.; Kileti, P.; Clayton, C.R. Hydrogen Blending in Gas Pipeline Networks—A Review. Energies 2022, 15, 3582. [Google Scholar] [CrossRef]
  98. Munćan, V.; Mujan, I.; Macura, D.; Anđelković, A.S. The state of district heating and cooling in Europe—A literature-based assessment. Energy 2024, 304, 132191. [Google Scholar] [CrossRef]
  99. The Association for Decentralised Energy (ADE). Market Report: Heat Networks in the UK. 2018. Available online: https://www.theade.co.uk/media/qh2npmkg/heat-networks-in-the-uk_v5-web-single-pages.pdf (accessed on 8 May 2025).
  100. Tiktak, J. Heat Management of PEM Electrolysis: A Study on the Potential of Excess Heat from Medium-to Large-Scale PEM Electrolysis and the Performance Analysis of a Dedicated Cooling System. Master’s Thesis, Delft University of Technology, Delft, The Netherlands, 2019. Available online: https://scispace.com/pdf/heat-management-of-pem-electrolysis-a-study-on-the-potential-13l7kpv6y9.pdf (accessed on 7 May 2025).
  101. Li, J.; Lin, J.; Song, Y.; Xing, X.; Fu, C. Operation optimization of power to hydrogen and heat (P2HH) in ADN coordinated with the district heating network. IEEE Trans. Sustain. Energy 2019, 10, 1672–1683. Available online: https://ieeexplore.ieee.org/document/8454770 (accessed on 3 June 2025). [CrossRef]
  102. Ministry of Energy of the Republic of Lithuania. Lithuania’s National Energy Independence Strategy. Available online: https://enmin.lrv.lt/public/canonical/1731396595/5432/NENS%202024-2.12.pdf (accessed on 8 May 2025).
  103. Ember Energy. Data on the EU Electricity Sector in 2023. Power Sector CO2 Emissions. Available online: https://ember-energy.org/latest-insights/european-electricity-review-2024/eu-electricity-trends/#power-sector-co2-emissions (accessed on 8 May 2025).
  104. Schäfer, M.; Gretzschel, O.; Schmitt, T.G.; Knerr, H. Wastewater Treatment Plants as System Service Provider for Renewable Energy Storage and Control Energy in Virtual Power Plants—A Potential Analysis. Energy Procedia 2015, 73, 87–93. [Google Scholar] [CrossRef]
  105. European Biogass Association (EBA). 22 bcm of Biogases were Produced in Europe in 2023, According to a New Report Released Today. Available online: https://www.europeanbiogas.eu/22-bcm-of-biogases-were-produced-in-europe-in-2023according-to-a-new-report-released-today/ (accessed on 8 May 2025).
  106. Spirito, G.; Dénarié, A.; Cirillo, V.F.; Casella, F.; Famiglietti, J.; Motta, M. Energy mapping and district heating as effective tools to decarbonize a city: Analysis of a case study in Northern Italy. Energy Rep. 2021, 7, 254–262. [Google Scholar] [CrossRef]
  107. Miranzadeh, M.B.; Jafarsalehi, M.; Akram, J.; Ebrahimi, M.; Mazaheri, A.; Mashayekh, M. Boosting biogas production in the wastewater treatment plants: A narrative review on co-digestion of sewage sludge with internal and external organic waste. Bioresour. Technol. Rep. 2024, 26, 101856. [Google Scholar] [CrossRef]
  108. Snieška, D. Gas powered heavy duty trucks—Solutions from Scania. In Proceedings of the European Innovation Partnership (EIP) Project Conference “Use of Innovative Biogas Production Technologies and Biomethane in Agriculture and Heavy Transport”, Kaunas, Lithuania, 7 March 2024. [Google Scholar]
  109. Xia, A.; Cheng, J.; Song, W.; Su, H.; Ding, L.; Lin, R.; Lu, H.; Liu, J.; Zhou, J.; Cen, K. Fermentative hydrogen production using algal biomass as feedstock. Renew. Sustain. Energy Rev. 2015, 51, 209–230. [Google Scholar] [CrossRef]
  110. Sayer, M.; Ajanovic, A.; Haas, R. On the economics of a hydrogen bus fleet powered by a wind park—A case study for Austria. Int. J. Hydrogen Energy 2022, 47, 33153–33166. [Google Scholar] [CrossRef]
  111. International Energy Agency (IEA). Task 37: Energy from Biogas. Available online: http://task37.ieabioenergy.com/ (accessed on 8 May 2025).
  112. Swedish Environmental Protection Agency (SEPA). Wastewater Treatment in Sweden 2018; SEPA: Stockholm, Sweden, 2020; pp. 1–36. Available online: https://www.naturvardsverket.se/4a4387/globalassets/media/publikationer-pdf/8800/978-91-620-8867-5.pdf (accessed on 8 May 2025).
  113. Masłoń, A.; Czarnota, J.; Szaja, A.; Szulżyk-Cieplak, J.; Łagód, G. The Enhancement of Energy Efficiency in a Wastewater Treatment Plant through Sustainable Biogas Use: Case Study from Poland. Energies 2020, 13, 6056. [Google Scholar] [CrossRef]
  114. Fernando-Foncillas, C.; Estevez, M.M.; Uellendahl, H.; Varrone, C. Co-Management of Sewage Sludge and Other Organic Wastes: A Scandinavian Case Study. Energies 2021, 14, 3411. [Google Scholar] [CrossRef]
  115. Budych-Gorzna, M.; Smoczynski, M.; Oleskowicz-Popiel, P. Enhancement of biogas production at the municipal wastewater treatment plant by co-digestion with poultry industry waste. Appl. Energy 2016, 161, 387–394. [Google Scholar] [CrossRef]
  116. Maragkaki, A.E.; Fountoulakis, M.; Kyriakou, A.; Lasaridi, K.; Manios, T. Boosting biogas production from sewage sludge by adding small amount of agro-industrial by-products and food waste residues. Waste Manag. 2018, 71, 605–611. [Google Scholar] [CrossRef]
  117. Shen, Y.; Linville, J.L.; Urgun-Demirtas, M.; Schoene, R.P.; Snyder, S.W. Producing pipeline-quality biomethane via anaerobic digestion of sludge amended with corn stover biochar with in-situ CO2 removal. Appl. Energy 2015, 158, 300–309. [Google Scholar] [CrossRef]
  118. Sillero, L.; Solera, R.; Perez, M. Improvement of the anaerobic digestion of sewage sludge by co-digestion with wine vinasse and poultry manure: Effect of different hydraulic retention times. Fuel 2022, 321, 124104. [Google Scholar] [CrossRef]
  119. Cavinato, C.; Bolzonella, D.; Pavan, P.; Fatone, F.; Cecchi, F. Mesophilic and thermophilic anaerobic co-digestion of waste activated sludge and source sorted biowaste in pilot- and full-scale reactors. Renew. Energy 2013, 55, 260–265. [Google Scholar] [CrossRef]
  120. Di Capua, F.; Spasiano, D.; Giordano, A.; Adani, F.; Fratino, U.; Pirozzi, F.; Esposito, G. High-solid anaerobic digestion of sewage sludge: Challenges and opportunities. Appl. Energy 2020, 278, 115608. [Google Scholar] [CrossRef]
  121. European Union. Directive 2008/98/EC of the European Parliament and of the Council of 19 November 2008 on Waste and Repealing Certain Directives (Waste Framework Directive). Available online: https://eur-lex.europa.eu/eli/dir/2008/98/oj/eng (accessed on 8 May 2025).
  122. Mayanti, B. Life cycle assessment and waste reduction optimisation of household food waste in Finland. Sci. Total Environ. 2024, 957, 177438. [Google Scholar] [CrossRef]
  123. Silvennoinen, K.; Nisonen, S.; Katajajuuri, J.-M. Food waste amount, type, and climate impact in urban and suburban regions in Finnish households. J. Clean. Prod. 2022, 378, 134430. [Google Scholar] [CrossRef]
  124. Stenmarck, Å.; Jensen, C.; Quested, T.; Moates, G. ResearchGate. Estimates of European Food Waste Levels. 2016. Available online: https://www.researchgate.net/publication/301216380_Estimates_of_European_food_waste_levels (accessed on 8 May 2025).
  125. De Laurentiis, V.; Caldeira, C.; Serenella, S.; Barco Cobalea, H. Review of Studies on Food Waste Accounting at Member State Level; Publications Office of the European Union: Luxembourg, 2019; pp. 1–66. Available online: https://data.europa.eu/doi/10.2760/340637 (accessed on 8 May 2025).
  126. Zhang, J.; Hu, Q.; Qu, Y.; Dai, Y.; He, Y.; Wang, C.-H.; Tong, Y.W. Integrating food waste sorting system with anaerobic digestion and gasification for hydrogen and methane co-production. Appl. Energy 2020, 257, 113988. [Google Scholar] [CrossRef]
  127. Ellacuriaga, M.; González, R.; Gómez, X. Feasibility of coupling hydrogen and methane production in WWTP: Simulation of sludge and food wastes co-digestion. Energy Nexus 2024, 14, 100285. [Google Scholar] [CrossRef]
  128. Shi, L.; Yang, Q.; Xu, Z.Z.; Yang, C. Technologies for in-situ H2S control in wastewater treatment plants: A review. J. Water Process Eng. 2024, 65, 105716. [Google Scholar] [CrossRef]
  129. Striūgas, N.; Valinčius, V.; Pedišius, N.; Poškas, R.; Zakarauskas, K. Investigation of sewage sludge treatment using air plasma assisted gasification. Waste Manag. 2017, 64, 149–160. [Google Scholar] [CrossRef] [PubMed]
  130. AB Kauno Energija. City Heat. Available online: https://www.miestosiluma.lt/ (accessed on 8 May 2025).
  131. Cipolla, S.S.; Maglionico, M. Heat recovery from urban wastewater: Analysis of the variability of flow rate and temperature. Energy Build. 2014, 69, 122–130. [Google Scholar] [CrossRef]
  132. Lagoeiro, H.; Davies, G.; Revesz, A.; Maidment, G. Heat recovery opportunities from wastewater treatment plants. In Proceedings of the American Society of Heating, Refrigerating and Airconditioning Engineers (ASHRAE) Conference, Atlanta, GA, USA, 4–8 February 2023; Available online: https://openresearch.lsbu.ac.uk/item/958z4 (accessed on 8 May 2025).
  133. Alytus Regional Waste Management Center. Company Activity Report for 2023. Available online: https://www.aratc.lt/uploads/Veiklos%20ataskaitos/ARATC%20ataskaita%202023.pdf (accessed on 8 May 2025).
  134. Biogas Vienna. From Food Waste to Biogas. Available online: https://www.wien.gv.at/umwelt/ma48/service/publikationen/pdf/infoblatt-biogas-wien-en.pdf (accessed on 8 May 2025).
Figure 1. Technological diagram of Kaunas WWTP (developed by Kaunas WWTP).
Applsci 15 07417 g001
Figure 2. Energy diagram of Kaunas WWTP. Existing situation (developed by the authors).
Applsci 15 07417 g002
Figure 3. Energy diagram of Kaunas WWTP with integrated green H2 production (developed by the authors).
Applsci 15 07417 g003
Table 1. The main WWTP processes by time characteristics and main type of energy (structured by the authors).
Process NameThe Temporal Nature of the ProcessMain Type of Energy
ContinuousIntermittentVolatileElectricityHeat
Energy-consuming processes
Anaerobic digestionX X
Biogas cleaningX X
Biogas upgradingX X
Sludge managementXX XX
AerationXX X
MethanationX X
ElectrolysisXX X
Energy-generating processes
Solar power production XX
Wind power production XX
CogenerationXX XX
Hydropower productionX X
ElectrolysisXX X
Table 2. Main WWTP processes according to the technological readiness level (structured by the authors).
Technology NameTechnology Readiness LevelApplication in WWTP
Laboratory ScalePilot
Scale
Industrial ScaleDemo CasesIndustrial CasesWide
Use
Biogas production X X
Biogas upgrading X X
Biogas cogeneration X X
Biological removal of H2S with oxygen aerationX X
Oxygen aeration X X
Co-digestion XX X
Electrolysis X X
Biological CO2 methanation in situX X
Biological CO2 methanation ex situ X X
Chemical (catalytic) CO2 methanation XX
Hydrogen cogeneration XXX
Sludge gasificationXX X
Sludge incineration X X
Heat pumps X X
Solar power plants X XX
Wind power plants X X
Electricity storage (batteries) XX
Hydro power plants X X
Biomethane-powered transport X X
Hydrogen-powered transport XX
Biogas boiler exhaust gas CO2 methanationXX X
Table 3. The main data of Kaunas WWTP (structured by the authors).
Parameter NameValueUnitsParameter NameValueUnits
Wastewater treatment plant Power
Total territory of WWTP19.3haTotal power demand of WWTP9350MWh/a
Free territory of WWTP7.8haPower demand for basic tech. processes, MWh/a:
Wastewater inflow -sludge management;4115MWh/a
Number of inhabitants in Kaunas302,875vnt-biological treatment of wastewater;4382MWh/a
Wastewater inflow into WWTP25,501,000m3/a-other processes and administrative premises.854MWh/a
Wastewater amount in popul. equivalent (PE)392,413PEPower demand for basic tech. processes, %:
Wastewater biological oxygen demand (BOD)337mg O2/L-sludge management;44.0%%
Sludge -biological treatment of wastewater;46.9%%
Dewatered sludge (dry mass)7175t DM/a-other processes and administrative premises.9.1%%
Dewatered sludge (wet mass)31,367t/aPower production from biogas in cogenerators1627MWh/a
Humidity of dewatered sludge77.1%%Power from the grid7533MWh/a
Dried sludge (dry mass)3533t DM/aPower production in a solar power plant190MWh/a
Dried sludge (wet mass)3926t/aTotal power prod. in WWTP from RES, MWh/a1817MWh/a
Humidity of dried sludge10.0%%Total power production in WWTP from RES, %19.4%%
Moisture evaporated during sludge drying11,519t/aInstalled power of solar power plant200kW
Sludge drying temperature85°CNatural gas
Installed power of the sludge dryer1.95MWNatural gas consumption, nm3/a37,215nm3/a
Heat consumption for sludge drying7320MWh/aNatural gas consumption, MWh/a395MWh/a
Energy value of dewatered sludge38,315MWh/aBiogas
Aeration Biogas production, nm3/a3,814,800nm3/a
Power consumption for aeration4382MWh/aBiogas production, MWh/a27,161MWh/a
Oxygen amount for aeration5,823,558m3/aBiogas energy value7.12kWh/m3
Heat Biogas storage volume1200m3
Total heat demand of WWTP16,129MWh/aBiogas cons. for heat production in boilerhouse2,711,456m3/a
Heat demand for basic tech. processes, MWh/a: Biogas cons. for power prod. in cogenerators924,813m3/a
-heating of anaerobic digesters;4633MWh/aBiogas utilization in the flare178,531m3/a
-sludge drying;7320MWh/aTransport
-other processes and administrative premises.4176MWh/aDiesel consumption in WWTP transport100MWh/a
Heat demand for basic tech. processes, %: Diesel consumption for sludge transportation355MWh/a
-heating of anaerobic digesters;28.7%%Hydro energy
-sludge drying;45.4%%Hydro power production from wastewater0MWh/a
-other processes and administrative premises.25.9%%Hydro power potential from wastewater654MWh/a
Heat production from natural gas301MWh/a
Heat production from biogas in the boiler house14,692MWh/a
Heat production from biogas in cogenerators1137MWh/a
Total heat prod. in WWTP from RES, MWh/a15,829MWh/a
Total heat production in WWTP from RES, %98.1%%
Table 4. Electrolyzer power selection options (structured by the authors).
Levels of Electrolyzer CapacityBased on O2 DemandBased on H2
Demand
Based on Heat DemandBased on Electricity
Availability
Case *V1 and V2V1V2V1 and V2V1V2
Electrical power of electrolyzer, MW8.34.15.26.81.42.3
Electricity consumption, MWh/a58,30228,44236,27147,440999115,976
Hydrogen production, mln m3/a11.65.77.29.52.03.2
Oxygen production, m3/a5.82.83.64.71.01.6
Heat production, MWh/a19,823967012,33216,12933975432
* V1—current situation (without additional waste, without solar power plant expansion and hydroelectricity). V2—after assessing the collection of sorted food waste, the potential of solar power and hydroelectricity.
Table 5. Energy balance data (structured by the authors).
Energy FormExisting SituationCase V1 *Case V2 *
Energy consumptionMWh/aMWh/aMWh/a
Electricity consumption935064,06764,067
Heat consumption (produced from biogas)15,829
Heat consumption (produced in electrolyzer) 16,12916,129
Natural gas consumption for heat production395
Hydrogen consumption 17,04621,738
Consumption of diesel as a transport fuel455
Consumption of biomethane as a transport fuel 455455
Total net energy consumption:26,02997,697102,389
Energy productionMWh/aMWh/aMWh/a
Heat production from biogas15,829
Power production from biogas1627
Power production in the existing solar power plant190190190
Biomethane production 39,67448,022
Hydrogen production 34,94134,941
Useful heat production in the electrolyzer 19,82319,823
Solar power production, additional potential 3268
Hydropower production 654
Total useful energy production:17 64594,628106,898
Energy balance
Energy balance, MWh/a−8383−30694508
Energy balance, %−32.2%−3.1%4.4%
* Existing situation—without electrolyzer. Case V1—with electrolyzer only. Case V2—electrolyzer + food waste + PV + hydro.
Disclaimer/Publisher’s Note: The statements, opinions and data contained in all publications are solely those of the individual author(s) and contributor(s) and not of MDPI and/or the editor(s). MDPI and/or the editor(s) disclaim responsibility for any injury to people or property resulting from any ideas, methods, instructions or products referred to in the content.

