Abstract
In the context of vulnerability management for data communication networks, determining which vulnerabilities to address first is of paramount importance. While identifying vulnerabilities using network scanners is relatively straightforward, efficiently prioritizing them for mitigation remains a significant challenge. Previously, our team developed a machine learning-based converter to translate CVSS v2.0 base scores into CVSS v3.x base scores, specifically to enable the use of the CVSS v3.x environmental score. The central question of this research is whether leveraging these converter-enabled CVSS v3.x environmental scores leads to a measurably improved vulnerability prioritization process compared to traditional methods, often reliant solely on CVSS v2.0 base scores. The environmental score potentially offers a more refined, context-specific perspective on vulnerability impact within specific systems. To evaluate this approach, we will test the converter’s performance in real-world environments and assess its impact on network administrator decision-making and workflows. Performance improvement will be measured by analyzing changes in mitigation times, potential threat exposure reduction, and overall vulnerability management efficiency. The ultimate goal is to determine if the proposed machine learning based methodology delivers practical benefits, enhancing organizational security through more accurate and effective vulnerability prioritization.Experimental results demonstrate that CVSS v3.x environmental scoring resolves critical v2.0 imprecision issues, enabling more accurate vulnerability prioritization. Our approach achieves measurable efficiency gains, reducing estimated remediation work hours by up to 8% compared to CVSS v2.0 methods. The study confirms that the proposed methodology delivers practical benefits, enhancing organizational security through more accurate and effective vulnerability prioritization.
1. Introduction
In recent years, the number of vulnerabilities detected and announced in public knowledge databases, such as the National Vulnerability Database (NVD) [1], is increasing steadily [2,3,4]. As a result, each year since 2016, new vulnerability disclosure records have been established. For example, more than 1500 new vulnerabilities were announced in January and the first few days of February 2024. Vulnerabilities concern both hardware and software and reached an almost 25% increase in number between the years 2021 and 2022 [4]. As stated in [4], only a few of the newly reported vulnerabilities would be actively used for exploitation. However, the number of accumulated vulnerabilities has passed 200,000 and many of them have matured exploits that still present a real threat. Consequently, cyber security experts face the challenging task of identifying critical vulnerabilities and prioritizing remediation efforts effectively [2,3,4].
To assess vulnerability criticality in an environmental context, one needs to calculate the environment score. In the case of environmental calculations using the Common Vulnerability Scoring System v2.0, variables such as the potential of collateral damage (), target distribution (), confidentiality (C), integrity (I) and availability (A) must be taken into account in the overall score. The CVSS v2.0 environmental score contains significant limitations [5], while the absence of CVSS v3.x base scores for legacy vulnerabilities prevent using superior v3.x environmental scoring. Therefore, in this contribution, we utilize a novel approach, adopting a machine learning conversion mechanism, which allows us to calculate the CVSS v3.x base score knowing the CVSS v2.0 base score [6,7]. Once all base CVSS v3.x scores are known, the CVSS v3.x environmental scores can be calculated [8]. Finally, vulnerability prioritization can be fully implemented using the CVSS v3.x standard. Compared with commercially available vulnerability scanners, the proposed approach offers a transparent way in which the prioritization process is applied, allowing the end user to understand the rationale behind the automatic decisions made by the presented Vulnerability Management Center (VMC) in version 1.0.2 software [9]. According to the authors’ knowledge, such an approach has not been presented before in the publicly available literature. Thus, in summary, the major contribution of this paper is a practical implementation of the vulnerability management process using CVSS 3.x environmental score.
This paper is divided into the following subsections.
- Background—provides an overview of the fundamental concepts in vulnerability management, outlining key challenges, methodologies, and trade-offs encountered in this research area.
- Related Work—reviews existing literature relevant to the topic, including a summary of approaches to managing work-related vulnerabilities. Additionally, this section introduces a proposed vulnerability management model that leverages a machine learning converter to map CVSS v2.0 base scores to CVSS v3.x.
- Methodology—describes approaches and methods taken during research, describing research environment.
- Methods of evaluation for vulnerability management models—highlights the effectiveness of evaluation models for vulnerability management in the identified VM models by using the CVSS standard.
- Machine learning algorithms for conversion of CVSS base score from 2.0 to 3.x—describes the topics related to converting the method of base assessment to version 3.x of the standard.
- Results—presents an analysis of the findings, highlighting the benefits of the proposed software. It also explores the performance of the models introduced and evaluates the outcomes achieved.
- Conclusions—summarizes obtained results.
2. Background
The idea of a Common Vulnerability Enumeration (CVE) was introduced in 1999 [10]. The authors of the CVE concept recognized the need for a consistent, unified and universal method of vulnerability description that enables stakeholders to mitigate interoperability issues. Before CVE, each vulnerability was marked by an individual set of methods, designed with a specific product in mind [10,11,12]. Consequently, comparing data from various vendors and managing vulnerability systems was a highly time-consuming task [10,12]. The CVE concept has gained widespread acceptance in both the literature and industry, to the extent that it is now integrated not only in intrusion detection systems (IDSs) [13], but also across various sectors of the cybersecurity landscape [14,15,16]. Since 1999, a large number of software vendors and non-profit organizations have been developing, promoting, and implementing a variety of competing vulnerability assessment systems, for example, X-Force [17], Symantec [18], Microsoft [19], Redhat [20], Mozilla [21], Secunia [22], Vulpen [23], Google [24], VRSS [23], and CVSS [25]. Currently, software vendors X-Force, Symantec, Microsoft, Redhat, Mozilla, and Google [17,18,19,20,21,24] continue to maintain their research departments, while the Secunia solution [22] is no longer being developed, and VRSS [23] was not successfully approved.
The Common Vulnerability Scoring System (CVSS) was first introduced as a research project by the National Infrastructure Advisory Council (NIAC) in 2005 [25]. Due to some concerns from early adopters, work on a new version of the standard has been initiated. As a result, CVSS in version 2.0 [26] was introduced in 2007. In the next years, organizations such as Risk-based Security and the Open Security Foundation have published an open letter enumerating failures and errors regarding CVSS v2.0 [27]. The authors indicated a lack of specificity in the metrics and, consequently, due to the scores obtained, it was not possible to distinguish a vulnerability type and risk profile when assessing. Furthermore, the research indicated that CVSS requires extensive expertise on the exact impact of a vulnerability. Despite the demonstrated failures of the CVSS, this standard is still used today.
Common Vulnerability Scoring System standards, CVSS v2 and CVSS v3.x, involve three types of score metrics: Base, Temporal, and Environmental. The base category represents the properties of a vulnerability that are constant over time. However, the base score may change depending on the information that requires an update of the score to allow for changes in the metric vector upon new information gathered. The temporal score is a modifier for the base vulnerability in time based on the maturity of an exploit, possible remediation techniques, and confidence of the vulnerability reports. Environmental score metrics are environment-specific modifiers that help to evaluate risk for particular ICT environments.
As part of further improvements to the CVSS standard, new versions, v3.0 and v3.1, were introduced. Standard v3.0 implemented a new approach towards metric parameters and calculations, and the latest version focused on clarifying the ambiguous metrics [28]. CVSS v3.0 was presented in 2015 as an update for the CVSS v2.0 version. This standard demonstrates a new vulnerability calculation method and excludes both the target distribution, and the collateral damage potential, , from the environment score vector. CVSS v3.0 differs from v2.0 by refining vulnerability categorization and assigning vector features to assessment components. It maintains the three categories:
- Base—describing constant parameters of vulnerability,
- Temporal—describing time-changing parameters,
- Environmental—describing the context of vulnerability within the environment.
Considering the base category, the following changes have been implemented:
- In terms of confidentiality and integrity, the scoring values were changed to none, low or high,
- The Physical (P) value was added to the attack vector, indicating a vulnerability that forces the attacker to have physical access to the system in order to be exploited,
- User Interaction () was implemented with values: None (N) and Required (R). This new parameter indicates whether the interaction with a user is essential in order to exploit the vulnerability by an attacker,
- Privileges Required () parameter was implemented with three values: None (N), Low (L) and High H) in order to confirm whether any permissions (e.g., administrative) are required for the attacker to successfully exploit the vulnerability.
Considering the environmental score vector, the most significant change includes removing the parameters and and replacing them with the so-called modified base parameters. Modifiers were able to alter each of the base parameters, by an organization or operator, in order to present vulnerability in a specific ICT environment.
The CVSS v3.0 standard was widely criticized for an inaccurate description of parameter values, due to which their various interpretations are possible [29]. Consequently, in 2019, the CVSS v3.1 update was released, which clarified the description of metrics, making them more understandable for the recipient; however, regarding the CVSS calculation method, the form of parameters and the vector representation have not changed.
Having discussed the CVSS standards themselves in more detail, we now move on to present the related work in order to show how this paper’s contribution complements the results obtained by other research teams.
3. Related Work: Vulnerability Management Models
Many research teams have paid attention to the problem of vulnerability prioritization [30,31,32,33]. Most established organizations, with a strong focus on cybersecurity, implemented the vulnerability management process to a greater or lesser extent [30,34,35]. However, as clarified in [30,31,32,33,35], each organization differs in its approach to vulnerability management. Solutions presented in [36], such as F-Secure [37], Qualys [38], Rapid7 [39] or Tenable [40], are products that address major problems in vulnerability management and provide custom-made solutions to address vulnerabilities. However, these commercial solutions do not disclose the details of vulnerability prioritization procedures [41].
Alongside commercial solutions, there is a large portion of open-source projects in the area of vulnerability prioritization, such as PatchRank [42], Vulcon [43], CMS [44], CAVP [45], or VEST [46]. However, none of these solutions [42,43,44,45,46] offers prioritization according to the CVSS v2.0 and CVSS v3.x standards [6,7,12]. This is because the majority of CVSS v2.0 base scores have not been converted to the CVSS v3.x standard until now.
An important aspect of vulnerability prioritization that should be emphasized concerns the organizations that use metrics submitted by the Center for Internet Security (CIS). These metrics were created in 2010 [47] to measure the security level of the ICT infrastructure. In order to meet the requirements of CIS metrics, organizations most frequently choose a standard considering the CVSS v2.0 base score, excluding the CVSS v3.x model, due to a lack of availability of the CVSS v3.x base score for all vulnerabilities. Furthermore, according to several independent researchers [34,48,49], vulnerability management models that rely solely on the base score are inadequate. The time characteristic was tested mainly by Ruohonen in [50], while the environmental characteristic was analyzed by researchers who aimed to estimate the risk value, the potential loss and the prevalence of affected systems within the discussion environment. An additional context of the environment is essential to accurately estimate the security level. Hence, in most recent papers, the importance of the CVSS v3.x environmental score calculation is stressed. Thus, in [5], the authors pursued the route of combining both CVSS v2.0 and CVSS v3.x standards to at least take advantage of the improved accuracy of the CVSS v3.x standard in cases where the CVSS v3.x base score is known, while in [6,7] a machine learning tool was developed to convert base scores from CVSS v2.0 to the CVSS v3.x standard.
Extending our previous vulnerability management research [5,41,51], this paper presents the Vulnerability Management Center (VMC), a scalable cloud-based distributed system. A key function of VMC is to aggregate vulnerability data from public sources and internal ICT networks (using scanners such as Nessus [52]) and correlate it with inventory data. Specifically, this paper details the application of VMC in two crucial areas: translating CVSS v2 scores to CVSS v3.1 scores and subsequently calculating CVSS v3.1 environmental Scores to provide a more accurate and context-aware vulnerability assessment and prioritization. Thus, using machine learning methods, we are able to fully implement CVSS v3.1 in the vulnerability management process. The main contribution of this paper that goes beyond the previously published work consists of implementing CVSS v3.1 in selected test environments and evaluating the potential benefits compared to CVSS v2.0.
Having described the main contribution of this paper, we now describe the methodology used in this research. The next section also gives a more detailed description of the novel aspects of the presented work. First, we outline the methodology used for the calculation of CVSS scores in a given environment. In Section 4, Methodology, we present the method that was used to estimate the time needed to handle vulnerabilities (the time it takes for a vulnerability to remain in the system without any attention from the security team). In the next section, we present the machine learning algorithms used to calculate the CVSS v3.x base scores, assess environmental scores, and then present the results.
4. Methodology
To assess the performance of machine learning algorithms in converting CVSS v2.0 scores to CVSS v3.x, two distinct ICT environments were artificially constructed and scanned using the Nessus vulnerability scanner (Tenable, Inc., Columbia, Maryland). Nessus was selected for its extensive plugin library, which allows the detection of a wide range of vulnerabilities, supporting both CVSS standards. The environments were designed to replicate real-world ICT infrastructures without exposing operational systems to risk. The first environment comprised 23 servers, while the second contained 15 servers, each offering various services, including product development and back-office operations.
Machine learning algorithms were trained on this dataset to automate the conversion from CVSS v2.0 to CVSS v3.x. The performance of the vulnerability management models was evaluated by comparing the times related to mitigating problems prioritized using different models. The two environments, which feature a diverse range of vulnerabilities, enabled a comprehensive evaluation of the generalizability and effectiveness of the models across different network configurations.
We then calculate the environmental CVSS v3.x score for all identified vulnerabilities, allowing the elimination of the CVSS v2.0 environmental score from the prioritization process and consequently the removal of the parameter, which addresses the inherent issues of the CVSS v2.0 standard. The proposed vulnerability management model, illustrated in Figure 1, begins with a vulnerability scan conducted using the Nessus scanner. The results are fed into a CVSS base score calculation module. For vulnerabilities where only the CVSS v2.0 base score is available, a machine learning converter is used to calculate the CVSS v3.x base scores [6,7]. Once all base CVSS v3.x scores are obtained, an initial prioritization is performed. In the subsequent step, information from the asset database is utilized to compute the CVSS v3.x environmental scores for all vulnerabilities. The process of assigning environmental metrics might be achieved with VMC in an automated manner, altered by the operator by adjusting the Impact Subscore Modifiers: confidentiality, integrity and availability requirements for CVSS v3.x environmental metrics. It is also possible to alter other parameters of the environmental score in order to adjust the base CVSS v3.x score using modifiers from the environmental score.
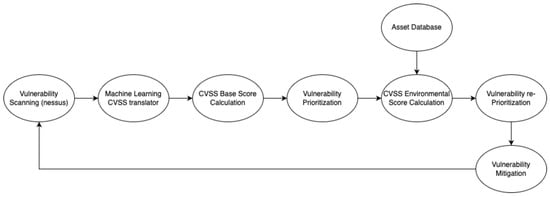
Figure 1.
Model of vulnerability management process.
After this calculation, the final prioritization is performed. The process ends with decisions on the handling of detected vulnerabilities, broadly classified as vulnerability mitigation in Figure 1, which may involve actions such as updating to non-vulnerable versions or applying patches.
The use of artificially constructed environments in this study provides a controlled and representative setting to evaluate the proposed methodology. Although these environments are not live production systems, they are designed to reflect key characteristics of real-world ICT—testing environments effectively mimic production systems by replicating key infrastructure components, including hardware specifications, server configurations, network topology, and software versions, while implementing production-like datasets through data masking techniques, identical security policies, deployment processes, and monitoring systems. This approach ensures that the identified vulnerabilities, as well as their categorization under both CVSS standards, are consistent with those found in operational networks. By replicating common server and service setups, artificial environments are capable of capturing a broad spectrum of potential vulnerabilities, providing a reliable basis for assessing the performance of machine learning models.
In addition, the controlled nature of these environments allows for a focused and risk-free evaluation of the proposed method. In production systems, the scanning process could introduce risks, such as potential downtime or unintended impacts on operational services. Using artificial environments, this study ensures that such risks are mitigated while still allowing a robust analysis of the machine learning algorithms’ ability to accurately convert CVSS scores. Consequently, the use of sample environments strikes a balance between replicating real-world conditions and maintaining a safe testing environment, ensuring that the results are valid and applicable to practical vulnerability management scenarios.
This research presents a novel approach to vulnerability management by building on our previously developed machine learning model to calculate CVSS v3.x scores. The key focus is not only on automating the conversion from CVSS v2.0 to v3.x but also on evaluating how the AI-based model improves the vulnerability prioritization process. Although CVSS v2.0 has been widely used, it lacks the granularity and context awareness provided by CVSS v3.x, particularly with respect to environmental metrics. The main contribution of this research is therefore to assess the degree to which our AI model enhances prioritization, allowing organizations to make more informed decisions about which vulnerabilities pose the highest risk to critical assets.
5. Research Environment
To provide a comparison of the proposed vulnerability management models, two ICT environments were scanned using Nessus [52], as described in the previous section. Both environments were artificially generated, based on real ICTs, to show several aspects and product types of ICT networks, without putting the production environment at risk. The first environment consists of 23 servers, while the second one consists of 15 servers. Both provide various services, from the development of the product to back-office functions. The environments were scanned, identifying 42 vulnerabilities, categorized according to the CVSS v2.0 and CVSS v3.x standard. In addition, more than 300 informational vulnerabilities, such as open ports and service identifications, were reported but excluded from further analysis. The vulnerability data was pre-processed, focusing on features relevant to CVSS conversion, such as base scores and vector metrics, and then normalized for use in machine learning models.
Table 1 shows the summary of the vulnerabilities detected by the Nessus scanner. The difference in the number of detected vulnerabilities between the Nessus report and the CVSS classified vulnerabilities is due to the fact that the scanning software categorizes multiple CVEs into one vulnerability. For instance, the reported vulnerabilities from respective Nessus plugins “134944 − PHP 7.3.x < 7.3.16 Multiple Vulnerabilities” and “98865 PHP 7.2.x < 7.2.1 Multiple Vulnerabilities” were assigned to multiple CVEs. Corresponding CVEs were linked to the first group: CVE-2020-7064, CVE-2020-7065, and CVE-2020-7066, while the second group included CVE-2018-14884, CVE-2018-5711, and CVE-2018-5712.

Table 1.
The number of the detected vulnerabilities according to CVSS base scores for the tested environment.
Figure 2 shows a histogram of vulnerability categorization for both standards, CVSS v2.0 and CVSS v3.x. The detected vulnerabilities, as much as 71% and 50% for the CVSS v2.0 and CVSS v3.x standards, respectively, correspond to the medium category. A more detailed analysis of the vulnerabilities was conducted in the results section of this article.
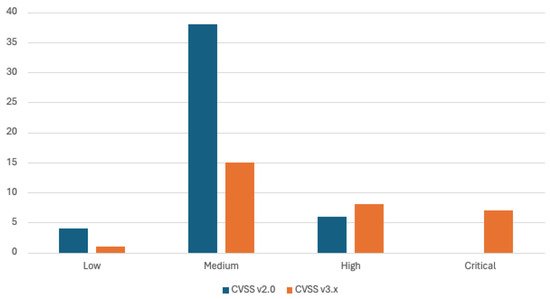
Figure 2.
Histogram of the vulnerability categories divided into CVSS v2.0 and 3.x base scores for the tested environment.
By integrating machine learning-based scoring with asset management, we tested in well-defined selected environments whether this approach improves the prioritization accuracy. Hence, our primary objective is to determine if the AI model results in a better vulnerability management and is not simply reducible to merely streamlining the transition between two CVSS standards.
6. Methods of Evaluation for Vulnerability Mitigation Models
To assess the effectiveness of the vulnerability management models proposed in the previous chapter (Figure 1) a time metric introduced in [43] and extended in [41] has been considered. In [43], the authors interviewed engineers responsible for vulnerability mitigation and classified vulnerability mitigation steps into the following categories:
- From 1 to 3 h (configuration),
- From 3 to 6 h (fix by software version update),
- From 6 to 9 h (fix by operating system update).
It should be noted that the correlation between the severity of the vulnerability and the required time could differ for different organizations. The time required for developers mitigating vulnerability might be unique; hence, the following calculations do not involve cases where no official patching, or other mitigation process, is recommended.
Based on previously introduced work time ranges, the vulnerability fix time () was divided into three subcategories:
- —addressing maximum time effort, in hours (9 h), required to fix vulnerability,
- —addressing average time effort, in hours (4.5 h), required to fix vulnerability,
- —addressing minimum time effort, in hours (1 h), required to fix vulnerability,
Those time ranges would provide additional information regarding possible time ranges when fixing vulnerabilities, based on those additional calculations performed, addressing effort in time for the ICT administrator.
Assuming that administrators must fix all vulnerabilities with critical (), high () and medium () classification, the time required for mitigation vulnerabilities can be expressed as the sum of the number of vulnerabilities to be fixed and the corresponding number of work hours. In addition, the scan duration should also be taken into account. Taking into account all the contributing terms for the CVSS v2.0 base score, the relevant equation is the following.
is the number of work hours required to fix one vulnerability, while and indicate the number of vulnerabilities with, respectively, high and medium severity level, according to the CVSS v2.0 base score.
In an analogous manner for CVSS v3.x, the following equation was obtained:
where is the number of critical vulnerabilities.
, denote, respectively, the number of vulnerabilities with a critical, high, and medium severity level, according to the CVSS v3.x base score.
As the CVSS base score relates to a subjective assessment performed outside of the organization, it is possible that the low severity category () includes vulnerabilities that are underestimated. Therefore, administrators should include all vulnerabilities in the mitigation process, in order to exclude the risk of omitting a vulnerability with an underestimated assessment [49,53]. The modified equation for the model with the CVSS v2.0 base score, which minimizes the risk in case an underestimated vulnerability is not fixed, is expressed as follows:
denotes the work hours required to fix one vulnerability, while , , indicate a number of vulnerabilities with high, medium and low severity level, respectively, according to the CVSS v2.0 base score.
Considering the vulnerability management model using the CVSS v3.x base score, we obtain:
, , and denote vulnerability number with a critical, high, medium and low severity level, respectively, according to the CVSS v3.x base score.
We note that for models with an environmental score, the time of prioritization with the developed software () should also be included. Consequently, due to more precise assessment, involving the environmental score component, for the CVSS v2.0 environmental model, one obtains the following equation:
is the duration of prioritization, while , are the number of vulnerabilities with a high and medium severity level, according to the CVSS v2.0 environmental score, respectively.
Analogously, considering the CVSS v3.x environmental model:
, and are the critical, high and medium severity levels according to the CVSS v3.x environmental score, respectively.
The comparison between vulnerability management models based on the number of work hours required to mitigate critical, high, and medium vulnerabilities serves the purpose of comparing different approaches to vulnerability prioritization. We note that more agile prioritization methods might not only improve security posture in a shorter time, but also increase responsiveness to newly emerging vulnerabilities during the ICT network life cycle. Therefore, next, we present the machine learning techniques used in this contribution.
7. Machine Learning Algorithms for Conversion of CVSS Base Score from 2.0 to 3.x
The conversion from CVSS v2.0 base scores to CVSS v3.x involves facing several challenges simultaneously. Firstly, imbalanced data pose difficulties during the learning phase, leading to a deterioration in predictive accuracy. In addition, the final results of the calculation of the CVSS v3.x base score are related to a function expressed by 8 parameters (Attack Vector, Attack Complexity, Privileges Required, User Interaction, Scope, Confidentiality, Integrity, Availability), each of which is expressed by one of several values ranging from 2 to 4.
The vector (AV, AC, PR, UI, S, C, I, A) and the values of each vector component, used to calculate the CVSS v3.x base scores, contain a total of 2592 combinations, assigned to 101 values, in the range of 0 to 10, with increments of 0.1. The CVSS v3.x base score is classified into five qualitative severity rating scales: informational, low, medium, high, and critical. These categories are not equally distributed, with proportions of 1:39:30:20:11, respectively. The asymmetry in the category range suggests that when the CVSS v3.x base score is 0, there is no risk of misjudgment when converting from the CVSS v2.0 base score to CVSS v3.x. In contrast, as the score increases, the deviation from critical to high values is less pronounced.
The approach proposed in [6,7] to solve the problem of base score conversion between the CVSS v2.0 and CVSS v3.x standards used the following steps. Once data is collected, training vectors are selected to obtain the classification precision for each of the eight components for the CVSS v3.x base score vector. For this purpose, two concepts were used that exploit the median and the correlation of the vectors. The median of vector concept aims to fully balance data with undersampling, while the correlation of the vector concept statistically binds all the CVSS v3.x vector parameters, thus allowing for training vectors that follow a constant rule. As a result, a common training set [6] was created. The next step was an extraction of the relevant features from the set of vectors obtained, using Principal Component Analysis (PCA). Several statistical classification methods, including the Support Vector Machine (SVM), Naive Bayes classifier, and K-nearest neighbor (kNN), were applied. Once the most efficient methods for classifying within a given parameter of the CVSS v3.x vector were determined, the classification attempts were carried out while increasing the number of vectors of the trained set from 100 to 1000. Thus, the authors were able to choose the best candidate for machine learning algorithms and optimize classification models.
The research shown in [6,7] indicates that the original CVSS v2.0 base score vectors were mapped to CVSS v3.x with low precision. To enhance accuracy, the original feature vector was augmented with an additional 50, 100, 500, and 1000 dimensions. These additional features were extracted from vulnerability descriptions, with the values computed by normalizing keyword frequencies (dividing the number of occurrences by 100). Text processing and feature extraction were performed using the Natural Language Toolkit (NLTK) [54] library. Finally, we note that since the obtained data are imbalanced, the undersampling method, discussed in [6], was implemented. The research was conducted with the following machine learning algorithms:
- The k-Nearest Neighbors (kNN) algorithm with Euclidean metric (E) and cosine similarity (C),
- Naive Bayes classifier (NB),
- Probabilistic Neural Network (PNN),
- Soft Independent Modeling of Class Analogy (SIMCA),
- Kernel support vector machine (KSVM) consists of two configurations, namely, with a linear kernel function and Trained Gaussian Radial Basis Function (TGRBF) [55]. Considering a learning loop, KSVM TRGBF uses a 2-fold cross-validation (2-fold CV), Misclassification Ratio (MCR), an NM algorithm with a 50 starting points set, and kNN with a cosine (C) metric required for the final classification of unrecognized samples. Furthermore, in the case of KSVM TRGBF, a One-vs-One (OvO) approach was applied for parameters indicating at least three classes.
The optimization of the machine learning algorithm parameters was performed using a five-fold cross-validation on a 100-element dataset. The test process was repeated 10 times to calculate the averaged values for the Misclassification Ratio (MCR), precision, recall, and the F1 score. Following this, the classification accuracy for the chosen algorithms was evaluated over 30 tests, each utilizing 1000 randomly selected element vectors. The algorithm parameters were re-optimized to maximize classification accuracy while minimizing result discrepancies.
Having described the research methodology, we now move on to the presentation of the results.
8. Results
This section presents the results obtained from the vulnerability management process conducted in selected test environments. Figure 3 illustrates the distribution of vulnerabilities assessed in severity categories using both the CVSS v2.0 and CVSS v3.x base models, including environmental scores.
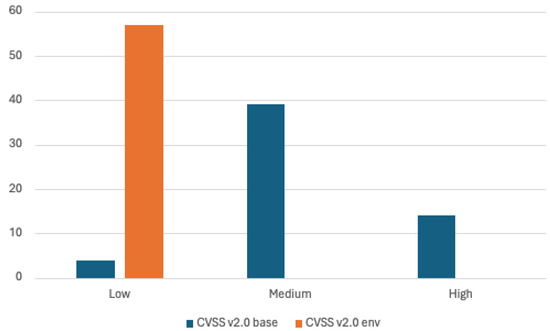
Figure 3.
The number of detected vulnerabilities for each severity category according to CVSS v2.0 base and environmental score for the tested ICT environment.
Figure 4 shows the matrix of the output of the vulnerability category classification for the conversion of the CVSS v2.0 base score to CVSS v3.x, which was the result of algorithms previously presented applied to 71,000 vulnerabilities obtained from NVD [1]. The numbers on the vertical and horizontal axes have the following meaning: 0—informational; 1—low; 2—medium; 3—high; 4—critical. These results show that the applied solution obtains the best result in the critical category (precision 90.3%, sensitivity 87.8%) and the worst in the low category (precision 27%, sensitivity 12.4%) for CVSS v3.x. In particular, only class 2 vectors were incorrectly assigned to the information category. One might conclude that the method prefers to overestimate the vulnerability category for class 1 (low) and class 2 (medium), classified respectively as medium and high, which, from the point of view of the IT security system, represents a safer solution than an underestimation. In the case of classes 2 (medium) and 3 (high), most misclassification occurs within adjacent categories. In 8.55% of the cases, they were incorrectly assigned to class 3 (high), instead of class 2 (medium), and the category of 3.81% of the rest of the cases was underestimated. Taking into account class 3 (high), about 12.30% of the cases were assigned a lowered category, while 3.54% were assigned a critical category. Finally, considering the results shown in Figure 4, one can see that the average accuracy for the classification of all categories is equal to 85.52%.
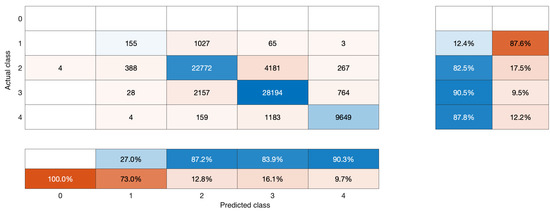
Figure 4.
Matrix of vulnerability category classification errors from CVSS v2.0 base score to CVSS v3.x.
The misclassification patterns observed in Figure 4 can be attributed to several key factors. Poor performance in the low category (precision 27%, sensitivity 12.4%) is mainly due to fundamental differences in scoring methodologies between CVSS v2.0 and v3.x standards. Specifically, CVSS v3.x introduces finer-grained metrics such as Privileges Required (PR) and User Interaction (UI), which were not present in CVSS v2.0. Vulnerabilities that scored low in CVSS v2.0 due to limited metric precision may legitimately deserve higher scores under the more nuanced evaluation of v3.x. The introduction of the scope parameter S in CVSS v3.x fundamentally changes the way impact is calculated, particularly for vulnerabilities that affect multiple components, i.e., a changed scope. The disproportionate representation of categories (1:39:30:20:11 for corresponding severity categories) potentially creates a bias toward over-representation of medium and high categories, explaining why the algorithm tends to overestimate rather than underestimate severity. Some effects might also be due to the over-representation of higher-scored vulnerabilities—typically, it is less likely for lower vulnerabilities to be added to vulnerability databases.
The data illustrated in Figure 3 reveal a significant limitation of the CVSS v2.0 environmental score: Throughout, all identified vulnerabilities were consistently classified as low severity, even those with high base scores. Further analysis indicates that the Temporal Difference (TD) parameter was the primary factor contributing to these low environmental scores [5]. Since none of the scanned vulnerabilities affected more than 25% of the machines in the studied environments, the TD parameter was uniformly assigned a low value (TD:L). Consequently, the impact of other environmental parameters—Collateral Damage Potential (), Confidentiality (C), Integrity (I), and Availability (A)—on the resulting severity categorization was minimal.
To illustrate this, consider the ‘log4shell’ vulnerability (CVE-2021-44228), which has a high base score of 9.3 and a base vector of AV:N/AC:M/Au:N/C:C/I:C/A:C/. When this is combined with an environmental vector of CDP:H/TD:L/CR:H/IR:H/AR:H, the resulting overall score is a mere 2.4, leading to a low-severity classification. This discrepancy arises because only 9% of the ICT machines were susceptible to CVE-2021-44228. In particular, the CVSS v2.0 environmental score, and consequently the overall score, employs the TD parameter as a multiplier in its calculation. This inherent characteristic implies that a vulnerability management model relying solely on the CVSS v2.0 environmental score risks overlooking critical vulnerabilities, particularly without an expert understanding of the CVSS v2.0 standard.
The fundamental limitations of the CVSS v2.0 environmental score that make it ineffective for the identification of critical vulnerabilities include the calculation of the CVSS v2.0 environmental score that uses as a multiplicative factor. This design means that any vulnerability affecting less than 25% of the systems (: L = 0.25) automatically receives a severe score reduction regardless of its actual criticality. The interdependence between parameters and creates scenarios where the high potential for collateral damage is negated by the low target distribution.
Figure 5 illustrates the distribution of vulnerabilities based on the difference between their baseline scores and the recalculated environmental scores using CVSS v2.0. Taking into account the environmental parameters Confidentiality (C), Integrity (I), Availability (A), Collision Damage Potential () and Temporal Difference (), all base CVSS v2.0 scores were modified within a range of −8.9 to −2.4. The absence of unmodified environmental scores compared to base scores is attributed to the calculation of the environmental score detailed in Equation 3.2.3 of the CVSS v2.0 specification [26], where the final score is multiplied by the TD parameter.
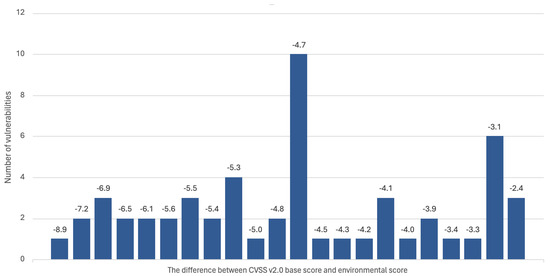
Figure 5.
The number of vulnerabilities modified for a given difference value between CVSS v2.0 base score and CVSS v2.0 environmental score for the tested ICT environment.
To understand the temporal implications of vulnerability remediation, we analyzed estimated work hours using time calculation formulae from Section 4. The CVSS v2.0 base score was calculated with (1) and (3); The work hours of the environmental score were calculated with . Table 2 shows the estimated work hours to address vulnerabilities in the tested ICT environments, prioritized by CVSS v2.0 scores. assumes remediation of high/medium-severity vulnerabilities, accepting residual risk by not addressing a low-severity issue. remediates all vulnerabilities, acknowledging that CVSS v2.0 environmental scores may underestimate risk. assumes accurate evaluations and includes time for scanning ( and prioritization (). consistently increases work hours by 7.5% compared to , reflecting the cost of comprehensive remediation. Remediating all vulnerabilities based on base scores reduces the risk of underestimation, but it questions the value of the CVSS v2.0 environmental score. Compared to and , shows a substantial reduction in estimated work hours (97.4% and 97.6%, respectively). This suggests that incorporating an environmental context can improve resource allocation efficiency. However, this depends on the accuracy and relevance of the environmental parameters. The potential for the parameter to disproportionately influence the environmental score raises concerns about whether it accurately reflects real-world risk. This highlights the need for careful scrutiny of CVSS v2.0 environmental scores and more robust contextualization methods.
Table 2.
The number of work hours required to remove a significant security vulnerability for a tested ICT environment.
To analyze the properties of the proposed vulnerability management model presented in Section 3 and Figure 1, scanning results without assigning a CVSS v3.x base score were processed using the machine learning converter discussed in Section 5. Translation allowed all vulnerabilities to be assigned a CVSS v3.x base score. As a result, CVSS v3.x environmental score assignment was possible for all vulnerabilities.
Upon analyzing environmental parameters for the CVSS v3.x base score, two cases were distinguished. One consists of using machine learning methods to convert CVSS v2.0 base scores to CVSS v3.x ones when a newer standard is unavailable. The second case involves no use of the machine learning converter when the CVSS v3.x base score is available.
Figure 6 shows the number of detected vulnerabilities categorized by severity according to the CVSS v3.x base score and the environmental scores for the ICT environment tested. The results of Figure 6 show significant changes between the CVSS v3.x base score and the environmental one. An increased number of critical vulnerabilities and a decrease in the number of high vulnerabilities is also observed. This is mainly due to the environmental parameters C, I, and A.
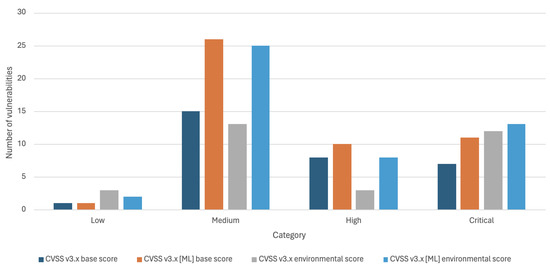
Figure 6.
The number of detected vulnerabilities for each severity category according to the CVSS v3.x base score and environmental score.
Figure 7 shows the number of all changes in the value of the CVSS v3.x environmental score when referring to the CVSS v3.x base score. The environmental parameters C, I, and A modified base scores in the range from −2.1 to 1.9, which made up 51% of all detected vulnerabilities, while the environmental parameters C, I, and A modified 38 base scores in the range from −2.1 to 1.9, which corresponds to 48.1% of all detected vulnerabilities.
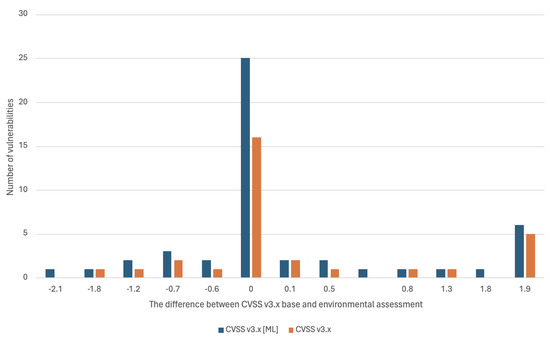
Figure 7.
The number of vulnerabilities modified for a given difference value between CVSS v3.x base score and CVSS v2.0 environmental score for the tested ICT environment.
Table 3 shows the number of changes in severity category with between the CVSS v2.0 base score and the CVSS v3.x base score (calculated using machine learning). The most significant change in detected vulnerabilities was observed for the critical (+2) and high (−2) categories.
Table 3.
The number of changes in the vulnerability categories implementing the conversion of CVSS v2.0 base score to CVSS v3.x with machine learning.
Table 4 shows the number of changes regarding the severity category when the C, I, and A environmental parameters are considered. This time the results do not include the conversion mechanism of the CVSS v2.0 base score to the CVSS v3.x base score using machine learning, which means that the vulnerabilities with no CVSS v3.x base score, are not considered. The most significant change in the number of detected vulnerabilities was recorded for critical (+5) and high (−5) categories.
Table 4.
The number of changes in vulnerability categories once the environmental parameters are considered.
Table 5 shows the number of work hours needed to remove significant vulnerabilities from tested ICT environments. For CVSS v3.x base scores, the estimated number of work hours was calculated with the following formulae: (2), (4) from Section 4. In the case of the CVSS v3.x environmental score, the estimated number of work hours was calculated with the formula (6). The values of times were calculated assuming that the administrator needs to fix only the critical, high, and medium vulnerabilities; thus, the risk related to vulnerability of a low severity in the system would be considered acceptable. Furthermore, it should be noted that in the case of CVSS v3.x base score prioritization, which does not consider environmental data among vulnerabilities classified as low, vulnerability underestimation could occur. The values of were estimated with the assumption that an administrator needs to fix all vulnerabilities, including low-severity ones. The values for times were estimated by assuming that all vulnerability assessments were classified accurately. The estimated work hours of compared to , include a noticeable increase in the estimated number of work hours for all the comparison cases considered (, , ).
Table 5.
The number of work hours required to remove significant security vulnerabilities in a tested ICT environment.
Furthermore, it can be observed that fixing all vulnerabilities according to the prioritization obtained with the CVSS v2.0 base score reduces the risk of underestimating vulnerability criticality from 34.1% to 31.7%. When the results for and are compared, one can observe that the average gain of an estimated number of work hours decreases for all cases considered and is equal to 5.12%. Implementing the prioritization using the CVSS v3.x environmental score allows us to limit the risk of not fixing the underestimated vulnerability from 34.1% to 29.1%. On the other hand, when the results obtained for and are compared, one can observe that the average gain of an estimated number of work hours decreases for all the cases considered and is equal to 8.15%. Furthermore, due to the prioritization of vulnerabilities according to the CVSS v3.x environmental score, the risk of using a fixed vulnerability by an attacker is equal to 29.1%. In the case of implementing the conversion of CVSS v2.0 to the CVSS v3.x standard with machine learning, the results obtained for and show an increase in the number of estimated work hours by 51% due to the increase in the number of vulnerabilities evaluated. Furthermore, implementing the conversion of the CVSS v2.0 base score to the CVSS v3.x base score reduces the risk of using the fixed vulnerability of an attacker from 34.1% to 2.4%. Finally, prioritizing according to the CVSS v3.x environmental score, the risk of not fixing the vulnerability that an attacker may use is reduced from 34.1% to 2.4% compared to the CVSS v2.0 standard.
Using the time required to achieve this fix might not offer a clear understanding of the vulnerabilities, yet prioritization of tasks in organizations might be tied to the effort required for mitigations.
Based on the results, one might conclude that the use of the CVSS v2.0 environmental score could result in an underestimation of vulnerabilities and the production of residual risk. However, without calculating the base score using the v3.x standard, there will not be a possibility to use a finer solution, the CVSS v3.x environmental score. Using proposed Machine Learning, and assigning CVSS v3.x base score to vulnerabilities without them assigned allows operator to properly assign effort and prioritization for vulnerabilities.
9. Conclusions
This paper presents a vulnerability management model that implements CVSS v3.x scoring and demonstrates its advantages over CVSS v2.0.
Simulations carried out in selected test environments confirm that the previous standard, CVSS v2.0, lacks precision in environmental score assessments. All vulnerabilities were consistently classified as low severity, making the CVSS v2.0 environmental score insufficient to provide actionable information to ICT administrators. This critical limitation may result in the failure to promptly address all critical vulnerabilities and, in extreme cases, allow publicly known exploits to persist due to low CVSS v2.0 environmental scores.
As a solution, we developed a vulnerability management model that adopts the CVSS v3.x standard instead of CVSS v2.0. This model utilizes specially tailored machine learning algorithms to convert CVSS v2.0 base scores into the newer standard, ensuring that vulnerabilities identified during scanning, regardless of their creation year, are assigned CVSS v3.x base scores. Consequently, ICT administrators can accurately calculate the environmental metrics for all vulnerabilities listed in the NIST NVD database. Simulations in our test environments demonstrate that, compared to CVSS v2.0, the utilization of CVSS v3.x environmental scores leads to a reduction in estimated work hours required to address critical vulnerabilities, thanks to a more accurate vulnerability prioritization. Our proposed model significantly improves remediation times between standards, with efficiency gains of up to 8%.
Although the observed improvement in prioritization of 8% may appear modest as a standalone metric, the resulting risk reductions of 2.4% (34.1% to 31.7%) and 5% (34.1% to 29.1%) represent substantial operational impact when contextualized within cybersecurity economics. Given that cyber risk is calculated as the product of probability and impact, where impact often involves multimillion-dollar exposures, even modest percentage reductions translate to significant cost avoidance.
The practical implications extend beyond direct cost savings. Even a digit decrease in exploitable vulnerabilities meaningfully narrows the attack surface available to threat actors, while these percentage improvements often exceed the demonstrable risk reduction thresholds required by regulatory frameworks and compliance standards. Furthermore, small percentage improvements in vulnerability closure rates compound temporally, creating progressively enhanced security postures through reduced mean time to remediation.
Furthermore, our results indicate that the application of the CVSS v3.x standard effectively resolves the issue of categorizing all vulnerabilities as low priority when considering the environmental components of the CVSS score vector in all test environments studied. Thus, our findings highlight that the implementation of the CVSS v3.x standard enables ICT administrators to prioritize vulnerabilities more effectively and consequently improve risk assessment within their organizations.
The main contribution to efficiency with the developed model is the ability to use the CVSS v3.x environmental score for all vulnerabilities. Adding environment context to the score allows us to adjust severity levels and, as a result, the priority of vulnerabilities. However, changes to priority scores in newer CVSS versions are more subtle and do not come with shortcomings like in previous versions. As shown in the research, the use of the CVSS v2.0 environmental score as a method of scoring priority management could introduce distorted images of vulnerability parameters and , making the standard unusable apart from specific cases including multiple deployments of the same components.
Potential further improvement in the model is to include temporal scores that might alter the overall score even further. Using automated solutions, as in our previous research, the changes might be introduced dynamically, depending on the change in vulnerability exploitation—especially using CVSS v3.x, including metrics responsible for Exploit Code Maturity (E) and Remediation Level (RL). From our experience, the second parameter should have little influence on prioritization of vulnerability, as the presence of a potential fix should not lower the overall score but might be helpful with mitigation time estimation.
CVSS v4.0 takes an interesting approach, consistent with previous observations, to the temporal metric by exchanging it with a threat metric, with only one metric called exploit maturity and treated as separate component in calculations. This approach should allow easier adoption of the threat intelligence process by organizations, as this metric might be the most dynamic with greater influence on the overall score.
The main limitations of efficiency gains in the presented approach could be found in the lack of a temporal score metric that would further improve the overview of vulnerabilities expressed in the overall score. Adoption of the Exploit Prediction Scoring System (EPSS) into the vulnerability management process should also provide a clearer picture of vulnerability and improve gains within the prioritization process. Identified edge cases that could not be analyzed using the following methods are identified as critical vulnerabilities with existing exploits—these vulnerabilities should be addressed by the vulnerability management process in the first place.
However, it should also be noted that the methodology developed for the implementation of the CVSSv3.x standard also has some limitations. As the major shortcoming of the implemented methodology, we identify the fact that the errors incurred whilst calculating the CVSSx3.x base score propagate down and affect the full CVSSv3.x score that includes the environmental component. Also, it should be noted that the CVSSv3.x standard itself, even if implemented accurately, has some intrinsic limitations, some of which are intended to be addressed with the newly released CVSSv4.0 standard.
The newly released CVSS v4.0 [56] standard introduces fundamental paradigm shifts that significantly impact our proposed methodology. The nomenclature evolution replaces temporal metrics with threat metrics including Exploit Maturity (E) and introduces environmental security requirements along with modified base metrics providing finer granularity than v3.x implementations. Supplemental metrics create additional scoring beyond the traditional CIA triad. The increased complexity of CVSS v4.0 creates exponentially larger parameter spaces. Limited v4.0 scored vulnerabilities in initial deployment require transfer learning from v3.x models with domain adaptation techniques, while backward compatibility demands multitarget learning frameworks supporting simultaneous predictions across v2.0/v3.x/v4.0 environments.
Furthermore, our objective is to improve software vulnerability management by implementing the Exploit Prediction Scoring System (EPSS), which refines the prioritization process by incorporating exploitation metrics.
Author Contributions
Methodology, A.B., M.W. and S.S.; Software, A.B., M.W. and M.N.; Validation, A.B.; Formal analysis, J.O. and S.S.; Investigation, M.N.; Data curation, A.B. and M.W.; Writing—review & editing, A.B. and S.S. All authors have read and agreed to the published version of the manuscript.
Funding
This work is supported by the “Implementation Doctorate” program financed by the Polish Ministry of Education and Science, edition 6 grant No. DWD/6/0320/2022. The authors from Wroclaw University of Science and Technology acknowledge support from statutory activity.
Institutional Review Board Statement
Not applicable.
Informed Consent Statement
Not applicable.
Data Availability Statement
The original contributions presented in this study are included in the article. Further inquiries can be directed to the corresponding author.
Conflicts of Interest
The authors declare no conflicts of interest.
References
- Booth, H.; Rike, D.; Witte, G.A. The National Vulnerability Database (NVD): Overview; National Institute of Standards and Technology: Gaithersburg, MD, USA, 2013. [Google Scholar]
- Vulnerability and Threat Trends; Technical Report 2020. Available online: https://lp.skyboxsecurity.com/rs/440-MPQ-510/images/Skybox_Report_2020-VT_Trends.pdf (accessed on 20 December 2023).
- Vulnerability and Threat Trends; Technical Report 2021. Available online: https://lp.skyboxsecurity.com/rs/440-MPQ-510/images/Skybox-Security-vulnerability-and-threat-trends-report-2021.pdf (accessed on 20 December 2023).
- Vulnerability and Threat Trends; Technical Report 2023. Available online: https://www.skyboxsecurity.com/resources/report/vulnerability-threat-trends-report-2023/ (accessed on 20 December 2023).
- Walkowski, M.; Oko, J.; Sujecki, S. Vulnerability Management Models Using a Common Vulnerability Scoring System. Appl. Sci. 2021, 11, 8735. [Google Scholar] [CrossRef]
- Nowak, M.; Walkowski, M.; Sujecki, S. Machine Learning Algorithms for Conversion of CVSS Base Score from 2.0 to 3.x; Springer: Berlin/Heidelberg, Germany, 2021; pp. 255–269. [Google Scholar]
- Walkowski, M.; Oko, J.; Sujecki, S. Conversion of CVSS Base Score from 2.0 to 3.1. In Proceedings of the 2021 International Conference on Software, Telecommunications and Computer Networks (SoftCOM), Split, Croatia, 23–25 September 2021; pp. 1–3. [Google Scholar]
- Balsam, A.; Walkowski, M.; Nowak, M.; Jacek, O.; Sujecki, S. Automated Calculation of CVSS v3.1 Temporal Score Based on Apache Log4j 2021 Vulnerabilities. In Proceedings of the 2023 International Conference on Software, Telecommunications and Computer Networks (SoftCOM), Split, Croatia, 21–23 September 2023; pp. 1–3. [Google Scholar]
- OWASP. OWASP Vulnerability Management Center 1.0.2. Available online: https://github.com/owasp/www-project-vulnerability-management-center (accessed on 25 May 2025).
- Mann, D.E.; Christey, S.M. Towards a common enumeration of vulnerabilities. In Proceedings of the 2nd Workshop on Research with Security Vulnerability Databases, West Lafayette, IN, USA, 21–22 January 1999. [Google Scholar]
- Martin, R.A. Managing vulnerabilities in networked systems. Computer 2001, 11, 32–38. [Google Scholar] [CrossRef]
- Fall, D.; Kadobayashi, Y. The Common Vulnerability Scoring System vs. Rock Star Vulnerabilities: Why the Discrepancy? In Proceedings of the ICISSP, Prague, Czech Republic, 23–25 February 2019; pp. 405–411. [Google Scholar]
- Mell, P.; Hu, V.; Lippmann, R.; Haines, J.; Zissman, M. An Overview of Issues in Testing Intrusion Detection Systems; National Institute of Standards and Technology: Gaithersburg, MD, USA, 2003. [Google Scholar]
- Kaya, K. A Study of Vulnerabilities and Weaknesses in Connected Cars; KTH Royal Institute of Technology: Stockholm, Sweden, 2019. [Google Scholar]
- Food and Drug Administration. Postmarket Management of Cybersecurity in Medical Devices: Guidance for Industry and Food and Drug Administration Staff; Food and Drug Administration: Rockville, MD, USA, 2016. [Google Scholar]
- Wang, W.; Gupta, A.; Niu, N. Mining security requirements from common vulnerabilities and exposures for agile projects. In Proceedings of the 2018 IEEE 1st International Workshop on Quality Requirements in Agile Projects (QuaRAP), Banff, AB, Canada, 20–24 August 2018; pp. 6–9. [Google Scholar]
- IBM. IBM X-Force Threat Intelligence. Available online: https://www.ibm.com/security/xforce (accessed on 20 December 2023).
- Symantec. Symantec Security Center. Available online: https://www.broadcom.com/support/security-center (accessed on 20 December 2023).
- Microsoft. Microsoft Security Response Center. Available online: https://www.microsoft.com/en-us/msrc?rtc=1 (accessed on 20 December 2023).
- Redhat. Redhat Product Security Center. Available online: https://access.redhat.com/security (accessed on 20 December 2023).
- Mozilla. Mozilla Foundation Security Advisories. Available online: https://www.mozilla.org/en-US/security/advisories (accessed on 20 December 2023).
- Secunia. Secunia Research. Available online: http://secunia.com/advisories/historic/ (accessed on 20 December 2023).
- Liu, Q.; Zhang, Y.; Kong, Y.; Wu, Q. Improving VRSS-based vulnerability prioritization using analytic hierarchy process. J. Syst. Softw. 2012, 8, 1699–1708. [Google Scholar] [CrossRef]
- Google. Severity Guidelines for Security Issues. Available online: http://dev.chromium.org/developers/severity-guidelines/ (accessed on 20 December 2023).
- Mell, P.; Scarfone, K.; Romanosky, S. Common vulnerability scoring system. IEEE Secur. Priv. 2006, 6, 85–89. [Google Scholar] [CrossRef]
- FIRST. Common Vulnerability Scoring System v2.0: Specification Document. Available online: https://www.first.org/cvss/v2/guide (accessed on 20 December 2023).
- Eiram, C.; Martin, B. The CVSSv2 Shortcomings, Faults, and Failures Formulation; Technical report; Forum of Incident Response and Security Teams (FIRST): Cary, NC, USA, 2013. [Google Scholar]
- FIRST. Common Vulnerability Scoring System v3.1: Specification Document. Available online: https://www.first.org/cvss/v3.1/specification-document (accessed on 20 December 2023).
- Spring, J.; Hatleback, E.; Manion, A.; Shic, D. Towards Improving CVSS; Technical Report; Software Engineering Institute, Carnegie Mellon University: Pittsburgh, PA, USA, 2018. [Google Scholar]
- Chen, Y.; Boehm, B.W. Stakeholder value driven threat modeling for off the shelf based systems. In Proceedings of the 29th International Conference on Software Engineering (ICSE’07 Companion), Washington, DC, USA, 20–26 May 2007; pp. 91–92. [Google Scholar]
- Eschelbeck, G. The Laws of Vulnerabilities: Which security vulnerabilities really matter? Inf. Secur. Tech. Rep. 2005, 4, 213–219. [Google Scholar] [CrossRef]
- Lai, Y.-P.; Hsia, P.-L. Using the vulnerability information of computer systems to improve the network security. Comput. Commun. 2007, 9, 2032–2047. [Google Scholar] [CrossRef]
- Rieke, R. Modelling and analysing network security policies in a given vulnerability setting. In Proceedings of the International Workshop on Critical Information Infrastructures Security, Samos, Greece, 31 August–1 September 2006; pp. 67–78. [Google Scholar]
- Fruhwirth, C.; Mannisto, T. Improving CVSS-based vulnerability prioritization and response with context information. In Proceedings of the 2009 3rd International Symposium on Empirical Software Engineering and Measurement, Lake Buena Vista, FL, USA, 15–16 October 2009; pp. 534–544. [Google Scholar]
- Gartner Research. A Guidance Framework for Developing and Implementing Vulnerability Management. Available online: https://www.gartner.com/en/documents/3747620 (accessed on 20 May 2022).
- Gartner Research. Gartner Peer Insights ‘Voice of the Customer’: Vulnerability Assessment. Available online: https://www.gartner.com/en/documents/4008853 (accessed on 20 May 2022).
- F-Secure. Vulnerability Management Tool. Available online: https://www.withsecure.com/en/support/quick-start/elements-vulnerability-management (accessed on 20 May 2022).
- Qualys. Vulnerability Management Tool. Available online: https://www.qualys.com/apps/vulnerability-management (accessed on 20 May 2022).
- Rapid7. Vulnerability Management Tool. Available online: https://www.rapid7.com/products/nexpose/ (accessed on 20 December 2023).
- Tenable. Vulnerability Management Tool. Available online: https://www.tenable.com/products (accessed on 20 December 2023).
- Walkowski, M.; Krakowiak, M.; Jaroszewski, M.; Oko, J.; Sujecki, S. Automatic CVSS-based vulnerability prioritization and response with context information. In Proceedings of the 2021 International Conference on Software, Telecommunications and Computer Networks (SoftCOM), Split, Hvar, Croatia, 23–25 September 2021; pp. 1–6. [Google Scholar]
- Miura-Ko, R.A.; Bambos, N. SecureRank: A risk-based vulnerability management scheme for computing infrastructures. In Proceedings of the 2007 IEEE International Conference on Communications, Glasgow, UK, 24–28 June 2007; pp. 1455–1460. [Google Scholar]
- Farris, K.A.; Shah, A.; Cybenko, G.; Ganesan, R.; Jajodia, S. Vulcon: A system for vulnerability prioritization, mitigation, and management. ACM Trans. Priv. Secur. (TOPS) 2018, 4, 1–28. [Google Scholar] [CrossRef]
- Weintraub, E. Security Risk Scoring Incorporating Computers’ Environment. (IJACSA) Int. J. Adv. Comput. Sci. Appl. 2016, 4, 183–189. [Google Scholar] [CrossRef]
- Jung, B.; Li, Y.; Bechor, T. CAVP: A context-aware vulnerability prioritization model. Comput. Secur. 2022, 116, 102639. [Google Scholar] [CrossRef]
- Chen, H.; Liu, J.; Liu, R.; Park, N.; Subrahmanian, V.S. VEST: A System for Vulnerability Exploit Scoring & Timing. In Proceedings of the IJCAI, Macao, China, 10–16 August 2019; pp. 6503–6505. [Google Scholar]
- The Center for Internet Security. The CIS Security Metrics. Available online: https://learn.cisecurity.org/CIS-Controls-Measures-and-Metrics-Version-7-FINAL.pdf (accessed on 20 December 2023).
- Wang, S.; Xia, C.; Gao, J.; Jia, Q.; Jajodia, S. Vulcon: Vulnerability evaluation based on CVSS and environmental information statistics. In Proceedings of the 2015 4th International Conference on Computer Science and Network Technology (ICCSNT), Harbin, China, 19–20 December 2015; Volume 1, pp. 1249–1252. [Google Scholar]
- Gallon, L. On the impact of environmental metrics on CVSS scores. In Proceedings of the 2010 IEEE Second International Conference on Social Computing, Minneapolis, MN, USA, 20–22 August 2010; pp. 987–992. [Google Scholar]
- Jukka, R. A look at the time delays in CVSS vulnerability scoring. Appl. Comput. Inform. 2019, 15, 129–135. [Google Scholar]
- Walkowski, M.; Krakowiak, M.; Oko, J.; Sujecki, S. Efficient algorithm for providing live vulnerability assessment in corporate network environment. Appl. Sci. 2020, 10, 7926. [Google Scholar] [CrossRef]
- Beale, J.; Meer, H.; van der Walt, C.; Deraison, R. Nessus Network Auditing: Jay Beale Open Source Security Series; Elsevier: Amsterdam, The Netherlands, 2004. [Google Scholar]
- Li, H.; Xi, R.; Zhao, L. Vulcon: Study on the distribution of CVSS environmental score. In Proceedings of the 2015 IEEE 5th International Conference on Electronics Information and Emergency Communication, Beijing, China, 14–16 May 2015; Volume 1, pp. 122–125. [Google Scholar]
- Bird, S.; Klein, E.; Loper, E. Natural Language Processing with Python: Analyzing Text with the Natural Language Toolkit; O’Reilly Media: Sebastopol, CA, USA, 2009; pp. 1249–1252. [Google Scholar]
- Nowak, M.R.; Zdunek, R.; Plinski, E.; Swiatek, P.; Strzelecka, M.; Malinka, W.; Plinska, S. Recognition of Pharmacological Bi-Heterocyclic Compounds by Using Terahertz Time Domain Spectroscopy and Chemometrics. Sensors 2019, 15, 3349. [Google Scholar] [CrossRef] [PubMed]
- FIRST. Common Vulnerability Scoring System Version 4.0. Available online: https://www.first.org/cvss/v4-0/ (accessed on 20 February 2024).
Disclaimer/Publisher’s Note: The statements, opinions and data contained in all publications are solely those of the individual author(s) and contributor(s) and not of MDPI and/or the editor(s). MDPI and/or the editor(s) disclaim responsibility for any injury to people or property resulting from any ideas, methods, instructions or products referred to in the content. |
© 2025 by the authors. Licensee MDPI, Basel, Switzerland. This article is an open access article distributed under the terms and conditions of the Creative Commons Attribution (CC BY) license (https://creativecommons.org/licenses/by/4.0/).